harpenden neighbourhood plan baseline report · 2020-02-20 · 1.2 this baseline report identifies...
TRANSCRIPT

Harpenden Neighbourhood Plan
Baseline Report
on behalf of Harpenden Town Council May 2017
October 2017 update


Harpenden Neighbourhood Plan
Baseline Report
on behalf of Harpenden Town Council
May 2017
October 2017 update

Harpenden Neighbourhood Plan Baseline Report for Harpenden Town Council
Page 4
Contents
1.0 Purpose of the document .......................................................................................................... 5 2.0 Introduction to the HNP Area .................................................................................................... 8 3.0 Planning Policy Context .......................................................................................................... 10 4.0 Population and People ............................................................................................................ 15 5.0 Housing ................................................................................................................................... 20 6.0 Employment ............................................................................................................................. 24 7.0 Retail ....................................................................................................................................... 28 8.0 Transport ................................................................................................................................. 33 9.0 Social Infrastructure and Community Facilities ....................................................................... 42 10.0 Natural Environment ................................................................................................................ 50 11.0 Heritage and Design ................................................................................................................ 53 12.0 Summary ................................................................................................................................. 58

Harpenden Neighbourhood Plan Baseline Report for Harpenden Town Council
Page 5
1.0 Purpose of the document
1.1 This October 2017 Baseline Report Update is prepared in support of the Regulation 14 draft
Harpenden Neighbourhood Plan. It refreshes the Baseline Report mainly with reference to
the policy situation at St Albans City and District Council.
1.2 This Baseline Report identifies the key social, environmental and economic characteristics of
the Harpenden Neighbourhood Plan (HNP) Area, providing a shared resource and reference
point for all parties contributing to the preparation of the HNP. The Baseline Report is an
evolving document, which may be reviewed in response to new evidence.
1.3 The Baseline Report brings together and summarises information from a range of
background reports and evidence based studies. These primarily comprise documents
produced by or for the local planning authority (LPA)1, St Albans City and District Council
(SADC), to inform the preparation of its development plan documents. It also has regard to
other reports and research undertaken by or for Hertfordshire County Council (HCC), the
Hertfordshire Local Enterprise Partnership (HLEP) or directly by or for Harpenden Town
Council (HTC). It also considers national statistics such as Census data.
1.4 A Neighbourhood Plan is a planning policy document that sets out a framework for
development at a local scale, sitting below planning policy prepared by a LPA.
Neighbourhood planning was introduced by the Localism Act, which came into force in 2011.
Since its inception over 200 Neighbourhood Plans have been adopted.
1.5 Neighbourhood Plans give local people a greater say in the future of their communities by
creating their own statutory planning policy, which dictates how development will take place
1 SADC is regarded as the LPA for the purposes of this document, although HCC does have some planning powers with regards to minerals and waste and its own applications for service development such as schools, fire stations and new road infrastructure such as bypasses

Harpenden Neighbourhood Plan Baseline Report for Harpenden Town Council
Page 6
in their neighbourhood for the foreseeable future. They must conform with strategic planning
policy that ‘sits above’ them, at a national and LPA level.
1.6 Neighbourhood Plans are related to land use and development quality and do not have to
power to allocate funds or make decisions outside of the remit of land use planning.
1.7 As the HNP develops, a key challenge will be the need to reflect the aspirations of local
residents and stakeholders, while taking into account the requirements set nationally and by
SADC.
1.8 Neighbourhood Plans do not have the power to prevent housing or employment growth when
a need has been identified by the LPA. The HNP can either allocate sites to meet this need,
or resolve to not allocate sites and leave the decision of where to accommodate growth to
the LPA. The HNP can also contain policies that influence the type of development that
takes place in Harpenden, what it looks like and the mix of potential uses that are to be
included.
1.9 On 22 December 2015, SADC formally agreed the HNP Area boundary, which reflects the
combined boundaries of Harpenden Town Parish and Harpenden Rural Parish.
1.10 In December 2016, HTC appointed Nexus Planning to assist with the preparation of the
HNP.
1.11 Once a draft HNP is prepared, it will be submitted to SADC for review for compliance with its
strategic policies before an independent Planning Inspector examines it and, if approved, it

Harpenden Neighbourhood Plan Baseline Report for Harpenden Town Council
Page 7
undergoes a Referendum. If the plan is supported by a majority of residents, it will be
adopted and form part of the SADC development plan for applications in the HNP boundary.
1.12 The remainder of the Baseline Report is set out as follows:
• Section 2: Introduction to the HNP Area
• Section 3: Planning Policy Context
• Section 4: Population and People
• Section 5: Housing
• Section 6: Employment
• Section 7: Retail
• Section 8: Transport
• Section 9: Social Infrastructure and Community Facilities
• Section 10: Natural Environment
• Section 11: Heritage and Design
• Section 12: Summary

Harpenden Neighbourhood Plan Baseline Report for Harpenden Town Council
Page 8
2.0 Introduction to the HNP Area
Location and role of the area
2.1 The HNP Area is located in Hertfordshire, south of the border with Bedfordshire. It is
comprised of two parishes, which are Harpenden Town Parish, where most of the population
reside, and Harpenden Rural Parish, which borders Harpenden Town to the west and north-
west. The two parishes lie within the boundaries of SADC, however, closely relate to the
boundaries of Central Bedfordshire, North Hertfordshire, Luton Borough and Dacorum LPAs.
2.2 Harpenden is a town with a historic core, reflecting its heritage as a small village for a
number of centuries before its expansion in the late 19th Century. This core predominantly
extends to each side of the High Street, which bisects the town, with a number of Listed
Buildings on each side. Many of these were built in the 17th, 18th and 19th Centuries,
however, there are some older buildings, dating back to the 15th and 16th Centuries. Much
of the population of Harpenden live in the residential areas outside of the Town Centre,
which were mostly developed during the 20th Century.
2.3 Harpenden Rural Parish is sparsely populated and is predominantly undeveloped, but
includes Kinsbourne Green Common, a small hamlet.
2.4 Harpenden is near to a number of larger towns. It lies almost equidistant between Luton
(north) and St Albans (south), around five miles from each. It is also close to Hemel
Hempstead, Hitchin and Welwyn Garden City.
2.5 Harpenden is predominantly a commuter town, with a small number of employment sites for
a town of its population size. A notable employment site is Rothamsted Research, founded
in 1843, which is a world leading agricultural research establishment. The major destination
for commuters is London, with regular City Thameslink trains from Harpenden Station taking
around 30 minutes to London St Pancras Station and 40 minutes to Blackfriars Station.
Harpenden is also located around five miles from London Luton Airport, which is around 20
minutes by train, and is close to the M1, M25 and A1(M). People also commute out of
Harpenden by car to destinations such as St Albans, Milton Keynes, Hatfield and Hemel
Hempstead.
2.6 Public green spaces and trees are prominent throughout the town, particularly in its historic
core, with Harpenden Common extending in to the High Street, plus Church Green and

Harpenden Neighbourhood Plan Baseline Report for Harpenden Town Council
Page 9
Leyton Green. This results in a town with a low-density and green character that responds
to its rural surroundings.
2.7 The rural land within the HNP Area, mostly within Harpenden Rural Parish, is predominantly
in agricultural use. This is with the exception of Harpenden Golf Course, south-west of the
town, and the east part of Redbourn Golf Club. The Green Belt surrounds Harpenden,
which has protected this land from development.

Harpenden Neighbourhood Plan Baseline Report for Harpenden Town Council
Page 10
3.0 Planning Policy Context
Status of planning policy and guidance
Neighbourhood Plans must conform to national planning policy and guidance as well as the
development plan of the LPA. Therefore, the status of planning policy at SADC is of
importance to the HNP.
The table below sets out national planning policy and guidance and adopted and emerging
planning policy documents at SADC.
Title Purpose of the document Date of adoption/ emerging timeline
National Planning Policy and Guidance
National Planning
Policy Framework
(NPPF)2
The NPPF is the overarching
planning policy framework in
England. It sets out a broad
agenda for decision taking and plan
making.
Adopted in 2012.
National Planning
Practice
Guidance
(NPPG)3
NPPG supports the NPPF with
more detailed guidance, responding
frequently to developments in the
planning system.
The Government frequently
update NPPG.
Local Planning Policy and Guidance
Adopted Local
Plan Review4 This comprises the adopted
planning policy framework. Given
its age, the NPPF resolves to apply
weight to its policies in accordance
with conformity to the NPPF (NPPF
Paragraph 215). For example, if a
policy does not conform to the
NPPF, it is no longer acceptable to
apply weight to it.
Adopted in 1994, with a
number of policies ‘saved’ in
2007.
2 HM Government (2012) National Planning Policy Framework. Available at: https://www.gov.uk/government/publications/national-planning-policy-framework--2 3 HM Government (regularly updated) National Planning Practice Guidance. Available at: https://www.gov.uk/government/collections/planning-practice-guidance 4 St Albans City and District Council (1994, saved 2007) Adopted Local Plan Review. Available at: http://www.stalbans.gov.uk/planning/Planningpolicy/currentadoptedlocalplan.aspx

Harpenden Neighbourhood Plan Baseline Report for Harpenden Town Council
Page 11
Emerging Local
Plan (Local Plan)5
The Local Plan will form the
Development Plan in the District,
containing strategic and detailed
planning policies.
The Local Plan is being
prepared and the District
Council is expecting adoption
by 2018. This is an optimistic
timeline and in reality, it could
take longer to prepare a new
Local Plan.
5 St Albans City and District Council (2017) Planning Policy Committee “Next Steps and Direction of Travel” Available at: http://stalbans.moderngov.co.uk/ieListDocuments.aspx?CId=459&MId=8245&Ver=4

Harpenden Neighbourhood Plan Baseline Report for Harpenden Town Council
Page 12
National policy requirements
At the heart of the NPPF is a presumption in favour of sustainable development. The effects
of this for Neighbourhood Plan makers are set out at Paragraph 16 and require
Neighbourhood Plans to:
• Support the strategic development need identified in Local Plans, including those set
out in housing and economic development policies;
• Plan positively to shape and direct local development in parts of the neighbourhood
outside of those covered in the strategic policies of the Local Plan; and
• Identify opportunities to use Neighbourhood Development Orders to enable
development consistent with the Neighbourhood Plan to proceed.
Paragraph 58 expects Neighbourhood Plans to set out policies relating to the quality of
development locally, based on objectives relating to future development needs.
Paragraph 76 encourages local communities to designate Local Green Spaces in
Neighbourhood Plans, protecting land from development other than in very special
circumstances.
Paragraphs 183 – 185 specifically relate to neighbourhood planning. The paragraphs make
clear that:
• Neighbourhood Plan policies are used to determine decisions on planning
applications (183);
• Neighbourhood Plans must conform with strategic policies of the LPA’s Local Plan;
and,
• Once a Neighbourhood Plan is in force, where there is a conflict between its policies
and non-strategic policies of the LPAs Local Plan (e.g. Site allocations or detailed
policies), policies of the Neighbourhood Plan take a precedence.
NPPG contains a chapter of guidance related to the detailed practice of preparing and
implementing Neighbourhood Plans.

Harpenden Neighbourhood Plan Baseline Report for Harpenden Town Council
Page 13
Local planning policy
While the NPPF considers the Local Plan Review (1994) to be out of date, it is worth noting
that the Settlement Strategy identifies Harpenden as the second largest town in the District,
after St Albans. It states that development is generally to be concentrated in those
locations;
The emerging Local Plan is in the early stages of production and there is no draft available.
However, the emerging Local Plan is expected mostly resemble the Strategic Local Plan
(SLP) and Detailed Local Plan (DLP), which were recently abandoned following an
Inspector’s decision that the SLP did not meet the legal Duty to Cooperate and therefore
could not proceed to examination. The submission draft of the SLP set out a number of
strategic policies that may have had a bearing on the development of the HNP and may
reappear in the emerging Local Plan. These are:
• Abandoned Policy SLP1 (‘Spatial Strategy and Development Strategy’), which sets
out how Harpenden is a main urban settlement excluded from the Green Belt. It
considers these locations to be the most sustainable for development and
encourages higher density development, so as it respects local character, in order to
protect the Green Belt. Emerging Policy SP1 identifies north-west Harpenden as a
‘broad location’ for principally housing-led development of approximately 500
dwellings;
• Abandoned Policy SLP2 (‘Metropolitan Green Belt’), which sets out that the SLP will
release the ‘broad locations’ from the Green Belt and how further release may be
included in the DLP;
• Abandoned Policy SLP13c (‘North West Harpenden Broad Location – Principally
Housing’), sets out how the Council will seek to deliver circa 500 homes and related
infrastructure including recreation/open space, a one-form entry primary school and
sustainable transport upgrades at North West Harpenden;
• Abandoned Policy SLP17 (‘Rothamsted Research’), which supports a
redevelopment of Rothamsted Research, including a possible extension, to meet the
future needs of the centre;
• Abandoned Policy SLP18 (‘Retail Hierarchy of Centres’), which sets out how
Harpenden is a Town Centre, subservient to St Albans as the major Town Centre,
yet serving the northern part of the District with an offer comprised on food/grocery

Harpenden Neighbourhood Plan Baseline Report for Harpenden Town Council
Page 14
shopping and a diverse mix of independent retailers, supported by cafes,
restaurants, leisure, cultural and other uses; and
• Abandoned Policy SLP21 (‘Provision and Retention of Cultural Facilities’), which sets
out support for the redevelopment of Harpenden Public Hall plus the redevelopment
of leisure and cultural facilities in Rothamsted Park.

Harpenden Neighbourhood Plan Baseline Report for Harpenden Town Council
Page 15
4.0 Population and People
4.1 This section sets out the current socio-demographic background to the HNP. Unless stated,
statistics in this section relate to the entire HNP Area.
Population
4.2 The 2011 Census6 established that there were 29,853 residents in the HNP Area, comprised
of 29,448 residents from Harpenden Town Parish and 405 residents from Harpenden Rural
Parish. Harpenden Town Parish witnessed a population increase of 6% (1,762 persons)
since the 2001 Census. The Harpenden Rural population decreased by 4% over the same
period (17 persons). Residents in the HNP Area make up 21% of the SADC population.
4.3 Figure 1 sets out how the population of Harpenden Town Parish has grown since 1921 (with
the exception of 1941 when there was no Census). It shows how population growth was
rapid in the four post-war decades and has steadily increased since (albeit falling slightly
from 1981 to 1991).
Figure 1. Harpenden Population by Census Year
6 HM Government (2001 and 2011) UK Census. Available at: www.neighbourhood.statistics.gov.uk and www.nomisweb.co.uk/
0 5,000 10,000 15,000 20,000 25,000 30,000 35,000
1921
1931
1941
1951
1961
1971
1981
1991
2001
2011

Harpenden Neighbourhood Plan Baseline Report for Harpenden Town Council
Page 16
Demographics
4.4 The 2011 Census found that 51% of residents are female, which is very similar to the SADC
and national average.
4.5 Figure 2 outlines the breakdown of the Harpenden Rural and Harpenden Town populations
by age group, in comparison to SADC and national averages, at the time of the 2001 and
2011 Censuses. Key findings include:
• In 2011, both Parishes had a notably larger population aged 0-17 than the SADC
and national averages. This age group has grown across the HNP Area since 2001;
• In 2011, both Parishes have a low number of residents in the 18-29 age bracket
compared to SADC and national averages, which has reduced since 2001.
• As of 2011, Harpenden Rural has more residents aged 45-59 and less aged 75+
than Harpenden Town, SADC and England; and
• The remainder of the age ranges across each area are broadly similar.
Figure 2. Comparison of 2001 and 2011 Populations by Age Group
4.6 Figure 3 sets out the ethnic background of residents in Harpenden Town and Harpenden
Rural in comparison to SADC and the national composition. Harpenden Town and
Harpenden Rural are less ethnically diverse than the remainder of SADC and England.
0%10%20%30%40%50%60%70%80%90%
100%
HarpendenRural 2001
HarpendenRural 2011
HarpendenTown 2001
HarpendenTown 2011
St AlbansDistrict2001
St AlbansDistrict2011
England2001
England2011
Perc
ent
Age group
0-17 18-29 30-44 45-59 60-74 75+

Harpenden Neighbourhood Plan Baseline Report for Harpenden Town Council
Page 17
Figure 3. Comparison of 2011 Population by Ethnic Group
Deprivation
4.7 The Office for National Statistics measures deprivation at Lower Super Output Area (LSOA)
level7. Deprivation is measured based on seven domains, from which an ‘Index of Multiple
Deprivation (IMD) is determined. The domains are:
• Income deprivation (percentage of low income population);
• Employment deprivation (percentage of people involuntarily unemployed);
• Education, skills and training deprivation (percentage of people without formal
qualifications or low-level qualifications);
• Health deprivation and disability (morbidity, disability and premature mortality)
• Crime;
• Barriers to housing and services; and
• Living environment deprivation (quality of houses, air quality, road traffic accidents);
4.8 Harpenden Town is comprised of 16 LSOAs and Harpenden Rural forms part of a larger
LSOA incorporating the northern part of Redbourn Parish (mostly rural). The latest
measures of deprivation were released by the Department for Communities and Local
Government (DCLG) in 2015 and are shown in Figure 4.
7 HM Government (2015). Indices of Multiple Deprivation. Available at: http://dclgapps.communities.gov.uk/imd/idmap.html
0% 10% 20% 30% 40% 50% 60% 70% 80% 90% 100%
Harpenden Rural
Harpenden Town
St Albans District
England
White British/Irish White Other
Mixed Race Asian (inc. South/East/British)
Black (inc African/Caribbean/British) Other (inc. Arab)

Harpenden Neighbourhood Plan Baseline Report for Harpenden Town Council
Page 18
Figure 4. LSOAs in HNP Area by Decile of Deprivation.
Please note that this plan has an underlay map, which results in certain areas that appear to be darker green. This
is not relevant to the decile of deprivation measurement.
4.9 Harpenden Town and Harpenden Rural generally have very low levels of deprivation, with all
but three LSOAs in the 10% least deprived LSOAs in England. LSOAs 001C and 002D, to
the North East of Harpenden, are in the 30% least deprived areas nationally and 002C, to the
furthest North East part of Harpenden (comprising Batford), is in the 50% least deprived parts
of England. While no areas are below the average level of deprivation nationally, it is worth
noting that these three areas, particularly 002C, experience some deprivation and this is
likely to be a key consideration for the Neighbourhood Plan.
4.10 It is possible to understand further deprivation data through looking at economy data from
Herts Insight (HCC)8, which supports its Children’s Centre programme. This data is arranged
by LSOA and includes the percentage of under five year olds living in poverty and the
number of Benefits Claimants, which are shown at Figures 5 and 6.
8 HCC (2017) Children’s Centre Economy Selection – Harpenden and Southdown. Available at: https://www.hertfordshire.gov.uk/microsites/herts-insight/information-for-childrens-centres.aspx
Harpenden Neighbourhood Plan Baseline Report for Harpenden Town Council
Page 19
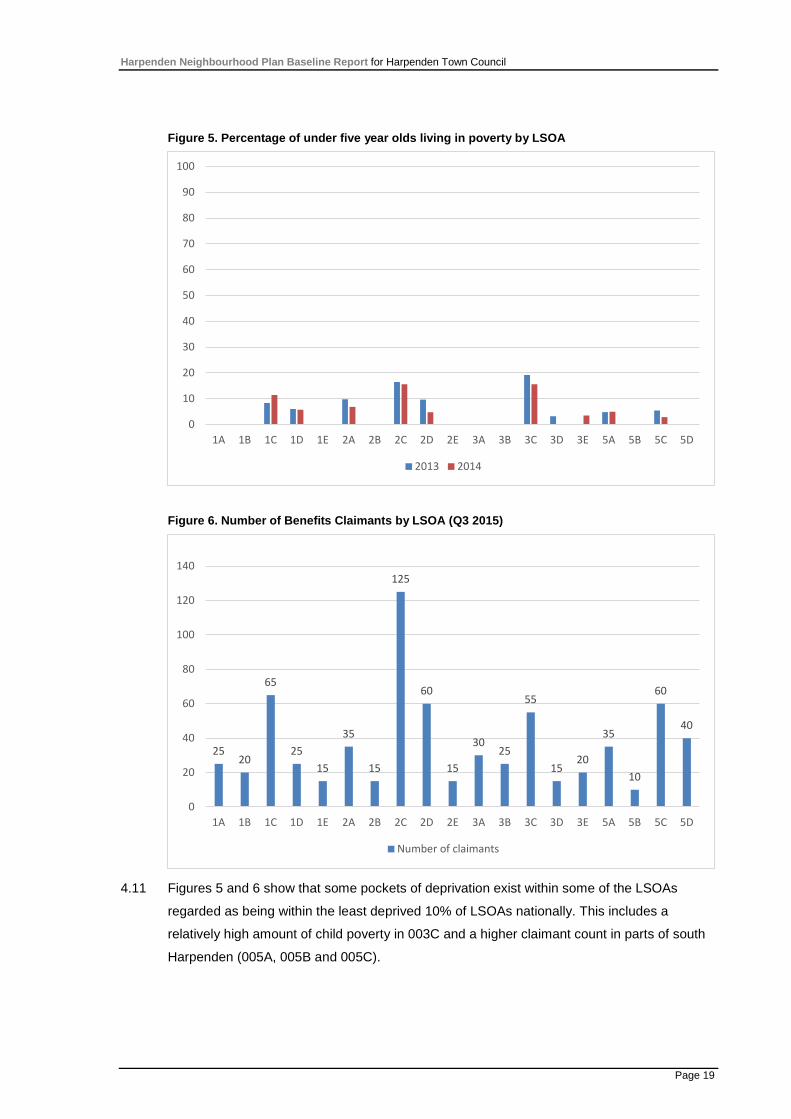
Figure 5. Percentage of under five year olds living in poverty by LSOA
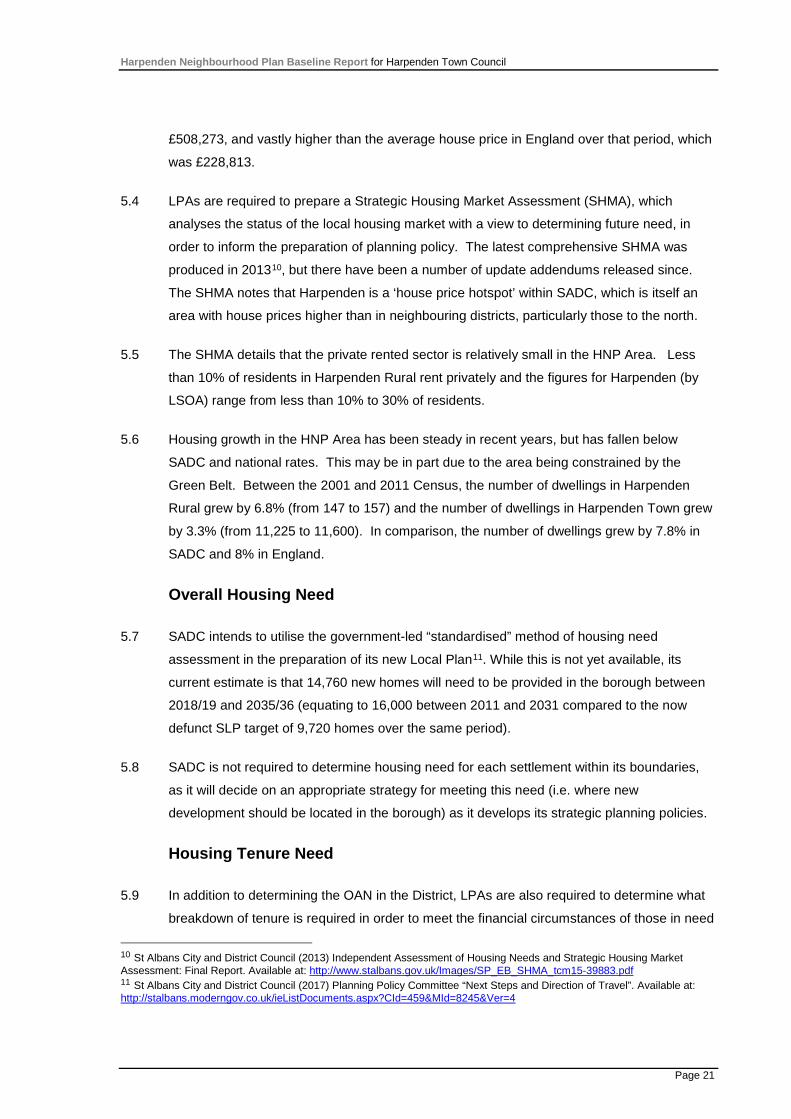
Figure 6. Number of Benefits Claimants by LSOA (Q3 2015)
4.11 Figures 5 and 6 show that some pockets of deprivation exist within some of the LSOAs
regarded as being within the least deprived 10% of LSOAs nationally. This includes a
relatively high amount of child poverty in 003C and a higher claimant count in parts of south
Harpenden (005A, 005B and 005C).
0
10
20
30
40
50
60
70
80
90
100
1A 1B 1C 1D 1E 2A 2B 2C 2D 2E 3A 3B 3C 3D 3E 5A 5B 5C 5D
2013 2014
2520
65
2515
35
15
125
60
15
3025
55
1520
35
10
60
40
0
20
40
60
80
100
120
140
1A 1B 1C 1D 1E 2A 2B 2C 2D 2E 3A 3B 3C 3D 3E 5A 5B 5C 5D
Number of claimants

Harpenden Neighbourhood Plan Baseline Report for Harpenden Town Council
Page 20
5.0 Housing
5.1 This section sets out the current housing circumstances in the HNP Area and a summary of
future growth requirements.
Current Housing Stock
5.2 Figure 7 shows the composition of the housing stock in Harpenden Town and Harpenden
Rural at the time of the 2011 Census. The housing stock in Harpenden Town is primarily
composed of medium to large sized detached and semi-detached housing set in low-density
neighbourhoods, with some denser areas of smaller unit sizes. Harpenden Rural Parish is
typified by large detached houses set in spacious private gardens. The amount of detached
housing is notably higher in the HNP Area than in SADC and across England. The current
stock of housing, in terms of size and quality, has contributed to Harpenden’s status as a
desirable place to live.
Figure 7. Comparison of 2011 Housing Stock by Type
5.3 House prices in the HNP Area reflect its status as a sought after place to live. According to
Rightmove data9, the average sale price in Harpenden in 2016 was £723,391. This is
considerably higher than the average house price in SADC during 2016, which was
9 Right Move (regularly updated) House Price Data. Available at: http://www.rightmove.co.uk/house-prices.html
0% 10% 20% 30% 40% 50% 60% 70% 80% 90% 100%
England
St Albans District
Harpenden Town
Harpenden Rural
Detached housing Semi-detached housing
Terraced housing Flat, masionette or apartment
Mobile home
Harpenden Neighbourhood Plan Baseline Report for Harpenden Town Council
Page 21
£508,273, and vastly higher than the average house price in England over that period, which
was £228,813.
5.4 LPAs are required to prepare a Strategic Housing Market Assessment (SHMA), which
analyses the status of the local housing market with a view to determining future need, in
order to inform the preparation of planning policy. The latest comprehensive SHMA was
produced in 201310, but there have been a number of update addendums released since.
The SHMA notes that Harpenden is a ‘house price hotspot’ within SADC, which is itself an
area with house prices higher than in neighbouring districts, particularly those to the north.
5.5 The SHMA details that the private rented sector is relatively small in the HNP Area. Less
than 10% of residents in Harpenden Rural rent privately and the figures for Harpenden (by
LSOA) range from less than 10% to 30% of residents.
5.6 Housing growth in the HNP Area has been steady in recent years, but has fallen below
SADC and national rates. This may be in part due to the area being constrained by the
Green Belt. Between the 2001 and 2011 Census, the number of dwellings in Harpenden
Rural grew by 6.8% (from 147 to 157) and the number of dwellings in Harpenden Town grew
by 3.3% (from 11,225 to 11,600). In comparison, the number of dwellings grew by 7.8% in
SADC and 8% in England.
Overall Housing Need
5.7 SADC intends to utilise the government-led “standardised” method of housing need
assessment in the preparation of its new Local Plan11. While this is not yet available, its
current estimate is that 14,760 new homes will need to be provided in the borough between
2018/19 and 2035/36 (equating to 16,000 between 2011 and 2031 compared to the now
defunct SLP target of 9,720 homes over the same period).
5.8 SADC is not required to determine housing need for each settlement within its boundaries,
as it will decide on an appropriate strategy for meeting this need (i.e. where new
development should be located in the borough) as it develops its strategic planning policies.
Housing Tenure Need
5.9 In addition to determining the OAN in the District, LPAs are also required to determine what
breakdown of tenure is required in order to meet the financial circumstances of those in need
10 St Albans City and District Council (2013) Independent Assessment of Housing Needs and Strategic Housing Market Assessment: Final Report. Available at: http://www.stalbans.gov.uk/Images/SP_EB_SHMA_tcm15-39883.pdf 11 St Albans City and District Council (2017) Planning Policy Committee “Next Steps and Direction of Travel”. Available at: http://stalbans.moderngov.co.uk/ieListDocuments.aspx?CId=459&MId=8245&Ver=4

Harpenden Neighbourhood Plan Baseline Report for Harpenden Town Council
Page 22
of housing. This exercise should determine how many of the new homes required to meet
the OAN should be affordable, either available through social/affordable rent or ‘intermediate’
housing, designed to help people on to the property ladder, and how many new homes
should be ‘market’, those available on the open market.
5.10 The SHMA, at Table 6.5, sets out a need for 56.82% of the OAN (equivalent to 6,662 homes)
to be affordable homes available through social rent, with an additional 8.27% of the OAN
(970 homes) available through affordable rent and 3.75% (440 homes) through shared
ownership (intermediate). This represents a significant proportion of the OAN in the District,
with 68.85% of new homes required to be affordable, including intermediate.
5.11 Table 6.5 further states a need for 15.24% of the OAN (1,787 homes) to be available through
the private rental sector and 15.91% of the OAN (1,865) to be available for owner-occupiers.
Together these comprise 31.15% of new homes to be available on the open market.
5.12 Abandoned SLP Policy SLP9 (‘Affordable Housing’) required new residential development to
provide 40% affordable housing, subject to viability. This is a greater requirement than the
adopted development plan. The policy required 60% of the affordable housing to be social
or affordable rented and 40% to be intermediate housing, such as shared ownership (as
detailed in the SHMA). This provides a useful context.
Housing Mix Need
5.13 The final issue the SHMA must consider is housing mix, which considers issues such as
what size dwellings (in number of bedrooms) are required for each tenure and whether there
is a need for specialist housing, such as housing for over 65s.
5.14 The SHMA sets out an overall need for 21.49% (2,520) new dwellings to be one-bed,
19.87% (2,329) to be two-bed, 51.34% (6,020) to be three-bed and 7.3% (855) to be four or
more bedrooms. The SHMA regards that this breakdown applies exactly to all tenures,
across affordable, intermediate and market housing.
5.15 The SHMA identifies that to 2031 there is a need for 3,240 homes across the District for
older people, which is part of the overall OAN as detailed above. This is comprised of a pre-
2011 need for 2,160 units and an anticipated need for 1,080 units arising during the period of
2011 – 2031. The overall need breaks down to a need for 1,378 ‘designated’ older person
dwellings (i.e. older person housing without individual support/care), 657 sheltered units and
1,205 extra-care units. There is no indication of how these break down in terms of tenure or
size or in terms of the HNP Area.

Harpenden Neighbourhood Plan Baseline Report for Harpenden Town Council
Page 23
5.16 Abandoned SLP Policy SP10 (‘Housing Size, Type and Mix’) referred to the SHMA for
determining the mix at allocated sites and elsewhere it expected proposals to take into
account the existing pattern of development, while considering that smaller housing,
including one and two bed flats, is a priority. This provides a useful context.
Housing Delivery and Site Allocations
5.17 Abandoned SLP Policy SLP11 (‘Density of Housing Development’) expected housing density
to be 40 dwellings per hectare in allocated sites. The policy was more flexible in other
locations, where it expected density to be appropriate in the context of the local area.
5.18 Abandoned SLP Policy SLP13c (‘North West Harpenden Broad Location – Principally
Housing’) proposed a single housing site allocation in Harpenden, at North West Harpenden,
with a capacity of circa 500 dwellings. Two outline masterplan options were included in the
abandoned DLP Policy DLP13 (‘Broad Location Masterplanning’), which showed a primary
school and allotments in addition to the residential area. These are shown at Figures 8 and
9. While these proposals will now not become allocations in the near future, this provides a
useful context for the Neighbourhood Plan.
Figure 8. North West Harpenden Broad Location: Option A

Harpenden Neighbourhood Plan Baseline Report for Harpenden Town Council
Page 24
Figure 9. North West Harpenden Broad Location: Option B
6.0
Employment
6.1 This section sets out the current employment circumstances of residents in the HNP Area,
details employment sites and provides a summary of future growth requirements.
Economic Activity
6.2 At the time of the 2011 Census, 72% of the population aged 16 – 74 were economically
active (i.e. In work or looking for work). This is lower than in SADC (75%) and higher than
the national average (70%). Notably, 12% of the female population aged 16-74 is
economically inactive due to looking after home or family. This is higher than the SADC
average of 9% and UK average of 8%.
6.3 Of the economically active proportion of the population, 94% were in employment, 3% were
unemployed and 3% were in full time education. Both the unemployed and full time
education figures are lower than the SADC and national averages, with unemployment
recorded at around half of the national figure.
6.4 A total of 28% of residents aged 16-74 were economically inactive, of which 49% were
retired, 22% were full-time carers (including stay at home parents) and 4% were long-term
sick or disabled.

Harpenden Neighbourhood Plan Baseline Report for Harpenden Town Council
Page 25
Employment by Industry
6.5 Figure 10 sets out the occupation (by broad industry groupings) of employed residents of the
HNP Area in comparison to the SADC and national averages. This shows that residents of
the HNP Area are more likely to be in skilled or semi-skilled jobs than those in SADC and
considerably more likely than the national population.
Figure 10. Comparison of 2011 working population by broad industrial groupings
Qualifications
6.6 Residents of Harpenden are generally very well educated. At the time of the 2011 Census,
only 10% of the population had no qualifications, compared to 13% in SADC and 23% in
England. Over half of Harpenden’s residents (53%) held qualifications that are at least level
four (those above A-Level, i.e. higher level certificate, higher apprenticeship, degree,
master’s degree). This was higher than the SADC average of 46% and significantly higher
than the national average of 27%.
Journey to Work
6.7 The 2011 Census shows that the average travel to work distance for Harpenden residents is
21.8km (13.5 miles). This is higher than in both SADC (17.8km / 11 miles) and England
(14.9km / 9.3 miles). The Census records travel to work distances in brackets. The most
popular distance brackets from Harpenden (in order of volume of people not distance) are:
• 30km (19 miles) to less than 40km (25 miles) (3,295 persons) – this bracket includes
the Central Activity Zone of central London, including the whole of the City of London
and Westminster. It also includes Milton Keynes and Bedford;
0% 10% 20% 30% 40% 50% 60% 70% 80% 90% 100%
HNP Area
St Albans District
England
Managerial and professional roles
Associate professional, technical, administrative or secretarial roles
Skilled trade, care, leisure, sales, customer services, process, plant, machinery or elemetaryoccupations

Harpenden Neighbourhood Plan Baseline Report for Harpenden Town Council
Page 26
• 5km (3 miles) to less than 10km (6 miles) (2,126 persons) – this bracket includes the
centres of Luton and St Albans as well as Luton Airport. For most residents it would
also include Welwyn Garden City Town Centre and Hatfield Business Park;
• Less than 2km (1.25 miles) (1,896 persons) – this bracket includes most residents
working in Harpenden. More information on local employment sites is detailed at
Paragraph 6.9, below; and
• 10km (6 miles) to less than 20km (12 miles) (1,528 persons) – this bracket includes
Watford, Hatfield (including University of Hertfordshire), Stevenage, Hitchin and
Dunstable.
6.8 A considerable proportion of residents work from home, with 7% of the population doing so
compared to 6% in SADC and 3% in England.
6.9 Figure 11 sets out resident’s primary mode of travel to work at the time of the 2011 Census
(please note those using more than one mode of transport will have only stated the mode
they consider primary and the figures exclude work from home).
Figure 11. Resident’s Primary Mode of Travel to Work (2011 Census)
6.10 Evidence from ticket sale data suggests that rail travel to work is likely to be higher than set
out above, as there are a number of irregular passengers, who may travel to London only on
a part time basis and may not be reflected in the above figures.
0
1,000
2,000
3,000
4,000
5,000
6,000
7,000
8,000
Num
ber o
f Res
iden
ts
Private Vehicle Train On foot Bicycle Bus
Harpenden Neighbourhood Plan Baseline Report for Harpenden Town Council
Page 27
Employment Land
6.11 Despite its reputation as a commuter town, there are some designated employment sites in
and around Harpenden. These are:
• Rothamsted Research;
• Southdown Industrial Estate;
• Batford Mill Industrial Estate; and
• Coldharbour Lane.
6.12 In addition to these locations, the Town Centre also hosts a number of jobs and there are
some additional employment uses at James Marshall Units. The Town Centre has a number
of small office locations used by professional service companies such as accountants and
solicitors.
6.13 Local anecdotal evidence suggests a majority of people working in Harpenden do not live in
the HNP Area, with most residents commuting out of Harpenden.
6.14 The abandoned DLP policies map proposed Coldharbour Lane and Southdown Industrial
Estate as ‘Primarily Business Use Areas’. The corresponding abandoned Policy, DLP14,
sets out how commercial uses (‘B Class’) were expected in these locations, which already
host a range of B-Class uses, such as industrial, light industrial and storage/distribution.
Rothamsted Research, a world leading agricultural research centre, was proposed for
designation as a ‘Special Employment Location’ where, according to abandoned Policy
DLP18, proposals were required to directly enhance the business of Rothamsted Research.
These requirements may be included in the new Local Plan.
6.15 The abandoned SLP did not propose any new employment sites in or around Harpenden.
The major proposed new employment allocation was located in East Hemel Hempstead,
which is within 10km of the HNP Area and therefore may have some impact on it.

Harpenden Neighbourhood Plan Baseline Report for Harpenden Town Council
Page 28
7.0 Retail
7.1 This section considers the retail performance of Harpenden Town Centre and its
neighbourhood centres, including current issues and potential future requirements.
7.2 In addition to the Town Centre, Harpenden has a neighbourhood centre in Southdown and
some smaller undesignated retail frontages, all of which are detailed in this section.
Harpenden Town Centre
7.3 Most of the retail units in Harpenden Town Centre run either side of the High Street (A1081)
(some are located on Bower’s Parade, east, but have a High Street address), including Leyton
Road, which runs parallel to the southern extent of the High Street. Another key frontage is
the west end of Station Road, which connects the High Street to the railway station. This
results in a relatively linear Town Centre, with the High Street/Bower’s Parade frontages
extending for around 500 metres.
7.4 Harpenden Town Centre is noteworthy for its mix of uses, including a number of independent
and national retailers selling a range of goods. It also has a diverse range of eating and
drinking establishments.
7.5 The SADC Shopping Monitoring Report (2010)12 states that Harpenden Town Centre is the
District’s second largest shopping centre. It sets out how a number of national retailers are
located in the Town Centre, including three supermarkets (Sainsbury’s, Waitrose and Marks
and Spencer Simply Food) as well as a number of major national retailers, such as Boots and
WH Smith. It also sets out how key features in the Town Centre include the range of
restaurants and the monthly Farmer’s Market.
7.6 The Shopping Monitoring Report studies the status of ‘primary’ and ‘secondary’ shopping
frontages in Harpenden. Primary frontages are key retail locations, which will have a
predominance of retail units. SADC also regularly prepares an Authority Monitoring Report,
which reviews, among other matters, the composition of shopping frontages in the District. The
most recent Authority Monitoring Report considers 2015-201613. This allows some
comparison of the change of frontages over time. The Shopping Monitoring Report and
Authority Monitoring Report consider the primary frontages in Harpenden to be:
12 St Albans City and District Council (2010) Shopping Monitoring Report. Available at: http://www.stalbans.gov.uk/Images/SP_ShoppingMonitoringReport_April2010_tcm15-15786.pdf 13 St Albans City and District Council (2016) Authority’s Monitoring Report. Available at: http://www.stalbans.gov.uk/Images/SP_EB_AuthoritysMonitoringReport2016.pdf

Harpenden Neighbourhood Plan Baseline Report for Harpenden Town Council
Page 29
• 1-3 Church Green/ 2b-10 Leyton Road;
• 1-31 High Street;
• 18-50 High Street;
• The Leys;
• 1-11 Leyton Road/ 12-18 Church Green Row; and
• 2-16 High Street & 1-3 Leyton Green Road.
7.7 Figure 12 sets out the percentage use of primary frontages in Harpenden in 2010 and 2016,
measured by the length of shopfronts in each use. It shows very little change in the overall
composition over the six-year period, which implies a stable primary shopping area.
Figure 12. Comparison of Primary Frontage Composition in Harpenden by Use.
7.8 Secondary frontages are less prominent areas of the Town Centre, which generally are more
diverse in terms of uses. The Shopping Monitoring Report considers the secondary
frontages in Harpenden to be:
• 4-6 Church Green & 52-104 High Street;
• 33-61 High Street;
• 12-14 Leyton Road;
• 2a-34 Station Road; and
• 1-17 Station Road.
7.9 Figure 13 details the percentage use of secondary frontages in Harpenden in 2010 and 2016
by length of shopfronts. It shows a similar amount of change over the period to primary
frontages, with very little change in the overall composition.
0 10 20 30 40 50 60 70 80 90 100
2016
2010
Percent
A1 (Retail) A2 (Financial and Professional Services)A3 (Restaurants and Cafes) A4 (Drinking Establishments)A5 (Hot Food Takeaways) Combined A Class UsesNon-A Class Uses

Harpenden Neighbourhood Plan Baseline Report for Harpenden Town Council
Page 30
Figure 13. Comparison of Secondary Frontage Composition in Harpenden by Use.
7.10 Harpenden Town Centre has maintained a very low vacancy rate since 2001, as detailed in
the AMR and shown in Figure 14. While there have been fluctuations, It appears that the
average vacancy rate in both primary and secondary frontages has grown slightly since
2001.
Figure 14. Harpenden Town Centre Vacancies Since 2001
Southdown Neighbourhood Centre
7.11 Southdown Neighbourhood Centre offers a smaller range of units than Harpenden Town
Centre, which are more tailored to its role as a local centre with a smaller visitor catchment
area. It is difficult to consider change in Southdown as the Authority Monitoring Report does
not include the Neighbourhood Centre, meaning the most up-to-date data is contained in the
Shopping Monitoring Report. The breakdown of uses, in 2010, was:
0 10 20 30 40 50 60 70 80 90 100
2016
2010
Percent
A1 (Retail) A2 (Financial and Professional Services)
A3 (Restaurants and Cafes) A4 (Drinking Establishments)
A5 (Hot Food Takeaways) Mixed-A Class Uses
Non-A Class Uses
0
1
2
3
4
5
6
2001 2002 2003 2004 2005 2006 2007 2008 2009 2010 2011 2012 2013 2014 2015 2016
Primary Frontages Secondary Frontages
No.
of v
acan
cies

Harpenden Neighbourhood Plan Baseline Report for Harpenden Town Council
Page 31
• A1 (retail) – 67% of frontages (by length);
• A2 (financial and professional services) – 4% of frontages;
• A3 (restaurants and cafes) – 3% of frontages;
• A4 (drinking establishments) – 0% of frontages;
• A5 (hot food takeaways) – 8% of frontages; and
• Other uses – 19% of frontages.
7.12 Southdown also has maintained a low vacancy rate since 2001, as set out in Figure 15. The
Authority Monitoring Report does not analyse Southdown, so the latest figures are from
2010. It is worth noting that there did appear to be a small uplift in vacancies in Southdown
following the 2008 financial market downturn.
Figure 15. Southdown Neighbourhood Centre Vacancies 2001 – 2010
Undesignated retail frontages
7.13 These sites are not designated as retail frontages and therefore have not been studied by
SADC as part of its evidence base. Undesignated retail frontages include:
• A small cluster of three retail units (including a Tesco Express) to the north end of
the Luton Road, north of the junction with Park Mount; and
• A pair of retail units in Batford, at the junction of the Lower Luton Road and Pickford
Hill. These accommodate a medium size Co-operative supermarket and a fast food
takeaway.
Future provision
7.14 The SADC Retail Study Economic Capacity Update (2010)14 set out an analysis of the
sufficiency of retail provision in Harpenden. It stated that:
14 St Albans City and District Council (2010) Retail Study Economic Capacity Update. Available at: http://www.stalbans.gov.uk/Images/SP_RetailStudyUpdate_April2010_tcm15-14303.pdf
0
1
2
3
4
2001 2002 2003 2004 2005 2006 2007 2008 2009 2010Vacancies
No.
of v
acan
cies

Harpenden Neighbourhood Plan Baseline Report for Harpenden Town Council
Page 32
• There is a good provision and choice of foodstores in Harpenden and, while there is
not a demonstrable need for new retail floorspace, should it be encouraged it should
be in existing stores in the Town Centre rather than new stores outside of the centre;
and
• There is some need for more floorspace for retailers other than foodstores (such as
clothes shops), which should be provided in the Town Centre through infill and small-
scale extension and redevelopment, rather than expansion of the Town Centre
and/or large-scale redevelopment.
7.15 The above study is now seven years old, so the situation may have changed somewhat
since its preparation. The abandoned DLP did not propose new retail provision in
Harpenden and there is no suggestion that the new Local Plan will.

Harpenden Neighbourhood Plan Baseline Report for Harpenden Town Council
Page 33
8.0 Transport
8.1 This section highlights the existing transport network in Harpenden, including walking,
cycling, public transport and road networks, as well as issues related to it.
8.2 Harpenden is located in the north of SADC and has a range of sustainable transport
connections, including a train station with Thameslink connections, buses to a range of
nearby destinations and some cycle routes. It is also very well connected by road, with the
A1081 running through the town, which connects to Luton and St Albans, and the M1 and
A1(M) less than 10km away.
8.3 The Hertfordshire County Council Traffic Data Report (2015)15 monitors modal split of
transport users in Hertfordshire’s towns. The modal split of those travelling in Harpenden
has most recently been studied in 2011 and 2014, through monitoring travel around the
Town Centre from a number of sites between 7am to 10am (please note train is not included
and many users may be travelling to the station). The results were:
• Car – 82.5% (2011) to 81.9% (2014);
• Bus – 9.4% (2011) to 8.9% (2014);
• Foot – 6.5% (2011) to 9.2% (2014);
• Bicycle – 1.1% (2011) to 1.7% (2014); and
• Motorcycle – 0.5% (2011) to 0.7% (2014).
8.4 The study also considered car occupancy rates, which were 1.26 in 2011 and 1.25 in 2014.
Road Network
8.5 The A1081 runs through Harpenden Town Centre, at which point it is referred to as the High
Street. North of the Town Centre, it is known as Luton Road and south it is known as St
Albans Road. The Hertfordshire Local Transport Plan (2011-2031)16 identifies the A1081 as
a main distributor and primary trunk road in Hertfordshire, connecting Borehamwood to
Harpenden via Radlett and St Albans. The Harpenden Urban Transport Plan (2011)17
states that the A1081 suffers from high traffic flows northbound and southbound throughout
the day, but particularly at AM peak times. It sets out how congestion appears to arise from
15 Hertfordshire County Council (2015) Traffic and Transport Data Report. Available at: https://www.hertfordshire.gov.uk/media-library/documents/highways/transport-planning/transport-and-accident-data/ttdr/traffic-and-transport-data-report-2015.pdf 16 Hertfordshire County Council (2011) Local Transport Plan 2011-2031. Available at: https://www.hertfordshire.gov.uk/media-library/documents/highways/transport-planning/local-transport-plan-live/overarching-strategy.pdf 17 Hertfordshire County Council (2011) Harpenden Urban Transport Plan. Available at: https://www.hertfordshire.gov.uk/media-library/documents/highways/urban-transport-plans/harpenden/harpenden-urban-transport-plan.pdf

Harpenden Neighbourhood Plan Baseline Report for Harpenden Town Council
Page 34
its role as both a strategic route and an access road to a number of vehicle attracting land
uses in the Town Centre, such as retail and community uses, resulting in demand for
medium and short distance trips.
8.6 Other routes that connect Harpenden with surround areas include:
• B653 (Lower Luton Road), which runs north east of Harpenden, through Batford, and
connects to Luton and Wheathampstead;
• B487 (Redbourn Lane), which adjoins the A1081 by Hatching Green and leads
towards Redbourn, where it also connects to the A5183 (Dunstable Road), which
connects to the M1 at Junction 9;
• The Common/Annables Lane, which adjoins the A1081 by Kinsbourne Green
Common and runs through Harpenden Rural Parish, where it splits to provide an
alternative route to M1 Junction 9 or Flamstead (as Watery Lane) or Markyate (at
Coles Lane);
• Pipers Lane, which adjoins Grove Road in Southdown connects to roads leading to
B651 (High Street) south of Wheathampstead, providing an alternative route to St
Albans; and
• Wheathampstead Road, which runs from Southdown and connects to the B651 in
Wheathampstead.
8.7 A key route within Harpenden is the B652 (Station Road), which adjoins the High Street in
the Town Centre and runs east, past the railway station, towards the north east suburbs of
Harpenden, eventually continuing to Luton as the Lower Luton Road. The Harpenden
Urban Transport Study notes this road as another congested route, especially between the
A1081 and the junction with Cowper Road, due to traffic accessing and egressing the station.
It also notes some congestion beyond Cowper Road towards Batford during AM and PM
peak times, including up to the junction with the Lower Luton Road.
8.8 The Harpenden Urban Transport Plan further notes that congestion occurs generally around
Harpenden due to school runs in the AM and PM.
8.9 Harpenden Urban Transport Plan notes four hazardous sites in Harpenden, those being sites
that have experienced six or more collisions over the preceding six years. Those sites are
all located on the A1081, at junctions with Bloomfield Road, Rothamsted Avenue, Station
Road and Bull Road. It further notes that there are issues with excess speed (including
noncompliance with speed limits and unsuitable speed limits) across Harpenden, particularly
on roads that adjoin the A1081 from the east across Harpenden Common (including Cravells

Harpenden Neighbourhood Plan Baseline Report for Harpenden Town Council
Page 35
Road), Walkers Road, Grove Road, the A1081 from Beesonend Lane to Bull Road,
Wheathampstead Road and Leyton Road.
8.10 Hertfordshire County Council carries out an annual Programmed Vehicle Survey (PVS)18,
which monitors the level of traffic at certain nodes around Harpenden based on an Annual
Average Weekday (AAWD) flow, usually recording between 0600 and 2200 and avoiding
occasions where the level of traffic is likely to be unusual (i.e. road works or special events).
Figure 16 shows the locations of the nodes and Figure 17 sets out annual counts at each of
those nodes since 2005.
Figure 16: PVS locations around Harpenden (1. Luton Road 2. Lower Luton Road, Batford 3. Bower Heath Lane 4. Wheathampstead Road 5. Harpenden Road 6. Redbourn Lane).
18 Hertfordshire County Council (regularly updated) Programmed Vehicle Survey. Available at: http://webmaps.hertfordshire.gov.uk/highwayspub/index.htm?layers=%5B5:15,18%5D

Harpenden Neighbourhood Plan Baseline Report for Harpenden Town Council
Page 36
Figure 17: Harpenden vehicle traffic counts measured at each node (2005-2015).
8.11 Figure 17 suggests that traffic on the A1081 has reduced slightly between 2005 and 2015, as
shown by flows north (1, Luton Road) and south (5, Harpenden Road). Usage of the Lower
Luton Road and Wheathampstead Road and Bower Heath Lane has also reduced over the
period; however, the Lower Luton Road appears to be becoming busier. Redbourn Lane
stands out as traffic has generally increased over the period. The above data shows that the
traffic volume has been managed in Harpenden over the past ten years. Most roads are on
a trajectory towards less volume.
Parking
8.12 SADC sets out a list of public car parks on its website19. It identifies the following car parks
in and around Harpenden Town Centre:
• Amenbury Lane – 206 spaces (operated by NCP);
• Bowers Way East – 148 spaces (operated by NCP);
• Bowers Way West – 158 spaces (operated by NCP);
• Harpenden Station – 670 spaces (operated by Meteor Parking);
• Lydekker Park – 88 spaces (operated by Harpenden Town Council); and
• Waitrose Supermarket Cark Park – 130 spaces.
19 St Albans City and District Council (regularly updated) Car Parks in Harpenden. Available at: http://www.stalbans.gov.uk/transport-and-streets/parking/Car_Parks/Car-parks-in-Harpenden/default.aspx
0
5000
10000
15000
20000
25000
AAWD flow by node (2005-2015)
2005 2006 2007 2008 2009 2010 2011 2012 2013 2014 2015

Harpenden Neighbourhood Plan Baseline Report for Harpenden Town Council
Page 37
8.13 In addition, there are some car parks in Southdown, including the Cooperative car cark (157
spaces), Cravells Road Car Park and BAA Lamb car park. The Rothamsted Research car
park is also occasionally open to the public.
8.14 The Harpenden Urban Transport Plan states that key issues in the town include the
presence of commuters seeking to use on-street parking spaces (outside of controlled areas)
and an undersupply of off-street parking spaces. It notes that the station car parks are full
by 08.30am each day.
8.15 The Harpenden Urban Transport Plan considers that the expansion of the controlled parking
zone could help alleviate parking issues, and recommends it for further consideration.
Walking and Cycling
Walking
8.16 Harpenden is not a particularly compact town, being relatively linear in shape, with distinct
areas separated by large green spaces, including The Common. The Town Centre is
particularly linear, with the Town Centre part of the High Street extending by over 500
metres, which may discourage walking.
8.17 The Harpenden Urban Transport Plan notes a number of locations where residents feel
pavements are narrow and crossings should be provided, including around the A1081 and
the Common. It also notes that signage clutter in the Town Centre makes navigation
confusing.
Despite the challenges set out above, pedestrian infrastructure in Harpenden is strong in
places, with some areas of wide pavements and many tree-lined streets punctuated by green
spaces. This means that, outside of problem areas, walking from one destination to another
in Harpenden can be a reasonably pleasant experience.
Cycling
8.18 Figure 18 is taken from the SADC Cycling Map20 and sets out existing cycle routes in
Harpenden.
20 St Albans City and District Council (2014) Cycling Map. Available at: http://www.stalbans.gov.uk/Images/St%20Albans%20City%20%26%20District%20Cycling%20Map%20-%20St%20Albans%20%26%20Harpenden_tcm15-20384.pdf

Harpenden Neighbourhood Plan Baseline Report for Harpenden Town Council
Page 38
Figure 18. Cycle Infrastructure in Harpenden
8.19 The Harpenden Urban Transport Plan notes that cycling numbers are low, despite the strong
strategic transport routes set out above. It notes that there are issues with cycling in the
Town Centre, including lack of continuous cycle routes and poor crossing facilities by the
station. It also notes a lack of cycling infrastructure generally, including routes connecting to
the strategic cycle network and signage. The topography of the town, with its gently sloping
valley, also somewhat discourages cycling and it is noted that this makes travelling across
the town (east-west) somewhat challenging.
Public Transport
Bus
8.20 A number of bus routes run through Harpenden, regularly connecting the Town Centre to
destinations including Luton, St Albans, Hemel Hempstead, Hatfield, Welwyn Garden City
and Watford. The Arriva 321 route from Luton to Watford (every 20 minutes) and Uno 610
route from Cockfosters to Luton (hourly) also stop at Kinsbourne Green. The 321 route also

Harpenden Neighbourhood Plan Baseline Report for Harpenden Town Council
Page 39
serves Southdown on its way to St Albans. The 610, the Centrebus 366 from Luton to
Welwyn Garden City and Hatfield (hourly) and the Uno 657 from Harpenden Cross Lane to
St Albans via Wheathampstead (hourly) serve Batford on their way to Wheathampstead.
The 657 also runs from the Town Centre to the Cross Lane Estate via Southdown. Town
services are provided by the HA1 (2 services a day) and the 307 (3 services a day), which
together provide a limited service from the Aldwickbury area via Southdown into the Town
Centre. The 307 extends to Redbourn. There is also a new community bus service (pilot
scheme) linking the Town Centre with North Harpenden. In addition, there are a number of
school only routes serving the secondary schools in the town from the surrounding villages.
8.21 The Harpenden Urban Transport Plan notes concerns about bus provision in the town,
including:
• Punctuality problems due to congestion at peak times (particularly on A1081) and
lack of real time information;
• No direct bus to hospitals in St Albans, Hemel Hempstead or Watford;
• Poor bus service to Redbourn; and
• Evening services finishing too early.
Train
8.22 Harpenden station is on the Thameslink Network, with fast trains connecting regularly (every
15-30 minutes during the day) to Bedford via Luton (including Airport Parkway) and Sutton,
Brighton or Sevenoaks via St Albans, West Hampstead and central London (St Pancras
International, Farringdon and Blackfriars). Fast trains to London take 25-35 minutes, which
attract commuters. Slow trains stop at more destinations within Hertfordshire are also
relatively regular, generally running every half hour.
8.23 The Harpenden Urban Transport Plan notes concerns about train provision in the town,
including:
• The lack of any east – west services across Hertfordshire;
• Bicycles not being allowed on the trains and poor cycle parking at Harpenden
station;
• Overcrowding in AM peak hours;
• Poor bus interchange at the station;
• Lack of taxi rank at eastern station exit; and,
• Insufficient vehicle parking (including Blue Badge) and access.

Harpenden Neighbourhood Plan Baseline Report for Harpenden Town Council
Page 40
8.24 The above concerns may no longer be relevant, including issues related to bicycle parking,
which has been improved at the station since the Plan, and it should be noted that bicycles
are allowed on trains outside peak hours (folding bicycles at all hours).
Future strategy
8.25 Hertfordshire County Council is in the process of preparing a new Local Transport Plan,
which will set the strategic framework for transport in Hertfordshire to 2050. Hertfordshire
County Council is in the early stages of preparing the Local Transport Plan and consulted on
its emerging Vision21 in December 2016. The Vision sets out six potential policy options,
which comprise:
1. A ‘Transport User Hierarchy’ Policy, which is intended to reduce the pressure on
roads through the promotion of the following, which are in hierarchical order of
importance:
1. Identifying options to reduce the need to travel;
2. Optimise travel for pedestrians and cyclists;
3. Optimise travel by public transport and powered two wheelers;
4. Cater for commercial vehicles including car based shopping and visitor
access; and
5. Cater for car based commuter activities;
2. Delivering a Step Change in Cycling in Larger Urban Areas, through funding
improvements to the cycling environment and parking infrastructure in towns and
supporting better connections between towns;
3. Greater Facilitation and Support for Shared Mobility, including car clubs, lift
share and bike share schemes;
4. Enhanced Public Transport Connectivity Between Towns, Through Bus Priority
Measures, including bus lanes, priority signalling and bus only access roads.
The current proposal suggests the introduction of bus lanes in to Harpenden;
5. A Priority Traffic Management Network, to better manage diversions from major
roads when a road/lane closure occurs; and
6. Growth and Transport Plans, which will provide local level support to the
overarching strategy for Hertfordshire. The local areas will be formed based on
transport considerations rather than pre-existing boundaries (i.e. not necessarily
District boundaries).
21 Hertfordshire County Council (2016) Hertfordshire Transport Vision 2050. Available at: https://www.hertfordshire.gov.uk/about-the-council/consultations/transport-and-highways/hertfordshire-transport-vision-2050.aspx

Harpenden Neighbourhood Plan Baseline Report for Harpenden Town Council
Page 41
8.26 The Vision further sets out five Major Schemes. These are generally local and do not directly
affect Harpenden (such as a Hertford Bypass), however MS5, Hertfordshire Bus Rapid
Transit Network, may affect travel in Harpenden.
8.27 As part of the SLP evidence base SADC prepared a draft Infrastructure Delivery Plan for
consultation with the draft SLP in 2016. Although the SLP is no longer being prepared, this
provides useful background information.

Harpenden Neighbourhood Plan Baseline Report for Harpenden Town Council
Page 42
9.0 Social Infrastructure and Community Facilities
9.1 Harpenden has an extensive number of leisure and community facilities, which this section
captures. This section contains key social infrastructure including schools and doctors
facilities.
Sports and Recreation Facilities and Clubs
9.2 Harpenden’s recreation offer is primarily clustered around the north east corner of
Rothamsted Park. This includes Harpenden Sports Centre, which hosts a gym and a sports
hall. Next door is a large separate indoor swimming pool and a number of outdoor pitches.
The sports centre and swimming pool are owned by SADC and jointly operated by 1Life.
9.3 SADC plans to redevelop Harpenden Sports Centre to provide a single building hosting a
swimming pool and sports facilities at the site of the current swimming pool. This would then
provide space, at the former sports centre site, for a new cultural centre. SADC has
prepared concept design proposals for the redevelopment and has held some initial public
consultation events.
9.4 Next door to Harpenden Sports Centre is Harpenden Lawn Tennis Club. The facilities
include 17 tennis courts, including grass, astro-turf and hard court surfaces. Harpenden has
a second lawn tennis club, Elliswick Lawn Tennis Club, located towards the east of the Town
Centre.
9.5 There are a number of golf courses in and around Harpenden. The most central Golf Club is
Harpenden Common Golf Club, which has its course towards the south end of Harpenden
Common. Harpenden Golf Club is within Harpenden Rural Parish and half of Redbourn Golf
Club is located within Harpenden Rural Parish.
9.6 Harpenden Cricket Club is also located on the Common, further towards the Town Centre. It
has 11 mens senior teams, including some friendly teams, which play at various pitches
around Harpenden. It also has a number of junior teams for boys and girls. The men’s First
X1 play in the Saracens Hertfordshire Premier Division.
9.7 Harpenden Rugby Football Club and Squash Club are located to the south west of
Harpenden, next to Harpenden Golf Course. The Rugby Football Club has mens and
womens, boys and girls teams and hosts the National Pub Sevens. The mens first team
play in in the London 2 North West League, which is at the seventh tier of club rugby.
Harpenden Neighbourhood Plan Baseline Report for Harpenden Town Council
Page 43
9.8 Harpenden Town Football Club is located in Rothamsted Park. The club has a first team,
which plays in the Spartan South Midlands Football League, and a development team.
Harpenden Rovers FC are another local football club, which have four amateur teams and
play on The Common. In addition, the town hosts the Harpenden Colts Junior Football Club.
9.9 Harpenden also has two bowls clubs, an indoor one off Aldwickbury Crescent and an outdoor
club, which is over 100 years old and is located off Spencer Road. The town also has a
Hockey Club, which is currently without a permanent home.
Cultural Facilities
9.10 Harpenden Public Halls hosts a range of cultural events, including music, film, comedy,
theatre and dance. It also provides a number of clubs, including dance and theatre classes
for children and a film society.
9.11 As previously stated, SADC has ambitions to provide a new cultural centre on the site of the
current Sports Centre.
Community Facilities
9.12 Harpenden has a number of community venues, including:
• Harpenden Public Halls
• Batford Memorial Hall (Batford);
• Batford Early Years Centre (Batford);
• Park Hall;
• The Harpenden Trust Centre (Southdown); and
• Harpenden Library.
9.13 A number of other venues around the HNP Area are also used as community venues,
including church halls and the new British Legion facilities.
Education
9.14 Harpenden has a significant number of state and private educational facilities, which are set
out below.
9.15 Nursery and pre-schools:
• Artisans Kindergarten;

Harpenden Neighbourhood Plan Baseline Report for Harpenden Town Council
Page 44
• Busy Bees Nursery – Leyton Road;
• Busy Bees Nursery – Rothamsted;
• Buzby Mae Pre-School;
• Fingertips Creative Arts Preschool & Forest School;
• Harpenden Day Nursery;
• Harpenden Pre-School and Nursery;
• Highfield Pre-School;
• Kinsbourne Common Nursery & Pre school;
• Lynmore Nursery;
• Noah’s Ark Play School;
• Playschool Nursery;
• Southdown Methodist Pre-School;
• Rothamsted Little Stars Nursery;
• Skylarks Day Care; and
• United Reformed Pre-School & Nursery
9.16 State primary:
• Crabtree Infant and Junior Schools;
• Harpenden Academy;
• High Beeches Primary School;
• Manland Primary School;
• Roundwood Primary School;
• Sauncey Wood Primary School;
• St Dominic Catholic Primary School;
• St Nicholas CE VA Primary School;
• The Grove Infant and Junior Schools;
• The Lea Primary School;
• Wood End School;
9.17 State secondary:
• Roundwood Park School (including Sixth Form).
• Sir John Lawes School (including Sixth Form);
• St George’s School (day and boarding) (including Sixth Form); and
9.18 Independent schools:
• St Hilda’s School (girls primary school); and

Harpenden Neighbourhood Plan Baseline Report for Harpenden Town Council
Page 45
• The King’s School (all through).
9.19 All three state secondary schools in Harpenden make their sports facilities available to let by
local residents outside of school hours. Collectively this provides a large range of additional
sports and recreation facilities for the local community. Some primary schools, including
Crabtree Junior School and The Grove Junior School, also make facilities available for use.
School Demand and Growth Plans
9.20 Hertfordshire County Council publishes school admissions data22, which shows that in the
past two years:
• Primary school admissions have been very close to the capacity of 517, with 503
admissions in 2014/15 and 510 admissions in 2015/16; and
• Secondary school admissions have been above the capacity of 572, with 582
admissions in 2014/15 and 585 in 2015/16.
9.21 Hertfordshire County Council is required to forecast demand for state school places on an
annual basis. The figures relate to the Harpenden School Planning Area, which includes
outlying areas reliant on Harpenden for education facilities. The latest figures23, prepared in
2016, run from 2016/17 to 2019/20 for primary schools and 2026/27 for secondary schools.
The forecasts detail the expected percentage shortfall/surplus of places at primary and
secondary level against the current capacity of 517 Reception places and 572 Year 7 places.
Figure 19, shows these forecasts.
22 Hertfordshire County Council (regularly updated) School admissions – previous years’ statistics. Available at: https://www.hertfordshire.gov.uk/services/schools-and-education/school-admissions/research-a-school/school-admissions-previous-years-statistics.aspx 23 Hertfordshire Council (regularly updated) School Planning Forecast. Available at: https://www.hertfordshire.gov.uk/services/schools-and-education/at-school/school-planning/school-planning.aspx

Harpenden Neighbourhood Plan Baseline Report for Harpenden Town Council
Page 46
Figure 19. Forecast Demand for Primary and Secondary School Places in Harpenden School Planning Area
9.22 The forecasts show an expectation that the primary school capacity in Harpenden is
sufficient, and that the surplus of places will grow significantly over the next four years, with
36.4% of Reception places unfilled by 2019/20. The forecast is different for secondary
school places, with an expectation of a shortfall throughout the period to 2026/2027, which is
expected to peak in 2019/20 at 30.9% and fluctuate until reducing from 2022/23.
9.23 In response to the forecasted shortfall, plans are in place for a fourth state secondary school
for Harpenden. The Harpenden Secondary Education Trust, which is a Trust formed by the
three existing secondary schools in the town joined by the University of Hertfordshire and
Rothamsted Research, will manage the school. The Trust has had a site secured for it by
the County Council adjacent to the Lower Luton Road and Common Lane, to the east of the
Parish. The School is planned to open in September 2018, however, planning permission is
yet to be obtained.
9.24 The draft IDP (prepared in support of the abandoned SLP) set out that a proposed two-form
entry primary school at North West Harpenden Broad Location would absorb demand from
that new development and accommodate spare capacity for future growth, Need for
2016/17
2017/18
2018/19
2019/20
2020/21
2021/22
2022/23
2023/24
2024/25
2025/26
2026/27
Primary Places 9.1 20.5 28.8 36.4Secondary Places -2.8 -11.2 -17.8 -30.9 -24.1 -25.7 -29.4 -22.2 -16.8 -7 -0.7
-40
-30
-20
-10
0
10
20
30
40
Perc
enta
ge su
rplu
s/sh
orta
ge o
f pla
ces

Harpenden Neighbourhood Plan Baseline Report for Harpenden Town Council
Page 47
secondary school places arising from that allocation was expected to be met at the proposed
new secondary school. While the SLP is no longer being prepared, this adds some useful
context.
Healthcare
9.25 Harpenden Memorial Hospital provides some limited out-patient services. The nearest
accident and emergency departments are at Luton and Dunstable Hospital, Lister Hospital
(Stevenage) and Watford General Hospital.
9.26 There are three Doctor’s Surgeries in Harpenden:
• The Village Surgery;
• Davenport House Surgery; and,
• The Elms Medical Practice.
9.27 The Herts Valley Clinical Commissioning Group states in its 2016/17 Operation Plan24 that it
is seeking to provide a local care hub in Harpenden, for which it has identified the Harpenden
Memorial site as a potential location.
9.28 The draft IDP (prepared in support of the abandoned SLP) set out that one of the three
surgeries in Harpenden is “significantly constrained” and that two have capacity for more
patient admissions. With regards to the SLP proposal at North West Harpenden Broad
Location, it expected that additional demand could be absorbed but vowed to monitor that
position. While the SLP is no longer being prepared, this provides useful context.
Community Groups
9.29 There are a number of local interest groups in Harpenden. These include:
• The Harpenden Society;
• The Harpenden Local History Society;
• St Albans & Harpenden Patient Group;
• Harpenden Senior’s Forum;
• The Harpenden Trust;
• Harpenden Spotlight on Africa;
• Batford Springs Volunteers;
• Friends of the Nicky Line;
24 Herts Valley Clinical Commissioning Group (2016) 2016/17 Operational Plan. Available at: www.hertsvalleysccg.nhs.uk/documents/publications/.../ccg-reports.../3001-operational-plan

Harpenden Neighbourhood Plan Baseline Report for Harpenden Town Council
Page 48
• Harpenden Light Operatic Society;
• Harpenden Arts Club;
• UNA – Harpenden;
• U3A – Harpenden;
• Harpenden Gang Show;
• Harpenden Green Belt Association;
• Various Brownies, Scouts and Guiding Groups;
• Lions;
• Round Table and Ladies Circle;
• Harpenden Village Rotary Club;
• Harpenden Film Club;
• Rothamsted International Film Club; and,
• British Legion.
Youth Groups
9.30 Harpenden has a number of clubs and venues made available for the use of children and
young people. These include:
• Harpenden Youth Project, which is run by Youth Connections Hertfordshire and
occupies a venue above the Harpenden Library. Its facilities include a dance studio
and café. It runs after school, evening and weekend sessions for young people aged
13-19 (up to 24 for those with a disability or learning difficulty). It also runs an Open
Mic Night;
• Various church-led activities including at the High Street Methodist Church, Christ
Church and the Salvation Army; and
• Brownies, Cubs, Scouts, Guides, Cadets and Harpenden Expedition Club, which run
various outdoor-orientated clubs for children of different age ranges.
Social Media Infrastructure
9.31 Harpenden’s use of community social media infrastructure is very prevalent and significant.
There are a number of Harpenden specific groups within Facebook, some examples of which
include Harpenden Parents Network, Harpenden Parents Group, I Love Batford, Old
Harpenden Years Gone By, Harpenden Dog Owners and Harpenden Jobs. Harpenden
Parents Network currently has approximately 5500 members. It is not only used for

Harpenden Neighbourhood Plan Baseline Report for Harpenden Town Council
Page 49
parenting guidance, but rather an extremely popular more holistic site about issues that affect
people in Harpenden.

Harpenden Neighbourhood Plan Baseline Report for Harpenden Town Council
Page 50
10.0 Natural Environment
10.1 This section sets out the natural environment designations within the Harpenden HNP Area.
It breaks designations down by theme.
Land Use
10.2 Harpenden Rural Parish plus some key open spaces in Harpenden Town, including The
Common, is designated as within the Metropolitan Green Belt of London. The Green Belt is
a land use designation that prevents unrestricted sprawl of large urban areas. The Green
Belt is protected by national planning policy from most development, with the exception of
proposed developments that are for:
• Mineral extraction and engineering operations;
• Local transport infrastructure where a need to be in the Green Belt is demonstrated;
• Re-use of buildings;
• Development brought forward under a Community Right to Build Order;
• Buildings for agriculture and forestry;
• Provision of facilities for outdoor sport/recreation or cemeteries, where it preserves
the openness of the Green Belt;
• Extension or alteration of a building where considered appropriate;
• Replacement of a building where no larger than the building to be replaced; and
• Redevelopment of previously developed sites where the impact on the openness of
the Green Belt would not be greater than under the existing use.
10.3 SADC has the power to redefine Green Belt boundaries during the preparation of
development plan documents. For example, the proposed allocation of North West
Harpenden, if adopted in the new Local Plan, would result in the release of that land from the
Green Belt. At this present moment in time, neighbourhood plans do not have power to
release land from the Green Belt.
Landscape
10.4 There are a number of parks and community green spaces in Harpenden. These include:
• Harpenden Common;
• Batford Springs;
• Rothamsted Park;
• Fovant Close Community Orchard;

Harpenden Neighbourhood Plan Baseline Report for Harpenden Town Council
Page 51
• Lydekker Park;
• Porters Hill Park;
• Nicky Line;
• Upper Lea Valley Walk;
• Marquis Lane; and
• Westfield Recreation Ground.
10.5 Natural England categorises undeveloped land in England based on its quality for
agriculture25. The Agricultural Land Classifications are graded from 5 (very poor) to 1
(excellent). Undeveloped land in Harpenden and Harpenden Rural Parishes is considered
to be 3 (good to moderate).
Biodiversity
10.6 Batford Springs Local Nature Reserve centres on the part of the Upper Lea Valley that
passes through Harpenden. It is owned and managed by Harpenden Town Council, which
is supported by Natural England, Herts and Middlesex Wildlife Trust and the Batford Springs
Volunteers. The Reserve centres on a number of chalk lined springs and ponds, which
support a number of invertebrate species. It is a very rare habitat.
Flood Risk
10.7 The Environment Agency considers the majority of Harpenden to be in river Flood Zone 1
(least concern)26. This is with the exception of some Flood Zone 2 and 3 land in the areas
surrounding the River Lea, which runs through Batford in north west Harpenden.
10.8 The Environment Agency considers there to be some surface water flood risk around
Harpenden27. Areas of medium and high surface water flood risk include along the length of
the High Street, under which is a culverted river, and in areas around the River Lea. Surface
water flood risk is shown at Figure 20.
25 Natural England (2010) Agricultural Land Classification Map Eastern Region. Available at: http://publications.naturalengland.org.uk/category/5954148537204736 26 Environment Agency (regularly updated) Flood Map for Planning (Rivers and Sea). Available at: http://maps.environment-agency.gov.uk/wiyby/wiybyController?x=357683.0&y=355134.0&scale=1&layerGroups=default&ep=map&textonly=off&lang=_e&topic=floodmap 27 Environment Agency (regularly updated) Flood Map for Planning (Surface Water). Available at: https://flood-warning-information.service.gov.uk/long-term-flood-risk/map?map=surfacewater

Harpenden Neighbourhood Plan Baseline Report for Harpenden Town Council
Page 52
Figure 20. Environment Agency Surface Water Flood Risk Map
Air quality
10.9 There are no Air Quality Management Area (AQMA) designations in Harpenden. The
Hertfordshire and Bedfordshire Air Quality network does not currently monitor air quality in
Harpenden.
Ecological footprint
10.10 In 2007, the World Wildlife Fund produced a report detailing the ecological footprint of British
city residents28. While this report did not consider Harpenden, it did consider St Albans, and
the methodology used, whereby the entire local authority area is assessed and then an
urban figure is produced to identify the ecological footprint of the city, could be usefully
applied to Harpenden. The study found that St Albans residents had the second largest
ecological footprint in the UK. Most notable impacts of residents came from transport use
and food sourcing.
28 World Wildlife Fund (2007) Ecological footprint of British city residents. Available at: http://assets.wwf.org.uk/downloads/city_footprint2.pdf

Harpenden Neighbourhood Plan Baseline Report for Harpenden Town Council
Page 53
11.0 Heritage and Design
Heritage
Listed Buildings
11.1 There are a significant number of listed buildings and structures in the HNP Area. There are
particular concentrations of listed buildings in the Town Centre, Kinsbourne Green Common
and the Rothamsted Estate. These are highlighted at Figures 21 and 22, which are taken
from Historic England online records29, which highlight the main clusters of listed buildings in
the HNP Area.
Figure 21. Cluster of Listed Buildings in Harpenden Town Centre and Rothamsted
29 Historic England (regularly updated) Search the List: Map Search. Available at: https://historicengland.org.uk/listing/the-list/map-search?clearresults=true

Harpenden Neighbourhood Plan Baseline Report for Harpenden Town Council
Page 54
Figure 22. Cluster of Listed Buildings in Kinsbourne Green.
11.2 Most listed buildings in Harpenden are Grade II Listed. Some listed buildings attract a more
prestigious grading. These include:
• Grade I Listed Rothamsted Manor, which is located west of Harpenden and within
Harpenden Rural Parish. The manor house was constructed largely in the 16th and
17th Centuries;
• Grade II* Listed Bowers House, in Harpenden Town Centre;
• Grade II* Listed Cross Farmhouse, south of the built up area of Harpenden;
• Grade II* Listed Faulkners End Farmhouse, in Kinsbourne Green Common;
• Grade II* Listed Harpenden Hall, in Harpenden Town Centre;
• Grade II* Listed Harpenden House Hotel, in Harpenden Town Centre;
• Grade II* Listed Parish Church of St Nicholas, in Harpenden Town Centre;
• Grade II* Listed Hammonds End House, in Harpenden Rural Parish; and
• Grade II* Listed Harpendenbury Farmhouse, in Harpenden Rural Parish.
Conservation Areas
11.3 There is one conservation area in the HNP Area, the Harpenden Conservation Area, which is
one of the largest Conservation Areas in the UK. It centres on the Town Centre but includes
a much larger area, extending south to include almost all of Harpenden Common, including

Harpenden Neighbourhood Plan Baseline Report for Harpenden Town Council
Page 55
some small parts of Hatching Green/West Common and Southdown. North of the Town
Centre, it includes a considerable amount of the residential areas either side of the A1081,
eventually terminating at the built up area boundary next to Highfield Oval.
11.4 The Harpenden Conservation Area Character Statement (2008)30 sets out the key
characteristics of the Conservation Area. In order to do this, it defines 14 separate ‘identity
areas’ within the wider Conservation Area. These areas are set out in the table below.
Identity Area Key Characteristics
A – High Street Grand Town Centre buildings, some of which are older
than most other buildings in Harpenden.
B – Harpenden Lodge Transition area between Town Centre and residential
areas – large scale group of buildings
C1 – Luton Road and
Hollybush Lane
Late Victorian and Edwardian suburban houses, generally
medium size and semi-detached.
C2 – Park Hill Smaller suburban housing, generally semi-detached and
terraced.
D – Highfield Oval Classic example of an early 20th Century institutional
development, in the garden city style.
E1 – The Avenues west of
Town Centre
Semi-rural character due to proximity to Rothamsted Park
and prevalence of cottages, however, with many
Edwardian and Victorian houses. Formerly part of Pym
and Packe Estate.
E2 – The Avenues north-
west of the Town Centre
Similar to the above.
F – Park Avenue Formerly part of Pym and Packe Estate. Generally
composed of larger detached properties, many of which
were built after the war.
G – Station Road Small area characterised by a number of institutional
buildings.
H – Bowers Way North Inter-war suburban housing, primarily medium sized.
I.1 – St George’s School and
Harpenden Memorial
Hospital
Two large nineteenth century buildings set in grand park-
like grounds.
I.2 – Ox Lane Area Varied housing styles, including some Victorian and
Edwardian properties.
30 St Albans City and District Council (2008) Harpenden Conservation Area Statement. Available at: http://www.stalbans.gov.uk/planning/conservation/conservation-areas.aspx

Harpenden Neighbourhood Plan Baseline Report for Harpenden Town Council
Page 56
J – The Poets Enclave of late Victorian and Edwardian houses, semi-
detached and detached.
K – The Common Open green expanse of common land, which penetrates
the town, used for sports and recreation.
L1 – Development
Surrounding The Common –
East Side
Large houses set in spacious surrounds in parts and
smaller housing in terraces.
L2 – Development
Surrounding The Common –
West Side
Many historic buildings with interesting/varied characters
M – West Common Mainly large twentieth century housing.
N – Hatching Green Mixture of detached, semidetached and terraced housing
around a small green.
O – Southdown Area Nineteenth century housing, public houses near a small
green.
11.5 A number of buildings within the Harpenden Conservation Area have been ‘locally listed’ by
SADC. Local listing affords some protection to non-statutory listed buildings deemed an
asset to the Conservation Area. SADC has prepared a list of locally listed buildings (1999),
which is available on its website31.
Scheduled Monuments
11.6 There is one Scheduled Ancient Monument in the HNP Area, which is the Rothamsted
Romano-British Cemetery.
Design
Character areas outside conservation area
11.7 A number of parts of the HNP Area fall outside the Conservation Area. These broad areas
are described in the table below.
Manland Way to Crabtree
Lane
Large detached and semi-detached post-war housing set
with generous gardens is typical in this area.
West Common The part of West Common outside of the Conservation
Area is typified by large post-war housing, most of which is
31 St Albans City and District Council (1999) Harpenden Locally Listed Buildings. Available at: http://www.stalbans.gov.uk/planning/conservation/conservation-areas.aspx

Harpenden Neighbourhood Plan Baseline Report for Harpenden Town Council
Page 57
detached. The design style is varied, with a number of
grand and highly detailed properties.
Southdown Residential areas in Southdown are typified by medium
sized post-war housing, most of which is semi-detached.
The neighbourhood centre has a range of styles.
Batford Housing in Batford is generally post-war, with a range of
property sizes, including some areas with smaller houses.
Wood End/Kinsbourne
Green
This area contains a mix of post-war housing, ranging
from large detached dwellings to rows of terraced housing.
Kinsbourne Green Common This is the largest cluster of development in Harpenden
Rural. Houses are very large and generally set in
spacious grounds. Many historic properties are located in
this area
Other parts of Harpenden
Rural Parish
Isolated farmhouses mostly typify this area.
Exemplary building design
11.8 There are examples of high quality and detailed housing throughout Harpenden, much of
which was built during the Edwardian and Victorian eras. Areas of exemplary design are
generally contained within the Conservation Area.

Harpenden Neighbourhood Plan Baseline Report for Harpenden Town Council
Page 58
12.0 Summary
12.1 This Baseline Report has identified the key features of Harpenden and has set out key
issues for the emerging HNP, taken from range of evidence base studies. It has found the
following:
• A key consideration for the HNP is the planning policy context. SADC is currently
preparing a new Local Plan, which will be important for planning decisions in
Harpenden;
• The Harpenden population is generally well-educated and affluent, with low levels of
deprivation. There are, however, some pockets of more deprived areas within the
HNP Area, which will be considered as part of the production of the HNP;
• Harpenden is a town that has grown rapidly since the start of the 20th Century and
has become a very desirable and expensive place to live. The town will continue to
grow, with requirements for new housing to meet demand. Conversely, Harpenden
Rural is a Parish with very limited growth and it is not anticipated further growth is
required;
• Despite its image as a commuter town, Harpenden has a number of designated
employment Sites, the most prominent of which is Rothamsted Research;
• Harpenden Town Centre is an attractive retail location. The retail offer is
supplemented by a neighbourhood centre in Southdown;
• Transport is a key issue in Harpenden, with the town experiencing traffic and parking
congestion. The railway station is a busy hub, with a large number of residents
commuting by train;
• Harpenden has a large range of leisure and community facilities and sports teams.
Plans are in place to provide new improved leisure and cultural facilities at the site of
the current Sports Centre and swimming pool. Harpenden also has a large number
of schools and is expecting the delivery of a new secondary school in the near
future;
• The natural environment in Harpenden is well integrated in to the Town, with open
spaces such as The Common and Rothamsted Park being located centrally. The
Green Belt designation of Harpenden Rural and undeveloped areas around
Harpenden Town protects the rurality of much of the HNP Area; and

Harpenden Neighbourhood Plan Baseline Report for Harpenden Town Council
Page 59
• The HNP Area includes a vast number of heritage and archaeological assets, which
will need to be considered during the development of the HNP.
12.2 The findings of this document will be vital to the production of the HNP, establishing a
baseline of knowledge that, alongside findings from engagement, will inform its content.