harlow council 2014/15 quarter two: joint finance and
TRANSCRIPT
www.harlow.gov.uk/performance Email: [email protected]
Harlow Council 2014/15 Quarter Two: Joint Finance and Performance Report for the period ending 30 September 2014

The Council’s aim for 2014-15 –
“Improving Harlow for residents, businesses and visitors”
The Council’s priorities:
1. More and better housing
2. Regeneration and a thriving economy
3. Wellbeing and social inclusion
4. A clean and green environment
5. Successful children and young people
The Council’s principles:
Being the community leader
Sound resource management
How to use this report
You may wish to consider the following questions to form an idea on how well the Council is doing in achieving its priorities and objectives.
Questions which the reader may wish to consider:
1. What are the reasons for the performance being below target?
2. What is the Council’s expenditure on this service?
3. Has performance fluctuated between quarters and what are the reasons for this?
4. Is it anticipated that the target will be met by the end of the year?
5. What are the proposed actions to improve performance and achieve the target and when will this be done by?
6. How well is the Council responding to gaps in performance or shortfalls in income?
Other areas for consideration could include:
7. Is the indicator a high priority for the Council? Is this reflected in the budget?
8. How does the service compare to other local authorities in terms of value for money – how does the Council’s expenditure on this service and performance achieved compare to similar local authorities?
9. What are other Council’s doing to improve performance in this area?
10. Are there any overspends/underspends in the budget area within which the under performing indicator sits?
11. Are there any future projects planned that will enhance existing performance?
12. How severe or likely are risks associated with lower level performance?
Performance Symbols:
Harlow Council uses the below symbols when reporting performance.
Below Target: e.g. more than 5% worse than target
On Target: e.g. within 5% of
target
Above Target: e.g. more than 5%
above target
Data not yet available: e.g. survey information pending
Direction of Travel (DOT) Symbols
Going up and getting better e.g. % of rent
collected
Going down and getting better e.g.
crime levels
Exactly the same as
previous year
Going up and getting worse e.g
levels of litter
Going down and getting worse e.g. income generated
Section One: Key considerations for Quarter Two The key issues relating to the Council’s finances, performance, risks and corporate projects (excluding the HRA):
FIN
AN
CE
A review from 01 July 2014 to 30 September 2014 indicates that,
in total, the controllable General Fund revenue budget is
projected to be under-spent by £206,000. This represents -0.31%
of the Council’s approved gross budget for the General Fund.
Key risks in relation to financial management continue to be:
The risk associated with the Government’s localisation of
council tax support and business rates.
Variations in income from fees and charges as public
spending habits respond to the economic climate.
Continued long-term austerity measures placed upon local
government by the Government.
Six performance indicators (13 per cent) under-performed by at least 20
per cent in Quarter Two, these are:
i. BV202 - Homelessness
ii. BF005 - Average days to process new claims
iii. BF006 - Average days to process change events
iv. CS02b – Percentage of lost calls for Contact Harlow
v. NI195a - Street and environmental cleanliness (percentage of land
assessed as having unacceptable levels of litter).
vi. NI195b – Street and environmental cleanliness (percentage of land
assessed as having unacceptable levels of detritus).
PE
RF
OR
MA
NC
E
RIS
K
Exceptional risks (rated as high likelihood, high impact):
A total of four risks are highlighted as exceptional for quarter
three. These relate to:
i. The ongoing threat of austerity measures
ii. Risks of several high level regeneration projects: in particular –
delays in the GAFII programme,
iii. Investment into the town centre and,
iv. Investment for motorway Junction 7A
The Council is on track to meet 90 per cent of its Corporate Plan
milestones with 84 of 93 key corporate milestones being marked as
green or complete for the period July to September 2014.
Four milestones have lapsed or require further action to ensure they will
be completed during 2014/15:
i. Lead on the delivery of the 'Peaceful Neighbourhoods' work
stream.
ii. Determine the future of the waste and recycling contract.
CO
RP
OR
AT
E P
LA
N
4
Section Two: What our customers are telling us (complaints)
The Council provides and commissions a large number of services to a population of over
84,000 residents. In its role as a Housing Authority with over nine thousand properties - each
year it undertakes in excess of 600,000 housing transactions, deals with hundreds of
thousands of enquiries at Contact Harlow and provides benefits administration for a caseload of
over 10,000 benefit claimants. All complaints are taken seriously by the Council which aims to
respond to and resolve all stage one and stage two complaints within ten working days.
The number of complaints logged by Harlow Council has decreased on average between 2009
and 2014. The majority of complaints are answered within the Council’s target timescale of ten
days*. 79 per cent of complaints were resolved by Stage One.
During July to September 2014 the Council received between… 63 and 89 complaints regarding performance: These peaked in September 2014 with 48 per cent of complaints relating to Kier Harlow Ltd Housing Services.
9 and 18 complaints regarding persons: These were again highest in September 2014 with largest numbers relating to Housing and Community Wellbeing Services.
7 and 14 complaints regarding policies peaking in July 2014: the largest numbers were regarding Housing Services. * Stage One and Stage Two complaints to be resolved within ten working days, Harlow Council Complaints Policy, June 2013.

5
Section Three: Latest Financial Performance
A review of the Council’s General Fund budget from 01 July 2014 to 30 September 2014
identifies that, in total, the controllable budget is projected to be under-spent by £206,000 and
represents a -0.31 per cent variation when compared with the approved gross budget.
Excellent control continues to be applied across all service budgets despite the on-going
economic problems.
When combined with the non-controllable forecast variations the total under-spend forecast
for the General Fund is £346,000, or -0.52 per cent when compared with the General Fund
gross budget. This variation includes the forecast loss of business rates income compared
with the Council’s baseline figures. The Council bears the first 7.5 per cent of any under-
recovery of business rates under the Government’s Business Rates Retention scheme. For
Harlow, this means that up to £204,000 of any business rates shortfall in the year has to be
met by the Council locally, as reflected in the Major Variations table contained within this
report. The South East Local Enterprise Partnership (SELEP) agreed to repay the Council in
respect of the start-up costs associated with the Enterprise Zone and as a result £244,000
has been received. It is proposed that this receipt will be contributed to a new earmarked
reserve – “Regeneration and Enterprise Reserve” in order to help support the Council’s
regeneration work within Harlow.
Subject to financial performance during the remainder of the 2014/15 financial year the
current forecast for the General Fund Balance is shown in the table below after accounting for
the planned movements relating to the Discretionary Services Fund. The approved minimum
working balance on the General Fund is £2.5 million.
Simon Freeman, Head of Finance
Forecast Movements in General Fund Balance in 2014/15
£000s*
General Fund opening balance as at 1 Apr 2014 4,753
Service budget variations (favourable) 346
Impact of budgeted earmarked reserve movements
Transfer to Discretionary Services Fund (approved Cabinet 17/7/14) (1,985)
Approved budget carry over from 2013/14 into 2014/15 (255)
Windfall income: Kier dividend 1,527
Transfer to Discretionary Services Fund in respect of Kier dividend (approved
Cabinet 11/9/14) (1,527)
Sub-total before proposed movements to/from earmarked reserves 2,859
Proposed movements to/ from earmarked reserves:
Transfer to new earmarked reserve in respect of EZ grant (Recommendation X) (244)
Closing General Fund Balance as at 31 March 2015 (projected) 2,615
* Note: Figures in brackets () reduce the projected General Fund Balance.

6
Latest Financial Performance (Budget Variations / Exceptions):
Major Variances – Period Six / Quarter Two of 2014/15:
Service Adverse Favourable Net Main Contributing Factors to Variations
£000s £000s £000s
Community Wellbeing Service
Recycling (87) (87) Additional income (£39k) and reduced inflation on the contract (£36k)
Sports Partnership (50) (50) Favourable performance by District Sports Trust
Domestic Refuse Collection
60 (25) 35 Reduced inflation on the contract (£22k) less non achievement of saving £60k
Community Services - Central Services
(35) (35) Savings derived from vacancy of Head of Service Post
Contact Harlow 33 33 Employee costs and non-achievement of vacancy savings (nb, off-set by variation in contribution from HRA, see below)
Street Cleansing 32 32 Non-achievement of budget saving
Open Spaces (26) (26) Income from low-value land sales
Other Minor Service Variances
31 31 Net of all other variances across the service
Total Community Wellbeing Services
(67)
Regeneration & Enterprise Service
Latton Bush Centre 39 39 Reduced rental and service charges income
Water Gardens Car park
37 37 Reduction in income
Civic Centre 53 (27) 26 Increased employee costs and half-year effect of new cleaning contract, partially offset by forecast reduction in energy costs
Property and Facilities (25) (25) Reduced employee costs arising from vacancies
Other Minor Service Variances
(34) (34) Net of all other variances across the service
Total Regeneration & Enterprise Service
43
Housing (General Fund) Service
Supporting People (111) (111) Cuts in Forecasted ECC Supporting People grant level not materialised in 2014/15.
Other Minor Service Variances
24 24 Increased staffing costs offset by efficiencies realised from re-procurement of Temporary Accommodation.
Total Housing (General (87)
2014/15 Outturn – Forecast
The Council forecasts that it will
underspend by a margin of -0.52% on its
gross General Fund revenue budget.
3%
2%
1%
-1%
-2%
-3%
2.5%
1.5%
0.5%
-0.5%
-1.5%
-2.5%

7
Service Adverse Favourable Net Main Contributing Factors to Variations
£000s £000s £000s
Fund) Service
Finance Service
Housing Benefits 70 70 Housing Benefit subsidy claim
Insurance Section 43 43 Projected variation in Council-wide policy excesses
Finance, Miscellaneous (37) (37) Reduced audit fees
ICT (35) (35) Staff vacancies
Other Minor Service Variances
(6) (6) Net of all other variances across the service
Total Finance Service 35
Governance Service
Policy and Performance (31) (31) Staff vacancies
Other Minor Service Variances
(51) (51) (mainly attributable to staff vacancies across the service)
Total Governance Service
(82)
Corporate Services
CMT (48) (48) Saving in employee costs (-£45k)
Total Corporate Services
(48)
Service-Related Variations Sub Total
(206)
Other
Costs chargeable to/from the HRA
133 133 The major element of this is the HRA recharge for the JVCo being reduced due to the JVCo underspend
JVCo Payments (177) (177) The year-end variation reflects reduced RPI and pension payments (note: £153k of the underspend is attributable to the HRA)
Other One-Off/ Windfall & Non-Service-Specific Items
Additional Corporate Grants and Income
(56) (56) Additional income from Homes & Communities Agency (-£9k), additional New Homes Bonus Grant (-£31k) and New Burdens Grant (-£16k)
Enterprise Zone (244) (244) SELEP Grant for EZ set-up costs
Net Business Rates Retention
204 204 Applying maximum safety net exposure
Total General Fund Budget Variation (net underspend)
(346)
** Note: Figures in () are a credit e.g. income or underspend.

8
Service based summary of financial control:
Community Wellbeing, Graham Branchett:
Financial performance of Community Wellbeing remains positive, with a small year-end underspend identified mainly due to factors outside of the control of the Council. The Key Performance Indicators are detailed within the report and continue to show a generally positive position with commentary also provided where necessary within Section Five.
Regeneration, Graeme Bloomer:
Financial control remains good. Energy reduction measures should be reflected in lower energy costs at year end. The procurement of the new cleaning contract was ultimately more costly than envisaged when the overall budget was set.
Housing, Andrew Murray:
Housing need resources continue to reduce with the need to prioritise and target resources accordingly to support increased demand and assessment. Efficiencies being realised from the re-procurement of temporary accommodation, and the prevention initiatives continue to be resourced as these are recognised to be effective in providing settled housing solutions as well as preventing homelessness. Thereby reducing the Council`s statutory provision and overall costs.
There continues to be uncertainty as to future levels and procurement of supported housing and commissioning arrangements.
Governance, Brian Keane:
Good financial control continues to be maintained during the first quarter of the 2014/15 financial year with no major variations to be reported at this stage of the year. Issues which may arise will generally be staffing related either through the occurrence of vacancies leading to the reporting of savings or the non-achievement of vacancy savings currently built in to the service budget if there is little turnover during the remainder of the year.
Finance, Corporate Services and other items, Simon Freeman:
The Finance Service is currently forecasting an overspend at quarter two of the financial year. This position will be closely monitored during the remainder of the year with a view to bringing the overall service position in line with the approved budget by year end.
Key issues for the service continue to focus on the workload pressures within the Revenues and Benefits Service area, where vacancies are creating issues of performance as set out in section four and five of this report. Failure to meet the performance targets can lead to errors occurring especially in the overpayment of benefits which the Council is then not able to recover. The cost of these overpayments fall to the Council subject to DWP set thresholds and a financial cost of £70,000 has been included in this report to reflect this potential implication of the processing delays. The Revenues and Benefits Service also has a £200,000 savings target to meet which may now prove to be difficult during 2014/15 as a result of the proposed private sector partnership no longer going ahead. The savings will therefore have to be found internally and any review of the Service will only create a part year effect in 2014/15.
The new arrangements in place for the collection and distribution of business rates are being monitored closely. At this stage in the financial year, it is envisaged that the impact of local economic conditions will result in the Council meeting the cost of income reductions up to its threshold level of £204,000. The Council forecast this in its NNDR 1 return to Government and is receiving safety net payments on account during the year as a result.
9
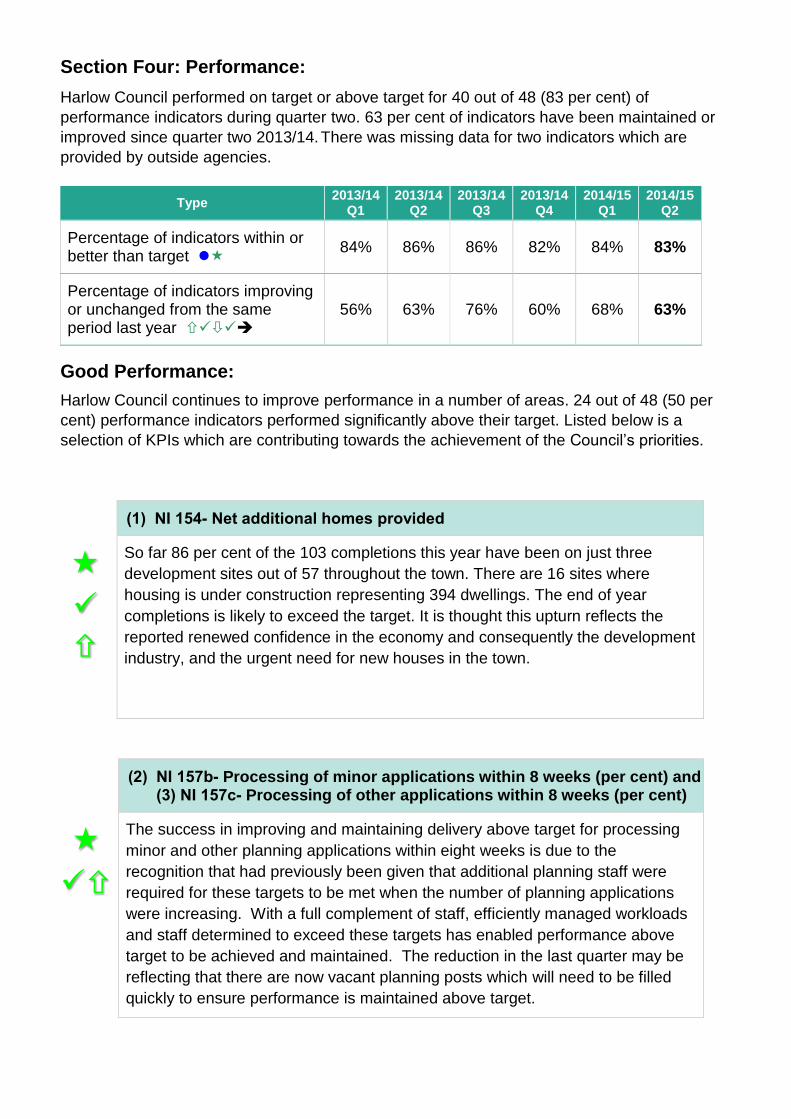
Section Four: Performance:
Harlow Council performed on target or above target for 40 out of 48 (83 per cent) of
performance indicators during quarter two. 63 per cent of indicators have been maintained or
improved since quarter two 2013/14. There was missing data for two indicators which are
provided by outside agencies.
Type 2013/14
Q1 2013/14
Q2 2013/14
Q3 2013/14
Q4 2014/15
Q1 2014/15
Q2
Percentage of indicators within or better than target
84% 86% 86% 82% 84% 83%
Percentage of indicators improving or unchanged from the same period last year
56% 63% 76% 60% 68% 63%
Good Performance:
Harlow Council continues to improve performance in a number of areas. 24 out of 48 (50 per
cent) performance indicators performed significantly above their target. Listed below is a
selection of KPIs which are contributing towards the achievement of the Council’s priorities.
(1) NI 154- Net additional homes provided
So far 86 per cent of the 103 completions this year have been on just three
development sites out of 57 throughout the town. There are 16 sites where
housing is under construction representing 394 dwellings. The end of year
completions is likely to exceed the target. It is thought this upturn reflects the
reported renewed confidence in the economy and consequently the development
industry, and the urgent need for new houses in the town.
(2) NI 157b- Processing of minor applications within 8 weeks (per cent) and (3) NI 157c- Processing of other applications within 8 weeks (per cent)
The success in improving and maintaining delivery above target for processing
minor and other planning applications within eight weeks is due to the
recognition that had previously been given that additional planning staff were
required for these targets to be met when the number of planning applications
were increasing. With a full complement of staff, efficiently managed workloads
and staff determined to exceed these targets has enabled performance above
target to be achieved and maintained. The reduction in the last quarter may be
reflecting that there are now vacant planning posts which will need to be filled
quickly to ensure performance is maintained above target.
10
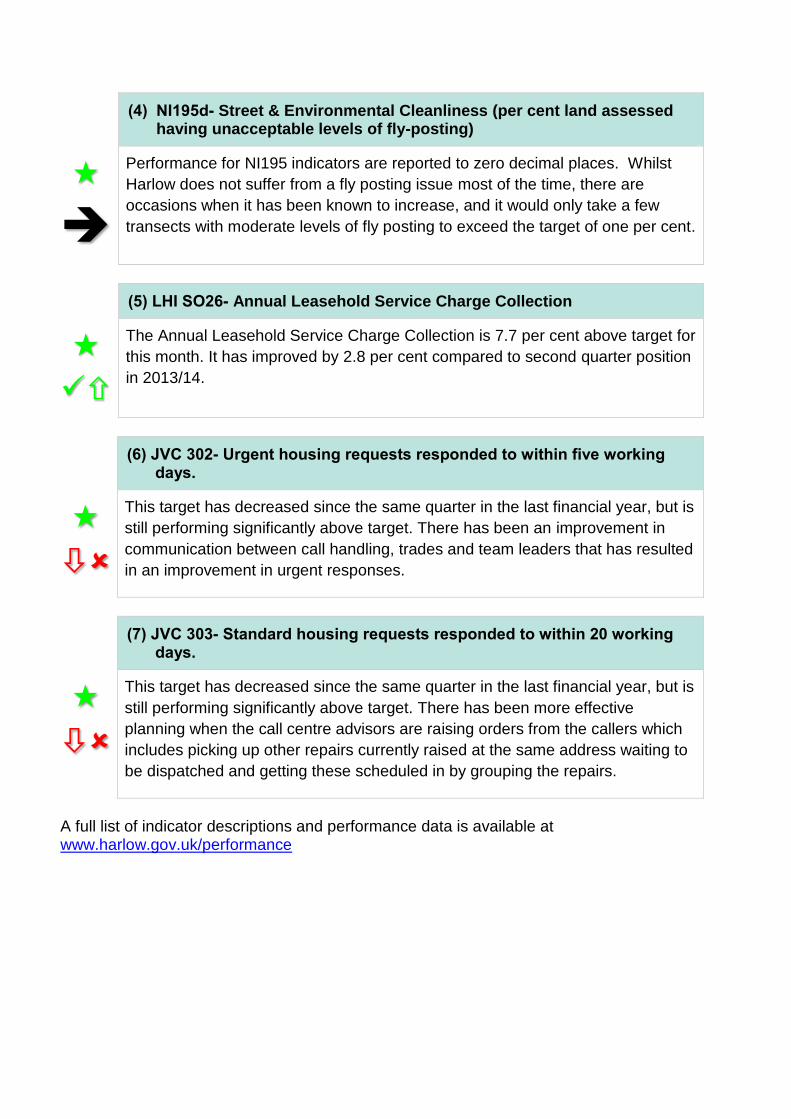
(4) NI195d- Street & Environmental Cleanliness (per cent land assessed having unacceptable levels of fly-posting)
Performance for NI195 indicators are reported to zero decimal places. Whilst
Harlow does not suffer from a fly posting issue most of the time, there are
occasions when it has been known to increase, and it would only take a few
transects with moderate levels of fly posting to exceed the target of one per cent.
(5) LHI SO26- Annual Leasehold Service Charge Collection
The Annual Leasehold Service Charge Collection is 7.7 per cent above target for
this month. It has improved by 2.8 per cent compared to second quarter position
in 2013/14.
(6) JVC 302- Urgent housing requests responded to within five working days.
This target has decreased since the same quarter in the last financial year, but is
still performing significantly above target. There has been an improvement in
communication between call handling, trades and team leaders that has resulted
in an improvement in urgent responses.
(7) JVC 303- Standard housing requests responded to within 20 working days.
This target has decreased since the same quarter in the last financial year, but is
still performing significantly above target. There has been more effective
planning when the call centre advisors are raising orders from the callers which
includes picking up other repairs currently raised at the same address waiting to
be dispatched and getting these scheduled in by grouping the repairs.
A full list of indicator descriptions and performance data is available at www.harlow.gov.uk/performance
11
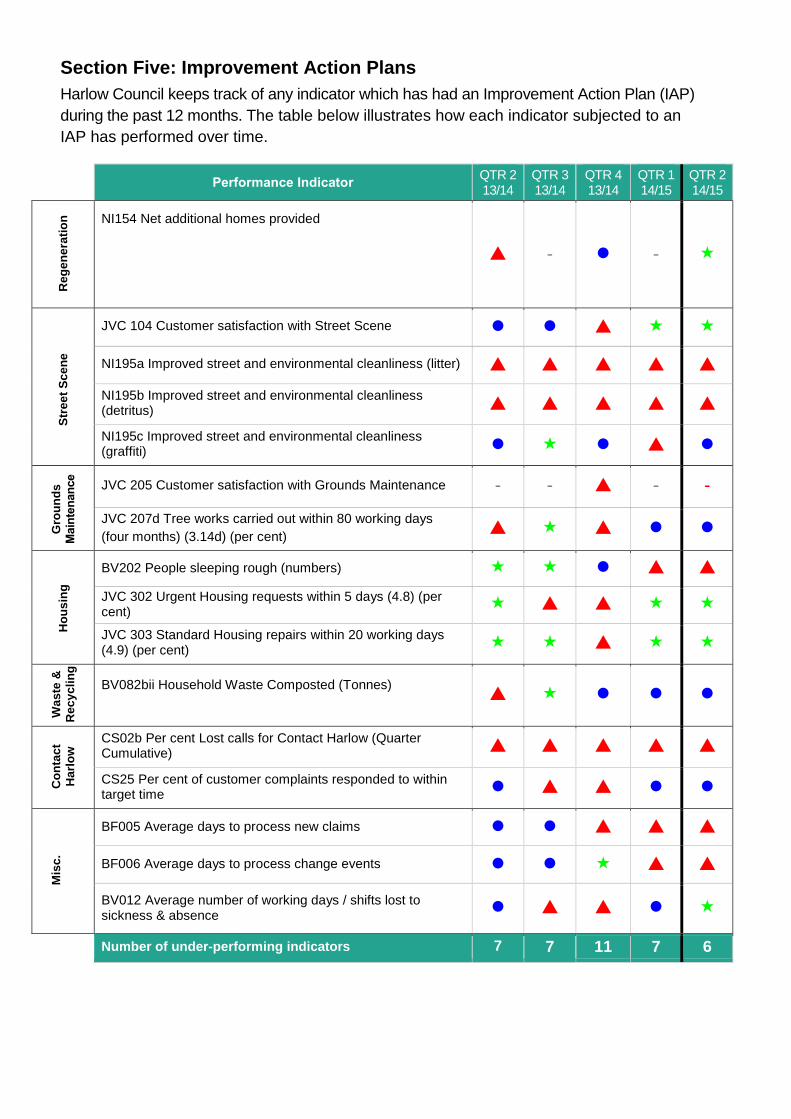
Section Five: Improvement Action Plans
Harlow Council keeps track of any indicator which has had an Improvement Action Plan (IAP)
during the past 12 months. The table below illustrates how each indicator subjected to an
IAP has performed over time.
Performance Indicator
QTR 2 13/14
QTR 3 13/14
QTR 4 13/14
QTR 1 14/15
QTR 2 14/15
Re
ge
ne
rati
on
NI154 Net additional homes provided
- -
Str
ee
t S
ce
ne
JVC 104 Customer satisfaction with Street Scene
NI195a Improved street and environmental cleanliness (litter)
NI195b Improved street and environmental cleanliness (detritus)
NI195c Improved street and environmental cleanliness (graffiti)
Gro
un
ds
Main
ten
an
ce
JVC 205 Customer satisfaction with Grounds Maintenance - - - -
JVC 207d Tree works carried out within 80 working days
(four months) (3.14d) (per cent)
Ho
us
ing
BV202 People sleeping rough (numbers)
JVC 302 Urgent Housing requests within 5 days (4.8) (per cent)
JVC 303 Standard Housing repairs within 20 working days (4.9) (per cent)
Wa
ste
&
Rec
yc
lin
g
BV082bii Household Waste Composted (Tonnes)
Co
nta
ct
Harl
ow
CS02b Per cent Lost calls for Contact Harlow (Quarter Cumulative)
CS25 Per cent of customer complaints responded to within target time
Mis
c.
BF005 Average days to process new claims
BF006 Average days to process change events
BV012 Average number of working days / shifts lost to sickness & absence
Number of under-performing indicators 7 7 11 7 6
12
Perf
orm
an
ce In
dic
ato
r
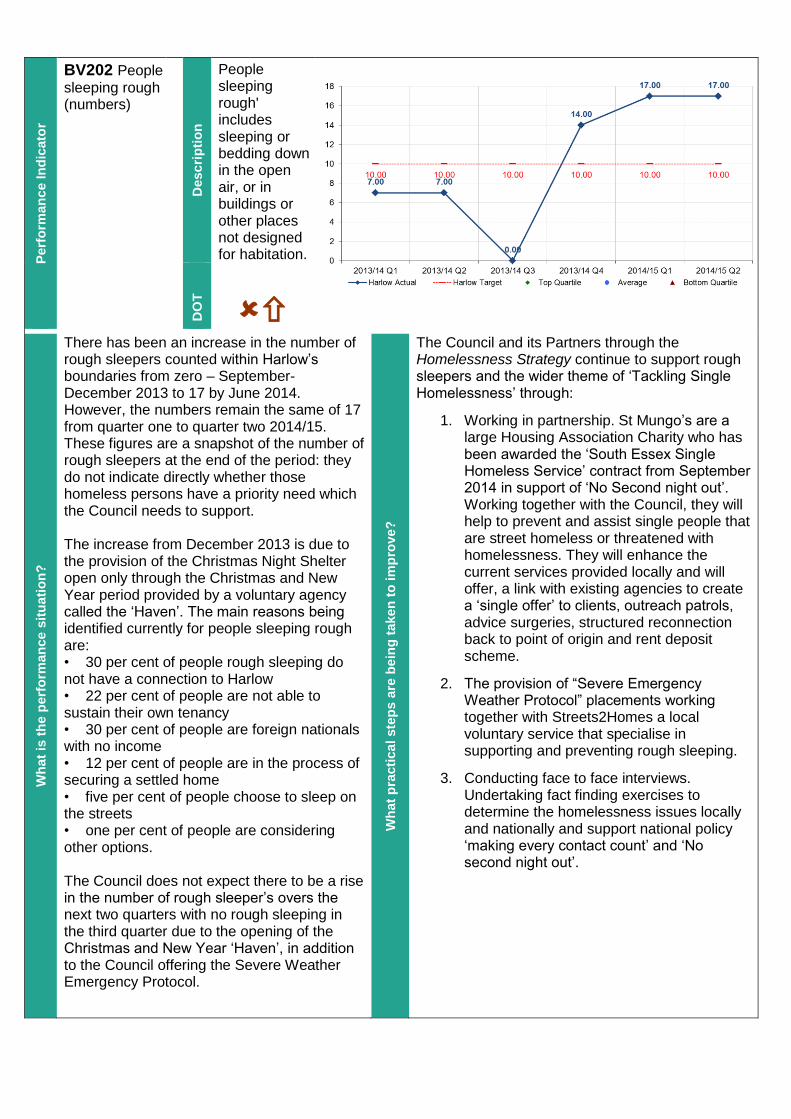
BV202 People
sleeping rough (numbers)
Desc
rip
tio
n
People sleeping rough' includes sleeping or bedding down in the open air, or in buildings or other places not designed for habitation.
DO
T
Wh
at
is t
he
perf
orm
an
ce
sit
uati
on
?
There has been an increase in the number of rough sleepers counted within Harlow’s boundaries from zero – September- December 2013 to 17 by June 2014. However, the numbers remain the same of 17 from quarter one to quarter two 2014/15. These figures are a snapshot of the number of rough sleepers at the end of the period: they do not indicate directly whether those homeless persons have a priority need which the Council needs to support. The increase from December 2013 is due to the provision of the Christmas Night Shelter open only through the Christmas and New Year period provided by a voluntary agency called the ‘Haven’. The main reasons being identified currently for people sleeping rough are: • 30 per cent of people rough sleeping do not have a connection to Harlow • 22 per cent of people are not able to sustain their own tenancy • 30 per cent of people are foreign nationals with no income • 12 per cent of people are in the process of securing a settled home • five per cent of people choose to sleep on the streets • one per cent of people are considering other options. The Council does not expect there to be a rise in the number of rough sleeper’s overs the next two quarters with no rough sleeping in the third quarter due to the opening of the Christmas and New Year ‘Haven’, in addition to the Council offering the Severe Weather Emergency Protocol.
Wh
at
pra
cti
ca
l ste
ps
are
bein
g t
aken
to
im
pro
ve?
The Council and its Partners through the Homelessness Strategy continue to support rough sleepers and the wider theme of ‘Tackling Single Homelessness’ through:
1. Working in partnership. St Mungo’s are a large Housing Association Charity who has been awarded the ‘South Essex Single Homeless Service’ contract from September 2014 in support of ‘No Second night out’. Working together with the Council, they will help to prevent and assist single people that are street homeless or threatened with homelessness. They will enhance the current services provided locally and will offer, a link with existing agencies to create a ‘single offer’ to clients, outreach patrols, advice surgeries, structured reconnection back to point of origin and rent deposit scheme.
2. The provision of “Severe Emergency Weather Protocol” placements working together with Streets2Homes a local voluntary service that specialise in supporting and preventing rough sleeping.
3. Conducting face to face interviews. Undertaking fact finding exercises to determine the homelessness issues locally and nationally and support national policy ‘making every contact count’ and ‘No second night out’.
13
Perf
orm
an
ce
Ind
icato
r
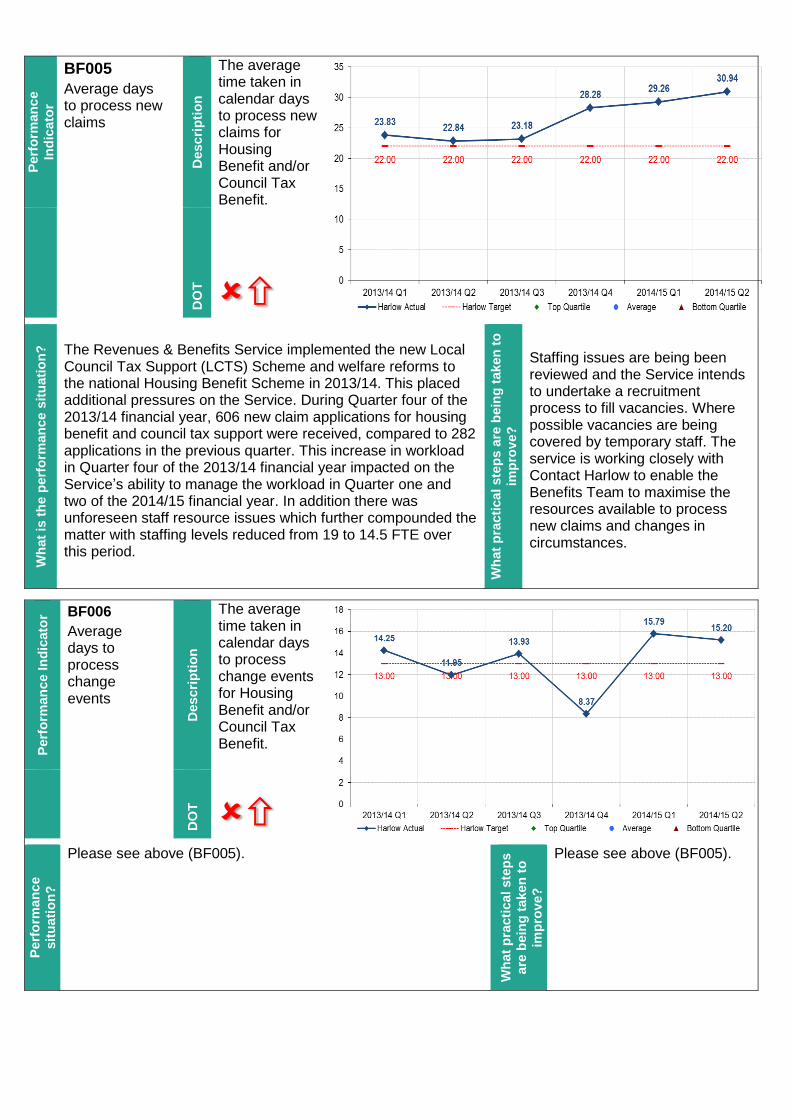
BF005
Average days to process new claims
Desc
rip
tio
n
The average time taken in calendar days to process new claims for Housing Benefit and/or Council Tax Benefit.
DO
T
Wh
at
is t
he
perf
orm
an
ce
sit
uati
on
?
The Revenues & Benefits Service implemented the new Local Council Tax Support (LCTS) Scheme and welfare reforms to the national Housing Benefit Scheme in 2013/14. This placed additional pressures on the Service. During Quarter four of the 2013/14 financial year, 606 new claim applications for housing benefit and council tax support were received, compared to 282 applications in the previous quarter. This increase in workload in Quarter four of the 2013/14 financial year impacted on the Service’s ability to manage the workload in Quarter one and two of the 2014/15 financial year. In addition there was unforeseen staff resource issues which further compounded the matter with staffing levels reduced from 19 to 14.5 FTE over this period.
Wh
at
pra
cti
ca
l ste
ps
are
bein
g t
aken
to
imp
rove?
Staffing issues are being been reviewed and the Service intends to undertake a recruitment process to fill vacancies. Where possible vacancies are being covered by temporary staff. The service is working closely with Contact Harlow to enable the Benefits Team to maximise the resources available to process new claims and changes in circumstances.
Perf
orm
an
ce In
dic
ato
r BF006
Average days to process change events
Desc
rip
tio
n
The average time taken in calendar days to process change events for Housing Benefit and/or Council Tax Benefit.
DO
T
Perf
orm
an
ce
sit
uati
on
?
Please see above (BF005).
W
hat
pra
cti
ca
l ste
ps
are
bein
g t
aken
to
imp
rove?
Please see above (BF005).
14
Perf
orm
an
ce In
dic
ato
r
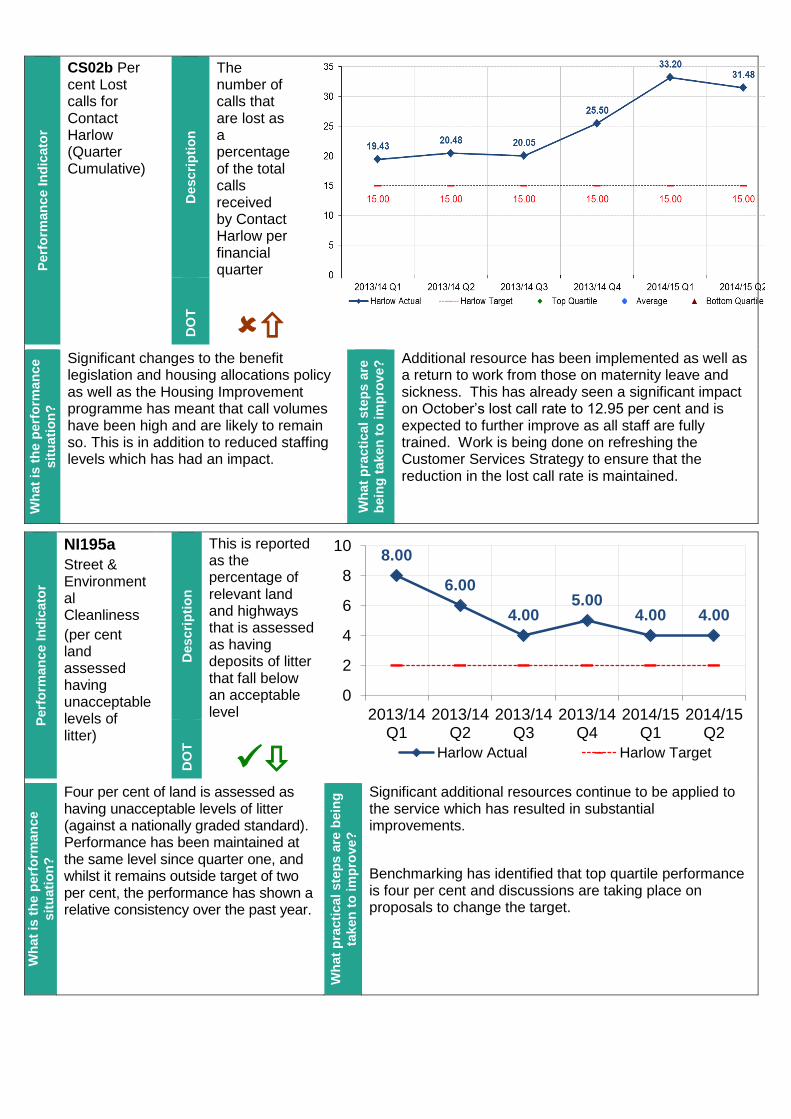
CS02b Per cent Lost calls for Contact Harlow (Quarter Cumulative)
Desc
rip
tio
n
The number of calls that are lost as a percentage of the total calls received by Contact Harlow per financial quarter
DO
T
Wh
at
is t
he
perf
orm
an
ce
sit
uati
on
?
Significant changes to the benefit legislation and housing allocations policy as well as the Housing Improvement programme has meant that call volumes have been high and are likely to remain so. This is in addition to reduced staffing levels which has had an impact.
Wh
at
pra
cti
ca
l ste
ps
are
bein
g t
aken
to
im
pro
ve?
Additional resource has been implemented as well as a return to work from those on maternity leave and sickness. This has already seen a significant impact on October’s lost call rate to 12.95 per cent and is expected to further improve as all staff are fully trained. Work is being done on refreshing the Customer Services Strategy to ensure that the reduction in the lost call rate is maintained.
Perf
orm
an
ce In
dic
ato
r
NI195a
Street & Environmental Cleanliness
(per cent land assessed having unacceptable levels of litter)
Desc
rip
tio
n
This is reported as the percentage of relevant land and highways that is assessed as having deposits of litter that fall below an acceptable level
DO
T
Wh
at
is t
he
perf
orm
an
ce
sit
uati
on
?
Four per cent of land is assessed as having unacceptable levels of litter (against a nationally graded standard). Performance has been maintained at the same level since quarter one, and whilst it remains outside target of two per cent, the performance has shown a relative consistency over the past year.
Wh
at
pra
cti
ca
l ste
ps
are
bein
g
taken
to
im
pro
ve?
Significant additional resources continue to be applied to the service which has resulted in substantial improvements.
Benchmarking has identified that top quartile performance is four per cent and discussions are taking place on proposals to change the target.
8.00
6.00
4.00 5.00
4.00 4.00
0
2
4
6
8
10
2013/14Q1
2013/14Q2
2013/14Q3
2013/14Q4
2014/15Q1
2014/15Q2
Harlow Actual Harlow Target
15
Perf
orm
an
ce In
dic
ato
r
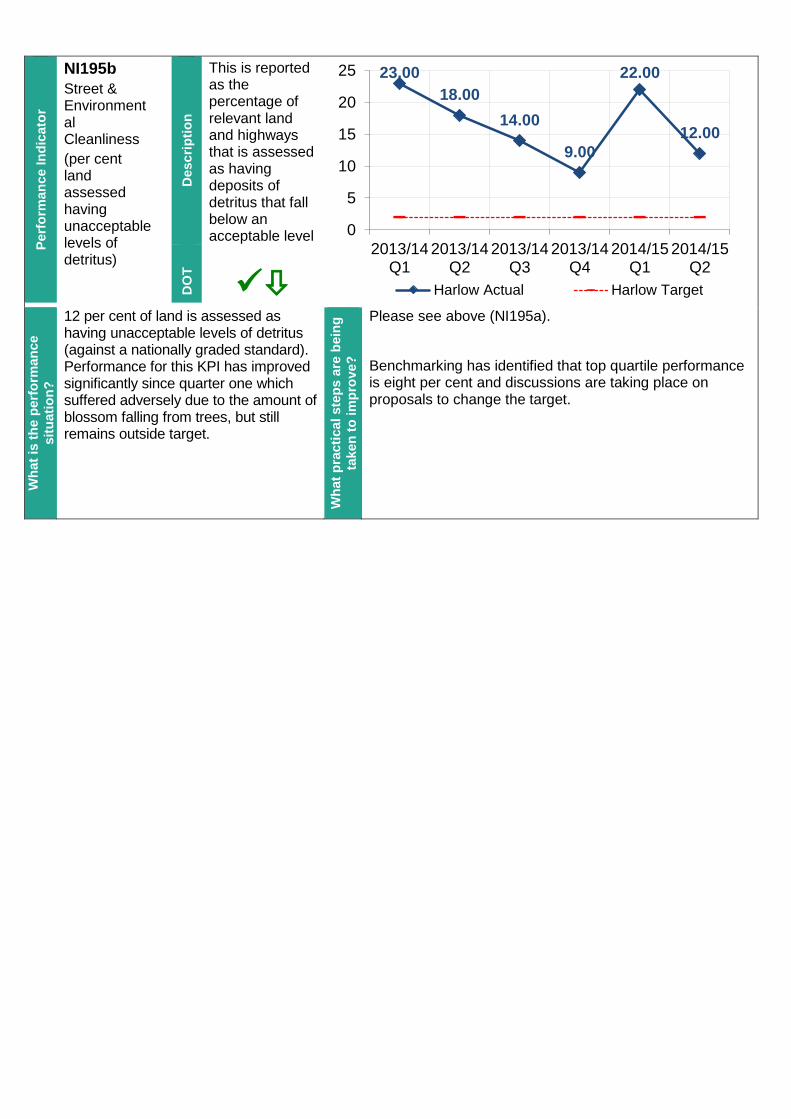
NI195b
Street & Environmental Cleanliness
(per cent land assessed having unacceptable levels of detritus)
Desc
rip
tio
n
This is reported as the percentage of relevant land and highways that is assessed as having deposits of detritus that fall below an acceptable level
DO
T
Wh
at
is t
he
perf
orm
an
ce
sit
uati
on
?
12 per cent of land is assessed as having unacceptable levels of detritus (against a nationally graded standard). Performance for this KPI has improved significantly since quarter one which suffered adversely due to the amount of blossom falling from trees, but still remains outside target.
Wh
at
pra
cti
ca
l ste
ps
are
bein
g
taken
to
im
pro
ve?
Please see above (NI195a).
Benchmarking has identified that top quartile performance is eight per cent and discussions are taking place on proposals to change the target.
23.00
18.00
14.00
9.00
22.00
12.00
0
5
10
15
20
25
2013/14Q1
2013/14Q2
2013/14Q3
2013/14Q4
2014/15Q1
2014/15Q2
Harlow Actual Harlow Target
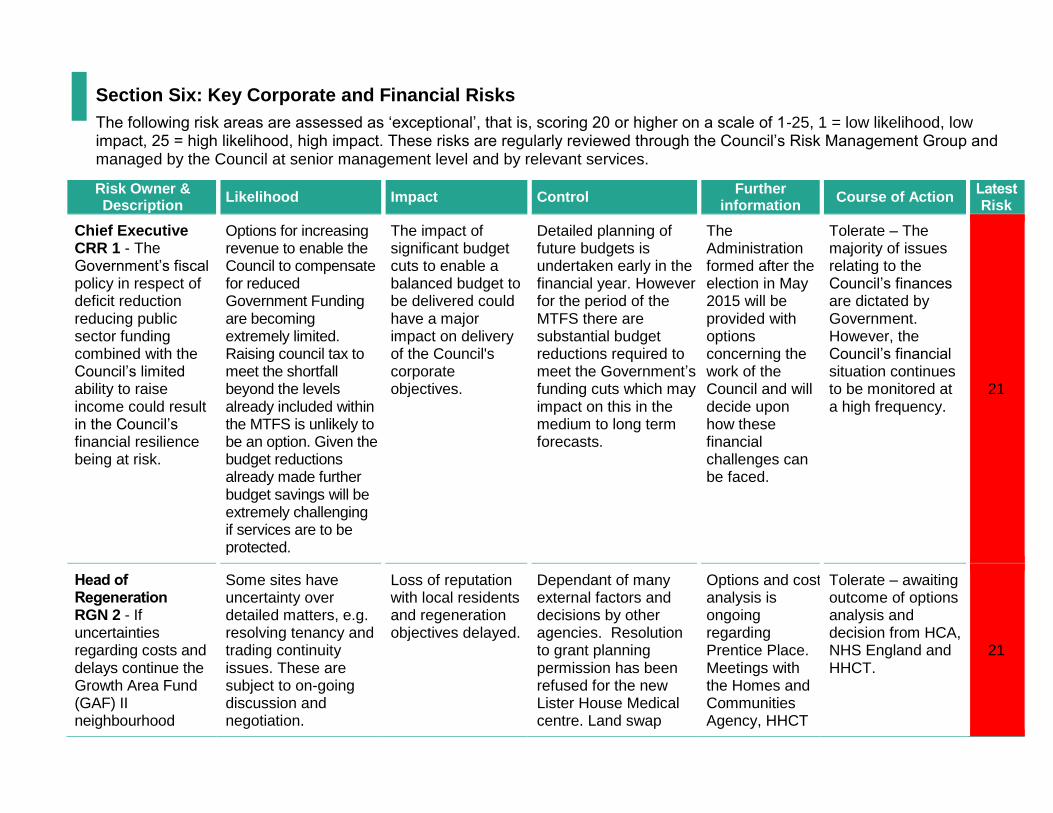
Section Six: Key Corporate and Financial Risks
The following risk areas are assessed as ‘exceptional’, that is, scoring 20 or higher on a scale of 1-25, 1 = low likelihood, low impact, 25 = high likelihood, high impact. These risks are regularly reviewed through the Council’s Risk Management Group and managed by the Council at senior management level and by relevant services.
Risk Owner & Description
Likelihood Impact Control Further
information Course of Action
Latest Risk
Chief Executive CRR 1 - The Government’s fiscal policy in respect of deficit reduction reducing public sector funding combined with the Council’s limited ability to raise income could result in the Council’s financial resilience being at risk.
Options for increasing revenue to enable the Council to compensate for reduced Government Funding are becoming extremely limited. Raising council tax to meet the shortfall beyond the levels already included within the MTFS is unlikely to be an option. Given the budget reductions already made further budget savings will be extremely challenging if services are to be protected.
The impact of significant budget cuts to enable a balanced budget to be delivered could have a major impact on delivery of the Council's corporate objectives.
Detailed planning of future budgets is undertaken early in the financial year. However, for the period of the MTFS there are substantial budget reductions required to meet the Government’s funding cuts which may impact on this in the medium to long term forecasts.
The Administration formed after the election in May 2015 will be provided with options concerning the work of the Council and will decide upon how these financial challenges can be faced.
Tolerate – The majority of issues relating to the Council’s finances are dictated by Government. However, the Council’s financial situation continues to be monitored at a high frequency.
21
Head of Regeneration RGN 2 - If uncertainties regarding costs and delays continue the Growth Area Fund (GAF) II neighbourhood
Some sites have uncertainty over detailed matters, e.g. resolving tenancy and trading continuity issues. These are subject to on-going discussion and negotiation.
Loss of reputation with local residents and regeneration objectives delayed.
Dependant of many external factors and decisions by other agencies. Resolution to grant planning permission has been refused for the new Lister House Medical centre. Land swap
Options and cost analysis is ongoing regarding Prentice Place. Meetings with the Homes and Communities Agency, HHCT
Tolerate – awaiting outcome of options analysis and decision from HCA, NHS England and HHCT.
21

Risk Owner & Description
Likelihood Impact Control Further
information Course of Action
Latest Risk
regeneration programme may not be completed across all four sites
matters are being discussed with a view to a successful resolution to enable to re-submission of the planning application.
and NHS England have been ongoing throughout 2014 with regards to Osler House and Lister House.
Head of Regeneration RGN6 - A lack of private sector investment and/or disinvestment by retailers and landowners in the Town Centre could lead to a further decline in its attractiveness as a shopping and leisure destination.
The macro economic impact on the retail sector is very uncertain.
Damaged reputation and perception towards the town. Potential loss of jobs and employment and potential failure to deliver regeneration.
The Council maintains frequent contact with the current landowners to encourage investment into the Town Centre. The Council will need to consider alternative options for the future of the Town Centre.
Feasibility report on commercially led analysis of market demand has been commissioned and work is now under way. Anticipate report back by in early 2015.
Tolerate – until such time as alternative options are considered by the Council and a way forward agreed.
21
Head of Regeneration RGN7 - If priority allocation and funding by the Highways Agency and Government is not achieved then the timely delivery of M11 Junction 7a will be put at risk.
Although junction 7a is high on the agenda for both SELEP and ECC, it has yet to be accorded required funding and/or recognition by the Government/ Highways agency.
Without the new junction the Highway Agency's cap on new jobs growth will not be lifted in the absence of alternative highways-improvements. The lack of a new junction is also known to be a
Continued lobbying of Government, SELEP, Highways Authorities and co-operation with relevant interests (e.g. West Essex Alliance, London-Stansted-Cambridge Corridor Consortium).
Essex County Council concluded a first public consultation on the proposals for Junction 7a in May 2014. ECC are re-consulting. The Council
Tolerate – This decision is now primarily with Government, SELEP and ECC and beyond the Council’s direct control.
21

Risk Owner & Description
Likelihood Impact Control Further
information Course of Action
Latest Risk
deterrent to the retention and expansion of current and new businesses. Housing growth will be constrained due to capacity of the current junction.
continues to lobby SELEP and Government to ensure Junction 7a remains a priority.
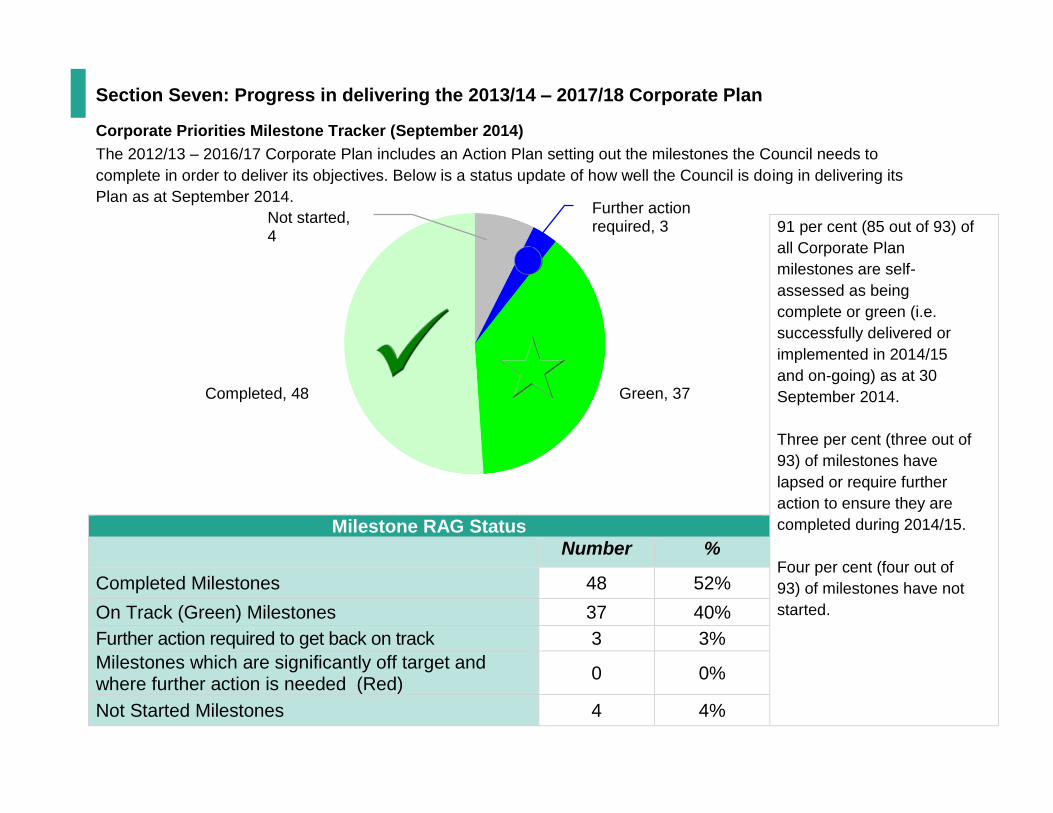
Section Seven: Progress in delivering the 2013/14 – 2017/18 Corporate Plan
Corporate Priorities Milestone Tracker (September 2014)
The 2012/13 – 2016/17 Corporate Plan includes an Action Plan setting out the milestones the Council needs to
complete in order to deliver its objectives. Below is a status update of how well the Council is doing in delivering its
Plan as at September 2014.
91 per cent (85 out of 93) of
all Corporate Plan
milestones are self-
assessed as being
complete or green (i.e.
successfully delivered or
implemented in 2014/15
and on-going) as at 30
September 2014.
Three per cent (three out of
93) of milestones have
lapsed or require further
action to ensure they are
completed during 2014/15.
Four per cent (four out of
93) of milestones have not
started.
Milestone RAG Status
Number %
Completed Milestones 48 52%
On Track (Green) Milestones 37 40%
Further action required to get back on track 3 3%
Milestones which are significantly off target and where further action is needed (Red)
0 0%
Not Started Milestones 4 4%
Completed, 48 Green, 37
Further action required, 3
Not started, 4
Milestones which are assessed as red or not started
The following milestones were due to be completed by September 2014 and are either ‘not started’ or ‘red’ (significantly off track).
# Objective Action Milestone Due Date
RAG Status
Comments
COM.6.1.3
Plan for the future of the Council's major environmental contracts and services
Determine the future of the waste and recycling contract
Evaluate costs and impact of re-tendering the contract
Sep 2014
Not Started
The Council is securing consultancy services to support an options appraisal.
COM.6.3.2
Plan for the future of the Council's major environmental contracts and services
Develop the Council's regulatory response to private sector housing issues
Establish the Inspection Programme
Aug 2014
Not Started
Cabinet have recently approved a licensing scheme effective from 01/04/15.
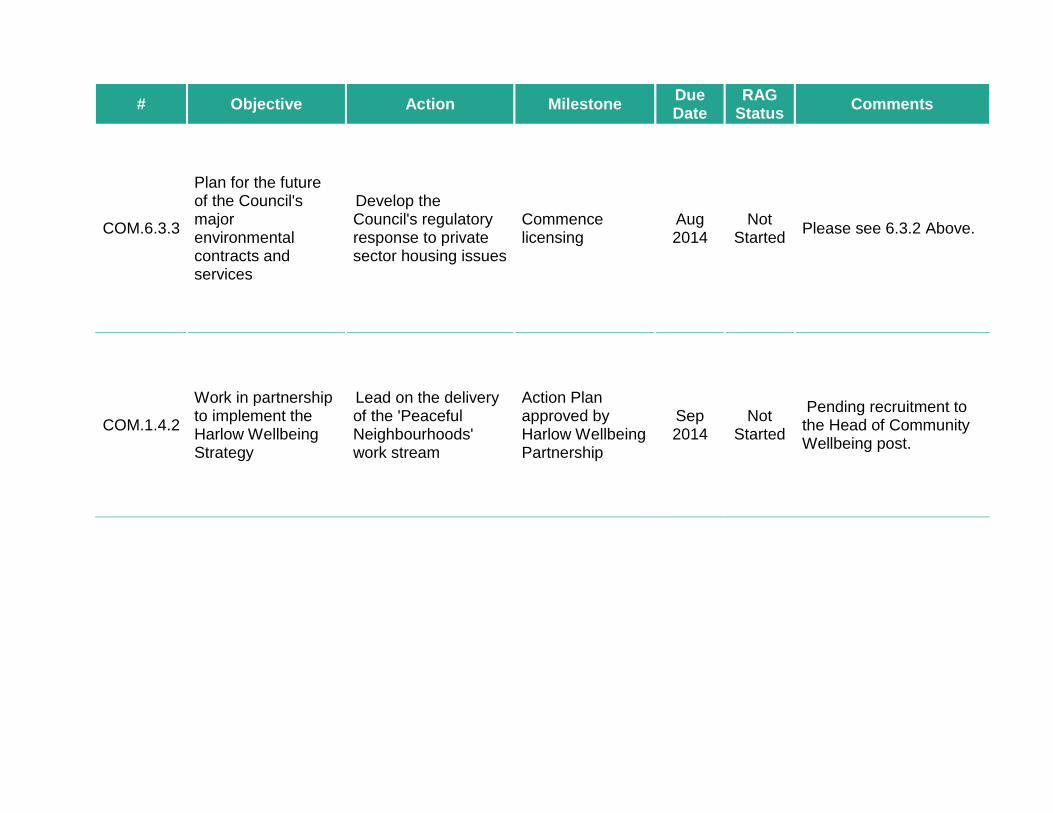
# Objective Action Milestone Due Date
RAG Status
Comments
COM.6.3.3
Plan for the future of the Council's major environmental contracts and services
Develop the Council's regulatory response to private sector housing issues
Commence licensing
Aug 2014
Not Started
Please see 6.3.2 Above.
COM.1.4.2
Work in partnership to implement the Harlow Wellbeing Strategy
Lead on the delivery of the 'Peaceful Neighbourhoods' work stream
Action Plan approved by Harlow Wellbeing Partnership
Sep 2014
Not Started
Pending recruitment to the Head of Community Wellbeing post.