hardware design for an electro-mechanical bicycle
TRANSCRIPT
The International Journal of Virtual Reality, 2018, 18(02): pp1-pp13 1
HardwareDesignforanElectro-MechanicalBicycleSimulatorinanImmersiveVirtualRealityEnvironment
JaeminPowell1, Oliver Stroh1, Geb W. Thomas1
1 Department of Mechanical & Industrial Engineering, University of Iowa, Iowa City, IA, USA
Abstract - Roughly 50,000 people are injured in bicycle collisions with motor vehicles each year. The Hank Bicycle Simulator provides a virtual environment to study and reduce this risk by safely investigating the interaction of bicycle riders and traffic, particularly for bicyclists crossing streets. The bicycle simulator design focuses on the bicycle and rider inertia, the predominant dynamic element for riders moving from a stopped position. The Hank Bicycle Simulator’s flywheel provides instantaneous inertial response while a servomotor provides simulated wind resistance to pedaling. This work describes the simulator design and a validation experiment that compares the simulator performance to theoretical predictions. The Hank Bicycle Simulator achieved initial acceleration with less than 0.20% error at realistic rider weights. The observed terminal velocity achieved less than 3.75%, with smaller errors for heavier riders. This allowed the rider to cross a street with about a 60 ms time difference between the simulator and a real-life rider. The Hank Bicycle Simulator was also validated through various physical experiments measuring the system inertia, the time delay of the electrical components, and overall system
performance. Such careful system validation for a mechanical feedback system is relatively rare in simulation research and is unique among previous reports of bicycle simulators.
Index Terms - Bicycle, psychometrics and testing, simulator validation, virtual environments
I. INTRODUCTION Of the 50,000 people injured in bicycle collisions with motor vehicles each year, approximately 6,000 involve children younger than 14. Fifty such collisions each year result in child fatalities (National Center for Statistics and Analysis, 2014). Virtual reality provides a unique opportunity to safely investigate the interaction between children and traffic. The Hank Bicycle Simulator has been instrumental in this type of investigation for over a decade and has provided unique insights into the perceptions and decision-making processes of both children and adults who encounter traffic on a bicycle (Grechkin et al., 2013; Plumert et al., 2004; Plumert et al., 2007). The Hank Bicycle Simulator includes an instrumented bicycle fixed at the center of three projection screens and a projection floor (Babu et al., 2009). The movement of the bicycle is synchronized with graphics so that the rider is presented with a three-dimensional view consistent with the experience of riding

The International Journal of Virtual Reality, 2018, 18(02): pp1-pp13 2
through a town or countryside. A motor connected through the bicycle’s drivetrain provides resistance to pedaling consistent with the resistance perceived during normal bicycling.
Figure 1.Hank Bicycle Simulator fixed at the center of the virtual reality environment. Several bicycle simulators have been designed, primarily for exercise purposes. The KAIST simulator (Kwon et al., 2001; Kwon et al., 2002) completely immerses a rider in a bicycle race with other riders on similar bicycles and features one of the more sophisticated control systems. The bicycle is mounted on a six-degree-of-freedom Stewart platform, with motions emphasizing the vertical movement (heave), side-to-side (roll), and front-to-rear (pitch) movements. A magneto-rheological fluid brake provides pedal resistance while an AC servomotor simulates acceleration due to gravity as the rider goes down a slope. The rider wears a head-mounted display and graphics are synchronized with a second bicycle over a network. Tang et al. (2007) designed a simulator to enable riders to exercise in a confined space. Their bicycle rests on a platform with spring supports on the bottom, permitting riders to slightly tilt as they pedal and turn. A damper is attached to the rear wheel to provide resistance from wind and road friction. An AC servomotor produces decelerating or accelerating torque based on the slope of the rider’s environment. Kikuchi et al. (2012) designed their simulator to provide people with cognitive and physical impairments an opportunity for safe exercise
without the need to worry about other riders or traffic. Pedaling resistance is provided from a custom-designed magneto-rheological fluid brake. The magneto-rheological fluid brake was equipped with an enhanced braking torque by increasing the magnetic field’s distribution along the area of the cylindrical surface. This design enhancement enables the movements of the bicycle to be restricted using a single movement system, rather than the two different systems used in most other simulators. The Kikuchi et al. study (2012) reported the pedaling torques of riders traveling virtually on different slopes but does not compare this to a predicated bicycle response or to real-world data. Several other bicycle simulators have been designed primarily for research and education. Miyanoue et al. (2015) designed a bicycle simulator for traffic safety education and safety analysis of a wide variety of traffic situations. The rear wheel stand enables the rider to lean slightly to either side but does not provide the natural lean a rider feels while turning. Another simulator designed by He et al. (2005) features a complex, bicycle dynamics model. The model has two sub-models: the stability sub-model, and the vibration sub-model. The stability sub-model solves equations for the rider’s current bicycle movement. The vibration sub-model solves equations for the vibrations that result from the bicycle’s current surface. The researchers validated their mathematical sub-models by comparing data of the calculated steering and tilt angle to the measured values. They put forward methods to evaluate the pedal torque, however, they never provided any information on the resistances the specific rider must overcome to move the bicycle in the forward direction. Consequentially, the resistances applied to the rider in their bicycle simulator is not scientifically validated. Typically, bicycle simulators focus on steady-state riding instead of starting and stopping situations. The psychological experiments conducted with the Hank Bicycle Simulator focus on street-crossing

The International Journal of Virtual Reality, 2018, 18(02): pp1-pp13 3
scenarios from a stopped position, where participants must avoid traffic. Consequently, our bicycle design is focused on the dynamics of the bicycle starting from a stopped position, as the time it takes to cross the street depends on accurately modeling the bicycle’s acceleration. These dynamics are heavily dependent on the rider’s inertia because of the slower starting speeds, and as such, our simulation is particularly focused on this aspect. Also, because of the role of the bicycle in formal psychological experiments, we seek to publish the details of the simulator’s behavior and describe how the performance was validated. That way, other researchers can consider how these details might affect the results of the psychological tests and ultimately improve on our results. To our knowledge, no scientific team has attempted to statistically validate or analyze the performance of their bicycle simulator against their theoretical model, nor have they postulated how the details of their implementation may affect the scientific conclusions reached with their simulator. In this work, we first describe the physical model we use for the bicycle. We then describe the simulator’s construction and the two experiments we conducted to measure the time delay of the bicycle’s response. Finally, we test the response of the simulator to a constant torque input. II. BACKGROUND 2.1 The Physical Model of the Bicycle The time it takes a rider to directly cross a street from a stopped position is almost entirely a function of the energy the rider puts into the pedals and the resistance to rotation provided from the pedals. At low velocities, nearly all of the pedal resistance is related to the effects of inertia, which is mostly a function of the weight of the rider and the bicycle. At higher velocities, wind resistance increases and becomes a larger impediment to further acceleration than the effects of inertia. Since the rider’s expectation of how
long it will take to cross a street in the virtual world is presumably based on their past experience in the real world, it is important to create a system that accurately reproduces the effects of inertia and wind resistance so that the relationship between the rider’s exerted energy and the time it takes to cross the street matches their past experiences in the real world.
A bicycle transfers torque from the pedal rotation into a propulsive force, 𝐹" in Newtons (N), acting between the rear wheel and the ground. This propulsive force accelerates the rider and bike’s inertia when it overcomes the drag, 𝐹# , the slope resistance, 𝐹$, the rolling resistance, 𝐹% , the bump resistance, 𝐹& , and the mechanical inefficiencies, 𝐹' (Wilson, 2005).
The acceleration force, 𝐹()) , of the total bicycle system can then be described as:
𝐹" − 𝐹# + 𝐹$ + 𝐹% + 𝐹& + 𝐹' = 𝐹()) =𝑀𝑎 (2.1)
where 𝑀 is the combined mass of the bicycle and rider in kilograms (kg), and 𝑎 , is the acceleration of the bicycle in meters per second squared (m/s2).
In this study, the potential effects of slope and bump resistance are ignored because of the assumption that the rider will have a flat, smooth surface as he or she crosses the street. 𝐹% is a fraction of a percent of the total system weight due to the rolling resistance coefficient, which can be anywhere from 0.002% to 0.008% (Wilson, 2005). Since 𝐹% is such a small value of the rest of the system, it is considered to be negligible in our calculations.
The mechanical efficiency,𝐹', is the ratio of the output power compared to the input power. There can be as low as a 1% loss of energy to as high as a 20% loss of energy in the bicycle system (Kyle & Berto, 2001). This force will be considered in the calculations, though the rider will naturally compensate to the inefficiencies similar to the real-life experience of pedaling a bicycle. The efficiency of the simulator should be similar to that of a regular bicycle.

The International Journal of Virtual Reality, 2018, 18(02): pp1-pp13 4
Given these parameters, Equation (2.1) is simplified to:
𝐹" − 𝐹# + 𝐹' = 𝐹()) = 𝑀𝑎 (2.2)
The inertial force depends mostly on the mass of the rider and the bicycle,𝑀, although the rotational inertia of the rotating components on the bike are also important factors. Since the theater of our simulation presumes that the rider is using an unfamiliar bicycle, it seems reasonable to assume that so long as the bicycle parameters are within the range of similarly sized commercial bicycles, the validity of this will be dominated by the mass of the rider and bicycle.
The force of wind drag, 𝐹#, is a function of the square of the velocity:
𝐹# = 𝐷𝑥2 (2.3)
where 𝐷 is the air drag constant in kg/m, and 𝑥 is the velocity in m/s, in terms of position. The drag constant is described as follows:
𝐷 = 32𝜌𝐶6A (2.4)
where 𝜌 is the air density in kg/m3, 𝐶6 is the drag coefficient (unitless), and A is the area of the rider in m2. Our simulator treats each of these variables as constants, adjusting the area of the rider with the size of the bicycle.
For simplicity, we will combine the terms, 𝐹" and 𝐹' into the constant propulsive force variable, 𝑃. Accounting for drag and inertia results in the following second order, partial differential equation:
𝑃 = 𝐷𝑥2 + 𝑀𝑥 (2.5)
where 𝑥 is the acceleration, in terms of position.
Solving Equation (2.5) for 𝑥 𝑡 gives the position of the rider, 𝑥, at time 𝑡:
𝑥 𝑡 = 𝐶2 + ('#𝑙𝑛 cosh #" AB'CD
')
(2.6)
where 𝐶3 and 𝐶2 are constants. Assuming the bicycle initially starts from a resting point, we can apply those boundary conditions of 𝑥 0 = 0 and 𝑥 0 = 0 . From those boundary conditions, we produce the values
of the constants to be 𝐶3 = 𝐶2 = 0 . This produces the fundamental equation of our bicycle traveling in a straight line under a constant propulsive force, P:
𝑥 𝑡 = '#𝑙𝑛(cosh #"
'𝑡 ) (2.7)
The derivative of this equation describes the velocity of the bicycle as a function of time:
𝑥 𝑡 = "#tanh( #"
'𝑡) (2.8)
Figure 2 illustrates the velocity curve described by Equation (2.8).
Figure 2: Graphical representation of Equation (2.8) with an asymptote at 𝑃/𝐷 and a starting acceleration at 𝑃/𝑀.
Equation (2.8) converges to 𝑃/𝐷 , which is the terminal velocity of the bicycle. At 𝑡 = 0, the slope of the line is:
"#
#"'
= "'
(2.9)
Thus, if our simulator is driven by a constant torque, we expect the initial acceleration to be described by Equation (2.9) and the terminal velocity to be described by Equation (2.8). 2.2 Specific Aims Because of our interest in bicyclists avoiding traffic when crossing a street from a complete stop, two important variables are: 1) the time delay between the rider input and the movement of the virtual environment; and 2) the inertial response of the bicycle to the rider’s input. These are important elements of the control system design. The specific aims of this study are the following:

The International Journal of Virtual Reality, 2018, 18(02): pp1-pp13 5
1. To measure the time delay from when the user turns the handlebars to the response of the virtual reality environment.
2. To analyze the time it takes the bicycle to reach terminal velocity given a constant input torque.
If testing indicates that the system has a short lag time with the visual system and accelerates appropriately for input torques of the expected range, the bicycle will possess the dymanics suitable for this virtual reality environment. III. SYSTEM DESIGN 3.1 Selection of the Bicycles Because the system was to be used by both children and adults, we expected that it should be capable of accommodatingseveral bicycle sizes. The design parameters for the bicycles were that they should: 1. fit a rider’s weight up to 220 lb.; 2. fit riders from age 6 and up; 3. fit a rider’s height up to 6 ft.; 4. have comfortable seats; 5. have cruiser style handlebars; 6. have a chain guard; 7. have no gears; and, 8. be a step through bicycle. Using standard growth charts, we determined that we would need three bicycles of different sizes to cover our intended age and size ranges, as measured by their tire diameter: a 20-inch, 24-inch, and 26-inch wheel. The 20-in. bicycle would only accommodate 84% of 6-year olds, but implementing a smaller bike was determined by the researchers to be too costly. The 26-in. bicycle would accommodate up to the 25th percentile of 20-year old males, and the 90th to 95th percentile of 20-year old females. Again, the researchers felt that because the studies typically focused on children, this upper range was sufficient. 3.2 Designing the Flywheel The goal of the design is to accurately simulate a street crossing, or to accurately
reproduce the rider’s position in time, given the rider’s mass and torque input. The flywheel simulates the inertia of the bicycle and the rider, and the motor simulates resistance from wind drag.
Neglecting the rotational inertia of the bicycle wheels, the linear kinetic energy, in joules (J), of a bicycle and the rider is:
𝐾𝐸MN6OM =32𝑀𝜗2 (3.1)
where 𝑀 is the combined mass of the bicycle and the rider, and 𝜗 is the velocity of the bicycle. The rotational kinetic energy of the inertial system is:
𝐾𝐸QRSTUOOR =32𝐼𝜔2 (3.2)
where 𝜔 is the angular velocity of the flywheel in radians per second (rad/s), and 𝐼 is the moment of inertia in kg(m2). Equating Equation (3.1) and Equation (3.2) gives: 32𝐼𝜔2 = 3
2𝑀𝜗2 (3.3)
Solving for 𝑀 produces:
𝑀 = XYZ
[Z (3.4)
Thus, with an appropriate gear system matched with a flywheel with appropriate inertia, the gears may be adjusted to simulate a large range of rider masses. In our case, we designed a cylindrical flywheel with a thickness of 0.709 in. and radius of 6.339 in. The inertia of this flywheel is 0.152 kg(m2). We coupled this with an 11-speed, internally geared hub (Alfine Internal Geared Hub for Disc Brake Use, Shimano, Irvine, CA) that could shift between gear ratios from 0.527 to 2.153. When combined with the other fixed gears in the drivetrain, the overall gear ratio ranged from 2.306 to 9.419. With this design, the Hank Simulator can accommodate riders as small as 10 lbs. on the small bicycle, using gear 1 of the internally geared hub, and riders as large as 253 lbs. on the large bicycle, using gear 11 on the internally geared hub. Figure 3 presents an image of the flywheel and its gear train, without its protective box.

The International Journal of Virtual Reality, 2018, 18(02): pp1-pp13 6
Figure 3: The initial virtual design of the hardware in the Hank Simulator. The internally geared hub includes a freewheel that prevents the inertia of the flywheel from being transferred to the rider’s shins, in the case of coasting, when the velocity of the bicycle goes slower than the flywheel. A motor connected to the flywheel simulates the velocity-dependent air drag. 3.3 Simulating the Air Drag A motor (AKM53K-BKCNC-00, Kollmorgen, Radford, VA) and motor controller (AKD-P01206-NBAN-0000, Kollmorgen, Radford, VA) resist the flywheel rotation to simulate wind resistance as described in Equation (2.3). The bicycle velocity is measured from the motor output, factoring for the gear ratio between the motor to the rear wheel. The drag is based on the following assumptions: (a) air density, ρ, is 1.184 kg/m3, (b) the area facing the wind, A, is 0.4 for the 20-inch bicycle, 0.5 for the 24-inch bicycle, and 0.6 for the 26-inch bicycle, and (c) the drag coefficient, CD, is 1.1 for each bicycle (Gross, et al.). A microcontroller (Uno, Arduino, Ivrea, Italy) receives the velocity signal from the motor controller, interprets the velocity, and calculates the corresponding air drag, 𝐹6 , according to the equation: 𝐹6 =
32𝜌𝐶#𝐴𝜗2 (3.5)
The microcontroller then sends a new torque command to the motor as an analog voltage input.
The flywheel, motor, and internally geared hub are housed in a case made of ¼ in. ABS plastic supported by an extruded aluminum frame.
Figure 4: The flywheel and the internally geared hub connected by chain in the inertial system before the painting of the steel components. The case helps to dampen the gear train noise from the system and protect experiment participants from the moving parts. The entire assembly is mounted on three parallel T-slot tracks screwed into a 24 x 96 in., 1 in. thick white melamine board. This arrangement allows the chain tension to be adjusted between the inertial system and the rear wheel of the bicycle, held in place by a commercial stand (Rock-the-Bike, Oakland, CA), which is also fixed to the melamine board. A flip-flop hub (Surly Track Cog 1/8'' X 20t, Bloomington, MN) on the rear wheel connects the rear wheel to the internally geared hub on one side and to the bicycle pedals on the other. A custom stand was designed to support the front bicycle wheel about an inch off the
Back Motor
Flywheel
Internally Geared
Hub

The International Journal of Virtual Reality, 2018, 18(02): pp1-pp13 7
surface of the melamine board.
Figure 5: The downtube stand that sustained the front of the bicycle above the ground. A potentiometer measures the front steering angle, and a hub motor slaved to the velocity of the back wheel drives the front wheel motion. A wheel stabilizer (VO Wheel Stabilizer, Velo Orange, Annapolis, MD) provides a force to restore the return of the front fork to the straight-ahead position. A small voltage divider built into the cable connector of each bicycle indicates the bicycle size to the microcontroller. Figure 6 illustrates the connections between the microcontroller, the front hub motor controller, the back motor controller, the steering potentiometer, and the potentiometer that indicates the current gear ratio. The microcontroller sends velocity and steering angle updates to the virtual environment computer over a USB connection. Full
system details are available in (Powell, 2017). IV. EXPERIMENT I: TIME DELAY System lag, the time between when a user acts and the system responds, is very important in an immersive virtual environment because lags of more than approximately 100 ms have been identified as a factor contributing to motion sickness. The overall system lag includes the time to send the signals from the bicycle hardware to the computer rendering the graphics plus the time to actually render and display the graphics. The following experiment measures only the time to send the signal to the computer. 4.1 Methods When displaying the microcontroller output directly on a text terminal, it appears that the microcontroller produces a new output every 21 ms. That estimate includes the time to transmit the serial information to the text terminal, however, the lag between the microcontroller and the rendering computer may be more accurately estimated by writing a simple program on that computer to echo messages from the microcontroller back to the microcontroller and using the echoed signal to toggle the output voltage on one of the microcontroller’s pins. This approach avoids the time-consuming process of writing to a monitor. The handlebar movement
Flywheel Box
Micro-controller
Steering Angle & Bicycle Size
Front Hub Motor Velocity
Motor Velocity& Gear Ratio
Air Drag Torque
Virtual Environment
Computer
Bicycle Velocity & Steering Angle
Figure 6: Diagram of the microcontroller functions throughout the Hank Simulator.

The International Journal of Virtual Reality, 2018, 18(02): pp1-pp13 8
provided an appropriate input signal. We programmed the microcontroller to toggle one output pin between 0 and 5V whenever the handlebars were turned past the zero-degree position. It also sent a single character “H” or “L” to the rendering computer over the USB connection. Python code on the rendering computer echoed the signal back to the microcontroller, which then toggled a second output pin between 0 and 5V. An oscilloscope connected to the two output pins could then measure the time interval between the two signals. Figure 7 shows a diagram of the set-up of the delay experiment.
4.2 Results The oscilloscope indicated that the time between the handlebar movement through the zero-degree position and the echo from the rendering computer was 40 ms. This is the round-trip time, so the lag to the rendering computer is half of that, or 20 ms. 4.3 Discussion & Conclusion The microcontroller appears to loop through its code every 21 ms and another 20 ms is required to send the signal to the rendering computer. The difference between the moment at which the microcontroller samples the handlebar signal and the moment when that processed signal begins its trip to the rendering computer is some fraction of the loop time. In this experiment, the output
pin designating the initiation of the signal was set right after the signal was sampled, so only a few microcontroller clock ticks expired between the sampling time and the changing of the pin value. Thus, the round-trip estimate is likely to be an accurate measure of the whole lag, and it is not necessary to add the loop time plus half the round-trip time to estimate the lag. The net lag between the user’s movement of the handlebars and the arrival of the signal at the rendering computer is just 20 ms. V. EXPERIMENT II: SUMMATIVE
SYSTEM PERFORMANCE The second experiment measured whether the inertia system and the motor modeling
wind resistance provided the expected feedback. A second motor (AKM53K-BKCNC-00, Kollmorgen) controlled by its own motor controller (AKD-P01206-NBAN-0000, Kollmorgen, Radford, VA), referred to as the input motor, replaced the pedals in order to provide a consistent torque. We expected that the system would respond as predicted by the solution to the differential equation presented in Equation (2.8). 5.1 Methods & Results Three constant torques spaced 0.157 Nm apart were applied to gears 1, 3, and 5. As the system accelerated towards the terminal velocity associated with each torque input, the microcontroller reported the time and velocity of the rear wheel.
Micro-controller
Virtual Environment
Computer
Oscilloscope
L/H
0V/5V
0V/5V
5V
0V
SquareWave
Time
Figure 7: Diagram of the time delay experiment.

The International Journal of Virtual Reality, 2018, 18(02): pp1-pp13 9
Figures 8, 9 and 10 display the velocity and time reported by the microcontroller for each of the three gears and three constant input torques. The corresponding theoretical curves are provided for each condition.
Figure 8: Plot of the system velocity under three torques applied in gear 1.
Figure 9: Plot of the system velocity under three torques applied in gear 3.
Figure 10: Plot of the system velocity under three torques applied in gear 5.
Table 1 presents the input torque, the initial acceleration, and the terminal velocity, both experimentally and theoretically predicted, for each of the three gears.
Table 1: Theoretical and actual initial acceleration and terminal velocity for a constant input torque in several gears.
The estimates of the initial acceleration were derived from a nonlinear fit model using the following equation:
𝑎(𝑇𝑎𝑛ℎ 𝑏𝑡 ) (4.6)
This equation describes the velocity of the Hank Simulator at a given time, 𝑡 . The derivative of the nonlinear fit model is the acceleration of the Hank Simulator at any point in time. The initial acceleration is the acceleration of the simulator at 𝑡 = 0, which simplifies the initial acceleration results to be 𝑎𝑏. 5.2 Discussion & Conclusion The initial accelerations across the three gears was better than 2%, and much better than 1% for most cases that would be encountered for heavier riders. The terminal velocities were better than 5.5%, again most accurate for heavier riders. Given the mechanical and electrical complexity of the system, this is quite good and most likely sufficient for the application scenario. VI. GENERAL DISCUSSION The purpose of the Hank Simulator is to observe the behavior of children and adults riding across a street on a bicycle, with particular emphasis on how participants judge the gaps between passing cars when choosing their moment to cross. Participants’ decisions are likely to be dominated by their estimates of how long it will take to cross the street. This estimate is likely to be a function of their past experience with bicycles, an experience dominated by the challenge of physically overcoming the mechanical inertia of the system.
10 20 30 40 50 60Time (s)
1
2
3
4
5
Velocity (m/s)Lowest Torque Condition
10 20 30 40 50 60Time (s)
1
2
3
4
5
6Velocity (m/s)
Middle Torque Condition
10 20 30 40 50 60Time (s)
1
2
3
4
5
6Velocity (m/s)
Highest Torque Condition
Gear Torque Initial Acceleration (m/s2) Terminal Velocity (m/s)
Theoretical Measured Error (%) Theoretical Measured Error
(%)
1 1.717 0.54 0.57 0.62% 4.16 4.26 2.38% 1.870 0.59 0.65 1.24% 4.34 4.54 4.47% 2.028 0.65 0.73 1.94% 4.52 4.77 5.46%
3 2.315 0.37 0.37 0.07% 4.83 4.83 0.08% 2.471 0.40 0.40 0.02% 4.99 5.10 2.26% 2.629 0.42 0.43 0.20% 5.15 5.34 3.73%
5 2.920 0.29 0.30 0.20% 5.42 5.43 0.07% 3.077 0.31 0.31 0.05% 5.57 5.72 2.71% 3.234 0.32 0.33 0.10% 5.71 5.92 3.70%
The International Journal of Virtual Reality, 2018, 18(02): pp1-pp13 10
Thus, the most important factor in the Hank Simulator is the simulation of the inertial force. As seen in the second experiment, the flywheel produces the expected kinetic energy. The error on the starting acceleration is 0.20% or less for gears 3 and 5, the gears
that are most frequently used in normal simulator operation. The air drag produced by the back motor ultimately determines the terminal velocity for a constant input pedaling force. The terminal velocity will rarely be a practical factor in the Hank Simulator experiments because the riders typically cross the street or ride for short distances. Nevertheless, the second experiment suggests that the system’s terminal velocity, and by extension its representation of the wind drag, were quite favorable. For gears 3 and 5 the error was 3.73% or less; the rider’s terminal velocity was only about 0.20 m/s faster than the predicted terminal velocity. In the best case, the error was only 0.07%, less than 0.01 m/s faster than the predicted value.
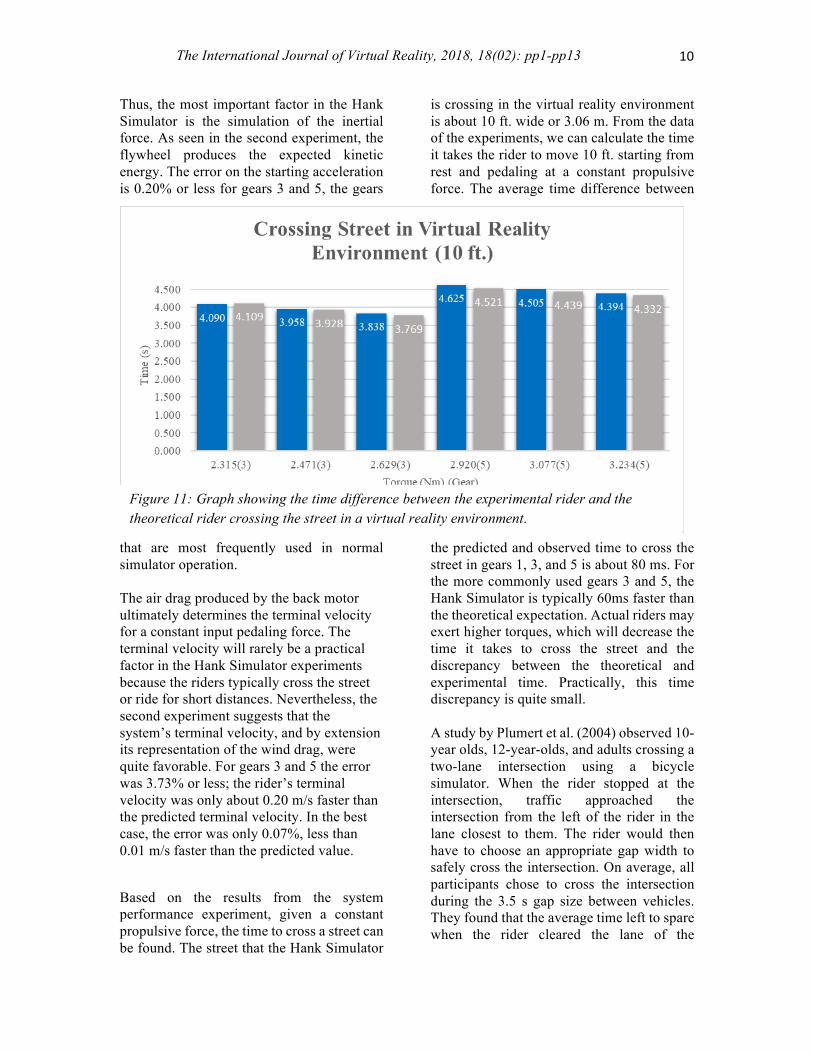
Based on the results from the system performance experiment, given a constant propulsive force, the time to cross a street can be found. The street that the Hank Simulator
is crossing in the virtual reality environment is about 10 ft. wide or 3.06 m. From the data of the experiments, we can calculate the time it takes the rider to move 10 ft. starting from rest and pedaling at a constant propulsive force. The average time difference between
the predicted and observed time to cross the street in gears 1, 3, and 5 is about 80 ms. For the more commonly used gears 3 and 5, the Hank Simulator is typically 60ms faster than the theoretical expectation. Actual riders may exert higher torques, which will decrease the time it takes to cross the street and the discrepancy between the theoretical and experimental time. Practically, this time discrepancy is quite small. A study by Plumert et al. (2004) observed 10-year olds, 12-year-olds, and adults crossing a two-lane intersection using a bicycle simulator. When the rider stopped at the intersection, traffic approached the intersection from the left of the rider in the lane closest to them. The rider would then have to choose an appropriate gap width to safely cross the intersection. On average, all participants chose to cross the intersection during the 3.5 s gap size between vehicles. They found that the average time left to spare when the rider cleared the lane of the
Figure 11: Graph showing the time difference between the experimental rider and the theoretical rider crossing the street in a virtual reality environment.

The International Journal of Virtual Reality, 2018, 18(02): pp1-pp13 11
approaching vehicle decreased with the younger riders. The average time left was 1.13 s for the 10-year-old riders, 1.49 s for 12-year-old riders, and 1.98 s for the adult riders. The 60 ms time difference between the predicted and observed times will have little to no effect on the performance of the riders in the Hank Simulator. The riders will typically be around 60 ms ahead of where they may predict, however, that 60 ms results in a displacement difference of only a few inches. For example, in the worst-case scenario in which there is a difference of 104 ms, if we assume a constant propulsive force of 2.920 Nm in gear 5, this will result in an observed displacement of about five inches ahead of the predicted displacement. VII. CONCLUSIONS The next step for the Hank Simulator is to compare the behavior of riders in the simulator with a real bicycle in a physical environment. Of particular interest would be the observation of force patterns exerted by a rider in a natural environment and the bicycle motion, which could then be compared to their behavior and the bicycle response in the simulator. Differences in simulator response and bicycle motion would then drive further refinements, with an eye on the net time differences these refinements might create in the street-crossing scenario. The mechanical simulation of inertia in the Hank Simulator provides an accurate and immediate reproduction of the expected inertia. How this compares with other simulators, particularly those relying on electrical motors and magneto-rheological fluid brakes is unclear, as previous studies have not provided enough performance detail to be able to make a valid comparison. We hope that the current study will encourage future researchers to report the details of their underlying models and their system performance, particularly those with ties to the physical parameters of the simulation they wish to reproduce, so that the community may move forward together, taking the best elements of each system.
ACKNOWLEDGMENTS The authors would like to acknowledge Clayton Mills for his help with the mechanical design and manufacture. We would also like to acknowledge Gray Thomas for his initial inspiration of the mechanical flywheel design. Finally, we would like to thank Andres Alfaro for his work in revising and preparing the manuscript for publication.
VIII. REFERENCES [1] Babu, S., Grechkin, T., Chihak, B.,
Ziemer, C., Kearney, J., Cremer, J., & Plumert, J. (2009, March). A virtual peer for investigating social influences on children's bicycling. In Virtual Reality Conference, 2009. VR 2009. IEEE (pp. 91-98). IEEE.
[2] Grechkin, T. Y., Chihak, B. J., Cremer, J. F., Kearney, J. K., & Plumert, J. M. (2013). Perceiving and acting on complex affordances: How children and adults bicycle across two lanes of opposing traffic. Journal of experimental psychology: human perception and performance, 39(1), 23.
[3] Gross, A., Kyle, C.R., & Malewicki, D. (n.d.). “Human powered vehicle performance” [Digital image]. Retrieved from http://2.bp.blogspot.com/-6rUkPBorBnY/UKGkyUzCMII/AAAAAAAABVA/3KflV7aANbg/s1600/Human Powered Vehicle Data.jpg
[4] He, Q., Fan, X., & Ma, D. (2005). Full bicycle dynamic model for interactive bicycle simulator. Journal of Computing and Information Science in Engineering, 5(4), 373-380.
[5] Kikuchi, T., Kobayashi, K., & Sugiyama, M. (2012, December). Development of virtual reality bike with cylindrical MR fluid brake. In Robotics and Biomimetics (ROBIO), 2012 IEEE

The International Journal of Virtual Reality, 2018, 18(02): pp1-pp13 12
International Conference on (pp. 1753-1758). IEEE.
[6] Kwon, D. S., Yang, G. H., Lee, C. W., Shin, J. C., Park, Y., Jung, B., ... & Wohn, K. Y. (2001). KAIST interactive bicycle simulator. In Robotics and Automation, 2001. Proceedings 2001 ICRA. IEEE International Conference on (Vol. 3, pp. 2313-2318). IEEE.
[7] Kwon, D. S., Yang, G. H., Park, Y., Kim, S., Lee, C. W., Shin, J. C., ... & Lee, D. Y. (2002). KAIST interactive bicycle racing simulator: the 2nd version with advanced features. In Intelligent Robots and Systems, 2002. IEEE/RSJ International Conference on (Vol. 3, pp. 2961-2966). IEEE.
[8] Kyle C.R. & Berto, F. (2001). “The mechanical efficiency of bicycle derailleur and hub-gear transmissions,” Human Power, no. 52, Summer 2001, pp. 3-15, 2001. Retrieved from http://www1.bhpc.org.uk/Data/Sites/1/Uploads/humanpower/PDF/hp52-2001.pdf
[9] Miyanoue, K., Suzuki, M., Takagawa, T., Hosoya, K., & Yai, T. (2015). Passing behavior and simulator validation analysis on two-way cycle track with cycling simulator “MORICS.” Journal of Japan Society of Civil Engineers, Ser. D3 (Infrastructure Planning and Management), 71.
[10] National Center for Statistics and Analysis. “Bicyclists and other cyclists: 2014 data.” (Traffic Safety Facts. Report No. DOT HS 812 282). Washington, DC: National Highway Traffic Safety Administration, 2016.
[11] Plumert, J. M., Kearney, J. K., & Cremer, J. F. (2004). Children's perception of gap affordances: bicycling across traffic- filled intersections in an immersive virtual environment. Child development, 75(4), 1243-1253.
[12] Plumert, J. M., Kearney, J. K., & Cremer, J. F. (2007). Children's road crossing: a window into perceptual–motor development. Current Directions in Psychological Science, 16(5), 255-258.
[13] Powell, J. “Hardware design for an electro-mechanical bicycle simulator in an immersive virtual reality environment,” M.S. thesis, Dept. Mech. & Ind. Eng., The University of Iowa, Iowa City, Iowa, 2017.
[14] Tang, Y. M., Tsoi, M. H. C., Fong, D. T. P., Lui, P. P. Y., Hui, K. C., & Chan, K. M. (2007, June). The development of a virtual cycling simulator. In International Conference on Technologies for E-Learning and Digital Entertainment (pp. 162-170). Springer, Berlin, Heidelberg.
[15] Wilson, D. “Power and speed,” in Bicycling science, pp. 123-172, Cambridge, MA: MIT Press, 2005.

The International Journal of Virtual Reality, 2018, 18(02): pp1-pp13 13
Jaemin C. Powell received his M.S. in Industrial Engineering from the University of Iowa in 2017. In graduate school, his research interests included virtual reality and electro-mechanical systems. He is currently a Systems Engineer at Rockwell Collins where he works with GPS receivers.
Oliver Stroh is currently a graduate researcher in the Department of Mechanical & Industrial Engineering at the Univeristy of Iowa. He received his B.Sc. in Industrial Engineering at the University of Iowa in 2017. His current research interests include virtual reality and position estimation.
Geb W. Thomas received a B.S. degree in Physics from the State University of New York at Stony Brook in 1991 and a Master’s and Ph.D. in Industrial Engineering from The Pennsylvania State University in 1995 and 1996, respectively. In 1997, he was awarded a National Research Council Fellowship and worked at the NASA Ames Research Center. He joined the faculty of The University of Iowa as an Assistant Professor in 1997 and was promoted to Professor in 2015. He has authored over 100 journal articles and conference papers. His research interests include human-machine system interaction, human-robot interaction, surgical simulation, and human factors.