harbour long short fund fund update
TRANSCRIPT

Harbour Investment Funds
What are the risks of investing?
Note that even the lowest category does not mean a risk-free investment, and there are other risks that
are not captured by this rating.
This risk indicator is not a guarantee of a fund's future performance. The risk indicator is based on the returns
data for the 5 years to 30 June 2020. While risk indicators are usually relatively stable, they do shift from time
to time. The risk indicator will continue to be updated in future fund updates.
See the Product Disclosure Statement (PDS) for more information about the risks associated with investing in this Fund.
A combination of actual Fund returns and market index returns
have been used to determine the risk indicator for the Harbour
Long Short Fund (inception 3 January 2019), as the Fund has not
been operational for the required 5 years. The risk indicator may
therefore provide a less reliable indicator of potential future
volatility of this Fund.
3 January 2019The date the Fund started
Total value of the Fund (NZD) $2,531,664
Harbour Long Short Fund
Fund Updatefor the quarter ended 30 June 2020
This fund update was first made publicly available on 28 July 2020
What is the purpose of this update?
This document tells you how the Harbour Long Short Fund has performed and what fees were charged. The document
will help you compare the Fund with other funds. Harbour Asset Management Limited prepared this update in
accordance with the Financial Markets Conduct Act 2013. This information is not audited and may be updated.
Description of this fund
The Fund is an actively managed, high conviction portfolio investing principally in ‘long’ and ‘short’ listed Australasian
equities.
The focus is on delivering positive returns through the market cycle by investing in long and short-sold equity positions
with no particular attention to an equity benchmark.
The fund is expected to have lower volatility than equity benchmarks.
We can actively allocate investments between Australasian listed equities, fixed interest and cash. The Fund may also
use derivatives to hedge currency and equity risk.
Investment Objective: To deliver positive absolute returns through the economic cycle with low volatility and low
correlation of returns with equity markets.
The risk indicator is rated from 1 (low) to 7 (high). The rating reflects how much the value of the Fund's assets goes up and down. A higher risk generally means higher potential returns over time, but more ups and downs along the way. To help you clarify your own attitude to risk, you can seek financial advice or work out your risk profile at www.sorted.org.nz.
1 | Harbour Investment Funds
How has the Fund performed?
Annual Return1 What fees are investors charged?
% of net asset value
Total fund charges (Inc. GST) 1.90%
Which are made up of:
1.90%
Including-
Manager’s basic fee 1.25%
Other management and 0.18%
administration charges3
Total Performance-based fees 0.47%
Annual Return Graph2
Including-
Manager’s basic fee
Other management and
administration charges3 0
Annual Return Graph Total Performance-based fees
Example of how this applies to an investor
Small differences in fees and charges can have a big impact on
This shows the return after Fund charges and tax your investment over the long term.
for each year ending 31 March since the Fund Jenny had $10,000 in the Harbour Long Short Fund at
started. the start of the year and did not make any further contributions. At
the end of the year, Jenny received a return, after fund charges
since the Fund started, up to 30 June 20. were deducted of $958 (that is 9.58% of her initial $10,000). This
Market Index returns do not include any tax, gives Jenny a total return after tax of $987 for the year.
Investors in the Fund are charged fund charges. This Fund has not
been open for a year to 30 June 2019. As such, below are
estimates of fees to 30 June 2020:
Total management and
administration
Market index annual
return1
2.04%(reflects no deduction for
charges and tax)
The last bar shows the annualised annual return
expenses or charges.
Past Year
9.87%(after deductions for charges
and tax)
Annual Return1
9.58%(after deductions for charges
but before tax)
The market index annual return is based on the weighted average return of the market indices used to measure performance of the underlying fund. In this case the Market Index is the 15% S&P NZX50 Index: 15% S&P/ASX 200 Index & 70% S&P/NZX Bank Bills 90-Day Index. Additional information about the market index is available on the offer
Investors may also be charged individual action fees for specific
actions or decisions (for example, for withdrawing from or
switching funds). See the PDS and Other Material Information
Document OMI for more information about fees.
Important: This does not tell you how the Fund will perform in the future. Returns in this update are after tax at the highest prescribed investor rate (PIR) of tax for an individual New Zealand resident. Your tax may be lower.
4.4
5%
3.1
6%
-0.8
2%
2.2
2%
-2.0%
-1.0%
0.0%
1.0%
2.0%
3.0%
4.0%
5.0%
6.0%
7.0%
8.0%
31
/03
/20
20
An
nu
alis
ed r
etu
rn s
ince
ince
pti
on
Harbour Long Short Fund
Market Index
The fees for this Fund have reduced on 1 July 2020. Please refer to the latest PDS which details these estimated fees and charges to provide you with an indication for the year to 30 June 2021.In addition, the above performance fee is an estimate based on data to 30 June 2020. We estimate a performance fee of 0.47% may be payable for the year ending 31 December 2020. This is subject to change (up or down) depending on relative performance for the remainder of the calendar year for 2020. See OMI for more information on how performance fees are charged.
2 | Harbour Investment Funds

What does the Fund invest in?
This shows the types of assets that the fund invests in.
Top 10 investments
The top 10 investments make up 76.9% of the net asset value of the Fund.
NZ
AU
AU
1.98%
2.21%
NZ
Australasian equities
Australasian equities
Australasian equities
NZ
Australasian equities
9.45%
Name
ANZ 28 A/C
% of Fund net assets Type
Cash and cash equivalents
Cash and cash equivalents
Actual asset allocation to 30 June 2020. Actual asset allocation will vary from the target asset allocation as market
conditions change and if we pursue tactical investment opportunities.
Country
AU
NZ
AU
Macquarie Margin A/C 24.95%
24.94%
Australasian equities
Australasian equities
JP Morgan A/c
The A2 Milk Company Limited
Infratil Limited 2.80%
3.62%
NZ
Cash and cash equivalents
Australasian equities
NZMainfreight Limited
Contact Energy Limited
Aristocrat Leisure Limited
2.47%
2.26%
2.24%
National Australia Bank
EBOS Group Limited
28.51%
12.17%
59.32%
Actual Investment Mix
Australasian Equities NZ Fixed Interest
Cash & Cash Equivalents
30.00%
70.00%
Target Investment Mix
Australasian Equities NZ Fixed Interest
Cash & Cash Equivalents
3 | Harbour Investment Funds

Key Personnel
Name
Further information
Notes:
1. Returns to 30 June 2020.
2. Other fees: these charges cover the general management of the Fund e.g. administration, Supervisor, legal,
and audit fees and costs required to comply with relevant legislation. These charges are based on estimates
30 June 2020 and exclude any applicable GST.
More information on these charges can be found in the PDS and the other material information document
(OMI) on the Disclose Register.
4. The Fund currently has 40.67% of assets invested in Australian equities. Of this exposure,
we have a 49.61% hedge on these Australian dollar denominated assets.
Hyperlinks to Harbour documents:
Links to the latest PDS, SIPO & OMI for the Harbour Funds can be found on the Harbour website:
https://www.harbourasset.co.nz/our-funds/investor-documents/
Research Analyst, Alliance
Bernstein
Research Analyst, Alliance
Bernstein
2 years & 3
months
7 years & 3
months
Time in previous
positionTime in current
positionPrevious position
Oyvinn Rimer
Craig Stent
Current Position
Executive Director,
Head of Equities
Director, Senior
Research Analyst
10 years & 6 months
10 years & 6 months
You can also obtain this information, the PDS for the Harbour Long Short Fund, and some additional
information from the offer register at www.business.govt.nz/disclose.
4 | Harbour Investment Funds

Harbour Investment Funds
Total value of the Fund (NZD)
The date the Fund started
What are the risks of investing?
Note that even the lowest category does not mean a risk-free investment, and there are other risks that
are not captured by this rating.
This risk indicator is not a guarantee of a fund's future performance. The risk indicator is based on the returns
data for the 5 years to 30 June 2020. While risk indicators are usually relatively stable, they do shift from time
to time. The risk indicator will continue to be updated in future fund updates.
See the Product Disclosure Statement (PDS) for more information about the risks associated with investing in this Fund.
15,372,468$
10 April 2014
Harbour Australasian Equity Focus Fund
Fund Updatefor the quarter ended 30 June 2020
This fund update was first made publicly available on 28 July 2020
What is the purpose of this update?
This document tells you how the Harbour Australasian Equity Focus Fund has performed and what fees were charged.
The document will help you compare the Fund with other funds. Harbour Asset Management Limited prepared this
update in accordance with the Financial Markets Conduct Act 2013. This information is not audited and may be
updated.
Description of this fund
The Fund is an actively managed fund investing in New Zealand and Australian listed equities. It is a high conviction
fund where the portfolio will consist of companies our analysts have researched and have a high belief will perform
over the medium to longer-term. A higher rated company will have a higher weighting in the portfolio.
Investment Objective: To deliver medium to long term capital growth through investing in quality businesses with
strong growth prospects.
Benchmark: 50% S&P/NZX 50 and a 50% S&P/ASX 200 Index (which is 50% hedged into NZ dollars).
The risk indicator is rated from 1 (low) to 7 (high). The rating reflects how much the value of the Fund's assets goes up and down. A higher risk generally means higher potential returns over time, but more ups and downs along the way. To help you clarify your own attitude to risk, you can seek financial advice or work out your risk profile at www.sorted.org.nz.
1 |Harbour Investment Funds

How has the Fund performed?started, up to 30 June 20.
Market Index returns do not include any tax, expenses or charges.
What fees are investors charged?
% of net asset value
Total fund charges (Inc. GST)*
Which are made up of:
Including-
Manager’s basic fee
Other management and
Annual Return Graph2 administration charges3
Including-Total Performance-based fees
Manager’s basic fee
Other management and
administration charges3 0
Annual Return Graph Total Performance-based fees
Example of how this applies to an investor
Jenny had $10,000 in the Harbour Australasian Equity
Focus Fund at the start of the year and did not make any
further contributions. At the end of the year, Jenny received
a return, after fund charges were deducted, of $560
(that is 5.60% of her initial $10,000). This gives Jenny a
This shows the return after Fund charges and tax for total return after tax of $511 for the year.
each year ending 31 March since the Fund started.
Past Year
5.11%
5.60%
Average
over past 5
years
12.79%
13.23%
Annual Return1
Annual Return1
(after deductions for charges
and tax)
(after deductions for charges
but before tax)
Market index annual
return1
(reflects no deduction for
charges and tax)
1.57%10.80%
Total management and
administration
0.34%
1.29%
0.95%
Small differences in fees and charges can have a big impact on
your investment over the long term.
The last bar shows the annualised annual return since the Fund
1.29%
0.00%
The market index annual return is based on the weighted average return of the market indices used to measure performance of the underlying fund. In this case the Market Index is 50% S&P/NZX50 and a 50% S&P/ASX 200 Index (which is hedged into NZD).Additional information about the market index is available on the offer register at www.business.govt.nz/disclose.
Investors may also be charged individual action fees for specific
actions or decisions (for example, for withdrawing from or
switching funds). See the PDS and Other Material Information
Document (OMI) for more information about fees. Also see the
product disclosure statement for more information about the
basis on which performance fees are charged.
Important: This does not tell you how the Fund will perform in the future. Returns in this update are after tax at the highest prescribed investor rate (PIR) of tax for an individual New Zealand resident. Your tax may be lower.
2.3
9%
20
.94
%
11
.17
%
20
.70
%
5.8
1%
-12
.08
%
11
.14
%
13
.80
%
5.5
4%
13
.85
%
8.9
9% 1
5.2
6%
-7.2
8%
10
.63
%
-20.0%
-10.0%
0.0%
10.0%
20.0%
30.0%
31/0
3/20
15
31/0
3/20
16
31/0
3/20
17
31/0
3/20
18
31/0
3/20
19
31/0
3/20
20
Ave
rage
an
nu
al r
etu
rn s
ince
ince
pti
on
Australasian Equity Focus Fund
market index
Investors in the Fund are charged fund charges. In the year to 30 June 2019 these were as follows:
The fees for this Fund have reduced on 1 July 2020. Please refer to the latest PDS which details these estimated fees and charges to provide you with an indication for the year to 30 June 2021.
2 |Harbour Investment Funds

What does the Fund invest in?
This shows the types of assets that the fund invests in.
Top 10 investments
The top 10 investments make up 64.0% of the net asset value of the Fund.
Charter Hall Group Australasian equities AU3.95%
Macquarie Group Australasian equities AU
Contact Energy Limited Australasian equities NZ
4.50%
4.15%
Goodman Group Australasian equities AU
Ebos Group Australasian equities NZ
5.72%
5.68%
Xero Limited Australasian equities AU
6.08%
5.98%
Summerset Group Holdings Australasian equities NZ7.07%
CSL Limited Australasian equities AU
8.41%
Name % of Fund net assets Type Country
A2 Milk Australasian equities NZ
Mainfreight Australasian equities NZ
Actual asset allocation to 30 June 2020. Actual asset allocation will vary from the target asset allocation as market
conditions change and if we pursue tactical investment opportunities.
12.50%
98.81%
1.19%
Actual Investment Mix
Australasian Equities Cash & Cash Equivalents
95.00%
5.00%
Target Investment Mix
Australasian Equities Cash & Cash Equivalents
3 |Harbour Investment Funds

Key Personnel
Name
Further information
Notes:
1. Returns to 30 June 2020.
2. The bar chart shows fund returns after the deduction of fees and tax, however the market index returns are
shown before any fees or tax is deducted.
3. Other fees: these charges cover the general management of the Fund e.g. administration, Supervisor, legal,
and audit fees and costs required to comply with relevant legislation. These charges are based on the audited
financial statements for the Fund to 30 June 2019 and includes any applicable GST. These also include
underlying fund charges for retail funds holding units in other Harbour Funds. More information on these
charges can be found in the PDS and the other material information document (OMI) on the Disclose Register.
4. The Fund currently has 38.07% of assets invested in Australian equities. Of this exposure, we have a
24.84% hedge on these Australian dollar denominated assets.
Harbour documents:Links to the latest PDS, SIPO & OMI for the Harbour Funds can be found on the Harbour website:
https://www.harbourasset.co.nz/our-funds/investor-documents/
Craig Stent Executive Director,
Head of Equities
10 years & 6 months Research Analyst, Alliance
Bernstein
7 years & 3
months
Shane Solly Director, Portfolio
Manager
6 years & 3 months Head of Equities, Mint
Asset Management
7 years & 2
months
Andrew
Bascand
Managing Director 10 years & 6 months Senior Vice President &
Portfolio Manager,
Alliance Bernstein
10 Years
Current PositionTime in current
positionPrevious position
Time in previous
position
You can also obtain this information, the PDS for the Harbour Australasian Equity Focus Fund, and
some additional information from the offer register at www.business.govt.nz/disclose.
4 |Harbour Investment Funds

Harbour Investment Funds
What are the risks of investing?
Note that even the lowest category does not mean a risk-free investment, and there are other risks that
are not captured by this rating.
This risk indicator is not a guarantee of a fund's future performance. The risk indicator is based on the returns
data for the 5 years to 30 June 2020. While risk indicators are usually relatively stable, they do shift from time to time. The risk indicator will continue to be updated in future fund updates.
See the Product Disclosure Statement (PDS) for more information about the risks associated with investing in this Fund.
Total value of the Fund (NZD) $285,201,744
Harbour Australasian Equity Fund
Fund Updatefor the quarter ended 30 June 2020
This fund update was first made publicly available on 28 July 2020
11 April 2010The date the Fund started
What is the purpose of this update?
This document tells you how the Harbour Australasian Equity Fund has performed and what fees were charged. The
document will help you compare the Fund with other funds. Harbour Asset Management Limited prepared this update in
accordance with the Financial Markets Conduct Act 2013. This information is not audited and may be updated.
Description of this fund
The Fund provides actively managed exposure to New Zealand and Australian listed equities. This Fund has a growth -oriented investment management approach to generate alpha (return over the benchmark) for investors.
Investment Objective: To achieve a gross return of 5.0% per annum above the benchmark over the long term.
Benchmark: S&P/NZX 50 Index
The risk indicator is rated from 1 (low) to 7 (high). The rating reflects how much the value of the Fund's assets goes up and down. A higher risk generally means higher potential returns over time, but more ups and downs along the way. To help you clarify your own attitude to risk, you can seek financial advice or work out your risk profile at www.sorted.org.nz.
1 | Harbour Investment Funds
How has the Fund performed? This shows the return after fund charges and tax for each
up to 30 June 20. The Market Index returns do not include
any tax, expenses or charges.
What fees are investors charged?
Total fund charges (Inc. GST)
Which are made up of:
Including-
Manager’s basic fee
Annual Return Graph2
Other management and
administration charges3
Total Performance-based fees
Example of how this applies to an investor
Jenny had $10,000 in the Harbour Australasian Equity
Fund at the start of the year and did not make any
further contributions. At the end of the year, Jenny received
a return, after fund charges were deducted, of $1,076
(that is 10.76% of her initial $10,000). This gives Jenny a
total return after tax of $1,014 for the year.
9.85%
Annual Return1
(after deductions for
charges and tax)
Annual Return1
(after deductions for
charges but before tax)
Market index annual
return1
(reflects no deduction for
charges and tax)
14.72%
15.55%
16.10%
year ending 31 March since the Fund started. The last bar
shows the annualised annual return since the Fund started,
10.14%
10.76%
Past Year
Average
over past 5
years
% of net asset value
1.13%
Total management and
administration1.13%
0.93%
0.00%
0.20%
Small differences in fees and charges can have a big impact on
your investment over the long term.
The market index annual return is based on the weighted average return of the market indices used to measure performance of the underlying fund. In this case the Market Index is the S&P/NZX50 Index. Additional information about the market index is available on the offer register at www.business.govt.nz/disclose.
Investors in the Fund are charged fund charges. In the year to 30 June 2019 these were as follows:
Investors may also be charged individual action fees for specific
actions or decisions (for example, for withdrawing from or
switching funds). See the PDS and Other Material Information
Document OMI for more information about fees. Also see the
product disclosure statement for more information about the
basis on which performance fees are charged.
Important: This does not tell you how the Fund will perform in the future. Returns in this update are after tax at the highest prescribed investor rate (PIR) of tax for an individual New Zealand resident. Your tax may be lower.
-3.4
%
25
.6%
19
.9%
6.4
%
19
.0%
10
.0%
19
.5%
10
.5%
-4.7
%
12
.4%
3.6
%
27
.7%
17
.5%
15
.2% 17
.3%
7.9
%
16
.9%
19
.6%
0.4
%
14
.4%
-10.0%
-5.0%
0.0%
5.0%
10.0%
15.0%
20.0%
25.0%
30.0%
Harbour Australasian Equity Fund Market Index
2 | Harbour Investment Funds

What does the Fund invest in?
This shows the types of assets that the fund invests in.
Top 10 investments
The top 10 investments make up 65.8% of the net asset value of the Fund.
Fisher & Paykel Healthcare
Mainfreight
Ebos Group
Contact Energy
NZ
NZ
NZ
A2 Milk 16.52%
15.17%
NZ
NZ
4.61%
6.73%
4.32%
NZSummerset Group Holdings
Auckland Intl Airport
Ryman Healthcare
Spark New Zealand
Meridian Energy
Actual asset allocation to 30 June 2020. Actual asset allocation will vary from the target asset allocation as market
conditions change and if we pursue tactical investment opportunities.
CountryName
4.27%
4.21%
Australasian equities
Australasian equities
Australasian equities
Australasian equities
% of Fund net assets Type
Australasian equities
Australasian equities
Australasian equities
NZ
NZ
NZ
2.82%
3.55%
NZ
Australasian equities
Australasian equities
3.56% Australasian equities
99.65%
0.35%
Actual Investment Mix
Australasian Equities Cash & Cash Equivalents
98.00%
2.00%
Target Investment Mix
Australasian Equities Cash & Cash Equivalents
3 | Harbour Investment Funds

Key Personnel
Name
Further information
Notes:
1. Returns to 30 June 2020.
2. The bar chart shows fund returns after the deduction of fees and tax, however the market index returns are
shown before any fees or tax is deducted.
3. Other fees: these charges cover the general management of the Fund e.g. administration, Supervisor, legal,
and audit fees and costs required to comply with relevant legislation. These charges are based on the audited
financial statements for the Fund to 30 June 2019 and includes any applicable GST. These also include
underlying fund charges for retail funds holding units in other Harbour Funds. More information on these
charges can be found in the PDS and the other material information document (OMI) on the Disclose Register.
4. The Fund currently has 18.00% of assets invested in Australian equities. Of this exposure,
we have a 35.68% hedge on these Australian dollar denominated assets.
Hyperlinks to Harbour documents:
Links to the latest PDS, SIPO & OMI for the Harbour Funds can be found on the Harbour website:
https://www.harbourasset.co.nz/our-funds/investor-documents/
Shane Solly 6 years & 3 months
10 years & 6 months
10 years & 6 months
Craig Stent
Andrew
Bascand
Current Position
Managing Director
Director, Portfolio
Manager
Executive Director,
Head of Equities
Time in previous
positionTime in current position Previous position
Head of Equities, Mint
Asset Management
Research Analyst, Alliance
Bernstein
Senior Vice President &
Portfolio Manager,
Alliance Bernstein
7 years & 3
months
7 years & 2
months
10 Years
You can also obtain this information, the PDS for the Harbour Australasian Equity Fund, and some
additional information from the offer register at www.business.govt.nz/disclose.
4 | Harbour Investment Funds

Harbour Investment Funds
Total value of the Fund (NZD)
The date the Fund started
What are the risks of investing?
Note that even the lowest category does not mean a risk-free investment, and there are other risks that are not
captured by this rating.
This risk indicator is not a guarantee of a fund's future performance. The risk indicator is based on the returns data for the
5 years to 30 June 2020. While risk indicators are usually relatively stable, they do shift from time to time. The riskindicator will continue to be updated in future fund updates. See the Product Disclosure Statement (PDS) for more information
about the risks associated with investing in the Fund.
Harbour Australasian Equity Income Fund
Fund Updatefor the quarter ended 30 June 2020
This fund update was first made publicly available on 28 July 2020
48,607,807$
1 November 2011
What is the purpose of this update?
This document tells you how the Harbour Australasian Equity Income Fund has performed and what fees were charged.
The document will help you compare the Fund with other funds. Harbour Asset Management Limited prepared this
update in accordance with the Financial Markets Conduct Act 2013. This information is not audited and may be
updated.
Description of this fund
The Fund is designed to generate quarterly income from a diversified portfolio of Australasian listed equities that pay
sustainable and growing dividend yields (the amount a company pays out in dividends each year relative to its share
price) as well as holding cash and fixed interest securities.
Investment Objective: The performance objective of the Fund is to generate a higher yield than the New Zealand
and Australian markets.
Benchmark: 60% S&P/ASX Industrials Index and 40% S&P/NZX Portfolio Index.
The risk indicator is rated from 1 (low) to 7 (high). The rating reflects how much the value of the Fund's assets goes up and down. A higher risk generally means higher potential returns over time, but more ups and downs along the way. To help you clarify your own attitude to risk, you can seek financial advice or work out your risk profile at www.sorted.org.nz.
1 |Harbour Investment Funds

How has the Fund performed? since the fund started, up to 30 June 20.
Market Index Returns do not include any tax, expenses or charges.
Annual Return1
What fees are investors charged?
Total fund charges (Inc. GST)
Which are made up of:
Including-
Manager’s basic fee
Other management and
Annual Return Graph2 administration charges3
Total Performance-based fees
Including-0.0092
Manager’s basic fee0.002
Other management and
administration charges3 0
Annual Return Graph Total Performance-based feesExample of how this applies to an investor
Jenny had $10,000 in the Harbour Australasian Equity
Income Fund at the start of the year and did not make any
further contributions. At the end of the year, Jenny received
a return, after fund charges were deducted, of -$223
(that is -2.23% of her initial $10,000). This gives Jenny a
total return after tax of -$305 for the year.
This shows the return after Fund charges and tax for
each year ending 31 March since the Fund started.
11.38% -0.65%
(after deductions for charges
and tax)
Average
over past 5
years
Past Year
6.47% -3.05%
0.36%
0.00%
The last bar shows the annualised annual return
Total management and
administration
Annual Return1
(after deductions for charges
but before tax)
1.13%
0.77%
% of net asset value
Market index annual
return1 1.13%
(reflects no deduction for
charges and tax)
7.49% -2.23%
The market index annual return is based on the weighted average return of the market indices used to measure performance of the underlying fund. In this case the Market Index is 60% S&P/ASX industrials Index and 40% S&P/NZX portfolio Index. Additional information about the market index is available on the offer register at www.business.govt.nz/disclose.
Investors may also be charged individual action fees for specific
actions or decisions (for example, for withdrawing from or
switching funds). See the PDS and Other Material Information
Document (OMI) for more information about fees.
Important: This does not tell you how the Fund will perform in the future. Returns in this update are after tax at the highest prescribed investor rate (PIR) of tax for an individual New Zealand resident. Your tax may be lower.
26
.04
%
8.2
2%
24
.75
%
5.0
8%
6.4
9%
1.5
1%
14
.35
%
-9.2
2%
10
.67
%
22
.43
%
12
.62
%
16
.01
%
8.2
2% 1
4.4
2%
11
.14
%
14
.64
%
-13
.25
%
12
.86
%
-20.0%
-15.0%
-10.0%
-5.0%
0.0%
5.0%
10.0%
15.0%
20.0%
25.0%
30.0%
31/0
3/20
13
31/0
3/20
14
31/0
3/20
15
31/0
3/20
16
31/0
3/20
17
31/0
3/20
18
31/0
3/20
19
31/0
3/20
20
Ave
rage
an
nu
al r
etu
rn s
ince
ince
pti
on
Harbour Australasian Equity Income Fund
Market Index
Investors in the Fund are charged fund charges. In the year to 30 June 2019 these were as follows:
Small differences in fees and charges can have a big impact on
your investment over the long term.
2 |Harbour Investment Funds

What does the Fund invest in?
This shows the types of assets that the fund invests in.
Top 10 investments
The top 10 investments make up 41.3% of the net asset value of the Fund.
Actual asset allocation to 30 June 2020. Actual asset allocation will vary from the target asset allocation as market
conditions and if we pursue tactical investment opportunities.
Name % of Fund net assets Type Country
Spark New Zealand Limited Australasian equities NZ
Contact Energy Limited Australasian equities NZ
5.50%
5.34%
Cash and cash equivalents NZ
Infratil Limited Australasian equities NZ
4.61%
4.60%
NZ
Precinct Properties New Zealand Limited Australasian equities NZ
3.90%
3.71%
NZ
Charter Hall Group Australasian equities AU
3.54%
3.49%
AU
Vital Healthcare Property Trust Australasian equities NZ
3.35%
3.27%
Goodman Group Australasian equities
Meridian Energy Limited Australasian equities
Mercury NZ Limited Australasian equities
ANZ A/C
78.49%
21.51%
Actual Investment Mix
Australasian Equities Cash & Cash Equivalents
90.00%
10.00%
Target Mix
Australasian Equities Cash & Cash Equivalents
3 |Harbour Investment Funds

Key Personnel
Name
Further information
Notes:
1. Returns to 30 June 2020.
2. The bar chart shows fund returns after the deduction of fees and tax, however the market index returns are
shown before any fees or tax is deducted.
3. Other fees: these charges cover the general management of the Fund e.g. administration, Supervisor, legal,
and audit fees and costs required to comply with relevant legislation. These charges are based on the audited
financial statements for the Fund to 30 June 2019 and includes any applicable GST. These also include
underlying fund charges for retail funds holding units in other Harbour Funds. More information on these
charges can be found in the PDS and the other material information document (OMI) on the Disclose Register.
4. The Fund currently has 29.01% of assets invested in Australian equities. Of this exposure, we have a
77.77% hedge on these Australian dollar denominated assets.
Hyperlinks to Harbour documents:
Links to the latest PDS, SIPO & OMI for the Harbour Funds can be found on the Harbour website:
https://www.harbourasset.co.nz/our-funds/investor-documents/
Time in previous
position
Craig Stent Executive Director, Head
of Equities
10 years & 6 months Research Analyst, Alliance
Bernstein
7 years & 3
months
7 years & 2
months
Andrew
Bascand
Managing Director 10 years & 6 months Senior Vice President &
Portfolio Manager,
Alliance Bernstein
10 years
Shane Solly Director, Portfolio
Manager
6 years & 3 months Head of Equities, Mint
Asset Management
Current PositionTime in current
positionPrevious position
You can also obtain this information, the PDS for the Harbour Australasian Equity Income Fund, and
some additional information from the offer register at www.business.govt.nz/disclose.
4 |Harbour Investment Funds

$440,064,197
16 February 2009
What are the risks of investing?
Note that even the lowest category does not mean a risk-free investment, and there are other risks that are not captured
by this rating.
This risk indicator is not a guarantee of a fund's future performance. The risk indicator is based on the returns data
for the five years to 30 June 2020. While risk indicators are usually relatively stable, they do shift from time to
time. The risk indicator will continue to be updated in future fund updates.
See the Product Disclosure Statement (PDS) for more information about the risks associated with investing in this Fund.
Total value of the Fund (NZD)
The date the Fund started
Harbour Investment Funds
Harbour NZ Corporate Bond Fund
Fund Updatefor the quarter ended 30 June 2020
This fund update was first made publicly available on 28 July 2020
What is the purpose of this update?
This document tells you how the Harbour NZ Corporate Bond Fund has performed and what fees were charged. The document will help you compare the Fund with other funds. Harbour Asset Management Limited prepared this update in accordance with the Financial Markets Conduct Act 2013. This information is not audited and may be updated.
Description of this fund
The Fund provides access to favourable income yields through a diversified portfolio of primarily investment grade corporate bond fixed interest securities.
Investment Objective: The investment objective of the Fund is to exceed the return of the benchmark portfolio
after fees on a rolling 12 month basis.
The risk indicator is rated from 1 (low) to 7 (high). The rating reflects how much the value of the Fund's assets goes up and down. A higher risk generally means higher potential returns over time, but more ups and downs along the way. To help you clarify your own attitude to risk, you can seek financial advice or work out your risk profile at www.sorted.org.nz.
1| Harbour Investment Funds
How has the Fund performed?
Average
over past
5 years
Past Year
Annual Return1
What fees are investors charged?
Annual Return1
Market index annual
return1 Total fund charges (Inc. GST)
(reflects no deduction for
charges and tax)Which are made up of:
Total management and
administration charges
Including-
Manager’s basic fee
Other management and
administration charges3
Annual Return Graph2
Example of how this applies to an
investor
Jenny had $10,000 in the Harbour NZ Corporate Bond Fund
This shows the return after fund charges and tax for each at the start of the year and did not make any further
year ending 31 March since the Fund started. The last bar contributions. At the end of the year, Jenny received a
shows the annualised annual return since the Fund started, return after fund charges were deducted of $549 (that is
up to 30 June 2020. The Market Index returns do not 5.49% of her initial $10,000). This gives Jenny a total
include any tax, expenses or charges. return after tax of $393.
Investors may also be charged individual action fees for
specific actions or decisions (for example, for withdrawing
from or switching funds). See the PDS and Other Material
Information Document (OMI) for more information about
fees.
5.25% 5.82%
Total Performance-based fees
% of net asset value
0.64%
0.54%
0.10%
0.00%
0.64%
3.36% 3.93%
4.69% 5.49%
Small differences in fees and charges can have a big
impact on your investment over the long term.
(after deductions for charges
and tax)
(after deductions for charges
but before tax)
The market index annual return is based on the weighted average return of the market indices used to measure performance of the underlying fund. In this case the Market Index is the S&P/NZX A Grade Corporate Bond Total Return Index. Additional information about the market index is available on the offer register at www.business.govt.nz/disclose
Investors in the Fund are charged fund charges. In the year to 30 June 2019 these were as follows:
Important: This does not tell you how the Fund will perform in the future. Returns in this update are after tax at the highest prescribed investor rate (PIR) of tax for an individual New Zealand resident. Your tax may be lower.
6.0
4%
4.5
8%
4.0
4%
4.6
1%
1.8
4%
4.9
8%
4.1
4%
1.8
6%
2.9
8%
3.7
0%
2.6
4% 3.8
1%
9.9
6%
8.7
7%
6.8
0%
6.6
3%
2.6
7%
8.1
2%
6.4
0%
3.1
3% 4
.72
% 6.0
4%
4.1
9% 5
.95
%
0.0%
2.0%
4.0%
6.0%
8.0%
10.0%
12.0%
Harbour NZ Corporate Bond Fund Market Index
The fees for this Fund have reduced on 1 July 2019. Please refer to the latest PDS which details these estimated fees and charges to provide you with an indication for the year to 30 June 2020.
2| Harbour Investment Funds

What does the Fund invest in?
This shows the types of assets that the fund invests in.
market conditions change and if we pursue tactical investment opportunities.
Top 10 investments
Type Country Credit rating
New Zealand fixed interest NZ AA+
New Zealand fixed interest NZ AA+
New Zealand fixed interest NO AAA
New Zealand fixed interest NZ AA+
Cash and cash equivalents NZ AA
New Zealand fixed interest NZ AA
New Zealand fixed interest DE AAA
Cash and cash equivalents NZ AA
New Zealand fixed interest NZ AA
New Zealand fixed interest NZ AA+
The top 10 investments make up of the net asset value of the Fund.
2.63%
2.59%
2.44%
2.29%
2.12%
% of Fund
net assets
4.99%
4.73%
3.29%
3.27%
Name
NZ Government Stock 15/04/2023 5.50%
NZ Local Gov Fund Agency 15/04/25 2.75%
Kommunalbanken AS 12/06/2025 0.75%
Housing New Zealand Ltd 12/06/25 3.36%
ANZ A/C
Dunedin City Treasury 17/07/2025 3.61%
Landwirtschaftliche Ren 23/04/24 5.375%
ASB Bank Deposit A/C 12/8/2020
Auckland Council 24/03/2025 4.176%
NZ Local Gov Fund Agency 14/04/33 3.50%
30.4%
2.09%
Actual asset allocation to 30 June 2020. Actual asset allocation will vary from the target asset allocation as market
89.40%
8.80%1.80%
Actual Investment Mix
NZ fixedinterest
Cash & cashequivalents
Internationalfixed interest
95%
5%
Target Investment Mix
NZ fixedinterest
Cash & cashequivalents
3| Harbour Investment Funds
Key Personnel
Name Previous position
Further information
Notes:
1. Returns to 30 June 2020.
2. The bar chart shows fund returns after the deduction of fees and tax, however the market index returns are shown
before any fees or tax is deducted.
3. Other fees: these charges cover the general management of the Fund e.g. administration, Supervisor, legal, and audit
fees and costs required to comply with relevant legislation. These charges are based on the audited financial
statements for the Fund to 30 June 2019 and includes any applicable GST. More information on these charges can be
found in the PDS and the other material information odcument (OMI) on the Disclose Register.
Hyperlinks to Harbour documents:
Links to the latest PDS, SIPO & OMI for the Harbour Funds can be found on the Harbour website:
https://www.harbourasset.co.nz/our-funds/investor-documents/
Time in
current
position
Current Position Time in previous position
George Henderson 11 Years & 6 months
16 years & 5 monthsMark Brown AXA/Alliance Bernstein, Head
of Fixed Interest
Director, Head of
Fixed Income
9 years & 9
months
2 years & 0
months
Portfolio Manager Portfolio Manager, Royal
London Asset Management
You can also obtain this information, the PDS for the Harbour NZ Corporate Bond Fund, and some additional
information from the offer register at www.business.govt.nz/disclose.
4| Harbour Investment Funds
Harbour Investment Funds
What are the risks of investing?
Note that even the lowest category does not mean a risk-free investment, and there are other risks that are not
captured by this rating.
This risk indicator is not a guarantee of a fund's future performance. The risk indicator is based on the returns
data for the 5 years to 30 June 2020. While risk indicators are usually relatively stable, they do shift from time
to time. The risk indicator will continue to be updated in future fund updates.
See the Product Disclosure Statement (PDS) for more information about the risks associated with investing in this Fund.
Total value of the Fund (NZD) $263,910,624
Harbour NZ Equity Advanced Beta Fund
Fund Updatefor the quarter ended 30 June 2020
This fund update was first made publicly available on 28 July 2020
The date the Fund started 3 December 2014
What is the purpose of this update?
This document tells you how the Harbour NZ Equity Advanced Beta Fund has performed and what fees were charged. The
document will help you compare the Fund with other funds. Harbour Asset Management Limited prepared this update in
accordance with the Financial Markets Conduct Act 2013. This information is not audited and may be updated.
Description of this fund
The Fund provides exposure to New Zealand equities. The Fund is designed to track the market index with some quantitative tilting to selected companies. 70% of the Fund mirrors the market index with the remaining 30% of the Fund tilted towards those companies in the index that score well on our financial models for value, yield & growth.
Investment Objective: The performance objective of the Fund is to outperform the benchmark.
Benchmark: S&P/NZX 50 Portfolio Index.
The risk indicator is rated from 1 (low) to 7 (high). The rating reflects how much the value of the Fund's assets goes up and down. A higher risk generally means higher potential returns over time, but more ups and downs along the way. To help you clarify your own attitude to risk, you can seek financial advice or work out your risk profile at www.sorted.org.nz.
1|Harbour Investment Funds

How has the Fund performed? This shows the return after fund charges and tax for each
up to 30 June 20. The Market Index Returns do not include
any tax, expenses or charges.
What fees are investors charged?
Total fund charges (Inc. GST)
Which are made up of:
Including-
Manager’s basic fee
Annual Return Graph2
Other management and
administration charges3
Total Performance-based fees
Example of how this applies to an investor
Jenny had $10,000 in the Harbour NZ Equity Advanced Beta Fund at
the start of the year and did not make any further contributions.
At the end of the year, Jenny received a return, after fund charges
were deducted, of $71 (that is 0.71% of her initial $10,000).
This gives Jenny a total return after tax of -$21 for the year.
Annual Return1
(after deductions for
charges and tax)
Annual Return1
(after deductions for
charges but before tax)
11.22%
12.65%
Average
over past 5
years
Past Year
-0.21%
0.71%
Market index annual
return1 % of net asset value
(reflects no deduction for
charges and tax)0.55%
Total management and
administration0.55%
0.43%
0.12%
0.00%
14.30% 1.32%
year ending 31 March since the Fund started. The last bar
shows the annualised annual return since the Fund started,
The market index annual return is based on the weighted average return of the market indices used to measure performance of the underlying fund. In this case the Market Index is the S&P/NZX Portfolio Index. Additional information about the market index is available on the offer register at www.business.govt.nz/disclose.
Investors in the Fund are charged fund charges. In the year to 30 June 2019 these were as follows:
Investors may also be charged individual action fees for specific
actions or decisions (for example, for withdrawing from or
switching funds). See the PDS and Other Material Information
Document OMI for more information about fees. Also see the
product disclosure statement for more information about the
basis on which performance fees are charged.
Small differences in fees and charges can have a big impact on
your investment over the long term.
Important: This does not tell you how the Fund will perform in the future. Returns in this update are after tax at the highest prescribed investor rate (PIR) of tax for an individual New Zealand resident. Your tax may be lower.
13
.62
%
6.5
0%
13
.29
%
15
.29
%
-9.1
9%
11
.03
%16
.49
%
8.5
0%
16
.87
%
19
.79
%
-6.4
1%
13
.65
%
-15.0%
-10.0%
-5.0%
0.0%
5.0%
10.0%
15.0%
20.0%
25.0%
31/0
3/20
16
31/0
3/20
17
31/0
3/20
18
31/0
3/20
19
31/0
3/20
20
Ave
rage
an
nu
al r
etu
rn s
ince
ince
pti
on
NZ Equity Advanced Beta Fund
Market Index
The fees for this Fund have reduced on 1 July 2019. Please refer to the latest PDS which details these estimated fees and charges to provide you with an indication for the year to 30 June 2020.
2|Harbour Investment Funds

What does the Fund invest in?
This shows the types of assets that the fund invests in.
Top 10 investments
The top 10 investments make up 44.1% of the net asset value of the Fund.
Actual asset allocation to 30 June 2020. Actual asset allocation will vary from the target asset allocation as market
conditions change and if we pursue tactical investment opportunities.
Name % of Fund net assets Type Country
A2 Milk Australasian equities NZ
Fisher & Paykel Healthcare Australasian equities NZ
Meridian Energy Australasian equities NZ
Spark New Zealand Australasian equities NZ
Contact Energy Australasian equities NZ4.33%
Ebos Group Australasian equities NZ
Precinct Properties New Zealand Limited Australasian equities NZ
4.17%
3.63%
Mainfreight Limited Australasian equities NZ
Infratil Limited Australasian equities NZ3.38%
3.55%
Ryman Healthcare Australasian equities NZ3.36%
6.42%
6.35%
4.49%
4.44%
99.02%
0.98%
Actual Investment Mix
Australasian Equities Cash & Cash Equivalents
99.00%
1.00%
Target Investment Mix
Australasian Equities Cash & Cash Equivalents
3|Harbour Investment Funds

Key Personnel
Name
Further information
Notes:
1. Returns to 30 June 2020.
2. The bar chart shows fund returns after the deduction of fees and tax, however the market index returns are
shown before any fees or tax is deducted.
3. Other fees: these charges cover the general management of the Fund e.g. administration, Supervisor, legal,
and audit fees and costs required to comply with relevant legislation. These charges are based on the audited
financial statements for the Fund to 30 June 2019 and includes any applicable GST.
More information on these charges can be found in the PDS and the other material information document (OMI)
on the Disclose Register.
Hyperlinks to Harbour documents:
Links to the latest PDS, SIPO & OMI for the Harbour Funds can be found on the Harbour website:
https://www.harbourasset.co.nz/our-funds/investor-documents/
Current PositionTime in current
positionPrevious position
Time in previous
position
4 years & 2
months
Andrew
Bascand
Managing Director 10 years and 5 months Senior Vice President &
Portfolio Manager,
Alliance Bernstein
10 years
Craig Stent Executive Director,
Head of Equities
10 years and 5 months Research Analyst, Alliance
Bernstein
7 years & 3
months
Susanna Lee Director, Portfolio
Manager
8 years and 1 months Quantitative Investment
Analyst. AXA Global
Investors/AMP Capital
You can also obtain this information, the PDS for the Harbour NZ Equity Advanced Beta Fund, and
some additional information from the offer register at www.business.govt.nz/disclose.
4|Harbour Investment Funds
Harbour Investment Funds
What are the risks of investing?
Note that even the lowest category does not mean a risk-free investment, and there are other risks that are not
captured by this rating.
This risk indicator is not a guarantee of a fund's future performance. The risk indicator is based on the returns
data for the 5 years to 30 June 2020. While risk indicators are usually relatively stable, they do shift from time
to time. The risk indicator will continue to be updated in future fund updates.
The date the Fund started 21 October 2015
Total value of the Fund (NZD) $145,485,475
T. Rowe Price Global Equity Growth Fund
Fund Updatefor the quarter ended 30 June 2020
This fund update was first made publicly available on 28 July 2020
What is the purpose of this update?
This document tells you how the T. Rowe Price Global Equity Growth Fund has performed and what fees were charged.
The document will help you compare the Fund with other funds. Harbour Asset Management Limited prepared this
update in accordance with the Financial Markets Conduct Act 2013. This information is not audited and may be updated.
Description of this fund
The Fund invests primarily in a portfolio of securities of companies which are traded, listed or due to be listed, on recognised exchanges and/or markets throughout the world. It may include securities of companies traded on recognised exchanges of developing countries.
Investment Objective:
The Fund’s objective is to provide long-term capital appreciation by investing primarily in a portfolio of securities of
companies which are traded, listed or due to be listed, on recognized exchanges and/or markets throughout the world.
Benchmark: MSCI All Country World Index (unhedged).
A combination of actual Fund returns and market index returns have been used to determine the risk indicator for the T. Rowe Price Global Equity Growth Fund (inception 21 October 2015), as the Fund has not been operational for the required 5 years. The risk indicator may therefore provide a less reliable indicator of potential future volatility of this Fund.
The risk indicator is rated from 1 (low) to 7 (high). The rating reflects how much the value of the Fund's assets goes up and down. A higher risk generally means higher potential returns over time, but more ups and downs along the way. To help you clarify your own attitude to risk, you can seek financial advice or work out your risk profile at www.sorted.org.nz.
See the Product Disclosure Statement (PDS) for more information about the risks associated with investing in this Fund.

How has the Fund performed?
Annual Return1
What fees are investors charged?
% of net asset value
Total fund charges (Inc. GST)
Which are made up of:
Including-
Manager’s basic fee
Other management and
Annual Return Graph2 administration charges3
Including-Total Performance-based fees
Manager’s basic fee
Other management and
administration charges3 0
Annual Return Graph Total Performance-based fees
Example of how this applies to an investor
Jenny had $10,000 in the T. Rowe Price Global Equity Growth Fund at
This shows the return after Fund charges and tax at the start of the year and did not make any further contributions.
for each year ending 31 March since the Fund At the end of the year, Jenny received a return, after fund charges
started. were deducted, of $2,174 (that is 21.74% of her initial $10,000).
This gives Jenny a total return after tax of $2,050 for the year.
since the Fund started, up to 30 June 20.
Market Index returns do not include any tax,
1.25%
1.25%
1.05%
0.20%
0.00%
Total management and
administration
The last bar shows the annualised annual return
expenses or charges.
Small differences in fees and charges can have a big impact on your
investment over the long term.
Annual Return1
21.74%(after deductions for charges
but before tax)
Market index annual
return1
6.54%(reflects no deduction for
charges and tax)
Past Year
20.50%(after deductions for charges
and tax)
Investors may also be charged individual action fees for specific
actions or decisions (for example, for withdrawing from or
switching funds). See the PDS and Other Material Information
Document OMI for more information about fees.
The market index annual return is based on the weighted average return of the market indices used to measure performance of the underlying fund. In this case the Market Index is MSCI All Country World Index (unhedged). Additional information about the market index is available on the offer register at www.business.govt.nz/disclose.
Important: This does not tell you how the Fund will perform in the future. Returns in this update are after tax at the highest prescribed investor rate (PIR) of tax for an individual New Zealand resident. Your tax may be lower.
20
.33
%
10
.68
%
4.2
1%
13
.23
%
11
.29
%
8.5
3%
2.0
9%
8.8
0%
0.0%
5.0%
10.0%
15.0%
20.0%
25.0%
31
/03
/20
18
31
/03
/20
19
31
/03
/20
20
Ave
rage
an
nu
alre
turn
sin
cein
cep
tio
n
T. Rowe Price Global Equity Growth FundMarket Index
Investors in the Fund are charged fund charges. In the year to 30 June 2019 these were as follows:
this Fund.
The fees for this Fund have reduced on 1 July 2020. Please refer to the latest PDS which details these estimated fees and charges to provide you with an indication for the year to 30 June 2021.
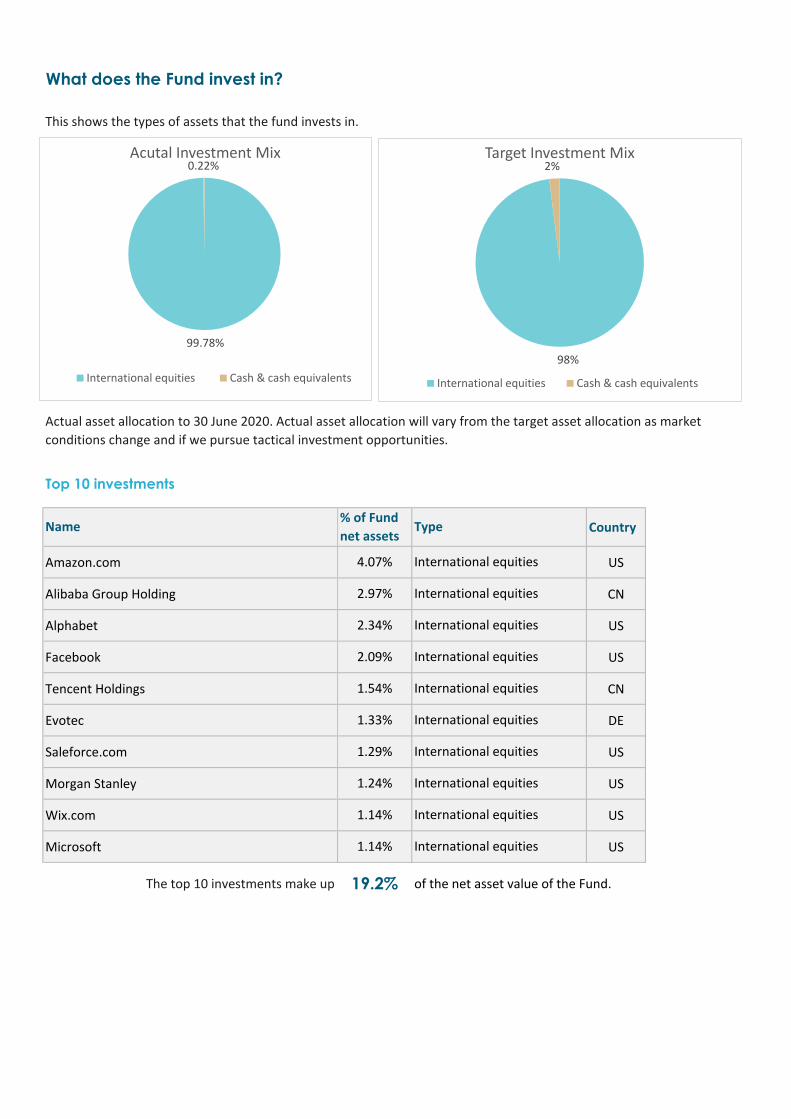
What does the Fund invest in?
This shows the types of assets that the fund invests in.
Top 10 investments
Country
Amazon.com US
Alibaba Group Holding CN
Alphabet US
Facebook US
Tencent Holdings CN
Evotec DE
Saleforce.com US
Morgan Stanley US
Wix.com US
Microsoft US
The top 10 investments make up of the net asset value of the Fund.19.2%
1.14% International equities
1.14% International equities
1.29% International equities
1.24% International equities
1.54% International equities
1.33% International equities
2.34% International equities
2.09% International equities
4.07% International equities
2.97% International equities
Actual asset allocation to 30 June 2020. Actual asset allocation will vary from the target asset allocation as market
conditions change and if we pursue tactical investment opportunities.
Name% of Fund
net assetsType
99.78%
0.22%Acutal Investment Mix
International equities Cash & cash equivalents
98%
2%Target Investment Mix
International equities Cash & cash equivalents

Key Personnel
Name
Further information
Notes:
1. Returns to 30 June 2020.
2. The bar chart shows fund returns after the deduction of fees and tax, however the market index returns are
shown before any fees or tax is deducted.
3. Other fees: these charges cover the general management of the Fund e.g. administration, Supervisor, legal,
and audit fees and costs required to comply with relevant legislation. These charges are based on the audited
financial statements for the Fund to 30 June 2019 and includes any applicable GST.
More information on these charges can be found in the PDS and the other material information document (OMI)
on the Disclose Register.
Hyperlinks to Harbour documents:
Links to the latest PDS, SIPO & OMI for the Harbour Funds can be found on the Harbour website:
https://www.harbourasset.co.nz/our-funds/investor-documents/
Current PositionTime in current
positionPrevious position
Time in previous
position
Andrew
Bascand
Managing Director &
Portfolio Manager
10 years & 6 months Senior Vice President &
Portfolio Manager, Alliance
Bernstein
10 Years
You can also obtain this information, the PDS for the T. Rowe Price Global Equity Growth Fund, and
some additional information from the offer register at www.business.govt.nz/disclose.

Harbour Investment Funds
What are the risks of investing?
Note that even the lowest category does not mean a risk-free investment, and there are other risks that
are not captured by this rating.
This risk indicator is not a guarantee of a fund's future performance. The risk indicator is based on the returns
data for the 5 years to 30 June 2020. While risk indicators are usually relatively stable, they do shift from time
to time. The risk indicator will continue to be updated in future fund updates.
See the Product Disclosure Statement (PDS) for more information about the risks associated with investing in this Fund.
Harbour Enhanced Cash Fund
Fund Updatefor the quarter ended 30 June 2020
This fund update was first made publicly available on 28 July 2020
Total value of the Fund (NZD) $158,036,974
The date the Fund started 1 August 2019
What is the purpose of this update?
This document tells you how the Harbour Enhanced Cash Fund has performed and what fees were charged. The
document will help you compare the Fund with other funds. Harbour Asset Management Limited prepared this update in
accordance with the Financial Markets Conduct Act 2013. This information is not audited and may be updated.
Description of this fund
The Harbour Enhanced Cash Fund is an actively managed portfolio that holds liquid money market securities, NZ
Government Stock, corporate bonds and bank deposits, all denominated in New Zealand Dollars. The Fund is designed to
earn a premium over 90 day bank bills, while aiming to avoid the volatility of traditional fixed interest funds. The
maximum permitted duration of the Fund is 2 years. The Fund maintains a core holding of highly liquid securities in order
to minimise transaction costs and facilitate investor cash flow requirements at short notice. The Fund also uses hedging
instruments to manage interest rate risk within prescribed limits.
Investment Objective: To outperform the benchmark of the portfolio by 85 basis points per annum over a rolling 3-
year period.
Benchmark:
A combination of Fund returns for the Harbour NZ Short Duration Fund (to 31 July 19) which transitioned into the Enhanced Cash Fund (on 1 August 19) have been used to determine the risk indicator for the Harbour Enhanced Cash Fund. The risk indicator may therefore provide a less reliable indicator of potential future volatility of this Fund.
The risk indicator is rated from 1 (low) to 7 (high). The rating reflects how much the value of the Fund's assets goes up and down. A higher risk generally means higher potential returns over time, but more ups and downs along the way. To help you clarify your own attitude to risk, you can seek financial advice or work out your risk profile at www.sorted.org.nz.
Harbour Investment Funds

How has the Fund performed?
What fees are investors charged?
Total fund charges (Inc. GST)
Which are made up of:
Total Performance-based fees
Example of how this applies to an investor
Small differences in fees and charges can have a big impact on your investment over the long term.
Jenny had $10,000 in the Harbour Enhanced Fund on 1 August 2019 (inception date) and did not make any further
contributions. At the end of 30 June 2020, Jenny received a return after fund charges were deducted of $191 (that is 1.91%
of her initial $10,000). This gives Jenny a total return after tax of $137 for the period 1 August 2019 to 30 June 2020.
Annual Return1 Not applicable
Past Year
(after deductions for charges and tax) (as Fund has not been running for a year)
Annual Return1 Not applicable
(after deductions for charges but before tax)(as Fund has not been running for a year)
Market index annual return1
1.20%(reflects no deduction for charges and tax)
% of net asset value
0.25%
Total management and administration 0.25%
Including-
Manager’s basic fee 0.16%
Other management and administration charges2 0.09%
0.00%
The market index annual return is based on the weighted average return of the market indices used to measure performance of the underlying fund. In this case the Market Index is the S&P/NZX Bank Bills 90-Day Index. Additional information about the market index is available on the offer register at www.business.govt.nz/disclose.
Investors in the Fund are charged fund charges. This Fund has not been open for a year. As such, below are estimates of fees to 30 June 2020:
Investors may also be charged individual action fees for specific actions or decisions (for example, for withdrawing from
or switching funds). See the PDS and Other Material Information Document OMI for more information about fees. Also
see the product disclosure statement for more information about the basis on which performance fees are charged.
Harbour Investment Funds

What does the Fund invest in?
This shows the types of assets that the fund invests in.
Top 10 investments
Country
NZ
NZ
NZ
NZ
NZ
NZ
NZ
NZ
NZ
NZ
The top 10 investments make up of the net asset value of the Fund.
AA
AA+
AA-
A-1+
AA-
AA-
New Zealand fixed interest
New Zealand fixed interest
Cash and cash equivalents
AA-
AA-
AA
New Zealand fixed interest
New Zealand fixed interest
New Zealand fixed interest
New Zealand fixed interest
New Zealand fixed interest
Actual asset allocation to 30 June 2020. Actual asset allocation will vary from the target asset allocation as market
conditions change and if we pursue tactical investment opportunities.
Name% of Fund net
assetsType Credit rating
NZ Government Stock 15/04/2023 5.50% 13.16%
ANZ Bank NZ Limited 22/03/2021 4.00% 6.87%
Auckland Council 12/08/2020 5.06%
Westpac NZ Limited 07/06/2022 3.775% 4.22%
Bank of New Zealand 27/07/2022 3.856% 4.11%
Westpac NZ Limited 28/04/21 3.795% 3.93%
ANZ Bank NZ Limited 01/09/2022 3.75% 3.88%
ANZ 28 A/C 3.87%
ASB Bank Deposit A/C 2/9/2020 3.83%
Kiwibank Deposit A/C 20/11/2020 3.17%
52.1%
Cash and cash equivalents A+
Cash and cash equivalents
72.15%
27.85%
Actual Investment Mix
NZ fixed interest Cash & cash equivalents
55%
45%
Target Investment Mix
NZ fixed interest Cash & cash equivalents
Harbour Investment Funds

Key Personnel
Name
Further information
Notes:
1. Returns to 30 June 2020.
2. Other fees: these charges cover the general management of the Fund e.g. administration, Supervisor, legal,
and audit fees and costs required to comply with relevant legislation. These charges are based on estimates
30 June 2020 and exclude any applicable GST.
More information on these charges can be found in the PDS and the other material information document
(OMI) on the Disclose Register.
Harbour documents:Links to the latest PDS, SIPO & OMI for the Harbour Investment Funds can be found on the Harbour website:
https://www.harbourasset.co.nz/our-funds/investor-documents/
Time in previous
positionCurrent PositionTime in current
positionPrevious position
George
Henderson
Portfolio Manager 11 Years & 6
months
9 years & 9 months
2 years & 0 months
AXA/Alliance Bernstein,
Head of Fixed Interest
Portfolio Manager, Royal
London Asset Management
16 years & 5
months
Mark Brown Director, Head of Fixed
Interest
You can also obtain this information, the PDS for the Harbour Enhanced Cash Fund, and some additional
information from the offer register at www.business.govt.nz/disclose.
Harbour Investment Funds

Harbour Investment Funds
What are the risks of investing?
Note that even the lowest category does not mean a risk-free investment, and there are other risks that
are not captured by this rating.
This risk indicator is not a guarantee of a fund's future performance. The risk indicator is based on the returns
data for the 5 years to 30 June 2020. While risk indicators are usually relatively stable, they do shift from time
to time. The risk indicator will continue to be updated in future fund updates.
See the Product Disclosure Statement (PDS) for more information about the risks associated with investing in this Fund.
The date the Fund started 24 May 2011
Total value of the Fund (NZD) $178,200,780
Harbour NZ Core Fixed Interest Fund
Fund Updatefor the quarter ended 30 June 2020
This fund update was first made publicly available on 28 July 2020
What is the purpose of this update?
This document tells you how the Harbour NZ Core Fixed Interest Fund has performed and what fees were charged. The
document will help you compare the Fund with other funds. Harbour Asset Management Limited prepared this update in
accordance with the Financial Markets Conduct Act 2013. This information is not audited and may be updated.
Description of this fund
The Fund is an actively managed investment grade bond fund that invests mainly in New Zealand Government and corporate bond fixed interest securities.
Investment Objective: The investment objective of the Fund is to outperform the benchmark by 100 basis points per
annum over a rolling three year period.
Benchmark: Bloomberg NZ Bond Composite 0+Yr Index
The risk indicator is rated from 1 (low) to 7 (high). The rating reflects how much the value of the Fund's assets goes up and down. A higher risk generally means higher potential returns over time, but more ups and downs along the way. To help you clarify your own attitude to risk, you can seek financial advice or work out your risk profile at www.sorted.org.nz.
1 |Harbour Investment Funds

How has the Fund performed? since the Fund started, up to 30 June 20.
Market index returns do not include any tax, expenses or charges.
Annual Return1
What fees are investors charged?
Total fund charges (Inc. GST)
Which are made up of:
Including-
Manager’s basic fee
Other management and
administration charges3
Total Performance-based fees
Annual Return Graph2 Including-
Manager’s basic fee
Other management and
administration charges3 0
Annual Return Graph Total Performance-based feesExample of how this applies to an investor
Jenny had $10,000 in the Harbour NZ Core Fixed Interest Fund
Fund at the start of the year and did not make any further
contributions. At the end of the year, Jenny received a return,
after fund charges were deducted, of $458 (that is 4.58% of
her initial $10,000). This gives Jenny a total return after tax of
$331 for the year.
This shows the return after Fund charges and tax for
each year ending 31 March since the Fund started.
4.64% 4.58%(after deductions for charges
but before tax)% of net asset value
Market index annual
return1
5.13% 5.36%
0.65%
0.54%
0.11%
0.00%
The last bar shows the annualised annual return
Small differences in fees and charges can have a big impact on
your investment over the long term.
Investors may also be charged individual action fees for specific
actions or decisions (for example, for withdrawing from or
switching funds). See the PDS and Other Material Information
Document (OMI )for more information about fees.
(reflects no deduction for
charges and tax)
Total management and
administration0.65%
3.32% 3.31%(after deductions for charges
and tax)
Annual Return1
Important: This does not tell you how the Fund will perform in
the future. Returns in this update are after tax at the highest
prescribed investor rate (PIR) of tax for an individual New
Zealand resident. Your tax may be lower.
Average
over past
5 years
Past Year
The market index annual return is based on the weighted average return of the market indices used to measure performance of the underlying fund. In this case the Market Index is a combination of Bloomberg NZ Bond Composite 0+Yr Index (from 1-1-19 current Index) and 50:50 weighted average of the S&P/NZX Government Bond Index and S&P/NZX A Grade Corporate Bond Total Return Index. Additional information about the market index is available on the offer register at www.business.govt.nz/disclose.
Investors in the Fund are charged fund charges. In the year to 30 June 2019 these were as follows:
0.6
3%
5.1
5%
4.7
2%
1.5
2% 3
.07
%
3.8
0%
2.3
9% 3.5
1%
0.4
8%
8.7
5%
6.5
1%
2.0
5%
4.6
4%
6.6
3%
4.7
2%
5.4
0%
0.0%
1.0%
2.0%
3.0%
4.0%
5.0%
6.0%
7.0%
8.0%
9.0%
10.0%
31/0
3/20
14
31/0
3/20
15
31/0
3/20
16
31/0
3/20
17
31/0
3/20
18
31/0
3/20
19
31/0
3/20
20
Ave
rage
an
nu
al r
etu
rnsi
nce
ince
pti
on
Harbour NZ Core Fixed Interest Fund Market Index
2 |Harbour Investment Funds

What does the Fund invest in?
This shows the types of assets that the fund invests in.
Top 10 investments
Country Credit Rating
NZ Government Stock 20/04/2029 3.00% NZ
NZ Government Stock 15/05/2031 1.50% NZ
NZGS Index Linked Bond 20/09/2025 2.00% NZ
NZ Government Stock 15/04/2023 5.50% NZ
NZ Government Stock 15/04/2025 2.75% NZ
NZ Government Stock 14/04/2033 3.50% NZ
NZ Government Stock 15/05/2024 0.50% NZ
NZGS Index Linked Bond 3.00% 20/09/2030 NZ
Housing New Zealand Ltd 24/04/30 2.183% NZ
NZ Local Gov Fund Agency 20/04/29 1.50% NZ
The top 10 investments make up of the net asset value of the Fund.
New Zealand fixed interest1.41%
1.30% AA+
AA+
New Zealand fixed interest
54.7%
AA+
9.34%
8.09%
5.74%
5.68%
New Zealand fixed interest
New Zealand fixed interest
New Zealand fixed interest
New Zealand fixed interest
Name% of Fund
net assetsType
New Zealand fixed interest
Actual asset allocation to 30 June 2020. Actual asset allocation will vary from the target asset allocation as market
conditions change and if we pursue tactical investment opportunities.
AA+16.49%
New Zealand fixed interest
AA+
AA+1.97%
New Zealand fixed interest
1.73% AA+
New Zealand fixed interest
2.99%
AA+
AA+
AA+
92.48%
3.63%3.89%
Actual Investment Mix
NZ fixed interest International fixed interest
Cash & cash equivalents
85%
10%5%
Target Investment Mix
NZ fixed interest International fixed interest
Cash & cash equivalents
3 |Harbour Investment Funds

Key Personnel
Name
Further information
Notes:
1. Returns to 30 June 2020.
2. The bar chart shows fund returns after the deduction of fees and tax, however the market index returns are
shown before any fees or tax is deducted.
3. Other fees: these charges cover the general management of the Fund e.g. administration, Supervisor, legal,
and audit fees and costs required to comply with relevant legislation. These charges are based on the audited
financial statements for the Fund to 30 June 2019 and includes any applicable GST.
More information on charges can be found in the PDS and the other material information document (OMI) on the
Disclose Register.
Hyperlinks to Harbour documents:
Links to the latest PDS, SIPO & OMI for the Harbour Funds can be found on the Harbour website:
https://www.harbourasset.co.nz/our-funds/investor-documents/
Director,
Head of Fixed Income
George
Henderson
2 years & 0 months Portfolio Manager, Royal
London Asset
Management
11 years & 6
months
Portfolio Manager
16 years & 5
months
9 years & 9 months AXA/Alliance Bernstein,
Head of Fixed Interest
Time in previous
positionTime in current position Previous position
Mark Brown
Current Position
You can also obtain this information, the PDS for the Harbour NZ Core Fixed Interest Fund, and some
additional information from the offer register at www.business.govt.nz/disclose.
4 |Harbour Investment Funds

Harbour Investment Funds
What are the risks of investing?
Note that even the lowest category does not mean a risk-free investment, and there are other risks that
are not captured by this rating.
This risk indicator is not a guarantee of a fund's future performance. The risk indicator is based on the returns
data for the 5 years to 30 June 2020. While risk indicators are usually relatively stable, they do shift from time to time. The risk indicator will continue to be updated in future fund updates.
See the Product Disclosure Statement (PDS) for more information about the risks associated with investing in this Fund.
Total value of the Fund (NZD) $13,505,737
Harbour Real Estate Investment Fund
Fund Updatefor the quarter ended 30 June 2020
This fund update was first made publicly available on 28 July 2020
1 October 2018The date the Fund started
What is the purpose of this update?
This document tells you how the Harbour Real Estate Investment Fund has performed and what fees were charged. The
document will help you compare the Fund with other funds. Harbour Asset Management Limited prepared this update in
accordance with the Financial Markets Conduct Act 2013. This information is not audited and may be updated.
Description of this fund
The Fund aims to capture the income yield and medium-term capital growth characteristics of investing principally in listed real estate assets and enhance diversification and return potential against the benchmark.
Investment Objective: To exceed the benchmark return plus 1% per annum over the medium term
Benchmark: S&P/NZX All Real Estate Index.
The risk indicator is rated from 1 (low) to 7 (high). The rating reflects how much the value of the Fund's assets goes up and down. A higher risk generally means higher potential returns over time, but more ups and downs along the way. To help you clarify your own attitude to risk, you can seek financial advice or work out your risk profile at
A combination of actual Fund returns and Market Index returns have been used to determine the risk indicator for the Harbour Real Estate Investment Fund (inception 1 October 2018), as the Fund has not been operational for the required 5 years. The risk indicator may therefore provide a less reliable indicator of potential future volatility of this Fund.
1 | Harbour Investment Funds

How has the Fund performed?
Annual Return1
What fees are investors charged?
% of net asset value
Total fund charges (Inc. GST)
Which are made up of:
Including-
Manager’s basic fee
Other management and
administration charges3
Annual Return Graph2
Including-Total Performance-based fees
Manager’s basic fee
Other management and
administration charges3 0
Annual Return Graph Total Performance-based fees
Example of how this applies to an investor
Jenny had $10,000 in the Harbour Real Estate Investment Fund at
the start of the year and did not make any further contributions. At
the end of the year, Jenny received a return, after fund charges
were deducted of -$400 (that is -4.00% of her initial $10,000). This
gives Jenny a total return after tax of -$454 for the year.
This shows the return after Fund charges and tax
for each year ending 31 March since the Fund
started.
since the Fund started, up to 30 June 20.
Market Index returns do not include any tax,
expenses or charges.
Past Year
-4.54%(after deductions for charges
and tax)
Annual Return1
-4.00%(after deductions for charges
but before tax)
0.55%
0.17%
Investors in the Fund are charged fund charges. This Fund has not
been open for a year to 30 June 2019. As such, below are
estimates of fees to 30 June 2020:
0.00%
The last bar shows the annualised annual return
Market index annual
return1
-7.71%(reflects no deduction for
charges and tax)0.72%
Total management and
administration0.72%
The market index annual return is based on the weighted average return of the market indices used to measure performance of the underlying fund. In this case the Market Index is the S&P/NZX All Real Estate Index. Additional information about the market index is available on the offer register at www.business.govt.nz/disclose.
Investors may also be charged individual action fees for specific
actions or decisions (for example, for withdrawing from or
switching funds). See the PDS and Other Material Information
Document OMI for more information about fees.
Important: This does not tell you how the Fund will perform in the future. Returns in this update are after tax at the highest prescribed investor rate (PIR) of tax for an individual New Zealand resident. Your tax may be lower.
-6.66%
8.94%
-2.89%
8.54%
-8.0%
-6.0%
-4.0%
-2.0%
0.0%
2.0%
4.0%
6.0%
8.0%
10.0%
31
/03
/20
20
Ave
rage
an
nu
al r
etu
rn s
ince
ince
pti
on
Real Estate Investment Fund
Market Index
Small differences in fees and charges can have a big impact on
your investment over the long term.
2 | Harbour Investment Funds

What does the Fund invest in?
This shows the types of assets that the fund invests in.
Top 10 investments
The top 10 investments make up 86.4% of the net asset value of the Fund.
Actual asset allocation to 30 June 2020. Actual asset allocation will vary from the target asset allocation as market
conditions change and if we pursue tactical investment opportunities.
Country
NZ
Listed property
Name
9.53%
% of Fund net assets Type
Listed property
Listed property
Listed property
Goodman Property Trust NZ
NZ
Precinct Properties NZ 16.02%
12.17%
11.59%
NZ
NZ
NZ
Argosy Property
Listed property
9.42%
5.52%
Listed property
Listed propertyVital Healthcare Property
Augusta Capital
Stride Property
Goodman Group
Investore Property
8.99%
5.63% Listed property
Listed property
NZ
NZ
NZ
3.46%
4.08%
AUListed property
Property For Industry
Kiwi Property Group
94.73%
4.05% 1.22%
Actual Investment Mix
Listed property Unlisted property
Australasian Equities Cash & Cash Equivalents
85%
12.50%2.50%
Target Investment Mix
Listed property Australasian Equities
Cash & Cash Equivalents
3 | Harbour Investment Funds
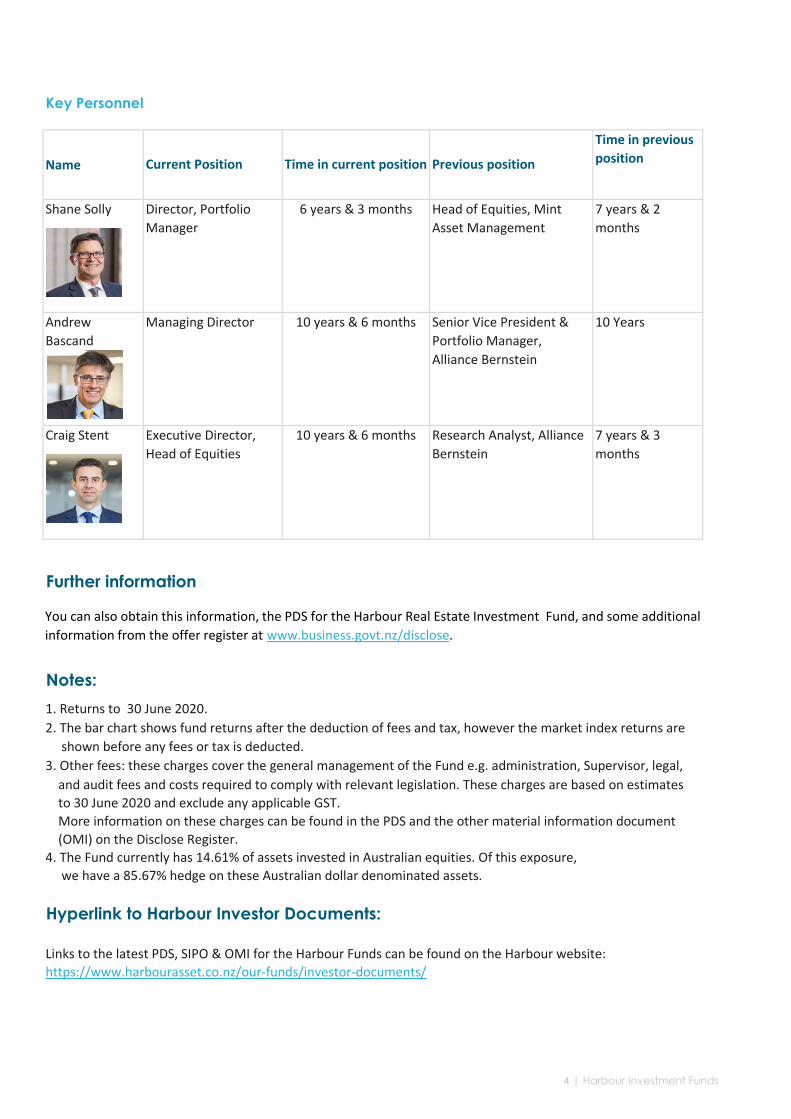
Key Personnel
Name
Further information
Notes:
1. Returns to 30 June 2020.
2. The bar chart shows fund returns after the deduction of fees and tax, however the market index returns are
shown before any fees or tax is deducted.
3. Other fees: these charges cover the general management of the Fund e.g. administration, Supervisor, legal,
and audit fees and costs required to comply with relevant legislation. These charges are based on estimates
to 30 June 2020 and exclude any applicable GST.
More information on these charges can be found in the PDS and the other material information document
(OMI) on the Disclose Register.
4. The Fund currently has 14.61% of assets invested in Australian equities. Of this exposure,
we have a 85.67% hedge on these Australian dollar denominated assets.
Hyperlink to Harbour Investor Documents:
Links to the latest PDS, SIPO & OMI for the Harbour Funds can be found on the Harbour website:
https://www.harbourasset.co.nz/our-funds/investor-documents/
6 years & 3 months
10 years & 6 months
10 years & 6 months
Shane Solly
Craig Stent
Andrew
Bascand
Current Position
Managing Director
Director, Portfolio
Manager
Executive Director,
Head of Equities
Time in previous
positionTime in current position Previous position
Head of Equities, Mint
Asset Management
Research Analyst, Alliance
Bernstein
Senior Vice President &
Portfolio Manager,
Alliance Bernstein
7 years & 3
months
7 years & 2
months
10 Years
You can also obtain this information, the PDS for the Harbour Real Estate Investment Fund, and some additional
information from the offer register at www.business.govt.nz/disclose.
4 | Harbour Investment Funds
Harbour Investment Funds
What are the risks of investing?
Note that even the lowest category does not mean a risk-free investment, and there are other risks that are not
captured by this rating.
This risk indicator is not a guarantee of a fund's future performance. The risk indicator is based on the returns
data for the 5 years to 30 June 2020. While risk indicators are usually relatively stable, they do shift from time
to time. The risk indicator will continue to be updated in future fund updates.
See the Product Disclosure Statement (PDS) for more information about the risks associated with investing in this Fund.
Harbour Active Growth Fund
Fund Updatefor the quarter ended 30 June 2020
This fund update was first made publicly available on 28 July 2020
Total value of the Fund (NZD) $7,222,587
The date the Fund started 1 November 2019
What is the purpose of this update?
This document tells you how the Harbour Active Growth Fund has performed and what fees were charged. The document
will help you compare the Fund with other funds. Harbour Asset Management Limited prepared this update in
accordance with the Financial Markets Conduct Act 2013. This information is not audited and may be updated.
Description of this fundThe Fund is designed to provide investors with exposure to a wide range of domestic and global assets. The Fund invests
approximately two thirds in growth assets such as shares, property and infrastructure and approximately one third into
more defensive assets, predominantly investment grade bonds. The Manager will use active management to enhance
returns and manage downside risks.
Investment Objective: The objective is to exceed the Official Cash Rate (OCR) plus 5% over rolling 5-year periods.
Benchmark: 5% S&P/NZX Bank Bills 90-day Index, 25% Bloomberg Composite 0+ Yr Index, 10% S&P/NZX All Real Estate
Index, 22.5% S&P/NZX 50 Index, 7.5% S&P/ASX 200 Index (50% hedged to NZD), 30% MSCI All Country World Index
(unhedged).
A combination of actual Fund returns and market index returns have been used to determine the risk indicator for the Harbour Active Growth Fund (inception 1 November 2019), as the Fund has not been operational for the required 5 years. The risk indicator may therefore provide a less reliable indicator of potential future volatility of this Fund.
The risk indicator is rated from 1 (low) to 7 (high). The rating reflects how much the value of the Fund's assets goes up and down. A higher risk generally means higher potential returns over time, but more ups and downs along the way. To help you clarify your own attitude to risk, you can seek financial advice or work out your risk profile at www.sorted.org.nz.
1 | Harbour Investment Funds

How has the Fund performed?
What fees are investors charged?
Total fund charges (Inc. GST)
Which are made up of:
Total Performance-based fees
The above performance fee estimate relates to the Harbour Active Growth Fund's investment in the Harbour Long Short Fund.
Example of how this applies to an investor
Small differences in fees and charges can have a big impact on your investment over the long term.
Jenny had $10,000 in the Harbour Active Growth Fund on 1 November 2019 (inception date) and did not make any
further contributions. At the end of June 2020, Jenny received a return after fund charges were deducted of
$696 (that is 6.96% of her initial $10,000). This gives Jenny a total return after tax of $645 for the period
1 November 2019 to 30 June 2020.
Including-
Manager’s basic fee 0.77%
Other management and administration charges2 0.18%
Annual Return1
na(after deductions for charges but before tax)
Market index annual return1
4.67%(reflects no deduction for charges and tax)
% of net asset value
0.99%
Total management and administration 0.99%
0.04%
Annual Return1
na(after deductions for charges and tax)
The performance fee is an estimate based on data to 30 June 2020. We estimate a performance fee of 0.04% may be payable for the
year ending 31 December 2020. This is subject to change (up or down) depending on relative performance within the Long Short
Fund for the remainder of the calendar year for 2020. See OMI for more information on how performance fees are charged.
Investors in the Fund are charged fund charges. This Fund has not been open for a year to 30 June 2019. As such, below are
estimates of fees to 30 June 2020.
Past Year
The market index annual return is based on the weighted average return of the market indices used to measure performance of the underlying fund. In this case the Market Index is the 5% S&P/NZX Bank Bills 90-day Index, 25% Bloomberg Composite 0+ Yr Index, 10% S&P/NZX All Real Estate Index, 22.5% S&P/NZX 50 Index, 7.5% S&P/ASX 200 Index (50% hedged to NZD), 30% MSCI All Country World Index (unhedged). Additional information about the market index is available on the offer register at www.business.govt.nz/disclose.
Investors may also be charged individual action fees for specific actions or decisions (for example, for withdrawing from
or switching funds). See the PDS and Other Material Information Document OMI for more information about fees. Also
see the product disclosure statement for more information about the basis on which performance fees are charged.
2 | Harbour Investment Funds

What does the Fund invest in?
This shows the types of assets that the fund invests in.
Top 10 investments
Country
NZ
Baillie Gifford World Wide Discovery Fund IE
NZ
iShares MSCI EMU ESG Screened UCITS ETF IE
NZ Government Stock 20/04/2029 3.00% NZ
The A2 Milk Company Limited NZ
Premia CSI Caixin China New Economy ETF HK
Macquarie Margin AUD AU
Mainfreight Limited NZ
Summerset Group Ltd NZ
The top 10 investments make up of the net asset value of the Fund.
5.95% International fixed interest First State Investments Global Listed
Infrastructure PIE
7.94% International equities
Actual asset allocation to 30 June 2020. Actual asset allocation will vary from the target asset allocation as market
conditions change and if we pursue tactical investment opportunities.
Name
ANZ cash account
1.66% Australasian equities
40.6%
2.22% Cash and cash equivalents
1.99% Australasian equities
2.89% Australasian equities
2.40% International equities
3.73% International equities
2.91% New Zealand fixed interest
8.92% Cash and cash equivalents
% of Fund
net assetsType
5.0%
25.0%
30.0%
30.0%
10.0%
Target Investment Mix
Cash and cash equivalents New Zealand fixed interestInternational fixed interest Australasian equitiesInternational equities Listed propertyUnlisted property
6.9%
17.7%
22.2%32.0%
6.4%
14.8%
Actual Investment Mix
Cash and cash equivalents New Zealand fixed interestInternational fixed interest Australasian equitiesInternational equities Listed propertyOther
3 | Harbour Investment Funds

Key Personnel
Name
Further information
Notes:
1. Returns to 30 June 2020.
2. The bar chart shows fund returns after the deduction of fees and tax, however the market index returns are
shown before any fees or tax is deducted.
3. Other fees: these charges cover the general management of the Fund e.g. administration, Supervisor, legal,
and audit fees and costs required to comply with relevant legislation. These charges are based on estimates
to 30 June 2020 and exclude any applicable GST.
More information on these charges can be found in the PDS and the other material information document
(OMI) on the Disclose Register.
Hyperlink to Harbour Investor Documents:
Links to the latest PDS, SIPO & OMI for the Harbour Funds can be found on the Harbour website:
https://www.harbourasset.co.nz/our-funds/investor-documents/
Chris Di Leva Multi Asset Specialist 1 years and 9 months Mercer- Portfolio Manager 8 Years & 0
months
Current PositionTime in current
positionPrevious position
Time in previous
position
You can also obtain this information, the PDS for the Harbour Active Growth Fund, and some additional information from
the offer register at www.business.govt.nz/disclose.
4 | Harbour Investment Funds

Harbour Investment Funds
What are the risks of investing?
Note that even the lowest category does not mean a risk-free investment, and there are other risks that are not
captured by this rating.
This risk indicator is not a guarantee of a fund's future performance. The risk indicator is based on the returns
data for the 5 years to 30 June 2020. While risk indicators are usually relatively stable, they do shift from time
to time. The risk indicator will continue to be updated in future fund updates.
See the Product Disclosure Statement (PDS) for more information about the risks associated with investing in this Fund.
Total value of the Fund (NZD) $129,014,579
Harbour Income Fund
Fund Updatefor the quarter ended 30 June 2020
This fund update was first made publicly available on 28 July 2020
The date the Fund started 28 October 2015
What is the purpose of this update?
This document tells you how the Harbour Income Fund has performed and what fees were charged. The document will
help you compare the Fund with other funds. Harbour Asset Management Limited prepared this update in accordance
with the Financial Markets Conduct Act 2013. This information is not audited and may be updated.
Description of this fund
The Fund is designed to give a favourable level of income. The Fund invests predominantly in New Zealand investment grade fixed interest securities and Australasian equities which pay a sustainable dividend yield. Other tools, such as activemanagement and scope to invest in sub investment grade securities may also be used to enhance returns.
Investment Objective: The investment objective of the Fund is to exceed the Official Cash Rate (OCR) plus 3.5% pa
over rolling three year periods.
Benchmark: 68% S&P/NZX A Grade Corporate Bond Total Return Index; 16% S&P/ASX200 Industrials Index (100%
hedged to NZ dollars); and 16% S&P/NZX Portfolio Index.
A combination of actual Fund returns and market index returns have been used to determine the risk indicator for the Harbour Income Fund (inception 28 October 2015), as the Fund has not been operational for the required 5 years. The risk indicator may therefore provide a less reliable indicator of potential future volatility of this Fund.
The risk indicator is rated from 1 (low) to 7 (high). The rating reflects how much the value of the Fund's assets goes up and down. A higher risk generally means higher potential returns over time, but more ups and downs along the way. To help you clarify your own attitude to risk, you can seek financial advice or work out your risk profile at www.sorted.org.nz.
1 | Harbour Investment Funds
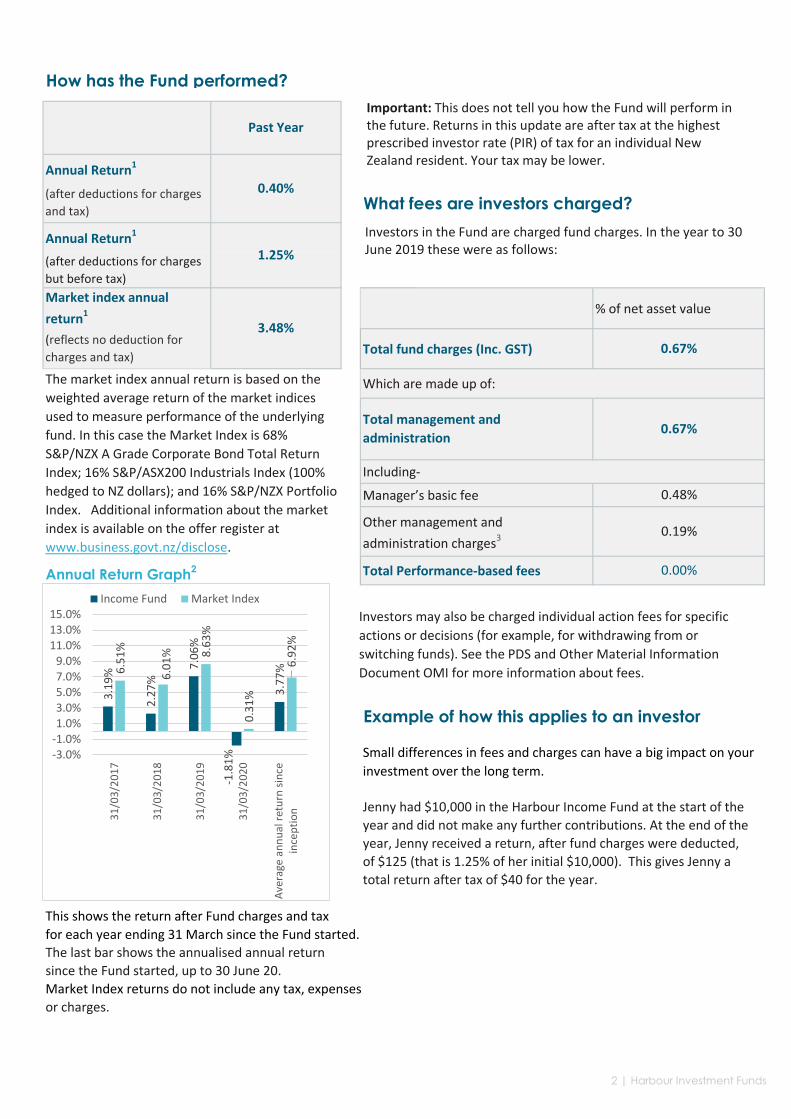
How has the Fund performed?
Annual Return1
What fees are investors charged?
% of net asset value
Total fund charges (Inc. GST)
Which are made up of:
Including-
Manager’s basic fee
Other management and
administration charges3
Annual Return Graph2
Including-Total Performance-based fees
Manager’s basic fee
Other management and
administration charges3 0
Annual Return Graph Total Performance-based fees
Example of how this applies to an investor
Jenny had $10,000 in the Harbour Income Fund at the start of the
year and did not make any further contributions. At the end of the
year, Jenny received a return, after fund charges were deducted,
of $125 (that is 1.25% of her initial $10,000). This gives Jenny a
total return after tax of $40 for the year.
This shows the return after Fund charges and tax
for each year ending 31 March since the Fund started.
The last bar shows the annualised annual return
since the Fund started, up to 30 June 20.
Market Index returns do not include any tax, expenses
or charges.
(after deductions for charges
and tax)
Annual Return1
(after deductions for charges
but before tax)
Market index annual
return1
(reflects no deduction for
charges and tax)
Small differences in fees and charges can have a big impact on your
investment over the long term.
The market index annual return is based on the
weighted average return of the market indices
used to measure performance of the underlying
fund. In this case the Market Index is 68%
S&P/NZX A Grade Corporate Bond Total Return
Index; 16% S&P/ASX200 Industrials Index (100%
hedged to NZ dollars); and 16% S&P/NZX Portfolio
Index. Additional information about the market
index is available on the offer register at
www.business.govt.nz/disclose.
0.67%
0.67%
0.48%
0.19%
0.00%
Past Year
0.40%
1.25%
3.48%
Total management and
administration
Investors may also be charged individual action fees for specific
actions or decisions (for example, for withdrawing from or
switching funds). See the PDS and Other Material Information
Document OMI for more information about fees.
Important: This does not tell you how the Fund will perform in the future. Returns in this update are after tax at the highest prescribed investor rate (PIR) of tax for an individual New Zealand resident. Your tax may be lower.
3.1
9%
2.2
7%
7.0
6%
-1.8
1%
3.7
7%6.5
1%
6.0
1% 8
.63
%
0.3
1%
6.9
2%
-3.0%-1.0%1.0%3.0%5.0%7.0%9.0%
11.0%13.0%15.0%
31
/03
/20
17
31
/03
/20
18
31
/03
/20
19
31
/03
/20
20
Ave
rage
an
nu
al r
etu
rn s
ince
ince
pti
on
Income Fund Market Index
Investors in the Fund are charged fund charges. In the year to 30 June 2019 these were as follows:
2 | Harbour Investment Funds

What does the Fund invest in?
This shows the types of assets that the fund invests in.
Top 10 investments
Country Credit Rating
NZ
NZ Government Stock 15/04/2037 2.75% NZ
NZGS Index Linked Bond 20/09/2030 3.00% NZ
NZ Government Stock 15/05/2031 1.50% NZ
NZGS Index Linked Bond 20/09/2025 2.00% NZ
Revolution Private Debt Fund II AU
Australian Government 21/11/22 2.25% AU
Contact Energy Limited NZ
NZ Government Stock 15/04/2025 2.75% NZ
Spark New Zealand Limited NZ
The top 10 investments make up of the net asset value of the Fund.
ANZ cash A/C AA
Actual asset allocation to 30 June 2020. Actual asset allocation will vary from the target asset allocation as market
conditions change and if we pursue tactical investment opportunities.
Name% of Fund
net assetsType
8.65% Cash and cash equivalents
3.25% New Zealand fixed interest AA+
3.18% New Zealand fixed interest AA+
2.96% New Zealand fixed interest AA+
2.81% New Zealand fixed interest AA+
2.61% International fixed interest
2.44% International fixed interest AAA
2.23% Australasian equities
1.99% International fixed interest AA+
1.88% Australasian equities
32.0%
32.0%
50.0%
8.0%10.0%
Target Investment Mix
Australasian Equities NZ Fixed Interest
International Equities Cash & cash equivalents
International fixed interest
19.3%
44.2%2.0%
10.6%
16.7%
7.2%
Actual Investment Mix
Australasian Equities NZ Fixed Interest
International Equities Cash & cash equivalents
International fixed interest Listed property
3 | Harbour Investment Funds
Key Personnel
Name
Further information
Notes:
1. Returns to 30 June 2020.
2. The bar chart shows fund returns after the deduction of fees and tax, however the market index returns are
shown before any fees or tax is deducted.
3. Other fees: these charges cover the general management of the Fund e.g. administration, Supervisor, legal,
and audit fees and costs required to comply with relevant legislation. These charges are based on audited
financial statements to 30 June 2019 and includes any applicable GST.
More information on these charges can be found in the PDS and the other material information document (OMI)
on the Disclose Register.
Hyperlinks to Harbour documents:
Links to the latest PDS, SIPO & OMI for the Harbour Funds can be found on the Harbour website:
https://www.harbourasset.co.nz/our-funds/investor-documents/
Current PositionTime in current
positionPrevious position
Time in previous
position
AXA/Alliance Bernstein,
Head of Fixed Interest
16 years & 5
months
Craig Stent Executive Director &
Head of Equities
10 years and 6
months
Alliance Bernstein, Research
Analyst
7 years & 3
months
Mark Brown Director, Head of Fixed
Income
9 years and 9 months
You can also obtain this information, the PDS for the Harbour Income Fund, and some additional
information from the offer register at www.business.govt.nz/disclose.
4 | Harbour Investment Funds