hapter 15: climate change 15 - 6 estimated current and future 100-year coastal flood risk areas...
TRANSCRIPT
SANTA CRUZ INTEGRATED REGIONAL WATER MANAGEMENT PLAN UPDATE 2014
C15-1 Ver. 7.21.2014
CHAPTER 15: CLIMATE CHANGE
CONTENTS 15.1 Climate Projections ........................................................................................................................... 4
15.2 Climate Change Impacts to the Santa Cruz IRWM Region ................................................................ 5
15.3 Vulnerability .................................................................................................................................... 15
15.3.1 Water Supply ........................................................................................................................... 17
15.3.2 Water Quality .......................................................................................................................... 19
15.3.3 Aquatic Ecosystems ................................................................................................................. 19
15.3.4 Flood / Stormwater Management .......................................................................................... 21
15.3.5 Sea Level Rise .......................................................................................................................... 21
15.4 The Value of Natural Habitat .......................................................................................................... 24
15.5 Regional Mitigation Strategies ........................................................................................................ 25
15.6 Regional Adaptation Strategies ...................................................................................................... 28
15.7 Future Efforts .................................................................................................................................. 30
FIGURES Figure 15 - 1 GHG Emissions Forecasts ......................................................................................................... 4
Figure 15 - 2 Change in Precipitation and Air Temperature through the year 2100 .................................... 7
Figure 15 - 3 Change in Recharge ................................................................................................................. 8
Figure 15 - 4 Precipitation, Evapotranspiration, Recharge, and Runoff ..................................................... 10
Figure 15 - 5 Climatic Water Deficit ............................................................................................................ 11
Figure 15 - 6 Estimated Current and Future 100-year Coastal Flood Risk Areas around Santa Cruz ......... 23
Figure 15 - 7 Percent of the Coast Most Exposed to Coastal Hazards ........................................................ 25

CHAPTER 15: Climate Change
SANTA CRUZ INTEGRATED REGIONAL WATER MANAGEMENT PLAN UPDATE 2014
C15-2 Ver. 7.21.2014
TABLES
Table 15 - 1 Climate Change Confidence Ranking Scale ............................................................................... 5
Table 15 - 2 Relative sea level rise projections for the San Francisco Bay ................................................. 12
Table 15 - 3 Projected Climate Changes for the Santa Cruz Region ........................................................... 13
Table 15 - 4 Projected Hydrologic Changes for the Santa Cruz Region ...................................................... 13
Table 15 - 5 Scoring Definitions for Sensitivity to Climate Change Impacts ............................................... 15
Table 15 - 6 Scoring Definitions for Adaptive Capacity to Climate Change Impacts .................................. 16
Table 15 - 7 Vulnerability Ranking Matrix ................................................................................................... 16
Table 15 - 8 Ranking Scale Used to Communicate General Confidence in a Number of Future Climate
Change Projections .................................................................................................................. 17
Table 15 - 9 Vulnerability Assessment of Water Supply Key Attributes ..................................................... 18
Table 15 - 10 Vulnerability Assessment of Aquatic Ecosystem Management Key Attributes .................... 20
Table 15 - 11 Vulnerability Assessment of Flood and Stormwater Management Key Attributes .............. 21
Table 15 - 12 Populations Vulnerable to Flood and Erosion from Sea Level Rise ...................................... 22
Table 15 - 13 AB 32 Scoping Plan Water Sector Mitigation Measures ....................................................... 26

CHAPTER 15: Climate Change
SANTA CRUZ INTEGRATED REGIONAL WATER MANAGEMENT PLAN UPDATE 2014
C15-3 Ver. 7.21.2014
The term climate change refers to any significant change in measures of climate (precipitation, temperature, winds), though the term is generally associated with an average increase in temperature and referred to as global warming. There is scientific consensus that the temperature of the earth’s climate has been increasing more than natural climatic cycles can explain and that this warming is due to human activities.1,2 The first 12 years of this century (2001–2012) rank among the 14 warmest in the 133-year period of recorded history3. Recent studies and planning efforts conducted by the State of California include projections for increased temperatures, sea level rise, reduced snowpack, altered precipitation patterns and more frequent and severe storm events. These impacts are already occurring and will further impact agricultural productivity, increase wildfire risk, decrease water supply, and impact public health and ecosystem function.4 In 2008, the California Department of Water Resources stated:
“Warmer temperatures, altered patterns of precipitation and runoff, and rising sea levels are increasingly compromising the ability to effectively manage water supplies, floods and other natural resources. Adapting California’s water management system in response to climate change presents one of the most significant challenges of this century.”5
Water managers in the Santa Cruz IRWM Region realized the potential impact that climate change could have on local water resources. A Proposition 50 IRWM Grant funded a study by the United States Geological Survey (USGS) to characterize potential climate change impacts on the Region. The study used global climate change models, local geologic, soils, and runoff data along with recent advances in downscaling to model potential impacts to the Region. In addition, the Santa Cruz IRWM Region worked with a group of scientists from the Natural Capital Project to assess the Region’s vulnerabilities to projected sea level rise along with adaptation and mitigation strategies. The potential impacts of these future climatic and hydrologic changes were evaluated in the context of each of the IRWM functional areas to identify opportunities for adaptation to reduce the vulnerability of water supply, water quality, aquatic ecosystems, and flood hazards in the region. In some instances projected changes may dramatically exacerbate the severity of local water issues, thus providing additional justification for the implementation of effective strategies now. Integration of climate change impacts into the IRWM conceptual framework can allow planners to take those into account in developing projects that will reduce the vulnerability of local systems to droughts, extreme temperatures, and rainfall pattern changes.
1 IPCC. 2007. IPCC Fourth Assessment Report: Working Group II Report (Technical Summary), Available from:
http://www.ipcc.ch/pdf/assessment‐report/ar4/wg2/ar4‐wg2‐ts.pdf 2 Oreskes, N. 2004. Beyond the Ivory Tower: The Scientific Consensus on Climate Change". Science 306 (5702):
1686. doi:10.1126/science.1103618. PMID 15576594. 3 NASA, 2013. Hansen, J. and M. Sato, R. Ruedy.. Global Temperature Update Through 2012.
http://www.nasa.gov/pdf/719139main_2012_GISTEMP_summary.pdf 4State of California. 2012. California Climate Adaptation Planning Guide.
5 California Department of Water Resources. 2008. Managing an Uncertain Future: Climate Change Adaptation
Strategies for California’s Water.
CHAPTER 15: Climate Change
SANTA CRUZ INTEGRATED REGIONAL WATER MANAGEMENT PLAN UPDATE 2014
C15-4 Ver. 7.21.2014
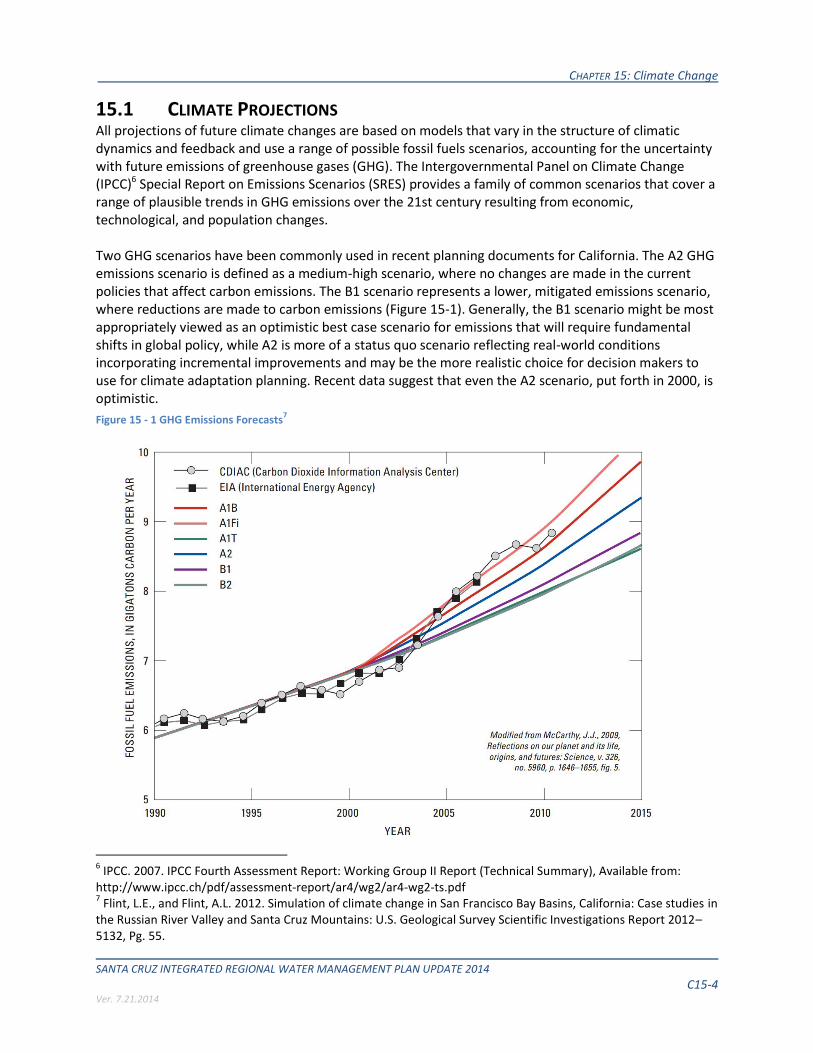
15.1 CLIMATE PROJECTIONS All projections of future climate changes are based on models that vary in the structure of climatic dynamics and feedback and use a range of possible fossil fuels scenarios, accounting for the uncertainty with future emissions of greenhouse gases (GHG). The Intergovernmental Panel on Climate Change (IPCC)6 Special Report on Emissions Scenarios (SRES) provides a family of common scenarios that cover a range of plausible trends in GHG emissions over the 21st century resulting from economic, technological, and population changes. Two GHG scenarios have been commonly used in recent planning documents for California. The A2 GHG emissions scenario is defined as a medium-high scenario, where no changes are made in the current policies that affect carbon emissions. The B1 scenario represents a lower, mitigated emissions scenario, where reductions are made to carbon emissions (Figure 15-1). Generally, the B1 scenario might be most appropriately viewed as an optimistic best case scenario for emissions that will require fundamental shifts in global policy, while A2 is more of a status quo scenario reflecting real-world conditions incorporating incremental improvements and may be the more realistic choice for decision makers to use for climate adaptation planning. Recent data suggest that even the A2 scenario, put forth in 2000, is optimistic.
Figure 15 - 1 GHG Emissions Forecasts7
6 IPCC. 2007. IPCC Fourth Assessment Report: Working Group II Report (Technical Summary), Available from:
http://www.ipcc.ch/pdf/assessment‐report/ar4/wg2/ar4‐wg2‐ts.pdf 7 Flint, L.E., and Flint, A.L. 2012. Simulation of climate change in San Francisco Bay Basins, California: Case studies in
the Russian River Valley and Santa Cruz Mountains: U.S. Geological Survey Scientific Investigations Report 2012–5132, Pg. 55.
CHAPTER 15: Climate Change
SANTA CRUZ INTEGRATED REGIONAL WATER MANAGEMENT PLAN UPDATE 2014
C15-5 Ver. 7.21.2014
The pathway leading from global GHG emissions to atmospheric composition changes, climate changes, and finally to system-level impacts in the Santa Cruz region is indeed complex and requires a multitude of important simplifying assumptions to model such a chain of cause and effect. The cumulative uncertainty resulting from assumptions employed at each step of the process should be considered when using results for decision making. The content of this synthesis represents the current understanding, which is rapidly evolving. A confidence ranking scale has been defined to simply communicate confidence in a number of different climate change projections throughout this chapter. Table 15-1 below outlines the confidence ranking scale used to communicate general confidence in a number of future climate change projections. Table 15 - 1 Climate Change Confidence Ranking Scale
Confidence Ranking Description
High General scientific agreement of conclusion that is supported by a number of monitoring data, modeling results, research or best available scientific information.
Moderate Scientifically supported but consensus or agreement is not present due to lack of information, moderate differences between studies, or limitations for drawing general conclusions from limited scientific information.
Low Lack of information or conflicting results between studies, model outputs, expert opinions, and/or research findings.
15.2 CLIMATE CHANGE IMPACTS TO THE SANTA CRUZ IRWM REGION During recent years, a number of valuable sources have been developed to facilitate incorporation of global climate change projections into regional planning processes (e.g., http://cal-adapt.org/), along with statewide8 and regional studies. As noted above, an IRWM grant supported an investigation by the USGS into climate impacts on temperature, rainfall, runoff, and recharge for the Santa Cruz IRWM Region.9 As part of that study, the USGS downscaled global climate model data provided by the IPCC from 250 km resolution to 12 km resolution over a 100-yr time frame. Data outputs were analyzed for the Santa Cruz Region, and these climate outputs were paired with hydrologic models calibrated with local stream gage data. The researchers chose to use projections from global climate models and emission scenarios that have proven capable of simulating recent historical climate for California: the Parallel Climate Model (PCM) developed by National Center for Atmospheric Research (NCAR) and the National Oceanic and Atmospheric Administration (NOAA) Geophysical Fluid Dynamics Laboratory
8 Cayan, D., M. Tyree, M. Dettinger, H. Hidalgo, T. Das, E. Maurer, P. Bromirski, N. Graham, and R. Flick. 2009.
Climate Change Scenarios and Sea Level Rise Estimates for the California 2009 Climate Change Assessment, California Climate Change Center. 64pp. 9 Flint, L.E., and Flint, A.L. 2012. Simulation of climate change in San Francisco Bay Basins, California: Case studies in
the Russian River Valley and Santa Cruz Mountains: U.S. Geological Survey Scientific Investigations Report 2012–5132, 55 p.

CHAPTER 15: Climate Change
SANTA CRUZ INTEGRATED REGIONAL WATER MANAGEMENT PLAN UPDATE 2014
C15-6 Ver. 7.21.2014
(GFDL) model. The A2 GHG emissions scenario was used, which more accurately reflects the measured data in California. Figures 15-2 to 15-5 and Tables 15-2 to 15-4 below display and summarize relevant findings from the USGS study, which showed strong evidence for temperature changes in the future, but disagreement between models for future precipitation patterns. Temperature projections showed an increase of 3-4o C for average monthly maximums and an increase in the variability (20-30% larger standard deviation) above the historic reference period (1971-2000), with spring and fall months experiencing warmer temperatures. While there is disagreement amongst climate model projections as to the timing of precipitation patterns, there is agreement that the future will be generally drier, resulting in a higher frequency of droughts, less groundwater recharge, and increased climatic water deficit (CWD). CWD characterizes the relationship between soil moisture storage and evapotranspiration pressure, and integrates the effects of increasing temperature and varying precipitation on basin conditions. Changes in CWD will tend to increase demand for irrigation water and could have dramatic impacts on local ecology, particular to species that are on the edge of their habitat zones, for example the coastal redwoods (Figure 15-5). Figure 15-2 illustrates projected changes in precipitation, maximum and minimum air temperatures through the year 2100 for the greater bay area.

CHAPTER 15: Climate Change
SANTA CRUZ INTEGRATED REGIONAL WATER MANAGEMENT PLAN UPDATE 2014
C15-7 Ver. 7.21.2014
Figure 15 - 2 Change in Precipitation and Air Temperature through the year 2100
CHAPTER 15: Climate Change
SANTA CRUZ INTEGRATED REGIONAL WATER MANAGEMENT PLAN UPDATE 2014
C15-8 Ver. 7.21.2014
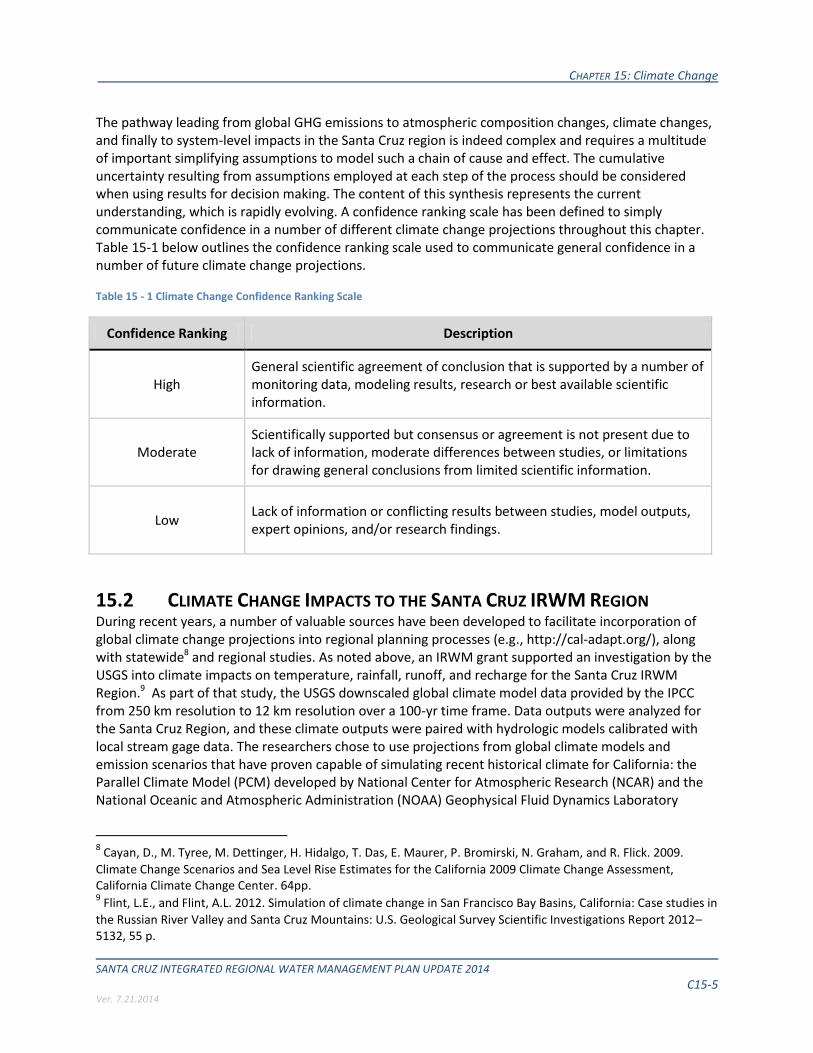
Figure 15 - 3 Change in Recharge

CHAPTER 15: Climate Change
SANTA CRUZ INTEGRATED REGIONAL WATER MANAGEMENT PLAN UPDATE 2014
C15-9 Ver. 7.21.2014
Figure 15-3 illustrates the potential changes in recharge between 1971–2000 and 2071–2100. Warmer colors indicate reduced recharge. The authors conclude there is a reduction in recharge over most of the region, from 10–15 percent for the PCM model to 30 percent for the GFDL-A2 modeled scenario, although slight increases occur in the San Lorenzo River basin recharge zone, as well as along the coastal plain, under both projections. Figure 15-4 illustrates projected changes to precipitation, evapotranspiration, recharge and runoff through the year 2100 for Santa Cruz County. Of particular note is the increased amount of runoff projected under each model, particularly the PCM-A2.

CHAPTER 15: Climate Change
SANTA CRUZ INTEGRATED REGIONAL WATER MANAGEMENT PLAN UPDATE 2014
C15-10 Ver. 7.21.2014
Figure 15 - 4 Precipitation, Evapotranspiration, Recharge, and Runoff
Changes in precipitation, evapotranspiration, recharge, and runoff as predicted by NCAR’s Parallel Climate Model (PCM) and by NOAA’s Geophysical Fluid Dynamics Laboratory (GFDL) model.

CHAPTER 15: Climate Change
SANTA CRUZ INTEGRATED REGIONAL WATER MANAGEMENT PLAN UPDATE 2014
C15-11 Ver. 7.21.2014
Figure 15 - 5 Climatic Water Deficit
CHAPTER 15: Climate Change
SANTA CRUZ INTEGRATED REGIONAL WATER MANAGEMENT PLAN UPDATE 2014
C15-12 Ver. 7.21.2014
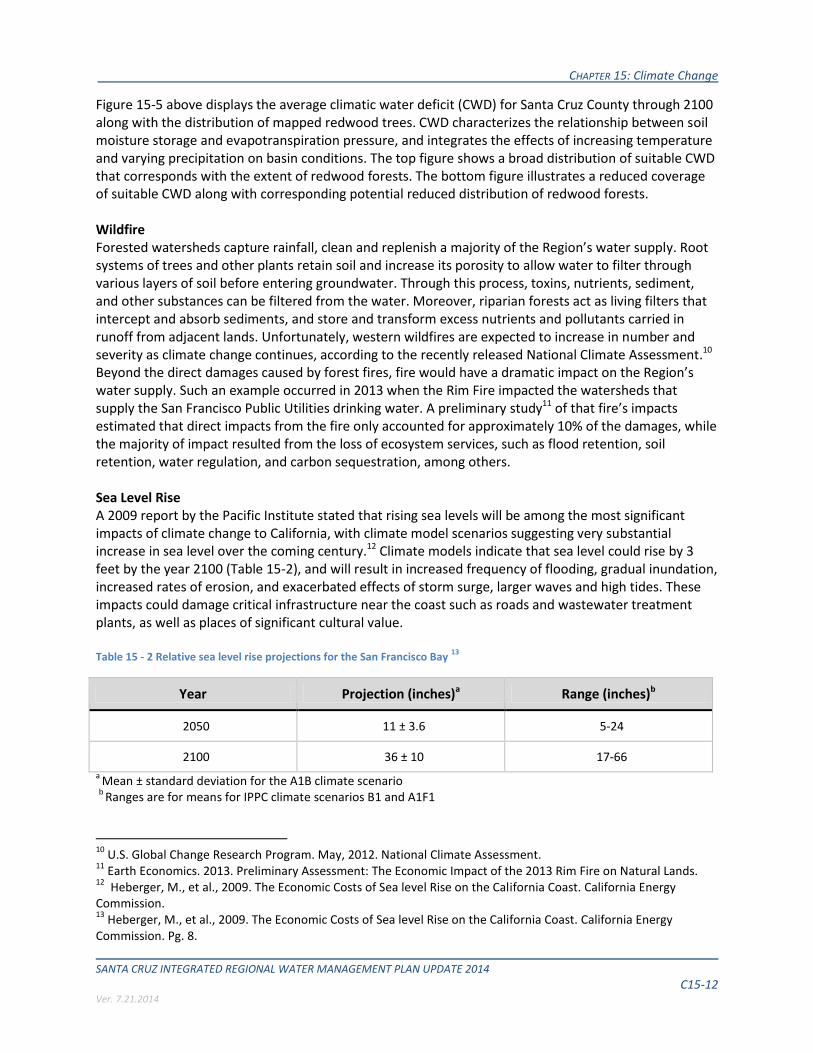
Figure 15-5 above displays the average climatic water deficit (CWD) for Santa Cruz County through 2100 along with the distribution of mapped redwood trees. CWD characterizes the relationship between soil moisture storage and evapotranspiration pressure, and integrates the effects of increasing temperature and varying precipitation on basin conditions. The top figure shows a broad distribution of suitable CWD that corresponds with the extent of redwood forests. The bottom figure illustrates a reduced coverage of suitable CWD along with corresponding potential reduced distribution of redwood forests. Wildfire Forested watersheds capture rainfall, clean and replenish a majority of the Region’s water supply. Root systems of trees and other plants retain soil and increase its porosity to allow water to filter through various layers of soil before entering groundwater. Through this process, toxins, nutrients, sediment, and other substances can be filtered from the water. Moreover, riparian forests act as living filters that intercept and absorb sediments, and store and transform excess nutrients and pollutants carried in runoff from adjacent lands. Unfortunately, western wildfires are expected to increase in number and severity as climate change continues, according to the recently released National Climate Assessment.10 Beyond the direct damages caused by forest fires, fire would have a dramatic impact on the Region’s water supply. Such an example occurred in 2013 when the Rim Fire impacted the watersheds that supply the San Francisco Public Utilities drinking water. A preliminary study11 of that fire’s impacts estimated that direct impacts from the fire only accounted for approximately 10% of the damages, while the majority of impact resulted from the loss of ecosystem services, such as flood retention, soil retention, water regulation, and carbon sequestration, among others. Sea Level Rise A 2009 report by the Pacific Institute stated that rising sea levels will be among the most significant impacts of climate change to California, with climate model scenarios suggesting very substantial increase in sea level over the coming century.12 Climate models indicate that sea level could rise by 3 feet by the year 2100 (Table 15-2), and will result in increased frequency of flooding, gradual inundation, increased rates of erosion, and exacerbated effects of storm surge, larger waves and high tides. These impacts could damage critical infrastructure near the coast such as roads and wastewater treatment plants, as well as places of significant cultural value. Table 15 - 2 Relative sea level rise projections for the San Francisco Bay
13
Year Projection (inches)a Range (inches)b
2050 11 ± 3.6 5-24
2100 36 ± 10 17-66 a
Mean ± standard deviation for the A1B climate scenario b
Ranges are for means for IPPC climate scenarios B1 and A1F1
10
U.S. Global Change Research Program. May, 2012. National Climate Assessment. 11
Earth Economics. 2013. Preliminary Assessment: The Economic Impact of the 2013 Rim Fire on Natural Lands. 12
Heberger, M., et al., 2009. The Economic Costs of Sea level Rise on the California Coast. California Energy Commission. 13
Heberger, M., et al., 2009. The Economic Costs of Sea level Rise on the California Coast. California Energy Commission. Pg. 8.

CHAPTER 15: Climate Change
SANTA CRUZ INTEGRATED REGIONAL WATER MANAGEMENT PLAN UPDATE 2014
C15-13 Ver. 7.21.2014
The Santa Cruz Region is already vulnerable to erosion and flooding as evidenced through impacts from a strong El Nino cycle in 1983. During that cycle, 12 storms, nine of which arrived at high tides, battered the Santa Cruz region. Large storm waves and storm surge resulted in over $200 million in losses to property and infrastructure. Similarly, a 1998 El Nino event caused over $13 million in damage throughout the county.14 Tables 15-3 and 15-4 Projected Climate-Change Induced Hydrologic Changes for the Santa Cruz Region Table 15 - 3 Projected Climate Changes for the Santa Cruz Region
Climate variable Projected changes by
2100 Confidence
ranking Supporting evidence Seasonal and spatial patterns
Average maximum air temperatures (30 yr. intervals)
Expected to increase 3-4C above the historic reference period of 1971-2000
high
Climate model agreement. Projections are consistent with statewide projections (Cayan et al., 2009).
High spatial variability with the largest changes expected in the Santa Cruz mountains. Warmer temperatures are projected to extend further into fall months compared to the historic reference period of 1971-2000.
Air temperature variability (30 yr. intervals)
Expected 20-30% larger standard deviation than the historic reference period of 1971-2000
high
Climate model agreement. Projections are consistent with statewide projections made in other studies (Cayan et al., 2009).
Increased variability but reduced range of extreme temperatures. Largest changes expected in the Santa Cruz mountains with a high degree of spatial variability across the region.
Sea levels
Expected 1-1.4m rise above 2010 elevations
high
Standardized projections with general model agreement (Knowles, 2010), data available at www.caladapt.org.
Coastal low lying areas and areas adjacent to streams most vulnerable when coupled with high tides during a high runoff event.
Annual precipitation totals (30 yr. intervals)
Direction of change undetermined
low
Climate models disagree on the direction of change, but both show the most pronounced changes during winter months. Climate models disagree on which months are responsible for annual precipitation changes.
Total annual precipitation changes cannot be determined, but projections indicate less precipitation in the fall and spring with the timing of peak annual precipitation shifting from January to February. Summers are projected to be longer and drier.
Precipitation variability (30 yr. intervals)
Expected < 10% larger standard deviation than the historic reference period of 1971-2000
low
Very small changes (<10%) are detected which may be smaller than the uncertainty associated with the model outputs.
Largest increases in precipitation variability projected in the Santa Cruz mountains.
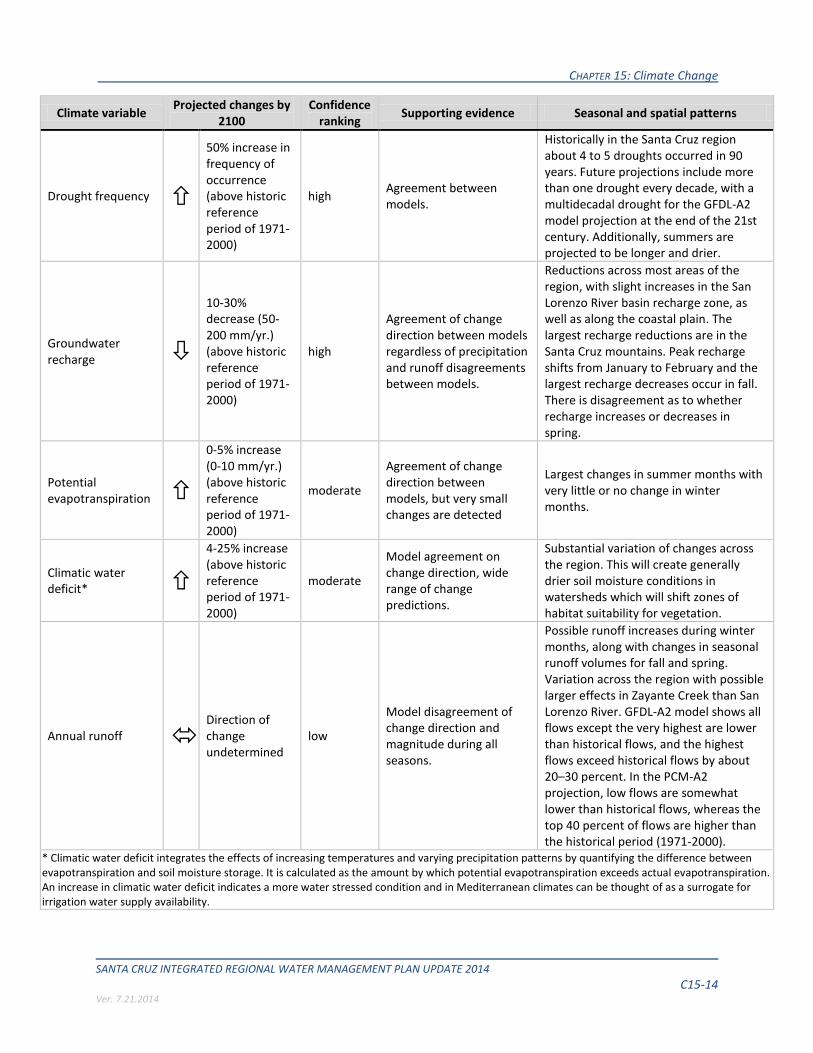
Table 15 - 4 Projected Hydrologic Changes for the Santa Cruz Region
14
Griggs, G., and Haddad, B. 2011. City of Santa Cruz Climate Change Vulnerability Assessment.
CHAPTER 15: Climate Change
SANTA CRUZ INTEGRATED REGIONAL WATER MANAGEMENT PLAN UPDATE 2014
C15-14 Ver. 7.21.2014
Climate variable Projected changes by
2100 Confidence
ranking Supporting evidence Seasonal and spatial patterns
Drought frequency
50% increase in frequency of occurrence (above historic reference period of 1971-2000)
high Agreement between models.
Historically in the Santa Cruz region about 4 to 5 droughts occurred in 90 years. Future projections include more than one drought every decade, with a multidecadal drought for the GFDL-A2 model projection at the end of the 21st century. Additionally, summers are projected to be longer and drier.
Groundwater recharge
10-30% decrease (50-200 mm/yr.) (above historic reference period of 1971-2000)
high
Agreement of change direction between models regardless of precipitation and runoff disagreements between models.
Reductions across most areas of the region, with slight increases in the San Lorenzo River basin recharge zone, as well as along the coastal plain. The largest recharge reductions are in the Santa Cruz mountains. Peak recharge shifts from January to February and the largest recharge decreases occur in fall. There is disagreement as to whether recharge increases or decreases in spring.
Potential evapotranspiration
0-5% increase (0-10 mm/yr.) (above historic reference period of 1971-2000)
moderate
Agreement of change direction between models, but very small changes are detected
Largest changes in summer months with very little or no change in winter months.
Climatic water deficit*
4-25% increase (above historic reference period of 1971-2000)
moderate
Model agreement on change direction, wide range of change predictions.
Substantial variation of changes across the region. This will create generally drier soil moisture conditions in watersheds which will shift zones of habitat suitability for vegetation.
Annual runoff
Direction of change undetermined
low
Model disagreement of change direction and magnitude during all seasons.
Possible runoff increases during winter months, along with changes in seasonal runoff volumes for fall and spring. Variation across the region with possible larger effects in Zayante Creek than San Lorenzo River. GFDL-A2 model shows all flows except the very highest are lower than historical flows, and the highest flows exceed historical flows by about 20–30 percent. In the PCM-A2 projection, low flows are somewhat lower than historical flows, whereas the top 40 percent of flows are higher than the historical period (1971-2000).
* Climatic water deficit integrates the effects of increasing temperatures and varying precipitation patterns by quantifying the difference between evapotranspiration and soil moisture storage. It is calculated as the amount by which potential evapotranspiration exceeds actual evapotranspiration. An increase in climatic water deficit indicates a more water stressed condition and in Mediterranean climates can be thought of as a surrogate for irrigation water supply availability.

CHAPTER 15: Climate Change
SANTA CRUZ INTEGRATED REGIONAL WATER MANAGEMENT PLAN UPDATE 2014
C15-15 Ver. 7.21.2014
15.3 VULNERABILITY Assessing the Region’s vulnerability is an important first step to informing sustainable water management and IRWM adaptation strategy prioritization. In this context, vulnerability is the susceptibility of a system component to harmful impacts due to climate change, and the degree of vulnerability is used to identify management actions that have the potential to reduce negative consequences. A vulnerability assessment provides a context to focus discussion on IRWM strategies that also can serve as potential mitigation or adaptation actions and may directly improve our preparedness for projected climate changes. For the Santa Cruz IRWM Region, a vulnerability assessment was conducted using methodology from the International Council for Local Environmental Initiatives (ICLEI)15 climate change guide for local governments. Several terms used in the assessment, including sensitivity, adaptive capacity, and vulnerability, are defined below for clarity in evaluating the results of the assessment. Sensitivity is the degree to which system components (e.g., water supply, stream habitat quality, or flood hazards) respond to climate conditions (e.g., temperature and precipitation) or system impacts (e.g., stream temperature increases or reduced recharge). If the system or system component is likely to be strongly affected by future climatic conditions then it is considered sensitive. Table 15-5 defines the relative sensitivity scale. Factors considered when determining the relative degree of sensitivity include:
The degree of exposure of the impact to climate change.
The existing stressors in the system and whether projected future climatic conditions would exacerbate these stressors.
The existing balance of resource demand and supply such that climate may increase demand and/or reduce supply.
Table 15 - 5 Scoring Definitions for Sensitivity to Climate Change Impacts
Sensitivity Definition
High The system responds measurably to an impact based on historical observations or modeling studies.
Moderate The system response to an impact has not been measured, but based on our understanding of system function there are likely to be direct or indirect responses.
Low The system does not respond measurably to impacts and based on understanding of system function there are not likely to be direct or indirect responses.
15
ICLEI. 2007. Preparing for Climate Change: A guidebook for local, regional and state governments. Center for
Science in the Earth Systems, University of Washington and Kings County Washington and ICLEI-Local Governments for Sustainability. September 2007.
CHAPTER 15: Climate Change
SANTA CRUZ INTEGRATED REGIONAL WATER MANAGEMENT PLAN UPDATE 2014
C15-16 Ver. 7.21.2014
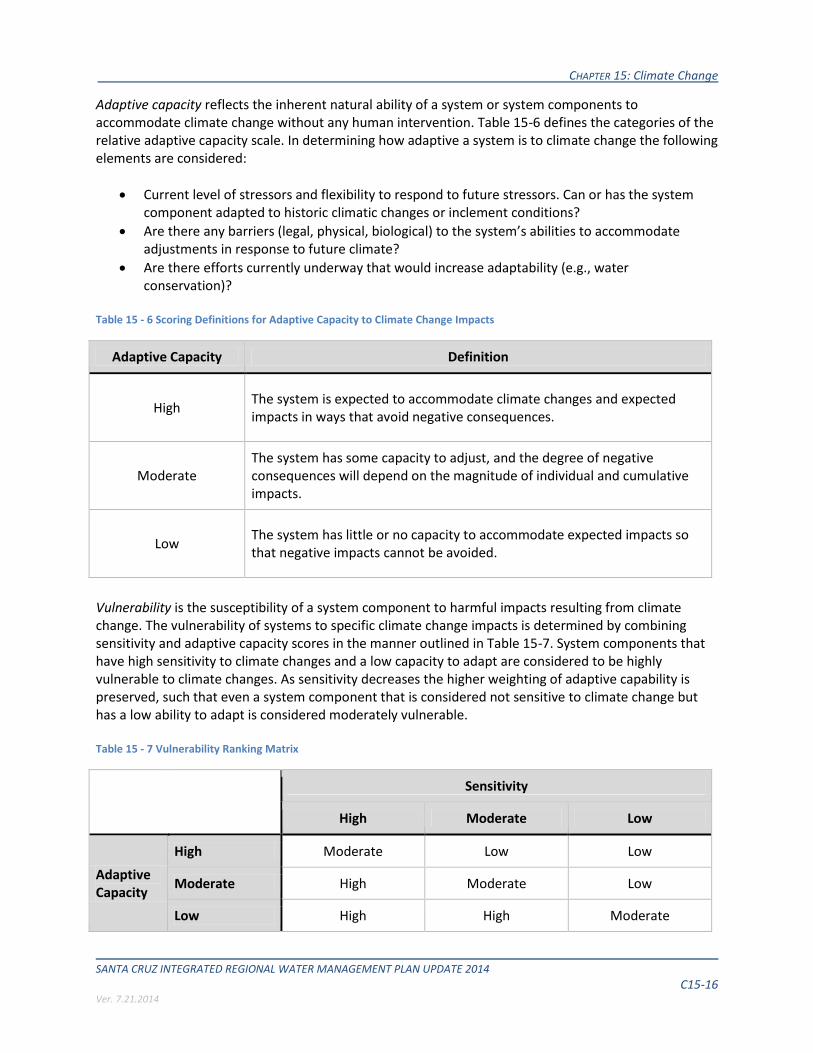
Adaptive capacity reflects the inherent natural ability of a system or system components to accommodate climate change without any human intervention. Table 15-6 defines the categories of the relative adaptive capacity scale. In determining how adaptive a system is to climate change the following elements are considered:
Current level of stressors and flexibility to respond to future stressors. Can or has the system component adapted to historic climatic changes or inclement conditions?
Are there any barriers (legal, physical, biological) to the system’s abilities to accommodate adjustments in response to future climate?
Are there efforts currently underway that would increase adaptability (e.g., water conservation)?
Table 15 - 6 Scoring Definitions for Adaptive Capacity to Climate Change Impacts
Adaptive Capacity Definition
High The system is expected to accommodate climate changes and expected impacts in ways that avoid negative consequences.
Moderate The system has some capacity to adjust, and the degree of negative consequences will depend on the magnitude of individual and cumulative impacts.
Low The system has little or no capacity to accommodate expected impacts so that negative impacts cannot be avoided.
Vulnerability is the susceptibility of a system component to harmful impacts resulting from climate change. The vulnerability of systems to specific climate change impacts is determined by combining sensitivity and adaptive capacity scores in the manner outlined in Table 15-7. System components that have high sensitivity to climate changes and a low capacity to adapt are considered to be highly vulnerable to climate changes. As sensitivity decreases the higher weighting of adaptive capability is preserved, such that even a system component that is considered not sensitive to climate change but has a low ability to adapt is considered moderately vulnerable. Table 15 - 7 Vulnerability Ranking Matrix
Sensitivity
High Moderate Low
Adaptive Capacity
High Moderate Low Low
Moderate High Moderate Low
Low High High Moderate

CHAPTER 15: Climate Change
SANTA CRUZ INTEGRATED REGIONAL WATER MANAGEMENT PLAN UPDATE 2014
C15-17 Ver. 7.21.2014
Table 15 - 8 Ranking Scale Used to Communicate General Confidence in a Number of Future Climate Change Projections
Confidence Ranking Description
High General scientific agreement of conclusion that is supported by a number of monitoring data, modeling results, research, or best available scientific information.
Moderate Scientifically supported but consensus or agreement is not present due to lack of information, moderate differences between studies, or limitations for drawing general conclusions from limited scientific information.
Low Lack of information or conflicting results between studies, model outputs, expert opinions, and/or research findings.
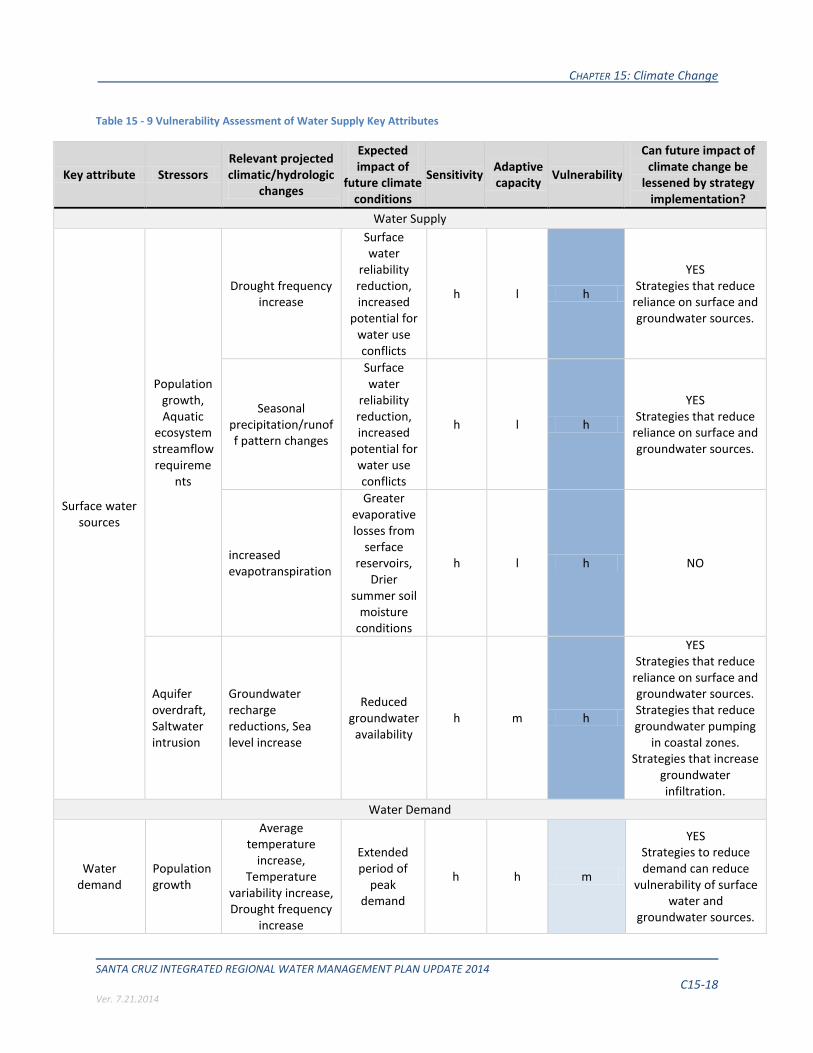
15.3.1 WATER SUPPLY The local climate change projections suggest longer and drier summers, an increased frequency of droughts, increased evapotranspiration rates, and reduced groundwater recharge. These projected changes will exacerbate current water supply issues and reduce the reliability of the local water sources to meet demand. Using the best information available, Table 15-9 provides an assessment of the vulnerability of key attributes of the water supply system to specific climate changes. The table lists stressors on key attributes within the water supply system. For simplicity, Table 15-9 includes only those climate change projections for which confidence is relatively high. The table also indicates whether opportunities exist to reduce vulnerability to climate change impacts with the implementation of management strategies.
CHAPTER 15: Climate Change
SANTA CRUZ INTEGRATED REGIONAL WATER MANAGEMENT PLAN UPDATE 2014
C15-18 Ver. 7.21.2014
Table 15 - 9 Vulnerability Assessment of Water Supply Key Attributes
Key attribute Stressors Relevant projected climatic/hydrologic
changes
Expected impact of
future climate conditions
Sensitivity Adaptive capacity
Vulnerability
Can future impact of climate change be
lessened by strategy implementation?
Water Supply
Surface water sources
Population growth, Aquatic
ecosystem streamflow requireme
nts
Drought frequency increase
Surface water
reliability reduction, increased
potential for water use conflicts
h l h
YES Strategies that reduce
reliance on surface and groundwater sources.
Seasonal precipitation/runoff pattern changes
Surface water
reliability reduction, increased
potential for water use conflicts
h l h
YES Strategies that reduce
reliance on surface and groundwater sources.
increased evapotranspiration
Greater evaporative losses from
serface reservoirs,
Drier summer soil
moisture conditions
h l h NO
Aquifer overdraft, Saltwater intrusion
Groundwater recharge reductions, Sea level increase
Reduced groundwater
availability h m h
YES Strategies that reduce
reliance on surface and groundwater sources. Strategies that reduce groundwater pumping
in coastal zones. Strategies that increase
groundwater infiltration.
Water Demand
Water demand
Population growth
Average temperature
increase, Temperature
variability increase, Drought frequency
increase
Extended period of
peak demand
h h m
YES Strategies to reduce demand can reduce
vulnerability of surface water and
groundwater sources.

CHAPTER 15: Climate Change
SANTA CRUZ INTEGRATED REGIONAL WATER MANAGEMENT PLAN UPDATE 2014
C15-19 Ver. 7.21.2014
15.3.2 WATER QUALITY The two water quality variables most susceptible to future regional climate conditions are salts in groundwater and surface water temperatures. The current extent and magnitude of saltwater intrusion as a result of historic and continued groundwater overdraft would be exacerbated in coastal areas by increasing sea level elevations if effective management actions are not implemented. Projected higher air temperatures in the future (particularly during summer) will result in a corresponding increase in surface water temperatures that could have a detrimental impact on coldwater fish species and the overall health of local aquatic ecosystems. Statewide predictions of increased rainfall intensities have the potential to increase pollutant transport, sediment erosion rates and delivery during future episodic storm events. However, the effect may be small relative to other water pollution drivers and pollutant source control strategies.
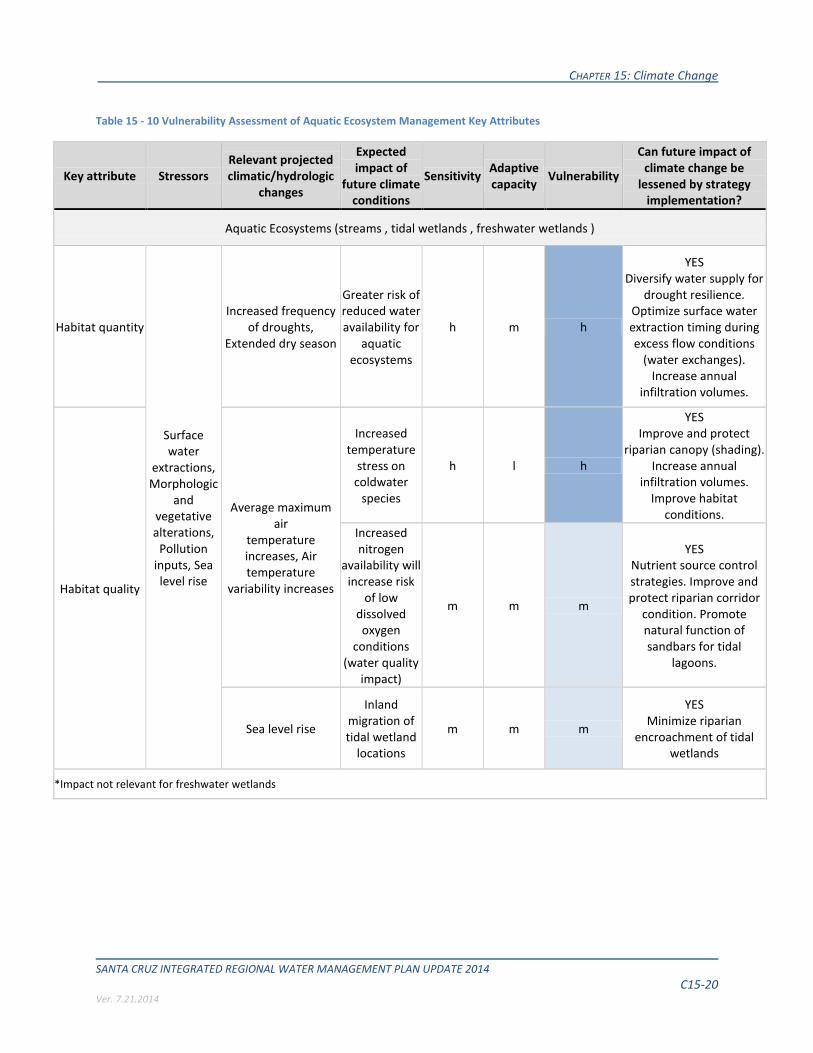
15.3.3 AQUATIC ECOSYSTEMS Using the best information available, we provide an assessment of the vulnerability of key attributes of the aquatic ecosystem to specific climate changes in Table 15-10. The table lists stressors on key attributes within aquatic ecosystems that are closely related to the drivers. For simplicity, Table 15-10 includes only those climate change projections for which confidence is relatively high. The table also indicates whether opportunities exist to reduce vulnerability to climate change impacts with the implementation of management strategies. The local climate change projections suggest an increase in average maximum air temperatures, temperature variability, evapotranspiration, climatic water deficit, frequency of droughts, and sea level. These projected changes would increase the challenges to improve the habitat quality and quantity for aquatic species given current land use and water requirements. Ensuring adequate water availability in streams, tidal wetlands, and freshwater wetlands to support native aquatic species is highly susceptible given the current regional water supply reliance on local sources. In addition, increased air temperatures are expected to impact the habitat quality of streams and tidal wetlands for coldwater fish species, namely steelhead trout and coho salmon. Rising sea levels will likely lead to the landward migration of tidal wetlands from saltwater inundation and erosion, and loss of tidal wetland area is likely in urban areas where inland channels are severely encroached by development. The impacts of climate change to aquatic ecosystems are expected to be most pronounced during the dry, warm summer and early fall months (July-October).
CHAPTER 15: Climate Change
SANTA CRUZ INTEGRATED REGIONAL WATER MANAGEMENT PLAN UPDATE 2014
C15-20 Ver. 7.21.2014
Table 15 - 10 Vulnerability Assessment of Aquatic Ecosystem Management Key Attributes
Key attribute Stressors Relevant projected climatic/hydrologic
changes
Expected impact of
future climate conditions
Sensitivity Adaptive capacity
Vulnerability
Can future impact of climate change be
lessened by strategy implementation?
Aquatic Ecosystems (streams , tidal wetlands , freshwater wetlands )
Habitat quantity
Surface water
extractions, Morphologic
and vegetative alterations,
Pollution inputs, Sea level rise
Increased frequency of droughts,
Extended dry season
Greater risk of reduced water availability for
aquatic ecosystems
h m h
YES Diversify water supply for
drought resilience. Optimize surface water extraction timing during excess flow conditions
(water exchanges). Increase annual
infiltration volumes.
Habitat quality
Average maximum air
temperature increases, Air temperature
variability increases
Increased temperature
stress on coldwater
species
h l h
YES Improve and protect
riparian canopy (shading). Increase annual
infiltration volumes. Improve habitat
conditions.
Increased nitrogen
availability will increase risk
of low dissolved oxygen
conditions (water quality
impact)
m m m
YES Nutrient source control strategies. Improve and protect riparian corridor
condition. Promote natural function of sandbars for tidal
lagoons.
Sea level rise
Inland migration of tidal wetland
locations
m m m
YES Minimize riparian
encroachment of tidal wetlands
*Impact not relevant for freshwater wetlands

CHAPTER 15: Climate Change
SANTA CRUZ INTEGRATED REGIONAL WATER MANAGEMENT PLAN UPDATE 2014
C15-21 Ver. 7.21.2014
15.3.4 FLOOD / STORMWATER MANAGEMENT Global climate change projections include expected increases in sea level in the Santa Cruz region. Increased sea level elevation will increase the boundary elevation at the terminus of coastal streams, resulting in an increase of the flooding risk for coastal low lying areas. Statewide models predict an increased frequency of intense winter precipitation events, which will also increase the risk of Santa Cruz flooding. Table 15 - 11 Vulnerability Assessment of Flood and Stormwater Management Key Attributes
Key attribute Stressors Relevant projected climatic/hydrologic
changes
Expected impact of
future climate
conditions
Sensitivity Adaptive capacity
Vulnerability
Can future impact of climate change be
lessened by strategy implementation?
Flood and Stormwater Management
Flood hazard
Areas with high degree of DCIA, Developed areas
Increased sea level elevations,
Possible (low confidence)
seasonal runoff changes
Flood hazard
increase for flood prone
areas
h l h
YES Reduce cost of flooding
in susceptible areas and improve channel conveyance efficiency during large storms.
Stormwater volumes
Areas with high degree of DCIA
Possible increased frequency of high
intensity precipitation
events, Possible seasonal runoff
changes
Localized risk of
episodic flooding
m h m
YES Strategies that reduce DCIA and maintain the
stormwater conveyance system.
Stormwater quality
Areas with high degree of DCIA
Potential to increase pollutant
entrainment during winter storms
l h l YES
Pollutant source control strategies.
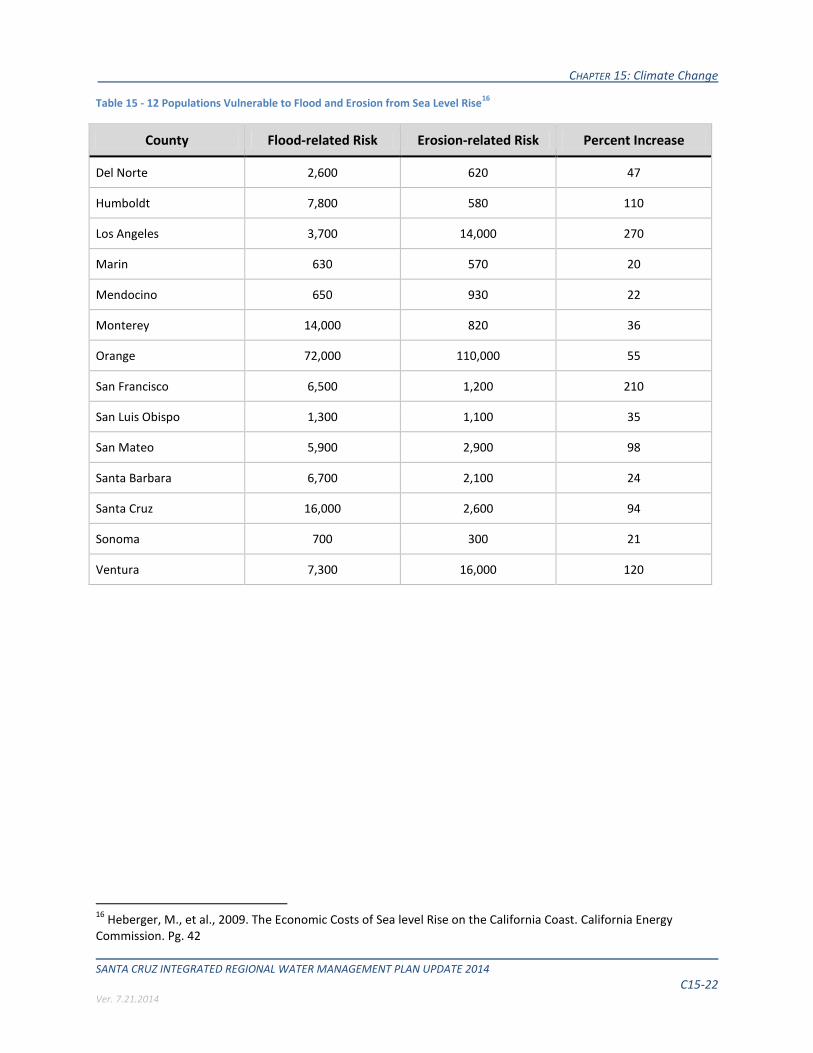
15.3.5 SEA LEVEL RISE Although rising sea levels will impact the entire California coast, a disproportionate number of people and infrastructure will be vulnerable to sea level rise in the Santa Cruz IRWM Region. The Pacific Institute study mapped areas of the California coast that are vulnerable to flooding with a 55-inch increase in sea level. Based on population at risk, Santa Cruz County was identified as having the second highest flood-related risk and the fourth highest erosion-related risk of the 20 coastal counties, representing nearly a 100% increase in risk from existing conditions (Table 15-12).
CHAPTER 15: Climate Change
SANTA CRUZ INTEGRATED REGIONAL WATER MANAGEMENT PLAN UPDATE 2014
C15-22 Ver. 7.21.2014
Table 15 - 12 Populations Vulnerable to Flood and Erosion from Sea Level Rise16
County Flood-related Risk Erosion-related Risk Percent Increase
Del Norte 2,600 620 47
Humboldt 7,800 580 110
Los Angeles 3,700 14,000 270
Marin 630 570 20
Mendocino 650 930 22
Monterey 14,000 820 36
Orange 72,000 110,000 55
San Francisco 6,500 1,200 210
San Luis Obispo 1,300 1,100 35
San Mateo 5,900 2,900 98
Santa Barbara 6,700 2,100 24
Santa Cruz 16,000 2,600 94
Sonoma 700 300 21
Ventura 7,300 16,000 120
16
Heberger, M., et al., 2009. The Economic Costs of Sea level Rise on the California Coast. California Energy Commission. Pg. 42
CHAPTER 15: Climate Change
SANTA CRUZ INTEGRATED REGIONAL WATER MANAGEMENT PLAN UPDATE 2014
C15-23 Ver. 7.21.2014
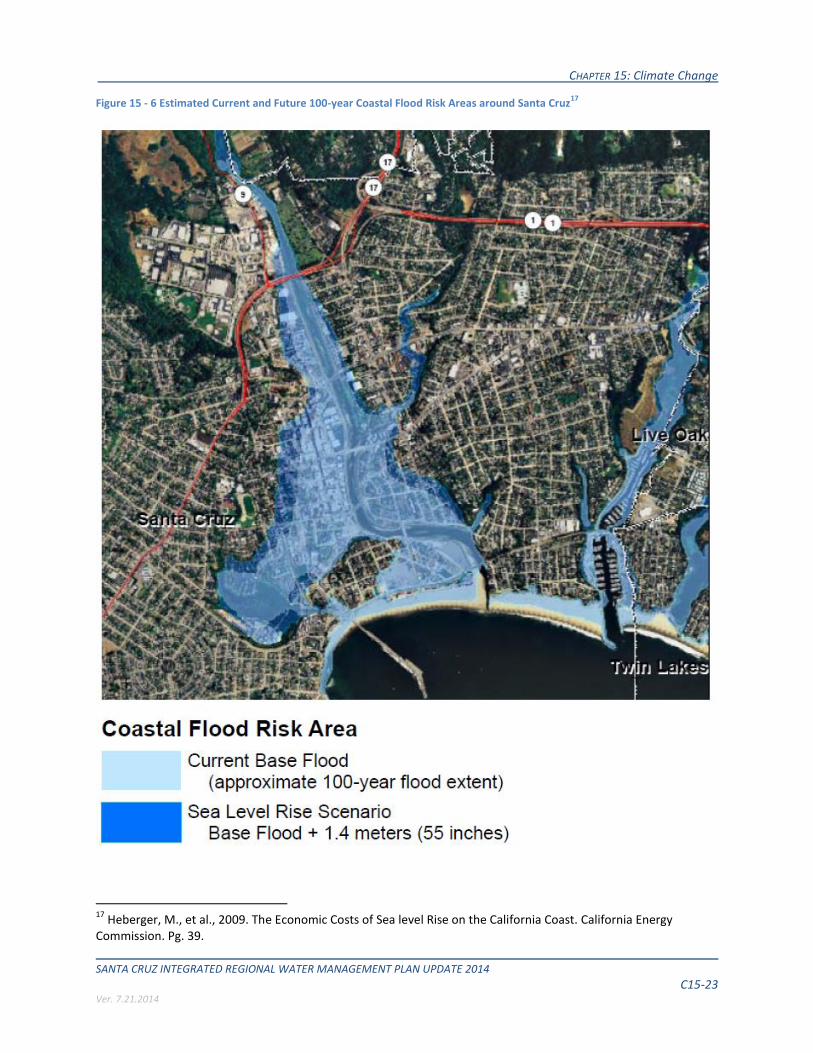
Figure 15 - 6 Estimated Current and Future 100-year Coastal Flood Risk Areas around Santa Cruz17
17
Heberger, M., et al., 2009. The Economic Costs of Sea level Rise on the California Coast. California Energy Commission. Pg. 39.
CHAPTER 15: Climate Change
SANTA CRUZ INTEGRATED REGIONAL WATER MANAGEMENT PLAN UPDATE 2014
C15-24 Ver. 7.21.2014
The Pacific Institute study also found a disproportionate impact on low-income households in 13 of the 20 coastal counties. These households are less likely than their counterparts to be able to afford emergency preparedness materials, purchase insurance policies, and obtain needed building reinforcements. In Santa Cruz County, the study estimates that approximately 30% of households are low-income, and that of those households, nearly 50% are vulnerable to sea level rise impacts. The consequences of coastal storm events to people, infrastructure, and the economy will continue to increase as sea level increases. Some climate models predict that extreme storm events will become more common and high sea level events will last longer, increasing the potential for damage. In addition, more intense river flooding due to climate change compounded with sea level rise could lead to more extreme flooding and erosion events for coastal communities.18 As demonstrated by the previous El Nino events, existing coastal armoring will likely not always be able to protect against projected sea level rise.
15.4 THE VALUE OF NATURAL HABITAT Building off of the Pacific Institute work, Santa Cruz IRWM planners worked with the Natural Capital Project and the Center for Ocean Solutions, Stanford Wood Institute for the Environment to characterize sea level rise, coastal vulnerability and adaptation planning for the Region.19 The study summarized existing work conducted in the Region to date, and conducted novel analysis of sea level rise vulnerability with particular emphasis on using natural approaches to adaptation.20 The following sections paraphrase and summarize the work of the Natural Capital Project. The Santa Cruz RWMG is grateful for the work conducted by this group and their assistance in developing this chapter. The Natural Capital group utilized modeling software, entitled the Integrated Valuation of Environmental Services and Tradeoffs (InVEST)21 22 coastal vulnerability model, to assess exposure to coastal flooding and erosion. They then combined those results with social variables to assess vulnerability of the region to coastal hazards. The InVEST coastal vulnerability model is based on seven physical and biological characteristics of the region—geomorphology, natural habitats, relief, wave exposure, wind exposure, surge potential, and sea level change—each ranked for its potential to increase or decrease exposure to erosion and flooding from ocean storms or sea level rise. The analysis found that exposure to coastal flooding and erosion will increase between approximately 2% to over 50%, depending on the amount of sea level rise and the extent to which habitat is protected or maintained. Without intactcoastal habitats, under the highest sea level rise scenario, the extent of
18
AECOM. 2013. The Impact of Climate Change and Population Growth on the National Flood Insurance Program Through 2100. Report prepared for the Federal Insurance and Mitigation Administration and the Federal Emergency Management Agency. 19
Langridge, S., Hartge, E., Prahler, E., Arkema, K., Verutes, G., Caldwell, M., Guery, A., Ruckelshaus, M. The Natural Capital Project and the Center for Ocean Solutions. 2013. The Role of Natural Habitat in Coastal Vulnerability and Adaptation Planning in the Santa Cruz IRWM Region. Stanford Woods Institute for the Environment, Stanford University, California. 20
National Research Council. 2012. Sea level Rise for the Coast of California, Oregon, and Washington: Past, Present and Future. National Academies Press. 21
Tallis, E. H., et al., 2013. InVEST 2.5.6 User’s Guide. The Natural Capital Project, Stanford, CA. 22
Arkema, K., et al., 2013. Coastal habitats shield people and property from sea level rise and storms. Nature Climate Change 3:1–6.

CHAPTER 15: Climate Change
SANTA CRUZ INTEGRATED REGIONAL WATER MANAGEMENT PLAN UPDATE 2014
C15-25 Ver. 7.21.2014
the coast with the greatest exposure to coastal flooding and erosion increases by approximately 40% from baseline levels (Figure 15-7). The study also examined the social dimensions of exposure in the context of local populations and built infrastructure. The study analyzed selected vulnerability metrics that were likely to be sensitive to exposure, including water system infrastructure (i.e., treatment plants, pipes, pumps, and wells), people, disadvantaged households, and farmland. The study found that without projected sea level rise, less than 5% of the total population as well as disadvantaged households were most vulnerable to coastal flooding and erosion. However, those values increased significantly with moderate to the highest sea level rise, between 15 to 25%, respectively, assuming natural habitats are intact. Without protective habitats, those figures increased to over 35%. The impact of protective habitats was most noticeable when examining vulnerability of farmland. Without protective habitat, the shoreline segments most vulnerable to coastal erosion and flooding within 1 km of farmland increases over baseline levels by more than 50%, under the highest sea level rise scenario. With the highest sea level rise scenario and habitats intact, approximately 35% of water system infrastructure pipes and 90% of water system infrastructure structures are within 1 km of coastal segments most vulnerable to erosion and flooding.
Figure 15 - 7 Percent of the Coast Most Exposed to Coastal Hazards
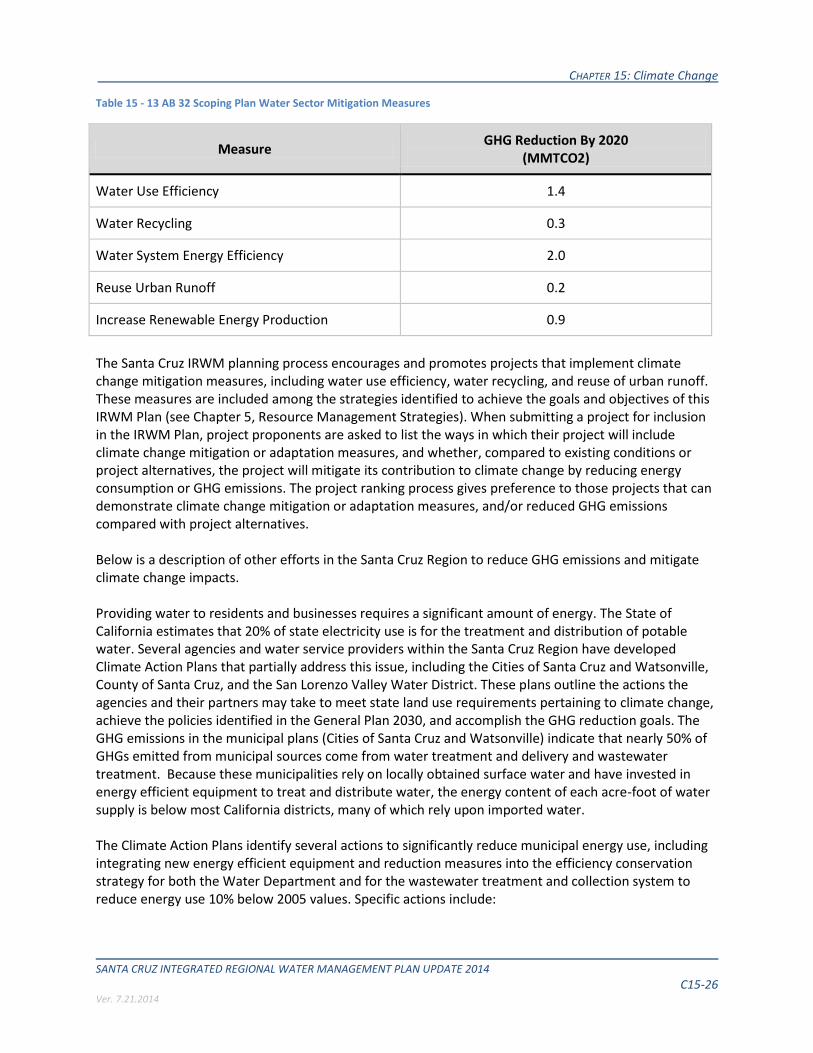
15.5 REGIONAL MITIGATION STRATEGIES The AB 32 Scoping Plan (2008) contains the main mitigation strategies California will use to reduce GHG emissions that cause climate change. Section 17 of the Scoping Plan discusses the mitigation measures or strategies for the Water sector. The table below shows the five areas from which specific GHG reduction measures will be identified and implemented.
CHAPTER 15: Climate Change
SANTA CRUZ INTEGRATED REGIONAL WATER MANAGEMENT PLAN UPDATE 2014
C15-26 Ver. 7.21.2014
Table 15 - 13 AB 32 Scoping Plan Water Sector Mitigation Measures
Measure GHG Reduction By 2020
(MMTCO2)
Water Use Efficiency 1.4
Water Recycling 0.3
Water System Energy Efficiency 2.0
Reuse Urban Runoff 0.2
Increase Renewable Energy Production 0.9
The Santa Cruz IRWM planning process encourages and promotes projects that implement climate change mitigation measures, including water use efficiency, water recycling, and reuse of urban runoff. These measures are included among the strategies identified to achieve the goals and objectives of this IRWM Plan (see Chapter 5, Resource Management Strategies). When submitting a project for inclusion in the IRWM Plan, project proponents are asked to list the ways in which their project will include climate change mitigation or adaptation measures, and whether, compared to existing conditions or project alternatives, the project will mitigate its contribution to climate change by reducing energy consumption or GHG emissions. The project ranking process gives preference to those projects that can demonstrate climate change mitigation or adaptation measures, and/or reduced GHG emissions compared with project alternatives. Below is a description of other efforts in the Santa Cruz Region to reduce GHG emissions and mitigate climate change impacts. Providing water to residents and businesses requires a significant amount of energy. The State of California estimates that 20% of state electricity use is for the treatment and distribution of potable water. Several agencies and water service providers within the Santa Cruz Region have developed Climate Action Plans that partially address this issue, including the Cities of Santa Cruz and Watsonville, County of Santa Cruz, and the San Lorenzo Valley Water District. These plans outline the actions the agencies and their partners may take to meet state land use requirements pertaining to climate change, achieve the policies identified in the General Plan 2030, and accomplish the GHG reduction goals. The GHG emissions in the municipal plans (Cities of Santa Cruz and Watsonville) indicate that nearly 50% of GHGs emitted from municipal sources come from water treatment and delivery and wastewater treatment. Because these municipalities rely on locally obtained surface water and have invested in energy efficient equipment to treat and distribute water, the energy content of each acre-foot of water supply is below most California districts, many of which rely upon imported water. The Climate Action Plans identify several actions to significantly reduce municipal energy use, including integrating new energy efficient equipment and reduction measures into the efficiency conservation strategy for both the Water Department and for the wastewater treatment and collection system to reduce energy use 10% below 2005 values. Specific actions include:

CHAPTER 15: Climate Change
SANTA CRUZ INTEGRATED REGIONAL WATER MANAGEMENT PLAN UPDATE 2014
C15-27 Ver. 7.21.2014
Public awareness and education - promote awareness about the City’s water system and conservation
Water demand monitoring - evaluate water supply and demand and determine need for increased demand reduction efforts
Long-term water conservation programs - develop and implement various conservation programs that result in sustained demand reductions
Planning and emergency management - plan for future demand, coordinate conservation activities, and analyze impacts of water shortages and demand hardening.
Between 2006 and 2010, the San Lorenzo Valley Water District prepared annual GHG emissions reports. These reports indicated that the four primary sources of the District’s GHG emissions from 2006-2010 were (in order of descending emissions):
1. Purchased electricity (water pumping and building use) 2. Mobile combustion (District vehicle fleet) 3. Commuting (combustion from employee vehicles) 4. Stationary combustion (generators and natural gas)
The SLVWD Board approved a climate change resolution in September 2008 that commits the District to reducing GHG emissions to 1990 levels by the year 2020. The reduction will be accomplished by encouraging water conservation, installing solar panels, and reducing fuel consumption of its vehicle fleet by phasing out the most fuel intensive vehicles. In addition, the County of Santa Cruz has recently (2013) adopted a Climate Action Strategy (CAS). The first portion of the CAS reports results of a GHG emissions inventory for Santa Cruz County, proposes targets for GHG reduction, and outlines strategies and implementing actions to achieve the targets. The second portion focuses on vulnerability assessment and strategies for adapting to the types of impacts that are likely to occur in Santa Cruz County. The CAS incorporates input from local community and non-governmental agencies that are working to mitigate and respond to climate change. GHG emissions inventories were prepared for county government operations and for community activities for 2005 and updated for 2009. Total emissions for government operations in 2009 were approximately 34,000 metric tons of CO2 equivalent (CO2e), a decrease of 12% from 2005. Total emissions for community activities were approximately 1,030,000 metric tons in 2009, a decrease of more than 50% from 2005. The dramatic decrease in community emissions reflects the closure of the Davenport cement plant, which accounted for approximately 90% of the commercial/industrial emissions in 2005. The inventories indicate that 70% of the community emissions in 2009 were generated by the transportation sector. Agricultural emissions other than electricity emissions were in the range of 17,000 metric tons of CO2e. State legislation requires California to reduce GHG emissions to 1990 levels by 2020. Based on the 2005 community emissions inventory, 1990 emissions levels for Santa Cruz County were estimated. Santa Cruz County has already met the target for 2020 due to the closing of the Davenport cement production plant. The State has also set a long-term reduction target for 2050, which is 80% below 1990 levels. The CAS incorporates the two state targets and sets an interim target for 2035. GHG reduction strategies are proposed for the three sectors with the highest emissions: transportation, energy, and solid waste.
CHAPTER 15: Climate Change
SANTA CRUZ INTEGRATED REGIONAL WATER MANAGEMENT PLAN UPDATE 2014
C15-28 Ver. 7.21.2014
A vulnerability assessment was prepared to identify the conditions that may occur in Santa Cruz County as a result of the various components of climate change (increasing temperature, rising sea level, and shifts in the precipitation regime) and the locations, infrastructure and economic sectors that are particularly vulnerable to negative impacts. The assessment identifies the coastal areas that are most susceptible to increased flooding, storm surge, beach and coastal bluff erosion from winter storms. The systems that will be most affected are residential coastal property, wastewater treatment infrastructure, coastal roads and bridges, beaches, coastal and wetland ecosystems, and water supply from coastal wells. The vulnerability assessment also identifies potential effects of precipitation changes and increased temperature on water supply, wildfire, biodiversity, and public health. Particular attention is given to the significant decrease in redwood habitat that may occur, especially if the current trend of decreasing coastal fog continues. A risk analysis was performed to determine which impacts from climate change present the greatest risk to people and to the natural and built environments. In the short to intermediate term (2010–2050) water shortage was identified as the largest risk. In the intermediate to long term (2050–2100) rising water table, coastal bluff erosion, and increased flooding and landslides join water shortage as the greatest risks.
15.6 REGIONAL ADAPTATION STRATEGIES The Integrated Regional Water Management Planning Act, CWC §10541(e)(10), states that IRWM plans must include an evaluation of the adaptability to climate change of water management systems in the region. The Region’s adaptation evaluation was guided by the Climate Change Handbook for Regional Water Planning,23 which outlines a process for defining vulnerable infrastructure, land uses, and habitats, for defining the sensitivity of those resources to changes in climate conditions, and evaluating the risk of impacts to those resources. Specifically, adaptation seeks to minimize the risks with anticipated impacts associated with climate change. In 2009, the State of California adopted a Climate Action Strategy24 (CAS) that describes climate change impacts and recommended adaptation strategies across seven sectors, including water. The CAS used downscaled climate impacts as a basis for guiding actions to prepare, prevent and respond to the effects of climate change. DWR developed the following 10 statewide adaptation strategies for the water management sector:
1. Provide sustainable funding for statewide and integrated regional water management 2. Fully develop the potential of integrated regional water management 3. Aggressively increase water use efficiency 4. Practice and promote integrated flood management 5. Enhance and sustain ecosystems 6. Expand water storage and conjunctive management of surface and groundwater resources 7. Fix Delta water supply, quality, and ecosystem conditions 8. Preserve, upgrade and increase monitoring, data analysis and management 9. Plan for, and adapt to, sea level rise 10. Identify and fund focused climate change impacts and adaptation research and analysis
23
U.S. Environmental Protection Agency, Region 9 and the Department of Water Resources. 2011.Climate Change Handbook for Regional Water Planning. 24
California Natural Resources Agency. 2009. 2009 Climate Adaptation Strategy.
CHAPTER 15: Climate Change
SANTA CRUZ INTEGRATED REGIONAL WATER MANAGEMENT PLAN UPDATE 2014
C15-29 Ver. 7.21.2014
Like much of statewide water planning, several of these strategies do not relate to the Santa Cruz Region, which is not reliant on the Delta for water. Tables 15-9, 15-10, and 15-11 above identify the various attributes, climate change stressors, adaptive capacities and vulnerabilities per functional area. Those tables also identify adaptation strategies that can potentially reduce the impacts of climate change within each functional area. The project solicitation conducted as part of this plan update sought to identify specific projects to address regional water resource challenges. An element of the solicitation sought to identify projects that had potential to either mitigate or adapt to climate change impacts. Strategies that can reduce the potential impact of climate change include the following:
Develop alternative/supplemental water supplies that will reduce groundwater overdraft and extraction of dry season streamflow.
Increase potential to capture, store and utilize winter precipitation, runoff and streamflow
Increase stormwater capture and infiltration.
Increase use of recycled water
Increase water use efficiency
Utilize more drought tolerant landscaping and crops to reduce irrigation demand Recognizing the value of natural habitat, as discussed previously, the Santa Cruz IRWM Conceptual Framework25 identified several specific adaptation strategies were identified to adapt to increased shoreline vulnerabilities. They include:
Restore coastal wetland habitat. Since there are few coastal wetland habitats in the central area of the Santa Cruz IRWM Region, restoration of coastal wetland habitat may reduce the vulnerability of people and infrastructure. In addition, coastal habitats can provide additional co-benefits such as improving water quality, increasing habitat for important fish species, and providing enhanced recreational opportunities.
Conserve and restore dune and associated beach habitats. This work may support other regional plans including the NOAA Coho Salmon Recovery Plan. In addition, coastal property owners within the Santa Cruz IRWM Region have made over 35 repetitive loss claims and sea level rise and more severe storms will only increase the number of repetitive loss claims and the amount of damage. Coastal habitats can reduce exposure to these hazards.
Evaluate the specific costs and benefits of adaptation strategies, such as conservation and restoration of protective natural habitats, construction or removal of hard infrastructure, managed retreat, or siting and design standards. For example, assess how restoration of coastal dunes and marshes or seawall placement impacts coastal protection, as well as provision of fishery habitat, water quality regulation, recreation values, and carbon sequestration.
25
2nd Nature. 2012. Conceptual Framework for the Santa Cruz Integrated Regional Water Management Plan.
CHAPTER 15: Climate Change
SANTA CRUZ INTEGRATED REGIONAL WATER MANAGEMENT PLAN UPDATE 2014
C15-30 Ver. 7.21.2014
15.7 FUTURE EFFORTS Research has demonstrated potential impacts of climate change in the Santa Cruz IRWM region, however there still exists some uncertainty regarding the magnitude of impact. Research on the climate change impacts on water resources will be ongoing and will continue to evolve with further analysis and more refined methodologies. During the preparation of this Plan update, key literature resources on climate change have been reviewed. New scientific findings should be reviewed periodically and incorporated into the climate change vulnerability assessment, especially the findings pertinent to the sectors most vulnerable to climate change in the region. The RWMG will continue participating in ongoing Monterey Bay area forums to facilitate networking among water resources planners to exchange ideas on how to incorporate latest tools or science into local planning. The Climate Change Center of the California Energy Commission prepares periodic reports on climate model simulations for California and some specific Regions. It also maintains the Cal-Adapt site and updates the modeling tools as new climate change modeling results, based on more refined data, become available from the IPCC. In addition, some agencies in the Region have prepared their own climate change analyses for their watersheds and have used these studies to develop scenarios for vulnerability and adaptation assessments. The RWMG will continue to explore ways where existing and updated climate models, and other available climate change tools and projections for the Region, can be used for future vulnerability assessments updated in future versions of the Plan. The intent of future data gathering is to address gaps in the current vulnerability assessment, to improve the understanding of climate change impacts and vulnerabilities, and to enable more quantitative analyses. Future data gathering efforts should include data that facilitate more quantitative analysis of vulnerability within the context of the current and proposed projects and funding available.