happy jack 42mw wind project - oati weboasis · web view355 carr draw 16.7 0 barber creek 91.1 0...
TRANSCRIPT

COMMON USE SYSTEM
2010 LOCAL TRANSMISSION PLAN
PREPARED BY
BLACK HILLS CORPORATION TRANSMISSION PLANNING
December 8, 2010
_________________________________________________________________________________________________________________Common Use System: Transmission Coordination and Planning Committee2010 Local Transmission Plan December 8, 2010
1

Table of Contents
1. Introduction...............................................................................................................................41.1. Common Use Transmission System Background...........................................................41.2. Stakeholder Participation.................................................................................................4
2. Study Methodology....................................................................................................................62.1. Study Criteria....................................................................................................................62.2. Study Area..........................................................................................................................72.3. Study Case Development...................................................................................................72.4. Transmission Planning Assumptions...............................................................................9
3. Evaluation of the Common Use Transmission System..........................................................93.1. Steady-State Analysis........................................................................................................93.2. Category D Analysis........................................................................................................123.3. Transient Analysis...........................................................................................................16
4. Transmission System Expansion............................................................................................194.1. Osage 69 kV reactive voltage support............................................................................194.2. Belle Creek 69 kV reactive voltage support..................................................................204.3. Modification of Minimum Allowable Frequency Criterion........................................20
5. Changes from the 2009 LTP...................................................................................................205.1. Additional 230:69 kV transformation capacity............................................................205.2. Osage 69 kV reactive voltage support............................................................................215.3. Moorcroft 69 kV reactive voltage support....................................................................21
6. Conclusions...............................................................................................................................21
_________________________________________________________________________________________________________________Common Use System: Transmission Coordination and Planning Committee2010 Local Transmission Plan December 8, 2010
2

Appendices
Appendix A:.....................................................................................................................................22STEADY-STATE PRIOR OUTAGES......................................................................................23STEADY STATE FORCED OUTAGES..................................................................................24
List of Tables
Table 1: Common Use Transmission System Interconnection Points..........................................7Table 2: Study Case Naming Convention.....................................................................................10Table 3: 2015HS Category D Outage Summary...........................................................................13Table 4: 2015LW Category D Outage Summary.........................................................................14Table 5 : 2021HS Category D Outage Summary..........................................................................15Table 6: 2021LW Category D Outage Summary.........................................................................16Table 7: Transient Analysis Fault Summary................................................................................17
List of Figures
Figure 1: Common Use Transmission System................................................................................5
_________________________________________________________________________________________________________________Common Use System: Transmission Coordination and Planning Committee2010 Local Transmission Plan December 8, 2010
3

1. Introduction
In December of 2007, the Common Use System (CUS) participants filed with FERC Attachment K to the Joint Open Access Transmission Tariff (JOATT) to meet the requirements outlined in FERC Order 890. Through their Attachment K filing, the CUS participants created the Transmission Coordination and Planning Committee (TCPC) as the forum to conduct long-range planning studies while promoting stakeholder input and involvement. This report, intended to serve as the 2010 Local Transmission Plan (LTP), will outline the 2010 study cycle and present the findings of the planning study.
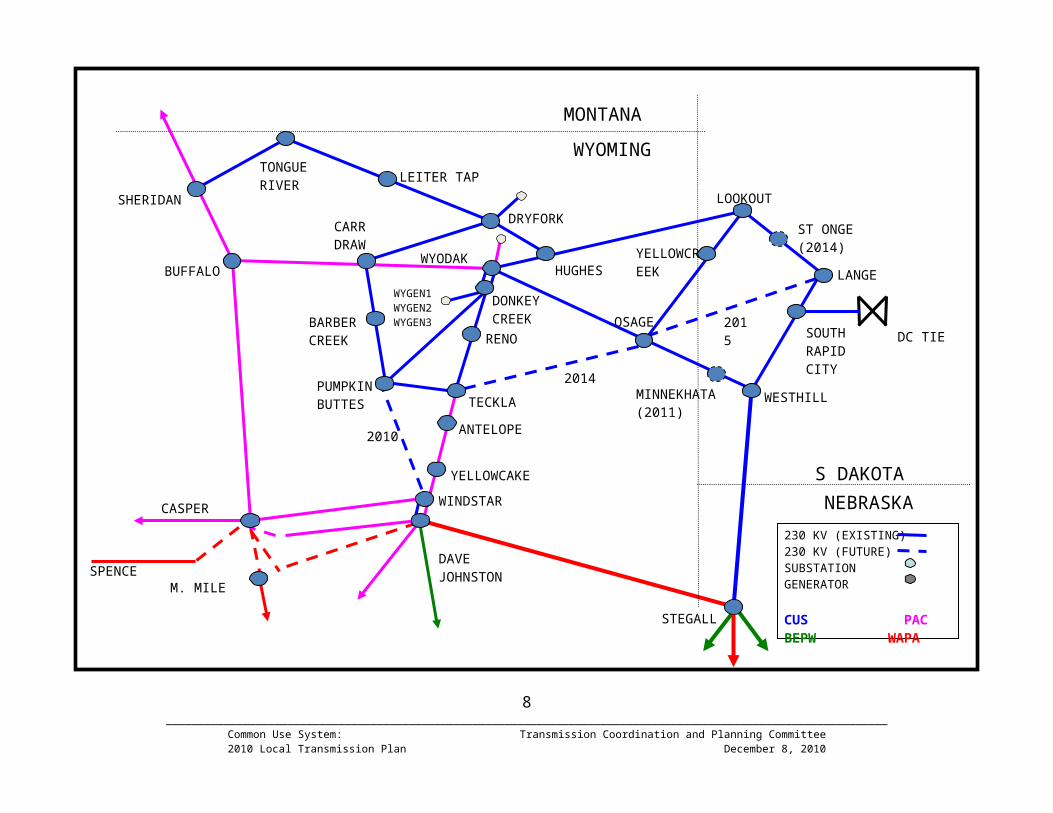
1.1. Common Use Transmission System BackgroundBlack Hills Power, Inc., Basin Electric Power Cooperative and Powder River Energy Corporation (referred to hereinafter as the Transmission Provider) each own certain transmission facilities with transmission service pursuant to a FERC-approved Joint Open Access Transmission Tariff (“JOATT”). The Transmission Provider commonly refers to these facilities as the Common Use System (“CUS”). A diagram of the CUS is shown in Figure 1.
1.2. Stakeholder ParticipationAll interested parties were encouraged to participate in the 2010 TCPC study process. An open stakeholder kick-off meeting and webinar was hosted at the Black Hills Power Service Center on March 25, 2010 to inform stakeholders of the proposed study plan and to provide an opportunity for suggestions and feedback on the study process. Requests for data pertaining to the modeling and evaluation of the transmission system were made by the Transmission Provider. Meeting notices were distributed via email and posted along with presentation materials on the Black Hills Basin Electric OASIS page at http://www.oatioasis.com/BHBE/index.html. The second and third quarterly stakeholder meetings were not held due to delays in the progression of the study process. Preliminary study results and a draft report were provided to the stakeholders via email and on the BHBE OASIS page prior to the Q4 meeting. Comments and feedback were solicited prior to the approval of the final report at the Q4 meeting.
_________________________________________________________________________________________________________________Common Use System: Transmission Coordination and Planning Committee2010 Local Transmission Plan December 8, 2010
4
Figure 1: Common Use Transmission System
5_________________________________________________________________________________________________________________Common Use System: Transmission Coordination and Planning Committee2010 Local Transmission Plan December 8, 2010
WYGEN1WYGEN2WYGEN3
S DAKOTANEBRASKA
WYOMING
MONTANA
BUFFALO
CASPER
DAVE JOHNSTON
LOOKOUT
LANGE
WESTHILL
RENO
SHERIDAN
TECKLA
STEGALL
YELLOWCAKE
SOUTH RAPID CITY
YELLOWCREEK
HUGHES
DC TIE
CARR DRAW
BARBER CREEK
M. MILE
OSAGE
TONGUE RIVER LEITER TAP
SPENCE
PUMPKINBUTTES
DONKEY CREEK
WYODAK
WINDSTAR
DRYFORKST ONGE(2014)
MINNEKHATA(2011)
ANTELOPE
2014
2015
2010
230 KV (EXISTING)230 KV (FUTURE)SUBSTATIONGENERATOR
CUS PACBEPW WAPA

2. Study Methodology
The BHBE transmission system was evaluated with planned system additions for 2015 and 2021 under both peak summer and off-peak winter load levels to identify any deficiencies in system performance. Steady state voltage and thermal analyses was performed, followed by transient stability analysis. Additional upgrades were identified and modeled as necessary to mitigate any reliability criteria violations.
2.1. Study CriteriaThe criteria described in 2.1.1 and 2.1.2 are consistent with the NERC TPL Reliability Standards, WECC TPL – (001 thru 004) – WECC – 1 – CR ─ System Performance Criteria and Colorado Coordinated Planning Group’s Voltage Coordination Guide.
2.1.1. Steady State Voltage CriteriaUnder system intact conditions, steady state bus voltages must remain between 0.95 and 1.05 per unit. Following a Category B or C contingency, bus voltages must remain between 0.90 and 1.10 per unit. Pre-existing voltage violations outside the localized study area were ignored during the evaluation.
2.1.2. Steady State Thermal CriteriaAll line and transformer loading must be less than 100% of their established continuous rating for system normal conditions (NERC/WECC Category A). All line and transformer loadings must be less than 100% of their established continuous or emergency rating under outage conditions (NERC/WECC Category B and C). Category D outages are to be evaluated for risk and consequence.
2.1.3. Transient Voltage and Frequency CriteriaNERC Standards require that the system remain stable and within applicable thermal ratings and voltage limits for Category A, B, and C disturbances. The WECC Disturbance – Performance Table of Allowable Effects on Other Systems states the following requirements:
Category B: Any transient voltage dip must not exceed 25% at load buses or 30% at non-load buses. The dip also must not exceed 20% for more than 20 cycles at load buses. Frequency must not drop below 59.6 Hz for 6 or more cycles at a load bus, including generation station service load.
Category C: Any transient voltage dip must not exceed 30% at load buses or 30% at non-load buses. The dip also must not exceed 20% for more than 40 cycles at load buses. Frequency must not drop below 59.0 Hz for 6 or more cycles at a load bus, including station service load.
Based in part on the NERC/WECC requirements, the following criteria were used to determine acceptable transient system performance:
_________________________________________________________________________________________________________________Common Use System: Transmission Coordination and Planning Committee2010 Local Transmission Plan December 8, 2010
6

All machines in the system shall remain in synchronism as demonstrated by their relative rotor angles.
System stability is evaluated based on the damping of the relative rotor angles and the damping of the voltage magnitude swings.
For central, northern and eastern Wyoming and western South Dakota, the following dynamic stability guidelines have been established: Following a single contingency disturbance with normal fault clearing, the bus voltage transient swing on all buses should not be lower than 0.70 per unit, and the system should exhibit positive damping.
The frequency criteria specified in the WECC Disturbance – Performance Table of Allowable Effects on Other Systems was utilized for the analysis. However, CUS transmission providers may adopt, for internal purposes only, a less stringent standard than the NERC/WECC Planning Standard. See Section 4.3 for details regarding this proposed change.
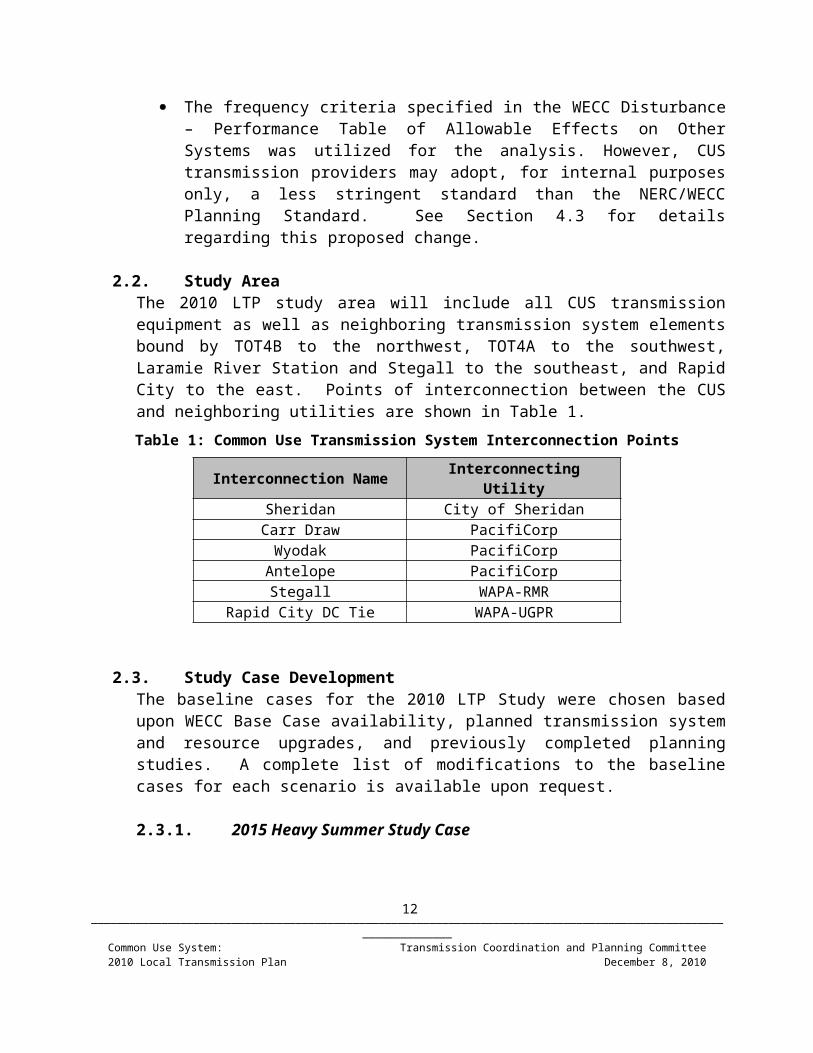
2.2. Study AreaThe 2010 LTP study area will include all CUS transmission equipment as well as neighboring transmission system elements bound by TOT4B to the northwest, TOT4A to the southwest, Laramie River Station and Stegall to the southeast, and Rapid City to the east. Points of interconnection between the CUS and neighboring utilities are shown in Table 1.
Table 1: Common Use Transmission System Interconnection Points
Interconnection Name Interconnecting UtilitySheridan City of Sheridan
Carr Draw PacifiCorpWyodak PacifiCorpAntelope PacifiCorpStegall WAPA-RMR
Rapid City DC Tie WAPA-UGPR
2.3. Study Case DevelopmentThe baseline cases for the 2010 LTP Study were chosen based upon WECC Base Case availability, planned transmission system and resource upgrades, and previously completed planning studies. A complete list of modifications to the baseline cases for each scenario is available upon request.
2.3.1. 2015 Heavy Summer Study CaseThe WECC 15hs2a1p.sav case was updated by CCPG participants and used in the 2010 CCPG study. This case was used as the starting point for the 2015 summer peak analysis. Updates to the case loads, resources, and topology were solicited from neighboring systems and applied to the model during the CCPG study process.
_________________________________________________________________________________________________________________Common Use System: Transmission Coordination and Planning Committee2010 Local Transmission Plan December 8, 2010
7
Additional CUS modifications were made to better represent the study area in detail for this analysis. There were no major resource additions to the CUS existing generation facilities with the exception of the Dry Fork unit, with a scheduled in-service date of late spring/early summer 2011.
Significant transmission additions to the existing system for 2015 included a Pumpkin Buttes-Windstar 230 kV line, a new 230 kV line from Teckla to Osage to Lange, a new 230:69 kV substation at Minnekhata, and a new 230:69 kV substation at St. Onge.
Additional assumptions made for the 2015HS scenario included the Ault-Cherokee 230 kV line out of service, a second 10 MVAR capacitor at the Osage 69 kV bus (both of which are auto-switched), and the Miles City DC Tie scheduled at 0 MW.
2.3.2. 2015 Light Winter Study CaseThe WECC 14la1sa1p.sav case was updated and used as the 2010 CCPG 12LA study case. This updated CCPG case was chosen as the starting point for the 2015 winter off-peak analysis. System topology was updated to match the 2015 Heavy Summer case, and the loads and resources were adjusted accordingly.
Additional assumptions made for the 2015LW scenario included the Ault-Cherokee 230 kV line out of service, a second 10 MVAR capacitor at the Osage 69 kV bus (both of which are auto-switched), and the Miles City DC Tie scheduled at 135 MW east-to-west.
2.3.3. 2021 Heavy Summer Study CaseThe WECC-approved 20hs1ap.sav study case was used as the starting point for the 2021 summer peak analysis. The 2020HS CCPG study case, which originated from the same WECC-approved case, was not used as a starting case because it was modified numerous times through the High Plains Express study process before it made it to the CCPG study. This resulted in irresolvable issues with dynamic initialization. Therefore, the applicable CCPG updates were applied to the WECC case, as well as additional changes provided by PacifiCorp and CUS participants, to achieve reasonable case accuracy and dynamic simulation capability.
Additional assumptions made for the 2021HS scenario included the Ault-Cherokee 230 kV line in service, a second 10 MVAR capacitor at the Osage 69 kV bus (both of which are auto-switched), the Miles City DC Tie scheduled at 144 MW east-to-west, and a second 2.1 MVAR 69 kV capacitor online at Belle Creek. This second capacitor was identified as a recommended upgrade in the 2009 LTP to mitigate low voltages on the Sundance Hill-Belle Creek 69 kV line. The Two Elk generation project and associated infrastructure were not included in this assessment.
2.3.4. 2021 Light Winter Study Case
_________________________________________________________________________________________________________________Common Use System: Transmission Coordination and Planning Committee2010 Local Transmission Plan December 8, 2010
8

The WECC 19hw1a1p.sav case was updated and used as the 2009 CCPG 2020HW study case. This updated case was chosen as the starting point for the 2021 light winter analysis. Regional system topology was updated to match the 2021 Heavy Summer TCPC case, and the loads and resources were adjusted accordingly.
Additional assumptions made for the 2021LW scenario included the Ault-Cherokee 230 kV line in service, a second 10 MVAR capacitor at the Osage 69 kV bus (both of which are auto-switched), a second 2.1 MVAR 69 kV capacitor online at Belle Creek, and the Miles City DC Tie scheduled at 143 MW east-to-west. The Two Elk generation project and associated infrastructure were not included in this assessment.
2.4. Transmission Planning AssumptionsThe 2010 LTP study was performed for both the 2015 and 2021 time frames with the following assumptions:
All existing and planned facilities and the effects of control devices and protection systems were accurately represented in the system model.
Projected firm transfers were represented per load and resource updates from each stakeholder.
Existing and planned reactive power resources were modeled to ensure adequate system performance.
There were no specific planned outages identified for the 2015 and 2021 study periods. A series of prior outages on facilities deemed to be most critical by the transmission planner was simulated to identify potential risks associated with such outages in the study time frame. A list of the evaluated prior and forced outages is included in Appendix A.
For system intact solutions, transformer taps and switched shunts were allowed to adjust. Following a contingency, adjustment of these devices was disabled for the local study area unless the equipment design allowed for such adjustments. For all solutions, area interchange control and phase shifter adjustments were disabled, while DC tap adjustment was enabled. A fixed slope decoupled Newton solution method was utilized through the analysis.
Each scenario described in Section 2.3 was evaluated to meet the requirements of the criteria described in 2.1.
3. Evaluation of the Common Use Transmission System
3.1. Steady-State AnalysisThe steady-state analysis was performed with several case options for each load scenario. The first option allowed for various prior outages to be applied to the study case. The second option provided different levels of generation output in Rapid City based on the
_________________________________________________________________________________________________________________Common Use System: Transmission Coordination and Planning Committee2010 Local Transmission Plan December 8, 2010
9

outage selected in the first option. The third option altered the flow across the Rapid City DC Tie. The fourth option changed the status of the normal open points on the Black Hills 69 kV system from open to closed. This was done to observe the effects of a radial 69 kV system compared to a tied-through system. Study case designations were formatted according to the selected options as shown in Table 2.
Table 2: Study Case Naming Convention
Prior Outage_RC Generation_RCDC Tie_69kV ConfigurationPrior Outage: See Appendix A RC Generation: NC No Change RCGEN0 0 MW online in RC RCGEN1 15 MW online in RC
RCGEN2 35 MW online in RCRCGEN3 55 MW online in RCRCGEN4 70 MW online in RCRCGEN5 85 MW online in RCRCGEN6 100 MW online in RCRCGEN7 115 MW online in RCRCGEN5 130 MW online in RC
RCDC Tie Schedule: 0E-W RCDC Tie blocked200E-W 200 MW east-to-west200W-E 200 MW west-to-east
69 kV Configuration: NC No Change ALLTIED Black Hills N.O. Points Closed
There were certain prior outages that required additional generation in Rapid City to prevent reliability criteria violations following a contingency event. The prior outages include one of the parallel Lange 230:69 kV transformers or the South Rapid City 230 kV transformer. The additional generation was required to reduce transformer loading following the loss of a second 230:69 kV transformer feeding Rapid City. This ‘Must Run Generation’ is specified in an operating procedure currently in place on the CUS. Therefore, transformer loading mitigated by Must Run Generation procedures was not included in the results summary.
3.1.1. 2015 Heavy Summer Results
All violations encountered in the heavy summer analysis followed an N-1-1 outage and occurred as a result of the RCDC Tie scheduled at 200 MW in either direction. A remedial action scheme (RAS) is currently in place to restrict flow across the tie following certain outages based on system conditions at the time of the event. All
_________________________________________________________________________________________________________________Common Use System: Transmission Coordination and Planning Committee2010 Local Transmission Plan December 8, 2010
10

identified violations were mitigated by reducing the flow across the RCDC Tie either manually following a prior outage or post-contingent assuming automatic operation of the RAS.
3.1.2. 2015 Light Winter ResultsA low voltage violation occurred at the Gillette and Gillette South 69 kV buses following the N-1-1 loss of both Wyodak 230:69 kV transformers. This violation was mitigated by dispatching the NSS CT generation. This issue was not identified in the heavy summer analysis because the NSS CT units were used to meet the resource requirements of the peak load scenario. The reduced demand in the light winter case did not require the units to be online, except in this particular case of a Wyodak transformer prior outage.
All other violations encountered in the light winter analysis followed an N-1-1 outage and occurred as a result of the RCDC Tie scheduled at 200 MW in either direction, similar to the heavy summer scenario. A remedial action scheme (RAS) is currently in place to restrict flow across the tie following certain outages based on system conditions at the time of the event. All identified violations were mitigated by reducing the flow across the RCDC Tie either manually following a prior outage or post-contingent assuming automatic operation of the RAS.
3.1.3. 2021 Heavy Summer ResultsThe 69 kV system in Rapid City was modified from its normal operating configuration for the South Rapid City 230:69 kV transformer prior outage. This was done to mitigate an overload on the Ben French-Pleasant Valley 69 kV line following the South Rapid City-Cambell 69 kV contingency. The normal open point at 6RS44 was moved to 6RS42, effectively moving the Robbinsdale and 5th Street load from the South Rapid City feed to the Cemetery feed. This procedure is operational in nature and will be reviewed prior to implementation in the future.
Low voltages occurred on the Osage 69 kV system following the N-1-1 loss of the Osage and Hughes 230:69 kV transformers. The voltage was restored to within the 0.90 p.u. threshold by adding a 5 MVAR capacitor to the Moorcroft or Osage 69 kV buses. Osage was selected as the location for this capacitor primarily due to the fact that the Osage plant retirement will open up additional bays at the 69 kV substation, reducing overall capital costs as opposed to the Moorcroft location specified in previous LTP reports. Additional study work may be necessary to determine the optimal size and location for the capacitor, alternatives such as distribution power factor correction, etc. and will be coordinated with all affected parties.
All other violations encountered in the heavy summer analysis followed an N-1-1 outage and occurred as a result of the RCDC Tie scheduled at 200 MW in either direction, similar to the heavy summer scenario. A remedial action scheme (RAS) is
_________________________________________________________________________________________________________________Common Use System: Transmission Coordination and Planning Committee2010 Local Transmission Plan December 8, 2010
11
currently in place to restrict flow across the tie following certain outages based on system conditions at the time of the event. All identified violations were mitigated by reducing the flow across the RCDC Tie either manually following a prior outage or post-contingent assuming automatic operation of the RAS.
3.1.4. 2021 Light Winter ResultsOvervoltage violations occurred on the Osage 69 kV system following the N-1-1 loss of the Osage 230:69 kV transformer plus the Osage-88 Oil 69 kV line. For this prior outage, both 10 MVAR capacitors were online at the Osage 69 kV bus. The Osage-88 Oil contingency dropped approximately 15 MW of radial load, causing Osage 69 kV voltages to rise to 1.158 per unit. The Osage capacitors will switch automatically and avoid the high voltage violations. It was deemed beneficial to feed the Newcastle load through 6F59 and move the normal open point from 6NF27 to 6N26. This would open the line between Newcastle and the Wyoming Refinery, reduce the amount of load dropped for that single contingency and avoid voltage spikes in the Osage area. It also aided in reducing low voltages in the heavy summer scenario. This procedure is operational in nature and will be reviewed prior to future implementation.
All other violations encountered in the light winter analysis followed an N-1-1 outage and occurred as a result of the RCDC Tie scheduled at 200 MW in either direction, similar to the heavy summer scenario. A remedial action scheme (RAS) is currently in place to restrict flow across the tie following certain outages based on system conditions at the time of the event. All identified violations were mitigated by reducing the flow across the RCDC Tie either manually following a prior outage or post-contingent assuming automatic operation of the RAS.
In addition to the results mentioned in 3.1.1 through 3.1.4, it was worth mentioning that the option of closing the normal open points on the Black Hills’ 69 kV system did not produce any adverse impacts on the rest of the CUS. It did provide the benefit of avoiding consequential load shedding following a 230:69 kV transformer contingency. This option was added to identify any impacts it may have on the long-term planning of the CUS infrastructure, but the results were deemed most useful in the operating horizon.
3.2. Category D AnalysisSeveral significant Category D outages were selected to identify the impacts of each outage on the remaining transmission system. The Category D bus outages were deemed significant because they interconnect three or more network elements. The outages were simulated by disconnecting the bus and all associated network elements for each load scenario.
_________________________________________________________________________________________________________________Common Use System: Transmission Coordination and Planning Committee2010 Local Transmission Plan December 8, 2010
12

Table 3: 2015HS Category D Outage Summary
Bus Outage (230 kV) Load Tripped (MW) Generation Tripped (MW)Lange 0 0
Lookout 71.1 3St. Onge 42.9 0
South Rapid City 0 0Westhill 0 0
Minnekhata 0 0Yellowcreek 20.3 0
Osage 0 0Hughes 0 0Wyodak 36 (station service) 375Dry Fork 30 (station service) 415
Donkey Creek 34.8 (station service) 385Carr Draw 14.7 0
Barber Creek 95.6 0Pumpkin Buttes 42 0
Teckla 83.6 0Reno 67 0
Leiter Tap 14.3 0Tongue River 34.6 0
The simulation of Category D outages in the 2015HS scenario resulted in the RCSouth 230:69 kV transformer reaching 120% of its continuous rating following the Lange outage. Loading was reduced by dispatching generation in Rapid City. There were no other violations.
_________________________________________________________________________________________________________________Common Use System: Transmission Coordination and Planning Committee2010 Local Transmission Plan December 8, 2010
13

Table 4: 2015LW Category D Outage Summary
Bus Outage (230 kV) Load Tripped (MW) Generation Tripped (MW)Lange 0 0
Lookout 42.5 0St. Onge 32.5 0
South Rapid City 0 0Westhill 0 0
Minnekhata 0 0Yellowcreek 13.8 0
Osage 0 0Hughes 0 0Wyodak 36 (station service) 375Dry Fork 30 (station service) 383
Donkey Creek 34.8 (station service) 355Carr Draw 16.7 0
Barber Creek 91.1 0Pumpkin Buttes 34.9 0
Teckla 66.5 0Reno 57.9 0
Leiter Tap 14.0 0Tongue River 30.9 0
The simulation of Category D outages in the 2015LW scenario resulted in low voltages on the Wyodak 69 kV system of 0.887 p.u. or higher following the Wyodak outage. There were no other violations.
_________________________________________________________________________________________________________________Common Use System: Transmission Coordination and Planning Committee2010 Local Transmission Plan December 8, 2010
14

Table 5 : 2021HS Category D Outage Summary
Bus Outage (230 kV) Load Tripped (MW) Generation Tripped (MW)Lange 0 0
Lookout 77.2 3St. Onge 36.0 0
South Rapid City 0 0Westhill 0 0
Minnekhata 0 0Yellowcreek 22.1 0
Osage 0 0Hughes 0 0Wyodak 36 (station service) 375Dry Fork 30 (station service) 420
Donkey Creek 34.8 (station service) 384Carr Draw 15.2 0
Barber Creek 100.7 0Pumpkin Buttes 38.8 0
Teckla 87.3 0Reno 69.5 0
Leiter Tap 13.9 0Tongue River 36.0 0
The simulation of Category D outages in the 2021HS scenario resulted in loading of under 102% on the 69 kV lines between Gillette and NSS1 or NSS2 following the Wyodak outage. There were no other violations.
_________________________________________________________________________________________________________________Common Use System: Transmission Coordination and Planning Committee2010 Local Transmission Plan December 8, 2010
15
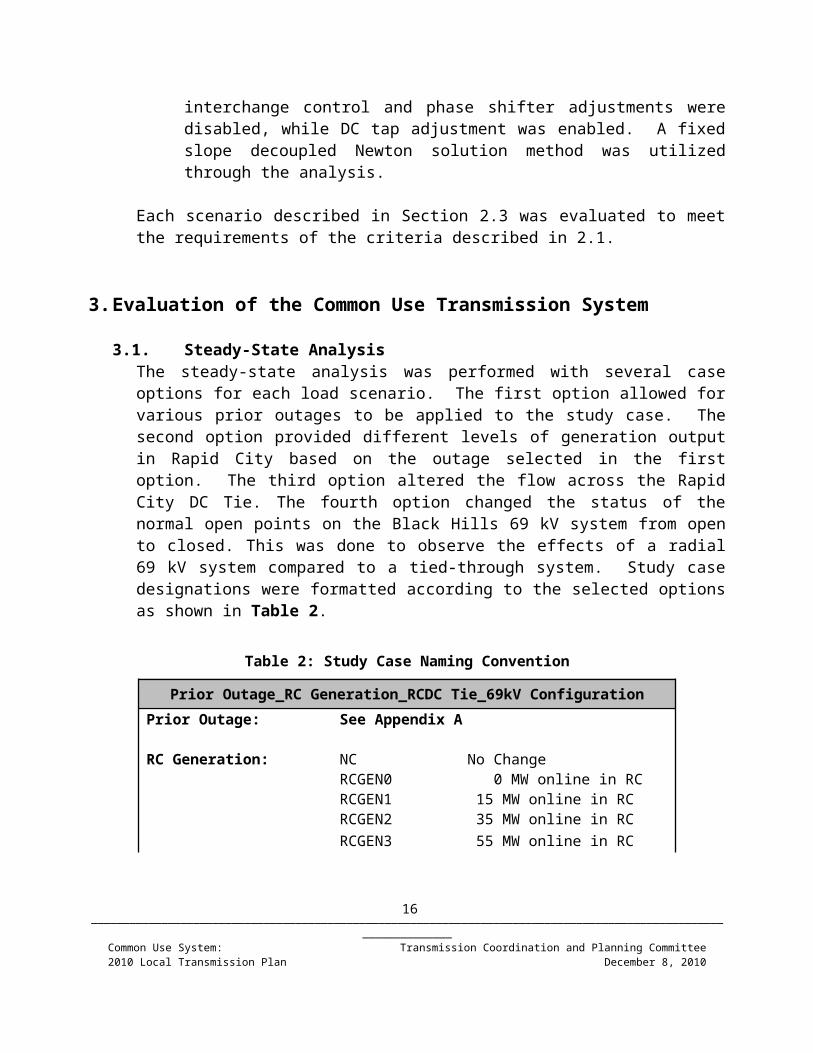
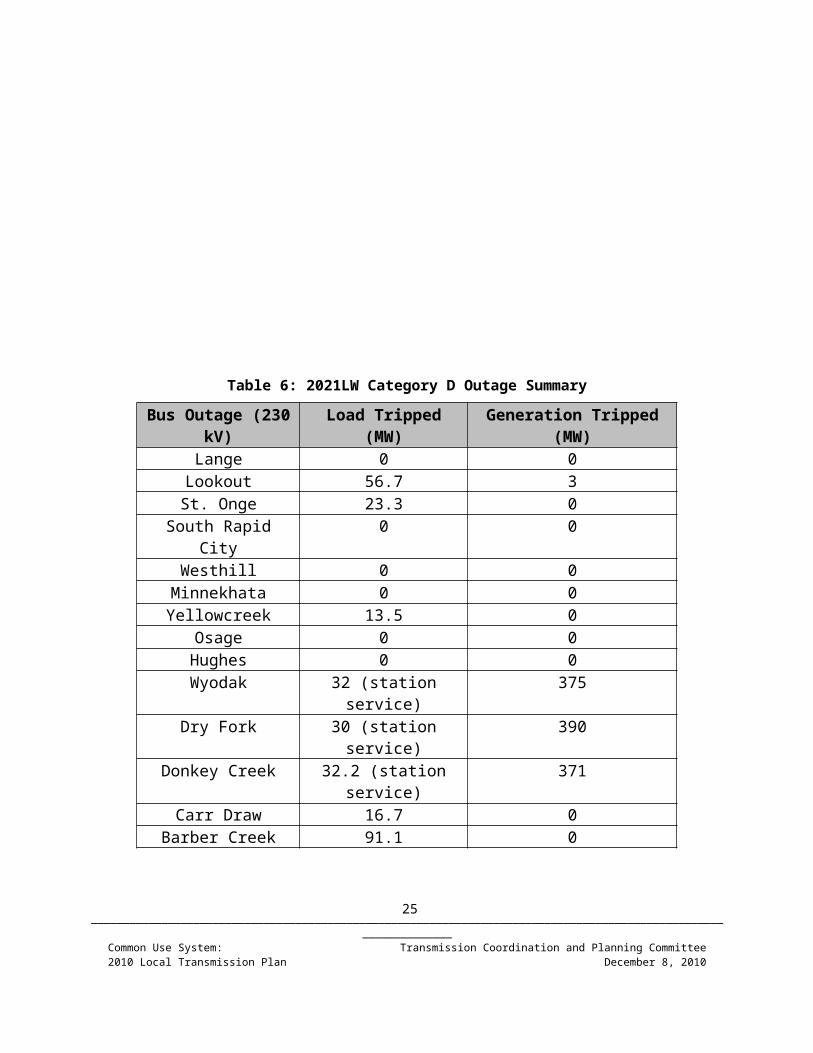
Table 6: 2021LW Category D Outage Summary
Bus Outage (230 kV) Load Tripped (MW) Generation Tripped (MW)Lange 0 0
Lookout 56.7 3St. Onge 23.3 0
South Rapid City 0 0Westhill 0 0
Minnekhata 0 0Yellowcreek 13.5 0
Osage 0 0Hughes 0 0Wyodak 32 (station service) 375Dry Fork 30 (station service) 390
Donkey Creek 32.2 (station service) 371Carr Draw 16.7 0
Barber Creek 91.1 0Pumpkin Buttes 34.9 0
Teckla 66.5 0Reno 57.9 0
Leiter Tap 14.0 0Tongue River 30.9 0
The simulation of Category D outages in the 2021LW scenario resulted in Rapid City voltages dipping to a minimum of 0.895 per unit following the Lange outage. This violation was mitigated by switching on a 69 kV capacitor in Rapid City. There were no other violations.
3.3. Transient AnalysisTransient analysis was performed to evaluate the dynamic characteristics of the transmission system in proximity to the CUS footprint following various disturbances. With the exception of Powder River Energy Corp. loads, system loads were modeled using the WECC generic motor load penetration of 20 percent, with the under voltage load shedding function disabled to provide a worst-case representation of system performance. The non-coal bed methane (CBM) PRECorp loads were modeled as 30 percent motor load and the CBM loads were modeled as 80 percent motor load. The critical outage combinations evaluated in the transient analysis were selected based on significance with respect to proximity to local generation, clearing of a CUS tie line, or performance during steady state analysis. The 3-phase faults listed in Table 7 were simulated for both 2015 and 2021 scenarios.
_________________________________________________________________________________________________________________Common Use System: Transmission Coordination and Planning Committee2010 Local Transmission Plan December 8, 2010
16

Table 7: Transient Analysis Fault Summary
Prior Outage Faulted Bus(230 kV) Cleared Element
Fault Duration (cycles)
System Intact None None N/ASystem Intact Wyodak Wyodak-Hughes 230 4.25System Intact Wyodak Wyodak-Osage 230 4.25System Intact Wyodak Wyodak-Osage 230 3.5System Intact Wyodak Wyodak-Carr Draw 230 4.25System Intact Wyodak Wyodak-Donkey Creek 230 4.25System Intact Wyodak Wyodak Plant 4.25System Intact D. Creek Donkey Creek-Wyodak 230 4.25System Intact D. Creek Donkey Creek-Reno 230 4.25System Intact D. Creek Donkey Creek-Pumpkin Buttes 230 3.5System Intact Reno Reno-Donkey Creek 230 4.25
System Intact (RCDC@200E-W) Wyodak Wyodak-Hughes 230 4.25System Intact (RCDC@200E-W) Wyodak Wyodak-Osage 230 4.25System Intact (RCDC@200E-W) Wyodak Wyodak-Carr Draw 230 4.25System Intact (RCDC@200E-W) Wyodak Wyodak-Donkey Creek 230 4.25System Intact (RCDC@200W-E) Wyodak Wyodak-Hughes 230 4.25System Intact (RCDC@200W-E) Wyodak Wyodak-Osage 230 4.25System Intact (RCDC@200W-E) Wyodak Wyodak-Carr Draw 230 4.25System Intact (RCDC@200W-E) Wyodak Wyodak-Donkey Creek 230 4.25
System Intact Dry Fork Dry Fork-Hughes 230 4.25System Intact Dry Fork Dry Fork-Carr Draw 230 4.25System Intact Dry Fork Dry Fork-Tongue River 230 4.25System Intact Dry Fork Dry Fork Plant 3.5Wyodak Plant Dry Fork Dry Fork Plant 3.5
Dry Fork-Leiter Tap 230 Dry Fork Dry Fork-Carr Draw 230 4.25Dry Fork-Carr Draw 230 Dry Fork Dry Fork-Hughes 230 4.25
Dry Fork-Hughes 230 Dry Fork Dry Fork-Tongue River 230 4.25St. Onge-Lange 230(RCDC@200W-E) Osage Osage-Lange 230 +
RCDC Tie 4.25 + 7
South Rapid City-Westhill 230(RCDC@200W-E) Osage Osage-Lange 230 +
RCDC Tie 4.25 + 7
Teckla-Osage 230(RCDC@200W-E) Wyodak Wyodak-Osage 230 +
RCDC Tie 4.25 + 7
Teckla-Osage 230(RCDC@200W-E) Lookout Lookout-Hughes 230 +
RCDC Tie 4.25 + 7
Osage-Minnekhata 230(RCDC@200W-E) Lange Lange-South Rapid City 230 +
RCDC Tie 4.25 + 7
_________________________________________________________________________________________________________________Common Use System: Transmission Coordination and Planning Committee2010 Local Transmission Plan December 8, 2010
17

For each five second simulation, plots including local machine parameters, tie line flows, bus voltages, and frequencies at various points throughout the study area were created. Due to the large quantity of plots created, they are not included in this report but are available upon request.
3.3.1. 2015HS ResultsThere were two issues identified during the 2015HS transient analysis:
System instability occurred for the case of the Dry Fork-Carr Draw 230 kV prior outage followed by a contingency on the Dry Fork-Hughes 230 kV line. Following this event, the Dry Fork plant output is restricted to the Dry Fork-Sheridan 230 kV path. A generation runback to 300 MW gross was necessary to mitigate violations associated with this outage. This known issue is operational in nature and will be addressed in greater detail by BEPC and BHP in the operating horizon.
Post-contingent frequency criteria violations occurred at the Wygen1-3, NSS CT 1-2, NSS1, and NSS2 13.8 kV terminal buses following N-1 faults at the Wyodak or Donkey Creek 230 kV buses. The worst-case contingencies involving the Wyodak-Carr Draw or Wyodak-Osage 230 kV lines also caused frequency dips below 59.6 Hz at the Wyodak, Gillette, Gillette_S, NSS1, and NSS2 69 kV buses. The frequency violations were eliminated at the 69 kV buses and reduced to only three 13.8 kV buses by replacing the three-cycle breakers with two-cycle breakers at Wyodak. Application of the Category C outage minimum frequency criterion to Category B outages would also prevent violations.
3.3.2. 2015LW ResultsThe 2015LW scenario exhibited frequency violations similar to the 2015HS scenario, but to a lesser degree. The worst-case Wyodak-Osage contingency produced frequency violations at the Wygen 1-3 and NSS2 13.8 kV buses. By implementing two-cycle 230 kV breakers at Wyodak, the identified frequency violations were eliminated. Application of the Category C outage minimum frequency criterion to Category B outages would also prevent violations.
3.3.3. 2021HS ResultsThere were two issues identified during the 2021HS transient analysis:
System instability occurred for the case of the Dry Fork-Carr Draw 230 kV prior outage followed by a contingency on the Dry Fork-Hughes 230 kV line. Following this event, the Dry Fork plant output is restricted to the Dry Fork-Sheridan 230 kV path. A generation runback to 290 MW gross was necessary to mitigate violations associated with this outage. This known issue is operational in nature and will be addressed in greater detail by BEPC and BHP in the operating horizon.
_________________________________________________________________________________________________________________Common Use System: Transmission Coordination and Planning Committee2010 Local Transmission Plan December 8, 2010
18

Post-contingent frequency criteria violations occurred at the Wygen1-3, NSS1, and NSS2 13.8 kV terminal buses following N-1 faults at the Wyodak or Donkey Creek 230 kV buses. The frequency violations were eliminated at all of the 13.8 kV buses except NSS2 by replacing the three-cycle breakers with two-cycle breakers at Wyodak. Application of the Category C outage minimum frequency criterion to Category B outages would also prevent violations.
3.3.4. 2021LW ResultsThere were two issues identified during the 2015LW transient analysis:
Based on the results of the 2015HS transient stability simulations, a Dry Fork unit runback to 300 MW gross was in place for the Dry Fork-Carr Draw 230 kV prior outage for all 2021LW steady state cases. This reduced level of generation proved sufficient to maintain stability for the Dry Fork-Carr Draw + Dry Fork-Hughes outage combination in the light winter transient stability simulation.
Similar to the previous scenarios, frequency dip violations were present at the NSS2 and Wygen 1-3 13.8 kV buses following an N-1 fault at the Wyodak or Donkey Creek 230 kV buses. Replacing the existing three-cycle breakers with two-cycle breakers at Wyodak mitigated the frequency violations. Application of the Category C outage minimum frequency criterion to Category B outages would also prevent violations.
With the exception of the minor issues mentioned in Sections 3.3.1 through 3.3.4, all dynamic simulations resulted in acceptable results for each evaluated study scenario. There were no additional post-contingent voltage dip violations or frequency criteria violations. Assuming a generation runback at Dry Fork for the Wyodak-Carr Draw 230 kV prior outage, all system oscillations were adequately damped. Additional prior and forced outage combinations of the three 230 kV lines terminated at Dryfork were not evaluated in this analysis. These combinations may require a generation runback at Dryfork, but the requirements are operational in nature and are better addressed through near-term operational studies.
4. Transmission System Expansion
The following transmission system projects and practices have been identified as possible solutions to mitigate the reliability criteria violations mentioned in Sections 3.1 and 3.3.
4.1. Osage 69 kV reactive voltage support A 5 MVAR capacitor in service at the Osage 69 kV bus would mitigate low voltages on the Osage 69kV system under 2021 high load scenarios. Further analysis of Osage-area load
_________________________________________________________________________________________________________________Common Use System: Transmission Coordination and Planning Committee2010 Local Transmission Plan December 8, 2010
19

growth and power factor will be necessary to determine the exact size and type of voltage support and required in-service date.
4.2. Belle Creek 69 kV reactive voltage support A second 2.1 MVAR capacitor in service at the Belle Creek 69 kV bus would help mitigate low voltages on the Sundance Hill-Belle Creek 69 kV line under high load scenarios. The second 2.1 MVAR capacitor could be manually be switched into service on-site without further system upgrades. In order to remotely monitor voltages and switch the cap into service, a 69 kV breaker and a communication link to Belle Creek would need to be added. Further analysis of the load growth and potential development in the area will be necessary to determine the required upgrades.
4.3. Modification of Minimum Allowable Frequency CriterionPost-contingent frequency dip violations at various Wyodak-area 69 and 13.8 kV buses were mitigated in most instances by reducing the total fault clearing times on the close-in 230 kV faults at Wyodak or Donkey Creek to 3.5 cycles from 4.25 cycles. Most of the 230 kV breakers at Wyodak are older oil-type circuit breakers, and an upgrade to 2 cycle breakers would provide the opportunity to incorporate newer technology. This option is not a complete solution to the frequency dip issues identified, and due to associated costs, is not recommended.
All frequency dip violations, including those that were not completely mitigated by installing faster breakers, were mitigated by observing a less stringent frequency dip criterion. By utilizing the NERC/WECC Category C frequency dip criterion with a minimum allowable frequency dip of 59.0 Hz for no more than 6 cycles, all frequency dip violations were avoided. This modified criterion would eliminate the need to replace the 230 kV breakers at Wyodak, or provide a viable solution in the interim until the breakers are replaced. This exception would apply solely to Donkey Creek generator terminal buses, as well as load and generator terminal buses connected to the Wyodak 69 kV system. The CUS transmission providers would continue to meet the NERC/WECC Planning Standards regarding impacts on its neighbors.
5. Changes from the 2009 LTP
The 2009 LTP specified several projects that are not represented in the 2010 LTP in their original form, either because the projects were completed or study results indicated a better option. These projects are listed below.
5.1. Additional 230:69 kV transformation capacityThis project was completed in 2010 in the form of a 150 MVA 230:69 kV transformer at Lookout. The upgrade was removed from the 2010 LTP.
_________________________________________________________________________________________________________________Common Use System: Transmission Coordination and Planning Committee2010 Local Transmission Plan December 8, 2010
20

5.2. Osage 69 kV reactive voltage supportThis project was modified from the 2009 LTP, which recommended a second 10 MVAR capacitor at Osage. In 2010, operations at the Osage generation facility were suspended prior to the original retirement date of 2012. This required the second Osage 10 MVAR capacitor to be placed in-service earlier than initially planned. The capacitor is planned for installation in late 2010 or early 2011. The 2010 LTP specifies at least a 5 MVAR capacitor at Osage prior to 2021, in addition to the existing 10 MVAR and the planned 10 MVAR capacitors. This third capacitor will take the place of the Moorcroft capacitor identified in the 2009 LTP.
5.3. Moorcroft 69 kV reactive voltage supportThis project was removed from the 2010 LTP, and replaced by the 5 MVAR capacitor at Osage as described in Section 4.1.
6. Conclusions
An open and transparent process was utilized in conducting the 2010 Local Transmission Plan study. Stakeholders were provided the opportunity for involvement and input into the study scope and process. Through this process, the TCPC participants believe they have fulfilled the requirements of Attachment K to the Open Access Transmission Tariff (OATT).
The suggested transmission system additions identified in the 2010 LTP were found to be adequate through the 2021 timeframe.
The additional voltage support at the Osage 69 kV bus in lieu of the Moorcroft capacitor was identified in the assessment.
Additional voltage support at the Belle Creek 69 kV bus will be required in the future. Load growth and development along the Sundance Hill-Belle Creek 69 kV line will be the primary driver of this project, and will ultimately determine the final project specifications.
The replacement of the three-cycle breakers at the Wyodak and Donkey Creek 230 kV buses with two-cycle breakers would reduce or eliminate the occurrence of frequency dip violations following three-phase faults at these buses through the 2021 timeframe. The implementation of a modified frequency dip criterion to the localized Wyodak area would allow for compliance with approved reliability criteria without requiring the capital input that the breaker replacement would. Another alternative would be to implement a combination of the two options.
Assessment of the identified system enhancements will continue through additional transmission planning studies and the TCPC study process. This will ensure the Common Use transmission system will effectively meet the requirements for all transmission customers.
_________________________________________________________________________________________________________________Common Use System: Transmission Coordination and Planning Committee2010 Local Transmission Plan December 8, 2010
21

Appendix A:
Steady State Analysis:Prior and Forced Outages
_________________________________________________________________________________________________________________Common Use System: Transmission Coordination and Planning Committee2010 Local Transmission Plan December 8, 2010
22

STEADY-STATE PRIOR OUTAGESPRIOR OUTAGE SERIES GENERATOR SERIES TRANSFORMER SERIES
LABEL DESCRIPTION LABEL DESCRIPTION LABEL DESCRIPTION
SYSINT SYSTEM INTACT GEN-1 WYODAK UNIT XFMR-1 NOT USED
PO 230-1 GOOSE CREEK-SHERIDAN GEN-2 DRY FORK UNIT XFMR-2 DJ XFMR
PO 230-2 BUFFALO-SHERIDAN GEN-3 WYGEN3 UNIT XFMR-3 WYODAK XFMR 1
PO 230-3 BUFFALO-KAYCEE GEN-4 LRS UNIT XFMR-4 WYODAK XFMR 2
PO 230-4 CASPER-CLAIM JUMPER GEN-5 DJ UNIT #4 XFMR-5 WESTHILL XFMR
PO 230-5 CASPER-DAVE JOHNSTON XFMR-6 OASGE XFMR
PO 230-6 SHERIDAN-TONGUE RIVER XFMR-7 HUGHES XFMR
PO 230-7 TONGUE RIVER-LEITER TAP XFMR-8 LANGE XFMR 1
PO 230-8 LEITER TAP-DRY FORK XFMR-9 LANGE XFMR 2
PO 230-9 DRY FORK-CARR DRAW XFMR-10 LOOKOUT XFMR 1
PO 230-10 DRY FORK-HUGHES XFMR-11 LOOKOUT XFMR 2
PO 230-11 BUFFALO-CARR DRAW XFMR-12 YELLOWCREEK XFMR
PO 230-12 WYODAK-CARR DRAW XFMR-13 SOUTH RAPID CITY XFMR
PO 230-13 CARR DRAW-BARBER CREEK XFMR-14 ST. ONGE XFMR
PO 230-14 BARBER CREEK-PUMPKIN BUTTES XFMR-15 MINNEKHATA XFMR
PO 230-15 WINDSTAR-PUMPKIN BUTTES
PO 230-16 PUMPKIN BUTTES-TECKLA
PO 230-17 TECKLA-ANTELOPE
PO 230-18 YELLOWCAKE-WINDSTAR
PO 230-19 WINDSTAR-DAVE JOHNSTON
PO 230-20 WINDSTAR-AEOLUS
PO 230-21 TECKLA-OSAGE
PO 230-22 OSAGE-LANGE
PO 230-23 RENO-TECKLA
PO 230-24 DONKEY CREEK-RENO
PO 230-25 DONKEY CREEK-PUMPKIN BUTTES
PO 230-26 WYODAK-DONKEY CREEK
PO 230-27 WYODAK-OSAGE
PO 230-28 WYODAK-HUGHES
PO 230-29 HUGHES-LOOKOUT
PO 230-30 YELLOWCREEK-OSAGE
PO 230-31 LOOKOUT-YELLOWCREEK
PO 230-32 OSAGE-MINNEKHATA
PO 230-33 WESTHILL-MINNEKHATA
PO 230-34 ST. ONGE-LOOKOUT
PO 230-35 LANGE-ST. ONGE
PO 230-36 LANGE-SOUTH RAPID CITY
PO 230-37 SOUTH RAPID CITY-WESTHILL
PO 230-38 RCDC WEST-SOUTH RAPID CITY
PO 230-39 WESTHILL-STEGALL
_________________________________________________________________________________________________________________Common Use System: Transmission Coordination and Planning Committee2010 Local Transmission Plan December 8, 2010
23

_________________________________________________________________________________________________________________Common Use System: Transmission Coordination and Planning Committee2010 Local Transmission Plan December 8, 2010
24
STEADY STATE FORCED OUTAGES1 TECKLA-WINSDSTAR 230 39 AEOLUS-WINDSTAR 2 230 77 NSS1-NSS2 69 115 LRS XFMR
2 BADWATER-SPENCE 230 40 WINDSTAR-LATIGO 230 78 OSAGE-88 OIL 69 116 OSAGE XFMR
3 BUFFALO-CARR DRAW 230 41 WINDSTAR-PUMPKIN BUTTES 230 79 WHITEWOOD-LANGE 69 117 SIDNEY XFMR
4 BUFFALO-KAYCEE 230 42 ALCOVA-CASPERLM 1 115 80 LOOKOUT-SPEARFISH PARK 69 118 STEGALL XFMR 1
5 BUFFALO-SHERIDAN 230 43 ALCOVA-CASPERLM 2 115 81 LOOKOUT-SUNDANCE HILL 1 69 119 STEGALL XFMR 2
6 CARR DRAW-WYODAK 230 44 ALCOVA-RADERVILLE 115 82 LOOKOUT-SUNDANCE HILL 2 69 120 HUGHES XFMR
7 CARR DRAW-BARBER CREEK 230 45 LRS-AULT 345 83 LOOKOUT-KIRK 69 121 RCSOUTH XFMR
8 CARR DRAW-DRY FORK 230 46 CASPER-DJTPN 115 84 SUNDANCE HILL-ST ONGE 69 122 ST. ONGE XFMR
9 CASPER-DJ 230 47 WESTHILL-STEGALL 230 85 TECKLA-PUMPKIN 230 123 MINNEKHATA XFMR
10 CASPER-CLAIM JUMPER 230 48 WESTHILL-RCSOUTH 230 86 RICHMOND HILL-YELLOWCREEK 69 124 MBPP-1 GEN
11 CASPER-RIVERTON 230 49 WESTHILL-MINNEKHATA 230 87 YELLOWCREEK-WHITEWOOD 69 125 BEN FRENCH GEN
12 CASPER-SPENCE 230 50 LRS-STEGALL 230 88 WYODAK-HUGHES 69 126 NSS1 GEN
13 CASPER-LATIGO 230 51 LRS-ARCHER 230 89 WYODAK-NSS2 69 127 RCCT1 GEN
14 DJ-DIFFICULTY 230 52 OSAGE-LANGE 230 90 PACTOLA-YELLOWCREEK 69 128 RCCT2 GEN
15 DJ-WINDSTAR 1 230 53 OSAGE-TECKLA 230 91 HUGHES-DRY FORK 230 129 RCCT3 GEN
16 DJ-WINDSTAR 2 230 54 OSAGE-YELLOWCREEK 230 92 CAMBELL-LANGE TIE 69 130 RCCT4 GEN
17 DJ-LRS 230 55 OSAGE-MINNEKHATA 230 93 SUNDANCE HILL-BELLE CREEK 69 131 NSS2 GEN
18 DJ-STEGALL 230 56 LANGE-RCSOUTH 230 94 RCSOUTH-RCDCW 230 132 NSSCT1 GEN
19 FRANNIE-GARLAND 230 57 LANGE-ST. ONGE 230 95 DONKEY CREEK-PUMPKIN 230 133 NSSCT2 GEN
20 FRANNIE-YELLOWTAILP 230 58 RENO-TECKLA 230 96 ST. ONGE-WHITEWOOD 69 134 WYGEN GEN
21 GARLAND-OREBASIN 230 59 RENO-DONKEY CREEK 230 97 TONGUE RIVER-LEITER TAP 230 135 WYGEN2 GEN
22 GOOSE CREEK-SHERIDAN 230 60 SIDNEY-SIDNEYDC 230 98 TONGUE RIVER-DECKER 230 136 WYGEN3 GEN
23 GOOSE CREEK-YELLOWTAILP 230 61 SIDNEY-STEGALL 230 99 PUMPKIN-BARBERCRK 230 137 LANGE CT GEN
24 GRASS CK-OREBASIN 230 62 LOOKOUT-YELLOWCREEK 230 100 DRY FORK-LEITER TAP 230 138 BHPPLAN GEN
25 GRASS CK-THERMOPOLIS 230 63 LOOKOUT-HUGHES 230 101 LOOKOUT-SPEARFISH-YELLOWCREEK 69 139 DRY FORK GEN
26 KAYCEE-MIDWEST 230 64 LOOKOUT-ST. ONGE 230 102 MINNEKHATAWESTHILL 69 14027 CLAIMJUMPER-MIDWEST 230 65 BEN FRENCH-RCSOUTH 69 103 CUSTER-MINNEKHATA 69 14128 MUSTANG-SPENCE 230 66 BF-LANGE 69 104 CASPERPP XFMR 14229 RIVERTON-THERMOPOLIS 230 67 BF-PACTOLA 69 105 DJ XFMR 14330 RIVERTON-WYOPO 230 68 CAMBELL-LANGE 69 106 WYODAK XFMR 1 14431 SHERIDAN-TONGUE RIVER 230 69 CAMBELL-4TH-BF 69 107 WYODAK XFMR 2 14532 WYODAK-OSAGE 230 70 PACTOLA-CUSTER 69 108 WESTHILL XFMR 14633 WYODAK-HUGHES 230 71 CUSTER-WESTHILL 69 109 LANGE XFMR 1 14734 WYODAK-DONKEY CREEK 1 230 72 KIRK-YELLOWCREEK 1 69 110 LANGE XFMR 2 14835 WYODAK-DONKEY CREEK 2 230 73 KIRK-YELLOWCREEK 2 69 111 LOOKOUT XFMR 1 14936 YELLOWCAKE-WINDSTAR 230 74 RCSOUTH-CAMBELL 69 112 LOOKOUT XFMR 2 15037 YELLOWTAILP-YELLOWTAILBR 230 75 HUGHES-OSAGE 69 113 YELLOWCREEK XFMR 15138 AEOLUS-WINDSTAR 1 230 76 NSS1-WYODAK 69 114 YELLOWTAIL XFMR 152
_________________________________________________________________________________________________________________Common Use System: Transmission Coordination and Planning Committee2010 Local Transmission Plan December 8, 2010
25