handelsbanken nordic mid/small seminar stockholm 3 june …...highlights of january–march orders...
TRANSCRIPT


Handelsbanken Nordic Mid/Small Seminar – Stockholm 3 June 2015
Mika Vehviläinen, President and CEO

39%
32%
29%
32%
44%
24%
Cargotec’s business basics
May 2015 3
Geographical split
of sales in 1-3/2015
Services share of sales
in 1-3/2015
Order to delivery lead
time
EMEA
APAC
AMER
22% 12-24 months
EMEA
APAC
AMER
24% 2-4 months
EMEA
APAC
AMER
27% 6-9 months
MacGregor
EMEA APAC AMER
Kalmar Hiab
Cargotec sales split
in 1-3/2015
Cargotec geographical
split of sales in 1-3/2015
MacGregor
Kalmar
Hiab

Contracting forecast reflects imbalance
in the ship market
02 04 06 08 10 12 14 16 18 20 22 24 * 15 16 17 18 19 20 21 22 23 24 25 26 27
May 2015 4
Long-term contracting 2002–2024
0
1,000
2,000
3,000
4,000
5,000
6,000
ship nos
History Forecast
Source: Clarkson Newbuilding Market Forecast, April 2015
Long-term deliveries 1996–2027
0
500
1,000
1,500
2,000
2,500
ship nos
* 1996 – 2014 average

Mobile offshore unit contracting and
delivery forecast
02 04 06 08 10 12 14 16 18 20 02 04 06 08 10 12 14 16 18 20
May 2015 5
Long-term contracting 2002–2021
200
400
600
800
1,000
1,200
200
400
600
800
Long-term deliveries 2002–2021 ship nos ship nos
0 0
Source: Clarkson Offshore Newbuilding Market Forecast, April 2015
History Forecast History Forecast
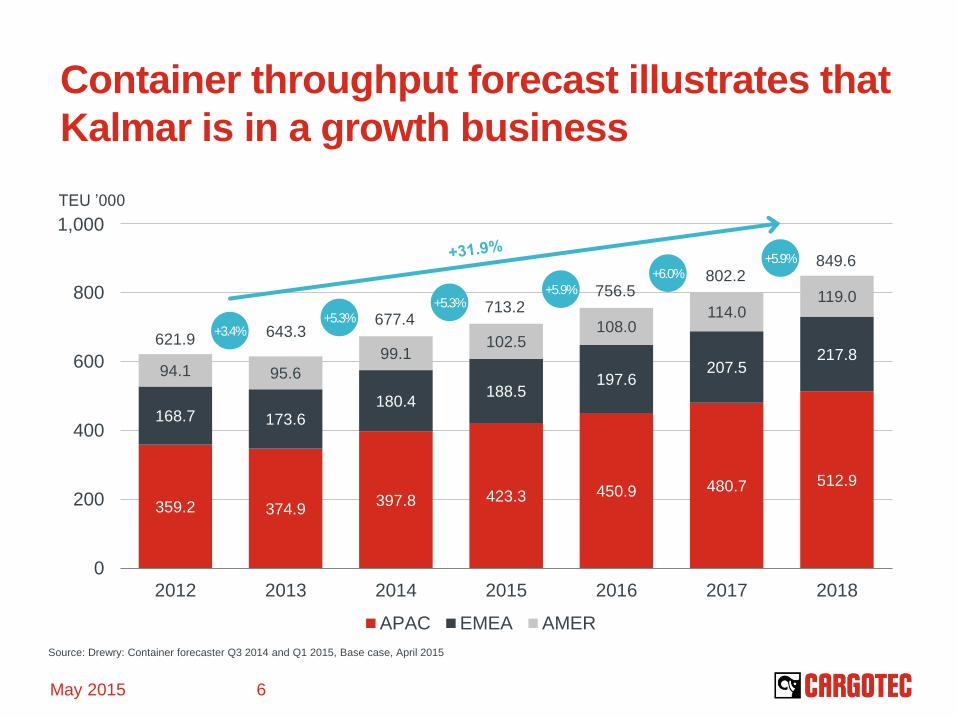
Container throughput forecast illustrates that
Kalmar is in a growth business
359.2 374.9 397.8 423.3 450.9 480.7 512.9
168.7 173.6 180.4
188.5 197.6
207.5 217.8
94.1 95.6
99.1 102.5
108.0 114.0
119.0
0
200
400
600
800
1 000
2012 2013 2014 2015 2016 2017 2018
APAC EMEA AMER
May 2015 6
TEU ’000
Source: Drewry: Container forecaster Q3 2014 and Q1 2015, Base case, April 2015
621.9 643.3
677.4 713.2
756.5 802.2
849.6
+3.4% +5.3%
+5.3% +5.9%
+6.0% +5.9%
1,000

-60
-40
-20
0
20
40
60
80
EMEA AMER APAC
% Truck sales growth GVW over 15t, regions
2008 2009 2010 2011 2012
2013 2014 2015 2016
Two-fold market environment for Hiab
May 2015 7
Source: IHS Global Insight Q1-Q2/2015 forecast
60
65
70
75
80
85
90
95
100
105
110
-10
-8
-6
-4
-2
0
2
4
6
8
2005 2007 2009 2011 2013 2015
AMER Construction Output
INDEX CHANGE (%)
y/y change (%)
Index 2005 = 100
60
70
80
90
100
110
120
-8
-6
-4
-2
0
2
4
6
2005 2007 2009 2011 2013 2015
EMEA Construction Output INDEX CHANGE (%)
y/y change (%)
Index 2005 = 100

Cargotec’s must wins 2015–
Driving Hiab to best in class profitability and capital
return
Driving MacGregor profitability over the cycle
through better effectiveness
Safeguarding competitiveness in mobile equipment
in Kalmar
Driving services offering development and growth in
MacGregor and Kalmar
Driving growth in automation in Kalmar
May 2015 8

Cargotec financial targets for 2016
May 2015 9
Operating profit margin
(EBIT)
Return on capital
employed
(ROCE pre-tax)
Gearing Dividend
of earnings per share

Highlights of January–March
Orders grew 9% y-o-y and totalled EUR 939 (863)
million
With fixed currencies orders grew 2%
Order book strengthened 12% from 2014 year-end to
EUR 2,469 million
Sales grew 18% y-o-y to EUR 889 (751) million
With fixed currencies sales grew 10%
Operating profit excluding restructuring costs was EUR
52.3 (24.6) million or 5.9 (3.3)% of sales
Operating profit was EUR 51.3 (23.8) million
Cash flow from operations was EUR 51.6 (32.5) million
Savings measures initiated in MacGregor
May 2015 10

MacGregor Q1 – offshore orders still on
good level
Order intake declined 28% y-o-y to EUR
228 (315) million
Order book grew 10% from 2014 year-end
Sales grew 30% y-o-y to EUR 282 (217)
million
Profitability excluding restructuring costs
was 4.4%
Savings measures initiated
May 2015 11
315
228 217
282
3.6
4.4
0
2
4
6
8
10
0
100
200
300
400
Q1/14 Q2/14 Q3/14 Q4/14 Q1/15
Orders Sales Operating profit%*
MEUR %
*excluding restructuring costs

Kalmar Q1 – strong start for the year
Order intake increased 38% y-o-y to
EUR 455 (330) million
Order book strengthened 12% from 2014
year-end
Sales grew 21% y-o-y to EUR 395 (327)
million
Profitability excluding restructuring costs
was 7.4%
May 2015 12
330
455
327
395
3.4
7.4
-8
-6
-4
-2
0
2
4
6
8
10
0
100
200
300
400
500
Q1/14 Q2/14 Q3/14 Q4/14 Q1/15
Orders Sales Operating profit%*
MEUR %
*excluding restructuring costs

Hiab Q1 – profitability improved further
Orders grew 17% y-o-y to EUR 256
(218) million
Order book strengthened 22% from
2014 year-end
Sales were at comparison period’s level
at EUR 212 (208) million
Profitability excluding restructuring
costs was 9.0%
May 2015 13
218
256
208 212
6.4
9.0
0
2
4
6
8
10
0
50
100
150
200
250
300
Q1/14 Q2/14 Q3/14 Q4/14 Q1/15
Orders Sales Operating profit%*
MEUR %
*excluding restructuring costs

Sales by geographical segment by
business area
May 2015 14
MacGregor Kalmar Hiab
APAC 10% (11)
EMEA 30%
APAC 63 % (58)
Americas 7% (6)
APAC 21% (20)
EMEA 48%
Americas 42% (34) Americas 37% (28)
EMEA 42%
(36) (52) (55)

Return on capital (ROCE) improved towards
the >13% target level
9.5
5.9
2
4
6
8
10
12
14
16
2010 2011 2012 2013 2014 Q1/15
ROCE Operating profit margin %*
May 2015 15
%
ROCE, annualised
* excluding restructuring costs
Outlook
Cargotec’s 2015 sales are expected
to grow from 2014 (3,358 MEUR).
Operating profit excluding
restructuring costs for 2015 is
expected to improve from 2014 (149.3
MEUR).
May 2015 16
