handbook on statistics for economies based on natural ... · demand for natural resources impacts...
TRANSCRIPT

Statistical Commission Background document
Forty-seventh session Available in English only
8 – 11 March 2016
Item 4(l) of the provisional agenda
Statistics for economies based on natural resources
Handbook on statistics for economies based on natural resources
(Draft)

2
-DRAFT-
ULAANBAATAR CITY GROUP
2012-2017
STATISTICS FOR
ECONOMIES BASED ON
NATURAL RESOURCE
2015

3
CONTENTS
CHAPTER 1. INTRODUCTION .................................................................... 5
1.1. Foreword ............................................................................................................... 5
1.2. Rationale for the handbook .................................................................................... 6
1.3. Fundamental Principles of Official Statistics ......................................................... 7
1.4. Scope and coverage of the handbook ..................................................................... 8
1.5. Links with other City Groups ................................................................................ 9
1.6. Structure of the handbook ................................................................................... 10
CHAPTER 2. DEFINITION AND CLASSIFICATION ................................ 11
2.1. Definitions of mineral resources .......................................................................... 11
2.2. Identification of statistical unit ............................................................................ 13
2.3. Mining activities ................................................................................................. 14
2.4. Mineral products ................................................................................................. 16
2.5. Data items ........................................................................................................... 17
2.6. International comparability.................................................................................. 19
CHAPTER 3. FRAMEWORKS AND PRINCIPLES .................................... 21
3.1. Introduction......................................................................................................... 21
3.2. Principle frameworks .......................................................................................... 21
CHAPTER 4. DATA SOURCES AND GENERAL METHODOLOGICAL
NOTES 26
4.1. Introduction......................................................................................................... 26
4.2. Data sources ........................................................................................................ 26
4.2.1. Overview of the data sources ................................................................... 26
4.2.2. National accounts..................................................................................... 28
4.2.3. Environmental accounts ........................................................................... 29
4.2.4. Economic census ..................................................................................... 30
4.2.5. Population census .................................................................................... 31
4.2.6. Establishment surveys .............................................................................. 32
4.2.7. Household surveys ................................................................................... 32
4.2.8. Administrative registers ........................................................................... 34
CHAPTER 5. STANDARD INDICATORS .................................................. 35
5.1. Introduction......................................................................................................... 35
5.2. The indicators to measure impacts of mining activities on the three pillars as
economy, society and environment ............................................................ 36
5.2.1. Measurement issues on contribution of mining to the economy ................. 36
5.2.2. Measurement issues for impacts of mining on the social sector ................. 37
5.2.3. Measurement issues for impacts of mining on the environment ................. 38
5.3. The indicators to determine impacts of mining and mining activities ................... 38
5.3.1. Introduction .............................................................................................. 38
5.3.2. Methodological sheet of indicators ............................................................ 39

4
5.3.3. The indicators to determine contribution of mining activities to the economy
................................................................................................................ 39
5.3.4. The indicators to define impacts of mining activities on society ................ 42
5.3.5. The indicators to determine impacts of mining activities on environment .. 44
CHAPTER 6. MEASURING THE ECONOMIC IMPACT OF MINING ..... 45
6.1. Executive Summary ............................................................................................ 45
6.2. Conceptual Framework ....................................................................................... 45
6.3. Basic statistics to be used for an analysis ............................................................. 47
6.4. Assessment of direct economic impacts ............................................................... 51
6.5. Assessment of indirect and induced economic impacts ........................................ 62
6.6. Trends in the mining boom .................................................................................. 67
CHAPTER 7. MEASURING SOCIETAL IMPACTS FROM MINING ........ 74
7.1. Introduction......................................................................................................... 74
CHAPTER 8. MEASURING THE IMPACT OF THE MINING INDUSTRY
ON THE ENVIRONMENT ............................................................................. 81
8.1. Introduction......................................................................................................... 81
8.2. Residuals ............................................................................................................. 82
8.3. Selected mining activities and their impact .......................................................... 82
8.3.1. Mineral exploration ................................................................................... 82
8.3.2. Mining operation ....................................................................................... 82
8.3.3. Rate of mineral resource use ..................................................................... 84
8.3.4. Use of energy and water by the mining industry ........................................ 84
8.3.5. Environmental management ...................................................................... 85
8.3.6. Rehabilitation ............................................................................................ 85
8.3.7. Oil and gas disasters .................................................................................. 86
8.4. Environmental accounts and the mining industry ................................................. 86
8.5. Data collection .................................................................................................... 87
CHAPTER 9. PRIORITY STATISTICS FOR ECONOMIES BASED ON
NATURAL RESOURCES .............................................................................. 88
CHAPTER 10. REMAINING ISSUES ............................................................ 90
References ............................................................................................................... 91
Annex 1. ............................................................................................................... 92
Annex 2. ............................................................................................................. 133

5
CHAPTER 1. INTRODUCTION
1.1. Foreword
In many countries, the mining industry is rapidly developing, generating substantial
revenue and resulting in significant growth in those economies based on natural resources.
The mining industry’s impact on the environment is expected to increase over time. This new
wave of development of the mining industry is posing new challenges to the national
statistical institutions of both developed and developing countries with significant natural
resources. Furthermore, there are deficiencies in the availability of mining statistics that are
comparable across countries.
The Ulaanbaatar City Group (UBCG) on statistics for economies based on natural resources
was established to address methodological issues related to statistics on natural resources and
contribute to improving international standards and methods for producing such statistics, by
pooling expertise from various countries.
The group would deal with statistics on direct and indirect activities related to mining.
Mining, henceforth understood to include quarrying, is defined as the extraction of minerals
occurring naturally as solids, liquids and gases. Direct activities and impacts are those
associated with the extraction process itself, including specialised support services. Indirect
activities and impacts include those associated with downstream processing, as well as
mining-related components of other activities that are closely associated with mining, such as
construction, transportation and the provision of technical services. The economic,
environmental and social impact will also be considered by the group.
Since the turn of the century the world’s appetite for natural resources has grown
exponentially. Since 2000 China’s GDP growth has been on average greater than 7%, India’s
has been greater than 5%. This growth has been predominantly in infrastructure but also in
dwelling investment as well. There has been significant expansion in many countries’
manufacturing sectors, all of which drives the increase in demand for natural resources. This
demand for natural resources impacts those economies that are based on natural resources.
Many of the countries are small and changes in commodity prices can impact their income
streams.
In order to understand how this increase in demand for natural resources is impacting on
economies, it is necessary to develop a suite of statistics that will assist decision making.
Countries whose economies are dependent on natural resources would benefit from the
material in this handbook.
These economies are dependent on natural resource as their main source of foreign income.
This foreign income is important to living standards as it enables them to buy imports that
they may not produce. However, unlike many products, natural resources have volatile prices.
This then impacts on their ability to have a steady income stream. This income stream is
important for government revenues, which are used to improve the living standards in the
country.

6
Appropriate and timely statistics are essential to inform governments, businesses and
communities about the decisions that must make to ensure that they make the best use of their
natural resources. Against this background the Ulaanbaatar City Group (UBCG) was formed.
The UBCG was formed to provide leadership in defining international best practices in
statistical measurement for economies based on natural resources. The UBCG also serves as a
forum for sharing expertise among statistical organisations, both national and international, as
well as other stakeholders. The UBCG is also collaborating with the United Nations in
developing and improving statistical methodologies and standards for natural resources.
The objectives for UBCG are to develop methodological and practical guidelines to
accurately track mining activity. These guidelines will assist in measuring and assessing
mining’s contribution to the economy, its impact on society and the environment. This
handbook is one of the main objectives of the group, and is focused on providing
recommendations and best practice to ensure coverage, reliability, accuracy and relevance of
statistical data.
The work of the UBCG aligns with other city groups. City groups are formed to address
selected problems in statistical methods. The work of these groups could result in proposals
to change international standards. City groups determine their own individual mechanism of
work, their agendas and outputs. City groups are informal groups of experts primarily from
national statistical agencies. Participation by representatives is voluntary as is the existence of
the group itself.
1.2. Rationale for the handbook
The main reason for producing the handbooks is to enable National Statistical Offices
(NSOs) to produce a suite of statistics that would be beneficial to decision makers. These
statistics would cover mining and related activities. The set of statistics would provide
information on the impact of mining on the economy, society and the environment. The
handbook addresses a number of issues that were considered when establishing the UBCG.
The importance of understanding impact of the mining industry on a country’s economy
could be articulated and analysed. Mining enterprises carry out additional functions apart
from their main activities. Mining enterprises also engage in the development of
infrastructure, including roads, transportation and communications. Some of these activities
are not currently classified under the mining sector. An assessment of the contribution made
by the mining sector could include these indirect contributions.
The mining sector plays an important role in total production. As such, the prices of mining
products are also important as these affect the contribution to the national economy. For
instance, volatile mining products impact estimates of Gross Domestic Product (GDP).
Therefore, a methodological assessment should be carried out on the impact of price
volatility.
Considering that investment is one the components of GDP estimates, the issue of how to
accurately estimate foreign investment should also be addressed. There is an urgent need to

7
define an efficient methodology for collecting data on the capital expenditure of mining
industries and for information on foreign direct investment.
For many countries the informal mining sector plays a large role in their economies.
Methodologies and recommendations for determining the size of the informal mining sector
are needed. Due to the specific nature of the mining industry, workers engaged in the
informal mining sector are likely to be constantly migrating, moving from site to site, which
could hinder their involvement in household surveys. As mentioned, the price of mining
products in the formal sector is high and thus impacts the informal mining sector. Therefore,
the handbook will address the issue of how to calculate the economic contribution of the
informal mining sector.
Some mining products are handled by a single company. This means many NSOs will have to
deal with data confidentiality. This is linked with the issue of the classification and
identification of activities of transnational companies. Dealing with transnational enterprises
is also important for measuring GDP and associated income flows.
The handbook will also provide statistics that will assist users in examining the impact of
mining on society. Measuring the benefits arising from and the income generated by the
mining sector on the living standards is important. The spillover effects of the mining
industry are identified in the handbook. [DN Are we addressing this?]
Despite the positive benefits that may flow to the economy from mining activity it is also
important to measure its impact on the environment. The handbook will improve indicators to
estimate the sustainable development of affected countries. Recommendations with regard to
the development of economic accounting systems for the environment and on the
development of relevant data sources will also be addressed. There is also an increasing
demand for the development of methodologies and the identification of indicators for
measuring desertification due to the inappropriate use of mining procedures that the
handbook will discuss.
The rationale for producing the handbook is to address these issues. To do this the handbook
will provide guidelines that will deliver consistency across countries. The handbook will also
establish best practices in collection and dissemination for mining and related statistics.
As the target audience for the hand book is NSOs it is important the work of the UBCG
reflects the Fundamental Principles of Official Statistics (UN 2014).
1.3. Fundamental Principles of Official Statistics
The UN Fundamental Principles of Official Statistics:
Principle 1. Official statistics provide an indispensable element in the information system of
a democratic society, serving the Government, the economy and the public with data about
the economic, demographic, social and environmental situation. To this end, official statistics
that meet the test of practical utility are to be compiled and made available on an impartial
basis by official statistical agencies to honor citizens' entitlement to public information.

8
Principle 2. To retain trust in official statistics, the statistical agencies need to decide
according to strictly professional considerations, including scientific principles and
professional ethics, on the methods and procedures for the collection, processing, storage and
presentation of statistical data.
Principle 3. To facilitate a correct interpretation of the data, the statistical agencies are to
present information according to scientific standards on the sources, methods and procedures
of the statistics.
Principle 4. The statistical agencies are entitled to comment on erroneous interpretation and
misuse of statistics.
Principle 5. Data for statistical purposes may be drawn from all types of sources, be they
statistical surveys or administrative records. Statistical agencies are to choose the source with
regard to quality, timeliness, costs and the burden on respondents.
Principle 6. Individual data collected by statistical agencies for statistical compilation,
whether they refer to natural or legal persons, are to be strictly confidential and used
exclusively for statistical purposes.
Principle 7. The laws, regulations and measures under which the statistical systems operate
are to be made public.
Principle 8. Coordination among statistical agencies within countries is essential to achieve
consistency and efficiency in the statistical system.
Principle 9. The use by statistical agencies in each country of international concepts,
classifications and methods promotes the consistency and efficiency of statistical systems at
all official levels.
Principle 10. Bilateral and multilateral cooperation in statistics contributes to the
improvement of systems of official statistics in all countries.
1.4. Scope and coverage of the handbook
The handbook’s primary focus is on mining and its impact on the economy, environment and
broader society. The handbook will not be examining other natural resources. The reason is
that very few, if any, countries’ economies are driven by non-mining natural resources. While
natural resources, such as forests and water are important, they are not likely to drive an
economy’s output. This is an important distinction to make, as this is an area where the
UBCG is interested in examining the impact of mining on the environment. The London city
group, via SEEA, is examining broader natural resources.
As such recommendations will be limited to the highest priority statistics and methods to
produce those statistics related to the mining industry and related activity.

9
1.5. Links with other City Groups
With the scope of UBCG focusing on mining, it is worth noting that it has links with other
city groups. The two most directly linked are the Oslo Group (Energy statistics) and the
London Group (Environmental statistics). Both of these groups have been active longer than
the UBCG and have given many of the issues the UBCG face considerable analysis, which
the UBCG can draw upon.
Oslo City Group
The Oslo group is a forum for countries to address challenges related to the collection and
dissemination of complete, comparable and quality energy statistics. Some of the topics
considered are:
• User needs for energy statistics
• Scope of official energy statistics
• Country best practices in the collection and dissemination of energy statistics
• Selected methodological and data quality challenges in energy statistics
• Needs for harmonization of important energy statistics systems
• Key content provider for the new UN manuals on energy statistics, International
Recommendation on Energy Statistics (IRES) and Energy Statistics Compilers
Manual (ESCM)
• Methods for improving consistency in different statistic systems and reducing
response burden
London City Group
The London group plays a leadership role in defining international best practices in the theory
and practice of environmental accounting within the framework of the System of
Environmental-Economic Accounting (SEEA). Some of the topics considered are:
• Physical flow accounts (materials, water and energy);
• Asset accounts for natural resources and land;
• Environmental activity accounts and related flows;
• Ecosystem accounts;
• Applications and extensions of environmental accounts;
• Training and implementation material.
The London group is responsible for System of Environmental-Economic Accounting 2012.
This is the Central Framework that was adopted at the forty-third session of the United
Nations Statistical Commission as an international statistical standard. The UBCG as part of
its handbook will incorporate these standards.

10
1.6. Structure of the handbook
The contents of the handbook are structured in accordance with its objectives. The handbook
will be structured as follows.
Chapter 2 will examine the existing definitions and classification that the UBCG will use,
covering industry and product classifications. Classifications such as the Central Product
Classification and the International Standard Industrial Classification will be examined and
potentially extended to provide further detail if necessary.
Chapter 3 will draw on international frameworks and principles to ensure that the handbook
produces guidelines that are internationally comparable. These would primarily cover the
System of National Accounts, the Balance of Payments Manual, the Government Finance
Statistics Manual, the System of Environmental Economic Accounting and the International
Labour Organisation’s Prices and Labour manuals.
Chapter 4 will discuss data sources and general methodology requirements for producing
Mining and related statistics. The chapter will cover the different types of enterprise surveys,
household surveys and potential administrative data sources. Chapter 5 details the set of
standard indicators and potential survey questions that NSOs should produce. The chapter
discusses how the indicators are used to address various policy questions that government
and users might face.
Chapters 6, 7 and 8, will develop the analytical and contextual frameworks for the indicators,
by grouping them into impacts on the Economy, Society and the Environment. The chapters
will also discuss dissemination strategies along with country experiences. These three
chapters will also highlight particular measurements issues that NSOs are likely to face in
collecting, compiling and producing statistics.
Chapter 9 will develop some of the rationale for NSOs to prioritise their mining statistics and
Chapter 10 will examine areas for further research.

11
CHAPTER 2. DEFINITION AND
CLASSIFICATION
2.1. Definitions of mineral resources
1. The System of National Accounts 2008 (SNA 2008) and the System of Environmental
Economic Accounting 2012 (SEEA 2012) provides the general definition of natural resources
with respect to their different roles in economy. To ensure the methodological uniformity
with existing recommendations, this manual is broadly based on the conceptual framework of
SNA 2008, the Central framework of SEEA 2012, International Recommendations for
Industrial Statistics, 2008 (IRIS,2008) and other related publications.
2. Natural resources comprise the mineral and energy resources, biological resources, water
resources and land and soil resources. The scope of this manual, however, is confined to the
mineral resources, which refer to concentration [or occurrence] of material of economic
interest in or on the Earth’s crust in such form that there are reasonable and realistic prospects
for eventual economic extraction. Such mineral resources form a subset of environmental
assets defined in SEEA covering subsoil resources of coal, oil and natural gas, metallic or
non-metallic minerals. Through economic activities these resources are brought as natural
input in the production process. Extraction of mineral resources and its transfer to economic
activity reduces the environmental assets which are reflected in the national balance sheet of
natural resources.
3. From the perspective of the natural input to economy mineral resources are broadly
classified into following groups:
i. Oil resources
ii. Natural gas resources
iii. Coal and peat resources
iv. Non-metallic mineral resources (excluding coal and peat resources)
v. Metallic mineral resources
Mineral resources enter to economy as natural input. The point they enter to economy is
different by type of resources. As mentioned in ISIC, revision 4, the mining activities also
includes exploration and geological observations which generally precede the extraction
activities. Entering point to economy might be exploration for some resources but extraction
for others. In any case, the main outcome of mining activities is the conversion of mineral
resources to mineral products.
4. According to the SEEA 2012 "Natural resources include all natural biological resources
(including timber and aquatic resources), mineral and energy resources, soil resources and
water resources."
Mineral is a naturally occurring substance that is solid and stable at room temperature,
representable by a chemical formula, usually a biogenic, and has an ordered atomic structure.
Ore is a type of rock that contains minerals with important elements including metals.
Natural resource inputs are physical inputs to the economy from natural resources. They
derive from stocks of natural resources comprising mineral and energy resources, soil

12
resources, natural timber resources, natural aquatic resources, other natural biological
resources and water resources, all of which are considered to be owned by residents of the
country in which the resources are located. Natural resource inputs comprise physical inputs
to the economy from natural resources. The majority of natural resource inputs that enter the
economy (e.g., extracted minerals, removals of timber, water abstracted for distribution)
become products. There are different international guidelines describing products extracted
from natural resources.
Product name International Recommendations on
Energy Statistics (IRES) Energy Statistics Manual
Hard coal Coals with a gross calorific value (moist,
ash-free basis) which is not less than 24
MJ/kg or which is less than 24 MJ/kg
provided that the coal has a vitrinite mean
random reflectance greater than or equal to
0.6 per cent. Hard coal comprises anthracite
and bituminous coals.
Hard coal refers to coal of gross calorific
value greater than 23 865 kJ/kg (5 700
kcal/kg) on an ash-free but moist basis and
with a mean random reflectance of vitrinite
of at least 0.6.
Brown coal Coals with a gross calorific value (moist,
ash- free basis) less than 24 MJ/ kg and a
Vitrinite mean Random Reflectance less
than 0.6 per cent.
Lignite/brown coal: Non-agglomerating
coals with a gross calorific value less
than 17 435 kJ/kg (4 165 kcal/kg) and
greater than 31% volatile matter on a dry
mineral matter-free basis
Peat A solid formed from the partial
decomposition of dead vegetation under
conditions of high humidity and limited air
access (initial stage of coalification). It is
available in two forms for use as a fuel, sod
peat and milled peat.
Combustible soft, porous or compressed,
fossil sedimentary deposit of vegetal origin
with high water content (up to 90% in the
raw state), easily cut, of light to dark
brown colour.
Natural gas A mixture of gaseous hydrocarbons,
primarily methane, but generally also
including ethane, propane and higher
hydrocarbons in much smaller amounts and
some noncombustible gases such as nitrogen
and carbon dioxide.
It comprises gases, occurring in
underground deposits, whether
liquefied or gaseous, consisting mainly of
methane. It includes both “nonassociated”
gas originating from fields producing
hydrocarbons only in gaseous form, and
“associated” gas produced in association
with crude oil as well as methane
recovered from coal mines (colliery gas).
Crude oil A mineral oil of fossil origin extracted by
conventional means from underground
reservoirs, and comprises liquid or near-
liquid hydrocarbons and associated
impurities such as sulphur and metals.
Crude oil is a mineral oil of natural origin
comprising a mixture of hydrocarbons and
associated impurities, such as sulphur. It
exists in the liquid phase under normal
surface temperature and pressure and its
physical characteristics
(density, viscosity, etc.) are highly
variable. This category includes field or
lease
condensate recovered from associated and
non-associated gas where it is commingled
with the commercial crude oil stream.

13
5. Mining activities make considerable impact on the development of a country as a whole.
The economic impact is measured in terms of their contribution to GDP and other
macroeconomic indicators. The social impact is reflected by employment opportunities and
public services created by these activities. The mining sites are often located in a
geographically isolated area with the considerable distance from other settlements. Operation
of mining activities may require development of residential facilities with other basic social
services such as health, education, water and sanitation and transportation and
communication. Earning from mining activities contribute to household income and affect the
living standards of families where the main breadwinner is a mining worker. The impact on
environment is measured by indicators related to the use of natural resources and emissions
of mining industry to air, water, and soil.
6. To fit these measures into a set of established accounts the standard concepts of flows and
stocks are used in the manual. Mining and quarrying as an economic activity produces goods
and services that have economic value. Flows, according to SNA 2008, consist of transaction
and other flows, which reflect the creation, transformation, exchange, transfer or extinction of
economic value. Generally, stocks arise from accumulation of prior transaction and other
flows, however in case of environmental assets most of the increment occur naturally, while
the amount of frequency of extraction which determines the volume of flow has direct impact
on assets. SEEA defines different types of physical flows such as natural inputs, products
and residuals. Mineral resources as physical inputs are moved from their location in the
environment as a part of production processes or are directly used in production. Residuals
refer to the part of extracted minerals that are not retained in economy, which is considered to
have returned immediately to the environment.
7. Changes in the stocks of mineral resources are determined by the amount of deposit
arising from new discoveries and extraction of resources physically moved from the deposit.
Some changes between the opening and closing stock in monetary terms are more
accounting-related in nature and comprise those due to improved measurement (reappraisals)
and those involving the categorization of the asset (reclassifications).
8. Flows and stocks are entered in the accounts of the institutional units that own the goods
and assets involved, in the accounts of units that deliver or take delivery of services, or in the
accounts of units that provide labour and capital or use them in production. An institutional
unit in its capacity as a producer of goods and services is known as an enterprise. For its role
as a legal entity in the business the enterprise is normally registered with the government
authority. A business register compiled from the administrative data lists all enterprises,
which will eventually compose a statistical frame for data collection. Institutional units in
the context of a statistical unit are described in following paragraphs.
2.2. Identification of statistical unit
9. Identification of a proper statistical unit is essential to collect and compile relevant
statistical data. Definition of an institutional unit together with other types of statistical unit is
given in SNA as well as in International Recommendations for Industrial Statistics, which
among other covers mining and quarrying activities. An institutional unit is an economic
entity capable, in its own right, of owning assets, incurring liabilities and engaging in
economic activities and in transactions with other entities. An institutional unit in its capacity
of a producer of goods and services is known as an enterprise.
10. The enterprise is the basic statistical unit at which all information relating to its
production activities and transactions, including financial and balance-sheet accounts.

14
However, an enterprise may be engaged in one or more economic activities at one or more
locations. Therefore, for collecting detail data on more homogeneous categories of economic
activities the establishment is a recommended statistical unit. The establishment is
particularly appropriate statistical unit for collection of data on production of goods and
services, employment and remuneration, stock of non-financial capital used and changes in
inventories and gross fixed capital formation.
11. An establishment is defined as an enterprise or part of an enterprise that is primarily
engaged in one kind of activity with single physical location and the primary activity
accounts for the most of the value added of establishment. Small businesses operate as a
single-establishment enterprise and the difference between the enterprise and establishment is
rarely relevant. In case of larger business, an enterprise may own two or more establishments.
In such case production and employment data are collected at the establishment level.
Establishments of the same enterprise may be grouped into different industries as defined by
ISIC. Nevertheless, the enterprise is suitable for the compilation of financial statistics as the
only enterprise has legal authority to own the assets and incur liabilities.
12. The business register is instrumental in creating a statistical frame for regular data
collection operation. As mentioned in IRIS-2008, it is desirable to derive the frame for every
list based enterprise from a single general-purpose activity business register maintained by
the statistical office. Such register generally provides exhaustive and exclusive list of
statistical units in order to ensure that there is no omission or duplication in any
enterprise/establishment – based survey. The business register contains the information on
name, address, main activity (ISIC code), location (area code) and other relevant information.
2.3. Mining activities
13. Mining activities are defined in ISIC revision 4 as extraction of minerals occurring
naturally as solids (coal and ores), liquids (petroleum) or gases (natural gas). Extraction can
be achieved by different methods such as underground or surface mining, well operation,
seabed mining etc. Enterprises engaged in mining activities during a reference period and
territory form the target population for data collection. Description and codes of mining
activities as per ISIC revision 4 is given Table 2.1.
Table 2.1: Activities related to mining and quarrying by ISIC
revision 4
Division Group Class Description
Division 05 Mining of coal and lignite
051 0510 Mining of hard coal
052 0520 Mining of lignite
Division 06 Extraction of crude petroleum and natural gas
061 0610 Extraction of crude petroleum
062 0620 Extraction of natural gas
Division 07 Mining of metal ores
071 0710 Mining of iron ores
072 Mining of non-ferrous metal ores
0721 Mining of uranium and thorium ores
0729 Mining of other non-ferrous metal ores

15
Division Group Class Description
Division 08 Other mining and quarrying
081 0810 Quarrying of stone, sand and clay
089 Mining and quarrying n.e.c.
0891 Mining of chemical and fertilizer minerals
0892 Extraction of peat
0893 Extraction of salt
0899 Other mining and quarrying n.e.c.
Division 09 Mining support service activities
091 0910 Support activities for petroleum and natural gas
099 0990 Support activities for other mining and quarrying
14. While above-mentioned activities refer to extraction of mineral resources for economic
use products of mining activities are further processed in manufacturing. A number of
manufacturing activities almost entirely depend on mining for their intermediate input.
Therefore, the analysis of the economic activities related to mineral resources could include
selected manufacturing activities. The manufacturing activities based on mineral resources
are listed below by ISIC. The list does not include manufacturing activities processing other
natural resources such as timber and aquatic resources.
Table 2.2: Manufacturing activities based on processing of mining
and quarrying products
Division
19
Manufacture of coke and refined petroleum products
191 1910 Manufacture of coke oven products
192 1920 Manufacture of refined petroleum products
Division Manufacture of other non-metallic mineral products
231 2310 Manufacture of glass and glass products
239 Manufacture of non-metallic mineral products n.e.c.
2391 Manufacture of refractory products
2392 Manufacture of clay building materials
2393 Manufacture of other porcelain and ceramic products
2394 Manufacture of cement, lime and plaster
2395 Manufacture of articles of concrete, cement and plaster
2396 Cutting, shaping and finishing of stone
2399 Manufacture of other non-metallic mineral products n.e.c.
Division
24
Manufacture of basic metals
241 2410 Manufacture of basic iron and steel
242 2420 Manufacture of basic precious and other non-ferrous metals
243 Casting of metals
2431 Casting of iron and steel
2432 Casting of non-ferrous metals
15. Mineral resources are sparsely located across the globe. In many countries the scope of
mining activities is very much limited. Therefore, the country analysis of mineral resources
and inter-linkages with manufacturing and other activities such as construction, domestic and
external trade depends on the mining activities in operation in a specific country. The

16
economic analysis of inter-sector exchange of mineral products may benefit from input-
output data.
2.4. Mineral products
16. Products, according to SNA, are goods and services that result from a process of
production in the economy. Mineral products emerge from the extraction of the mineral
resources from environment and their transfer to economy. Not all resources extracted
subsequently become products. It should exclude the residuals of the production process such
as losses or unused items which return to environment immediately. Also excluded are so
called mining overburden, which refers to a quantity of soil, stone or materials that are
removed from the original places during extraction. Mineral products thus refer to the actual
amount of mineral resources transferred to economy.
17. Flows of products between economic units are generally recorded in the account of the
enterprises for its own business purpose. When a mining establishment produces crude oil
and supplies it to a refinery unit for producing petrol or other related products such
transaction is recorded by both entities. The amount of mineral products is therefore obtained
from production data of all institutional units engaged in mining activities. The amount of
mineral products used as intermediate input is derived from the data of other economic
activities such as manufacturing and construction.
18. The Central Product Classification (CPC) provides the detail list of mineral products.
CPC version 2.0 has direct correspondence with ISIC revision 4.0. Therefore, CPC is quite
helpful to determine the main activity of an enterprise based on its products. In the broad
economic category (BEC), mineral products mostly fall under the primary industrial supplies.
The list of mineral products by CPC is given in Table 2.3.
19. Standard international classifications exist for commodities, industries and trade. A very
large number of countries have their own national classifications designed to meet their own
particular needs and differing to some extend from the international standards. The various
existing international classifications came into being because of the need for having a basis
for international comparison of national statistics on separate industries.
BOX 2.1 : The classification of mining activities and products in Russia
The Russian statistics applies the Russia Classification of Minerals and Underground Waters
(RCMUW), developed by the Ministry of Natural Resources and Ecology of the Russian
Federation. RCMUW is accepted and put into operation in December 2002.
RCMUW is obligatory for application by federal enforcement authorities at creation of the state
information systems and resources. State balances of mineral stocks which reflect the condition of
mineral and raw-material resource base of the country were used for creation of RCMUW.
Objects of RCMUW classification are minerals (natural accumulation of minerals, rocks, oil,
gases) and underground waters in the ground.
RCMUW is intended for: normalization of geological and economic information on minerals and
underground waters;
maintenance of classification and coding of minerals and underground waters;
development of reporting about condition and use of mineral and raw-material resources of the

17
Russian Federation; maintenance of federal and regional balances of mineral stocks; supply of
information on minerals and underground waters to the users who are carrying out industrial and
commercial activity in the field of investigation of deposits of minerals and underground waters.
In RCMUW each position is identified by codes from four up to twelve digits. Feature of coding
of minerals is that on first four categories the integrated groupings of minerals which sequence
corresponds to sequence of groupings of kinds of economic activities on extracted minerals
according to the Russia Classification of Economic Activities (RCEA) are coded.
Kinds of economic activities on specified RCEA groupings correspond in RCMUW the minerals
extracted in result of this activity. For example, to economic activity groupings in RCEA
correspond integrated groupings of minerals in RCMUW:
RCEA RCMUW
10.10 Extraction, cleaning and agglomeration of coal 1010 Coal
11.10 Extraction of crude oil and natural gas 1110 Crude oil and natural
gas
RCEA was constructed by harmonization with the official version of the Statistical Classification
of Economic Activities in the European Community (NACE Rev. 1.1) by using in RCEA from
NACE 4-digit codes. The detailed features of Russian economic activities are reflected in 5 - 6
digits.
The Russian Classification of Products by Economic Activity (RCPEA) was
constructed by harmonization with the Statistical Classification of Products by Activity in the
European Economic Community (CPA 2002) by using in RCPEA from CPA 2002 codes (up to
six digits). The detailed features of Russian economy are reflected in 7 - 9 digits.
The transit codes from RCPEA groupings to the Harmonized system (HS) were also developed.
2.5. Data items
20. It is highly recommended that a list of data items is prepared in priority to the
questionnaire design for the survey that includes mining activities in its scope. A complete
list of data item is given in IRIS-2008. A large and small version of the model questionnaire
based on data items recommended by IRIS-2008 is presented in a UNIDO publication
Industrial Statistics: Guidelines and Methodology. However, implementation of these
recommendations depends on the purpose of the survey, available resources and other
circumstances. One important aspect to be considered is that the main source of data for any
industrial survey is the records maintained by businesses for their own accounting purpose.
Therefore selection of data items should be made in clear understanding of the accounting
rules and principles existing in the country of reference.

18
Table 2.3: Mineral products by CPC, version 2.0
Division Class Subclass Description
Division 11
Coal and lignite; peat
1101 11010 Coal, not agglomerated
1102 11020 Briquettes and similar solid fuels manufactured from coal
1103 11030 Lignite, not agglomerated
1104 11040 Lignite, agglomerated
1105 11050 Peat
Division 12
Crude petroleum and natural gas
1201 12010 Petroleum oils and oils obtained from bituminous minerals, crude
1202 12020 Natural gas, liquefied or in the gaseous state
1203 12030 Bituminous or oil shale and tar sands
Division 13
Uranium and thorium ores and concentrates
1300 13000 Uranium and thorium ores and concentrates
Division 14
Metal ores
1410 14100 Iron ores and concentrates, other than roasted iron pyrites
1421 14210 Copper, ores and concentrates
1422 14220 Nickel ores and concentrates
1423 14230 Aluminum ores and concentrates
1424 14240 Precious metal ores and concentrates
1429 14290
Other non-ferrous metal ores and concentrates (other than uranium or
thorium ores and concentrates)
Division 15
Stone, sand and clay
1511 15110 Slate
1512 15120 Marble and other calcareous monumental or building stone
1513 15130 Granite, sandstone and other monumental or building stone
1520 15200 Gypsum; anhydrite; limestone flux; limestone and other calcareous
stone, of a kind used for the manufacture of lime or cement
1531 1531 Natural sands
1532 1532
Pebbles, gravel, broken or crushed stone, macadam; granules, chippings
and powder of stone
1533 15330 Bitumen and asphalt, natural; asphaltites and asphaltic rock
1540 15400 Clays
Division 16
Other minerals
1611 16110 Natural calcium phosphates, natural aluminium calcium phosphates and phosphatic chalk
1612 16120 Unroasted iron pyrites
1619 16190 Other chemical minerals
1620 16200 Salt and pure sodium chloride; sea water
1631 16310 Precious stones (including diamonds, but not industrial diamonds) and
semi-precious stones, unworked or simply sawn or roughly shaped
1632 16320 Industrial diamonds, unworked or simply sawn, cleaved or bruted;
pumice stone; emery; natural corundum, natural garnet and other natural
abrasives
1633 16330 Chalk and dolomite
1639 16390 Other minerals n.e.c.

19
21. Data collected from the survey are to be used to compile the set of indicators discussed in
Chapter 5 and 6. Therefore, the information requirement for selected indicators pre-defines
the list of data items from the survey. Nevertheless there can be a minimal set of data items
that could be considered for most of the surveys. A full list of data items is given in IRIS-
2008 which among others includes following major data items.
A. Characteristics of the statistical unit:
Principle activity, location, type of unit (single establishment enterprise or the
part of multi-establishment enterprise)
B. Number of persons employed:
By sex; number of employees by categories such as production workers and
other workers; number of employees engaged in mineral exploration and
evaluation,
C. Compensation of employees
Wages and salaries by sex and by categories such as production workers and
other workers
D. Purchase of goods and services
Disaggregated by goods and services
E. Value of shipments, receipts for services and other revenues
Disaggregated by goods and services
F. Quantity of mineral resources extracted by type
G. Quantity of mineral products by CPC
H. Quantity of total energy consumed (terajoules), water consumed (cubic meters)
I. Inventories
J. Gross fixed capital formation, by type of assets
Including capital expenditure on mineral exploration and evaluation
Above data items are listed for the purpose of questionnaire design, which may also include
the indicators to be derived, for example wage rate, total output or intermediate inputs for the
purpose of checking consistency of reported data.
2.6. International comparability
22. International comparability is one of the important dimensions of data quality produced
by national and international statistical offices. It allows users to perform the cross country
analysis of social and economic performance of countries in given sectors. The part of the
national data is compiled for international reporting which is particularly subject to scrutiny
in terms of the compliance of reported data with international recommendations and
standards.
23. International comparability of data depends on uniformity of basic statistical methods
applied and classification structure and codes used for data compilation across the countries.
A certain degree of deviation is unavoidable due to the national conditions and practices. But
countries are encouraged to comply with internationally accepted methods and standards as it
improves the data quality in general and ensures the international comparability in particular.
With respect to mining statistics the basic standards to be complied with are ISIC revision 4
(some regional classification code such as NACE and NAICS are compatible to ISIC), SNA
2008, SEEA and IRIS 2008.
24. The practice of different units of measurement is another challenge to international
comparability. It involves physical unit, valuation method (basic prices or producer’s prices)
and currency unit. A standard unit of measurement by commodities is available in UN

20
Comtrade database. The questions related to basic prices, producer’s process and other
methods of valuation are discussed in SNA 2008. It is generally recommended to make the
valuation of mineral exploration at market prices. There is a whole range of questions related
to valuation of the different asset items under the gross fixed capital formation. Even after the
proper valuation is made, the data are still available in national currency. For the purpose of
cross country analysis, the UNIDO database converts the figures in national currency in to
US dollars.
25. A number of data items are subject to international reporting on annual basis. Currently,
UNIDO collects the data for following variables of mining and utility sectors on annual basis.
i. Number of establishments/enterprises
ii. Number of persons employed/employees
iii. Wages and salaries of employees
iv. Gross output
v. Value added
However, above set of variables has been inadequate to meet the demand of data users for
policy relevant analysis. In the context of increased relevance of environment related data, it
is recommended to add following variables for international reporting.
i. Quantity of mineral resources extracted
ii. Quantity of mineral products produced
iii. Gross fixed capital formation
iv. Quantity of energy consumed

21
CHAPTER 3. FRAMEWORKS AND
PRINCIPLES
3.1. Introduction
This chapter is mainly based on the International Recommendations for Water Statistics
(UNSD, 2012), as it is considered appropriate to use the schemes that the UN is promoting in
relation to the international recommendations of this type.
The statistics of mineral resources use and integrate concepts, definitions, classifications and
frameworks of the mining industry and statistics and environmental, economic, demographic
and social accounts. This chapter provides a brief overview of the main concepts related to
mining and its relationship with the environment, economy and society. It also presents
SEEA Central Framework, particularly relating to mineral resources, which provides the
overall framework for integrated environmental statistics and economics section.
The aim of this chapter is, in addition to providing an overview of the main accounting
frameworks, to make some comments on the conceptual and technical resources necessary to
develop economic, social and environmental indicators related to mining activities.
3.2. Principle frameworks
In order to characterize the main elements involved in the process of developing indicators
for mining, some documents that introduce concepts and definitions that define the field of
research are briefly described.
In this sense, the advantage of having International Statistical Standards1, is to facilitate,
among other things, the integration of information from different sources and thus to promote
consistency of statistical systems, and contribute to the formulation of internationally
comparable statistics.
In this section, we highlight two main international statistical standards that have been used
as a framework for some activities of UBCG: the System of National Accounts 2008 (SNA)
and the System of Environmental-Economic Accounting Framework 2012 (SEEA). Both
documents provide statistical frameworks that integrate financial information (SNA) and
environmental-economic information (SEEA). In fact, the current trend is that the documents
related to the economy and the environment will increasingly align to these two international
statistical standards.
1To complement the idea, it should be mentioned that a Statistical Standard is "an agreed rule or guideline on how one or
more parts of the statistical business process should be carried out, conforming with requirements for professionalism.
Components of a standard are: (1) definitions; (2) statistical units; (3) classifications; (4) coding processes; (5)
questionnaires, and; (6) output categories (SDMX 2009). An International Statistical Standard, is a "the comprehensive
body of international statistical guidelines and recommendations that have been developed by international organisations
working with national agencies" (SDMX 2009).

22
A. System of National Accounts 2008
General context of SNA 2008
The System of National Accounts 2008 (SNA 2008) is a statistical framework that provides a
complete, consistent and flexible set of macroeconomic accounts for policy analysis and
research purposes. It was adopted asan international statistical standard for national accounts
during the 40th session of the Statistical Commission of the United Nations (2009).
The SNA is the internationally standardized set of recommendations for the development of
measures of economic activity according to strict accounting conventions, based on accepted
economic principles. The recommendations are expressed by a set of concepts, definitions,
classifications and accounting rules which include the internationally accepted standards for
measuring items such as gross domestic product (GDP), the economic indicator most
commonly used.
The accounts themselves present in a condensed form, a large volume of detailed
information, organized according to certain principles and perceptions about the workings of
the economy. These constitute a complete and detailed record of the complex economic
activities taking place within an economy and of the interaction between the different agents
or groups of operators, which takes place on markets or elsewhere.
Also, the SNA detailed information not only on the economic activities that take place in a
period, but also on the levels of assets and liabilities of an economy, and thus on the wealth of
its inhabitants at certain points in time. In addition, the SNA includes an account with the
exterior showing the relationship between an economy and the rest of the world.
To understand the nature of the economy, it is essential to be able to observe and analyse the
economic interactions taking place between its various sectors. The application of SNA is
possible at different levels of aggregation: for individual operators (or institutional units, as
they are called in the SNA), for groups of these units (or sectors) or for the total economy.
The conceptual elements of SCN 2008
The SNA measures what happens in the economy, between what agents and for what
purposes. To capture the flows of the economy, the SNA recognizes the relevant activities by
identifying institutional units that compose it and the specification of the structure of the
accounts reflecting transactions for the various stages of production and, finally, consumer
goods and services.
1. Activities and transactions
The SNA is designed so that analytically provides useful information about the behaviour of
institutional units and their activities, such as production, consumption and asset
accumulation. To do so, the exchange of goods, services and assets that take place between
institutional units are recorded as transactions. While some transactions represent the

23
payment of the exchange, which may be a good, service or asset of similar value, usually
some kind of economic law, including notes and coins is involved.
Data on transactions constitute the basic material to calculate or deduct the value of the
various elements in the accounts. The use of such data provides great advantages. The first is
that the prices at which goods and services are exchanged in transactions between buyers and
sellers in the markets provide the information necessary to assess, directly or indirectly, all
off-balance. Secondly, a transaction between two institutional units must be registered by the
two parties involved and therefore generally appear twice in a set of macroeconomic
accounts. This establishes important linkages in the SNA. For example, production is
obtained by adding the amounts sold, exchanged or transferred to other units plus the
amounts of the entries less withdrawals from stocks. Thus, the production value is obtained
by registering its single applications from data on transactions.
2. The institutional sectors of the economy
SNA distinguishes between two main categories of institutional units (or subjects of
transactions): households and legal units. The latter are entities created to produce, mainly
companies or non-profit institutions on one hand, or entities established by political
processes, such as specific government units, on the other. The defining characteristic of an
institutional unit is the ability to own property and assets, to incur liabilities and to carry out
economic activities and transactions with other units in its own name.
For the purposes of SNA, the institutional units within the economy are grouped into five
mutually exclusive sectors composed of the following types of units:
a. Non-financial corporations;
b. Financial corporations;
c. Government units, including social security funds;
d. Non-profit institutions serving households;
e. Households.
These five sectors account for the total economy. Each sector can be further divided into sub-
sectors; for example, the sectors of non-financial and financial corporations are subdivided in
order to distinguish between the companies under the control of government or foreign units
and the rest of society.
SNA comprises a complete set of account flows and balances which can be prepared for each
sector, at subsector level, if necessary as well as for the economy as a whole. The total
number of accounts that can be compiled is therefore potentially very large, depending on the
required and feasible level of disaggregation. Disaggregating into sectors and subsectors
allows observing the interactions between different parts of the economy that must be
measured and analysed for the purposes of policy formulation.

24
The institutional units residing abroad form the rest of the world. SNA does not require the
preparation of accounts for economic activities that take place in the world, but must register
all transactions between residents and non-residents in order to get a full accounting of the
economic behaviour of resident units. Transactions between residents and non-residents are
grouped into a single account, called “the rest of the world”.
SNA 2008 and the mineral/energy resources
As already mentioned, the 2008 SNA emphasizes the way to record the economic activities in
general, and thus, does not go into detail about the issue of mining activities. However, some
parts from the manual which can be considered relevant to the construction of indicators as
those discussed in this manual.
Although discussed in more detail in the SEEA-CF, here is considered the structure of the
assets side of the balance, which is fundamental to access the information on availability of
mineral resource, on the flows that occur during the year, and are emphasized items related to
resource depletion, like new discoveries, losses from disasters (fires, spills, landslides, etc.),
appearance and disappearance of assets, changes in classification, changes in the quality of
assets, revaluation, among others.
For example, the SNA 2008 manual addresses the issue of mineral exploration, which
consists of the value of expenditures on exploration for petroleum, natural gas and non-
petroleum deposits and subsequent evaluation of the discoveries made.
These expenses include the costs of obtaining the prior licenses, license costs and acquisition
costs of feasibility studies, the costs of actual test drilling and boring, as well as the costs of
aerial or other type of survey, transportation costs, etc. incurred for making possible the
development of the exploration. After commercial exploitation of the reserve, revaluations
take place and the cost of these reassessments is also included in gross fixed capital
formation. (10,106)
This serves as a conceptual basis for the development of the indicator Mineral exploration
and evaluation (economy).
Another issue considered is the intellectual property, and several examples of it are the results
of research and development, mineral exploration and evaluation, computer software and
databases and original entertainment, literary or artistic. These examples are characterized by
the fact that most of their value is attributed to intellectual effort. In general terms, they can
be described as follows: products of intellectual property are the result of research,
development or innovation leading to knowledge that researchers can sell on the market or
use for their own benefit in the production, because the use of knowledge is restricted by
legal or other protections. The knowledge can be incorporated into a single independent
product or into another product. In the latter case, the product with the knowledge achieves a
higher price than the price of a similar product without the added knowledge. Knowledge
continues to be an asset as long as its use can create some form of monopoly profits for its
owner. When there is no protection, it becomes obsolete and no longer is an asset. (10.98)

25
B. Central framework of the System of Environmental-Economic Accounting
(SEEA Central Framework) 2012
General context of the SEEA Central Framework 2012
The central framework of the System of Environmental and Economic Accounting 2012
(SEEA) is a statistical framework consisting of a comprehensive set of tables and accounts
that guide the compilation of statistics and provides a comparable and consistent policy for
indicators, analysis and research.
At its 43rd session (2012), the Statistical Commission adopted the central framework of
SEEA as the first international statistical standard for environmental and economic
accounting, to implement it in a flexible and modular way. We urge all countries to compile
their environmental and economic accounts based on SEEA central framework, to provide
statistics derived from it and continue working together to address the remaining challenges,
to provide a more comprehensive set environmental and economic accounts.
SEEA-MC provides a statistical framework which permits quantifying in physical and
monetary terms the interactions between the economy and environment, particularly through
the description of stocks and flows of natural capital in a period of time.
It also allows the development of aggregates and indicators on a wide range of environmental
and economic issues. Particular examples include the measurement of trends in the use and
availability of natural resources, the level of emissions and discharges to the environment as a
result of economic activity.
In Figure XX is shown a simplified representation of the interaction between the economy
and the environment. In general, flows from the environment to the economy are recorded as
entries (e.g. flows minerals, wood, fish and water). Flows within the economy are recorded as
product flows (including additions to the stock of fixed assets) and cash flows from the
economy to the environment are recorded as waste (e.g. solid waste, air emissions and water
return flows).

26
CHAPTER 4. DATA SOURCES AND
GENERAL METHODOLOGICAL
NOTES
4.1. Introduction
The statistics of the mining industry are based on numerous sources of information and apply
different methods of data collection and compilation. Overall, the data are divided into two
distinct categories: data on the physical environment (i.e., flows, stocks, emissions) and
monetary data on mining and economic indicators (production value, wages and salaries,
etc.). Information sources and collection methods depend on the practices used by each
country, and that includes both institutional arrangements and the level of human and
financial resources.
To develop the necessary data, a statistical office collects and transforms basic data of
institutional units (firms, government agencies, households and institutions) in their role as
producers, consumers and investors, employees, and so on. There are two basic aspects of the
collection of economic data: it guarantees access to data already collected for administrative
purposes and that the statistical office conducts a direct survey.
Note that this chapter takes as its main references the following sources developed by United
Nations Statistics Division, through an international consultative process involving experts
from national and international institutions:
• The International Recommendations for Water Statistics (IRWS) which were
developed to help strengthen national information systems for water in support of
design and evaluation of Integrated Water Resources Management (IWRM)
policies
• The International Recommendations for Industrial Statistics, designed to provide
a comprehensive methodological framework for the collection and reporting of
industrial statistics in all countries, irrespective of the level of development of their
statistical systems. It is intended primarily for the producers of industrial statistics,
particularly the staff of national statistical offices involved in the collection and
compilation of industrial statistics, but may be also useful to researchers and other
users of industrial statistics.
4.2. Data sources
4.2.1. Overview of the data sources
The main data sources that can be used to produce the data topics in these recommendations
could include the following:
• Establishment and household surveys

27
• Administrative Records
• Economic and population census
• National accounts and environmental accounts
Surveys and administrative records are mainly used to produce data on economic units, while
the information about environmental impacts can be derived mainly from environmental
accounts. Traditionally, the National Statistical Offices are the institutions responsible for
collecting data through surveys and administrative records, but this can vary from country to
country. In many countries Ministry of Industry or a similar institution is responsible for
collection of statistical data on industry.
The survey data are collected directly from the economic units selected for the study. The
data are gathered from all units of the population (census) or only from some representative
data units selected through sampling (sample survey). The Information about the "physical"
aspects of mining may be obtained by some other statistical tools such Energy Balances or
institutions or publications of companies that perform the extraction of resources, like oil or
gas.
The official administrative processes are established to monitor and enforce laws and
regulations, which sometimes includes keeping a record of economic units. These records
may consist of household or establishment units and may contain various information items
about them. Usually the administrative data for statistical purposes are received from
government agencies. However, administrative data can also come from non-governmental
organizations, as for example the industry associations.
It is also possible to obtain data from collected for some research at the universities, research
institutes or non-governmental organizations, which can have different projects and research
programs related to mining and social or environmental studies.
Table 4.1 provides an overview of the data items that can be obtained from the different data
sources. In general, statistical surveys and administrative records provide data on economic
and social variables of mining, and some specialized exercises provide information on the
physical conditions of the deposits and mines.
Table 4.1: Example of different data sources for construction of
the mining indicators
Economic impact Social impact Environmental
impact
Surveys X X
Administrative registers X X
Economic census X X X
Population census X
National accounts X X
Environmental accounts X

28
It has been observed that the most common sources for compilation of statistical data on
mining are the national accounts and the economic census providing a specific section with
data for some variables of interest. However, depending on the population of interest, the
available resources and the particular conditions in a country, performing a specific census
can be a viable option for collecting the most complete and detailed mining statistics. A
complete census of the units in the mining industry may be appropriate when, for example, a
country does not maintain an updated business register (directory of companies).
Sample surveys are tools for gathering information from a part of the total population (a
sample) to infer about the whole population. They are almost always less expensive than
censuses. There are different types of surveys that can be used in mining statistics depending
on the sampling units: (i) business surveys, (ii) household surveys and (iii) mixed household-
enterprise surveys. In general, it is recommended that countries make efforts to establish a
program of sample surveys to meet the needs of mining statistics in an integrated manner, as
part of a comprehensive national program of sample surveys to businesses and households, to
avoid duplication of work and minimizing the burden on respondents2.
4.2.2. National accounts
The National Accounts are an organizational scheme for statistical information on
macroeconomic aspects of the country: production, consumption, savings, investment by
sector of economic activity and the primary and secondary distribution of income; as well as
financial transactions and economic relations with foreign countries, by institutional sector.
BOX 4.1 : The System of National Accounts of Mexico (SNCM)3
SNCM is the summary of the activities of the national economy that took place in Mexican
society for a certain period. The derivation of this information from censuses, surveys and
administrative records, is a part of the statistics, the economy and the private and public
accounting, applied to the national and global economy.
The following list presents the topics covered by SNCM:
Base 2008
• Gross Domestic Product (GDP)
o Quarterly
o Annual, by economic activity
o Annual, by state
o Annual, for public and private sector
o Annual for state and local governments
o Value added of total manufacturing exports
2 International Recommendations for Energy Statistics (IRES), 2011, page. 115.
3 http://www.inegi.org.mx/est/contenidos/proyectos/cn/

29
o Measuring the informal economy
• Short term
o By industrial activity
o Total Economic Activities
o Gross Fixed Investment
o Quarterly supply and use
o Monthly indicator for electricity by state
o Monthly Indicator for manufacturing by state
o Industrial activity by state
o Quarterly Indicator of economic activity by state
o Quarterly indicators of tourism
o Private consumption in the domestic market
• Supply and Use Tables
• Input-Output
o Input-Output 2012 - Update
o Input-Output 2008
• Tables Origin-Destination of the gross fixed capital formation
• Total Factor Productivity
• Institutional Sectors
• Satellite accounts
Base 2003
• Satellite accounts
4.2.3. Environmental accounts
BOX 4.2 : The Economic and Ecological Accounts of Mexico
The Economic and Ecological Accounts of Mexico (commonly known as SCEEM) provide
information on the impact on the environment and natural resources as a result of
anthropogenic activities, linking the main macroeconomic variables of the country and
obtaining the Environmentally Adjusted Net Domestic Product (PINE). This is done by
determining the amount of the costs for the depletion of natural resources and
environmental degradation. This indicator also presents the spending by the public sector in
favour of the environment for the prevention, control, reduction or elimination of pollution
generated by the activities of production, distribution and consumption. The above is
compiled in the framework of satellite accounts using their links with the central framework
of National Accounts.
The change of base year in all publications SCNM preserves the methodological and
conceptual improvements in environmental accounting and incorporates the latest available

30
in the country information4.
Since the environmental accounting uses the same accounting conventions, it is in general
consistent with the system of national accounts. Here we will refer the SEEA Central
framework with its specific analytical focus on the environment and its linkages with the
economy, as well as with its focus on the measurement of stocks and flows in physical and
monetary terms.
The above mentioned international standard for environmental accounting includes:
1. Asset accounts:
• Stocks and changes in stocks (flows) of natural resources such as land, forest,
water, fish, soil and mineral and energy resources in land, forest, water, fish, soil
and mineral and energy resources in physical and monetary terms.
• Wealth accounts and calculation of depletion.
2. Combining the accounts:
• Combine modules of SEEA to form a full sequence of accounts and integrate
physical and monetary accounts
• Aggregates such as Green GDP (e.g. PINE in Mexico), or Net Saving and
productivity/efficiency indicators
4.2.4. Economic census
Economic Census (EC) is used to determine the characteristics of establishments producing
goods, companies merchandising the goods and service providers, nationally, with a high
level of geographical and sectorial breakdown. They are composed of several procedures,
corresponding to the various sectors of economic activity. Economic censuses are held for
example every five years, in years ending in 4 and 9, to meet the country's economic
structure. Different questionnaires are used.
BOX 4.3 : The Economic census in Mexico
The most recent economic census in Mexico (EC 2014) was the eighteenth census event in
the country and its purpose was to obtain basic statistical information relating to the year
2013 on all goods-producing establishments, retailers and service providers and to generate
economic indicators for Mexico to a high level of geographical, sectoral and thematic
detail.
These censuses capture the basic economic information virtually for all economic activities
that take place in the country, except for agriculture, livestock and forestry, since the latter
are covered by the Agricultural Census.
4 http://www.inegi.org.mx/est/contenidos/proyectos/cn/ee/default.aspx

31
Also, in the recent census new items were incorporated: environment, global value chains
and supply services, with the aim of measuring the current economic events. In total more
than 1.4 million blocks throughout Mexico were traversed to capture information from a
population of 5.6 million establishments.
4.2.5. Population census5
BOX 4.4 : The Population census in Mexico
Statistical methods are used to determine the characteristics of the inhabitants of Mexico
and their accommodation at national, state and municipal level, by location, by groups of
neighbourhoods. The census is conducted every ten years, those ending in zero; also every
ten years (but those ending in five) is carried out counting.
Produced datasets:
• Total population
• Population, 3 years and over
5 http://www.inegi.org.mx/est/contenidos/proyectos/ccpv/cpv2010/Default.aspx

32
• Population, 12 years and over
• Female population, 12 years and over
• Population by households and housing
• Household census
• Housing
4.2.6. Establishment surveys
This type of surveys include statistical units and are used to efficiently capture
comprehensive statistical information from enterprises of all sizes operating in the country
and to determine the characteristics and conditions of the establishments of the various
sectors, as well as their perception of changes on economic development.
They are carried out more often than censuses and provide information also at sub-national
level. The target population (respondents) and the frequency depend on the nature of each
survey and intended information to be collected. They might take place monthly, quarterly,
annually, biennially, at five years span, or, on special occasions up to the request of the
government or other agencies.
An important tool is a directory (or inventory) of economic units which provides information
related to the financial institutions, to support decision-making in both the public and in
private. The sampling frame should contain all the units that are in the target population of
the survey, without duplication or omissions. A statistical business register can provide a
comprehensive list of all enterprises and other units, together with their characteristics, that
are active in a national economy. Apart from being a tool for conducting statistical surveys, a
business register is a source for statistics in its own right. The establishment and maintenance
of a statistical business register in most cases is based on legal provisions, since its scope and
coverage are determined by country specific factors. For countries that do not maintain an up-
to-date business register of companies, it is recommended to build one based on the last
economic census and amend it as needed, based on the relevant information obtained from
other statistical sources6.
4.2.7. Household surveys
Although household surveys are not designed specifically for collecting data in the mining
industry, they may contain data related to the social impact, such as the number of domestic
workers, or the level of wages.
The frequency of these surveys is a key to obtaining information on a regular basis. These
studies should reflect not only nationally, but also in rural and urban areas and regions, in
order to achieve an adequate analysis of the data7.
6 International Recommendations for Energy Statistics (IRES), 2011, pág. 117.
7 Íbid, págs. 118 y 119.

33
BOX 4.5 : Description of the data of the household survey of Mexico used for defining
the indicators
National occupational and employment survey8
The National Survey of Occupation and Employment (ENOE) in Mexico aims to obtain
statistical information on the occupational characteristics of the population nationwide, as
well as other demographic and economic variables to deepen the analysis of the labour
aspects.
In compliance with the international recommendations and given the amendment made in
2014 to the Constitution of the United Mexican States, which raised the minimum legal
working age from 14 to 15 years, ENOE covers the universe of the inhabitants 15 years and
older.
The information is adjusted to demographic projections by the National Population Council
(CONAPO) updated on April 16, 2013 and based on the results of the Census of Population
and Housing 2010.
The ENOE results are presented on a quarterly basis, at national level, for the 32 states, 32
self-representing cities and towns in five ranges of number of inhabitants (less than 2 500,
2500-14999, 15000-99999 and more than 100000).
8 Para mayor detalle se sugiere consultar:
http://www.inegi.org.mx/est/contenidos/proyectos/encuestas/hogares/regulares/enoe/default.aspx

34
4.2.8. Administrative registers
Administrative records are established in accordance with the laws and regulations. Each
regulation (or related group of regulations) results in a register of institutional units –
companies, people, etc. - and is subject to those regulations, together with the data resulting
from application of this regulation.
The statistical offices refer collectively to registration and data as an administrative source.
The administrative authorities keep records of the units in accordance with legislated
administrative requirements or simply for internal purposes in order to assist the units in
managing their operations. Statistical offices can use the data from an administrative source9.
Description of the data of the administrative records used for defining the indicators
Different administrative registers are established to serve different roles in response to
legislation and /or regulations. Some of these services are: (i) to monitor activities related to
production of goods and services, including mining and utilities; (ii) to enable regulatory
activities and audit actions; and (iii) assess outcomes of government policies, programmes
and initiatives. These data is collected by diverse governmental agencies, mainly for the
purpose of carrying out various non-statistical programs. A wider definition would include
also organizations operating in private sector. These data are organized in registers (which
can be from simple lists to sophisticated database systems) and these registers and the related
data are referred to collectively as administrative data. The data originating from
administrative sources can be effectively used to compliment the compilation of statistics on
mining activities. Examples for such administrative registers are tax register, social security
database, and register of companies (industrial register), register of Economic Chamber.
The main benefits of administrative data are:
• Cost reduction, since Surveys and censuses are expensive while administrative data
can be cheap, often “free”;
• Reduced burden on data suppliers; Statistics can be compiled more frequently with no
extra burden;
• A full coverage of target population;
• No survey errors and lower non-response;
• Better small-area data;
• Timeliness can be improved for some types of data but not for all.
Next to these benefits of administrative data, their disadvantages, limitations and issues have
to be considered:
<to be described>
9 Recomendaciones internacionales para las estadísticas del agua 2010, pág. 117.

35
CHAPTER 5. STANDARD
INDICATORS
5.1. Introduction
Background: This chapter consists basic metadata on the agreed list of standard indicators
for measuring the impacts of mining on the economy, social sector and environment. During
the developing of this handbook, a proposal for a set of indicators is being developed.
The indicators determined to inform policy makers and the community on issues faced by
policy-makers in economies with significant mining activity, including assisting international
comparability.
The list of standard indicators, developed based on the following criteria leaded the selection
of indicators:
- Should be consistent with goal of the Ulaanbaatar city group and potential to
measure economic, society, and environmental impacts of mining.
- Should be based on internationally accepted methodologies and uncomplicated to
interpret.
- Should be able to use the identical methodology with a scientific basis and
consistent with international recommendation and standards.
- Should be generally measurable (statistically feasible) over time.
The chapter is developed to provide the economies based on natural resources countries and
national and international stakeholders with guidance on the definitions, methodological
concepts and data sources for the indicators that are being used to measure the impacts of
mining.
The list is composed total 95 indicators for contribution to the economy, 29 indicators for
impact on the society, and 18 indicators for impact on the environment of mining activities.
The list of indicators is not fixed; countries can be select and complement a national list that
suits their needs. Country data should be used for compiling the indicators where such data
are available and of reasonable quality.
Scope: The scope of the indicators are covered to measure the mining contribution to the
economy, and to measure mining impacts on the human well-being (human health, education,
income), social equity and environmental sustainability.
There are 142 recommended indicators to determine impacts of mining activities. The big
number of indicators are not easy to deal. Therefore, indicators were prioritized by consensus
approach as following.

36
- High priority: Indicators must to have for demonstrate the impact on official statistics,
which countries’ economies are depend on natural resources (mining production).
- Medium priority: Indicators good to have for demonstrate the impact on official
statistics.
- Low priority: Indicators like to have for demonstrate the impact on official statistics.
5.2. The indicators to measure impacts of mining activities on the three pillars
as economy, society and environment
This session provides the measurement issues to define impacts of mining and mining-related
activity from an economic, social, and environmental perspective.
First meeting of Steering Committee of the group was approved the terms of references, and
discussed the work streams of the group. The second work stream was namely “assess the
impact of mining industry on economies and develop methodological and practical
recommendations on how to demonstrate the impact on official statistics”. According to the
work stream developed measurement issues to determine impacts on three pillars to
demonstrate the impact on official statistics. This work stream will require consultation with
users and policy makers to ensure that the data will be of relevance to them.
5.2.1. Measurement issues on contribution of mining to the economy
UBCG has identified following 22 measurement issues for contribution of mining to the
economy.
i. Measurement of mining production in terms of quantity and value
ii. Measurement of prices of mineral commodities and the impact of mineral prices on
the terms of trade, as well as mining-induced terms of trade impacts on the rest of
the economy
iii. Measurement of intermediate consumption in the mining industry, including
energy inputs
iv. Measurement of mining gross operating surplus
v. Measurement of mining inventories
vi. Measurement of mining fixed capital investment (eg current and expected
expenditure, capital stock, capital services, consumption of fixed capital
expenditure)
vii. Measurement of financial investment (including foreign investment, both direct
and portfolio) and associated incomes, including retained earnings
viii. Measurement of impact of mining on trade statistics, including coherency with
production statistics
ix. Measurement of mineral exploration, discoveries and sub-soil reserves
x. Measurement of the impact of mining on government finances, including
measuring of taxes on mining
xi. Measurement of productivity in the mining industry

37
xii. Measurement of construction activity associated with the mining industry
xiii. Measurement of impact of mining on transportation
xiv. Measurement of other economic activity to support the mining industry, including
role of input-output analysis
xv. Measurement of ‘down-stream’ economic impacts of mining, including the
manufacturing of mineral products
xvi. Measurement of infrastructure to support mining activity
xvii. Measurement of mining impact on national income, including balance of payments
incomes associated with mining and measures of real gross domestic income and
real net national disposable income
xviii. Measurement of national wealth
xix. Measurement of impact of mining on regional economies (including regional
prices and regional housing markets)
xx. General measurement issues, including dealing with multinational enterprises,
dealing with confidentiality issues, correction of ‘off year’ reporting, ensuring
coherence of information from different sources and consistency thereof, by
developing a coordinated approach to large mining projects, measuring informal
mining activity)
xxi. Measuring procurement of nationally produced goods and services
xxii. Standardization of units of measure
5.2.2. Measurement issues for impacts of mining on the social sector
The measurement issues for impacts of mining on the social sector are arranged into 5 sets as
below:
1. Labour force
i. Measurement of employment in the mining industry
ii. Measuring the demographic characteristics of the mining labour
iii. Measurement of employment in mining-related activities
iv. Measurement of impact of mining demand for labour on supply of labour to other
parts of the economy
2. Income
i. Measurement of mining wages and salaries, total and averages
ii. Measurement of distribution of mining incomes, including gender distributions
3. Health and productivity
i. Measurement of workers’ conditions and industrial relations in the mining
industry
ii. Measurement of mining skills and capabilities, including job vacancies skill
shortages
iii. Measurement of the impact of mining on workers’ health and the health of the
community generally
4. Measurement of the impact of mining on social issues

38
i. Measurement of fly-in/fly-out and drive-in/drive-out workers, including impacts
on demands for social services
ii. Measurement of internal and international migration flows associated with
mining (including remittances)
iii. Measuring the impact of mining on poverty
iv. Measuring social impacts of population dislocation associated with mining
activity
v. Measurement of the impact of mining on education and training
5.2.3. Measurement issues for impacts of mining on the environment
The following five measurement issues defined to develop indicators determined the impacts
of mining on the environment:
i. Measurement of the direct and indirect demand from the mining industry for
environmental inputs, both market and non-market, incorporating measurement in
terms of value;
ii. Measurement of emissions and waste products from the mining industry;
iii. Measurement of damage to land;
iv. Measurement of the environmental impact of economic activity ‘downstream’ from
the mining industry; and
v. Measurement of the impact of mining on green growth and the green economy.
5.3. The indicators to determine impacts of mining and mining activities
5.3.1. Introduction
The next three sub-sessions cover methodological sheets of indicators (142) to determine
impacts of mining and mining activities on three pillars as example, including this session.
Determined the all list of the economic, social and environmental indicators to assess impacts
of mining sector attached in annex 1 with priority, definition, measurement issue, and
estimation method, which can be inform policy makers and the broader community on these
issues. However, detailed practical recommendations for measuring the impact of the mining
industry on the economy, social sector and environment will be provided in chapter 6 to 8 of
this handbook. Through the following sub-sessions of the chapter used following terms:
Data source: a specific data set, metadata set, database or metadata repository from which
data or metadata may be obtained.
Estimates: values inferred from incomplete data sets by applying rules or methods.
Incomplete data sets include sample survey data.
Metadata: a set of data that describes and gives information about other data. In other word,
the metadata summarizes basic information about data, which can make finding and working
with particular instances of data easier. The metadata of the indicators provides, a simple

39
definition, purpose of the indicators, the calculation methods, and some additional
description.
5.3.2. Methodological sheet of indicators
This session presents a methodological sheets (Figure 5.4) that that contains elements as the
definition and purpose of the indicator; calculation algorithm, which shows how the indicator
is constructed; a graph showing the trend of the indicator and; one possible interpretation of
the result.
The methodological sheet can be indicated priority of indicators that high-priority indicators
have a green label, the medium priority, yellow, and finally the low priority identified with a
blue colour. Following figure shows the guide that way to reading of each methodological
sheet.
Figure 5.1. Contain of methodological sheets
5.3.3. The indicators to determine contribution of mining activities to the economy
The UBCG developed and proposed more than 90 indicators for measuring contribution of
mining to the economy, which was constructed through the outcomes of several workshop,
meeting, and video conferences conducted to expert group and steering committee of the
group.

40
Figure 5.2. Indicators for measuring contribution of mining to the economy
These indicators have been categorized as production, stock and investment statistical
indicators, expenditure statistical indicators, trade and price statistical indicators and
analytical statistics and transformations:
• Production & Stock & Investment statistics
• Total production of mining products, by value
• Total production of mining products, by quantity
• Inventories, fixed capital and investment
• Expenditure statistics
• Expenditure, by raw materials, spare parts, and packing materials used for
production processes
• Expenditure of electricity, fuel and water
• Expenditure of the transport vehicles and other transport running
• Expenditure of waste and air emissions management
• Cash cost
• Other service cost
• Trade & Price
• External trade
• Domestic trade
• Consumer and housing price
• Analytical statistics and transformations
• GDP & GNI
• IOT & SUT
• Productivity
• Taxes & Royalty & Export duties
As seen from the Figure 5.3 the data sources to derive these indicators include:

41
Official statistics:
• National accounts
• SUT, IOT and national wealth
• Capital and investment quarterly survey
• Enterprise and price survey
• Other surveys such as mining sites’ survey and artisanal and small scale mining
survey.
Administrative data:
Administrative data from ministries and agencies such as Customs authority, Mineral
resource authority, Ministry of Environment and Green Development and General
Department of Taxation.
Figure 5.3. Data sources of economic indicators
The Figure 5.4 shows the consistency of UBCG indicators to measure economic impacts of
mining with SNA. For example, the production statistics indicators identified by UBCG
matches the production indicator of SNA. The difference is that UBCG considers quantity in
estimating the total production whereas SNA recommends using volume. UBCG proposes to
derive productivity indicator, which is linked to the indicator total factor productivity in
SNA. In a case of expenditure consumption indicator of UBCG it is related to the SNA
indictor of intermediate consumption. Inventory statistics of UBCG is coherent with
inventories statistics of SNA that covers raw materials, supplies, work in process, finished
goods, and goods for resale. The fixed capital investment is related to the capital formation of
SNA statistics.

42
Figure 5.4. Data sources of economic indicators
5.3.4. The indicators to define impacts of mining activities on society
The UBCG has identified and suggested 29 indicators for measuring impacts of mining on
society. Of the 29 indicators, 15 indicators classified as high priority, 11 indicators as
medium, and 3 indicators as low priority.
These indicators have been categorized as labour statistics, health statistics, income statistics
and other statistics. The figures 5.6 below show the indicators under each statistics and data
sources. As seen, the social indicators can be derived from various sources such as household
socio-economic survey (HSES), labour force survey (LFS), wage and salary survey and other
special surveys. Other official statistics includes gender statistics, population and vital
statistics reports. The administrative data used for measuring impacts on social sectors
include data from the Ministry of Health and Ministry of Education and Science etc.
Figure 5.6. Measuring the impact of mining industry on social sector

43
Figure 5.7. An example of the methodological sheet for a society indicator
BOX 5.2 : Impacts of mining sector on number of employees
Name of the indicator: Number of employees of the
mining sector
Objective of indicator: The indicator aims to measure the
participation of workers in the mining sector related to the
overall working force in the rest of economic activities with
the aim to show the trend and intensity of the use of labor in
the mining sector and its comparability with the rest of the
economy.
Definition of indicator: The share of workers in the mining sector (SMWt) is defined as
the number of paid jobs in sector 21 Mining (using the North America Industry
Classification System, NAICS) related to the number of paid jobs in all economic activities
in the country.
Graph: The indicator is estimated for the period 2003-2012. Base information is available
at annual basis.
Description: The indicator shows, firstly, the number of paid workers in the mining sector
(21 using NAICS’ classification) which has an average annual growth rate of 2 per cent in
eight years; from 222 051 paid workers in 2003 to 266 488 in 2012. Moreover, a marginal
increase occurs in the share of paid workers in the mining sector related to the total paid
workers in other economic activities, this is, while in 2003 accounted for 0.65% of all paid
workers in the country, in 2012 the share increased to 0.68 per cent. Otherwise, it should be
noted that the jobs tendency in the economy was also positive, rising from 34.2 million in
2003 to 39.2 in 2012; i.e an average growth rate of 1.5% annually in the same period.
Indicator note: Initiative of the Ulaanbaatar City Group.
Hig
h p
riority
Priority
H: High (Green)
M: Medium
(Yellow)
L: Low (Blue)
Estimation
algorithm

44
5.3.5. The indicators to determine impacts of mining activities on environment
There are 18 indicators for measuring impacts of mining on environment. Of these indicators,
17 indicators are high priority, and an indicator is low priority to define impacts of mining
sector on environment.
The data to measure impacts of mining on environment are compiled for a wide range of
administrative data sources. Administrative data collected and integrated by the related
ministries and agencies of environment is an important source for deriving statistical
indicators to measure mining impacts on environment such as, air and water emissions and
waste products from the mining industry, and damage to land from mining activity.
Figure 5.8. An example of the methodological sheet for an environment indicator
BOX 5.3 : Impacts of mining sector on the environment
Name of the indicator: Cost of environmental protection
Objective of indicator: The Environmental Protection Expenditures (EPE) represents
monetary expenditures for prevent, measure, control and remedy or abate pollution or any
form or environmental degradation; as well as to protect, manage and promote the
environment.
Definition of indicator: The indicator aims to measure the environmental expenditures
incurred by the mining sector (expenditures related to public sector) in related activities to
environmental protection.
The Environmental protection expenditures by the mining sector (EPEM) are defined as
the sum of current and investment expenditures.
Graph: The indicator is estimated for the period 2003-2012. Base information is
available at annual basis.
Description: The indicator shows the amount spent for environmental protection activities on
mining activities incurred by the public sector, such as the operation and maintenance of basic
infrastructure in ecology and economic infrastructure projects of hydrocarbons, among other
sectors, it has a tendency to increase in the period 2003 and 2012 as it passes 7 516 million pesos
in 2003 to reach 33,396 million in 2012, that is an average annual increase of 18 percent. The most
pronounced growth was in 2009, being able to maintain and even increase this kind of
expenditures in subsequent years.
Hig
h p
riority

45
CHAPTER 6. MEASURING THE
ECONOMIC IMPACT OF MINING
6.1. Executive Summary
In order to measure the impacts of the mining industry within a country’s economy it is
necessary to be aware of the main determinants of the mining economy, measurement
framework, related concepts and methodology. Also, it requires good data sources necessary
to analyse and estimate the results.
By its very nature, such a process is not easily captured by a single indicator, and a small set
of measures will be needed. These indicators should be based on internationally comparable
data.
In this chapter we deal with an assessment of the impacts of the mining industry on economy
and finance in terms of measurement of natural resource revenues and estimation of related
statistics. We provide an overview of the scope of main statictics and estimation methods.
Also, the estimation of related statistics is made based on available databases and its results
are interpreted.
6.2. Conceptual Framework
Mining activities include exploration activity, mine development, mineral production, and
mine remediation exploration. Industrial products include coal, copper, molybdenum, gold,
zinc, silver, lead, concentrates and industrial minerals.
Before we conduct an analysis of the impacts of the mining activity on the national economy,
consideration must be given to the linkages and channels through which the direct, indirect
and induced impacts take place and to the fact that how they are measured. The framework
for measuring the contribution of these flows involves 3 types of group statistics:
production, expenditure and revenue.

46
Figure 6.1: Component of the impact of the mining industry on
economy and finance
As in the case of any assessment of economic impact at the industry level, it is important that
caution is exercised in interpreting results. All economic activities will generate impacts.
However, these activities give rise to associated opportunity costs of resource utilization. In the
context of this paper, this means that if the mining industry did not exist, the reduction in
economic activity would not equate with the impacts shown.
The schematic overleaf provides a description of the components of the direct and indirect
impacts which are captured in this assessment. The key measurable outcomes of the direct and
indirect impacts are as follows:
a. Mining sales turnover as a value of the mining production / output;
b. Persons employed in the mining as a measure of employment;
c. Mining Expenditures;
Direct impact
Economy wide impacts (overall impact)
Multiplier impact:
a. Indirect and induced output impacts
b. Indirect and induced employment impacts
c. Indirect and induced income impacts
d. Effect of the mining on other sectors
Export of mining products
Purchase of goods for re-sale
Purchase for production inputs
Capital expenditure
Value of Output less Value of Production Inputs
Taxes and Receipts
Employment supported
Value of mining production/output
Value of sales/ turnover in mining
Direct employment
Expenditures on Wages and Salaries Economy labor expenditure
of mining
Economy non-labor expenditures of mining
GVA / GDP contribution of
mining activity
Exchequer contribution (tax payment)

47
d. Gross value added of the mining output as a measure of the GVA contribution of mining;
and
e. Tax payments as a measure of the exchequer contribution of the industry.
The first section on basic statistics to be used for an analysis examines core indicators of
statistics for impact analysis.
The mining industry provides jobs, pays wage and generates value added in a country.
Governments at national, provincial, and local levels collect taxes on these activities. The
economic benefits resulting from the value added, income from goods and services, revenue,
operational expenditure, employment, tax revenues of the mining industry are concerned in the
section – an assessment of direct economic impact of the mining on the economy.
However the economic contribution of the mining is greater than these direct effects. The
indirect contribution to the economy is wider than the direct impact. The mining operator
purchases inputs from suppliers, and then re-sells the goods purchased from other companies to
the supplier; this is the feedback effect. In order to create new supply and other goods employers
are provided salary costs for domestic business. As the result, the impact through or from mining
will occur in other economic industry. This is discussed in the assessment of indirect and
induced impact of the mining on the economy.
The last section - Trend in the mining boom attemps to quantify some of its effect, using the
Mongolian database.
6.3. Basic statistics to be used for an analysis
Basic statistics to be used for an analysis is provided in this chapter while a more detailed
indicators, their description and estimation methods for measuring the economic impact can be
found in annex 1.
The economic analysis focuses on the direct, indirect and induced or wider economic impacts.
Direct impact – refers to the supply of primary mining products available in an economy.
Indirect impact – refers to the supply from the suppliers, providing the input to the
manufacturers of the mining products, and that from the producers, using of the output, in an
economy.
Induced impact – refers to the supply, secured by an increase in the income level of household
enterprises, which is generated as a result of the direct and indirect impact.

48
Figure 6.2: Categories of impacts on the economy
Determining the impacts of the mining industry on the whole economy requires internationally
comparable indicators. These must be compiled within a suitable conceptual framework and
should follow certain criteria. Finally, these indicators must be able to provide important and
clear signals to politicians and economic agents. The remainder of this statistics is structured as
follows:
Table 6.1: Basic statistics for an direct impact analysis
Main indicator groups Issue/indicator
Production/Output 1. Measurement of impact of the mining industry on sales turnover
1.1. Total sales turnover in the mining industry
1.2. The share of output in the mining industry
1.3. Export of the mining products
1.4. Export as % of total sales revenues in the mining industry
1.5. Export in the mining industry as % of total export sales revenues
Employment 2. Measuring direct employment in the mining industry
2.1. Employed in the mining activities
2.2. Employed in other support activities (estimated mining-related)
2.3. The share of direct employment in the mining activities
3. Measuring industry labour force in mining-related occupations
3.1. Total number in labour force
3.2. Number at work
3.3. Number unemployed (incl. looking for a first job)
3.4. Unemployment rate in the mining-related occupations
Gross Value added/ GDP 4. Measurement of the mining impact on national income, including
balance of payments incomes associated with mining and measures of
real gross domestic income and real net national disposable income
4.1. Value of gross sales turnover in the mining industry
4.2. Gross value added of the mining industry, at current and constant prices
4.3. The share of value added of the mining industry to the GDP
TOTAL IMPACT of mining sector on economy
DIRECT IMPACT(production, employment, investment and etc)
INDIRECT IMPACT (impact on suppliers and buyers)
INDUCED IMPACT (impact through salaries paid by employers )

49
Main indicator groups Issue/indicator
4.4. GVA as % of turnover in the mining industry
4.5. GVA per employee in the mining industry
4.6. Annual change of value added of the mining industry
4.7. Gross national income per capita
4.8. Annual change of GNI per capita
4.9. Gross disposable income
Expenditure 5. Measuring direct expenditure in the mining industry
5.1. Total direct expenditure on wages & salaries in the mining industry
5.2. The share of expenditure on wages and salaries in the mining industry
6. Measurement of non-labour input in the mining industry, including
energy inputs
6.1. Intermediate consumption of the mining industry
6.2. The share of expenditure on non-labour input in the mining industry
7. Measurement of direct capital expenditure associated with mining
industry
7.1. Total direct capital expenditure in the mining industry
7.2. The share of capital expenditure / investment in the mining industry
Government tax revenues 8. Measurement total direct payment contributions of the mining industry
8.1. Total tax payments
8.2. Total social contributions
8.3. Total direct payment contribution
8.4. The share of total direct payment of the mining indistry to the general government revenue
9. Measurement of state receipts from mining licence/lease holders
9.1. Property income
9.2. Dividends
9.3. Rent and royalties
9.4. Sales of goods and services
9.5. Fines, penalties and forfeits
9.6. Transfers non elsewhere classified
9.7. Premiums, fees and claims related to nonlife insurance and standardized guarantee schemes
9.8. Total receipts
9.9. The share of state receipts of the mining industry to the general government revenue

50
Table 6.2: Basic statistics for indirect and induced impact analysis
Main indicator groups Issue/indicator
Output 1. Measurement of indirect and induced output impact
1.1. Industry output multiplier
1.2. Indirect output impact
1.3. Induced output impact
1.4. Overall output impact
1.5. The share of overall output in mining-related industry
Employment 2. Measurement of indirect and induced employment impact
2.1. Industry employment multiplier
2.2. Indirect employment impact
2.3. Induced employment impact
2.4. Overall employment impact
2.5. The share of overall employment in mining-related industry
Income 3. Measurement of indirect and induced income impact
3.1. Industry income multiplier
3.2. Indirect income Impact
3.3. Induced income Impact
3.4. Overall income Impact
3.5. The share of overall income in mining-related industry
Trade industry 4. Measurement of prices of mineral commodities and the impact of
mineral prices on the terms of trade, as well as mining-induced terms of
trade impacts on the rest of the economy
4.1. Export and import unit price of the mining products
4.2. Export and import price index of the mining products
4.3. Export and import price index
4.4. Terms of trade index (ratio of export price index to import price index)
5. Measurement of impact of the mining on trade statistics, including
coherency with production statistics
5.1. Total sales of the domestic trade industry
5.2. Total sales of the mining products at the domestic market, by types of minerals
5.3. Total exports and imports
5.4. Total exports and imports of the mining products
Productivity 6. Measurement of productivity in the mining industry
6.1. Total productivity of the mining industry
6.2. Total factor productivity of the mining industry
6.3. Labor productivity of the mining industry
6.4. Fixed capital productivity of the mining industry

51
Main indicator groups Issue/indicator
6.5. Main raw material productivity of the mining industry
6.6. Electricity productivity of the mining industry
Construction 7. Measurement of construction activity associated with the mining
industry
7.1. Construction, capital repairs and maintenances associated with the mining industry
Transportation 8. Measurement of impact of the mining on transportation
8.1. Freight turnover of the mining products, by mln ton km
8.2. Carried freight of the mining products, by ton
8.3. Passenger turnover of the mining employees, by pass km
8.4. Passengers carried of the mining employees, by number of people
8.5. Freight turnover of the mining products per 1 km railway length, by ton km
8.6. Freight turnover of the mining products per 1 km improved auto road, by ton km
8.7. Average intensity of traffic per day, by type of vehicle, by conversion to light car from heavy vehicle
8.8. Tarmac and macadam road, power capacity of road construction, by value
8.9. Power capacity of crossroad of railway, by value
Regional impact 9. Measurement of impact of the mining on regional economies (including
regional prices and regional housing markets)
9.1. Consumer price index, by regions
9.2. Housing price index, by regions
6.4. Assessment of direct economic impacts
This section assesses the direct economic impacts of the mining industry. The analysis
includes the following components of the direct economic impact arising from mining
activities:
− Production/Output in the mining industry and extent of export sales;
− Direct employment of the mining industry;
− Gross Value Added/GDP contribution of the mining industry;
− Expenditures, including on wages and salaries, and on non-labour inputs and capital
spending/investment; and
− Exchequer impacts, including tax payments and payments to local authorities, and
receipts from prospecting licence and mining facility holders through royalties, dead
rent and licence fees.
Estimation of the overall contribution of the mining activities to the national economy value-
added/GDP, and the contribution of the industry to the Exchequer in the form of tax
payments. Direct economic impact includes the following statistics:

52
1. Production/Output in the mining industry and extent of export sales
The output of the mining industry can be measured by reference to the value of its sales
revenues.
The share of output in the mining industry (SMO): The share of output in the mining
industry is defined as total output in the mining industry related to total output in all
economic activities in the country.
���� =���
���∗ 100
����:�ℎ ����� ��������������ℎ��������������� �������� ���:� ��������������ℎ��������������� �������� ���: � ������������� ���������� ��������� ��������
BOX 6.1: The share of output in the mining industry in Mongolia, bln.tog
Indicators/statistics 2010 2011
Output in the mining industry 4 120.1 5 686.3
Output in the all economic activities 17 919.9 24 105.3
The share of output in the mining industry 22.3 23.6
Above table indicates the share of output in the mining industry during 2010 and 2011 in
Mongolia. Share of output in the mining industry increased from 22.3 percent in 2010 to
over 23.6 percent in 2011.
Export revenues as % of total revenues in the mining industry (SMExS): The majority of
sales revenue earned in the mining industry is from export. The share of export revenues in
the mining industry is defined as export revenues in the mining industry related to total sales
in the mining industry in the country.
������ =����
���∗ 100
������:������������� �%����� �������� ���ℎ��������������� ��������
����:����������������ℎ��������������� �������� ���: � ��������������ℎ��������������� ��������
Export revenues in the mining industry as % of total export revenues (SMExE): The
share of export revenues in the mining industry is defined as export revenues in the mining
industry related to total export revenue in all economic activities in the country.
������ =����
����∗ 100

53
������:������������� �%����� �������������� �� �� ��������� ��������
����:����������������ℎ��������������� �������� ����: !�� ���������������� ���������� ��������� ��������
BOX 6.2: The share of export in the mining industry in Mongolia, bln.tog
Indicators/statistics 2010 2011
Export turnover in the mining industry 3 148.0 5 065.0
Export as % of total sales in the mining industry 76.4 89.1
Export turnover all economic activities 4 554.3 6 923.3
Export as % of total Export 69.1 73.2
The indicator shows, firstly, in 2011, a total of 5065.0 bln.tog, or 89.1% of sales revenue,
was generated from export. Secondly, the share of export in the mining industry in the total
export in the country accounted for 69.1 in 2010, increased to 73.2 percent in 2011 (see
table above).
2. Employment
The employment, supported by mining, is an alternative measure of its economic contribution
to gross value added. Employment is expressed by the number of additional jobs created as a
result of the expenditures made by mining activities.
The share of main employment of the mining activities in the national employment is low,
but the mining activities create mining-related employment. Other support activities include
activities such as office employment and administration, technical and research activities.
The share of direct employment in the mining industry (SMEmp): The share of direct
employment supporting the mining industry is defined as total persons engaged in the mining
industry related to total employment in all economic activities in the country.
������ =��"#�
�����∗ 100
������:�ℎ �����������������������ℎ��������������� �������� �����:!�� ����������� ������ℎ��������������� �������� �����: !�� ������������� ���������� ��������� ��������
Where: !�� ����������� ��� = �����������ℎ������� ��������� + Employed in other
support activities

54
BOX 6.3: Direct employment supported in mining in Mongolia, thous.persons
Indicators/statistics 2010 2011
Employed in the mining activities - -
Employed in other support activities - -
Total persons engaged 34.1 45.1
Total employment 1 033.7 1 037.7
Direct employment as % of total employment 3.3 4.3
The indicator shows, in 2010, the number of paid workers in the mining sector accounted
for 3.3% of all employment in the country, the share increased to 4.3 percent in 2011.
Unemployment rate in the mining-related occupations (RMUnemp): The stronger
activity arising from the mining boom results in lower unemployment. Unemployment rate in
the mining-related occupations is the ratio of the number of unemployed people in the mining
related occupations to the sum of the number of employed and unemployed people in the
mining related occupations.
%�&����� =�&�����
�'(�����∗ 100
%�&�����:&������������ �����ℎ���������� �������� ����� �������� �&�����:)��*�����������������ℎ���������� �������� ����� �������� �'(�����: !�� ����*����� *�����������ℎ���������� �������� ����� ��������
3. GDP/Direct gross value added
Gross value added (GVA) is defined as the value of production less the value of intermediate
consumption. It is an equivalent measure to that of gross domestic product (GDP), which
measures the extent of value added across the economy as a whole. GVA is therefore the best
measure of the constribution of an industry/industry to economy-wide GDP. In the case of the
mining activity in a country, the GVA contribution by reference to the value of sales turnover
less expenditure on intermediate inputs (non-labour inputs such as purchases of raw materials
and other services).
The share of value added of the mining industry to the GDP (SMVA): The share of gross
value added in the mining industry is defined as gross value added in the mining industry
related to the GDP.
��+,� =�+,�
�+,�∗ 100
��+,�:�ℎ ���������� ��� �������������������� ���ℎ�-./ ��������
�+,�:-����� ��� �������ℎ��������������� ��������

55
�+,�: -./ ��������
GVA as % of turnover in the mining (SMVA_T): GVA as a share of turnover in the
mining is gross value added of the mining industry divided by turnover in mining.
��+,_!� =�+,�
���∗ 100
��+,�:�ℎ ���������� ��� �����������������������ℎ��������� �������� ��������
�+,�:-����� ��� �������ℎ��������������� �������� ���: � ��������������ℎ��������������� ��������
GNI per capita (PMGNI_C): GNI per capita is gross national income divided by mid-year
population.
/-)1_2� =-)1�
/���
/-)1_2�:-)1���� ��� �������� -)1�:-����� ���� ������� �������� /���:����� ������ ���� ��������
GVA per employee (PMVA_Emp): GVA per employee in the mining is gross value added
of the mining industry divided by employee in the mining.
/�+,_���� =�+,�
�����
/�+,_����:-����� ��� ����������������������� �������� �+,�:-����� ��� �������ℎ��������������� �������� �����:!�� ����������� ������ℎ��������������� ��������
Annual change of gross value added of the mining industry (CMVA): Annual change of
gross value added in the mining is gross value added of the mining industry at t period less
gross value added in the mining at t-1 period.
2�+,� = �+,� −�+,�45
2�+,�:,��� ��ℎ ����������� ��� ���� �������� �+,�:-����� ��� �������ℎ��������������� ��������
�+,�45:-����� ��� �������ℎ��������������� �� − 1������
BOX 6.4: Gross value added of the mining to the country economy in Mongolia
Indicators/statistics 2010 2011
Value of gross sales turnover in mining, bln.tog 4 120.1 5 686.3
Gross value added in mining, at current prices, bln.tog 2 102.2 2 536.2
Gross value added in mining, at constant prices, bln.tog 736.9 791.0

56
GDP, at current prices, bln.tog 9 756.6 13 173.8
Employed in the mining activities, thous.persons 34.1 45.1
The share of value added of the mining industry in the
GDP
21.6 19.3
GVA as % of turnover in mining 51.0 44.6
GNI per capita, thous.tog 3266.1 3774.3
GVA per employee, mln.tog 64.6 56.2
Annual change of gross value added of the mining
industry , bln.tog
- 434.0
Presented in Table 6.4.4 above are Mongolia estimates of GVA of the mining industry,
utilising data provided in SUT and IOT. We estimate that mining activity resulted in a
significant GVA contribution of 19.3 percent during 2012.
4. Expenditure
The overall economic impact of the mining activities will be a function of the level of
expenditures of the mining on goods and services inputs. This will include impacts through
spending on wages and salaries of persons employedand expenditures on non-labour business
inputs and capital investment. These components are described below.
The share of expenditure on wages and salaries in the mining industry (SMWExp): The
derived statistics aims to measure the level of total compensations by wages and salaries in
the mining industry. Wages and salaries are an important component of value added in an
economy; it is one of the main triggers of consumption of goods and services.
The share of expenditure on wages and salaries in the mining industry is defined as
expenditure on wages and salaries in the mining industry related to expenditure on wages and
salaries in all economic activities in the country.
��6���� =�6����
�6����∗ 100
��6����:�ℎ �����������������7 ��� ��� � ���� ���ℎ��������������� ��������
�6����:�������������7 ��� ��� � �������ℎ��������������� �������� �6����: �������������7 ��� ��� � ������ ���������� ��������� ��������
BOX 6.5: Total direct expenditure on wages and salaries in mining in Mongolia,
bln.tog
Indicators/statistics 2010 2011
Expenditure on wages and salaries in mining 260.1 591.3

57
Expenditure on wages and salaries in the all economic
activities
2 199.2 3 150.1
The share of expenditure on wages and salaries in the
mining industry
11.8 18.8
A total of 591.3 bln.tog was spent on wages and salaries by mining activities during
2011whereas 260.1 bln.tog was spent in 2010. In 2010, the share of expenditure on wages
and salaries in the mining industry was 11.8 percent and almost 18.8 percent in 2011.
The share of expenditure on non-labour input in the mining industry (SMIExp): When
considering the overall economic impact of the mining industry on the domestic economy a
main component is that of expenditure on country produced goods ans services. Expenditures
include spending that is required when a mine is in operation. These include production
materials and supplies, treatment and refining charges, professional and technical services,
including education and training, and the total cost of electricity purchased, including water
services.
The share of expenditure on non-labour input in the mining industry is defined as expenditure
on non-labour input in the mining industry related to expenditure on non-labour input in all
economic activities in the country.
��1���� =�1����
�1����∗ 100
��1����:�ℎ �������������������� − � *�����������ℎ��������������� �������� �1����:���������������� − � *�����������ℎ��������������� �������� �1����: ���������������� − � *���������� ���������� ��������� ��������
BOX 6.6: Total expenditure on non-labour input in mining, bln.tog
Indicators/statistics 2010 2011
Expenditure on non-labour input in mining 1 896.8 2 899.1
Expenditure on non-labour input in the all economic
activities
8 775.0 11 880.6
The share of expenditure on non-labour input in the
mining industry
21.6 24.4
In 2012 expenditures on non-labour inputs within the mining activities amounted to 2899.1
bln.tug, up slightly from 1896.8 bln.tog in 2010. The share of expenditure on non-labour
inputs in the mining industry was 21.6 percent in 2010 and was 24.4 percent in 2011.
The share of capital expenditure / investment in the mining industry (SMCExp): The
direct impacts generated from the capital expenditures are likely not a reliable point of
reference for examining trends in output, GDP or employment. During the construction phase
of a mine, companies are highly labour intensive. However, once the mine is in operation, the
total number of workers required reduces. Capital expenditures include the purchase of lands

58
and mining rights, expenditures on all buildings other construction, machinery, equipment
and mine shafts and underground work.
The share of capital expenditure in the mining industry is defined as capital expenditure in
the mining industry related to capital expenditure in all economic activities in the country.
��2���� =�2����
�2����∗ 100
��2����:�ℎ ����� ��� ���������������ℎ��������������� �������� �2����:2 ��� ���������������ℎ��������������� �������� �2����: 2 ��� �������������� ���������� ��������� ��������
BOX 6.7: Total capital expenditure in mining, bln.tog
Indicators/statistics 2010 2011
Capital expenditure in mining 895.4 899.4
Capital expenditure in the all economic activities 3 881.8 7 106.0
The share of capital expenditure in the mining
industry
23.1 12.7
The total amount spent by the main operating mines in Mongolia on capital goods in 2010
and 2011 is shown in Table 6.4.7 above. It is estimated that a total of 899.7 bln.tog was
invested in capital goods among the mines in during 2011.
The share of total expenditure in the mining industry (SMTExp): The share of total
expenditure in the mining industry is defined as total expenditure in the mining industry
related to total expenditure in all economic activities in the country.
��!���� =�6���� +�1���� +�2����
�6���� + �1���� + �2����∗ 100
��!����:�ℎ ������� ���������������ℎ��������������� �������� �6����:�������������7 ��� ��� � �������ℎ��������������� �������� �6����: �������������7 ��� ��� � ������ ���������� ��������� �������� �1����:����������������
− � *�����������ℎ��������������� �������� �1����: ����������������
− � *���������� ���������� ��������� �������� �2����:2 ��� ���������������ℎ��������������� �������� �2����: 2 ��� �������������� ���������� ��������� ��������
BOX 6.8: Total capital expenditure in mining, bln.tog
Indicators/statistics 2010 2011
Expenditure on wages and salaries in mining 260.1 591.3
Expenditure on non-labour input in mining 1 896.8 2 899.1

59
Capital expenditure in mining 895.4 899.4
Total expenditure in mining 3 052.3 4 389.8
Total expenditure in the all economic activities 14 856.0 22 136.7
The share of capital expenditure in the mining
industry
20.5 19.8
Table 6.4.8 overleaf combines all the expenditure components profiled above for the
mining industry, indicating a total for mining expenditure of 3052.3 bln.tog and 4389.8
bln.tog in 2010 and 2012, respectively.
5. Exchequer Contribution
Government revenues from natural resources are the revenue payments governments receive
from natural resource enterprises.
In addition to its impact through expenditures, GVA and direct employment, the mining industry
also contributes to the state in the form of various payments to the Exchequer.
The collection of data on government revenues from natural resources requires a template to
gather these data in a systematic manner, present it in an analytically useful way, and ensure it is
comparable across countries. The template that has been developed by the IMF is designed to
capture all possible government revenues from natural resources; however, in practice, for many
countries it is likely that data for only a subset of these revenues will be collected.
Tax revenue line items listed in the template cover the main taxes that would be payable by
natural resource enterprises. These taxes are a subset of the main GFSM 2014 category Taxes
(11). More specifically, taxes on income, profits and capital gains payable by corporations and
other enterprises (1112), dividends (1412), and rent (1415) are the principal revenue categories
associated with revenues from natural resources. A short description of each subcategory is
provided in the Annex 2 to this chapter while a more detailed description of the revenue
categories can be found in chapter 5 of the GFSM 2014.
Table 6.3: Template—Government Revenues from Natural Resources
GFSM
Codes Description*
11 Taxes
1112 Taxes on income, profits, and capital gains (payable by corporations and other enterprises)
Taxes on income payable by natural resource enterprises Taxes on extraordinary profits payable by natural resource enterprises
112 Taxes on payroll and workforce
113
114
Taxes on payroll and workforce payable by natural resource enterprises
Taxes on property
Taxes on property payable by natural resource enterprises
Taxes on goods and services
1141 General taxes on goods and services (value added tax, sales tax, turnover tax)
Value added taxes payable by natural resource enterprises Unrequited value added taxes payable by natural resource enterprises

60
GFSM
Codes Description*
1142 Excises
Excise taxes payable by natural resource enterprises 1143 Profits of fiscal monopolies
Profits of natural resource fiscal monopolies 1145 Taxes on use of goods and on permission to use goods or perform services
11452 Other taxes on use of goods and on permission to use goods or perform activities
Business and professional licenses payable by natural resource enterprises Pollution taxes payable by natural resource enterprises
1146 Other taxes on goods and services
115
Other taxes on goods and services payable by natural resource enterprises
Taxes on international trade and transactions
1151 Customs and other import duties (import taxes)
Taxes on imports payable by natural resource enterprises 1152 Taxes on exports
Taxes on exports of natural resources 1153 Profits of export or import monopolies
116
Profits of natural resource export monopolies
Other taxes
1161 Other taxes payable solely by business
Other taxes payable by natural resource enterprises
12
121
Social contributions
Social security contributions
1211 Social security employee contributions
Employee contributions from natural resource enterprises
1212
122
Social security employer contributions
Employer contributions from natural resource enterprises
Other social contributions
13 Grants (not applicable)
14
141
Other revenue
Property income
1412 Dividends
Dividends from government owned natural resource enterprises
Dividends from government participation in natural resource enterprises (equity) 1415
142
Rent Royalties payable by natural resource enterprises Bonuses payable by natural resource enterprises Production entitlements payable by natural resource enterprises Compulsory social infrastructure payable by natural resource enterprises Other rent Sales of goods and services
1422
143
Administrative fees
Administrative fees for government services supplied to natural resource enterprises
Fines, penalties, and forfeits
144 Transfers not elsewhere classified
145 Voluntary social infrastructure payments payable by natural resource enterprises
Premiums, fees, and claims related to nonlife insurance and standardized guarantee schemes
* Terms in italics refer to categories exclusively associated with government revenues from natural resources.
Source: Government Finance Statistics Manual 2014.
The share of total direct payment of the mining industry in the general government
revenue (SMTax): The share of total direct payment in the mining industry is defined as
total direct payment in the mining industry related to the general government revenue.
��! �� =�! ��
�-��%�∗ 100

61
��! ��:�ℎ ������� �������� ������������������������ℎ� ����� ������������������ ��������
�! ��:!�� �������� ��������ℎ��������������� �������� �-��%�: -���� �������������������������
BOX 6.9: Total direct exchequer contribution of mining, bln.tog
Indicators/statistics 2010 2011
Total tax payment 929.5 1 506.4
Social contribution 44.5 64.0
Total Direct Payment Contributions 974.0 1 570.4
General government revenue 3 122.5 4 468.2
The share of total direct payment in the mining
industry
31.2 35.1
The total combined direct exchequer contribution of mining in the mining industry for 2010
and 2011 is shown in the table 6.4.10. It is estimated that the mining industry contributed a
total of 1570.4 bln.tog or 35.1 percent to the general government revenue in tax and local
authority payments during 2011.
The share of state receipts of the mining industry in the general government revenue
(SMReceipts): The share of state receipts in the mining industry is defined as total receipts in
the mining industry related to the general government revenue.
��%�������� =�%��������
�-��%�∗ 100
��%��������:�ℎ ������ �����������������������������ℎ� ����� ������������������ ��������
�%��������:!�� ������������ℎ��������������� �������� �-��%�: -���� �������������������������
BOX 6.10: State receipts from mining industry, bln.tog
Indicators/statistics 2010 2011
Property income 99.3 158.4
Dividends 41.0 80.1
Rent and royalties 58.3 78.4
Sales of goods and services 5.9 6.7
Fines, penalties, and forfeits 30.6 53.0
Transfers not elsewhere classified
Premiums, fees, and claims related to nonlife insurance
and standardized guarantee schemes
15.1 31.9
Total Mining Receipts 150.9 250.1
The share of total receipts in the mining industry 4.8 5.6
The table integrates the above elements to identify the overall level of receipts from

62
royalties, licence fees and other payments by mining and prospecting licence holders. A
total of just under 250.1 bln.tog was paid to the state during 2011.
6.5. Assessment of indirect and induced economic impacts
This section examines the multiplier impacts of the direct activities measured in Section 6.4,
through estimating the indirect and induced, and overall impacts of mining activities on the
economy. These impacts reflectthe total economic impact of the mining activities. Wider output,
employment and income impacts of the mining activities will be focused.
The approach applied in arriving at the economy-wide impacts is based on the input-output
analysis, which forms the basis for derivation of the national accounts for the economy in line
with internationally agreed principles. Specifically, this section utilises the supply and use and
input-output tables for the economy. The analysis is conducted through the development of
multipliers for interested indicators which are derived from these tables.
Where the impacts are to be estimated at the industry level, it is very important to explain the
results. All economic activities create impacts.
First of all, let us remember the definition of ‘Input-output economic modeling’:
The main economic concept of the demand impact analysis to be made by input-output
modeling is to determine if demand elements in balance are changed exogenously, what will be
the consequence to the economy. When Leontyev reverse matrix is multiplied by the final
demand vector, the total production vector is resulted, therefore, in practice; it is called the
analysis of input-output multiplier. Demand multiplier is considered in total production in the
standard input-output modeling. There are 3 main forms for common multiplier:
• Output multiplier
• Income multiplier
• Labor multiplier
Each method has own strengths and weaknesses, however; all directly depend on the quality of
and access to the needed source data. Detailed approach will be shown in Annex 2.
Multiplier: Factor to be used in estimating the wider economic impacts of industry and
economic activities. It considers the indirect and induced impacts of the industry. Indirect
impacts relate to the additional economic activity supported in sub-supply of input to the
industry. As these indirect impacts supported employment and associated incomes, the re-
spending of these incomes elsewhere in the economy gives rise to induced impacts, thereby
supporting additional activity and employment. Multipliers are calculated using detailed industry
data of input-output analysis of the relationships between economic industries.
There are 2 methods of multipliers to assess the economic impact:
• Type I multiplier
• Type II multiplier

63
Type I multiplier calculates the economic-wide impact to be expressed by the sum of direct and
indirect impacts. It is expressed by the activity changes, which can occur in other industry
when the demand of direct impact industry increases.
Type II multiplier is the expanded form of type I multiplier. It includes direct, indirect and
induced impacts. Induced impact is generated from the additional consumption, related to the
additional employment income results from indirect impact. In other words, type II multiplier
includes the households within additional industry, related to the input-output table.
Following multipliers will be applied to our analysis:
• Output multipliers: They are employed to measure the production of all industry,
required for the demand of MNT 1 in an industry, and the intermediate expenses, to be
provided by households.
• Income multipliers: They show how a change in the consumption costs impacts the
income of the household enterprises and the labour supply. They describe how a change in
the labour costs per the gross production of an industry impacts on the household income.
• Employment multipliers: They explain how a change in the gross production impacts on
the volume of labour supply.
Output impacts: The economic impact from mining expenditure can be shown in the
following modeling.
1���������������� ��(2)� = (,� ∗ :�) − ,�
1��������������� ��(�)� = (,� ∗ .�) − 2� − ,�
,� :!�� ��������������������� �������� :�:���������������������� − !���1 .� :���������������������� − !���11
Overall output impact:
;<=>?@@ABCDBCEFD?GCC= HAC?@=ID=JKECB>=LEJFEJEJM(NC) + OJKE>=GCABCDBCEFD?GC(P)C+ OJKBG=KABCDBCEFD?GC(Q)C
The share of overall output in the mining industry (SMOO): The share of overall output
in the mining industry is defined as overall output in the mining activities related to total
output in all economic activities in the country.
����� =����
���∗ 100
����� :�ℎ �������� �����������ℎ������� ��������� �������� ���:���� �����������ℎ������� ��������� �������� ���: � ������������� ���������� ��������� ��������

64
BOX 6.11: Impacts of the mining Output in Mongolia (bln.tog), 2010
Statistics Mining
industry -
TOTAL
Mining of
coal and
crude
petroleum
Mining of
metal ores
Other
mining and
quarrying
Mining
support
service
activities
Direct Impact
Total Mining Expenditure 3052.3 415.6 786.8 69.6 1780.3
Indirect Multiplier Impact
Industry Output Multiplier - Type I 1.27 1.25 1.33 1.77
Indirect Output Impact 1702.7 112.2 196.7 23.0 1370.8
Induced Multiplier Impact
Industry Output Multiplier - Type II 1.52 1.64 2.06 2.19
Induced Output Impact 1209.3 103.9 306.8 50.8 747.7
Overall Output Impact: Direct +
Indirect + Induced Output
Impact 5964.3 631.8 1290.3 143.4 3898.8
The share of overall output in the
mining activities 33.3 3.5 7.2 0.8 21.8
We estimate that the expenditure of 1702.7 bln.tog causes the indirect impact. As the
demand of the mining industry increases, the input of the supply of other relevant industries
increases. This means that this measure impacts on the economy. The induced income
impact, derived from the mining expenditure, is associated with the additional
consumption, generated as a result of the indirect impact of the mining industry. It is
estimated that the induced impact amounts to 1209.3 bln.tog. The total output impact on the
economy from direct, indirect and induced impact results is 5964.3 billion tugrugs,which is
33.3 percent of the output in the national economy.
Employment impact: Employment impact on the economy from mining activities can be
shown in the following modeling.
1�������������������� ��(2)� = (,� ∗ :�) − ,�
1������������������� ��(�)� = (,� ∗ .�) − 2� − ,�
,�:)��*��������������������������� �������� :�:�������������������������� − !���1 .�:�������������������������� − !���11
Overall employment impact: ;<=>?@@=FD@ARF=JCEFD?GCC = QFD@ARF=JCEJFEJEJM(NC) +
OJKE>=GC=FD@ARF=JCEFD?GC(P)C + OJKBG=K=FD@ARF=JCEFD?GC(Q)C
The share of overall employment in the mining activitis (SMOEmp): The share of overall
employment in the mining activities is defined as overall employment in the mining activities
related to total employment in all economic activities in the country.

65
������� =���"#�
�����∗ 100
�������:�ℎ �������� ���������������ℎ������� ��������� �������� ������:���� ���������������ℎ������� ��������� �������� �����: !�� ������������� ���������� ��������� ��������
BOX 6.12: Impacts of the mining employment in Mongolia (thous.person), 2010
Statistics Mining
industry -
TOTAL
Mining of
coal and
crude
petroleum
Mining of
metal ores
Other
mining and
quarrying
Mining
support
service
activities
Direct Impact
Number of Persons Employed in
the mining 34.1 9.5 10.4 8.8 5.4
Indirect Multiplier Impact
Industry Employment Multiplier - Type I 2.61 2.96 1.2 7.9
Indirect Employment Impact 74.7 15.3 20.4 1.8 37.3
Induced Multiplier Impact
Industry Employment Multiplier - Type II 3.96 5.79 1.57 12.2
Induced Employment Impact 68.7 12.8 29.4 3.3 23.2
Overall Employment Impact:
Direct + Indirect + Induced
Employment Impact 177.5 37.6 60.2 13.8 65.9
The share of overall employment
in the mining activitis 17.2 3.6 5.8 1.4 6.4
The results from the economic impact analysis of the employment in the mining activities
reveals that in 2010, there were 34.1 thousand direct employees and the indirect impact of
the employment was 74.7 thousand in the industry relating to the mining activities. The
induced impact of employment was 68.7 thousand employments. The overall impact of the
employment in the mining industry on the economy was 177.5 thousand. The share of
overall employment in the mining activitis in the total employment is 17.2 percent in 2010.
Income impact: The final component of our analysis of the economic multiplier impacts of
the mining relates to the income multiplier impacts arising from the wages and salaries
earned by the employed in the mining. Income impact on the economy from mining activities
can be shown in the following modeling.
1���������������� ��(2)� = (,� ∗ :�) − ,�
1��������������� ��(�)� = (,� ∗ .�) − 2� − ,�
,�:�������������7 ��� ��� � ������������ �������� :�:���������������������� − !���1 .�:���������������������� − !���11

66
Overall income impact
;<=>?@@EJGAF=EFD?GCC
= QID=JCEKB>=AJS?M=L?JKL?@?>E=LEJFEJEJM(NC)
+ OJKE>=GCEJGAF=EFD?GC(P)C + OJKBG=KEJGAF=EFD?GC(Q)C
The share of overall income of the mining industry (SMOWExp): The share of overall
income in the mining activities is defined overall income in the mining activities related to
expenditure on wages and salaries in all economic activities in the country.
���6���� =��6����
�6����∗ 100
���6����:�ℎ �������� �����������ℎ������� ��������� �������� ��6����:���� �����������ℎ������� ��������� ��������
�6����: �������������7 ��� ��� � ������ ���������� ��������� ��������
BOX 6.13: Impacts of the mining income in Mongolia (bln.tog), 2010
Statistics Mining
industry -
TOTAL
Mining of
coal and
crude
petroleum
Mining of
metal ores
Other
mining and
quarrying
Mining
support
service
activities
Direct Impact
Expenditure on Wages & Salaries
in the mining 260.1 49.4 142.8 18.3 49.6
Indirect Multiplier Impact
Industry Income Multiplier - Type I 1.8034 1.4272 1.234 3.22991
Indirect Income Impact 215.7 39.7 61.0 4.3 110.7
Induced Multiplier Impact
Industry Income Multiplier - Type
II 2.3758 1.8802 1.6257 4.2551
Induced Income Impact 151.0 28.3 64.7 7.2 50.9
Overall Income Impact: Direct +
Indirect + Induced income
Impact 626.8 117.4 268.5 29.7 211.2
The share of overall income of the
mining industry 19.9 3.7 8.5 0.9 6.8
According to our estimation, the wage revenue of MNT 626.8 billion was generated
through the direct, indirect and induced impact of the mining industry in 2010.

67
6.6. Trends in the mining boom
This section shows that the mining boom involves a comparision of two scenarios. These are
how national economies develop with the mining boom and without mining boom.
Differences between the economies with mining and without mining scenarios are interpreted
as the effects of the mining boom.
Effects of the mining boom on GDP: GDP growth is calculated by the ratio of value added
at t period and value added at t-1 period in the mining industry.
-./���7�ℎ� =�+,�
�+,�45∗ 100
-./���7�ℎ�:-./���7�ℎ���ℎ��������������� �������� �+,�:+ ��� �������ℎ��������������� ��������
�+,�45:+ ��� �������ℎ��������������� �� − 1������
BOX 6.14: Effects of the Mining boom on GDP growth (trend, through the year)
Effects of the mining boom on income: The effect of the mining boom on overall living
standards can be gauged by the difference in real household gross national income per capita.
GNI per capita growth is calculated by the ratio of GNI per capita at t period and GNI per
capita at t-1 period in the economy.
-)1���� ��� ���7�ℎ� =-)1�
-)1�45∗ 100
-)1���� ��� ���7�ℎ�:-./���7�ℎ���ℎ��������������� �������� -)1�:-)1��������� ��������
-)1�45:-)1��������� �� − 1������
GDP growth
Mining GDP growth
Non-mining GDP
growth
0.0%
5.0%
10.0%
15.0%
20.0%
25.0%
2011 2012 2013 2014

68
BOX 6.15: Effects of the Mining boom on income (trend, through the year)
The share of j level income impact (SI) in the mining activities is defined as j income
related to total income in all economic activities in the country.
�1T� =1T�
�1�∗ 100
�1T�:�ℎ �������������ℎ�U����� �������� �1�:1��������ℎ�U����� ��������
�1�: !�� ��������� ���������� ��������� ��������
Where: j-direct level, indirect level, induced level and non-mining level
BOX 6.16: Effects of the mining boom on income
Effects of the mining boom on employment growth: The stronger activity arising from the
mining boom results in higher employment.
Employment growth (Emp growth) is calculated by the ratio of employment at t period and
employment at t-1 period in the mining industry.
GDP growth
Mining GDP growth
GNI per capita growth
0.0%
5.0%
10.0%
15.0%
20.0%
25.0%
2011 2012 2013 2014
11.818.8 18.0 15.6 13.7
8.6
13.6 13.011.3
9.9
9.6
15.2 14.612.7
11.1
70.0
52.4 54.560.4 65.3
0%
10%
20%
30%
40%
50%
60%
70%
80%
90%
100%
2010 2011 2012 2013 2014
Direct mining income Indirect mining income Induced mining income non-mining income

69
������7�ℎ� =�����
�����45∗ 100
������7�ℎ�:������7�ℎ���ℎ��������������� �������� �����:�������������ℎ��������������� ��������
�����45:�������������ℎ��������������� �� − 1������
BOX 6.17: Effects of the Mining boom on employment growth (trend, through the year)
The share of j level employment impact (SEmp) in the mining activities is defined as j
employment related to total employment in all economic activities in the country.
����T� =���T�
�����∗ 100
����T�:�ℎ �����������������ℎ�U����� �������� ����:�������������ℎ�U����� ��������
�����: !�� ������������� ���������� ��������� ��������
Where: j-direct level, indirect level, induced level and non-mining level
BOX 6.18: Effects of the mining boom on employment
Real employment
growth
Mining employment
growth
Non-mining
employment growth
-30
-20
-10
0
10
20
30
40
2006 2007 2008 2009 2010 2011 2012 2013 2014
3.3 4.3 4.4 4.6 3.77.2 9.4 9.6 9.9 8.06.6
8.7 8.9 9.27.4
82.9 77.5 77.1 76.4 80.9
0%
10%
20%
30%
40%
50%
60%
70%
80%
90%
100%
2010 2011 2012 2013 2014
Direct mining employment Indirect mining employment Induced mining employment non-mining employment

70
Effects of the mining boom on investment: Investment without the mining boom is lower
than that with the mining boom.
The share of investment to the GDP (SMI) is calculated by the ratio of investment at t
period and value added at t period in mining industry.
��1� =�1�
�+,�∗ 100
��1�:�ℎ �����������������ℎ��������������� �������� �1�:1������������ℎ��������������� �������� �+,�:+ ��� �������ℎ��������������� ��������
BOX 6.19: Effects of the Mining boom on investment, percent of trend GDP
Effects of the mining boom on consumption: The share of consumption to total
consumption (SMC) is calculated by the ratio of consumption in the mining at t period and
consumption at t period in all economic activities in the country.
��2� =�2�
�2�∗ 100
��2�:�ℎ ������������������ℎ��������������� �������� �2�:2�������������ℎ��������������� �������� �2�:2������������ ���������� ��������� ��������
BOX 6.20: Effects of the mining boom on consumption
With mining
investment
Without mining
investment
0.0%
10.0%
20.0%
30.0%
40.0%
50.0%
60.0%
70.0%
2009 2010 2011 2012 2013 2014
30.5 37.527.4 24.5 21.6
69.5 62.572.6 75.5 78.4
0%
20%
40%
60%
80%
100%
2010 2011 2012 2013 2014
Mining consumption Non- mining consumption

71
BOX 6.21: Impact of the mining boom on market costs
In the first 9 months of 2015, the average prices of some consumer goods and services
We compared and analysed the cost of commodity goods and services in Khanbogd soum
with the nearby Tsogttsetsii soum and the province center. We used the average data as of
first 8 months 2015 for the analysis. The figure below shows that the cost of the commodity
goods except meat is higher than in Tsogttsetsii soum and province center.
Hotel price is higher by 16.2 percent than in Tsogttsetsii soum and by 30.0 percent higher
than in province center, café’s dish cost is higher by 5.0 percent than in Tsogtstetsii soum
and by 16.7 percent higher than in province center. Cost for petrol A92 is higher by 2.2
percent than in Tsogttsetsii soum and by 2.9 percent than in province center. 24.5 percent of
the respondents in survey buy their commodity goods from other soums and province.
Source: Survey on impact of mining sector to economic, social and environmental status of
Khanbogd soum, Omnogovi province in Mongolia, 2015

72
Effects of the mining boom on Labor productivity: The labor productivity is defined and
calculated by the ratio of value added and annual average of employees in the mining
industry.
'/� =�+,�
���∗ 100
'/�:'�*�����������������ℎ��������������� �������� �+,�:+ ��� �������ℎ��������������� �������� ���: ���������������ℎ��������������� ��������
BOX 6.21: Labor productivity of mining industry (thous.tog/employees)
Trade industry: The share of export to total export (SMEx) is calculated by the ratio of
export in the mining at t period and export at t period in all economic activities in the country.
����� =����
����∗ 100
�����:�ℎ �������������ℎ��������������� �������� ����:���������ℎ��������������� �������� ���:�������� ���������� ��������� ��������
BOX 6.22: Export growth with and without mining (%) and Export and import price index of
the mining products
Labor productivity of
the mining
Labor productivity of
the country
0.0
10.0
20.0
30.0
40.0
50.0
60.0
70.0
80.0
90.0
2011 2012 2013 2014
tho
us.
tog
Mining export
Non- mining export
0%
10%
20%
30%
40%
50%
60%
70%
80%
90%
100%
2005 2006 2007 2008 2009 2010 2011 2012 2013 2014
Export growth with and without mining (%)

73
Export-Overall index
Export-mineral
products
Import-Overall index
Import-mineral
products
0.0
100.0
200.0
300.0
400.0
500.0
600.0
700.0
2011 I 2011 II 2011 III 2011 IV
Export and import price index of the mining products

74
CHAPTER 7. MEASURING
SOCIETAL IMPACTS FROM
MINING
7.1. Introduction
Mining as an activity has been there since the beginning of human society and minerals have
contributed to the development of human civilization since the Stone Age. The human
population is predicted to grow to about 9 billion by 2050; hence it would be necessary to
expand production of minerals in order to support this growth. For most of its history,
however, mining was dominated by mining benefits staying in the hands of too few people
with little regard for environment, local community or development. Generally speaking,
society, often mainly comprising indigenous, relatively backward communities in mining
areas, has been affected by the impacts of mining. The situation has changed somewhat since
the 1980s due to increasing concern worldwide regarding intensified environmental damage
and failure to address the problems of poverty and marginalization of indigenous backward
communities that have accompanied universal economic development in the post-World War
II years.
Mineral development involves use of large tracts of land and there are often problems and
disagreements around issues such as resettlement, compensation and land rights of the
indigenous people. Mining activities can bring benefits to the local communities through
creation of jobs, encouragement to business and infrastructure development. Conversely, they
may also generate social tensions and economic problems through loss of traditional
livelihoods and culture, involuntary resettlement and inequitable distribution of benefits and
costs within the communities, inadequate infrastructure development and health concerns due
to exposure of populations to chemicals and particles and workers’ safety.
Thus mining as an activity has both positive and negative impact on the society in general
and the neighbourhood society in particular. These impacts could be during the start of a
mining project, in the currency of it and after the inevitable closure of the project. The
societal impacts of mining can be measured mainly through employment generation, the
income generated by the employees, population dislocation due to mining activity, the effect
on poverty, effect of mining on health and education of the population, migration in
population etc.
BOX 7.1: Impact of the mining boom on migration
We calculated the important indicators, related to demography migration studies, as the
immigration rate, emigration rate and internal net migration rate. These indicators are
expressed by the number of migration participants per 1000 people.
Immigration rate was 132.8 in 2010 but reduced to 72.9 in 2014. And the emigration rate
was 24.7 in 2010 but increased to 61.6 in 2014. It shows the reduction of the internal net
migration rate. We can conclude that although the mining sector creates mining-supported

75
workplaces, this tend to reduce after a while.
We asked the reason for immigrants and 70.3 of total respondents answered that they follow
the mining activities.
Migration rate, by selected year
Source: Survey on impact of mining sector to economic, social and environmental status of
Khanbogd soum, Omnogovi province, 2015
1. Labour: Persons who, during the reference period, are engaged in any mining activity or
who, despite their attachment to their mining activity, have temporarily abstained from work,
for reasons of illness, injury or other physical disability, bad weather, festivals, social or
religious functions or other contingencies necessitating temporary absence from work
constitute workers. Labour Force in mineral sector indicates workers in the sector and is an
important input for production minerals in the country. The reliable estimates of labour force
are important for policy and planning purposes.
A. For measuring the employment in the mining industry the following indicators are
proposed.
1.1 Number of employees at the mining sector: It can be measured as the average daily
employed for all categories of workers directly working in the mines. It can be obtained
through statutory returns/administrative records/surveys. For a mine it can be computed as
follows:
Average daily employment=No. of man days worked ÷total number of days mine worked
Aggregate of all such mines data would be the Number of employees at the mining sector for
the country.
1.2. Number of foreign employees at the mining sector, by nationality: Foreign
employees are defined as the employees who are working in the mines in a country but are
citizens of another country. Number of foreign employees at the mining sector, by nationality
can be measured as the average daily foreign workers employed for all categories directly in
132.8
96.189.5
99.2
72.9
24.728.4
15.8
44.2
61.6
108.2
67.7
73.7
55.0
11.3
0.0
20.0
40.0
60.0
80.0
100.0
120.0
140.0
2010 2011 2012 2013 2014
immigration rate emigration rate internal net migration rate Linear (internal net migration rate)

76
the mines. It can be obtained through statutory returns/administrative records/surveys. For a
mine it can be computed as follows:
Average daily foreign workers employed=No. of man days worked by foreign employees ÷ total number of days mine worked
Aggregate of all such mines data would be the Number of foreign employees at the mining
sector for the country. This information can be obtained nationality wise.
1.3. Number of engineering and technical staffs required newly in coming 3 years, by
professions: This indicator intends to measure the no. of professionals required by the
mining industry in the short term future. It is the number of professional engineers and other
persons having skills in mining related activities likely to be employed in the mining industry
in the coming 3 years. This data can be collected through administrative records/surveys
B. Measuring the demographic characteristics of the mining labour:
1.4 Number employed by age: It is the number of persons of specified age group employed
in the mining sector. The age groups proposed are below 18, 18-30, 30-40, 40-50, 50-60 and
60 and above. The information can be obtained through surveys.
1.5 Number of employed by sex: It is the number of persons employed in the mining sector
by sex. The classifications proposed are Male, Female and Transgender. The information can
be obtained through surveys.
BOX 7.2: Impact of the mining boom on employment
We concerned the ages and gender groups of mining workers: 62.7 percent is male, 37.3
percent is female. And 93.4 percent of total workers are between 25-55 years old. And
majority of the workers are male around 30 years old.
Employed in the mining activities, population pyramid, 2015
Source: Survey on impact of mining sector to economic, social and environmental status of

77
Khanbogd soum, Omnogovi province, 2015
1.6. Number of employed by education: It is the number of persons employed in the mining
sector as per their level of education. The classifications proposed are illiterate, below class
X, diploma holder, under graduate, graduate and post graduate and above. It is also proposed
to obtain the information through surveys
BOX 7.3: Impact of the mining boom on employment, by level of education
By education level: 79.6 percent of the mining workers from Khanbogd soum have lower
than secondary education, which shows that they mostly engaged in auxiliary activities.
Employed in the mining activities by educational level, share to total
Source: Survey on impact of mining sector to economic, social and environmental status of
Khanbogd soum, Omnogovi province, 2015
1.7 Number of employed by occupation: It is the number of persons employed in the
mining sector as per their occupation. The classifications proposed are Miners and Loaders,
Foreman and Mining Mates, Geologists, Mining Engineers, Managers, Clerical and
Administrative Staff and Others. It is proposed to obtain the information through statutory
returns/ administrative records/ surveys.
1.8 Number of employed by marital status: It is the number of persons employed in the
mining sector as per their current marital status. The classifications proposed Unmarried,
Married, Widowed and Divorce/Separated. It is proposed to obtain the information through
surveys.
C. Mining related activities: The mining related activities can include other sectors of the
economy which are either supporting mining industry or using the mining products. Hence
manufacturing, construction, transport, storage, services and electricity and gas can be
considered as mining related activities. In these industries only those directly linked to

78
mining shall be considered as mining related activities. The indicators related to labour force
in these activities are
1.9 Number of employees, by classification of economic activities: It is the number of
persons employed in the mining related activities mentioned above. It can be obtained
through surveys.
1.10 Number of employees at the mining sector, by classification of occupations: It is the
number of persons employed in the mining related activities by occupation. This statistics can
also be obtained through surveys. For occupational classification the NOC 2011 can be used.
The broad occupational categories mentioned in NCO are:
0 Management occupations
1 Business, finance and administration occupations
2 Natural and applied sciences and related occupations
3 Health occupations Health occupations
4 Occupations in education, law and social, community and government services
5 Occupations in art, culture, recreation and sport
6 Sales and service occupations
7 Trades, transport and equipment operators and related occupations
8 Natural resources, agriculture and related production occupations
9 Occupations in manufacturing and utilities
D. Measuring of the impact of the supply of labour on other parts of the economy due to
changes in the demand for labour from the mining industry.
This can be measured by analysing the employment survey data covering all sectors of the
economy in areas where significant mining activities are carried out. The indicators suggested
for measuring this impact are given below.
1.11 Number of employees, by classification of economic activities: It is the number of
persons employed in the selected frame of area by various economic activities. The broad
classification of economic activities can be as given below:
a. Agriculture, forestry and fishing
b. Mining and quarrying
c. Manufacturing
d. Services
It can be obtained through surveys.
2. Income: Income in this context means the wages and salaries received by employees in
mining sector. Wage and salary consist of remuneration received in cash/cash equivalents for

79
the work performed during the reference period. It includes bonuses, allowances, overtimes
and payments towards leave period. The following indicators are proposed to measure the
income.
BOX 7.4: Impacts of the mining boom on household income
We concerned the sources of primary income of the households in Khanbogd soum: 30.2
percent of total households have mining activities, 24.8 percent livestock activities, 19.4
percent wages and salaries from the industries other than mining, 13.9 percent household
businesses, 8.7 percent pension and allowances and 3.1 percent others. It shows that mining
sector provides major percentage of household income.
Primary sources for household income, by baghs, 2015
Income source Share to total number of households
Total households 100.0
Livestock 24.8
Household businesses 13.9
Mining industry 30.2
Wages and salaries (other than mining sector) 19.4
Pensions, allowances 8.7
Others 3.1
Source: Survey on impact of mining sector to economic, social and environmental status of
Khanbogd soum, Omnogovi province, 2015
2.1 Total compensation of employees of the mining industry: It is the aggregate of
salary/wages received by all the employees of the mining sector. It includes the wages and
salary paid to both contract and direct employees. It can be obtained through statutory
returns/administrative records/surveys.
2.1.1 Monthly average wages and salaries of employees of the mining industry, by
domestic employees: It is the total compensation received by domestic employees during
the month x total number of days mine worked in the month. Domestic employees mean
those who are a citizen of the country of their work.

80
BOX 7.5: Impacts of the mining boom on household income
Monthly average wage and salaries of workers in mining industry
Average wages and salaries of the workers in Khanbogd soum: 881.7 thousand MNT in
mining sector and 547.0 thousand MNT in sectors other than mining. The average wages
and salaries of the workers in industries other than the mining is lower by 247-406 thousand
MNT than in mining industry in all baghs.
Source: Survey on impact of mining sector to economic, social and environmental status of
Khanbogd soum, Omnogovi province in Mongolia, 2015
2.1.2 Monthly average wages and salaries of employees of the mining industry, by
foreign employees: It is the total compensation received by foreign employees during the
month x total number of days mine worked in the month. Foreign employees are defined as
the employees who are working in the mines in a country but are citizens of another country.
2.2. Real wage index of the employees of the mining industry: Real wage index is nominal
wage index corrected for changes in purchasing power measured by the consumer price
index. It is proportion of nominal wage index and consumer price index of corresponding
year. A nominal wage index is proportion of nominal wage of current period and nominal
wage of base period as expressed as a percentage. In other words it is the total current wages
for the reference period x (total wages for the base period x consumer price index for the reference
period). It can be obtained through statutory returns/administrative records/surveys.
2.3 Monthly average wages and salaries of employees of the mining industry, by sex: It it
the total compensation received during the month by employees by sex x total number of
employees by sex. The classifications proposed are male, female and transgender. The
information can be obtained through administrative records/surveys.
2.4 Monthly average wages and salaries of employees of the mining industry, by
occupations: It is the Total compensation received during the month by employees by
occupation x Total number of employees by occupation. The classifications proposed are
miners and loaders, foreman and mining mates, geologists, mining engineers, managers,
clerical and administrative staff and others. It is proposed to obtain the information through
statutory returns/ administrative records/surveys.

81
CHAPTER 8. MEASURING THE
IMPACT OF THE MINING
INDUSTRY ON THE ENVIRONMENT
8.1. Introduction
The extractive nature of mining operations creates a variety of impacts on the environment
before, during and after mining operations. The extent and nature of the impacts can range
from minimal to significant depending on a range of factors associated with each mine. These
factors include: the characteristic of the ore body; the type of technology and extraction
methods used in mining and the on-site processing of minerals; and the sensitivity of the local
environment. The environmental impacts of mining, although significant, are generally
confined to local areas. Apart from direct physical impacts of extractive activities,
contamination of air, land and water may also result. However, mining in isolation may not
be the main land use that upsets ecological systems, as environmental effects are cumulative
in nature and other past activities or events may have contributed to these effects.
The impact of the mining industry on the environment has been a concern for many years.
Governments and businesses have responded with a number of initiatives and regulations to
protect and manage the environmental effects of mining activities. To do this effectively,
governments need relevant statistics that measure the impact of mining on the environment.
There has been much literature on the impact of mining on the environment, but minimal
work that systematically measures this impact and the changes over time. The System of
Environment and Economic Accounts provides the basic framework to address this
shortcoming. This handbook provides guidance and methodologies for National Statistical
Offices (NSOs) to develop appropriate statistics and standards to address this.
This chapter discusses the main environmental impacts of mineral mining, such as wastes and
the rate of resource use. The chapter also links these impacts to the statistics required for
measurement.
Many NSOs currently produce a raft of environmental statistics including a suite of
environmental accounts [DN reference]. However, they may not necessarily address the
impact of mining. This handbook draws upon some of these indicators and provides practical
guidelines for NSOs to establish appropriate data sets to measure this impact.
Much of this chapter draws upon the System of Environmental-Economic Accounting 2012: Central Framework (SEEA2012). The SEEA2012 provides the underlying accounts
framework to measure the impact of mining on the environment. Another source of material
is the Framework for the Development of Environment Statistics (FDES) 2013. FDES is a
useful guide to the indicators that might be used in measuring mining’s impact.

82
8.2. Residuals
Some of the significant direct impacts of mining predominantly occur via the residuals
‘produced’ by the industry. The SEEA2012 defines residuals to be the “flows of solid, liquid
and gaseous materials, and energy that are discarded, discharged or emitted by establishments
and households through processes of production, consumption or accumulation” (SEEA 2012
p.49). Residuals can be grouped depending on analytical need, the physical nature or purpose
of the flow. (SEEA 2012 p. 51). The most widely accepted groupings that relate directly to
mining are solid waste, wastewater, emissions, and natural resource residuals. The SEEA
2012 has not defined a single classification of residuals as the various groups overlap.
8.3. Selected mining activities and their impact
8.3.1. Mineral exploration
The impact of mineral exploration will depend on the scale of exploration and what
equipment is used in the exploration phase. Initial exploration may involve the use of
satellites and aerial photography, with the latter impacting through noise and proximity to
wildlife areas when conducted at a low altitude. Activities at ground level often require the
use of bore holes, excavation pits and transect lines. The use of support equipment also leaves
an impact on the environment. Exploration vehicles require access tracks, and even helipads,
if left unrehabilitated, can have medium to long-term effects.
Main indicators
There are very few direct indicators that measure the impact of mineral exploration. Land and
eco-system accounts are potential measurement tools to provide estimates of the impact of
exploration. However, given the short term nature of this activity (compared to a mine in
operation) any impact may be difficult to capture. While an accounts based process could be
linked with rehabilitation expenditure and environmental management, the impact of
exploration may not be significant compared with broader mining operations.
One alternative could be to use mineral and petroleum exploration expenditure, as a measure
of overall activity. If this data were available by region then the impacts on the environment
might be identifiable. It is worth noting that exploration expenditure is capitalised in the
System of National Accounts and contributes to Gross Domestic Product.
8.3.2. Mining operation
Environmental impacts may also occur through mine establishment, ore extraction, mineral
concentration and associated transport and infrastructure.
Inherent to mining and mineral processing operations is the generation of waste. These are
mostly in the form of waste rocks, including surface waste rocks, rocks between ore bodies or
layers and other unwanted material. This form of waste contains low or nil concentrations of
the material desired and is often relatively toxic. Normally, waste rocks are stockpiled or

83
dumped adjacent to or near the excavation area, to be used later as backfill during
reclamation.
Mineral processing produces wastes in grain sizes of fine sand, silt and clay fractions.
Referred to as mine tailings, this type of waste contains significant concentrations of minerals
that are not amenable to recovery at the time of initial mining. Tailings are usually disposed
of in specially lined tailings dams, which are normally capped and revegetated to prevent the
release of environmentally harmful materials. Other wastes from mining may be in the form
of water and air pollution. The majority of air emissions associated with the mining industry
includes dust, oxides of nitrogen, sulphur dioxide and carbon monoxide. Some of these come
from mining vehicles and on-site plant machinery. Water quality may be affected by:
• Acid mine drainage - when large quantities of excavated rock containing sulphide minerals
interact with water and oxygen to create sulphuric acid.
• Heavy metal contamination and leaching - heavy metals occur naturally in many ores, and are
often released in the mineral extraction process. Metals (i.e. arsenic, cobalt, copper, cadmium,
lead, silver and zinc) contained in an excavated or exposed rock may be leached out and
carried downstream by flowing water.
• Processing chemical pollution - spilling, leaking or leaching of chemical agents (i.e. cyanide,
sulphuric acid) from the minesite into nearby water bodies.
• Erosion and sedimentation - erosion of cleared land surface and dumped waste material
resulting in sediment loadings into the adjacent water bodies, particularly during rainfall.
Environmental impacts resulting from mining are not limited to current mining operations.
Mining residues and scars at old mining sites may also impact on local environments. The
legacy of abandoned, unrehabilitated minesites has required comprehensive remediation
efforts paid for with taxpayers’ funds.
With the increasing extraction of unconventional gas resources, such as coal seam gas and
shale gas there have been growing concerns over the environmental impact. The
environmental impacts from these forms of extraction are not fully understood. Besides
competing concerns of water and land usage, there are concerns over damage to both surface
and underground water supplies. While indicators could be used, there needs to be accurate
high quality data for decision makers. The accurate measurement of residuals is an important
part of this process.
Main indicators
There are numerous indicators to consider for mine operations, with the measurement of
residuals and the use of environmental inputs being the most significant. The indicators
should cover all the groups of residuals, providing as much detail as possible.
Other indicators to consider are environmental ratios, such as air emissions per unit of value
added. SEEA 2012 provides the following ratios:
• Productivity and intensity indicators

84
• Decoupling indicators
• Polluter pay indicators
Environment protection expenditure on rehabilitation and residuals should also be captured.
Having this data will enable NSOs to produce both monetary and physical accounts in these
areas. Coupling these with other accounts, such as water, land and eco-systems will provide
rich detail for analysing the impact of mining on the environment. Building upon this,
indicators on environment management activity by mining businesses can be developed
capturing not only expenditure, but whether businesses have environment management plans,
environmental protection income, or eco-efficiency savings.
8.3.3. Rate of mineral resource use
Minerals, oil and gas are finite and non-renewable. Their consumption today poses a threat of
scarcity to future generations. For the mining industry to be sustainable it would need to
maintain a rate of resource use which is reasonable, that is, its consumption of resources does
not go beyond a level which can ensure the availability of resources for the future of the
industry and the people. This rate of resource use depends on a variety of factors including
the rate of use of existing known resources, the rate at which new resources are discovered,
and the rate of recycling of existing materials. If discoveries or recycling do not keep pace
with the rate of use, depletion will result.
Main indicators
The main indicator here is the rate of depletion. SEEA 2012 (p. 146) defines depletion “in
physical terms,[as] the decrease in the quantity of the stock of a natural resource over an
accounting period that is due to the extraction of the natural resource by economic units
occurring at a level greater than that of regeneration.” SEEA then states that for non-
renewable resources “depletion is equal to the quantity of resource extracted.” The reasoning
behind this is that the regeneration of these resources is considerable in human time-scales.
The System of National Accounts (SNA) can provide a balance sheet approach to measuring
changes in the stock of assets, however, it incorporates increases via discoveries that need to
be separated out. Developing asset accounts for subsoil assets in conjunction with the SNA
balance sheet approach will provide greater detail analysis. For more detail on these
approaches see the 2008 SNA and SEEA 2012.
8.3.4. Use of energy and water by the mining industry
The mining industry is not a major user of energy compared to other industries, like
manufacturing and electricity. The mining industry is not a high user of water, although most
water consumed is sourced from the environment.
Main indicators
The main indicators to measure energy and water use here relate to intensity indicators such
as the amount of energy per unit of value added. However, this may be difficult to measure as

85
many mining corporations will potentially produce their energy on own account or extract it
free from the environment in the case of water usage.
In this case an economy-wide set of water and energy accounts will enable analysis of the
supply and use of these products. By compiling these alongside the SNA supply and use
tables an integrated estimate of intermediate usage is formed between the environment and
the economy.
8.3.5. Environmental management
In order to mitigate the adverse impacts from mining activities mentioned above, the mining
industry and government undertake environmental management measures. These measures
are aimed at the prevention, reduction or elimination of pollution or any degradation of the
environment. They include waste management and protection of biodiversity, landscape, air
and climate. Protection mechanisms can be backed legislation from the government.
Environmental management involves the use of mechanisms in the development, operation
and subsequent rehabilitation of mine sites. These mechanisms can be supported by
regulation and legislation. In some countries the mining industry has introduced its own code
for self-regulation.
Main indicators
The main indicators are the same as those above on environmental management activity and
protection expenditure.
8.3.6. Rehabilitation
The amount of 'rehabilitation' to an area disturbed by mining can range from restoration,
where an area is brought to as near as possible to pre-mining condition, to re-contouring and
revegetating to a state that is non-polluting and compatible with environmental regeneration
and community expectations (Hancock 1993). Re-contouring can involve construction of pit
walls and waste dumps, covering of reactive materials, dismantling of buildings/plant,
revegetation, and ongoing environmental quality monitoring.
Main indicators
The main indicator here is the amount of expenditure spent on rehabilitation. Another useful
indicator is the proportion of businesses who undertake rehabilitation activity. However, the
appropriate use of standards is required in reporting rehabilitation activity to be of any
analytical benefit.
The development of eco-system accounts would be of great benefit, especially if they are
timely. Then assessments pre- and post-mine operations of the impact of the mine and
rehabilitation can occur.

86
8.3.7. Oil and gas disasters
The environmental impact from an oil or gas disaster is discussed separately due to the scale
of the impact. While the disasters can potentially be captured from the measurement of
residuals, it is also the immediacy of the occurrence rather than at a constant rate over time
that needs consideration. Monetary measures such as disaster recovery expenditure and
government fines are available as indicators over the short term. However, without developed
eco-system account it may prove difficult to measure the longer term impact from the damage
to the environment.
BOX 8.1 : Environmental Statistics in Kazakhstan
Kazakhstan produces a suite of statistics on the environment across a number of agencies, that
measure:
• Hazardous waste,
• Environmental protection and sustainable development,
• Emissions of greenhouse gases by sector,
• Air pollution index (API) of 19 cities in Kazakhstan.
• Report on the costs of environmental protection, which includes the following indicators:
o Costs by type of economic activity,
o Fee for regulatory emissions (discharges) of pollutants by type of economic activity,
o Fee for excess emissions (discharges) of pollutants by type of economic activity
o Funds (lawsuits, fines) recovered for damages by type of economic activity,
o Fee for the use of natural resources by type of economic activity,
o Special payments of subsurface users by type of economic activity.
8.4. Environmental accounts and the mining industry
The SEEA 2012 recommends developing a suite of environmental accounts. The
development of set of accounts would be valuable, although the level of detail for a country
will be a determining factor in the usefulness of measuring the impact of mining on the
environment. Hence, industry detail is priority, and if this is not available, then a satellite
account approach may be more viable.
That is, environmental accounts could be developed in such a way to focus on the mining
industry and its supply and use framework for energy, land, water, environmental protection
expenditure, and other asset accounts.
The other important aspect of environmental accounts relates to their frequency. The SEEA
2012 recommends annual tables for its accounts, which is a similar practice for the supply
and use tables in the SNA.

87
8.5. Data collection
Environmental statistics can be compiled from a variety of sources, including surveys,
administrative data and satellite imagery. The important aspect for this handbook is to link
these data sources with mining activity. While much of this linking could be down via
analytical data sets such as environmental accounts, it is business surveys where
environmental questions are asked that can also be a valuable instrument for data collection.
The FDES outlines succinctly the sources of environment statistics, and includes the
following:
• Statistical surveys (e.g., censuses or sample surveys of population, housing, agriculture,
enterprises, households, employment, and different aspects of environment management);
• Administrative records of government and non-government agencies in charge of natural
resources as well as other ministries and authorities;
• Remote sensing and thematic mapping (e.g., satellite imaging and mapping of land use and
land cover, water bodies or forest cover);
• Monitoring systems (e.g., field-monitoring stations for water quality, air pollution or climate);
• Scientific research;
• Special projects undertaken to fulfil domestic or international demand.
FDES2013 provides a detailed discussion on these data sources on pages 25 to 32.

88
CHAPTER 9. PRIORITY
STATISTICS FOR ECONOMIES
BASED ON NATURAL RESOURCES
This chapter highlights those indicators that NSOs should prioritise for users. This is based
on discussion among the Steering Committee from consultation with key policy and decision
makers. In part this follows on from discussion in previous chapters and is essentially a
summary. For more details see the chapter on standard indicators.
Mining
• Total production of mining products, by value and quantity
• Share of value added of the mining industry to GDP
• Total exports and imports
• Total exports and imports of the mining products
• Export and import prices of mining products and economy-wide aggregates
• Terms of trade index (ratio of export price index to import price index)
• Intermediate consumption of the mining industry
• Total income of the mining industry, including gross operating surplus.
• Mining inventories, by value and quantity.
• Measurement of mining fixed capital investment
• Measurement of financial investment (including foreign investment, both direct and
portfolio)
• Measurement of the impact of mining on government finances, including measuring
of taxes on mining
• Labor productivity of mining industry
• Measurement of mining impact on national income, including balance of payments
incomes associated with mining and measures of real gross domestic income and real
net national disposable income
• Number of multinational enterprises in the mining industry
• Number of mining companies with FDI, percentage of FDI
• Main indicators for artisanal mining (total output, intermediate consumption, value
added, taxes paid)
Society
• Number of mining industry employees
• Number of foreign employees in the mining industry,
• Number of engineering and technical employees
• Total compensation of mining employees
• Number of mining related deaths
• Number of accidents at mining operations

89
• Number of internal migrants, by region
• Number of international migrants, by region
• Household income and expenditure, by region
• Population, by sex, age group and region
• Number of households, by region
Environment
• Measurement of environmental inputs into mining, both market and non-market,
incorporating measurement in terms of value.
• Measurement of residuals from mining
• Measurement of damage to land (including agricultural land) and ecosystems from
mining activity and any subsequent rectification activity
• Asset accounts for natural resource, by resource types
• Depletion of natural resources, by resource types
• Cost of environmental protection
• Natural resource management
Priorities for NSOs will ultimately depend on the resources available to them. The priorities
listed in this chapter are guidelines for where they might direct those resources.

90
CHAPTER 10. REMAINING ISSUES
Some of the issues that the manual is yet to consider are:
• Difficult conceptual areas,
• Difficult measurement issues, especially in relation to measuring the impacts from
mining on society and the environment,
• Whether to expand the scope to other areas where natural resources are intertwined
such as Agriculture, Tourism, Forestry and Fishing, and
• Implementation issues.
A dissemination strategy is potentially required although most NSOs are publishing these
statistics in other frameworks, such as the national accounts and the environmental accounts.
The issue to be determined is whether agencies would be willing to invest in compendiums
that bring the disparate suite of statistics together or leave the status quo with data available
in a range of publications. With most statistics available online, the cost of producing them is
greatly reduced, especially if they are published elsewhere. Broad themes of mining statistics
could be produced to cover the topics under consideration or provide links to other data
publications.
An important aspect of this work will be the analytical commentary that places the data in
context. This will enable users to understand and assess the impact of mining. On this basis
NSOs must be acutely aware of what the user needs are, and whether their focus is on the
economy, society or the environment.
At this stage the manual is not addressing green growth and green jobs, leaving this to other
groups, such as the London Group to progress.
Finally the manual has not explicitly considered the Sustainable Development Goals,
although the recommendations and guidelines in this handbook should not be inconsistent
with these.
[Draft Note: At this stage of drafting the handbook manual there has been minimal
discussion regarding remaining issues.]

91
References
[1] United Nations 2014 Fundamental Principles of Official Statistics, Resolution adopted by the
General Assembly on 29 January 2014.
[2] United Nations 2014, City Groups, Last accessed 18 February 2015
http://unstats.un.org/unsd/methods/citygroup/index.htm
[3] United Nations Department of Economic and Social Affairs (UNDESA), Statistics Division.
(2012) International Recommendations for Water Statistics,
http://www.zaragoza.es/ciudad/medioambiente/onu/en/detallePer_Onu?id=465
[4] United Nations. Statistical Office (2009), International recommendations for Industrial Statistics
(IRIS 2008), (Statistical Papers, Series M, No. 90)
[5] SDMX, (2009) SDMX CONTENT-ORIENTED GUIDELINES: Annex 4: METADATA
COMMON VOCABULARY,http://sdmx.org/wp-
content/uploads/2009/01/04_sdmx_cog_annex_4_mcv_2009.pdf
[6] La minería en México 2013 y 2014
http://www3.inegi.org.mx/sistemas/mapa/denue/default.aspx
[7] System of National Accounts
[8] System of Environmental-Economic Accounting 2012: Central Framework
[9] Hancock P 1993, Green and Gold: Sustaining mineral wealth, Australians and their environment, Centre for Resource and Environmental Studies.
[10] Australian Bureau of Statistics, 2003 Year Book Australia, 2003 Mining and the environment
feature article, (cat no 1301.0)
[12] Framework for the Development of Environment Statistics 2013
[13]http://www.abs.gov.au/ausstats/[email protected]/90a12181d877a6a6ca2568b5007b861c/ce28d7fbe5faa3
08ca256cae0015da32!OpenDocument.

92
Annex 1.
THE STATISTICAL INDICATORS TO MEASURE THE CONTRIBUTION OF THE
MINING INDUSTRY TO THE ECONOMY
Measurement
issues №
Appropriate
indicators
Priority
(high-1;
medium-2;
low-3)
Definition of indicator Calculation method
1. Measurement of
mining production
in terms of quantity
and value
1 Total production of
mining products, by
value
1 The value of production corresponds to the sum of the values
of all goods and services that are actually produced within an
establishment during the reference period, and become
available for use outside that establishment, plus any products
produced for own final use.
Source: (International Recommendations for Industry
statistics 2008, 4.186)
The value of production at basic prices is calculated as follows:
Gross output = Value of shipments/turnover/sales of goods or
services produced by the establishment + Value of
sale/turnover/shipments of all goods and services purchased for
resale in the same condition as received - Purchases of goods
and services for resale in the same condition as received +
Receipts for industrial work done or industrial services rendered
to others + Other revenues + Value of own-account fixed assets
+ Change in work-in-progress + Change in inventories of
finished goods + Change in inventories of goods purchased for
resale in the same condition as received. Source: (International
Recommendations for Industry Statistics 2008, 4.186).
2 Total production of
mining products, by
quantity and by
commodity and
level of processing
and contents
1 The production is understood to be a physical process, carried
out under the responsibility, control and management of an
institutional unit, in which labour and assets are used to
transform inputs of goods and services into outputs of other
goods and services.
Source: (SNA-2008, 1.40)
All products produced as outputs must be such that they can be
sold on markets or at least be capable of being provided by one
unit to another, with or without charge. The SNA includes
within the production boundary all production actually destined
for the market, whether for sale or barter.
2. Measurement of
prices of mineral
commodities and
the impact of
mineral prices on
the terms of trade,
as well as mining-
induced terms of
3 Export and import
unit price of mining
products
1 The export and import unit price of mining products tells the
price for per unit, such as per kilogram, per ton, etc., of what
homogenous mining products to exported and imported. It
expresses you the cost per measurement unit of a mining
product.
The export and import unit price in particular group of mining
products is the total value of mining products divided by total
volume of the products.
4 Export and import
price index of
2 An export price index (XPI) measures the rate of change in
the prices of mining products sold by residents of that
country to, and used by, foreign buyers. An import price
The two most commonly used index formulae are the Laspeyres
and Paasche indices. The Laspeyres price index can be defined
as the change in value of a basket of products whose

93
Measurement
issues №
Appropriate
indicators
Priority
(high-1;
medium-2;
low-3)
Definition of indicator Calculation method
trade impacts on the
rest of the economy
mining products index (MPI) measures the rate of change in the prices of
mining products purchased by residents of that country from,
and supplied by, foreign sellers.
Source: (Export and Import Price Index Manual 2009, IMF,
Page: xiii).
composition is kept fixed as it was in the reference period 0.
The Paasche index differs from the Laspeyres index in two
respects. It uses a harmonic mean instead of an arithmetic
average and the fixed period volumes or prices are those of the
current period t.
Source: (SNA-2008, 15.17, 15.18). The modified Laspeyres
price index is used to estimate foreign trade index.
5 Overall export and
import price index
2 The higher-level indices up to and including the overall
XMPIs are often calculated as young indices: that is, as
weighted averages of the elementary price indices using
weights derived from traded value shares in some earlier
weight reference period.
Source: (Export and Import Price Index Manual 2009, IMF,
1.309).
The required weight in calculation process is computed for
share of each mining product, which was in base year total in
export and import and define basket of foreign trade mining
products. The exported and imported total value (cost) of
mining products equals with quantity is multiplying by its unit
price. The modified Laspeyres price index is used to estimate
foreign trade index.
Vnt = Pnt * Qnt
Vnt – value (cost)
n – product type
t – current period
Pnt – price of product type n in current period
Qnt – quantity of product type n in current period
To compute price indexes for overall and group according to
share of each mining commodities in the total exports and
imports as considered as index weight. Share of each
commodity in total export and import is calculated on
comparison between value of each commodity and value of
export and import in base year.

94
Measurement issues
№ Appropriate indicators
Priority
(high-1;
medium-2;
low-3)
Definition of indicator Calculation method
6 Terms of trade
index (ratio of
export price index
to import price
index)
2 The indicator is obtained by dividing an export unit value
index by corresponding import unit value index. To estimate
terms of trade index which shows foreign trade character
based on comparison between export prices overall index and
import price overall index.
A terms of trade index is calculated for a country as the ratio of
its XPI to its MPI—a simple enough calculation.
Source: (Export and Import Price Index Manual 2009, IMF,
1.322).
3. Measurement of
intermediate
consumption in the
mining industry,
including energy
inputs
7 Intermediate
consumption of the
mining industry
1 Intermediate consumption consists of the value of the goods
and services consumed as inputs by a process of mining
production, excluding fixed assets whose consumption is
recorded as consumption of fixed capital. Of which, the cost
of energy consists of value of the electricity and thermal
energy consumed in the production process.
Source: (SNA-2008, 6.213)
It must be measured at purchasers’ prices, i.e. the prices the
purchaser actually pays for it. It also, can be calculate as sum of
the value for goods and services consumed for production
process of mining products. It does not include expenditures by
mining enterprises on valuables consisting of works of art,
precious metals and stones and articles of jewellery fashioned
out of them. It also does not include costs incurred by the
gradual using up of fixed assets owned by the mining enterprise.
However, intermediate consumption does include the rentals
paid on the use of fixed assets, whether equipment or buildings,
that are leased from other institutional units under an operating
lease, and also fees, commissions, royalties, etc., payable under
licensing arrangements.
The intermediate consumption not including labor costs, capital
costs and taxes on the production itself such as license fees, etc.
8 Cost of energy in
the mining industry
3 Cost of the electricity in mining industry covers the total
energy used for production activity of the mining industry at
the particular period. It includes the purchased, generated,
and sold electricity.
Source: (International Recommendation on Industry
Statistics-2008)
Sum of the value of electricity consumed for all production
activity.
9 Consumption of the
water in mining
industry, by volume
3 Consumption of the water in mining industry covers the
volume of water used for production activity of the industry
at the particular period. It could not cover the drinking water.
Sum of the volume of water consumed for all production
activity.

95
Measurement issues
№ Appropriate indicators
Priority
(high-1;
medium-2;
low-3)
Definition of indicator Calculation method
10 Share of the
consumption of
water, surface water
and ground water in
mining industry to
total consumption
of water
3 Consumption of the water covers the volume of water used
for production activity of the mining industry at the particular
period. It could not cover the drinking water.
Surface water includes water in artificial reservoirs, lakes,
rivers and streams, snow, ice and glaciers.
Source: (FDES-2013, 3.131)
Ground water comprises water that collects in porous layers
of underground formations known as aquifers.
Source: (SEEA-CF, 5.481)
Sum of the volume of water consumed for all production
activity.
11 Share of the
consumption of
reused water to
total consumption
of water in mining
industry
3 Reused water is wastewater supplied to a user for further use
with or without prior treatment, excluding the reuse (or
recycling) of water within mining industry.
Source: (SEEA-CF, 3.207)
Share of the consumption of reused water to total consumption
of water in mining industry is volume of reused water divided
by total consumption of water in mining industry.
12 Consumption of
fuel in mining
industry, by volume
3 Consumption of the fuel in mining industry covers the
volume of fuel used for production activity of the industry at
the particular period.
Sum of the volume of fuel consumed for all production activity.
13 Cost of the
management or
consultant service
in mining industry
with foreign
investment
3 Cost of the management or consultant service refers to all
expenses in relation to management or consultant service in
mining industry with foreign investment.
Total cost of management or consultant service basis cost of
management and management or consultant service.
14 Consumption of
chemical products
in the mining
industry, by types
of chemical product
3 Consumption of the chemical products in mining industry
covers the volume of chemical products used for production
activity of the industry at the particular period.
Sum of the volume of chemical products consumed for all
production activity in particular type.

96
Measurement issues
№ Appropriate indicators
Priority
(high-1;
medium-2;
low-3)
Definition of indicator Calculation method
4. Measurement of
mining gross
operating surplus
15 Total income of the
mining industry
1 Mining gross operating surplus is the difference between total
income and expenditure or income before tax of the mining
activity at the current period.
16 Total expenditure
of the mining
industry
1
5. Measurement of
mining inventories
17 Inventories 2 Inventories are produced assets that consist of goods and
services, which came into existence in the current period or in
an earlier period, and that are held for sale, use in production
or other use at a later date.
Materials and supplies consist of all products that an
enterprise holds in inventory with the intention of using them
as intermediate inputs into production.
Source: (SNA 2008, 10.131).
Work-in-progress consists of output produced by an
enterprise that is not yet sufficiently processed to be in a state
in which it is normally supplied to other institutional units.
Source: (SNA 2008, 10.134).
Finished goods consist of goods produced as outputs that
their producer does not intend to process further before
supplying them to other institutional units.
Source: (SNA 2008, 10.141).
Goods for resale are goods acquired by enterprises, such as
wholesalers or retailers, for the purpose of reselling them to
their customers.
Source: (SNA 2008, 10.145).
The information on inventories is required principally to
measure the value of changes in inventories. Changes in
inventories consist in the difference (positive or negative)
between the value of inventories at the end and their value at the
beginning of the reference period. They may also be measured
by the value of entries into inventories less the value of
withdrawals and of any recurrent losses of goods held in
inventories.
Source: (International Recommendations for Industry Statistics
2008, 4.167).

97
Measurement issues
№ Appropriate indicators
Priority
(high-1;
medium-2;
low-3)
Definition of indicator Calculation method
6. Measurement of
mining fixed capital
investment
18 Fixed assets, by
type
2 Fixed assets are tangible or intangible assets used repeatedly
or continuously in processes of production for more than one
year as follows.
Dwellings are buildings, or designated parts of buildings, that
are used entirely or primarily as residences, including any
associated structures, such as garages, and all permanent
fixtures customarily installed in residences. Houseboats,
barges, mobile homes and caravans used as principal
residences of households are also included, as are public
monuments identified primarily as dwellings.
Source: (SNA 2008, 10.68).
Other buildings and structures comprise non-residential
buildings, other structures and land improvements.
Source: (SNA 2008, 10.73).
Machinery and equipment covers transport equipment,
machinery for information, communication and
telecommunications (ICT) equipment, and other machinery
and equipment. Source: (SNA 2008, 10.82).
Gross fixed capital formation is measured by the total value of a
producer’s acquisitions, less disposals, of fixed assets during the
accounting period plus certain specified expenditure on services
that adds to the value of nonproduced assets. Source: (SNA
2008, 10.32). The
data item includes the value of all durable goods expected to
have a productive life of more than one year and intended for
use in the production process by the establishment (land,
buildings, machinery, equipment and vehicles). Source:
(International Recommendations for Industry Statistics 2008,
4.200).
Fixed assets acquired from others should be valued at
purchasers’ prices, which should cover all costs directly
connected with the acquisition and installation of the items for
use. These costs of ownership transfer comprise the cost of
purchase of the fixed assets on the market including taxes and
fees paid to government, transport, delivery and installation
charges, direct preliminary outlays, for example, for site
clearance and the fees of architects, designers and engineers,
and all legal costs. Indirect outlays for purposes of financing the
acquisition of the fixed assets, for example, flotation costs in
respect of security issues such as underwriters’ commissions
and registration charges, service charges in respect of loans, and
expenses of special advertising campaigns are excluded. Such
expenses are treated as intermediate consumption. For countries
using the value added tax system, the deductible value added
tax should be excluded. Source: (International
Recommendations for Industry Statistics 2008, 4.202).
Fixed assets acquired through barter are valued at their
estimated basic prices plus any taxes payable and costs of

98
Measurement issues
№ Appropriate indicators
Priority
(high-1;
medium-2;
low-3)
Definition of indicator Calculation method
ownership transfer. In principle, fixed assets produced on own
account should also be valued in this manner. However, as this
may be impracticable, particularly in the case of the
construction of structures and other works and alterations, it
may frequently be necessary to resort to valuing such own-
account assets production at explicit cost, including any
imputations that may be required in respect of the employed
own-account labour. Source: (International Recommendations
for Industry Statistics 2008, 4.203).
Fixed assets produced by one establishment of a multi-
establishment enterprise for the use of another establishment of
the same enterprise should be valued
by the receiving establishment as though purchased from
outside the enterprise. Source: (International
Recommendations for Industry Statistics 2008, 4.204).
Disposal of fixed assets should be valued at the actual amounts
realized rather than at book values. It should be noted that only
disposal should be deducted, and not decreases in inventories of
fixed assets owing to other causes. Source:
(International Recommendations for Industry Statistics 2008,
4.205).
19 Military weapons 3 Weapons systems include vehicles and other equipment such
as warships, submarines, military aircraft, tanks, missile
carriers and launchers, etc.
Source: (SNA 2008, 10.87).

99
Measurement issues
№ Appropriate indicators
Priority
(high-1;
medium-2;
low-3)
Definition of indicator Calculation method
20 Cultivated
biological resources
3 Cultivated biological resources cover animal resources
yielding repeat products and tree, crop and plant resources
yielding repeat products whose natural growth and
regeneration is under the direct control, responsibility and
management of an institutional unit.
Source: (SNA 2008, 10.88).
21 Costs of ownership
transfer on non-
produced assets
3 Purchasing a fixed asset is often a complicated procedure that
may involve using lawyers to establish legal title to the asset,
engineers to certify that it is in satisfactory working order and
so on. There may also be taxes to be paid occasioned by the
change of ownership of the item. Further, in the case of
highly complex machinery there may
be significant costs associated with delivery and installation
that were not included in the purchase price.
Source: (SNA 2008, 10.48).
22 Research and
development
3 Research and development consists of the value of
expenditures on creative work undertaken on a systematic
basis in order to increase the stock of knowledge, including
knowledge of man, culture and society, and use of this stock
of knowledge to devise new applications. This does not
extend to including human capital as assets within the SNA.
Source: (SNA 2008, 10.103).
Research and experimental development (R&D) on own
account consists of the value of expenditures on creative work
undertaken on a systematic basis in order to devise new
applications. By convention, output of own-account R&D
production by enterprises is valued at the sum of costs,
including the cost of unsuccessful R&D. Source:
(International Recommendations for Industry Statistics 2008,
4.220). The sum-of-costs
approach for R&D undertaken on own account by enterprises is
illustrated by the following identity:
Output of own-account R&D = material and service costs
(intermediate consumption)
+ Compensation of employees paid to R&D personnel
+ Other taxes less subsidies on production

100
Measurement issues
№ Appropriate indicators
Priority
(high-1;
medium-2;
low-3)
Definition of indicator Calculation method
+ Depreciation of capital goods used in R&D
+ a net return to fixed capital
Source: (International Recommendations for Industry Statistics
2008, 4.221).
23 Mineral exploration
and evaluation
3 Mineral exploration and evaluation consists of the value of
expenditures on exploration for petroleum and natural gas
and for non-petroleum deposits and subsequent evaluation of
the discoveries made.
Source: (SNA 2008, 10.106).
24 Computer software
and databases
3 Computer software consists of computer programs, program
descriptions and supporting materials for both systems and
applications software. Databases consist of files of data
organized in such a way as to permit resource-effective
access and use of the data.
Source: (SNA 2008, 10.110, 112).
The formula used to calculate output is similar to that for R&D.
Source: (International Recommendations for Industry Statistics
2008, 4.224). The creation of a database will
generally have to be estimated by a sum-of-costs approach.
Source: (International Recommendations for Industry Statistics
2008, 4.225).
25 Entertainment,
literary or artistic
originals
3 Entertainment, literary and artistic originals consist of the
original films, sound recordings, manuscripts, tapes, models,
etc., on which drama performances, radio and television
programming, musical performances, sporting events, literary
and artistic output, etc., are recorded or embodied.
Source: (SNA 2008, 10.115).
Such works are frequently developed on own account which
may be estimated by a sum-of-costs approach.
Source: (International Recommendations for Industry Statistics
2008, 4.226).
26 Other intellectual
property products
3 Other intellectual property products include any such
products that constitute fixed assets but are not captured as
research and development, mineral exploration and
evaluation, computer software and databases or
entertainment, literary and artistic originals.
Source: (SNA 2008, 10.117).

101
Measurement issues
№ Appropriate indicators
Priority
(high-1;
medium-2;
low-3)
Definition of indicator Calculation method
7. Measurement of
financial investment
(including foreign
investment, both
direct and portfolio)
and associated
incomes, including
retained earnings
27 Financial
investment
2 The financial account records transactions that
involve financial assets and liabilities and that take place
between residents and nonresidents.
Source: Balance of Payments and International Investment
Position, chapter 8.
It may be of interest to show balances for components of the
financial account. For example, analysts may be interested in
net flows for each functional category—such as net direct
investment derived as net acquisition of direct investment assets
less net incurrence of direct investment liabilities.
28 Foreign direct
investment
2 Foreign direct investment (FDI) is defined as the
establishment of a lasting interest in and significant degree of
influence over the operations of an enterprise in one economy
by an investor in another economy.
Source: Measuring International Investment by Multinational
Enterprises, 4th edition, OECD, page 5, FDIStatistics,
International Monetary Fund, 2003 page 23, 152, 154.
There are three main components to FDI statistics: 1) financial
flows, which capture debt and equity investments between
related parties in a specific period; 2) income, which represents
the return on equity and debt investment to the direct investor in
a specific period; and 3) positions, which are the value of the
accumulated direct investment at a specific point in time—it is
also referred to as the stock of FDI.
29 Other investment 2 Other investment is a residual category that includes
positions and transactions other than those included in direct
investment, portfolio investment, financial derivatives and
employee stock options and reserve assets.
Source: SNA 2008 26.94, Balance of Payments and
International Investment Position Manual 6th edition 6.61
Other investment includes the remainder of the following
financial instruments:
a. other equity;
b. currency and deposits;
c. loans (including use of IMF credit and loans from the IMF);
d. non-life insurance technical reserves, life insurance and
annuities entitlements, pension entitlements and provisions for
calls under standardized guarantees;
e. trade credit and advances;
f. other accounts receivable/payable; and
g. SDR allocations (SDR holdings are included in reserve
assets).
30 Cash flow 2 Cash flow is the money that comes in and goes out of a
mining company. It is the generation of income and the
payment of expenses. Cash inflows result from either the
Free cash flow (FCF) measures how much cash you generate
after taking into account capital expenditures for such things

102
Measurement issues
№ Appropriate indicators
Priority
(high-1;
medium-2;
low-3)
Definition of indicator Calculation method
generation of revenue through the selling of goods and
services, money borrowed, or money earned through
investments.
Source: http://study.com/academy/lesson/what-is-cash-flow-
definition-calculation-example.html
buildings, equipment, and machinery. The formula is:
FCF = Operating Cash Flow - Capital Expenditures
Operating cash flow (OCF) is the measure of your company's
ability to generate positive cash flow from its core business
activities. Here's the formula:
OCF = Earnings before Interest and Taxes + Depreciation +
Amortization - Taxes
8. Measurement of
impact of mining on
trade statistics,
including coherency
with production
statistics
31 Total sales of the
domestic trade
sector
2 Sales revenue is the total amount of the sales and services in
the reporting time.
Source: UNSD, 2008, "International recommendation of
Internal Trade Statistics".
Trade sector entities shall be the sum of net sales.
32 Total sales of the
mining products at
the domestic
market, by types of
minerals
1 Amount of sales of mining products sold in the domestic
market, by type of minerals.
33 Total exports and
imports
1 Export: A function of international trade where by goods
produced in one country are shipped to another country for
future sale or trade.
Import: A goods or service brought into one country from
another.
Source: International Merchandise Trade Statistics, Concepts
and Definitions 2010.
Total export: including in the country's direct exports of goods
and re-export of foreign goods. Total import: including in the
direct import of foreign goods and re-import of the country's
goods
34 Total exports and
imports of the
mining products
1 Export: Mining products produced in one country are shipped
to another country for sale or trade.
Import: Mining product brought into one country from
another.
Total export and import of the mining products.

103
Measurement issues
№ Appropriate indicators
Priority
(high-1;
medium-2;
low-3)
Definition of indicator Calculation method
9. Measurement of
mineral exploration,
discoveries and sub-
soil reserves
35 Total output of
mineral
explorations, by
types of mineral, by
physical quantity
1
36 Number of
discoveries, by
mineral resources in
physical quantity
1
37 Soil resource, by
physical quantity
1
10. Measurement of
the impact of
mining on
government budget
including measuring
of taxes on mining
38 Corporation income
tax
1 Taxes on the income of corporations consist of corporate
income taxes, corporate profits taxes, corporate surtaxes, etc.
Source: Glossary of Statistical Terms of OECD page 776,
SNA 2008 8.58 b [OECD 1210].
Such taxes are usually assessed on the total incomes of
corporations from all sources and not simply profits generated
by production (GFSM2001, 1112; OECD, 1210)
39 Value added tax,
repayment of VAT
1 Value-added taxes (VAT) (11411) are taxes on goods or
services collected in stages by enterprises but that are
ultimately charged in full to the final purchasers.
Source: SNA 2008 7.89, 6.55-6.62, GFSM2001 11411.
40 Royalty 1 “Royalties” is the term often used to describe either the
regular payments made by the lessees of subsoil assets to the
owners of the assets (these payments are treated as rents in
the System of National Accounts (SNA)) or the payments
made by units using processes or producing products covered
by patents (these are treated as purchases of services
produced by the owners of the patents in the SNA).
Source: SNA 2008 7.110, 7.160
41 Fee for exploration
and mining special
1

104
Measurement issues
№ Appropriate indicators
Priority
(high-1;
medium-2;
low-3)
Definition of indicator Calculation method
permit of the
mineral resources
42 Other royalty 1
43 Cumulative royalty 2 A term that most commonly refers to a single company
having to pay patent license fees/royalties to numerous
companies in the same or a similar field.
Source: Technology and IP law Glossary
44 Exports duties 2 Export duties consist of general or specific taxes on goods or
services that become payable when the goods leave the
economic territory or when the services are delivered to non-
residents; profits of export monopolies and taxes resulting
from multiple exchange rates are excluded.
Source:OEDC-Glossary
https://stats.oecd.org/glossary/detail.asp?ID=910, Glossary of
Statistical Terms page 280.
The contributions to percent change in a real aggregate, such as
real GDP, provide a measure of the composition of growth in
the aggregate that is not affected by the nonadditivity of its
components. This property makes contributions to percent
change a valuable tool for economic analysis. The contribution
to percent change (C% ∆i,t ) in an aggregate in period t that is
attributable to the quantity change in component i is defined by
the formula aggregate.
45 Contributions and
donations to the
local government
and individuals
from the mining
enterprises
2 Employers’ social contributions are social contributions
payable by employers to social security funds or other
employment-related social insurance schemes to secure social
benefits for their employees.
Source: A Guide to the National Income and Product
Accounts of the United States Page 28, Balance of Payments
and International Investment Position Manual 6th edition
11.22
The contributions to percent change in a real aggregate, such as
real GDP, provide a measure of the composition of growth in
the aggregate that is not affected by the nonadditivity of its
components. This property makes contributions to percent
change a valuable tool for economic analysis. The contribution
to percent change (C% ∆i,t ) in an aggregate in period t that is
attributable to the quantity change in component i is defined by
the formula aggregate.
11. Measurement of
productivity in the
mining industry
46 Total productivity
of mining industry
1 Productivity expresses the relationship between the output of
goods and services (real
output) and the various inputs required for production.
Ratio between the output volume and the volume of inputs

105
Measurement issues
№ Appropriate indicators
Priority
(high-1;
medium-2;
low-3)
Definition of indicator Calculation method
Productivity is commonly defined as a ratio between the
output volume and the volume of inputs. In other
words, it measures how efficiently production inputs, such as
labour and capital, are being used in an economy to produce a
given level of output.
Source: Measuring Productivity, OECD manual, 2001, page
12,
http://statsmauritius.govmu.org/English/Documents/product.
pdf, http://www.oecd.org/std/productivity-stats/40526851.pdf
47 Total factor
productivity of
mining industry
1 A measure that takes account of the contributions of both
labour and capital to growth in output is multifactor
productivity (MFP), which is sometimes referred to as total
factor productivity (TFP). The advantage of using MFP as the
measure of productivity is that it includes effects not included
in the labour and capital inputs.
Source: SNA 2008- 16.64,
http://statsmauritius.govmu.org/English/Documents/product.
multifactor productivity index= output index/ multifactor input
index * 100
48 Labor productivity
of mining industry
1 Labour productivity is a revealing indicator of several
economic indicators as it offers a dynamic measure of
economic growth, competitiveness, and living standards
within an economy. It is the measure of labour productivity
(and all that this measure takes into account) which helps
explain the principal economic foundations that are necessary
for both economic growth and social development.
Source: Labour Productivity Indicators, OECD, 2008, page
from 5.
Labour productivity is equal to the ratio between a volume
measure of output (gross domestic product or gross value
added) and a measure of input use (the total number of hours
worked or total employment). Labour productivity = volume
measure of output / measure of input use
49 Fixed capital
productivity of
1 Measures of capital productivity, calculated by dividing the
volume of output by an index of capital services provided,
suffer from similar drawbacks since they do not capture the
The capital productivity index shows the rate of change in
output per unit of capital. Capital Productivity Index= Output

106
Measurement issues
№ Appropriate indicators
Priority
(high-1;
medium-2;
low-3)
Definition of indicator Calculation method
mining industry effects of the amount of labour employed and the efficiency
and composition of the capital inputs.
Source:SNA-200819.63,
http://statsmauritius.govmu.org/English/Documents/product.
index/ capital input index* 100
50 Main raw material
productivity of
mining industry
1 The indicators "energy productivity" and "raw material
productivity" are used for measurement purposes.
Source: Environment-Economic Accounting (EEA), Federal
Statistical Office German, Jan 2010, page from 2
Raw material productivity is derived from the ratio between
gross domestic product and abiotic material used.
51 Energy productivity
of mining industry
1 International Energy Agency, Key World Energy Statistics
2014 (Paris: IEA, 2014) defines energy productivity as the
volume of services or products that can be generated per unit
of energy. It is not the same as energy efficiency, which
measures the inverse, i.e., how much energy is needed to
produce a given level of output.
Source: A new approach to measuring the Energy
Productivity of an Economy, Chi Yuan Liang, Research
Fellow The Institute of Economics, Academia Sinia,
International Energy Agency, Key World Energy Statistics
2014 (Paris: IEA, 2014)
Energy Productivity, which is defined as the ratio of output
divided by energy consumption, is a useful indicator for
understanding the energy efficiency of an industry or an
economy. The GDP from the National Income Accounts/ The
Energy Consumption from the Energy Balance Table
12. Measurement of
construction activity
associated with the
mining industry
52 Construction,
capital repairs and
maintenances
associated with the
mining industry, by
type.
2 Construction work includes the activities of building of
houses, bridges, banks as engineering construction and
creating of fixed capital, expansion, repairs, restoration.
Residential building is a building should be regarded as
residential building when more than half of the floor area is
used for dwelling purposes.
Non residential building is a building is regarded as a non-
residential building when the minor part of the building (i.e.
less than half of its gross floor area) is used for dwelling
International Recommendations for Construction Statistics, UN,
1997 and Bulletin of Housing and Building Statistics for Europe
and North America, UNECE, Geneva, 2000

107
Measurement issues
№ Appropriate indicators
Priority
(high-1;
medium-2;
low-3)
Definition of indicator Calculation method
purposes.
Civil engineering construction includes all construction work
not classified under building construction, that is,
construction of railways, roads, bridges, highways, airports,
water and sewage, dams and irrigation, etc.
53 Capitalized repairs
and maintenances,
by type
2 Repairs and maintenance covers all construction work not
included under new construction. Such repairs may be broken
down into capital repairs and current repairs and
maintenance.
International Recommendations for Construction Statistics, UN,
1997
13. Measurement of
impact of mining on
transportation
54 Freight turnover of
the mining
products, by type
and mln.ton km
3 Freight turnover is estimated by multiplying the total
amount of the weight of transported cargo by the shipping
distance.
Railway: Unit of measurement of goods transport which
represents the transport of one tonne of goods over a distance
of one kilometre.
Source: Glossary for Transport Statistics (UNECE) AV-20
Road: Unit of measurement of goods transport which
represents the transport of one tonne by road over one
kilometre.
Source: Glossary for Transport Statistics (UNECE) B.V-22
Water: Unit of measurement of goods transport which
represents the transport of one tonne by inland waterways
over one kilometer
Source: Glossary for Transport Statistics (UNECE) C.V-21
The distance to be covered is the distance actually travelled on
the considered network. To avoid double counting each country
should count only the km performed on its territory. If it is not
available, then the distance charged or estimated should be
taken into account.
The distance to be taken into consideration is the distance
actually run.
The distance taken into account is the distance performed in the

108
Measurement issues
№ Appropriate indicators
Priority
(high-1;
medium-2;
low-3)
Definition of indicator Calculation method
reporting country.
55 Carried freight of
the mining
products, by ton
3 Amount of mining products that are carried by railway, road,
or water vehicles.
Source: Glossary for Transport Statistics (UNECE)
A.V-16
Source: Glossary for Transport Statistics (UNECE) B.V-18
Source: Glossary for Transport Statistics (UNECE) C.V-17
Total volume of mining products that are carried by railway,
road, or water vehicles.
This includes all packaging and equipment, such as containers,
swap-bodies or pallets as well as road goods vehicles carried by
railway, road, or water.
14. Measurement of
other economic
activity to support
the mining industry,
including role of
input-output
analysis
56 Total supply, by
products and
economic activities
2 The amount of a product available for use within the
economy must have been supplied either by domestic
production or by imports. The same amount of the product
entering an economy in an accounting period must be used
for intermediate consumption, final consumption, capital
formation (including changes in inventories) or exports.
Source: SNA-2008, 14.4.
Output + imports = intermediate consumption + final
consumption + capital formation + exports
Total supply by product = Total use by product
57 Total use, by
products and
economic activities
2 A use table can be viewed as a rectangular table with four
quadrants, two in the upper part and two in the lower part.
The upper left quadrant consists of a sub-matrix showing the
use of different products by different groups of producing
units. In other words, this quadrant contains intermediate
consumption, disaggregated by product in the
rows and by industries in the columns. The upper right
quadrant consists of a sub-matrix showing the use of different
products by final consumers, a sub-matrix for exports and a
sub-matrix showing the use of different products for capital
formation. Together these three submatrices show final
demand. The lower left quadrant contains information on
value added disaggregated to show the elements of the
Total use by product=Intermediate consumption by product and
by industry+Final uses by product and by category

109
Measurement issues
№ Appropriate indicators
Priority
(high-1;
medium-2;
low-3)
Definition of indicator Calculation method
generation of income account, that is compensation of
employees, gross operating surplus or gross mixed income
and taxes less subsidies on production.
Source: SNA-2008, 14.84.
'IOT analysis. In
which:
58 o Production
multiplier, by
economic activities
3 An output multiplier for a sector j is defined as the total value
of production in all sectors of the economy that is necessary
at all stages of production in order to produce one unit of
product j for final demand.
Source: Eurostat Manual of Supply, Use and Input-Output
Tables 15.1.7
As we are assuming constant returns to scale, the effect on the
economy is seen by multiplying (I-A)〗^(-1) by a final demand
vector that has unity in the sector we are concerned with and
zero elsewhere, i.e. the vector of value multipliers is defined as
〖i^' (I-A)〗^(-1). This is just the column sum of the Leontief
inverse. Here (i ) is the unit vector and a prime indicates the
transpose
59 o Income
multiplier, by
economic activities
3 Income multipliers attempt to identify the impacts of final
demand changes on income received by households (labour
supply). the static input-output models is used to calculate the
direct and indirect requirements for wages which are
incorporated in one unit of output for final demand.
Source: Eurostat Manual of Supply, Use and Input-Output
Tables 15.1.7
Z = B(I-A)(-1) Direct and indirect requirements for wages
B = vector of input coefficients for wages
I = unit matrix
A = matrix of input coefficients for intermediates
Z = vector with results for direct and indirect requirements for
wages
60 o Labor multiplier,
by economic
activities
3 When employment multipliers are calculated, the major
difference to the calculation of the wage content of products
is that this time physical labour input coefficients are used
instead of monetary labour input coefficients.
Source: Eurostat Manual of Supply, Use and Input-Output
Tables 15.1.7
Z = E(I - A)(-1) Direct and indirect requirements for labour
E = matrix of input coefficients for labour (1.000 persons per
millions of DEM of output)
Z = matrix with results for direct and indirect requirements for
labour (persons)
61 o Backward and
forward linkages,
by economic
3 Impact models can measure the effect an industry’s
production has on other industries in

110
Measurement issues
№ Appropriate indicators
Priority
(high-1;
medium-2;
low-3)
Definition of indicator Calculation method
activities the economy in two ways. If an industry increases its
production, there will be increased
demand on the industries that produce the intermediate
inputs. Models that measure impacts based on this type of
relationship are called backward-linkage models. If an
industry increases its production, there will also be an
increased supply of output for other industries to use in their
production. Models that measure impacts based on this type
of relationship are called forward-linkage models.
Source: Eurostat Manual of Supply, Use and Input-Output
Tables 15.1.7
15. Measurement of
‘down-stream’
economic impacts
of mining, including
the manufacturing
of mineral products
62 The impacts of the
mining to the other
economic
industries'
productions,
especially:
63 o Total production
of the electricity,
gas, steam and air
conditioning supply
3 Total production of the electricity, gas, steam and air
conditioning supply
The total amount of electricity, thermal energy and water supply
sector.
64 o Total production
of the water supply;
sewerage, waste
management and
remediation
activities
3 Total production of the water supply, sewerage, waste
management and remediation.
The total amount of water supply, sewerage, waste management
and remediation sector.
65 o Total production
of the wholesale
and retail trade;
3 Total production of the wholesale and retail trade; repair of
motor vehicles and motorcycles.
The total amount of wholesale and retail trade; repair of motor
vehicles and motorcycles sector.

111
Measurement issues
№ Appropriate indicators
Priority
(high-1;
medium-2;
low-3)
Definition of indicator Calculation method
repair of motor
vehicles and
motorcycles
66 o Total production
of the transportation
and storage
3
67 o Total imports of
the heavy
machinery,
mechanism and
equipments
3 Total imports of the heavy machinery, mechanism and
equipments.
The total value of imported heavy machinery, mechanism and
equipments.
16. Measurement of
infrastructure to
support mining
activity
68 Fixed telephone
lines per 100
inhabitants
2 Fixed telephone lines refer to telephone lines that connect a
subscriber’s terminal equipment to the public switched
telephone network (PSTN) and that have a dedicated port on
a telephone exchange.
Source: Core ICT indicators 2010, Partnership on measuring
ICT for development, ITU, page 12, indicator A1
Fixed telephone lines per 100 inhabitants is calculated by
dividing the number of fixed telephone lines by the total
population and then multiplying by 100.
69 Proportion of
households with a
radio
2 A radio is defined as a device capable of receiving broadcast
radio signals, using common frequencies, such as FM, AM,
LW and SW. A radio may be a stand-alone device, or it may
be integrated with another device, such as an alarm clock, an
audio player, a mobile telephone or a computer.
Source: Manual for Measuring ICT Access and Use by
Household and Individuals, 2014 edition, ITU, page 45,
indicator HH1
The proportion of households with a radio is expressed as a
percentage and is calculated by dividing the number of in-scope
households with a radio by the total number of in-scope
households, and then multiplying the result by 100.
70 Proportion of
households with a
television
2 A television (TV) is a device capable of receiving broadcast
television signals, using popular access means such as over-
the-air, cable and satellite. A television set is typically a
stand-alone device, but it may also be integrated with another
The proportion of households with a TV is expressed as a
percentage and is calculated by dividing the number of in-scope
households with a TV by the total number of in-scope
households, and then multiplying the result by 100.

112
Measurement issues
№ Appropriate indicators
Priority
(high-1;
medium-2;
low-3)
Definition of indicator Calculation method
device, such as a computer or a mobile telephone.
Source: Manual for Measuring ICT Access and Use by
Household and Individuals, 2014 edition, ITU, page 46,
indicator HH2
71 Proportion of
individuals using a
mobile cellular
telephone
2 A mobile (cellular) telephone refers to a portable telephone
subscribing to a public mobile telephone service using
cellular technology, which provides access to the PSTN. This
includes analogue and digital cellular systems and
technologies such as IMT-2000 (3G) and IMT-Advanced.
Users of both postpaid subscriptions and prepaid accounts are
included.
Source: Manual for Measuring ICT Access and Use by
Household and Individuals, 2014 edition, ITU, page 60,
indicator HH10.
The proportion of individuals using a mobile telephone is
expressed as a percentage and is calculated by dividing the total
number of in-scope individuals using a mobile telephone by the
total number of in-scope individuals, and then multiplying the
result by 100.
72 Proportion of
businesses using
computer
2 A computer refers to a desktop computer, a laptop (portable)
computer or a tablet (or similar handheld computer). It does
not include equipment with some embedded computing
abilities, such as smart TV sets, and devices with telephony
as their primary function, such as smartphones.
Source: Core ICT indicators 2010, Partnership on measuring
ICT for development, ITU, page 36, indicator B1.
The proportion of businesses using computers is calculated by
dividing the number of in-scope businesses using computers
during the reference period by the total number of in-scope
businesses. The result is then multiplied by 100 to be expressed
as a percentage.
73 Proportion of
households with
Internet
2 The Internet is a worldwide public computer network. It
provides access to a number of communication services
including the World Wide Web and carries e-mail, news,
entertainment and data files, irrespective of the device used
(not assumed to be only via a computer − it may also be by
mobile telephone, tablet, PDA, games machine, digital TV
etc.). Access can be via a fixed or mobile network.
Source: Manual for Measuring ICT Access and Use by
Household and Individuals, 2014 edition, ITU, page 53,
The proportion of households with Internet is expressed as a
percentage and is calculated by dividing the number of in-scope
households with Internet by the total number of in-scope
ouseholds, and then multiplying the result by 100.

113
Measurement issues
№ Appropriate indicators
Priority
(high-1;
medium-2;
low-3)
Definition of indicator Calculation method
indicator HH6.
74 Proportion of
businesses using the
Internet
2 The Internet is a worldwide public computer network. It
provides access to a number of communication services
including the World Wide Web and carries e-mail, news,
entertainment and data files.
Source: Core ICT indicators 2010, Partnership on measuring
ICT for development, ITU, page 37, indicator B2.
The proportion of businesses using the Internet is calculated by
dividing the number of in-scope businesses using the Internet by
the total number of in-scope businesses. The result is then
multiplied by 100 to be expressed as a percentage.
75 Energy and public
services
1 Public service includes electricity supplied and services
rendered to municipalities or divisions or agencies of State or
Federal governments under special contracts, agreements, or
service classifications applicable only to public authorities.
Source: ISIC divisions: 33, 36-39, 45-96 and 99, excluding
ISIC 8422.
76 Petrol and gas tubes 1
77 Electric adjustment
assets
1
78 Allocation and
transmission system
1 An interconnected group of electric transmission lines and
associated equipment for moving or transferring electric
energy in bulk between points of supply and points at which
it is transformed for delivery over the distribution system
lines to consumers or is delivered to other electric systems.
Source:http://www.eia.gov/tools/glossary/index.cfm?id=T
79 Water supply
purification
1 Water purification is the process of removing undesirable
chemicals, biological contaminants, suspended solids and
gases from contaminated water. The goal is to produce water
fit for a specific purpose. Most water is disinfected for human
consumption (drinking water), but water purification may

114
Measurement issues
№ Appropriate indicators
Priority
(high-1;
medium-2;
low-3)
Definition of indicator Calculation method
also be designed for a variety of other purposes, including
fulfilling the requirements of medical, pharmacological,
chemical and industrial applications.
Source:https://en.wikipedia.org/wiki/Water_purification
17. Measurement of
mining impact on
national income,
including balance of
payments incomes
associated with
mining and
measures of real
gross domestic
income and real net
national disposable
income
80 Value added of
mining sector, by
volume change
1 When gross domestic product (GDP) is derived by summing
final domestic expenditures and exports and subtracting
imports, or by subtracting intermediate consumption from
output and adding taxes less subsidies on products, volume
measures of GDP can be obtained provided that the volumes
being aggregated are additive, (that is, are based on the
Laspeyres formula).
Source: (SNA 2008, 15.132-138).
The gross value added of an establishment, enterprise, industry
or sector is measured by the amount by which the value of the
outputs produced by that establishment, enterprise, industry or
sector exceeds the value of the intermediate inputs consumed.
This may be written as: where the Q’s refer to outputs, P’s their
basic prices, q’s to intermediate inputs and p’s their purchasers’
prices. Value added in year t at prices of year t is given by:
while value added in year t at the prices of the base year, 0, is
given by:
This measure of value added is generally described as being
obtained by “double deflation” as it can be obtained by deflating
the current value of output by an appropriate (Paasche-type)
price index and by similarly deflating the current value of
intermediate consumption.
Source: (SNA 2008, 15.134).
81 Annual change of
value added of
mining sector
1 Annual changes refer to annual changes in levels expressed
over the previous year. Annual growth rates are annual rates
of change expressed over the previous year.
Source: "Glossary of statistical terms" oecd 2007
Annual change=Xt-Xt-1; Percent_change=Xt/Xt-1*100; X-
value added of mining sector; t- current year; t-1-previous year
82 The share of value
added of mining
sector to the GDP
1 The share of value added of mining sector is value added of
mining sector divided by GDP.
83 GNI 1 Primary incomes generated in the production activity of
resident producer units are distributed mostly to other
resident institutional units; however, part of them may go to
GNI is equal to GDP less primary incomes payable to non-
resident units plus primary incomes receivable from non-
resident units. In other words, GNI is equal to GDP less taxes

115
Measurement issues
№ Appropriate indicators
Priority
(high-1;
medium-2;
low-3)
Definition of indicator Calculation method
non-resident units. Symmetrically, some primary incomes
generated in the rest of the world may come from resident
units. This leads to the definition and measurement of gross
national income (GNI).
Source: (SNA 2008, 2.143).
(less subsidies) on production and imports, compensation of
employees and property income payable to the rest of the world
plus the corresponding items receivable from the rest of the
world.
Source: (SNA 2008, 2.143).
84 Annual change of
GNI
1 Annual changes refer to annual changes in levels expressed
over the previous year. Annual growth rates are annual rates
of change expressed over the previous year.
Source: Glossary of statistical terms" OECD 2007
Annual change=Xt-Xt-1; Percent_change=Xt/Xt-1*100; X-
GNI; t-current yerar; t-1-previous year
85 GNI per capita 1 Per capita growth rates in real national income or in real
actual consumption generally provide a better measure of the
changes in the average “welfare” of a country’s population
than the changes in GDP volumes. GDP is a measure of
production within a country but the inflows or
outflows of income from or to the rest of the world can have
a significant effect on both the level and growth rates in real
national income per capita.
Source: (SNA 2008, 19.14).
GNI per capita is gross national income divided by midyear
population.
86 RNND /NDI/ 1 Primary incomes receivable by resident institutional units
may be used in part to make transfers to non-resident units
and resident units may receive transfers originating out of
primary incomes in the rest of the world. Gross national
disposable income measures the income available to the total
economy for final consumption and gross saving. By
deducting the consumption of fixed capital from gross
national disposal income, net national disposable income is
obtained. National disposable income is the sum of
disposable income of all resident institutional units or sectors.
Source: (SNA 2008, 2.145).
Gross national disposable income is equal to GNI less current
transfers (other than taxes, less subsidies, on production and
imports) payable to non-resident units, plus the corresponding
transfers receivable by resident units from the rest of the world.
Source: (SNA 2008, 2.145).

116
Measurement issues
№ Appropriate indicators
Priority
(high-1;
medium-2;
low-3)
Definition of indicator Calculation method
18. Measurement of
national wealth
87 Natural resource
(oil, coal, natural
gas, minerals etc.)
1 Natural resources are natural assets (raw materials) occurring
in nature that can be used for economic production or
consumption. Natural resources cover mineral and energy
resources, soil, water and biological resources.
Source: 'Glossary of Environment Statistics, Studies in
Methods, Series F, No. 67, United Nations, New York, 1997,
page 51, SNA 2008 10.15, SEEA-CF 2.101, 5.18,
https://stats.oecd.org/glossary/detail.asp?ID=1740.
Natural resources are a sub-set of environmental assets. Natural
resources include all natural biological resources (including
timber and aquatic resources), mineral and energy resources,
soil resources and water resources. All cultivated biological
resources and land are excluded from scope.
88 Produced assets
(machinery and
equipments,
buildings and urban
land)
1 Produced assets are non-financial assets that have come into
existence as outputs from processes that fall within the
production boundary of the SNA.
Source: SNA 2008- 10.9a, 10.10, A3.51
89 Human resource
(number of
employees)
1 The resource that resides in the knowledge, skills, and
motivation of people.
19. Measurement of
impact of mining on
regional economies
(including regional
prices and regional
housing markets)
90 Consumer price
index, by goods and
regions
2 Consumer price indices (CPIs) are index numbers that
measure changes in the prices of goods and services
purchased or otherwise acquired by households, which
households use directly, or indirectly, to satisfy their own
needs and wants.
Source: (Consumer price index manual: Theory and practice
2004, 1.3)
pit = price for i
th item (or product) at time t.
pi0 = price for ith product (or item) at time 0, the price reference
period (or base period) qib = quantity of ith
item purchased during the weight (or basket) reference period.
Source: (Practical guide for producing consumer price index
2009, 10.4)
91 Housing price
index, by regions
3 The housing price index (HPI) shows the changes of
residential properties purchased by households (flats,
detached houses, terraced houses, etc.) both newly-built and
existing ones, independently of their final use and
independently of their previous owners. Source:
(http://ec.europa.eu/eurostat/statistics-
Four main methods have been suggested in the literature to
control for changes in the amounts of the property
characteristics: stratification or mix adjustment, repeat sales
methods, hedonic regression methods, and the use of property
assessment information. Stratification of transactions according
to some of the price determining characteristics is a
/^(�/0)=(∑_�▒�_�^�Z_�^*)/(∑_�▒�_�^0
Z_�^*)

117
Measurement issues
№ Appropriate indicators
Priority
(high-1;
medium-2;
low-3)
Definition of indicator Calculation method
explained/index.php/Housing_price_statistics_-
_house_price_index)
straightforward and computational simple way to adjust for
changes in the quality mix of the samples in different time
periods. By defining a number of reasonably homogeneous
strata or cells, the average selling price within each cell can be
used as a (proxy to a) constant quality price for that type of
property. Regular index number theory can then be applied to
aggregate up the average prices by cell into an overall index.
Such stratification methods are also known as mix adjustment
methods. The repeat sales method addresses the quality mix
problem by comparing properties that have sold more than once
over the sample period. Restricting the comparison to units that
have sold repeatedly ensures that the price relatives compare
like with like, provided that the quality of the houses remained
unchanged. The standard repeat sales method is based on a
regression model where the repeat sales data pertaining to all
periods are pooled. Hedonic regression methods can in principle
adjust for such quality changes in addition to changes in the
quality mix of the samples. These methods utilize information
on the relevant property characteristics to estimate quality
adjusted price indices using regression techniques, though it
may prove difficult to sufficiently control for location. Many
countries tax real estate property and are likely to have an
official property valuation office that provides periodic
appraisals of all taxable real estate properties. Assessment-based
methods combine selling prices with appraisals to compute
price relatives (sale price appraisal ratios) and control for
quality mix changes. Source: (Handbook on Residential
property prices indices (RPPIs), 2013, 3.20, 3.21, 3.22, 3.23,
3.24)
20.General
measurement issues,
including dealing
with multinational
92 Number of
multinational
enterprises at the
mining industry
3 Number of multinational enterprises in mining sector that is
an organization that owns or controls production of goods or
services in one or more countries other than their home
country.
Total number of multinational enterprises in mining sector.

118
Measurement issues
№ Appropriate indicators
Priority
(high-1;
medium-2;
low-3)
Definition of indicator Calculation method
enterprises, dealing
with confidentiality
issues, correction of
‘off year’ reporting,
ensuring coherence
of information from
different sources
and consistency
thereof, by
developing a
coordinated
approach to large
mining projects,
measuring informal
mining activity)
93 Number of mining
companies with
FDI, percentage of
FDI
3 Number of mining companies with FDI that are registered in
Business Register.
A foreign direct investment (FDI) is an investment made by a
company or entity based in one country, into a company or
entity based in another country.
Total number of mining companies with FDI.
94 Main indicators of
the artisanal mining
(total output,
intermediate
consumption, value
added, total tax
paid, contributions
to the local
government,
number of
employees, land
damage,
remediation)
3 A citizen who is not a member of any partnership but
explores mineral resources through artisanal mining. Of them
total output, intermediate consumption, value added, total tax
paid, contributions to the local government, number of
employees, land damage, remediation.
21. Measurement of
the procurement of
nationally produced
goods and services
95 Total procurement
of nationally
produced goods and
services of the
mining enterprises
2

119
THE STATISTICAL INDICATORS TO MEASURE THE IMPACT OF THE MINING
INDUSTRY ON THE SOCIAL SECTOR
Measurement issues № Appropriate
indicators
Priority
(high-1;
medium-2;
low-3)
Definition of indicator Calculation method
1. LABOR FORCE
1.1. Measuring
employment in the
mining industry
96 Number of
employees at the
mining sector
1 Employees are all those workers who hold the type of job
defined as "paid employment jobs" in mining industry.
Paid employment jobs are those jobs where the incumbents
hold explicit (written or oral) or implicit employment
contracts which give them a basic remuneration which is not
directly dependent upon the revenue of the unit for which
they work (this unit can be a corporation, a non-profit
institution, a government unit or a household). Some or all of
the tools, capital equipment, information systems and/or
premises used by the incumbents may be owned by others,
and the incumbents may work under direct supervision of, or
according to strict guidelines set by the owner(s) or persons
in the owners’ employment. Persons in "paid employment
jobs" are typically remunerated by wages and salaries, but,
may be paid by commission from sales, by piece-rates,
bonuses or in-kind payments such as food, housing or
training.
Source: International Labour Organization (ILO) Resolutions
Concerning International Classification of Status in
Employment Adopted by the 15th International Conference
of Labour Statisticians, January 1993, para. 6.
(a1) "at work": persons who during the reference period
performed some work for wage or salary, in cash or in
kind;
(a2) "with a job but not at work": persons who, having
already worked in their present job, were temporarily not at
work during the reference period and had a formal
attachment to their job.
This formal job attachment should be determined in the
light of national circumstances, according to one or more
of the following criteria:
(i) the continued receipt of wage or salary;
(ii) an assurance of return to work following the end of the
contingency, or an agreement as to the date of return;
(iii) the elapsed duration of absence from the job which,
wherever relevant, may be that duration for which workers
can receive compensation benefits without obligations to
accept other jobs;
97 Number of foreign
employees at the
mining sector, by
nationality
1 A person who migrates or who has migrated from one
country to another with a view to being employed in mining
industry other than on his own account.
Source: ILO
98 Number of
engineering and
1 Physical and engineering science technicians perform
technical tasks to aid in research on and the practical
Tasks performed usually include: undertaking and carrying
out technical work related to chemistry, physics, geology,

120
Measurement issues № Appropriate
indicators
Priority
(high-1;
medium-2;
low-3)
Definition of indicator Calculation method
technical staffs application of concepts, principles and operational methods
particular to physical sciences including such areas as
engineering, technical drawing or economic efficiency of
production processes.
Source: International Standard Classfication of Occupation
ISCO-08, International Labour Office, Geneva, 2012, page
170
meteorology, astronomy, engineering, or technical
drawing; setting up, operating, and maintaining laboratory
instruments and equipment, monitoring experiments,
making observations, and calculating and recording results;
preparing materials for experimentation; conducting tests
of systems; collecting and testing samples; recording
observations and analyzing data; preparing, revising and
interpreting technical drawings, wiring diagrams, circuit
board assembly diagrams, or layout drawings.
1.2. Measuring the
demographic
characteristics of the
mining labor
99 Mining labor, by
working age
2 For statistical purposes, the working age population
comprises all persons above a specified minimum age
threshold for which an inquiry on mining activity is made.
Source:
https://www.ilo.org/ilostat/faces/home/statisticaldata/concept
sdefinitions?_afrLoop=4284023318850814#%40%3F_afrLo
op%3D4284023318850814%26_adf.ctrl-
state%3D303iff4lm_4
For purposes of international comparability, the working
age population is commonly defined as persons aged 15
years and older, but this varies from country to country. In
addition to using a minimum age threshold, certain
countries also apply a maximum age limit. Adoption of a
specified upper age limit means that all persons above that
age limit are excluded from the count of the working age
population. Most countries, however, do not use a
maximum age limit.
Data by age are provided according to 5-year: 15-19, 20-
24, 25-29, 30-34, 35-39, 40-44, 45-49, 50-54, 55-59, 60-64,
65-69, 70-74 and 75+. Whenever this data was not
available, 10-year age bands are used: 15-24, 25-34, 35-44,
45-54, 55-64 and 65+.
100 Mining labor, by
sex
2
101 Mining labor, by
level of education
2
102 Mining labor, by
occupation
2 Information on occupation provides a description of the set
of tasks and duties which are carried out by, or can be
assigned to, one person. Persons are classified by
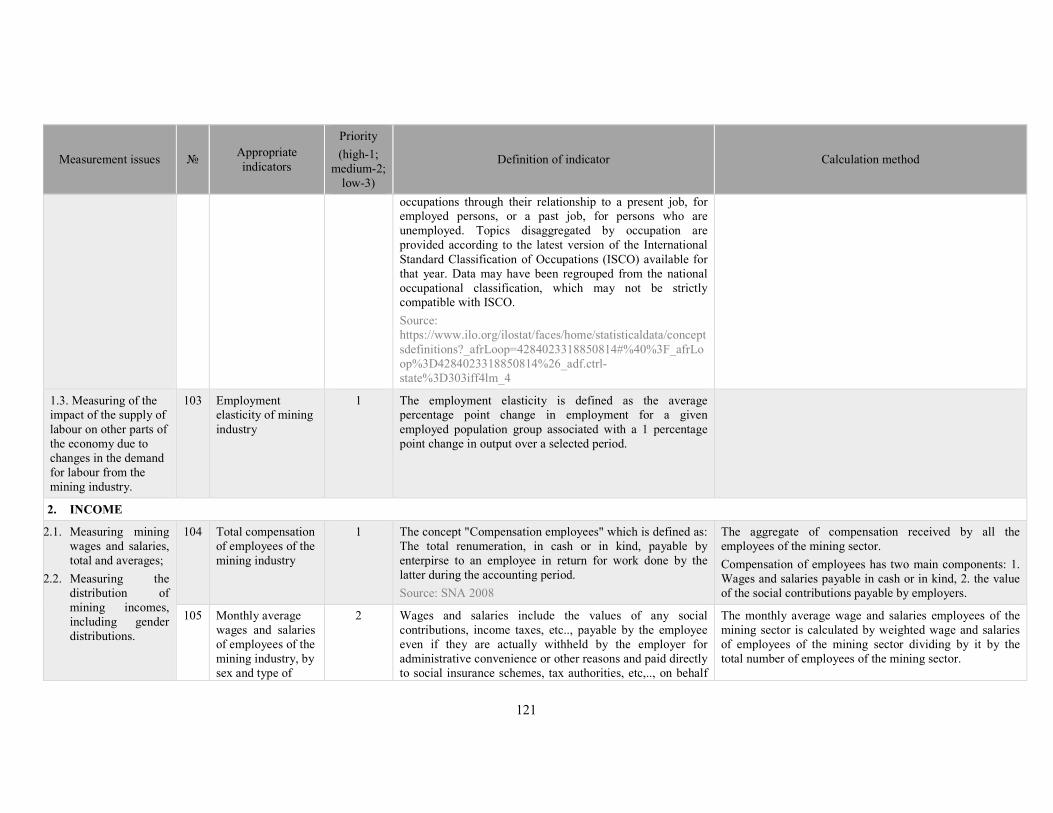
121
Measurement issues № Appropriate
indicators
Priority
(high-1;
medium-2;
low-3)
Definition of indicator Calculation method
occupations through their relationship to a present job, for
employed persons, or a past job, for persons who are
unemployed. Topics disaggregated by occupation are
provided according to the latest version of the International
Standard Classification of Occupations (ISCO) available for
that year. Data may have been regrouped from the national
occupational classification, which may not be strictly
compatible with ISCO.
Source:
https://www.ilo.org/ilostat/faces/home/statisticaldata/concept
sdefinitions?_afrLoop=4284023318850814#%40%3F_afrLo
op%3D4284023318850814%26_adf.ctrl-
state%3D303iff4lm_4
1.3. Measuring of the
impact of the supply of
labour on other parts of
the economy due to
changes in the demand
for labour from the
mining industry.
103 Employment
elasticity of mining
industry
1 The employment elasticity is defined as the average
percentage point change in employment for a given
employed population group associated with a 1 percentage
point change in output over a selected period.
2. INCOME
2.1. Measuring mining
wages and salaries,
total and averages;
2.2. Measuring the
distribution of
mining incomes,
including gender
distributions.
104 Total compensation
of employees of the
mining industry
1 The concept "Compensation employees" which is defined as:
The total renumeration, in cash or in kind, payable by
enterpirse to an employee in return for work done by the
latter during the accounting period.
Source: SNA 2008
The aggregate of compensation received by all the
employees of the mining sector.
Compensation of employees has two main components: 1.
Wages and salaries payable in cash or in kind, 2. the value
of the social contributions payable by employers.
105 Monthly average
wages and salaries
of employees of the
mining industry, by
sex and type of
2 Wages and salaries include the values of any social
contributions, income taxes, etc.., payable by the employee
even if they are actually withheld by the employer for
administrative convenience or other reasons and paid directly
to social insurance schemes, tax authorities, etc,.., on behalf
The monthly average wage and salaries employees of the
mining sector is calculated by weighted wage and salaries
of employees of the mining sector dividing by it by the
total number of employees of the mining sector.

122
Measurement issues № Appropriate
indicators
Priority
(high-1;
medium-2;
low-3)
Definition of indicator Calculation method
occupations of the employee. Wage and salaries payable to employees in
cash regular intervals including: Direct wages and salaries,
renumeration for time not worked, bonuses and gratuities,
food, drink, fuel and other payment in cash. It can be
disaggregation by sex and type of occupations.
Source: SNA 2008, ILO resolution 1973
106 Real wage index of
the employees of
the mining industry
2 Real wages are goods and services which can be purchased
with wages or are provided as wages, must be distingished
from the broader concept of real income and the complex
concept of level of living to which they are related.
Source: ILO resolution 1954
The real wage index is calculated by the nominal wage
index dividing it by the consumer price index and multiply
by 100.
107 Labour cost of the
empoyees of the
mining industry
2 The statistics of labour cost comprises renumeration for work
performed, payment in respect of time paid for but not
worked, bonuses and gratuities, the cost of food, drink and
other payment in kind, cost of workers' housing borne by
employer, employers' social security expenditures, cost to the
employer for vocational training, welfare services and
miscellaneous items, such as transport of workers, work
clothes and requitment, together with taxes regarded as
labour cost.
Source: ILO, Resolution concerning statistics of labour cost,
adopted by the 11th International Conference of Labour
Statisticians, Geneva, 1966
The aggregate of labour cost received by all the employees
of the mining sector.
3. HEALTH AND PRODUCTIVITY
3.1. Measuring workers
conditions and
industrial relations in
the mining industry
108 Occupational safety
of the mining
employees (safety
workwear and
facilities etc.)
1 The protection of workers' lives and physical well-being by
eliminating or controlling risks in the working environment
or the system of work within which workers operate.
Source: http://www.ilo.org/thesaurus/default.asp
3.3. Measuring the 109 Life expectancy at 1 Life expectancy at birth is defined as how long, on average, a According to statistics, it suggests that the mortality rate at

123
Measurement issues № Appropriate
indicators
Priority
(high-1;
medium-2;
low-3)
Definition of indicator Calculation method
impact of mining on
workers’ health and the
health of the
community generally
birth, by sex and
regions
newborn can expect to live, if current death rates do not
change. However, the actual age-specific death rate of any
particular birth cohort cannot be known in advance. If rates
are falling, actual life spans will be higher than life
expectancy calculated using current death rates. Life
expectancy at birth is one of the most frequently used health
status indicators. Gains in life expectancy at birth can be
attributed to a number of factors, including rising living
standards, improved lifestyle and better education, as well as
greater access to quality health services. This indicator is
presented as a total and per gender and regions and is
measured in years.
Source: https://data.oecd.org/healthstat/life-expectancy-at-
birth.htm
the time of a child's birth, might remain the same during
his/her lifetime.
110 Number of mining
related deaths, by
sex, age group,
level of education
and occupations
1 Number of died employees die to mining activities.
111 Crude death rate, by
regions
1 The crude death rate is the number of deaths occurring
among the population of a given geographical area during a
given year, per 1,000 mid-year total population of the given
geographical area during the same year. Source:
https://stats.oecd.org/glossary/detail.asp?ID=491
The total number of people who died during the period
compared with the annual average number of the
population and multiplied by 1000.
112 The sex ratio at
death, by regions
1 The number of death males per 100 death females and
estimated as a ratio of males to females.
Death population of man compared to the death population
of women and multiplied by 100.
113 Number of
inpatients, by
classification of
disease, by regions
3 The number of people suffering from the disease.
Source: Inpatient morbidity recorded statements Health
Report-503 (MHS)

124
Measurement issues № Appropriate
indicators
Priority
(high-1;
medium-2;
low-3)
Definition of indicator Calculation method
114 Number of
prevalence and
deaths of malignant
neoplasms, by
regions
3 International Classification of Diseases (ICD) according to
classification M800-M969
Report morbidity listed in the clinic HC-502, Report of
inpatient morbidity registered Health Report-503 (MHS)
115 Diseases of the
mining employees,
by type of diseases
3
4. MEASURING THE IMPACT OF MINING ON SOCIAL ISSUES
4.1. Measuring internal
and international
migration flows
associated with mining
(including
remittances);
116 Number of internal
migrant
1 A migrant is a person who has changed his usual place of
residence from one migration-defining area to another (or
who moved some specified minimum distance) at least once
during the migration interval.
An in-migrant is thus a person who enters a migration-
defining area by crossing its boundary from some point
outside the area, but within the same country.
Source: Methods of measuring internal migration, Manual 6,
UN.
With respect to a given area, the sum of in-migration and
out-migration, or of in-migrants and out-migrants, is
turnover.
Number of migrant = Number of emigrant + Number of
immigrant
117 Number of
international
migrant
1 The definition of the word can be ''international migrant'' is
defined as any person who changes his or her country of
usual residence.
Country of usual residence: The country in which a person
lives, that is to say, the country in which he or she has a
place to live where he or she normally spends the daily
period of rest. Temporary travel abroad for purposes of
recreation, holiday, visits to friends and relatives, business,
medical treatment or religious pilgrimage does not change a
person's country of usual residence.
Source: (Recommendations on Statistics International
Short-term migrant: A person who moves to a country
other than that of his or her usual residence for a period of
at least 3 months but less than a year (12 months) except in
cases where the movement to that country is for purposes
of recreation, holiday, visits to friends and relatives,
business, medical treatment or religious pilgrimage. For
purposes of international migration statistics, the country of
usual residence of short-term migrants is considered to be
the country of destination during the period they spend in
it.
Long-term migrant: A person who moves to a country
other than that of his or her usual residence for a period of

125
Measurement issues № Appropriate
indicators
Priority
(high-1;
medium-2;
low-3)
Definition of indicator Calculation method
Migration 1998, 4.186) at least a year (12 months), so that the country of
destination effectively becomes his or her new country of
usual residence. From the perspective of the country of
departure the person will be a long-term emigrant and from
that of the country of arrival the person will be a long-term
immigrant. (Recommendations on Statistics International
Migration 1998, 4.186).
Source: (Methods of measuring internal migration, Manual
6, UN).
118 Workers'
remittances
2 Workers’ remittances are current transfers
made by employees to residents of another economy.
Source:https://www.imf.org/external/pubs/ft/bop/2007/pdf/b
pm6.pdf, 12.22
Total workers’ remittances are the sum of personal
remittances and social benefits.
4.2. Measuring the
impact of mining on
poverty;
119 Household income
and expenditure, by
regions
1 Household income is a measure of the combined incomes of
all people sharing a particular household or place of
residence. It includes every form of income,
e.g., salaries and wages, retirement income, near cash
government transfers like food stamps, and investment gains.
Household expenditure is included the amount paid for
lodging, food consumed within the home, utilities paid and
other expenses.
Source: World bank
The total income (expenditure) of a household is defined
by the sum of the household's monetary income
(expenditure) and the value of consumed commodities
from own farming and received from others free of charge.
120 Poverty headcount
index, by regions
2 The poverty headcount index is the share of the population
whose consumption /expenditure/ is below the poverty line.
This is a most widely used poverty index, that is comparably
easy to interpret and understand, while other two more
indices poverty gap and severity of poverty are used in order
to get more comprehensive pictures of poverty.
Source: World bank
By far the most widely-used measure is the headcount
index, which simply measures the
proportion of the population that is counted as poor, often
denoted by P0. Formally,
P0 = Np
N
where Np is the number of poor and

126
Measurement issues № Appropriate
indicators
Priority
(high-1;
medium-2;
low-3)
Definition of indicator Calculation method
N is the total population (or sample).
4.3. Measuring social
impacts of population
dislocation associated
with mining activity;
121 Number of
population
1 The total number of persons inhabiting a country, city, or any
district or area.
Source: Population Handbook, USA, Handbook for
Population and Housing Census, UN, Principles and
Recommendations for Population and Housing Census, UN,
Principles and Recommendations for Vital Statistics, UN
Pt = P0 + B – D + In – Out
B - the live births that occurred during the time, D -
deaths that occurred during the time ,
In - in-migration during the time interval,
Out - out-migration during the time interval,
P0 - population number beginning of the year
122 Number of
households
1 The household is the group of people who live together in
one house, with a joint budget and jointly provide their food
and other basic needs. Members of the household should be
family members or relatives; there can be some members in
the household with no relation to the other members.
Source: Handbook for Population and Housing Census, UN,
Principles and Recommendations for Population and
Housing Census, UN
4.4 Measuring the
impact of mining on
education and training.
123 Number of students
in higher
educational
institutions, by
level of education
and sex
2 Higher education institutions are universities, colleges and
technical schools. Characteristics of University are research,
training and production or research and training based,
colleges are education and research based, technical schools
are academic or vocational training are based.
Total number of students studying in higher education
institutions of that year.
124 Graduates of
domestic
universities,
institutes and
college, by
professional areas
2 Number of person who has received a degree or diploma on
completing a course of study, as in a domestic universities
and colleges.
The number of students who have graduated with that
profession.

127
THE STATISTICAL INDICATORS TO MEASURE THE IMPACT OF THE MINING
INDUSTRY ON THE ENVIRONMENT
Measurement issues № Appropriate
indicators
Priority
(high-1;
medium-2;
low-3)
Definition of indicator Calculation method
1. Measurement of the
direct and indirect
demand from the
mining industry for
environmental
inputs, both market
and non-market,
incorporating
measurement in
terms of value
125 Mineral resource,
by mineral types
1 In the context of this classification, mineral resources means
all inorganic or organic substances in the earth that may be
exploited, wholly or partly, for the benefit of mankind. Water
resources are not a subject of this classification.
Source: United Nations Framework Classification for Fossil
Energy and Mineral Resources, page 3,15, SNA-2008
17.340
126 Soil resource 1 Soil resources are a fundamental part of the environment.
They provide the physical base to support the production and
cycling of biological resources, provide the foundation for
buildings and infrastructure, are the source of nutrients and
water for agriculture and forestry systems, provide a habitat
for diverse organisms, play an essential role in carbon
sequestration, and fulfil a complex buffering role against
environmental variability (ranging from dampening diurnal
and seasonal change in temperature and water supply to the
storage and binding of a range of chemical and biological
agents).
Source: SEEA-CF 5.318-5.342
A first stage of accounting for soil resources is to measure
the area of different soil types within a country. In order to
focus on soil resources that are available as a biological
system the scope of this account should be restricted to
land used for agriculture and forestry and also volumes of
soil extracted to be used as a biological system. (Table
5.7.1 Physical Asset Account for Area of Soil Resource
/Hectares/ SEEA-CF)
127 Water resource 2 Water resources consist of surface and groundwater
resources used for extraction to the extent that their scarcity
leads to the enforcement of ownership or use rights, market
valuation and some measure of economic control. Water
resources consist of fresh and brackish water in inland water
bodies including groundwater and soil water.

128
Measurement issues № Appropriate
indicators
Priority
(high-1;
medium-2;
low-3)
Definition of indicator Calculation method
Source: SEEA-CF 5.471-5.498, SNA-2008 10.184
128 Energy resource
(oil, natural gas,
coal, peat, uranium)
1 Mineral and energy resources are defined as known deposits
of oil resources, natural gas resources, coal & peat resources,
non-metallic minerals and metallic minerals. Mineral and
energy resources consist of mineral and energy reserves
located on or below the earth’s surface that are economically
exploitable, given current
technology and relative prices.
Source: SEEA-CF 5.173, SNA-2008 10.179
2. Measurement of
emissions (air and
water) and waste
products from the
mining industry;
129 Emissions from the
mining activities
1 Emissions are substances released to the environment by
mining industry as a result of production, consumption and
accumulation processes.
Source: SEEA-CF 3.88, 3.89
Generally, emissions are analyzed by type of receiving
environment, (i.e. emissions to air, emissions to water
bodies, emissions to soil) and by type of substance.
130 • Emissions to
water
1 Emissions to water are substances released to water
resources by mining industry as a result of production,
consumption and accumulation processes.
Source: SEEA-CF 3.92, 3.257
Water emission accounts record the quantity of substances
added to water by mining industry
during an accounting period. The quantities are expressed
in terms of mass (kilograms or tonnes, depending on the
substance under consideration). Water emission accounts
cover: (a) substances added to wastewater and collected in
the sewerage system; (b) substances added to wastewater
discharged directly to water bodies; and (c) substances
from non-point sources, for example, emissions and
releases from urban runoff and emissions from agriculture.
131 • Emissions to
air
1 Emissions to air are gaseous and particulate substances
released to the atmosphere by mining industry as a result of
production, consumption and accumulation processes.
Source: SEEA-CF 3.91, 3.233
132 • Emissions to
soil
1 Emissions to soil are substances released to the soil by
mining industry as a result of production, consumption and
accumulation processes. Source: SEEA-CF 3.95

129
Measurement issues № Appropriate
indicators
Priority
(high-1;
medium-2;
low-3)
Definition of indicator Calculation method
133 Solid waste 1 Solid waste covers discarded materials that are no longer
required by the owner or user. Solid waste includes materials
that are in a solid or liquid state but excludes wastewater and
small particulate matter released into the atmosphere.
Source: SEEA-CF 3.84, 3.85
3. Measurement of
damage to land
(including
agricultural land) and
ecosystems from
mining activity and
any subsequent
rectification activity
134 Land area of
mining exploration
and production
1 Land is a unique environmental asset that delineates the
space in which economic activities and environmental
processes take place and within which environmental assets
and economic assets are located.
Source: SEEA-CF 5.239, 5.241
A particular feature of statistics on land use and land cover
is the means by which data are collected. Broadly, two
methods are used – field surveys and satellite images.
Field surveys are important as they can provide a high
level of specificity regarding the land cover and, in
particular, the land use in a particular area. Satellite images
are important as they enable a broader assessment of all
areas in a country and, over time, more detailed resolutions
of the images are permitting new forms of analysis.
(SEEA-CF 5.244)
135 Land area, water,
soil and
biodiversity with
remediation
1 Protection and remediation of soil, groundwater and surface
water refers to measures and activities aimed at the
prevention of pollutant infiltration, cleaning up of soils and
water bodies and the protection of soil from erosion and
other physical degradation as well as from stalinisation.
Monitoring, control of soil and groundwater pollution is
included. Protection of biodiversity and landscape refers to
measures and activities aimed at the protection and
rehabilitation of fauna and flora species, ecosystems and
habitats as well as the protection and
rehabilitation of natural and semi-natural landscapes. The
separation between ‘biodiversity’ and ‘landscape’ protection
may not always be practical. For example, maintaining or
establishing certain landscape types, biotopes, eco-zones and
related issues (hedgerows, lines of trees to re-establish
‘natural corridors’) have a clear link to biodiversity

130
Measurement issues № Appropriate
indicators
Priority
(high-1;
medium-2;
low-3)
Definition of indicator Calculation method
preservation.
Source: SEEA-CF Annex 1, CEA, I. Environmental
Protection
136 Land area, water,
soil and
biodiversity without
remediation
1 All actions that making land in previous shape, recovering by
soil, thickening soil, planting, caring are the environmental
restoration actions.
137 Land degradation 1 Degradation considers changes in the capacity of
environmental assets to deliver a broad range of
contributions – known as ecosystem services (e.g. air
filtration services from forests) and the extent to which this
capacity may be reduced through the action of economic
units, including households. In this sense, since depletion
relates to one type of ecosystem service, it can be considered
as a specific form of degradation.
Source: SEEA-CF 5.90, 5.91
The measurement of degradation is complicated because
the capacity of environmental assets to deliver ecosystem
services is not solely attributable to individual assets, and
because individual assets may deliver a number of
different ecosystem services. Further, while individual
environmental assets, such as water and soil resources,
may have been degraded over time, separating the extent
of degradation of the individual asset from the broader
degradation of the related ecosystem may not be
straightforward.
138 Soil damage 1 Soil erosion is the wearing away of the land surface by
physical forces such as rainfall, flowing water, wind, ice,
temperature change, gravity or other natural or
anthropogenic agents that abrade, detach and remove soil or
geological material from one point on the earth's surface to
be deposited elsewhere. (European Commission)
Source: European Commission,
http://esdac.jrc.ec.europa.eu/esbn/Plenary_esbn_2007/Works
hop/ESBN_SoilErosion.pdf ,
http://eusoils.jrc.ec.europa.eu/projects/scape/uploads/108/Be
nyamini.pdf
The trend to use models in erosion evaluation is attractive.
As a result, potential soil erosion rates are typically
modeled from empirical and functional relationships
driven by factors related to soil properties, climate, and
landscape position.
These models do not yet represent the actual soil erosion
losses and only provide estimations of potential erosion
under specified climatic conditions. Without repeated
field-based measurements, there is currently no way to
determine accurate erosion losses. Soil erosion can occur
in two stages: 1) detachment of soil particles by raindrop
impact, splash or flowing water; and 2) transport of the
detached particles by splash or by the flowing water.
Therefore, soil erosion is a physical process requiring
energy, and its control requires certain measures to

131
Measurement issues № Appropriate
indicators
Priority
(high-1;
medium-2;
low-3)
Definition of indicator Calculation method
dissipate this energy. (Soil Conservation And Protection
for Europe)
4. Measurement of the
environmental
impact of economic
activity
‘downstream’ from
the mining industry;
139 Fee on usage of
road from the
mining companies
1
140 Environmental
damages (water,
animal, plant etc)
from the
transportation,
consignment and
discharge of the
mining products
1
141 Cost of
environmental
protection
1 Environmental protection expenditure refers to all operating
and capital expenditure in relation to compliance or in
anticipitation of environmental regulations/conventions in
country. This includes expenditure for preventing, reducing
and rehabilitation of environmental degradation or
preserving the environment.
Source: Environmental protection expenditure survey of
Malaysia, 2013
Total cost of environmental protection basis cost of
management and environmental monitoring.
142 Natural resource
management
1 Resource management includes all actions and activities that
are aimed at preserving and maintaining the stock of natural
resources and hence safeguarding against depletion. This
includes actions and activities aiming at reducing the
withdrawals of natural resources (recovery, reuse, recycling,
substitution of natural resources) as well as restoring natural
resource stocks (increases/ recharges of natural resource
stocks).
Source: SEEA-CF- II.Resource management, 10.

132

133
Annex 2.
GOVERNMENT REVENUES FROM NATURAL
RESOURCES
The Government Finance Statistics Manual 2014 (GFSM 2014) provides national authorities
and data users with a conceptual framework suitable for analysing and evaluating fiscal policy,
especially the performance of the general government sector and the broader public sector.
Specifically, the GFSM 2014 describes a specialized macroeconomic statistical system that
covers all flows (revenue, expense, financing, and other economic flows) and stock positions (in
nonfinancial assets, financial assets, and liabilities) associated with government units. The
information to be collected from natural resource enterprises is broad and the government and
other parties may be interested not just in data on revenues from natural resources, but also in
data on assets, expenses, and other economic flows associated with natural resources. However,
for the purposes of the natural resource revenues template described in Chapter 6, this annex
describes the tax and non-tax revenue classifications to be used in compiling data on the revenue
streams that accrue to government from mining activities.
It is worth noting that in the government balance sheet the GFSM 2001 category subsoil assets is
replaced in the GFSM 2014 by mineral and energy resources. To be an economic asset, a
resource must also be able to supply economic benefits given the technology, scientific
knowledge, economic infrastructure, available resources, and relative prices existing at a given
time or expected in the foreseeable future. Thus, a known deposit of minerals is an economic
asset only if it is already commercially exploitable or is expected to become commercially
exploitable in the foreseeable future.
In the GFS system, mineral and energy resources consist of mineral and energy reserves located
on or below the earth’s surface that are economically exploitable, given current technology and
relative prices. Ownership rights to the mineral and energy resources are usually separable from
those to the land itself. The deposits may be located on or below the earth’s surface, including
deposits under the sea, but they must be economically exploitable. Mineral and energy resources
are known reserves of oil, natural gas, coal, metallic ores (including ferrous, nonferrous, and
precious metal ores), and nonmetallic mineral reserves (including stone quarries, clay and sand
pits, chemical and fertilizer mineral deposits, and deposits of salt, quartz, gypsum, natural gem
stones, asphalt, bitumen, and peat). The tax and non-tax revenue classifications outlined below
may therefore be applied to the revenue streams that accrue to government from mining
activities
1. Taxes on extraordinary profits payable by natural resource enterprises: These are
specific taxes applied to natural resource enterprises. These are taxes generally classified as
profit taxes, for example, resource rent taxes, which are often imposed on profits earned
above a defined rate of return allowed by the government for the corporation to earn. These
taxes could be imposed pre- or post-corporate income tax. These taxes differ from royalties
as they take into account the profit of the mining/energy operation, whereas a royalty is
generally imposed on the production level irrespective of profitability. The taxes on profits
are levied on revenue less allowable deductions. The amounts recorded under this line item

134
are part of the GFSM 2014 category Taxes on income, profits, and capital gains payable by
corporations and other enterprises (1112).
2. Taxes on payroll and workforce payable by natural resource enterprises: These are
taxes paid by natural resource enterprises either as a proportion of payroll size or as a fixed
amount per person, and are not earmarked for social security schemes. If governments are
able to identify general corporate income taxes paid by natural resource enterprises, they
should be able to determine the same for payroll based taxes. The amounts recorded under
this line item are part of the GFSM 2014 category Taxes on payroll and workforce (112).
3. Taxes on property payable by natural resource enterprises: These are taxes payable on
the use, ownership, or transfer of wealth. The taxes may be levied at regular intervals, one
time only, or on a change of ownership. The amounts recorded under this line item are part
of the GFSM 2014 category Taxes on property (113).
4. Value-added taxes payable by natural resource enterprises: In many countries,
businesses are subject to VAT. A value-added tax is a tax on goods and services collected in
stages by enterprises, but which is ultimately charged in full to the final purchaser.
Enterprises usually collect the VAT from purchasers on their sales, and deduct the VAT
paid on their purchases. The amounts recorded under this line item are part of the GFSM 2014 category Value-added taxes (11411).
5. Unrequited value-added taxes (VAT) payable by natural resource enterprises: In the
majority of cases, enterprises are able to claim input tax credits as the enterprises’ purchases
are for intermediate and not for final consumption. In some countries, natural resource
enterprises do not have input tax credits available to reclaim any value-added taxes paid,
and therefore receive no refunds. Hence, a category is required for unrequited value-added
taxes paid by these enterprises. The amounts recorded under this line item are part of the
GFSM 2014 category Value-added taxes (11411).
6. Excise taxes payable by natural resource enterprises: Excises are taxes levied on
particular products (e.g., hydrocarbon oils, tobacco goods, sugar), or on a limited range of
products, that are not classifiable under general taxes on goods and services (1141); profits
of fiscal monopolies (1143); customs and other import duties (1151); or taxes on exports
(1152). The amounts recorded under this line item are part of the GFSM 2014 category
Excises (1142).
7. Profits of natural resource fiscal monopolies: This item covers that part of the profits
of fiscal monopolies that is transferred to the government. Fiscal monopolies are public
corporations or quasi-corporations that exercise the taxing power of government by the use
of monopoly powers over the production or distribution of a particular kind of good or
service. The monopolies are created to raise government revenue that could otherwise be
gathered through taxes on private sector production or distribution of the commodities
concerned. Typical commodities subject to fiscal monopolies are tobacco products,
petroleum products, salt, etc. The amounts recorded under this line item are part of the
GFSM 2014 category Profits of fiscal monopolies (1143). Depending on the specific
135
circumstances of a given country, the profits transferred to the government by a public
corporation would be classified as dividends (when no monopoly exists) or as profits of
fiscal monopolies (when a monopoly exists).
8. Fiscal monopolies are distinguished from public enterprises such as rail transport,
electricity, and post offices. These latter may enjoy a monopoly but normally exist
primarily to promote or advance the interests of public economic or social policy, rather
than to raise revenue for government. Transfers to government from such public enterprises
are treated as dividends (1412) or withdrawals of income from quasi-corporations (1413).
Profit transfers from export and import monopolies are similar to fiscal monopoly profits
but have their own category (see below).
9. While in principle only the excess of the monopoly profits over “normal” profits
should be treated as taxes, it is difficult to estimate this amount. Thus, in practice, the
value of the taxes should be taken to be equal to the amount of the profits actually
transferred to government. The taxes are recorded when the transfer takes place rather than
when profits are earned.
10. Business and professional licenses payable by natural resource enterprises: These are
payments where no specific service is attached or, in general, the amount of the fee is
significantly disproportionate to the service provided. Possible examples are license fees,
rental fees, and entry fees. Some licenses might be for exploration or extraction. The
amounts recorded under this line item are part of the GFSM 2014 category Other taxes on
use of goods and on permission to use goods or perform activities (11452). If there is a
specific service attached to the fee and the payment is proportionate to the service, it should
be recorded as a sale of a service under the subcategory Administrative fees for government
services supplied to natural resource enterprises (1422).
11. Pollution taxes payable by natural resource enterprises: These are taxes levied on the
emission or discharge of noxious gases, liquids, or other harmful substances. Amounts
payable to government for the collection and disposal of waste or noxious substances are
excluded from this category, as they constitute sales of goods and services. The amounts
recorded under this line item are part of the GFSM 2014 category Other taxes on use of
goods and on permission to use goods or perform activities (11452).
12. Other taxes on goods and services payable by natural resource enterprises: This item
includes taxes on the extraction of mineral fossil fuels, and other exhaustible resources from
deposits owned privately or by another government. Taxes on the extraction of exhaustible
resources usually are a fixed amount per unit of quantity or weight, but can be a percentage
of value. Payments for the extraction of exhaustible resources from deposits owned by the
government unit receiving the payment are recorded under rent. The amounts recorded
under this line item are part of the GFSM 2014 category Other taxes on goods and services
(1146).
13. Taxes on imports payable by natural resource enterprises: This items covers revenue
from all levies collected on goods because they are entering the country or services because

136
they are delivered by nonresidents to residents paid by natural resource enterprises. The
amounts recorded under this line item are part of the GFSM 2014 category Customs and
other import duties (1151).
14. Taxes on exports of natural resources: This category includes all levies on resource
commodities transported out of the country. The amounts recorded under this line item are
part of the GFSM 2014 category Taxes on exports (1152).
15. Profits of natural resource export monopolies: Governments may establish enterprises
with the exclusive right to export natural resource products to nonresidents to raise revenue
that could be gathered through taxes on exports. When such monopolies exist, the profits
remitted to governments by the monopolistic enterprise or marketing board are considered
to be taxes. Such profits are recorded as tax revenue when transferred to the government
and do not include the retained reserves of the enterprises or marketing boards. The
amounts recorded under this line item are part of the GFSM 2014 category Profits of export
or import monopolies (1153).
16. Profits received from export enterprises or marketing boards that do not represent
monopoly profits are recorded as property income (dividends). Profits transferred to the
government from public enterprises or marketing boards dealing in commodities
domestically, outside of international trade are recorded under property income (dividends,
1412) or profits of fiscal monopolies (code 1143). For further information, refer to
paragraphs 5.63-5.68 of the GFSM 2014.
17. Other taxes payable by natural resource enterprises: This item covers revenue from
taxes levied predominantly on a base or bases other not elsewhere classified under the
preceding tax headings payable by natural resource enterprises. Also included is revenue
from unidentified taxes and interest and penalties collected for late payment or non-
payment of taxes but not identifiable by tax category. Stamp taxes that do not fall
exclusively or predominantly on a single class of transactions would be included here. The
amounts recorded under this line item are part of the GFSM 2014 category Other taxes paid
solely by business (1161).
18. Social contributions: Social contributions (12) are actual or imputed receipts either from
employers on behalf of their employees or from employers, self-employed, or unemployed
persons on their own behalf that secure entitlements to social benefits for the contributors,
their dependents, or their survivors. The contributions may be compulsory or voluntary.
Social security contributions are compulsory social contributions to social security schemes.
19. Employee contributions from natural resource enterprises: These contributions are
payable directly by employees or deducted from employees’ wages and salaries and other
compensation and transferred by employers on their behalf. The amounts recorded under
this line item are part of the GFSM 2014 category Social security employee contributions
(1211).

137
20. Employer contributions from natural resource enterprises: These contributions are
payable directly by employers engaged in natural resource activities on behalf of their
employees. The amounts recorded under this line item are part of the GFSM 2014 category
Social security employer contributions (1212).
21. Other revenue: Other revenue (14) includes property income, interest, sales of goods and
services, and miscellaneous other types of revenue.10 For natural resource-based revenues,
this will predominantly be property income. Property income earned by governments from
natural resource products includes mainly rent and dividends.
22. Dividends: Dividends refer to payments to general government units, in their capacity as
shareholders in and/or owners of an enterprise, for example, as a result of placing equity
funds at the disposal of the enterprise. Equity funds do not entitle shareholders to a fixed or
predetermined income. Dividends are recorded either on the date they go ex-dividend, or if
the enterprise is 100 percent owned by government the date the dividends are payable or, if
no prior declaration occurs, on the date the payments are made.
23. General government units may receive dividends from private or public enterprises.
Distributions of profits by public enterprises may take place irregularly and may not be
explicitly labeled as dividends. Dividends include all distributions of profits by enterprises
to their shareholders or owners (except withdrawals of equity). Dividends from natural
resource enterprises are likely to take two forms: dividends from public resource
enterprises, and dividends from government participation in natural resource enterprises
(equity).
24. When payments are received from public enterprises (e.g., oil companies), it can be
difficult to decide whether they are dividends or withdrawals of equity. An enterprise
may, however, smooth the dividends it pays from one period to the next so that in some
periods it pays more in dividends than it earns from its productive activities. Withdrawals of
equity may take the form of distribution of proceeds from accumulated retained earnings
and reserves for the consumption of fixed capital.
25. A complication may arise when a government requests payment from a public
enterprise. In many cases, the government requests the enterprise to pay a dividend
that is set by the government. According to the GFSM 2014, this is not revenue if the
payments are not made from current income. These payments are a financial transaction
that should be classified as a withdrawal of equity. According to the 2008 SNA:
It is important to distinguish between the return of the equity investment by the corporation
to its owner and the payment of income in the form of dividends. Only regular distributions
from the entrepreneurial income are recorded as property income either as dividends or
withdrawals of income from quasi-corporations. Large and irregular payments, based on
10
Interest earned by governments from the investment of funds originally generated from natural resources is
not included in the template because they are not considered to constitute direct government revenues from
natural resources. Revenues earned by entities such as sovereign wealth funds are not considered to be
government revenues from natural resources.

138
accumulated reserves or sale of assets are recorded as a withdrawal of equity (2008 SNA
22.136).
26. Dividends from government owned natural resource enterprises: These are dividend
payments by public enterprises declared by the board of directors or other managers of the
enterprise of their own volition that are paid to general government. General government
will in most instances have 100 percent equity in the public enterprise. The amounts
recorded under this line item are part of the GFSM 2014 category Dividends (1412).
27. Dividends from government participation in natural resource enterprises (equity):
These are dividend payments, as described above, from natural resource enterprises where
the government has an equity position. In some cases, the government may receive dividend
payments in kind. These should be valued at the market price for the goods in kind at the
time of the transaction. The amounts recorded under this line item are part of the GFSM 2014 category Dividends (1412). Note that for in-kind transactions to be recorded under this
item, the amount should be set by the enterprise of its own volition and not mandated by the
government. If the amount of in-kind payment is predetermined or fixed, it should be
recorded under the subcategory production entitlements payable by natural resource
enterprises under the GFSM 2014 category Rent (royalties, 1415).
28. Rent is the property income received from certain leases of subsoil assets and other
naturally-occurring assets. The ownership of subsoil assets is dependent on how property
rights are defined by law. General government units may grant leases that permit other units
to extract deposits over a specified period of time in return for a payment or series of
payments. These payments are often described as “royalties,” but they are rents that accrue
to owners of the assets in return for putting the assets at the disposal of other units for
specified periods of time.11 The rents may take the form of periodic payments of fixed
amounts or, more usually, will be derived according to the quantity, volume, or value of the
asset extracted. Enterprises engaged in exploration may make payments to general
government units in exchange for the right to undertake test drilling or otherwise investigate
the existence and location of subsoil assets. Such payments are also treated as rents even
though no extraction may take place. Rents are the sum of royalties, bonuses, production
entitlements, and compulsory social infrastructure payments; and, in most cases, rent from
natural resources will be equal to the total rent revenues received by government. The
amounts recorded under this line item are part of the GFSM 2014 category Rent (1415).
29. The 2008 SNA recommends that payments by an extractor to the owner of the mineral
resources corresponding to a share of the resource rent be shown as property income,
even if they are described as taxes and treated as such in the government’s accounts. It
also recommends that when the legal owner of a mineral reserve contracts with another unit
to undertake extraction, on pragmatic grounds the resource may continue to be shown on
the balance sheet of the legal owner, with payments by the extractor to the owner treated as
property income (rent). The proper recording of rent presents practical challenges because
11 The GFSM 2014 states that when owners of a natural resource put the resource at the disposal of another
institutional unit, and this other unit can use the resource to extinction, the transaction be treated as a sale of the
resource asset.

139
payments to governments described as rent or royalties often include a mix of payments.
Some may effectively be rent and others may be taxes or fees. The latter should be
classified in the corresponding sub-category and not under rent. A further complicating
factor for the proper recording of rent is that in some cases payments to government not
described as rent or royalties (e.g. taxes, fees) should actually be classified as rent. The key
to determine whether a given payment is rent is whether the payment is made to the
government as owner of the natural resource.
30. The nonfinancial enterprises exploring and exploiting natural resources may be public
enterprises. These enterprises will reflect in their financial statements the flows and stocks
associated with their operations. These flows may include flows to and from government
units, which would not be consolidated when compiling GFS for the general government
sector, but would be subject to consolidation when compiling GFS for the public sector (or
nonfinancial public sector). A classification issue may arise concerning payments to
government by a public enterprise for the right to explore a natural resource. These
payments are treated by government as revenue (rent, 1415), and by the enterprise as an
operating expense (rent, 2814). The distribution of profits (residual between all operating
revenues and operating expenses) by the enterprise to government as owner of the
enterprise is treated as dividends by both entities (1412 and 2811, respectively).
31. Royalties payable by natural resource enterprises: Royalties are rents earned by the
government (as owner of the subsoil asset) based on the production or extraction levels
of a commodity. The royalties will usually be derived according to the quantity, volume, or
value of the asset extracted. For example, the royalty will be levied as a dollar amount per
ton (or equivalent) or as a percentage of the value of the resource extracted. The amounts
recorded under this line item are part of the GFSM 2014 category Rent (1415). If the
general government does not own the subsoil assets but similar taxes are levied, then these
payments should be recorded under Other taxes on goods and services (1146).
32. Bonuses payable by natural resource enterprises: These are payments to general
government units that are related to awards, grants, or transfer of extraction rights. These
payments are sometimes called signature, discovery, or production bonuses. In the case of
signature payments, these do not have to be linked to either the discovery or extraction of
resources. Payments can also be tied to the achievement of certain production levels or
targets. Bonus payments can also be for the discovery of additional mineral reserves or
deposits. Payments can be in the form of periodic payments or a fixed amount. Bonuses are
payments made to the government because it is the owner of the subsoil asset and has given
a corporation the right to extract the resource. The amounts recorded under this line item are
part of the GFSM 2014 category Rent (1415).
33. Production entitlements payable by natural resource enterprises: Production
entitlements are the volumes of output the general government is entitled to receive as
mandated in any agreement or license. These mandated volumes can be paid in cash or in
kind, and can be net of any other royalty payments. For in-kind payments, these should be
valued at market price (or cost of extraction). The amounts recorded under this line item are
part of the GFSM 2014 category Rent (1415).

140
34. If a public enterprise receives production entitlements from private enterprises, the
revenue from production entitlements should be attributed to the general government.
Production entitlements are generally stipulated in Production Sharing Contracts or
Production Sharing Agreements. These contracts can be with either the general government
or a government-owned corporation. In either case, the revenue from production
entitlements should be attributed to the general government. Any production entitlement
that is received by a public enterprise should be rerouted to be shown as being received by
the general government unit. The rerouting is done to properly record the underlying
economic event that it is the government as owner of the resource that is the true recipient
of the production entitlements, which it then chooses to transfer to a public enterprise.
Otherwise, the market value of the production entitlements would not be reflected in the
government accounts, which would only show the revenues eventually transferred by the
public enterprise to the government.
35. Compulsory social infrastructure payments payable by natural resource enterprises:
These are payments where natural resource enterprises are required to provide social
infrastructure as part of their contractual arrangements to exploit the resource. Payments can
either be cash or in-kind (completed infrastructure). The value of the payment should in
principle be equal to the value of the infrastructure. The amounts recorded under this line
item are part of the GFSM 2014 category Rent (1415).
36. For social infrastructure payments, the timing of the recording of the payment should
be as the work on the infrastructure is being performed. If this is not feasible, the
recording of the transaction may occur on completion of the infrastructure project, or when
ownership is handed to the government. The compulsory nature of the infrastructure
payments means that they are not grants, because grants are non-compulsory transfers.
37. Other rent. This item covers any payment to the government as owner of the resource not
included in the previous four sub-categories of rent.
38. Administrative fees for services supplied to natural resource enterprises: This item
includes fees for compulsory licenses and other administrative fees that are considered a
sale of services by government. Most are applicable to all sectors and industries of an
economy. There may be specific licenses that apply only to resource extraction. Typical
examples are licenses for specialized equipment operation or licenses linked to
qualifications to operate a mine. For these fees to be considered a sale of a service, the
general government unit must exercise some regulatory function—for example, checking
the competence or qualifications of the person concerned, checking the efficient and safe
functioning of equipment in question, or carrying out some other form of control that it
would otherwise not be obliged to do. The amounts recorded under this line item are part of
the GFSM 2014 category Administrative fees (1422).
39. Voluntary social infrastructure payments payable by natural resource enterprises:
This category includes gifts and voluntary donations from enterprises. These include
transfers for the construction or purchase of cultural centers, hospitals, museums, schools,
and theatres, and gifts of land, buildings, or intangible assets such as patents and copyrights.

141
Buildings could be extended to include roads, bridges, dams, and other civil infrastructure.
If the transfer is in the form of a gift that is a completed structure rather than a voluntary
payment for construction work, the value recorded should be at either the cost of producing
the structure or a fair market value. The amounts recorded under this line item are part of
the GFSM 2014 category Capital transfers not elsewhere classified (1442).