handbook on measuring the economic value … · our website or click on the link below to complete...
TRANSCRIPT
HANDBOOK ON MEASURING THE ECONOMIC VALUE OF TOURISM TO NATIONAL PARKS
Sally Driml and Char-lee McLennan
HANDBOOK ON MEASURING THE ECONOMIC VALUE OF TOURISM TO NATIONAL PARKS
Disclaimer The technical reports present data and its analysis, meta-studies and conceptual studies, and are considered to be of value to industry, government or other researchers. Unlike the Sustainable Tourism Cooperative Research Centre’s (STCRC’s) Monograph series, these reports have not been subjected to an external peer review process. As such, the scientific accuracy and merit of the research reported here is the responsibility of the authors, who should be contacted for clarification of any content. Author contact details are at the back of this report. The views and opinions of the authors expressed in the reports or by the authors if you contact them do not necessarily state or reflect those of the STCRC.
While all reasonable efforts have been made to gather the most current and appropriate information, the STCRC does not give any warranty as to the correctness, completeness or suitability of the information, and disclaims all responsibility for and shall in no event be liable for any errors or for any loss or damage that might be suffered as a consequence of any person acting or refraining from acting or otherwise relying on this information.
We’d love to know what you think of our new research titles. If you have five minutes to spare, please visit
our website or click on the link below to complete our online survey. STCRC Tech Report Feedback
National Library of Australia Cataloguing-in-Publication Entry Title: Handbook on Measuring the Economic Value of Tourism to National Parks/Sally Driml Author: Driml, S. (Sally) ISBNs: 9781921658457 (pbk.) 9781921658952 (pdf) Subjects: National parks and reserves—Economic aspects—Australia. Tourism—Economic aspects—Australia. Economic surveys—Handbooks, manuals, etc. Other Authors/Contributors: McLennan, Char-lee. CRC for Sustainable Tourism. Dewey Number: 333.7830994
Copyright © CRC for Sustainable Tourism Pty Ltd 2010 All rights reserved. Apart from fair dealing for the purposes of study, research, criticism or review as permitted under the Copyright Act, no part of this book may be reproduced by any process without written permission from the publisher. Any enquiries should be directed to: General Manager, Communications and Industry Extension or Publishing Manager, [email protected] First published in Australia in 2010 by CRC for Sustainable Tourism Pty Ltd Printed in Australia (Gold Coast, Queensland)
Acknowledgements Sustainable Tourism Cooperative Research Centre, established and supported under the Australian Government’s Cooperative Research Centres Program, funded this research.
ii
HANDBOOK ON MEASURING THE ECONOMIC VALUE OF TOURISM TO NATIONAL PARKS
CONTENTS
LIST OF TABLES .................................................................................................................................................. V GLOSSARY .......................................................................................................................................................... V ABSTRACT .......................................................................................................................................................... V
SUMMARY ......................................................................................................................................................... VI OBJECTIVES OF STUDY....................................................................................................................................... VI METHODOLOGY ................................................................................................................................................. VI
CHAPTER 1 .......................................................................................................................................................... 1 INTRODUCTION TO THE HANDBOOK........................................................................................................ 1
AIM OF THE HANDBOOK...................................................................................................................................... 1 AUDIENCE FOR THE HANDBOOK ......................................................................................................................... 1 WHAT THE HANDBOOK INCLUDES AND DOES NOT INCLUDE .............................................................................. 1 ROLE OF THE STCRC TECHNICAL REPORT......................................................................................................... 1 TERMINOLOGY.................................................................................................................................................... 2 STUDY METHOD.................................................................................................................................................. 2 OTHER STCRC TECHNICAL REPORTS................................................................................................................. 2
CHAPTER 2 .......................................................................................................................................................... 3 BACKGROUND TO THE ECONOMIC MEASURES .................................................................................... 3
INTRODUCTION ................................................................................................................................................... 3 SPENDING BY TOURISTS...................................................................................................................................... 3 MEASURES OF ECONOMIC CONTRIBUTION.......................................................................................................... 3
CHAPTER 3 .......................................................................................................................................................... 6 SETTING UP THE PROJECT............................................................................................................................ 6
PROJECT PARTNERS ............................................................................................................................................ 6 STEERING COMMITTEE........................................................................................................................................ 6 CONSULTATION WITH TREASURY ....................................................................................................................... 6 CONFIRMATION OF PROJECT SCOPE .................................................................................................................... 6 STEPS IN THE PROJECT ........................................................................................................................................ 7
CHAPTER 4 .......................................................................................................................................................... 8 SELECT REGIONS AND PARKS ..................................................................................................................... 8
SELECTING REGIONS TO PROVIDE STATE OR TERRITORY LEVEL RESULTS ......................................................... 8 Classifying regions ........................................................................................................................................ 8
SINGLE REGION STUDIES .................................................................................................................................... 9 SELECTING PARKS ............................................................................................................................................ 10
CHAPTER 5 ........................................................................................................................................................ 11 PREPARE AND ANALYSE POPULATION DATA ...................................................................................... 11
TOURISM REGION POPULATION DATA .............................................................................................................. 11 Obtaining the population data from NVS/IVS ............................................................................................. 12 Pooling and grouping the NVS/IVS data for reliability............................................................................... 14
USING POPULATION DATA TO DESIGN THE SURVEY ......................................................................................... 14 Stratified sampling with quotas ................................................................................................................... 14 Timing and seasonality................................................................................................................................ 15
DEVELOPING A SAMPLE AND WEIGHTING FRAMEWORK................................................................................... 15 Extracting visitor numbers from the NVS and IVS ...................................................................................... 15 Sample sizes for each stratum ..................................................................................................................... 16
iii
HANDBOOK ON MEASURING THE ECONOMIC VALUE OF TOURISM TO NATIONAL PARKS
Weighting the data....................................................................................................................................... 17
CHAPTER 6 ........................................................................................................................................................ 19 DESIGN QUESTIONNAIRE ............................................................................................................................ 19
INTRODUCTION ................................................................................................................................................. 19 QUESTIONNAIRE ELEMENTS.............................................................................................................................. 19
Introduction, orientation and selection of respondents ............................................................................... 19 Travel patterns ............................................................................................................................................ 20 Spending by respondents ............................................................................................................................. 20 National park scenarios .............................................................................................................................. 20 Demographics ............................................................................................................................................. 21 Modification for a mail back survey............................................................................................................ 21
DATABASE AND ANALYSIS DESIGN .................................................................................................................. 21 CHAPTER 7 ........................................................................................................................................................ 22 PREPARE FOR FIELD WORK ....................................................................................................................... 22
SELECTING SITES .............................................................................................................................................. 22 METHODOLOGY FOR SELECTING RESPONDENTS ............................................................................................... 22
Mail back surveys ........................................................................................................................................ 22 SAFETY ISSUES.................................................................................................................................................. 22 ETHICS .............................................................................................................................................................. 23 SELECTING AND TRAINING INTERVIEWERS ....................................................................................................... 23
CHAPTER 8 ........................................................................................................................................................ 24 CHECKLIST FOR STUDY DESIGN............................................................................................................... 24 CHAPTER 9 ........................................................................................................................................................ 25 FROM QUESTIONNAIRE TO SAMPLE MEANS........................................................................................ 25
ENTERING THE DATA ........................................................................................................................................ 25 CLEANING THE DATA........................................................................................................................................ 25 COMPARING SAMPLE RESULTS WITH POPULATION VARIABLES........................................................................ 25 CALCULATING SAMPLE MEANS ........................................................................................................................ 25
Monte Carlo simulation............................................................................................................................... 27 CHAPTER 10 ...................................................................................................................................................... 28 MEASURES OF SPENDING ............................................................................................................................ 28
NATIONAL PARK ASSOCIATED SPENDING......................................................................................................... 28 NATIONAL PARK GENERATED SPENDING.......................................................................................................... 28
Develop the ‘NP-generated factor’ ............................................................................................................. 28 Calculate NP-generated spending............................................................................................................... 29 Apply sensitivity analysis............................................................................................................................. 29
COMPARATIVE REPORTING ............................................................................................................................... 29 CHAPTER 11 ...................................................................................................................................................... 30 MEASURES OF ECONOMIC CONTRIBUTION.......................................................................................... 30
TSA AND STATE/TERRITORY LEVEL STUDIES .................................................................................................... 30 REGIONAL INPUT-OUTPUT MODELLING............................................................................................................ 31
Regional level studies .................................................................................................................................. 31 State/territory level studies.......................................................................................................................... 32
COMPARISON OF ECONOMIC VALUE OF TOURISM TO NATIONAL PARKS WITH SPENDING ON NATIONAL PARK MANAGEMENT .................................................................................................................................................. 32
CHAPTER 12 ...................................................................................................................................................... 33 INTERPRETING RESULTS FOR STAKEHOLDERS ................................................................................. 33 APPENDIX A: QUESTIONNAIRE.................................................................................................................. 34
iv
HANDBOOK ON MEASURING THE ECONOMIC VALUE OF TOURISM TO NATIONAL PARKS
REFERENCES.................................................................................................................................................... 42 AUTHORS........................................................................................................................................................... 44
List of Tables Table 1: Measures of economic contribution, what they are and when to use them_______________________ 4 Table 2: Project steps ______________________________________________________________________ 7 Table 3: The number of tourism regions in each state and territory __________________________________ 8 Table 4: Classification of tourism regions, Queensland____________________________________________ 9 Table 5: Variables to request from NVS and IVS ________________________________________________ 13 Table 6: Variables used in reweighting _______________________________________________________ 16 Table 7: Determining sample weights_________________________________________________________ 17 Table 8: Sample weights to four decimal places_________________________________________________ 17 Table 9: Sample to population based on expenditure per visitor ____________________________________ 17 Table 10: Sample to population based on expenditure per visitor night_______________________________ 18 Table 11: Total number of nights spent in the region by ‘national park/state park’ visitors _______________ 18 Table 12: Calculating spending per person for respondents _______________________________________ 26 Table 13: Calculating spending per person per night (per visitor night) for respondents _________________ 26 Table 14: Measures of direct contribution _____________________________________________________ 31 Table 15: Stakeholder groups and their interests. _______________________________________________ 33
Glossary ABS Australian Bureau of Statistics CDMOTA Compact Disk Monitor of Tourism Activity CGE Computable General Equilibrium model DRET Department of Resources, Energy and Tourism GRP/GSP/GNP Gross Regional/State/National Product GVA Gross Value Added IVS International Visitor Survey NP-associated National Park associated spending NP-generated National Park generated spending NVS National Visitor Survey QPWS Queensland Parks and Wildlife Service SPSS Statistical Package for the Social Sciences STCRC Sustainable Tourism Cooperative Research Centre TRA Tourism Research Australia TSA Tourism Satellite Account
Abstract This handbook provides clear instructions and advice on how to undertake a study to estimate the economic value of tourism to national parks, using the ‘spending by tourists’ approach. The handbook is aimed at developing regional or state/territory level estimates of spending by tourists who visit national parks, and interpreting these in ways relevant to decision makers. The handbook describes the methodology so that studies can be replicated in a consistent manner across regions and states and territories and across time.
The handbook includes a step-by-step guide to survey design, conduct and analysis to derive measures of
spending by tourists. It also includes a guide to deriving measures of economic contribution where appropriate economic models with tourism sectors are available. It includes recommendations on interpreting results to stakeholders.
v
HANDBOOK ON MEASURING THE ECONOMIC VALUE OF TOURISM TO NATIONAL PARKS
vi
SUMMARY
Objectives of Study The objective of this study was to produce a handbook to guide research into the economic value of tourism to national parks and protected areas. The handbook addresses developing both regional level and state/territory level estimates of spending by tourists who visit national parks. The handbook also provides guidance on further analysis of these measures to generate measures of economic contribution that are useful to decision makers.
Methodology Methodologies employed include; approaches to sampling, survey design and conduct and economic analysis. The rationale for methodologies recommended for placing an economic value on tourism to national parks is outlined in the accompanying STCRC technical report ‘The Economic Value of Tourism to National Parks and Protected Areas in Australia’.
Chapters in this handbook cover:
• Introduction—aims of the handbook. • Background to the economic measures—explaining direct spending measures and measures of
economic contribution. • Setting up a project—steps for setting up and managing the project. • Select regions and parks—selecting and classifying regions using tourism regions as the basis for a
study and selecting parks for the survey. • Prepare and analyse population data—using data from the National Visitor Survey (NVS) and
International Visitor Survey (IVS) to define the population of tourists who visit national parks and to inform study design including sample selection.
• Design questionnaire—designing the questionnaire to gather expenditure data, national park visit behaviour and other travel and demographic data.
• Prepare for fieldwork—a strategy to select survey respondents, selecting and training interviewers and logistical issues for fieldwork.
• A checklist for the study design—a final check that all elements of design are complete before commencing field work.
• From questionnaire to sample means—entering and cleaning the data and initial analysis to sample mean spending stage.
• Measures of spending—methodology to estimate ‘national park associated spending’ and ‘national park generated spending’.
• Measures of economic contribution—methodology to estimate measures including direct contribution to Gross State Product and direct employment.
• Interpreting results to stakeholders—strategies to improve understanding of the approach and results by stakeholders.
HANDBOOK ON MEASURING THE ECONOMIC VALUE OF TOURISM TO NATIONAL PARKS
Chapter 1
INTRODUCTION TO THE HANDBOOK
Aim of the Handbook The handbook provides a step-by-step guide to a study which adopts the ‘spending by tourists’ approach to measuring economic value of tourism to national parks. It allows for a study of national park tourism in a single sub-state region or for the compilation of state/territory level estimates, based on a representative selection of regions in the state/territory.
Both broad and narrow measures of spending by tourists can be produced in the study. The broad measure of
‘national park associated spending’ is all spending by tourists who visit national parks in a target region. The narrow measure of ‘national park generated spending’ is spending that can be most closely linked to the national park attractions as it would not have occurred if tourists did not have the opportunity to visit the parks.
Further analysis to derive measures of economic contribution such as contribution to Gross State Product
(GSP) and employment, including flow-on effects, is recommended where this is possible. This handbook covers how to undertake this estimation where there is a pre-existing suitable economic model. This is possible at the state/territory level, using published Tourism Satellite Accounts (TSA). The study also aims to produce results in a form that can be interpreted by a diverse range of stakeholders.
Audience for the Handbook The audience for the handbook is government agencies or other organisations who may wish to commission a study. It is also for practitioners who may be responsible for conducting a study and the level of detail is aimed at practitioners who are already experienced in survey design and conduct and economic analysis. It is recommended that only experienced practitioners be engaged for such a study.
What the Handbook Includes and does Not Include The handbook includes a step-by-step guide to survey design, conduct and analysis to derive measures of spending by tourists. It also includes a guide to deriving measures of economic contribution where appropriate economic models with tourism sectors are available. It includes recommendations on interpreting results to stakeholders. It does not include methodology for measuring tourists’ consumer surplus nor does it include methodology for building tourism sectors into Input-Output or Computable General Equilibrium (CGE) models or running such models.
Role of the STCRC Technical Report This handbook accompanies a STCRC technical report entitled ‘The Economic Value of Tourism to National Parks and Protected Areas in Australia’. The technical report presents considerable background that will be useful for anyone wishing to commission or undertake a study. The technical report includes:
• Chapter 1—introduction to the project and the report. • Chapter 2—a discussion of the approaches to understanding the economic value of tourism to
national parks, anchored in economic theory and current practice. A range of approaches to defining and measuring spending by tourists and the economic contribution of this spending is presented.
• Chapter 3—a review of Australian studies of the economic value of tourism to national parks and protected areas. The listing shows that studies have been undertaken in most state and territories, with most having as their subject a single national park or regional grouping of parks. The range of methodologies used has varied, thus giving relevance to this project which focuses on methodology.
1
HANDBOOK ON MEASURING THE ECONOMIC VALUE OF TOURISM TO NATIONAL PARKS
• Chapter 4—a discussion of the Queensland study which was undertaken as part of this project. This chapter focusses on why and how the study was undertaken, a summary of results and lessons learned that have been incorporated into the methodology.
• Chapter 5—background to the methodology as presented in the handbook. • Chapter 6—conclusions from the report. •
Terminology For the purposes of this handbook, the term ‘national parks’ is used as shorthand for national parks, state parks and protected natural environment areas, managed for conservation and visitor use.
The term ‘tourists’ is used in this handbook to include all visitors within the scope of the study. As defined
by the World Tourism Organisation (WTO), ‘tourism’ comprises the activities of persons travelling to and staying in places outside of their usual environment for not more than one consecutive year for leisure, business or other purposes. The usual environment consists of a certain area around his/her place of residence plus all other places s/he frequently visits (WTO 1995). Included in the Australian tourism statistics are international visitors to Australia and domestic overnight and day trips visitors in Australia. day trips, or same day visitors, are defined to include trips of a round trip distance of at least 50km, where the visitor is away from home for at least 4 hours and excluding commuting between work/school and home (Tourism Research Australia 2009a).
The handbook has been designed so that day trip visitors may be included or excluded, depending on the
purposes of the study.
Study Method The study method consists of four main phases:
• project set up • study design • collection of information by survey • analysis and reporting.
Each of these phases is critical and is described step-by-step in this handbook.
Other STCRC Technical Reports Other STCRC technical reports to refer to for background are:
• Ballantyne, R., Brown, R., Pegg, S. & Scott, N. (2008) Valuing Tourism Spend Arising from Visitation to Queensland National Parks
• Carlsen, J. & Wood, D. (2004) Assessment of the Economic Value of Recreation and Tourism in Western Australia's National Parks, Marine Parks and Forests
• Hughes. M., Jones, T., Deery, M., Wood, D., Fredline, L., Whitely, Z. & Lockwood, M.(2009) Estimating the Economic, Social and Environmental Value of Tourism to Protected Areas
• Lindberg, K. & Denstadii, J. (2004) Impact of National Park Visitation on Rural Economies and Government Expenditure in Queensland
• Tremblay, P. (2007) Economic Contribution of Kakadu National Park to Tourism in the Northern Territory
• Tremblay, P. & Carson, D. (2007) Economic Value of Tourism in Watarrka National Park • Wood, D., Glasson, J., Carlsen, J. & Hopkins, D (2006) Economic Evaluation of Tourism for
Natural Areas: development of a toolkit approach.
2
HANDBOOK ON MEASURING THE ECONOMIC VALUE OF TOURISM TO NATIONAL PARKS
Chapter 2
BACKGROUND TO THE ECONOMIC MEASURES
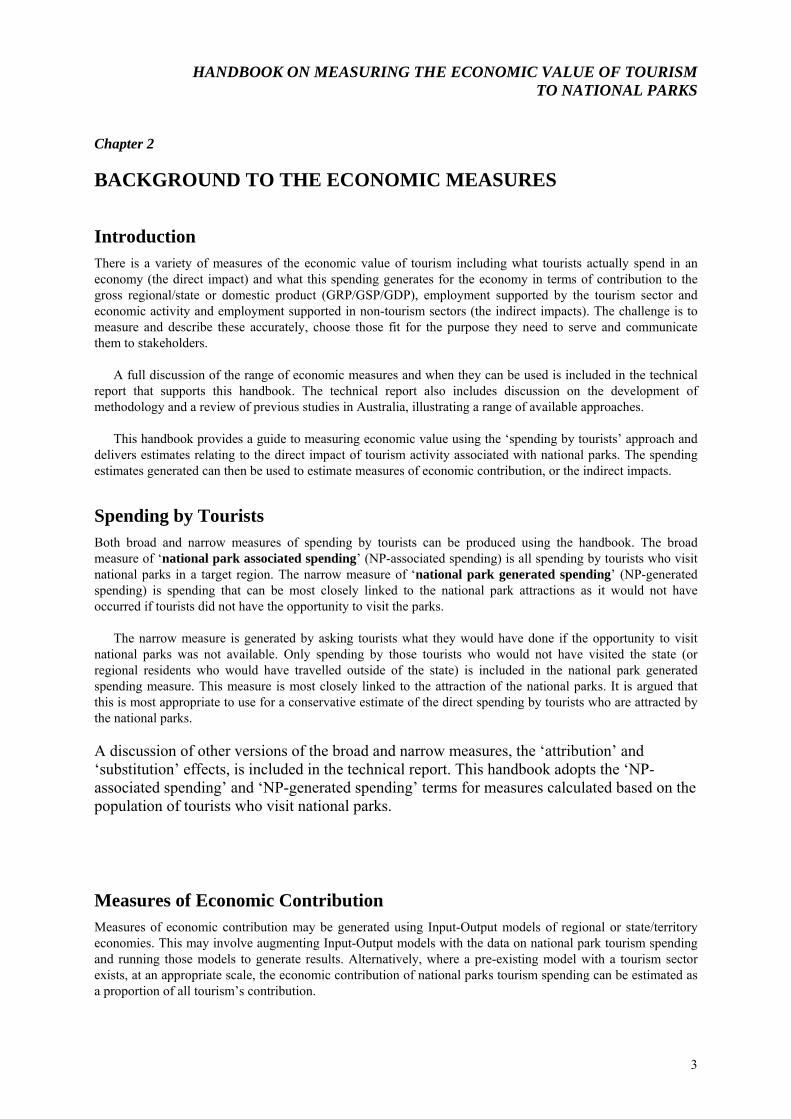
Introduction There is a variety of measures of the economic value of tourism including what tourists actually spend in an economy (the direct impact) and what this spending generates for the economy in terms of contribution to the gross regional/state or domestic product (GRP/GSP/GDP), employment supported by the tourism sector and economic activity and employment supported in non-tourism sectors (the indirect impacts). The challenge is to measure and describe these accurately, choose those fit for the purpose they need to serve and communicate them to stakeholders.
A full discussion of the range of economic measures and when they can be used is included in the technical
report that supports this handbook. The technical report also includes discussion on the development of methodology and a review of previous studies in Australia, illustrating a range of available approaches.
This handbook provides a guide to measuring economic value using the ‘spending by tourists’ approach and
delivers estimates relating to the direct impact of tourism activity associated with national parks. The spending estimates generated can then be used to estimate measures of economic contribution, or the indirect impacts.
Spending by Tourists Both broad and narrow measures of spending by tourists can be produced using the handbook. The broad measure of ‘national park associated spending’ (NP-associated spending) is all spending by tourists who visit national parks in a target region. The narrow measure of ‘national park generated spending’ (NP-generated spending) is spending that can be most closely linked to the national park attractions as it would not have occurred if tourists did not have the opportunity to visit the parks.
The narrow measure is generated by asking tourists what they would have done if the opportunity to visit
national parks was not available. Only spending by those tourists who would not have visited the state (or regional residents who would have travelled outside of the state) is included in the national park generated spending measure. This measure is most closely linked to the attraction of the national parks. It is argued that this is most appropriate to use for a conservative estimate of the direct spending by tourists who are attracted by the national parks. A discussion of other versions of the broad and narrow measures, the ‘attribution’ and ‘substitution’ effects, is included in the technical report. This handbook adopts the ‘NP-associated spending’ and ‘NP-generated spending’ terms for measures calculated based on the population of tourists who visit national parks.
Measures of Economic Contribution Measures of economic contribution may be generated using Input-Output models of regional or state/territory economies. This may involve augmenting Input-Output models with the data on national park tourism spending and running those models to generate results. Alternatively, where a pre-existing model with a tourism sector exists, at an appropriate scale, the economic contribution of national parks tourism spending can be estimated as a proportion of all tourism’s contribution.
3
HANDBOOK ON MEASURING THE ECONOMIC VALUE OF TOURISM TO NATIONAL PARKS
This handbook provides a guide to using the latter approach for state/territory level national park tourism spending using the state/territory Tourism Satellite Accounts (Pambudi, Van Ho, Spurr, Forsyth, Dwyer & Hoque, 2009). However, it is recommended that this approach only be used to produce direct effects including contribution to GSP and employment.
If the full range of measures including total effects (direct plus indirect) is required, it is recommended that
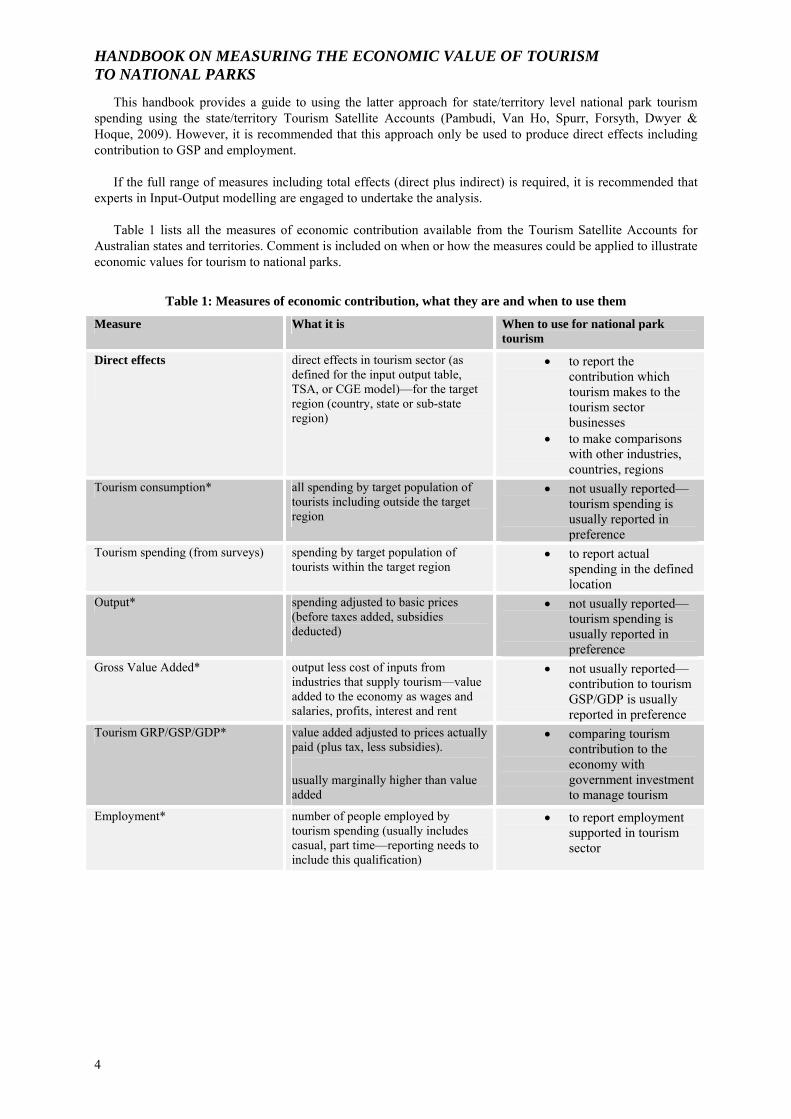
experts in Input-Output modelling are engaged to undertake the analysis. Table 1 lists all the measures of economic contribution available from the Tourism Satellite Accounts for
Australian states and territories. Comment is included on when or how the measures could be applied to illustrate economic values for tourism to national parks.
Table 1: Measures of economic contribution, what they are and when to use them
Measure What it is When to use for national park tourism
Direct effects
direct effects in tourism sector (as defined for the input output table, TSA, or CGE model)—for the target region (country, state or sub-state region)
• to report the contribution which tourism makes to the tourism sector businesses
• to make comparisons with other industries, countries, regions
Tourism consumption* all spending by target population of tourists including outside the target region
• not usually reported—tourism spending is usually reported in preference
Tourism spending (from surveys) spending by target population of tourists within the target region
• to report actual spending in the defined location
Output* spending adjusted to basic prices (before taxes added, subsidies deducted)
• not usually reported—tourism spending is usually reported in preference
Gross Value Added* output less cost of inputs from industries that supply tourism—value added to the economy as wages and salaries, profits, interest and rent
• not usually reported—contribution to tourism GSP/GDP is usually reported in preference
Tourism GRP/GSP/GDP* value added adjusted to prices actually paid (plus tax, less subsidies).
usually marginally higher than value added
• comparing tourism contribution to the economy with government investment to manage tourism
Employment* number of people employed by tourism spending (usually includes casual, part time—reporting needs to include this qualification)
• to report employment supported in tourism sector
4
HANDBOOK ON MEASURING THE ECONOMIC VALUE OF TOURISM TO NATIONAL PARKS
Measure What it is When to use for national park tourism
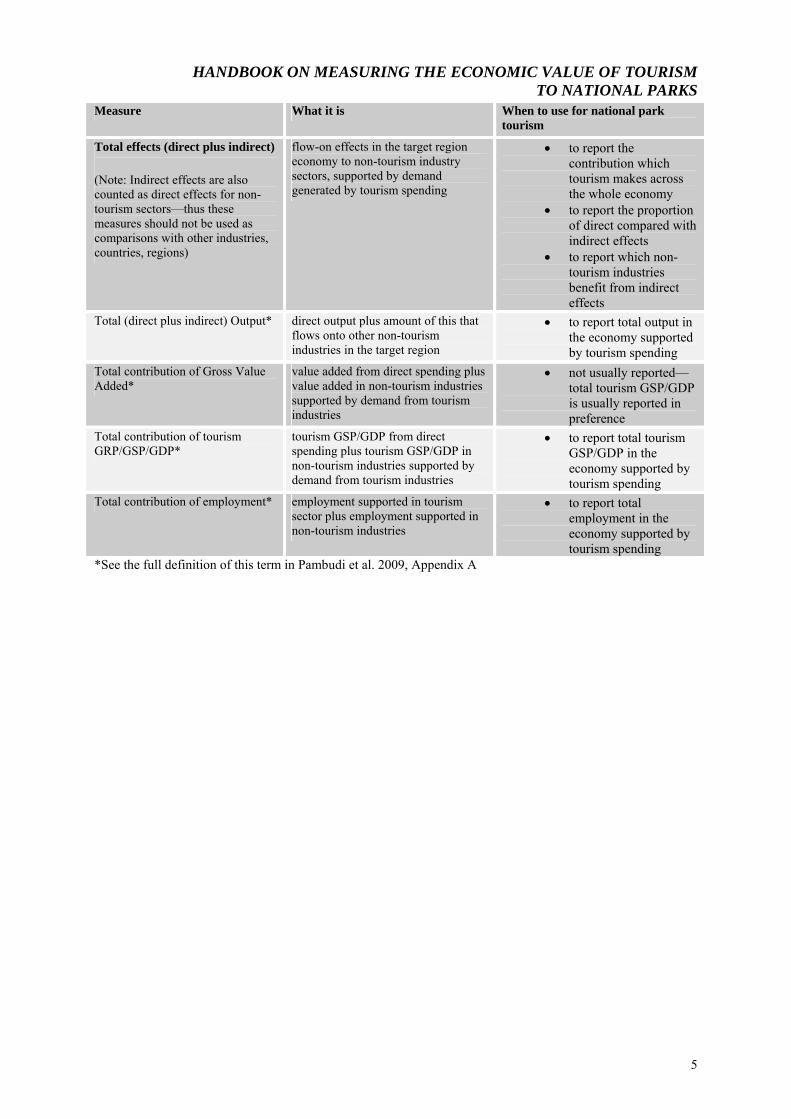
Total effects (direct plus indirect)
(Note: Indirect effects are also counted as direct effects for non-tourism sectors—thus these measures should not be used as comparisons with other industries, countries, regions)
flow-on effects in the target region economy to non-tourism industry sectors, supported by demand generated by tourism spending
• to report the contribution which tourism makes across the whole economy
• to report the proportion of direct compared with indirect effects
• to report which non-tourism industries benefit from indirect effects
Total (direct plus indirect) Output* direct output plus amount of this that flows onto other non-tourism industries in the target region
• to report total output in the economy supported by tourism spending
Total contribution of Gross Value Added*
value added from direct spending plus value added in non-tourism industries supported by demand from tourism industries
• not usually reported—total tourism GSP/GDP is usually reported in preference
Total contribution of tourism GRP/GSP/GDP*
tourism GSP/GDP from direct spending plus tourism GSP/GDP in non-tourism industries supported by demand from tourism industries
• to report total tourism GSP/GDP in the economy supported by tourism spending
Total contribution of employment* employment supported in tourism sector plus employment supported in non-tourism industries
• to report total employment in the economy supported by tourism spending
*See the full definition of this term in Pambudi et al. 2009, Appendix A
5

HANDBOOK ON MEASURING THE ECONOMIC VALUE OF TOURISM TO NATIONAL PARKS
Chapter 3
SETTING UP THE PROJECT
Project Partners This handbook assumes that the project will be commissioned by state or territory government agencies. If other arrangements are involved, the project management requirements would be similar.
Project partners in each state or territory will typically include:
• the state or territory agency responsible for management of national parks (commissioning partner) • the state or territory agency responsible for tourism (commissioning partner) • a university partner and/or a commercial consultant.
A project manager will be required. The project manager would ideally be from one of the government
agencies and will be responsible for defining the overall scope of the study (in conjunction with the Steering Committee), the project budget and engagement of consultants and ensuring regular input from the Steering Committee.
A research manager will also be required. The research manager will typically be from the university partner
or commercial consultant and will be responsible for the design and conduct of the survey, analysis of results and preparation of the report, within budget. If experts on Input-Output modelling are to be engaged to assist with the study, they should be involved at the study design phase to ensure the data collection meets the needs of the analysis.
Steering Committee A Steering Committee (SC) for the project should include all the commissioning project partners, and may also include invited experts and a treasury department representative. The project manager would typically be a member of the SC. The research manager would typically not be a member of the SC but would meet with the SC to confirm the project scope and would meet regularly with the SC to provide updates on research progress.
Consultation with Treasury Consultation with the state/territory treasury department is recommended in order to communicate the methodology, in particular the concept of the NP-generated spending measure. In addition, the treasury department should be consulted on any preferred way to present the direct spending results and which measures of economic contribution are preferred. Consultation should be at least at project commencement and at the draft report stage.
Confirmation of Project Scope It is important that project partners, in consultation with the Steering Committee and treasury department, confirm the project scope at the commencement of the project. This should be clearly communicated to the research manager.
Issues to include in the project scope are:
• geographical coverage—specified region(s) or the whole state or territory • economic measures to be produced and reported • any format and content requirements for the final report
6
HANDBOOK ON MEASURING THE ECONOMIC VALUE OF TOURISM TO NATIONAL PARKS
• timetable for the study • reporting schedule to project partners and/or Steering Committee • budget for the study.
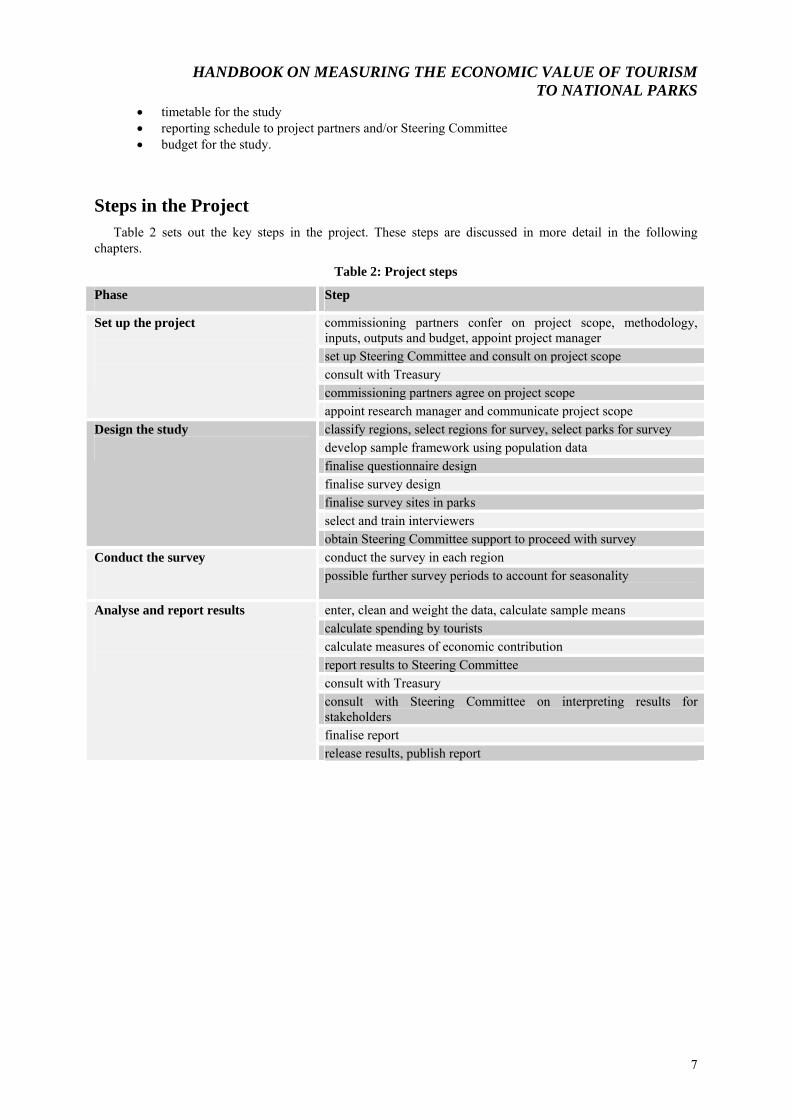
Steps in the Project Table 2 sets out the key steps in the project. These steps are discussed in more detail in the following
chapters.
Table 2: Project steps
Phase Step
commissioning partners confer on project scope, methodology, inputs, outputs and budget, appoint project manager set up Steering Committee and consult on project scope consult with Treasury commissioning partners agree on project scope
Set up the project
appoint research manager and communicate project scope classify regions, select regions for survey, select parks for survey develop sample framework using population data finalise questionnaire design finalise survey design finalise survey sites in parks select and train interviewers
Design the study
obtain Steering Committee support to proceed with survey conduct the survey in each region Conduct the survey
possible further survey periods to account for seasonality
enter, clean and weight the data, calculate sample means calculate spending by tourists calculate measures of economic contribution report results to Steering Committee consult with Treasury consult with Steering Committee on interpreting results for stakeholders finalise report
Analyse and report results
release results, publish report
7

HANDBOOK ON MEASURING THE ECONOMIC VALUE OF TOURISM TO NATIONAL PARKS
Chapter 4
SELECT REGIONS AND PARKS
Selecting Regions to Provide State or Territory Level Results If the aim of the study is to generate state/territory level estimates of spending by tourists to national parks, this could be achieved by collecting data in all regions of the state or in a sample of regions. The latter, stratified, approach is recommended as it allows for minimising cost while still ensuring good representation.
The need for a stratified approach to surveying arises from the fact that there are many parks in a state and
they vary in many ways in terms of attractiveness to tourism and resulting spending by tourists. Spending is also a function of tourism patterns in the broader region. There is a need for a representative sample of parks to develop regional and state level estimates. Ultimately, there is a need to select a sample of tourists at the park level.
The recommended approach is to stratify by classifying regions into similar sets with respect to national park tourism patterns. Then one or more regions can be drawn from each set and surveying can be undertaken in those selected regions.
Classifying regions For the purposes of developing state/territory level assessments, the recommended set of regions to use for most states and territories is the state tourism regions which are identical to the regions used for reporting the NVS and IVS data. This means that the NVS and IVS regional data can be used as population data, without any modification. Table 3 shows the number of tourism regions in each state and territory.
For most states and territories, the regions cover areas where it may be expected that tourism patterns are
internally similar. However, for Western Australia, the division of the state into only five tourism regions means that sub-tourism regions would be more appropriate for this type of study. Carlsen and Wood (2004) took the sub-regional approach in their study of two areas in Western Australia and their approach would be appropriate for other sub-regions in that state.
There are no problems in aligning tourism region boundaries with boundaries of economic models for state
and territory level assessments as tourism region spending results will be extrapolated to state and territory level results, and these can be used with state and territory TSAs to estimate measures of economic contribution (see Chapter 11).
.
Table 3: The number of tourism regions in each state and territory
State or Territory Number of tourism regions New South Wales 16 Victoria 21 Queensland 12 South Australia 13 Western Australia 5 Tasmania 7 Northern Territory 6 Australian Capital Territory 1
8

HANDBOOK ON MEASURING THE ECONOMIC VALUE OF TOURISM TO NATIONAL PARKS
For each state/territory, it will be necessary to identify and classify ‘park regional types’ in a way that reflects the tourism characteristics of the parks in the regions. Each region in the state is then allocated a classification.
An example of how to do this is drawn from the Queensland study (Ballantyne et al. 2008). For the
Queensland study, four park regional types were identified by experts from the Queensland Parks and Wildlife Service (QPWS)1 and Tourism Queensland. This was based on their expert understanding of the different types of parks and attractions and tourism use and expenditure patterns. The four types of park regions identified were: Iconic, Urban (including peri-urban), Remote and Outback. The 12 tourism regions in Queensland were then each allocated to one of the four types of park regions2. It may be relevant to identify different park regional types for different states/territories. Table 4 shows the classifications, regions and the national parks surveyed in the Queensland study.
Table 4: Classification of tourism regions, Queensland
Classification Characteristics of tourism to parks
Tourism Regions Parks surveyed
Iconic high visitor numbers, likely high attraction of visits to the region due to the existence of the parks and high average direct expenditure value
Tropical North Queensland (including Cairns), Mackay, Whitsundays, Wide Bay, Great Sandy
Cairns region parks
Urban high visitor numbers, likely low attraction of visits to the region due to the existence of the parks and average direct expenditure value
Brisbane, Gold Coast, Sunshine Coast
Gold Coast hinterland parks
Remote low visitor numbers, likely high attraction of visits to the region due to the existence of the parks and average direct expenditure value
Capricorn, Carnarvon, Townsville, Toowoomba,
Carnarvon National Park
Outback low visitor numbers, potentially low attraction of visits to the region due to the existence of the parks and average direct expenditure value
Outback Outback parks: particularly Lark Quarry and Pine Gully (Hughenden region)
Single Region Studies If a study is to focus on a single region, there will be a need to check whether the tourism region boundaries align with any pre-existing economic models with a tourism sector for the general region, or regional Input-Output models that could be used to model the economic contributions. The research will need to be designed to take account of what is available in terms of both population data and economic models. If regional boundaries do not align, there are a few options:
• select the tourism region boundaries and report only measures of spending by tourists • select the tourism region boundaries and estimate measures of economic contribution from an
economic model of a similar or overlapping region—with suitable qualifications • select regional boundaries that align with the economic model and estimate tourism population (or a
range for population).
1 At the time of that study, the Queensland Parks and Wildlife Service was a division of the Environmental Protection Agency. . In 2009, it became a division of the Department of Environment and Resource Management. 2 An additional region was also developed for the Queensland study by altering boundaries of surrounding regions. . This is not recommended as it is difficult to align population data.
9

HANDBOOK ON MEASURING THE ECONOMIC VALUE OF TOURISM TO NATIONAL PARKS
It is recommended that the third option only be chosen if expert advice supporting the population estimate is available from Tourism Research Australia (TRA) or state tourism agencies. The NVS and IVS data can be broken down to local government areas and then recombined, but sample sizes may be small and thus coding should be handled with expert care.
Selecting Parks The survey should be conducted at two or more parks in the region, in order to avoid possible bias of having only one observation per classification. The selection of parks within a region for survey purposes should be undertaken a view to representing the overall characteristics of the region. That is, if the region has been classified as predominately peri-urban, the parks chosen should be peri-urban. They can also be selected with a view to efficiency of surveying. It is best to have the expert opinion of the government agencies, and particularly local park managers, at this stage. These experts can advise on identifying parks and the best survey sites in parks. Their advice on visitor numbers and patterns and on seasonality should also be used in the study design.
10

HANDBOOK ON MEASURING THE ECONOMIC VALUE OF TOURISM TO NATIONAL PARKS
Chapter 5
PREPARE AND ANALYSE POPULATION DATA
It is recommended that the population data for tourism regions is put together before the survey design is completed and before the survey is conducted. The population data has two main uses: devising the sample framework and weighting the results. The population data should be used to design the survey framework by providing a basis to decide whether to adopt stratified quota sampling to represent particular groups and to derive a robust sample size. If a selection of particular key variables can be drawn with the ‘population’ data (this will be dependent on the sample size of the IVS/NVS), these key variables can be included in the questionnaire and used to compare the sample with the population on these variables. The population data will also be needed for weighting purposes, following the data collection, in order to undertake accurate economic analysis of spending by tourists—that is, to extrapolate from sample results to regional results.
Tourism Region Population Data The most comprehensive and nationally consistent datasets of tourism visitation that occurs within Australia are the NVS and the IVS, managed by Tourism Research Australia (TRA). These surveys provide international and domestic tourist population data to a regional and local level for Australia and delve into visitor and trip characteristics, such as purpose of visit, places visited and leisure activities undertaken.
However, raw expenditure data from the surveys are not available below the national level and instead
requires modelling for accurate estimates. These modelled expenditure estimates are only top-line annual figures and are generally confined to total expenditure by region with some limited detail by purpose of visit and place of origin (Tourism Research Australia, 2009a). Thus, for this study, there is the need to collect expenditure data for tourists who visit national parks by survey.
The population which is needed for this methodology is the population of tourists who have undertaken the
activity of visiting ‘national parks/state parks’ as defined by the NVS and IVS in the leisure activity grids. Specifically, this methodology requires total visitor numbers and nights spent in the region by domestic overnight and international visitors, who have visited a national or state park. If day trip visitors are to be included, a separate estimate of the number of national park day trip visitors for the region will be needed. The characteristics of the population can be used for developing the sampling and weighting framework.
The data at the detailed level required will need to be requested from TRA or from state tourism agencies
(who may be project partners) and is free of charge for the purpose of this project (email. [email protected]). Acquiring the data will require negotiating a signed agreement between TRA and the project researchers. The data can then be accessed using either TRA’s Compact Disk Monitor of Tourism Activity (CDMOTA) or a statistical software package, such as SAS, SPSS or STATA. As these are specialist software packages, the user would ideally be fully trained in the use of the software and have good understanding of the complex structure of the NVS and IVS data. Using CDMOTA or the datasets provides far greater flexibility when determining the population or investigating other visitor characteristics.
The NVS records the activities undertaken in each region visited by each respondent, so it is relatively
straightforward to select the respondents who undertook the selected activities. The IVS does not record the activities undertaken in each region visited for all respondents; however, this hand book suggests two methods to estimate population from the IVS data. As noted in Chapter 4, while it is most preferable to use the existing state tourism regions, it is possible to develop new regions if this aligns more with park regional types or economic models.
The NVS and IVS data can be broken down to local government areas and then aggregated to specific
requirements, but sample sizes may be small and reliability decreased. Regional specifications will need to be provided to TRA when requesting the data, or if purchasing the dataset or CDMOTA regional specifications will
11
HANDBOOK ON MEASURING THE ECONOMIC VALUE OF TOURISM TO NATIONAL PARKS
need to be carefully recoded so that the data is accurately generated. TRA may not release the data if the sample size is insufficient and this may require requesting a more highly grouped region.
Obtaining the population data from NVS/IVS To obtain NVS/IVS data for international, domestic and day visitors, it is necessary to select the number, nights and sample of visitors who undertook the activities of ‘visiting national parks/state parks’ (and possibly ‘bushwalking/rainforest walks’) averaged over five years for all regions of interest.
There are arguments for and against including the ‘bushwalking/rainforest walks’ variable. It could be
included in order to capture those tourists who may not always know whether they are ‘visiting national park/state park’. However, the ‘bushwalking/rainforest walks’ variable may capture respondents who simply walked through bushland (i.e. even in a park in the middle of a city) without the specific intent of going on these activities; particularly in the IVS where respondents may be unsure if they went bushwalking or not due to cultural or language differences. The variable also broadens the population further and implies that appropriate surveying should also take place in any area in which people could go ‘bushwalking/rainforest walks’ which may be too difficult to identify for surveying thereby reducing the representativeness of the survey. Simply using the ‘visiting national parks/state parks’ variable provides a much more defined population for surveying and weighting purposes thereby improving the reliability of the survey. A decision as to whether to include ‘bushwalking/rainforest walks’ should be made on a region by region basis, using expert knowledge and keeping in mind the need for comparability across regions.
It is possible to refine the population to those visitors whose entire trip purpose was ‘holidays and visiting
friends and relatives’3. However, as this study has a focus on actual national park visitors, the main purpose of the trip is less relevant than the choice of the tourist to visit national parks. It is recommended that all visitors, regardless of trip purpose, are included in the population and surveying.
For the NVS, the activity variables of interest can be obtained from the standard activity grid. For the IVS,
there are two methods which could be used to derive the visitor estimates. Determining which method is the most appropriate needs to be decided at the time of the data compilation based on the judgement of the expert deriving the data.
For the first method, the estimates need to be drawn from two separate questions in the IVS. The first
question on the survey which collects activity information, which includes estimates of the number of respondents that visited ‘national parks/state parks’, is the standard IVS leisure activity question, or the ‘leisure activities on trip’ variable. This variable collects activity information for the respondent’s entire trip in Australia, rather than for a particular region. For international visitors with a single stopover, the estimate of the number that visited ‘national parks/state parks’ correctly identifies the region in which it was undertaken.
However, for respondents with more than one stopover, the standard IVS leisure activity question collects
their activities for their entire trip, rather than for a particular region. To obtain location specific activities, it is necessary to draw on the ‘activity at random selected stopover’ variable in the IVS CDMOTA databases. This variable reports more detailed activity information at the local level for two randomly selected localities per respondent from 2005 to 2010. This random selector has been further complicated by having a regional bias aimed at boosting sample in the less visited regions. Thus, if the randomly selected activity variable is used, it will be necessary to reweight the randomly selected localities by visitors at the regional level.
This variable, however, also has an extra layer of complexity for determining the population statistics as it
excludes those visitors with only a single stopover and thus the single and multiple stopover respondents must be aggregated manually. Aggregating results from these two different questions may possibly introduce a bias associated with variations in responses due to different questions, combined with different treatments of the questions during the interviewing process, for example the standard trip level leisure activity question has a bias
3 To do this, the researcher would firstly need to decide if they are interested in the visitors ‘Main Purpose of Visit to/in Australia’ or the ‘Purpose of Visit to the Region of Interest’. However, this excludes some visitors at ‘‘national parks/state parks’’ which will make surveying more difficult as it will add an additional screening question to the survey, which is potentially quite complex for respondents. This screening question would need to aim to identify visitors in ‘‘national parks/state parks’’ whose trip purpose to Australia or the region was ‘Holiday and visiting friends and relatives’.
12
HANDBOOK ON MEASURING THE ECONOMIC VALUE OF TOURISM TO NATIONAL PARKS
towards the Asian market and capital cities, while the ‘activity at random selected stopover’ has a bias to regional areas. Furthermore, the ‘activity at random selected stopover’ question will be removed from the IVS in 2011 and so data is only available from 2005 to 2010.
Thus, an alternative method can be used for deriving the visitor estimates which follows a similar method to
that employed by Ballantyne, et al., (2008). This method is more a modelling technique that provides a general guide, rather than a true estimate, for visitation to the national parks. This involves deriving three estimates for the number of international visitors to the regions of interest; a maximum, a minimum and a middle estimate.
The maximum estimate represents the highest possible number of international visitors that visited a
‘national park/state park’ in the region of interest, while the minimum estimate represents the lowest possible number of international visitors that visited a ‘national park/state park’ in the region of interest. The maximum and minimum estimates can be derived by determining the total number of international visitors to the region of interest who visited a ‘national park/state park’ while in Australia (maximum estimate) and the number of international visitors to the region of interest who visited a ‘national park/state park’ and had only one stopover (minimum estimate).
The middle estimate is derived by determining for the region of interest the number of overnight stopovers by
the number of ‘outdoor or nature activities’ undertaken by international visitors. If the number of ‘outdoor or nature activities’ undertaken by international visitors in the region is equal to or greater than the number of stopovers, then the method assumes that all ‘national park/state park’ visitors could be allocated to the region. If the number of ‘outdoor or nature activities’ is less than the number of stopovers, then the number of visitors is divided by the number of stopovers.
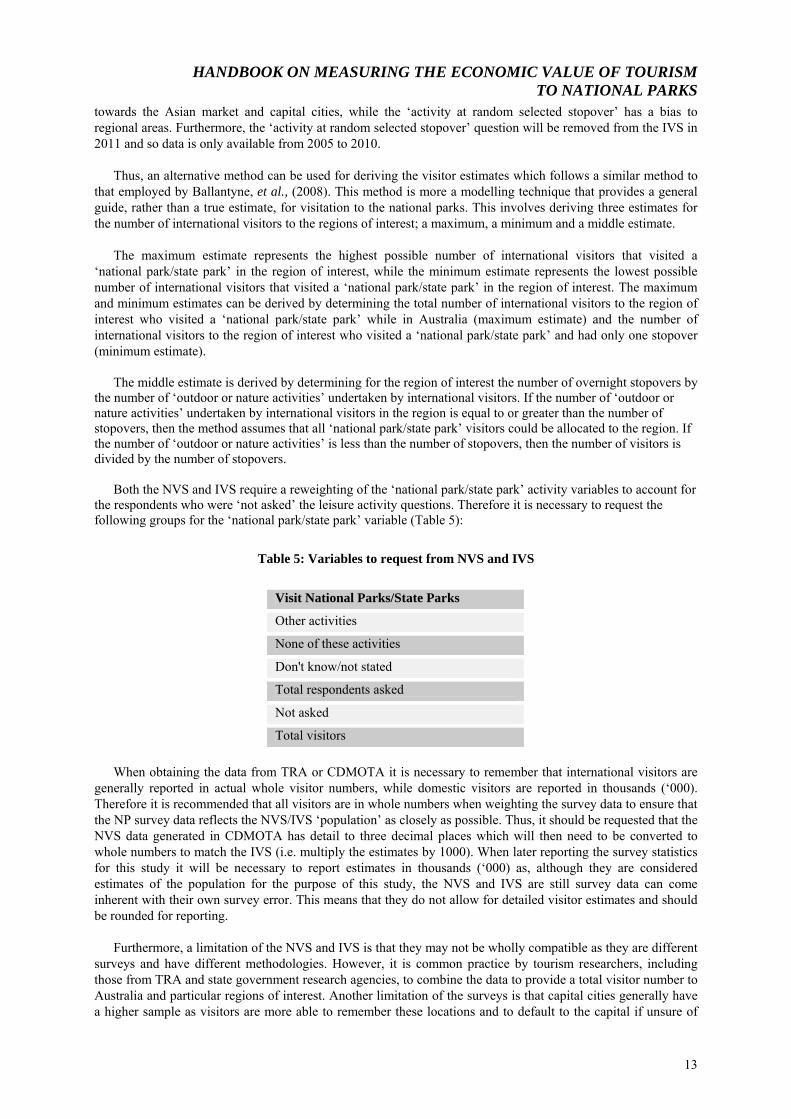
Both the NVS and IVS require a reweighting of the ‘national park/state park’ activity variables to account for the respondents who were ‘not asked’ the leisure activity questions. Therefore it is necessary to request the following groups for the ‘national park/state park’ variable (Table 5):
Table 5: Variables to request from NVS and IVS
Visit National Parks/State Parks
Other activities
None of these activities
Don't know/not stated
Total respondents asked
Not asked
Total visitors When obtaining the data from TRA or CDMOTA it is necessary to remember that international visitors are
generally reported in actual whole visitor numbers, while domestic visitors are reported in thousands (‘000). Therefore it is recommended that all visitors are in whole numbers when weighting the survey data to ensure that the NP survey data reflects the NVS/IVS ‘population’ as closely as possible. Thus, it should be requested that the NVS data generated in CDMOTA has detail to three decimal places which will then need to be converted to whole numbers to match the IVS (i.e. multiply the estimates by 1000). When later reporting the survey statistics for this study it will be necessary to report estimates in thousands (‘000) as, although they are considered estimates of the population for the purpose of this study, the NVS and IVS are still survey data can come inherent with their own survey error. This means that they do not allow for detailed visitor estimates and should be rounded for reporting.
Furthermore, a limitation of the NVS and IVS is that they may not be wholly compatible as they are different
surveys and have different methodologies. However, it is common practice by tourism researchers, including those from TRA and state government research agencies, to combine the data to provide a total visitor number to Australia and particular regions of interest. Another limitation of the surveys is that capital cities generally have a higher sample as visitors are more able to remember these locations and to default to the capital if unsure of
13
HANDBOOK ON MEASURING THE ECONOMIC VALUE OF TOURISM TO NATIONAL PARKS
regional boundaries, particularly within the IVS.
Pooling and grouping the NVS/IVS data for reliability To overcome small NVS and IVS sample sizes in some regions, the recommendation is to pool the data over five years (i.e. 2005 to 2009) and average the results. The number of years that can be pooled is currently limited as the ‘Activity at random selected stopover’ (the variable introduced to provide the locality specific information on activities) only commenced collection on the IVS in 2005. Pooling is a standard procedure for increasing the reliability of data (Wooldridge, 2006) and was the method used by TRA when developing the local government area profiles (Tourism Research Australia, 2007). It may also be necessary to combine regions to higher classifications within the NVS/IVS if the sample sizes are still too small. In general, a sample of at least 40 is required for a valid result and thus merging of regions and across years needs to be undertaken with great care.
Using Population Data to Design the Survey Stratified sampling with quotas The sample framework is a stratified sample that divides the population into strata or mutually exclusive groups that provides greater representativeness of the sample (Australian Bureau of Statistics, 2009a, 2009b). From within each stratum a fixed number (or quota) of respondents are sampled by means of random or systematic sampling. Weighting allows the sample within each stratum to equate to its population. These sub-populations are then summed to represent the entire population (Johnson & Kuby, 2000). Stratified sampling is a standard approach and is considered best practice for reducing sampling error (National Statistical Services, 2009).
Quota sampling is a form of stratified sampling where the strata are sampled in a non-random way, that is,
respondents are selected specifically to fill quotas (Australian Bureau of Statistics, 2009b). Quota sampling works well as a ‘site survey’ (Veal, 1997) and so is an appropriate tool for this study. Quota sampling predetermines the number (or quota) of people in a particular category that it is necessary to interview to obtain a representative sample. This impacts on the interviewing stage as it means that once interviewers have achieved quota in particular categories, they are then required to fill gaps in quotas by being more selective with the respondents that they interview. While quotas can occur at the strata level without affecting representativeness (due to the data being weighted), it is necessary for sampling within each stratum to be random.
As the study is aimed at measuring visitor expenditure, the most obvious grouping of respondents will reflect
different spending patterns. For Australia, spending per visitor night by domestic tourists is generally greater than by international tourists4. This suggests that at least, the sample size should be proportionate to the number of domestic and international visitor nights, which may require devising strata by nights or by origin. However, this decision should be made for each region based on the robustness of (i.e. a sample of at least 30 in a particular category) and evidence from the population data.
TRA publishes ‘modelled visitor expenditure for capital cities and regions for each state/territory’, and
‘modelled visitor expenditure in the top 20 regions’ for both domestic overnight and international visitors, on a quarterly basis (Tourism Research Australia 2009b, c). Regional expenditure and information on a number of population variables is available for all tourism regions for 2008-09 in a series of ‘regional tourism profiles’ (Tourism Research Australia 2010a). These data can be used to look at the difference between average expenditure per visitor-night for domestic and international tourists in each of these regions. Other variables in the population that could have a relationship to spending, such as age or lifecycle group, could be explored to see if there are any significant differences that warrant quota sampling.
4 In the year ending September quarter 2009, average expenditure per visitor night by international visitors was $97 (Tourism Research Australia 2009c) and for overnight domestic tourists it was $142 (Tourism Research Australia 2009b).
14
HANDBOOK ON MEASURING THE ECONOMIC VALUE OF TOURISM TO NATIONAL PARKS
For the purpose of this study, it is recommended that the strata are simply international visitors, domestic overnight visitors and domestic day trip visitors. For some regions with robust IVS/NVS sample sizes it would be possible to stratify below this level, for example by gender, age, duration of stay and purpose of visit. As mentioned above, it may be ideal to develop the strata by ‘length of visit to region’ with survey groupings being:
• 1 night • 2 nights • 3 to 7 nights • 8 to 14 nights • 15 to 27 nights • 28 or more nights.
However, due to IVS/NVS sample sizes this may not be practical and will need to be determined during the
population data generation stage.
Timing and seasonality Selection of a time(s) to conduct surveys should take into account the most efficient and cost-effective time to conduct the surveys, which would usually be at peak visitor times. The question of whether the survey can be conducted at one point in time, or needs to be staged over two or more periods, needs to be considered as part of the study design. There would be a reason to survey in more than one time period if visitor expenditure per person per night varied significantly over the year. Unfortunately TRA expenditure data is not available at the national or regional level on a quarter by quarter basis.
It is recommended that an assumption of the study is that visitor expenditure per person per night does not vary greatly throughout the year. Thus surveying at a single point in time should preferably occur during peak visitation to the national or state parks. This is the easiest and most practical assumption as collecting data for the whole year can be time consuming and expensive. However, if seasonality is an issue, it will be necessary to collect data on a monthly basis for an entire year. The decision on whether seasonality is an issue should be made based on expert regional opinion, keeping in mind additional survey costs and delayed results associated with surveying for a 12 month period.
Developing a Sample and Weighting Framework Extracting visitor numbers from the NVS and IVS The first step in developing a sample and weighting framework involves extracting the annual number of tourists to a region who visited ‘national parks/state parks’ from the NVS and IVS data bases, and adjusting the data to account for how many respondents to the NVS and IVS surveys were asked for their activities in a region. It is recommended that the population is expressed in terms of annual visitors to the region (in preference to visitor-nights) as the NVS and IVS population data are more reliable for this variable.
Generate the IVS data using ‘leisure activities on trip’ variable and possibly the ‘activities at random selected stopover’ variables depending on the method being used to derive the IVS ‘national park/state park’ data for the region of interest. Select the required filters: ‘stopover region’, the ‘number of stopovers in Australia’ (grouped as ‘one stopover’ and ‘two or more stopovers’), the activity variable of interest and the time period (e.g. Quarter one, 2005 to Quarter four, 2009) by visitors, nights and sample. If additional strata variables, such as length of stay in region, are being included, these would also need to be cross-tabulated with the above filters.
Generate the NVS data (for both domestic overnight and domestic daytrip visitors) using the following
filters: ‘leisure activities on trip’, ‘stopover region’ and the time period (e.g. Quarter one, 2005 to Quarter four, 2009) by visitors, nights and sample (or only visitors and sample in the case of daytrip visitors). Again, if additional strata variables, such as length of stay in region, are being included, these would also need to be cross-tabulated with the above filters.
Not all respondents in the IVS and NVS are asked the activities question as some respondents skip particular
questions on the surveys. Therefore, it is necessary to reweight the activity variables for both the IVS and NVS to eliminate population respondents that were ‘not asked’ the leisure activities questions. This is done by proportionately equating the total respondents asked the activities question in the region to the total number of
15

HANDBOOK ON MEASURING THE ECONOMIC VALUE OF TOURISM TO NATIONAL PARKS
visitors to the region. There is a subtle difference between the term ‘respondent’ and ‘visitor’ in the equation below which is related to whether the survey data has been fully weighted to the IVS/NVS population (visitors) or not (respondents). The formula to reweight respondents to the number of visitors is:
Reweighted total visitor numbers = (A/100)*(B/C*100)
Where, A = Total visitors to region
B = Number who responded to the activities question by each activity code C = Total respondents asked activity question
The following table (Table 6) provides conceptual clarity to the above equation:
Table 6: Variables used in reweighting
B Visit national parks/state parks
B Other activities
B None of these activities
B Don't know/not stated
C Total respondents asked
Not asked
A Total visitors to region
The above equation will allow the correct population of visitors to ‘national parks/state parks’ in each region to be determined thereby determining the appropriate population statistic for the NP survey. A quick check to ensure the reweighting calculation has worked is that the total number of respondents asked the activity question in a particular region (C) should now equal the total number of visitors to that particular region (A). You now have the population data by three (or more) strata (international, domestic overnight and domestic daytrip).
Sample sizes for each stratum To determine an appropriate sample size for each stratum it is necessary to consider budgetary issues and practicality. It would be best to consult with an expert in survey design and analysis at this stage in order to ensure objectives of the research are achieved. As a general guide, a sample size of 30 for each sub-population of interest (as determined by the project steering committee) is required to ensure a robust estimate of the segment for the NP survey. However, we recommend a sample size of 40 to be consistent with TRA sampling and to improve the robustness of the sample.
If you are interested in finding out more detail on groups within each stratum, you will require a minimum
sample size for each group. This means that if, for example, you are not just interested in what international ‘national park/state park’ visitors spent, but rather you wished to compare German international ‘national parks/state parks’ visitors’ expenditure to French international ‘national parks/state parks’ visitors, you will require a sample of 30 for each of these groups As this information is below the strata (or weighting) level you will need to collect the country information randomly, that is, without a set screening question or quota. This may mean surveying a very large number of international visitors to ‘national parks/state parks’ in order to achieve the required sample in each of these groups. Alternatively, you may be able to develop additional strata for countries of interest, however for some regions of interest the NVS/IVS data may not have sufficient sample size (n≥40) to allow the data to be weighted.
16

HANDBOOK ON MEASURING THE ECONOMIC VALUE OF TOURISM TO NATIONAL PARKS
Weighting the data Once the data has been collected it is necessary to clean and weight the data. Weighting occurs by matching the sample to the population by giving each a ‘weight’ or a proportional value of the population that they represent. Strata add extra complexity as it means that the weighting occurs at the stratum level implying that the ‘weight’ can vary between respondents depending on the stratum they fall within. Table 7 shows an example of determining the sample weights if the three strata were International, Domestic overnight and Domestic day visitors who visited ‘national parks/state parks’:
Table 7: Determining sample weights
Strata Population of ‘National
Parks/State Parks’ visitors
Sample from National Park
survey
Calculation Sample Weight
International 10,000 40 = 10,000/40 250.0 Domestic overnight 15,000 40 = 15,000/40 375.0 Domestic day 20,000 40 = 20,000/40 500.0
It is recommended that sufficient decimal places are used in the sample weight so that the addition of the
sample allows the sample weight to sum accurately to the whole population. Generally, rounding to four or more decimal places should be sufficient (Table 8).
Table 8: Sample weights to four decimal places
Strata Population of ‘National
Parks/State Parks’ visitors
Sample from National Park
survey
Calculation Sample Weight
International 10,000 41 = 10,000/41 243.9024 Domestic overnight 15,000 39 = 15,000/39 384.6154 Domestic day 20,000 42 = 20,000/42 476.1905
This sample weight is then used during analysis in order to align the sample more closely to the population
and improve representativeness. For example, if you are trying to determine total expenditure by international tourists who visited ‘national parks/state parks’, you would multiply the average expenditure (sample mean) of international tourists who visited the parks by the sample weight and the sample to determine the total population expenditure. To determine total expenditure by all visitors this calculation would need to occur for each stratum and then the total expenditure for each stratum would need to be summed to provide the total estimate. See the example in Table 9.
Table 9: Sample to population based on expenditure per visitor
Strata Sample Weight
Sample Sizea
Average per Visitor
Expenditure (Sample mean)a
Calculation Total Expenditure
International 243.9024 41 $493 = 243.9024 * 41 * 493
$4,929,999
Domestic overnight 384.6154 39 $480 = 384.6154 * 39 * 480
$7,200,000
Domestic day 476.1905 42 $98 = 476.1905 * 42 * 98
$1,960,000
Total $14,090,000 a) Estimates from the national parks survey
17

HANDBOOK ON MEASURING THE ECONOMIC VALUE OF TOURISM TO NATIONAL PARKS
Alternatively, if you know the average per visitor expenditure per night (sample mean), the calculation would
be as follows (Table 10). The data for average visitor nights spent in the region can be taken from either the NVS/IVS or from the national park survey sample. It is recommended that whichever source has the largest sample size for the region is used.
Table 10: Sample to population based on expenditure per visitor night
Strata Sample Weight
Sample Sizea
Average Visitor Nightsa
Average per Night Visitor Expenditure
(Sample mean)a
Calculation Total Expenditure
International 243.9024 41 3.4 $145 = 243.9024 * 41 * 3.4 * 145
$4,929,999
Domestic overnight
384.6154 39 3.2 $150 = 384.6154 * 39 * 3.2 * 150
$7,200,000
Domestic day 476.1905 42 $98 = 476.1905 * 42 * 98
$1,960,000
Total $14,090,000 a) Estimates from the national parks survey To calculate the total number of nights spent in the region by ‘national park/state park’ visitors, the
calculation would be (Table 11).
Table 11: Total number of nights spent in the region by ‘national park/state park’ visitors
Strata Sample Weight
Sample Sizea
Average Visitor Nights
(Sample mean)a
Calculation Total Nights
International 243.9024 41 3.4 = 243.9024 * 41 * 3.4
34,000
Domestic overnight 384.6154 39 3.2 = 384.6154 * 39 * 3.2
48,000
Total 82,000 a) Estimates from the national parks survey
18
HANDBOOK ON MEASURING THE ECONOMIC VALUE OF TOURISM TO NATIONAL PARKS
Chapter 6
DESIGN QUESTIONNAIRE
Introduction It is recommended that face to face interviews are used for this study, to maximise reliability of the data collected. The key point in designing the questionnaire is to keep it as short and simple as possible to get the information required. This study requires collection of information on what people spend when visiting the region. These questions do not take up much space on the questionnaire. However the questions can be quite onerous for both the respondent and the interviewer as they require recall and projection of spending by the respondent and checking or probing by the interviewer. Thus the questionnaire should be designed around allowing the most time for these questions.
A sample questionnaire is included at Appendix A. This sample questionnaire could be used as it is, or it may
be tailored to fit the needs of a specific study. Therefore this Chapter includes a discussion of the rationale behind the sample questionnaire, so that this can be considered if changes are contemplated. It is strongly recommended that the questionnaire not be used as a vehicle to add extra questions on issues which are not part of this economic study (for example, visitor satisfaction with national park facilities). This is because of the time required to answer the spending questions effectively and the likelihood of respondent fatigue. If extra questions are added, they should be added after the expenditure and behaviour questions, so as not to jeopardise the main purpose of the survey.
The questionnaire has five main elements and these are discussed in turn. The questionnaire has been
developed for administration by face to face interview. This could either be conducted using paper surveying or via Computer Assisted Personal Interviewing (CAPI). There are a number of easy online programs for designing CAPI surveying, for example Survey Monkey (www.surveymonkey.com). However these online programs would require the interviewer to have internet access at the time of interviewing. This could be achieved via laptop computers and wireless internet connections. Modifications for a mail back questionnaire are discussed at the end of the Chapter. It is advisable to pilot the questionnaires for interviews and mail back surveying by conducting a small number of interviews and observing respondents filling in mail back surveys, in a convenient national park.
Interviewers will have separate instructions on selecting respondents (as discussed in Chapters 5 and 7).
Questionnaire Elements Introduction, orientation and selection of respondents The questionnaire has a separate cover sheet that will be handed to respondents. It includes brief information about: the study purpose and who is conducting the study; the interview process; and contact details should respondents wish to contact the research leader or an ethics officer. The map on the reverse is important for orienting the respondent to the region of interest. Care should be taken in making the map as clear as possible. When formatting material that is meant to be read by respondents, make it easy to read by making the font larger than standard size.
The aim of the survey is to include only people who have visited, are currently visiting or are definitely
intending to visit a national park in the region. The first two screening questions are aimed at ensuring that the respondent is part of the target group and not proceeding with the interview if the respondent is not a national park tourist. The third question on whether the respondent is on a day trip or overnight stay could also be used for elimination purposes if day trips are not to be included in the study. Otherwise, this question could be used to group respondents if quota sampling of day and overnight tourists is to be used. The fourth question on origin of visitors,Australian or overseas—can also be used in quota sampling. This question could be expanded if additional strata by origin are required.
19
HANDBOOK ON MEASURING THE ECONOMIC VALUE OF TOURISM TO NATIONAL PARKS
It is important that by Question four it has been established that the respondent is in the target group for the
study and in any quota group for the sample. It is also important that the respondent has a clear idea of the region to which the survey refers.
Travel patterns The next element of the questionnaire is to gather information about travel patterns. The main reason for this is to provide information that the interviewer can use later in helping the respondent fill in the spending information. For example, if the main type of transport in the region is hire car, the interviewer can check that the cost of hire car is included in the spending tables. Thus questions are asked on; number of nights in the region, number of adults and children in the travel party, transport and accommodation.
These questions can also provide data on the characteristics of the sample that can be compared with what is
known about the population of national park tourists in the region from the NVS and IVS. However it must be remembered that the NVS and IVS data is also based on a survey approach and any mis-match between the published results of the NVS and IVS and the study survey may simply be due to this fact. Thus the data collected on the other variables should be used only as a guide to how closely the survey matched the ‘population’ on these other variables.
The questions in the sample questionnaire have been developed as an example of matching information
collection in the sample with available published information from the NVS and IVS. In this case, published information on all tourists at the regional level has been used as the population data. The Regional Tourism Profiles 2008-09 contain the most detailed published information on regional tourism and are updated annually on a financial year basis (Tourism Research Australia 2010a). This data has been compiled from the NVS and the IVS. The Regional Tourism Profiles include information on; expenditure, visitor origin, accommodation used, transport used, and trip purpose. The questions in the sample questionnaire collect information on all these topics, using the categories reported in the Regional Tourism Profiles. It should be noted that in most cases the original questions in the NVS and IVS contain more categories of information and these have been summarised for reporting in the Regional Tourism Profiles. It is recommended that the questions used in this section of the questionnaire are tailored to the regional data that is available from TRA or state tourism agencies for each study.
Spending by respondents This section of the questionnaire is likely to be the most difficult for respondents to complete. It consists of three tables. The first table will only need to be completed by respondents who are on a package holiday. The second table is about travel to the region. The third table requires detailed recall and prediction of spending while in the region.
The role of the interviewer is important in moving through the tables and ensuring that there is an answer in
each cell of the tables—even if it is a ‘$0’ for zero dollars spent on that item or a ‘nr’ for non-response. It is also important that the interviewer records the number of people that the amounts in the tables are for, and that this has been double checked with the respondent if it is different to the number of people in the travel party. Interviewers should be instructed that if a respondent states ‘don’t know’ they should probe the respondent to provide a rough estimate or best guess.
The expenditure items are the same as those in the NVS. The table has been designed to make answering as
easy as possible by asking for spending so far, and predicted spending. It is important that the interviewer records how many days the spending so far and predicted cover. The questionnaire does not collect data on major capital purchases (e.g. cars, tents) associated with the travel. While this information is collected in the NVS, it is not used in expenditure estimates.
National park scenarios This set off questions provides the information to estimate the NP-generated factor. Two questions ask about national park visits, to establish this experience in the respondents’ minds. Two questions are then asked which seek the opinion of respondent on whether they would have visited the region and the state if they did not have
20
HANDBOOK ON MEASURING THE ECONOMIC VALUE OF TOURISM TO NATIONAL PARKS
the opportunity to visit the national parks in the region. The question actually poses the scenario that the national parks are closed to visitors.
The questions included in the sample questionnaire are based on work by Carlsen and Wood (2004), Wood et
al. (2006) and Ballantyne et al. (2008). A topic for future research is the development of questions to ascertain whether respondents who said they would have visited the region and state/territory even if the national parks were closed to visitors would be likely to reduce their length of stay in the region and in the state territory. See the technical report for a discussion of this issue.
Demographics A few demographic questions round out the questionnaire. Questions should allow for comparison with population data where possible. As recommended for the travel pattern questions, the questions chosen for each study should be based on regional population data available from the TRA or state tourism agencies. However the same qualifications with regard to comparison apply.
Modification for a mail back survey The distribution of surveys for mail back to the researchers is a means of improving sample size at low cost. The interview schedule for the mail back survey will need the instructions to be written in a form that speaks directly to the respondent. These instructions should emphasise the importance of filling in all cells in the expenditure tables. A reply paid envelope will be required.
Database and Analysis Design It is advisable to design the data base for recording the data and also the steps for analysis before the questionnaire is finalised. That way, it is possible to check that all the information required for analysis is collected on the questionnaire. Also this provides a check that the questionnaire is not being used to collect data that is not required for the analysis and is therefore kept as simple as possible. The data base and steps for analysis are described in Chapter 9.
21

HANDBOOK ON MEASURING THE ECONOMIC VALUE OF TOURISM TO NATIONAL PARKS
Chapter 7
PREPARE FOR FIELD WORK
This chapter covers several issues critical to ensuring the survey will meet methodological standards and will go smoothly in the field.
Selecting Sites The advice of the national parks agency partner and local park managers is particularly important in selecting sites for efficient and safe surveying. The sites should be selected to maximise the opportunity for interviews. Good sites include picnic areas where visitors stop for a while and at the ends of walking tracks returning to car parks. Facilities close to national parks such as information centres, camping grounds or closely related accommodation centres may also be useful sites, but the interviewers must then ascertain if the potential respondent has visited or intends to visit the national park. Sites should be selected with a view to interviewer safety. Permits may be required from the national parks agency to undertake research in the national parks. The local park manager should be kept informed of the timing and progress of the survey.
Methodology for Selecting Respondents The main survey method is face to face interview. The survey uses a quota sampling method to ensure an adequate number of respondents are selected from each stratum, in this case domestic overnight visitors, international visitors and day trip visitors. It is important that selection of potential respondents within each stratum is as unbiased as possible. However, we cannot know who will visit the sites at any time, so cannot perform a truly random selection from this ‘population’. The survey technique is therefore aimed at removing as much bias as possible when selecting potential respondents from those who are visiting the site when the survey is being conducted.
This is achieved by using method such as approaching every third (or other number) person who passes a
certain point, or approaching the next person who passes that point after the previous interview is completed. Most people travel to national parks in groups, and only one spokesperson for each group is required for the interview. Once a person in a group is approached for an interview, it is common for another person to put themselves forward as a spokesperson. Selection of that ‘self appointed’ spokesperson may affect the individual demographic variables (for example if females tend to want to be the spokespersons) but should not affect the expenditure data. If the demographic variables are important to the study, the interviewer should keep strictly to selection of every third (or other number) person and point out that the methodology requires them to be the spokesperson.
The aim of reducing bias should be explained to interviewers and they should be trained to always keep
strictly to the selection method.
Mail back surveys It is difficult to control for bias in that the people most interested will participate and follow through with mailing a response. This must be kept in mind in interpreting the results, particularly demographic variables.
Safety Issues It is important to maintain the safety of interviewers. The following should be observed:
• avoid isolated sites where possible
22

HANDBOOK ON MEASURING THE ECONOMIC VALUE OF TOURISM TO NATIONAL PARKS
• interview in pairs • provide a reliable vehicle • provide a reliable mobile phone with coverage • a survey supervisor should know where all interviewers are at all times • advise the local park manager of where and when the survey is being conducted.
Ethics The project will typically need ethics clearance from the university partner’s institution. Ethical issues will be minimised by doing the following:
• select respondents over 18 years age • advise respondents of the purpose of the survey, who is conducting it and the project partners (this can
be on a hand out sheet with the research leader’s name and contact number) • advise respondents that the survey is voluntary and anonymous • take no records of respondents’ identity • advise respondents that they need not answer any question that causes them discomfort and that they
may withdraw from the survey at any time • advise respondents that they may contact the University Ethics Officer if they have any issues.
Selecting and Training Interviewers A key criterion for selecting interviewers is that they must be prepared to travel to national park areas and to stay in the area for the required time (generally five to ten days). They must be prepared to be neatly presented in the field and able to approach any potential respondent with confidence.
Training should include background on the project, logistical, safety and ethics issues. Interviewers should be
trained to select respondents according to the survey design, including where quota sampling is used. Training for administering the questionnaire should emphasise the questions asking for the amount that respondents have spent or intend to spend on the various categories of goods and services in the region. The interviewer will need to understand what is required of this question and be able to probe and cross check answers in order to complete this question as well as possible.
23

HANDBOOK ON MEASURING THE ECONOMIC VALUE OF TOURISM TO NATIONAL PARKS
Chapter 8
CHECKLIST FOR STUDY DESIGN
Before going into the field to conduct the survey, the following steps should have been completed:
□ regions classified, survey regions selected and parks selected
□ sites for surveying selected in consultation with local park managers
□ population data analysed for information relevant to study design
□ questionnaire finalised
□ database design and methodology for analysis finalised
□ sample size and quotas finalised
□ survey timing finalised in consultation with local park managers
□ respondent selection method finalised
□ logistics and supervision for survey finalised
□ interviewers selected and trained
□ Steering Committee support for the study design and approval to proceed to survey stage obtained
24
HANDBOOK ON MEASURING THE ECONOMIC VALUE OF TOURISM TO NATIONAL PARKS
Chapter 9
FROM QUESTIONNAIRE TO SAMPLE MEANS
Entering the Data The data from the questionnaire should be entered into a data base suitable for analysis using Statistical Package for the Social Sciences (SPSS) or a similar package. The code book for entering data should be pre-designed in association with finalising the questionnaire. The steps and tables for analysis in SPSS should also be pre-designed in association with finalising the questionnaire. Records for each surveyed region should be kept together for separate analysis for each region.
Cleaning the Data For this study, it has been emphasised that interviewers should be trained to make sure that no cells in the spending tables are left blank. Each cell in the spending tables should either have a number for dollars spent, a zero if the expenditure was nil or ‘nr’ for don’t know, or no response. In this case, any cells that are blank should be coded as ‘nr’ at this stage.
Comparing Sample Results with Population Variables The sample questionnaire includes a number of questions about travel patterns and demographics. As noted in Chapter 6, these were selected to match variables in the NVS and IVS and in particular, those reported in the Regional Tourism Profiles 2008-09 (Tourism Research Australia 2010a). Results of questions on origin, purpose, accommodation used and transport can be used to compare sample results with published results for all tourism in the region. However, the most relevant comparisons are between sample results and the population for all tourists in the region who visited a national park. It has been emphasised that for each study, the questionnaire should be designed around whatever regional data on the population of visitors to national parks is able to be obtained from TRA or state tourism agencies.
Calculating Sample Means This section shows how to calculate two sample means; mean spending per person in the region and mean spending per person per day/night. Mean spending per person in the region (that is for their whole time in the region can then be multiplied by population data on total visitors to the region—to get total expenditure. Mean spending per person per day/night is used if the population data are in visitor nights.
These means should be calculated separately for day trip, domestic overnight and international visitors.
Airfares nominated by respondents are not included as these are generally allocated to capital city regions. This will lead to a conservative estimate of regional spending. Table 12 shows the steps to calculate spending per person for respondents that is for each record in the sample) and Table 13 shows the steps to calculate spending per person per night for respondents.
25
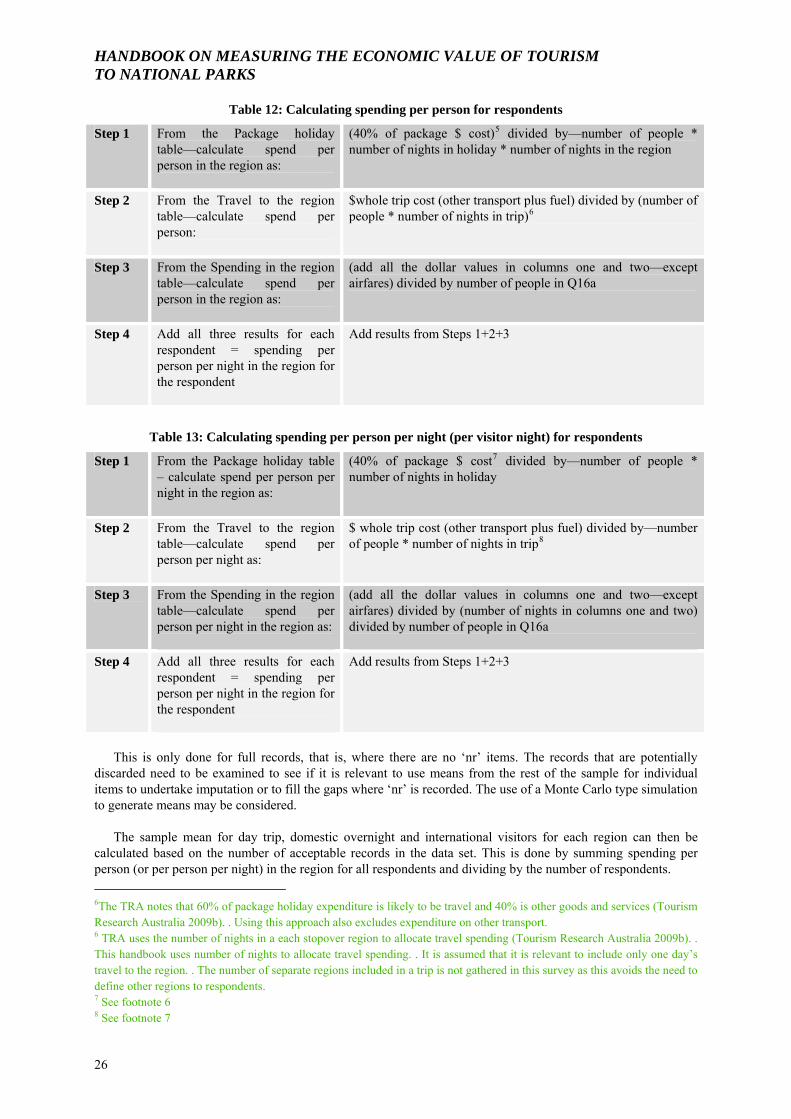
HANDBOOK ON MEASURING THE ECONOMIC VALUE OF TOURISM TO NATIONAL PARKS
Table 12: Calculating spending per person for respondents
Step 1 From the Package holiday table—calculate spend per person in the region as:
(40% of package $ cost)5 divided by—number of people * number of nights in holiday * number of nights in the region
Step 2 From the Travel to the region table—calculate spend per person:
$whole trip cost (other transport plus fuel) divided by (number of people * number of nights in trip)6
Step 3 From the Spending in the region table—calculate spend per person in the region as:
(add all the dollar values in columns one and two—except airfares) divided by number of people in Q16a
Step 4 Add all three results for each respondent = spending per person per night in the region for the respondent
Add results from Steps 1+2+3
Table 13: Calculating spending per person per night (per visitor night) for respondents
Step 1 From the Package holiday table – calculate spend per person per night in the region as:
(40% of package $ cost7 divided by—number of people * number of nights in holiday
Step 2 From the Travel to the region table—calculate spend per person per night as:
$ whole trip cost (other transport plus fuel) divided by—number of people * number of nights in trip8
Step 3 From the Spending in the region table—calculate spend per person per night in the region as:
(add all the dollar values in columns one and two—except airfares) divided by (number of nights in columns one and two) divided by number of people in Q16a
Step 4 Add all three results for each respondent = spending per person per night in the region for the respondent
Add results from Steps 1+2+3
This is only done for full records, that is, where there are no ‘nr’ items. The records that are potentially
discarded need to be examined to see if it is relevant to use means from the rest of the sample for individual items to undertake imputation or to fill the gaps where ‘nr’ is recorded. The use of a Monte Carlo type simulation to generate means may be considered.
The sample mean for day trip, domestic overnight and international visitors for each region can then be
calculated based on the number of acceptable records in the data set. This is done by summing spending per person (or per person per night) in the region for all respondents and dividing by the number of respondents. 6The TRA notes that 60% of package holiday expenditure is likely to be travel and 40% is other goods and services (Tourism Research Australia 2009b). . Using this approach also excludes expenditure on other transport. 6 TRA uses the number of nights in a each stopover region to allocate travel spending (Tourism Research Australia 2009b). . This handbook uses number of nights to allocate travel spending. . It is assumed that it is relevant to include only one day’s travel to the region. . The number of separate regions included in a trip is not gathered in this survey as this avoids the need to define other regions to respondents. 7 See footnote 6 8 See footnote 7
26
HANDBOOK ON MEASURING THE ECONOMIC VALUE OF TOURISM TO NATIONAL PARKS
If the sample size achieved is too small to treat domestic overnight and international visitors separately, they
should be treated as one data set and average spend per visitor-night calculated. If the sample size achieved for day trips is too small, day trips should not be included in further analysis.
Outliers in the data should then be excluded from analysis and the sample means recalculated. A standard
rule is to exclude outliers more than two standard deviations from the mean. Stynes and White (2006) note that it is typical for expenditure by visitors to natural environment recreation sites to have a skewed pattern and that it is typical to have some quite high expenditure observations. This may be rectified by removing outliers.
Monte Carlo simulation The data should be checked for variance around the mean. If there is any uncertainty about results arising
from calculation of sample means, analysis using a Monte Carlo type probability simulation to generate expected means can be undertaken using @RISK software (see Ballantyne et al. 2008). This analysis can use the minimum and maximum records and the sample mean, mode or median.
27
HANDBOOK ON MEASURING THE ECONOMIC VALUE OF TOURISM TO NATIONAL PARKS
Chapter 10
MEASURES OF SPENDING
This chapter covers the steps required to develop the measures of spending by tourists. Two measures are produced. The broad measure of NP-associated spending is all spending by tourists who visit national parks in a target region. The narrow measure of NP-generated spending is spending that can be most closely linked to the national park attractions as it would not have occurred if tourists did not have the opportunity to visit the parks. The steps include how to producing the measures for a single region or for a state and territory
National Park Associated Spending The population data has already been compiled for either the single region or for all regions in the state or territory (see Chapter 5). It is in the form of the number of visitors to a region or visitor nights to a region- per annum by tourists who visit national parks in that region (the population). The sample mean spending per visitor-night for each region surveyed (the sample mean) has already been estimated (see Chapter 9). If the sample sizes are sufficient, domestic overnight and international tourists are analysed separately, or alternatively these are combined. day trips are analysed separately.
For each region surveyed, the NP-associated spending is calculated by using the sample weighting approach
described in Chapter 5. See Tables 9 and 10 which illustrates the approach using the sample mean spend per visitor and sample mean spend per visitor night.
For a single region study, add together results for domestic overnight, international and day trip tourists and
this is the NP-associated spending result. For state and territory level estimates, for the regions surveyed, the population estimate is made using the
sample weighting approach. For the regions not surveyed in a particular state/territory, the sample mean for each regional type is allocated to all regions of that type (for example the mean for the ‘remote’ region surveyed is applied to all ‘remote’ regions). These sample means are simply multiplied by the population of visitors or visitor nights for each region. This is undertaken separately for domestic overnight, international and day trip tourists. The sum of these regional totals, for all three tourist strata, is the state or territory total NP-associated spending.
National Park Generated Spending Develop the ‘NP-generated factor’ The NP-generated factor is the proportion of respondents who reported that they would not have visited (a) the region for a single region study or (b) the state or territory for a state or territory level study. The spending by this proportion of respondents is the NP-generated spending.
The NP-generated factor is developed from the set of questions on what respondents said they would have
done if they were not able to visit the national parks in the region in which they were interviewed. As noted in Chapter 6, the questions take into account whether the purpose is a single region study or state and territory level study.
The questions for the state or territory level are: A) If the national parks in this region (please refer to map) were closed to visitors, would you have chosen to visit this region anyway?
(a) yes (b) no
28
HANDBOOK ON MEASURING THE ECONOMIC VALUE OF TOURISM TO NATIONAL PARKS
B) If you answered ‘no’ at question A, what would you have done instead of visiting this region? (Please tick one box only)
(a) stayed at home (b) travelled elsewhere in this state (name state) (c) travelled to another state (d) travelled to another country
Respondents who answered (b) ‘no’ to question A and answered (a) or (c) or (d) to question B, are included
in the sample of NP-generated respondents. The NP-generated factor is calculated for each region surveyed by selecting the NP-generated respondents from the data set and adding up the number of these responses. This number is then divided by the total number of responses for each region and expressed as a percentage.
Results of previous studies have generally found the NP-generated factor to be less than 20 percent of all
respondents. There is a discussion of results of previous studies in the technical report and it is cautioned that generalisations should not be drawn based on the few studies undertaken to date.
Calculate NP-generated spending The NP-generated factors from the surveyed regions are allocated to each region according to region type. The percentage is then applied to the NP-associated spending for each region. Regional totals are summed to a state or territory level total.
Note that for a single region study, the results refer to the spending in the region that would not have
occurred if tourists did not have the opportunity to visit the parks. For a state/territory level study the results for each region refer to the spending in the state that would not have occurred if tourists did not have the opportunity to visit the parks, and is likely to be a smaller amount.
Apply sensitivity analysis If there are any variables (mean, population, NP-generated factor) for which a set of alternative values is used (for example a low and high estimate of population), sensitivity analysis should be applied. This can be done by applying a Monte Carlo type simulation. The ranges of possible values for total spending (at the 90% confidence interval) can be estimated for each of the alternative variable values and compared. If the bands overlap the results can be considered relatively insensitive to the choice of alternative variable.
Comparative Reporting The current total tourism spending in the state or territory is available from published sources including TRA and state tourism agencies. These sources also have current published information for some regions (for example TRA publishes spending for the top 20 regions in Australia), but up to date results for other regions may need to be requested. The NP-associated and NP-generated spending can be reported as a percentage of that spending. It should be made clear whether day trip spending is included or not in the comparisons made.
29

HANDBOOK ON MEASURING THE ECONOMIC VALUE OF TOURISM TO NATIONAL PARKS
Chapter 11
MEASURES OF ECONOMIC CONTRIBUTION
Measures of economic contribution provide additional information about the significance of the national park tourism spending. The measures of economic contribution that may be of interest to the various stakeholders are discussed in Chapter 2. The full set of measures generated in the study can be put before decision makers. An approach of generating total regional effects using a broad measure of spending has been accepted for many years in one state. However, advice from at least one state treasury department to researchers indicates that the narrow type of measure which most closely links tourist spending in the state to the attraction of the national parks is preferred (Carlsen and Wood 2004). Another state treasury department has indicated that it prefers the direct contribution to GSP as a measure of economic contribution (Ballantyne et al. 2008).
This chapter firstly provides a guide to the generation of state/territory level estimates of direct economic
contribution using expenditure data from the survey and state/territory level TSA. The chapter then discusses the approach of using tourism expenditure data with regional Input-Output tables, for regional estimates or to model indirect effects for state/territory level estimates.
TSA and state/territory level studies Tourism Satellite Accounts (TSA) are published for each state and territory and Australia as a whole for 2007–08 (Pambudi et al 2009a). These contain the following measures for the whole tourism sector, based on expenditure by all tourists, in each jurisdiction
• tourism consumption (dollars) • tourism direct output (dollars) • tourism direct gross value added (GVA) (dollars) • tourism direct gross state/national product (GSP,GDP) (dollars) • tourism direct employment (jobs) • tourism total GVA (dollars) • tourism total GSP, GDP (dollars) • tourism total employment (jobs).
The TSA provide a basis for estimating the contribution of the spending by national park tourists, using some
of these measures. A method of making that estimate is outlined here. The method relies on the assumption that the pattern of spending by tourists who visit national parks, whose spending makes up the NP-associated and NP-generated measures of spending, is roughly the same as the pattern of spending by all tourists. It also relies on the assumption that the level of imports to a state or territory to support tourists who visit national parks is roughly the same as for all tourists to the state or territory. It assumes no particular distortion due to the regional distribution of tourists who visit national parks relative to the regional distribution of all tourists. These assumptions could be explored by comparing results of the study on a region by region basis with estimates for the population of all tourists in the region.
Measures of direct contribution Provided that the assumptions seem reasonable, the direct measures of economic contribution can be estimated from the TSA data. This is done by comparing NP-associated spending and NP-generated spending with state or territory level tourism consumption. These figures are all in purchasers’ prices so can be compared. However it should be noted that the national park spending estimates generated using the NVS and IVS approach may be somewhat lower than actual consumption for international visitors used in the TSA9, but the difference is not
9 The total expenditure data estimated by the IVS does not fully reflect the TSA consumption estimates. . This is because the IVS ‘Spend in Australia’ excludes some components that are considered necessary for the TSA (i.e. some components of package or international airfare expenditure that eventually flows on to the Australian economy). . TRA therefore generate
30

HANDBOOK ON MEASURING THE ECONOMIC VALUE OF TOURISM TO NATIONAL PARKS
considered significant in terms of this approach. The proportions that NP-associated spending and NP-generated spending are of total tourism consumption
are calculated and these proportions are applied to the other measures of economic contribution to give the estimates. The method is outlined in Table 14. The shaded columns show how the estimates are calculated.
The resulting estimates should be reported with the qualification that they are based on the assumptions of
similar patterns of spending and imports as for all tourism to the state or territory.
Table 14: Measures of direct contribution
Measure TSA measure for state or territory#
NP-associated spending (from study)
Proportion y%
Estimated NP-associated economic contribution
NP-generated spending (from study)
Proportion z%
Estimated NP-generated economic contribution
Tourism consumption
$A $W ($W/$A)*100 $W $X ($X/$A)*100 $X
Tourism output
$B ($B*y)/100 ($B*z)/100
Tourism GVA
$C ($C*y)/100 ($C*z)/100
Tourism GSP
$D ($D*y)/100 ($D*z)100
Tourism employment
E jobs (E jobs*y)/100
(E jobs*z)/100
Note: from Pambudi et al. 2009a.
Measures of direct plus indirect contribution The TSA include measures of direct contribution to the tourism sector plus contribution to non-tourism sectors in the economy. Together these provide measures of ‘total’ contribution. The multipliers generated for the TSA are shown in Appendix B of Pambudi et al. (2009).
However, it is recommended that these estimates are not made at the state and territory level for national park
tourist spending. This is because the assumptions of similarity of patterns of spending and imports are more difficult to substantiate where the extra modelling needed to estimate flow on effects is involved. The flow on effects will vary from region to region based on the economic structure of regions, adding to a state level effect. The survey provides no information on inter regional trade and regional imports and so it is difficult to support an assumption of similarity to total tourism in the state or territory.
Regional Input-Output Modelling Regional level studies A standard approach to estimating regional economic impacts or measures of contribution is to augment existing regional Input-Output tables (which generally do not have a separate ‘tourism sector’) with data on tourism spending. This data needs to be adjusted to be expressed in basic values and imports to the region are excluded. Methodology this type of analysis is described in Gillespie Economics and BDA Group (2009) and Centre for Agricultural and Regional Economics (2006). It is recommended that experts in this type of analysis be engaged to undertake this exercise.
the Total Inbound Economic Value (TIEV) which is a reflection of the TSA, using a modeling approach (Tourism Research Australia, 2010b).
31
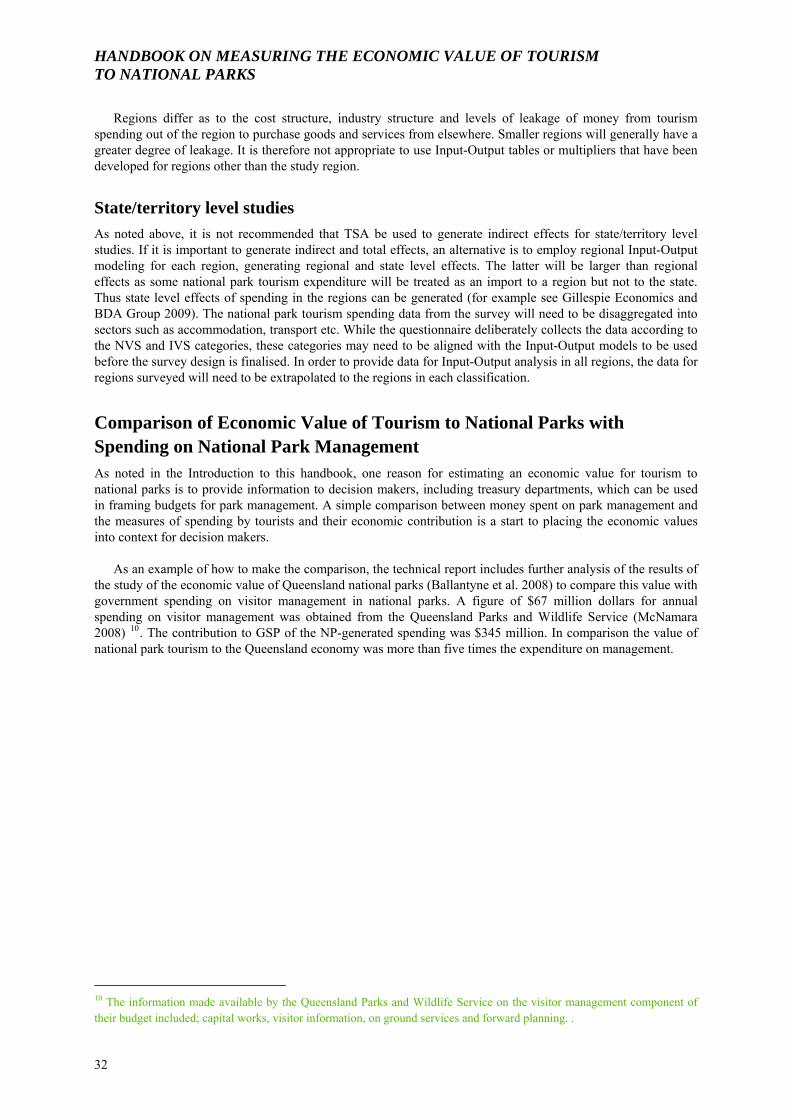
HANDBOOK ON MEASURING THE ECONOMIC VALUE OF TOURISM TO NATIONAL PARKS
Regions differ as to the cost structure, industry structure and levels of leakage of money from tourism
spending out of the region to purchase goods and services from elsewhere. Smaller regions will generally have a greater degree of leakage. It is therefore not appropriate to use Input-Output tables or multipliers that have been developed for regions other than the study region.
State/territory level studies As noted above, it is not recommended that TSA be used to generate indirect effects for state/territory level studies. If it is important to generate indirect and total effects, an alternative is to employ regional Input-Output modeling for each region, generating regional and state level effects. The latter will be larger than regional effects as some national park tourism expenditure will be treated as an import to a region but not to the state. Thus state level effects of spending in the regions can be generated (for example see Gillespie Economics and BDA Group 2009). The national park tourism spending data from the survey will need to be disaggregated into sectors such as accommodation, transport etc. While the questionnaire deliberately collects the data according to the NVS and IVS categories, these categories may need to be aligned with the Input-Output models to be used before the survey design is finalised. In order to provide data for Input-Output analysis in all regions, the data for regions surveyed will need to be extrapolated to the regions in each classification.
Comparison of Economic Value of Tourism to National Parks with Spending on National Park Management As noted in the Introduction to this handbook, one reason for estimating an economic value for tourism to national parks is to provide information to decision makers, including treasury departments, which can be used in framing budgets for park management. A simple comparison between money spent on park management and the measures of spending by tourists and their economic contribution is a start to placing the economic values into context for decision makers.
As an example of how to make the comparison, the technical report includes further analysis of the results of
the study of the economic value of Queensland national parks (Ballantyne et al. 2008) to compare this value with government spending on visitor management in national parks. A figure of $67 million dollars for annual spending on visitor management was obtained from the Queensland Parks and Wildlife Service (McNamara 2008) 10. The contribution to GSP of the NP-generated spending was $345 million. In comparison the value of national park tourism to the Queensland economy was more than five times the expenditure on management.
10 The information made available by the Queensland Parks and Wildlife Service on the visitor management component of their budget included; capital works, visitor information, on ground services and forward planning. .
32
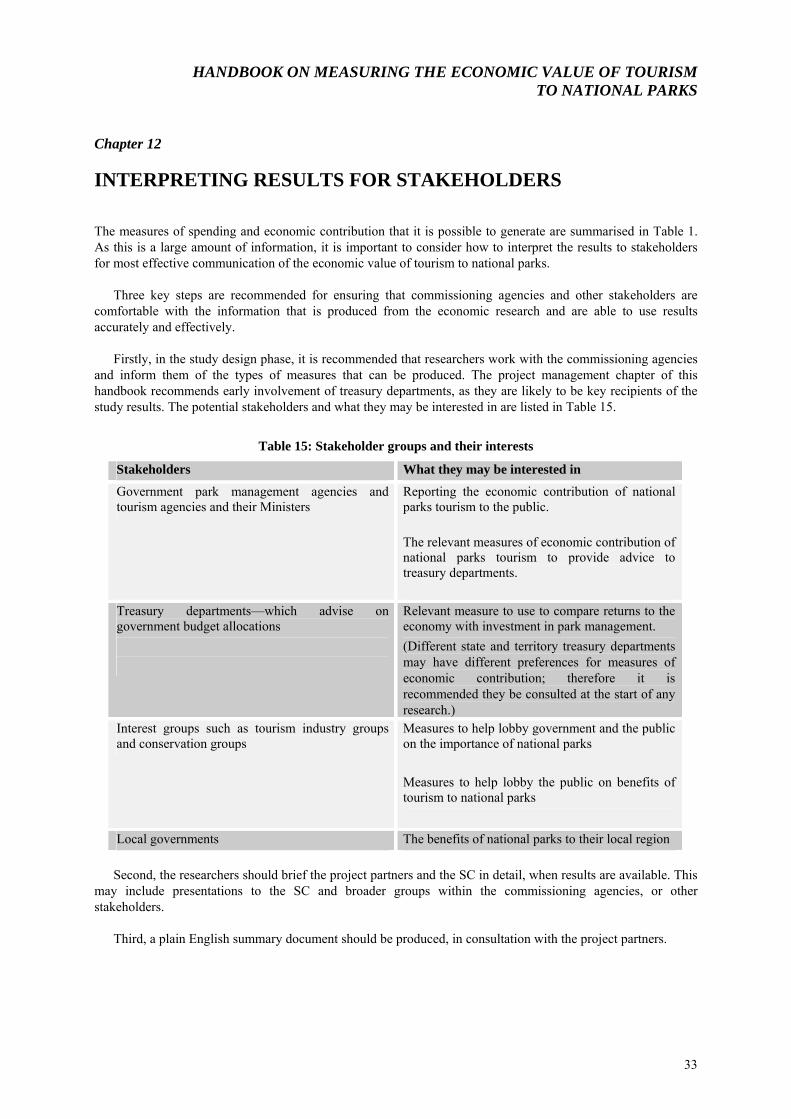
HANDBOOK ON MEASURING THE ECONOMIC VALUE OF TOURISM TO NATIONAL PARKS
Chapter 12
INTERPRETING RESULTS FOR STAKEHOLDERS
The measures of spending and economic contribution that it is possible to generate are summarised in Table 1. As this is a large amount of information, it is important to consider how to interpret the results to stakeholders for most effective communication of the economic value of tourism to national parks.
Three key steps are recommended for ensuring that commissioning agencies and other stakeholders are
comfortable with the information that is produced from the economic research and are able to use results accurately and effectively.
Firstly, in the study design phase, it is recommended that researchers work with the commissioning agencies
and inform them of the types of measures that can be produced. The project management chapter of this handbook recommends early involvement of treasury departments, as they are likely to be key recipients of the study results. The potential stakeholders and what they may be interested in are listed in Table 15.
Table 15: Stakeholder groups and their interests
Stakeholders What they may be interested in
Government park management agencies and tourism agencies and their Ministers
Reporting the economic contribution of national parks tourism to the public.
The relevant measures of economic contribution of national parks tourism to provide advice to treasury departments.
Treasury departments—which advise on government budget allocations
Relevant measure to use to compare returns to the economy with investment in park management. (Different state and territory treasury departments may have different preferences for measures of economic contribution; therefore it is recommended they be consulted at the start of any research.)
Interest groups such as tourism industry groups and conservation groups
Measures to help lobby government and the public on the importance of national parks Measures to help lobby the public on benefits of tourism to national parks
Local governments The benefits of national parks to their local region Second, the researchers should brief the project partners and the SC in detail, when results are available. This
may include presentations to the SC and broader groups within the commissioning agencies, or other stakeholders.
Third, a plain English summary document should be produced, in consultation with the project partners.
33

HANDBOOK ON MEASURING THE ECONOMIC VALUE OF TOURISM TO NATIONAL PARKS
APPENDIX A: QUESTIONNAIRE
Questionnaire cover sheet
Handout cover sheet. On the reverse, this will have a map of the region with region name, main towns, all national parks, and regional boundary clearly marked.
National Parks Tourism Study—XXXX region
A study of the economic significance of tourism to national parks and other protected areas is being
undertaken by (name of research partners). The information from this study will be used to plan future management of national parks for visitor use.
Your assistance in participating in an interview would be greatly appreciated.
• the interview will take approximately 15 minutes • it will be anonymous; we will not ask for your name • your participation is voluntary; you may withdraw from the interview at any point if you wish.
The interview will focus on your travel in the region marked on the map on the back of this sheet. We will
ask some questions about your travel in the region, your spending while in the region, your visits to national parks and about yourself (to match our study group to what we know about all tourists to the region).
If you have any questions about the interview or the study, you may contact (name of research leader and
contact details). The study adheres to the guidelines of the ethical review process of (name of institution) and if you would
like to speak to an officer of (name of institution) not involved in the study, you may contact the ethics officer on (contact details).
34

HANDBOOK ON MEASURING THE ECONOMIC VALUE OF TOURISM TO NATIONAL PARKS
35
Questionnaire page 1. National Parks Tourism Study—XXXX region
Questionnaire number □□□□ Instructions to interviewers: Show map of the region and say the passage in quotation marks. Fill in question 1. If respondent is not currently in a national park go to Q2. If respondent is ‘possibly’ or is ‘not’ going to visit a national park, please finish the interview. Otherwise begin interview at Q3.
‘Please look at the map of this (name) region. We are here (indicate and name location) and we are interested in all your travel in this marked region and whether a visit to a national park is part of your trip’.
1. Is the respondent currently in a national park?
□ Yes—go to Q3
□ No—go to Q2 2. During your trip to this region, have you visited or are you intending to visit a national park?
□ I have already visited a national park in this region on this trip.
□ I am definitely intending to visit a national park in this region.
□ I am possibly going to visit a national park in this region. No further questions thank you
□ I am not planning to visit a national park in this region. No further questions thank you 3. Today are you on a day trip from home, or on a longer trip with at least one overnight stay away from
home?
□ day trip
□ trip with overnight stay 4. Where is your normal place of residence?
Australia—please give postcode □□□□ Overseas – please give country ______________
5. How many nights will you spend in this region, on this trip? _______
6. How many nights have you spent already? _____
7. How many adults and children over 15 are you travelling with? _____
8. How many children under 15 are you travelling with?______ 9. What main form of transport did you use
to get to the region? (Tick one box)
□ air
□ pivate vehicle
□ hired vehicle
□ other
10. What main form of transport are you using
while in this region? (Tick one box)
□ air
□ private vehicle
□ hired vehicle
□ other
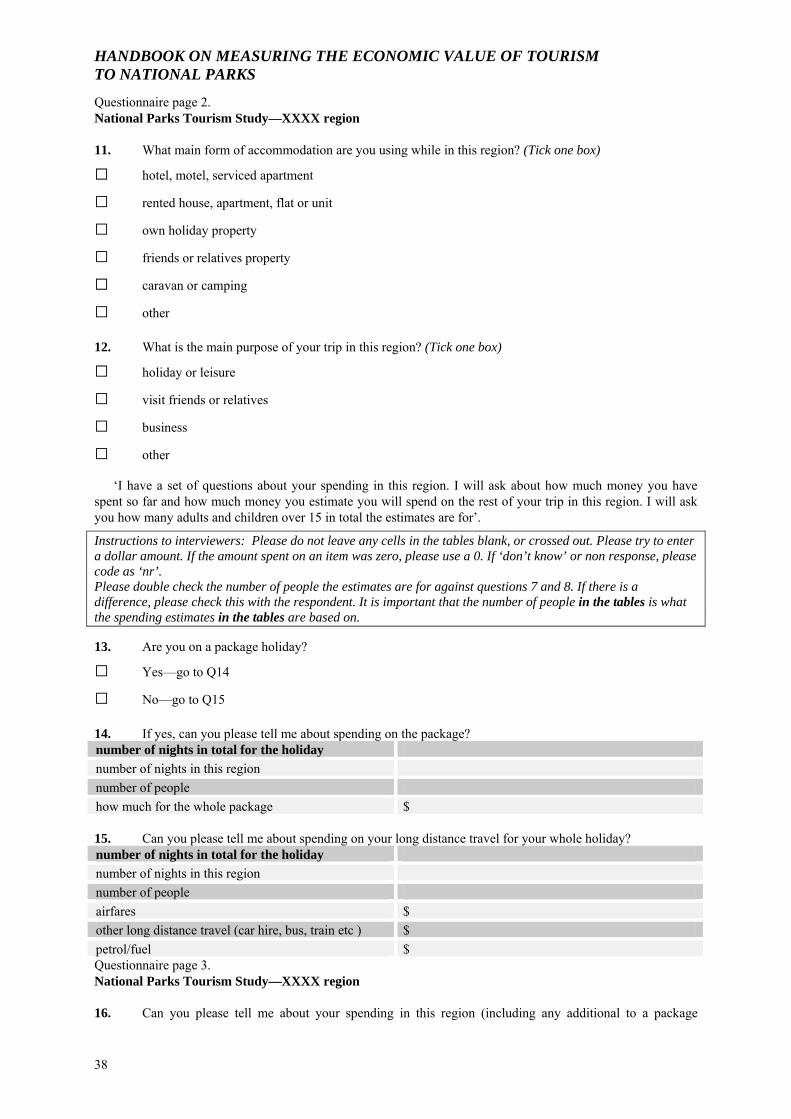
HANDBOOK ON MEASURING THE ECONOMIC VALUE OF TOURISM TO NATIONAL PARKS
Questionnaire page 2. National Parks Tourism Study—XXXX region
11. What main form of accommodation are you using while in this region? (Tick one box)
□ hotel, motel, serviced apartment
□ rented house, apartment, flat or unit
□ own holiday property
□ friends or relatives property
□ caravan or camping
□ other 12. What is the main purpose of your trip in this region? (Tick one box)
□ holiday or leisure
□ visit friends or relatives
□ business
□ other
‘I have a set of questions about your spending in this region. I will ask about how much money you have spent so far and how much money you estimate you will spend on the rest of your trip in this region. I will ask you how many adults and children over 15 in total the estimates are for’.
Instructions to interviewers: Please do not leave any cells in the tables blank, or crossed out. Please try to enter a dollar amount. If the amount spent on an item was zero, please use a 0. If ‘don’t know’ or non response, please code as ‘nr’. Please double check the number of people the estimates are for against questions 7 and 8. If there is a difference, please check this with the respondent. It is important that the number of people in the tables is what the spending estimates in the tables are based on. 13. Are you on a package holiday?
□ Yes—go to Q14
□ No—go to Q15 14. If yes, can you please tell me about spending on the package? number of nights in total for the holiday number of nights in this region number of people how much for the whole package $ 15. Can you please tell me about spending on your long distance travel for your whole holiday? number of nights in total for the holiday number of nights in this region number of people airfares $ other long distance travel (car hire, bus, train etc ) $ petrol/fuel $ Questionnaire page 3. National Parks Tourism Study—XXXX region
16. Can you please tell me about your spending in this region (including any additional to a package
38
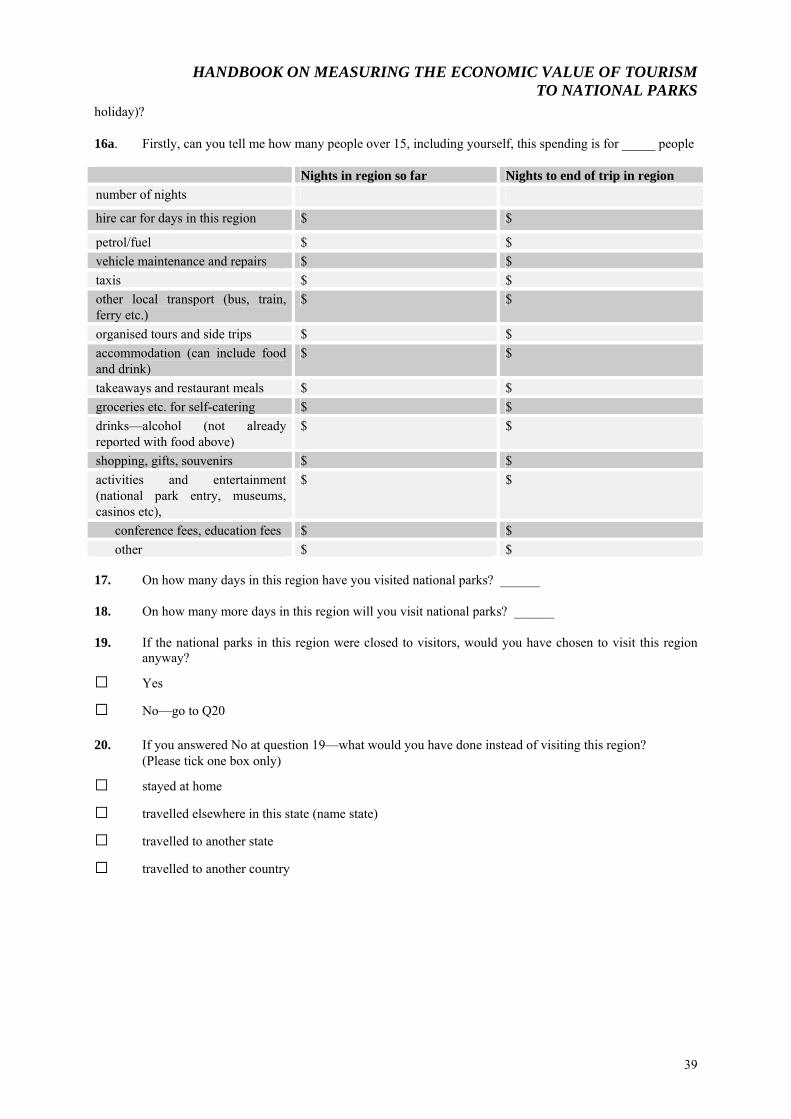
HANDBOOK ON MEASURING THE ECONOMIC VALUE OF TOURISM TO NATIONAL PARKS
holiday)? 16a. Firstly, can you tell me how many people over 15, including yourself, this spending is for _____ people
Nights in region so far Nights to end of trip in region number of nights
hire car for days in this region $ $
petrol/fuel $ $ vehicle maintenance and repairs $ $ taxis $ $ other local transport (bus, train, ferry etc.)
$ $
organised tours and side trips $ $ accommodation (can include food and drink)
$ $
takeaways and restaurant meals $ $ groceries etc. for self-catering $ $ drinks—alcohol (not already reported with food above)
$ $
shopping, gifts, souvenirs $ $ activities and entertainment (national park entry, museums, casinos etc),
$ $
conference fees, education fees $ $ other $ $
17. On how many days in this region have you visited national parks? ______
18. On how many more days in this region will you visit national parks? ______
19. If the national parks in this region were closed to visitors, would you have chosen to visit this region
anyway?
□ Yes
□ No—go to Q20
20. If you answered No at question 19—what would you have done instead of visiting this region? (Please tick one box only)
□ stayed at home
□ travelled elsewhere in this state (name state)
□ travelled to another state □ travelled to another country
39
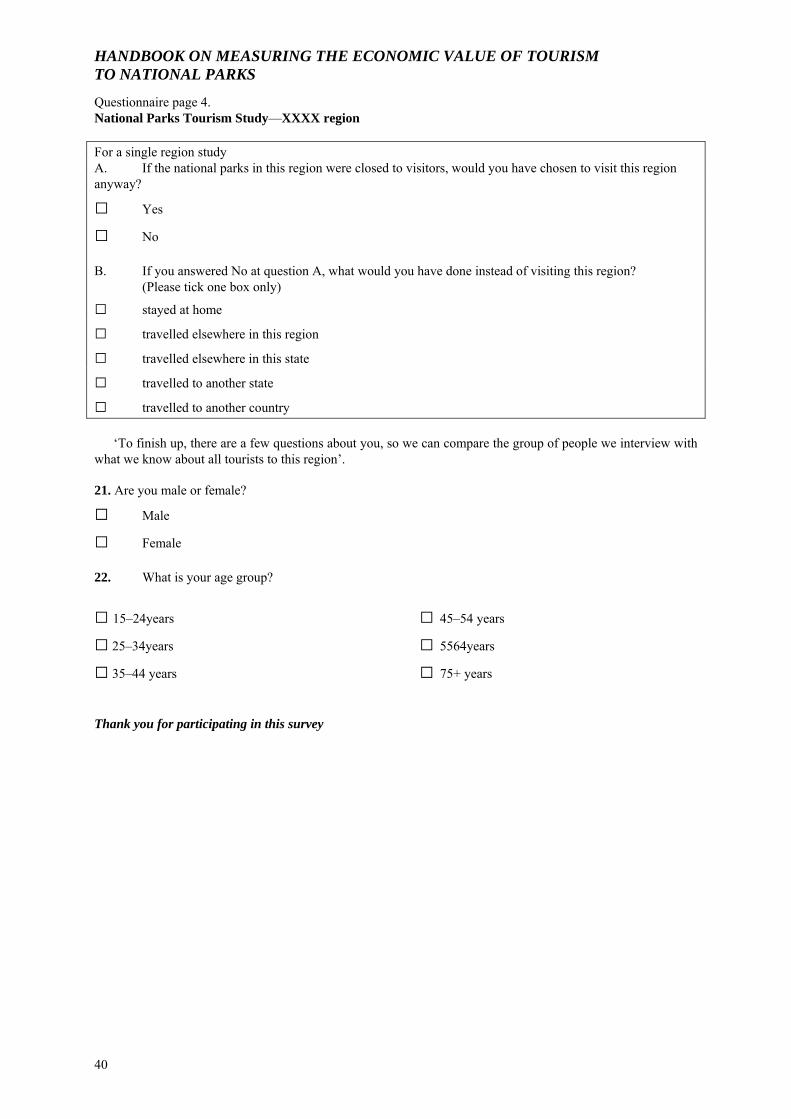
HANDBOOK ON MEASURING THE ECONOMIC VALUE OF TOURISM TO NATIONAL PARKS
40
Questionnaire page 4. National Parks Tourism Study—XXXX region For a single region study A. If the national parks in this region were closed to visitors, would you have chosen to visit this region anyway?
□ Yes
□ No B. If you answered No at question A, what would you have done instead of visiting this region?
(Please tick one box only)
□ stayed at home
□ travelled elsewhere in this region
□ travelled elsewhere in this state
□ travelled to another state
□ travelled to another country
‘To finish up, there are a few questions about you, so we can compare the group of people we interview with what we know about all tourists to this region’.
21. Are you male or female?
□ Male
□ Female 22. What is your age group?
□ 15–24years
□ 25–34years
□ 35–44 years
□ 45–54 years
□ 5564years
□ 75+ years
Thank you for participating in this survey
HANDBOOK ON MEASURING THE ECONOMIC VALUE OF TOURISM TO NATIONAL PARKS
REFERENCES
Australian Bureau of Statistics. (2009a). Introduction to Statistics. Understanding Statistics Retrieved 4 March, 2010,from_http://www.abs.gov.au/websitedbs/a3121120.nsf/4a256353001af3ed4b2562bb00121564/fb36d75769416c13ca2576100002db58!OpenDocument
Australian Bureau of Statistics. (2009b). Types of Sampling. Retrieved 4 March, 2010, from
http://www.abs.gov.au/Websitedbs/cashome.nsf/51c9a3d36edfd0dfca256acb00118404/22073476df088d06ca2572fe001e58b5!OpenDocument
Ballantyne, R., Brown, R., Pegg, S., & Scott, N. (2008). Valuing Tourism Spend Arising from Visitation to
Queensland National Parks, Sustainable Tourism Cooperative Research Centre, Gold Coast Carlsen, J. & Wood, D. (2004). Assessment of the Economic Value of Recreation and Tourism in Western
Australia's National Parks, Marine Parks and Forests, Sustainable Tourism Cooperative Research Centre, Gold Coast
Centre for Agricultural and Regional Economics (2006) Impact of National Parks on the Western Pastoral
Region of NSW, Report Prepared for the NSW Department of Environment and Conservation Gillespie Economics & BDA Group (2009). Economic Activity of Australia’s World Heritage Areas, Report to
the Department of the Environment, Water, Heritage and the Arts, Canberra Hughes. M., Jones, T., Deery, M., Wood, D., Fredline, L., Whitely, Z. & Lockwood, M. (2009) Estimating the
Economic, Social and Environmental Value of Tourism to Protected Areas, Sustainable Tourism Cooperative Research Centre, Gold Coast
Johnson, R. R., & Kuby, P. (2000). Elementary Statistics (8th ed.) Pacific Grove, CA, United States of America:
Duxbury, Thomson Learning Lindberg, K. & Denstadii, J. (2004) Impact of National Park Visitation on Rural Economies and Government
Expenditure in Queensland, Sustainable Tourism Cooperative Research Centre, Gold Coast McNamara, A. (2008) ‘International conference to set future direction of Australia’s national parks’, Minister for
Sustainability, Climate Change and Innovation, Media Statement Tuesday November 25, 2008 National Statistical Services. (2009). Errors in Statistical Data. Retrieved 2 March, 2009, from
http://www.nss.gov.au/nss/home.NSF/NSS/4354A8928428F834CA2571AB002479CE?opendocument#Sampling%20Error
Pambudi, D., Van Ho, T., Spurr, R., Forsyth, P., Dwyer, L., & Hoque, S. (2009), The Economic Contribution of
Tourism to Australian States and Territories 2007–08, Sustainable Tourism Cooperative Research Centre, Gold Coast
Stynes, D.J. & White, E. M. (2006). ‘Reflections on measuring recreation and travel spending’. Journal of Travel Research, 45(1), 8-16. Tourism Research Australia. (2007). Tourism Profiles for Local Government Areas in Regional Australia
Queensland. Retrieved 19 February, 2010, from http://www.tra.australia.com/regional.asp?sub=0159
42
HANDBOOK ON MEASURING THE ECONOMIC VALUE OF TOURISM TO NATIONAL PARKS
Tourism Research Australia. (2009a). Background and Methods: Regional Expenditure 2008. Retrieved 9 February, 2010,from http://www.tra.australia.com/content/documents/Regional/Regional%20Expenditure/2009/Regional_background_FINAL.pdf
Tourism Research Australia (2009b), Travel by Australians, September Quarter 2009, Tourism Research
Australia, Canberra Tourism Research Australia (2009c). International Visitor Survey. Retrieved 9 March, 2009, from
http://www.tra.australia.com/international.asp?sub=0038 Tourism Research Australia (2010a) Regional Tourism Profiles 2008-09, Tourism Research Australia, Canberra Tourism Research Australia. (2010b). International Visitor Survey. Retrieved 25 March, 2010, from
http://www.ret.gov.au/tourism/Documents/tra/International%20Visitor%20Survey/IVS%20December%202009%20Final.pdf
Tremblay, P. (2007) Economic Contribution of Kakadu National Park to Tourism in the Northern Territory,
Sustainable Tourism Cooperative Research Centre, Gold Coast Tremblay, P. & Carson, D. (2007) Economic Value of Tourism in Watarrka National Park, Sustainable Tourism
Cooperative Research Centre, Gold Coast Veal, A. (1997). Research Methods for Leisure and Tourism; a practical guide (2 ed.). London: Pearson
Education Wood, D., Glasson, J., Carlsen, J. & Hopkins, D (2006) Economic Evaluation of Tourism for Natural Areas:
development of a toolkit approach, Sustainable Tourism Cooperative Research Centre, Gold Coast Wooldridge, J. M. (2006). Introductory Econometrics: a modern approach (3rd ed.). United States of America:
Thomson, South-Western World Tourism Organization 1995, Concepts, Definitions and Classifications for Tourism Statistics, Technical
Manual No. 1, World Tourism Organization
43

HANDBOOK ON MEASURING THE ECONOMIC VALUE OF TOURISM TO NATIONAL PARKS
44
AUTHORS
Dr. Sally Driml Dr. Sally Driml specialises in natural resource and environmental economics. Her experience includes: developing environmental policy and economic studies in; climate change, market based instruments, pollution management, sustainable tourism and tourism industry issues, values of protected areas, fishing and forestry, and environmental economics methods. Dr. Driml’s experience in tourism includes management of tourism in protected areas whilst working for the Great Barrier Reef Marine Park Authority and the Queensland Environmental Protection Agency and serving on advisory bodies. She has undertaken research into the economic values of tourism in protected areas, including a major study on in the Wet Tropics World Heritage Area. Dr Driml commenced as a Senior Research Fellow in the School of Tourism, University of Queensland in 2009. Current areas of research include the economic value of tourism in national parks and protected areas and issues for investment in tourism in Australia. She has published in journals including Ecological Economics, Journal of Sustainable Tourism, Coral Reefs, and Australian Journal of Environmental Management. Email: [email protected]
Char-lee McLennan Char-lee McLennan has a Bachelor of Hotel Management (Event Management)/Bachelor of Business (Financial Economics) with first class Honours from Griffith University. She has previously worked as a Tourism Research Officer in the tourism branch of Gold Coast City Council and as the project officer on the International Visitor Survey for Tourism Research Australia. More recently, she has worked as a Senior Research Technician for the School of Tourism at the University of Queensland (UQ). She is currently a full-time PhD Candidate with UQ on a UQ Research Scholarship (UQRS) and an operating partner of Moyle and McLennan Consulting. Her PhD topic focuses on tourism transformation, economic development and strategic destination management. Email: [email protected]

COMMERCIALISE
RESEARCHAND
DEVELOPMENT
EDUCATIONAND
TRAINING
UTILISE
COLLABORATION
COM
MU
NI C A T I O N
I NN
OV
ATI
ON
• Travel and tourism industry• Academic researchers• Government policy makers
• New products, services and technologies• Uptake of research finding by business, government and academe• Improved business productivity• Industry-ready post-graduate students• Public good benefits for tourism destinations
I N D U S T R Y P A R T N E R S U N I V E R S I T Y P A R T N E R S C O M M E R C I A L I S A T I O N
TOURISM NT NORTHERN TERRITORYAUSTRALIA
EC3, a wholly-owned subsidiary company, takes the outcomes from the relevant STCRC research; develops them for market; and delivers them to industry as products and services. EC3 delivers significant benefits to the STCRC through the provision of a wide range of business services both nationally and internationally.
K E Y E C 3 P R O D U C T S
Chairman: Stephen GreggChief Executive: Ian KeanDirector of Research: Prof. David Simmons
CRC for Sustainable Tourism Pty LtdGold Coast Campus Griffith University Queensland 4222 Australia ABN 53 077 407 286
Telephone: +61 7 5552 8172 Facsimile: +61 7 5552 8171Website: www.crctourism.com.auBookshop: www.crctourism.com.au/bookshopEmail: [email protected]

Sustainable Tourism Cooperative Research Centre (STCRC) is established under the Australian Government’s Cooperative Research Centres Program.
STCRC is the world’s leading scientific institution delivering research to support the sustainability of travel and tourism—one of the world’s largest and fastest growing industries.
IntroductionSTCRC has grown to be the largest dedicated tourism research organisation in the world, with $187 million invested in tourism research programs, commercialisation and education since 1997.
STCRC was established in July 2003 under the Commonwealth Government’s CRC program and is an extension of the previous Tourism CRC, which operated from 1997 to 2003.
Role and responsibilitiesThe Commonwealth CRC program aims to turn research outcomes into successful new products, services and technologies. This enables Australian industries to be more efficient, productive and competitive.
The program emphasises collaboration between businesses and researchers to maximise the benefits of research through utilisation, commercialisation and technology transfer.
An education component focuses on producing graduates with skills relevant to industry needs.
STCRC’s objectives are to enhance:the contribution of long-term scientific and • technological research and innovation to Australia’s sustainable economic and social development;
the transfer of research outputs into • outcomes of economic, environmental or social benefit to Australia;
the value of graduate researchers to • Australia;
collaboration among researchers, • between searchers and industry or other users; and
efficiency in the use of intellectual and • other research outcomes.