handbook of utilization of aquatic plants
TRANSCRIPT
Produced by: Fisheries andAquaculture Department
Title: Handbook of utilization of aquatic plants... More details
III. WATER, MINERAL AND PROTEIN CONTENT AND PRODUCTIVITY OF AQUATICPLANTS
The ingredients, other than water, of aquatic plants are similar to those in plants adapted to growth on dry land. The literaturecontains the results of numerous analyses taken of different species growing in a range of habitats in many countries. A generalcriticism against the usefulness of aquatic plants is that their high water content makes them inconvenient to harvest and alsounsuitable as fodder for livestock. Moreover, it is often alleged that the plants are low in useful nutrients.
Thereforea study of these various results should be interesting and helpful tothose considering the utilization of aquatic plants fortheir own particular needs.
Probably the most comprehensive analyses of aquatic plants has been done by C.E. Boyd, U.S.A., whose work will be repeatedlynoted in the following pages. This work has culminated in an extensive review (Boyd and Scarsbrook, 1975) in which the data from35 papers, all on work in the U.S.A., have been tabulated. Anyone studying the overall range of aquatic weed analyses shouldhave a copy of this paper.
A brief but useful review on nutrient uptake by aquatic plants by J.J. Gaudet appears in a chapter in Mitchell (1974).
Abdalla, A.A. and A.T. Abdel Hafeez, 1969 Some aspects of utilization of water hyacinth (Eichhornia crassipes). PANS, 15(2):204–7
Water hyacinth analysis (% fresh weight) :
water = 90.2; N = 1.03; P = 0.42; K = 1.81; Ca = 0.02
The authors point out the high P content in water hyacinth compared with 0.24% in alfafa (lucerne).
*Agrupis, F.M., 1953 The value of water hyacinth as silage. Philipp.Agric., 37(1–2):50–6
Water hyacinth analyses: % %moisture 90.7 crude protein 0.9carbohydrates (N-free extract) 3.9 crude fats (ether extract) 0.4crude fibre 2.2 ash 2.0Ca 0.3 P 0.1Calorifio value for every 100 g = 23.0.
*Alford, L.W., 1952 Alligator weed - a good cattle food. Chemurg.Dig., 2(9):10–2
Alligator weed (Alternanthera philoxeroides) - analysis of dry matter (100°C) (%):
moisture 12.0 Al2O3 + Fe2O3 0.79ash 12.0 CaO 0.29fat and oil 1.4 MgO 0.06crude protein 6.4 dextrose 2.8crude fibre 7.5 invert sugar 6.2N-free extract 60.8 sucrose 3.2Air-dry moisture = 80%
Allenby, K.G., 1967 The manganese and calcium content of some aquatic plants and the water in which they grow. Hydrobiologia,29:239–44
Analyses of Mn, Ca and ash of a range of aquatic plants (mean of several analyses):
Species% DM %
Ash Mn Ca Ca in ashAlisma plantago 10.8 0.05 1.2 11.0
HANDBOOK OF UTILIZATION OF AQUATIC PLANTS http://www.fao.org/docrep/003/x6862e/x6862e03.htm
1 de 20 03/02/14 11:34

Sparganium ramosum 7.8 0.05 1.1 13.8
Carex acutiformis 4.9 0.02 0.3 6.3
Potamogeton natans 7.1 0.15 0.9 12.5
Sagittaria sagittifolia 9.8 0.05 1.0 10.0
Elodea canadensis 12.8 0.29 1.6 12.8
Lemna minor 12.1 0.40 1.8 12.3
L. trisulca 13.6 0.31 1.5 10.7
L. gibba 19.0 0.17 1.1 5.8
The author comments that the Mn content of aquatic plants is several times greater than land species. There appeared to be nocorrelation between the amount of Mn in the plants and the water in which they grow. He also noted that the Ca to ash ratio of E.canadensis, S. ramosum and A. plantago is less than that of the water.
Allenby, K.G., 1968 Some analyses of aquatic plants and waters. Hydrobiologia, 32:486–90
Analyses (% or ppm dry weight) of a range of aquatic plants compared with the water in which they were growing (mean of severalanalyses):
SpeciesCa Cu N
Water Plant Water Plant Water Plantppm % ppm ppm % %
Lemna minor 45 1.55 0.03 25 2.9 3.7
L. gibba 48 1.05 0.05 33 1.2 3.9
L. polyrhiza 41 1.43 0.02 19 3.5 4.6
L. trisulca 28 1.25 - - 1.7 3.7
Elodea canadensis 27 1.22 - - 1.0 3.2
Potamogeton obtusifolius 25 0.48 - - - -
P. pectinatus 92 2.6 - - - -
P. perfoliatus 92 0.7 - - - -
Hottonia palustris 84 0.7 - - - -
The author draws attention to the high N. content of L. polyrhiza which was growing in high nitrogen water.
He also notes that chloride content of L. minor appeared to decrease with increasing chloride content of the water, while with L.polyrhiza the reverse appeared to be the case. With E. canadensis there appeared to be no relationship.
Anderson, R.R., R.G. Brown and R.D. Rappleye, 1966 The mineral content of Myriophyllum spicatum L. in relation to its aquaticenvironment. Ecology, 47:844–6
Analyses of Myriophyllum spicatum when grown in fresh water and in brackish water (ppm fresh weight):
Element SourceFresh Brackishwater water
Ca water 10 150
M. spicatum 350 250
K water 10 125
M. spicatum 2 700 1 600
Na water 6 2 700
M. spicatum 1 200 2 100
Mg water 20 400
M. spicatum 50 140
M. spicatum analyses (% DM) Fresh water Brackish waterN 3 2
K 0.4 0.4
S 0.4 0.3
HANDBOOK OF UTILIZATION OF AQUATIC PLANTS http://www.fao.org/docrep/003/x6862e/x6862e03.htm
2 de 20 03/02/14 11:34
The authors comment that M. spicatum appears to be capable of regulating salt uptake independently of concentrations in theaquatic environment. It can tolerate salt concentrations up to a maximum of 15 000 ppm.
*Bailey, T.A., 1965 Commercial possibilities of dehydrated aquatic plants. Proc.Annu.Meet. South.Weed. Sci.Soc., 18:543–51
Citation of unpublished analyses of the dry matter of aquatic plants compared to common animal foods containing xanthophyll:
Plant or food Protein Fibre Xanthophyll% % ppm
Ceratophyllum sp. 18.3 16 922
Elodea densa 16.8 14 820
Myriophyllum exalbescens 21.1 11 1 160
Yellow corn 8–9 - 13–22
Alfalfa meal 16–21 - 175–400
Corn gluten meal (mean) 50 - 176–320
Analyses (mean of different harvests):
Protein Fibre Ash Xanthophyll
% % % ppmCeratophyllum sp. 18 15.5 19 420
E. densa 15.5 14 18.5 560
M. exalbescens 24.5 13 19 1 030
Estimated annual yields of E. densa = 6.5 tonnes/ha and of M. exalbescens = 8.4 tonnes/ha
The author concludes that it would appear that these dehydrated plants will average 840 mg of xanthophyll per kg, about 19%protein, and about 12% fibre.
Book, J.H., 1969 Productivity of the water hyacinth, Eichhornia crassipes (Mart.) Solms. Ecology, 50(3):460–4
Water content of water hyacinth (derived from the mean of 82 determinations) was 93.4%. The author notes that this contentremained nearly constant throughout the growing season. After reviewing literature from several countries on daily production shepoints out that, in California, water hyacinth can, in spite of winter frosts, produce at a rate comparable with growth in the tropics.
Boyd, C.E., 1968 Fresh water plants: a potential source of protein. Econ.Bot., 22:359–68
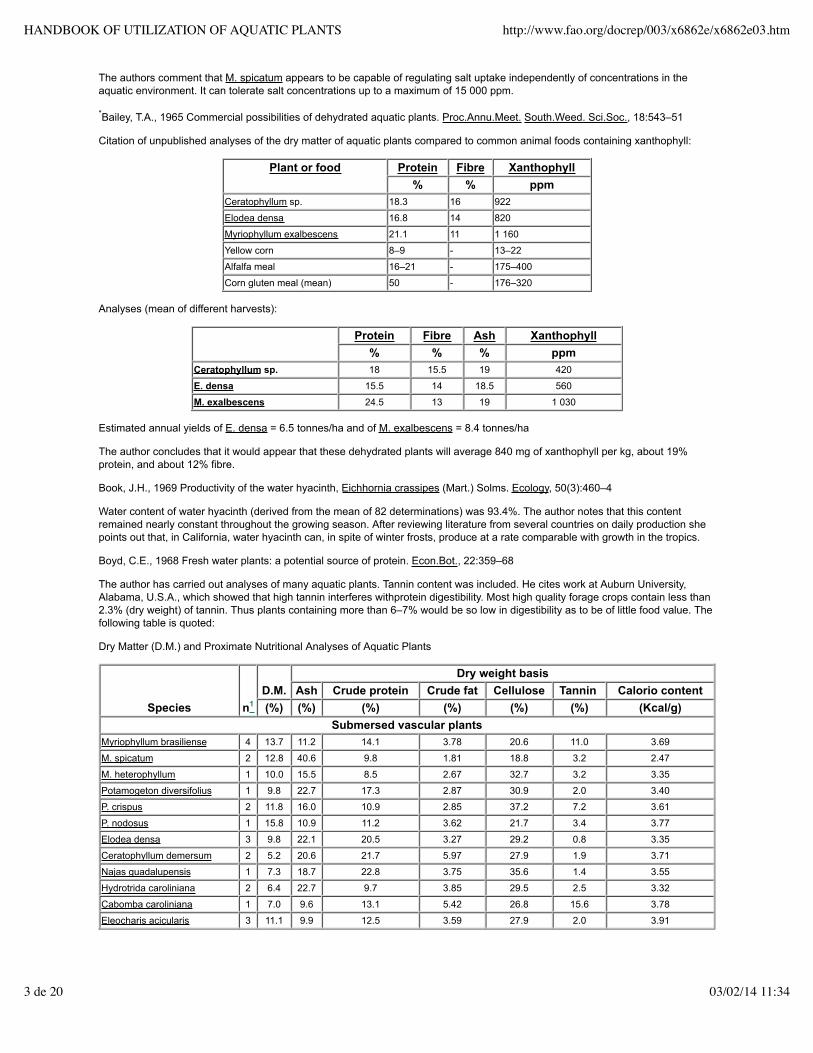
The author has carried out analyses of many aquatic plants. Tannin content was included. He cites work at Auburn University,Alabama, U.S.A., which showed that high tannin interferes withprotein digestibility. Most high quality forage crops contain less than2.3% (dry weight) of tannin. Thus plants containing more than 6–7% would be so low in digestibility as to be of little food value. Thefollowing table is quoted:
Dry Matter (D.M.) and Proximate Nutritional Analyses of Aquatic Plants
Species n1D.M.
Dry weight basisAsh Crude protein Crude fat Cellulose Tannin Calorio content
(%) (%) (%) (%) (%) (%) (Kcal/g)Submersed vascular plants
Myriophyllum brasiliense 4 13.7 11.2 14.1 3.78 20.6 11.0 3.69
M. spicatum 2 12.8 40.6 9.8 1.81 18.8 3.2 2.47
M. heterophyllum 1 10.0 15.5 8.5 2.67 32.7 3.2 3.35
Potamogeton diversifolius 1 9.8 22.7 17.3 2.87 30.9 2.0 3.40
P. crispus 2 11.8 16.0 10.9 2.85 37.2 7.2 3.61
P. nodosus 1 15.8 10.9 11.2 3.62 21.7 3.4 3.77
Elodea densa 3 9.8 22.1 20.5 3.27 29.2 0.8 3.35
Ceratophyllum demersum 2 5.2 20.6 21.7 5.97 27.9 1.9 3.71
Najas guadalupensis 1 7.3 18.7 22.8 3.75 35.6 1.4 3.55
Hydrotrida caroliniana 2 6.4 22.7 9.7 3.85 29.5 2.5 3.32
Cabomba caroliniana 1 7.0 9.6 13.1 5.42 26.8 15.6 3.78
Eleocharis acicularis 3 11.1 9.9 12.5 3.59 27.9 2.0 3.91
HANDBOOK OF UTILIZATION OF AQUATIC PLANTS http://www.fao.org/docrep/003/x6862e/x6862e03.htm
3 de 20 03/02/14 11:34
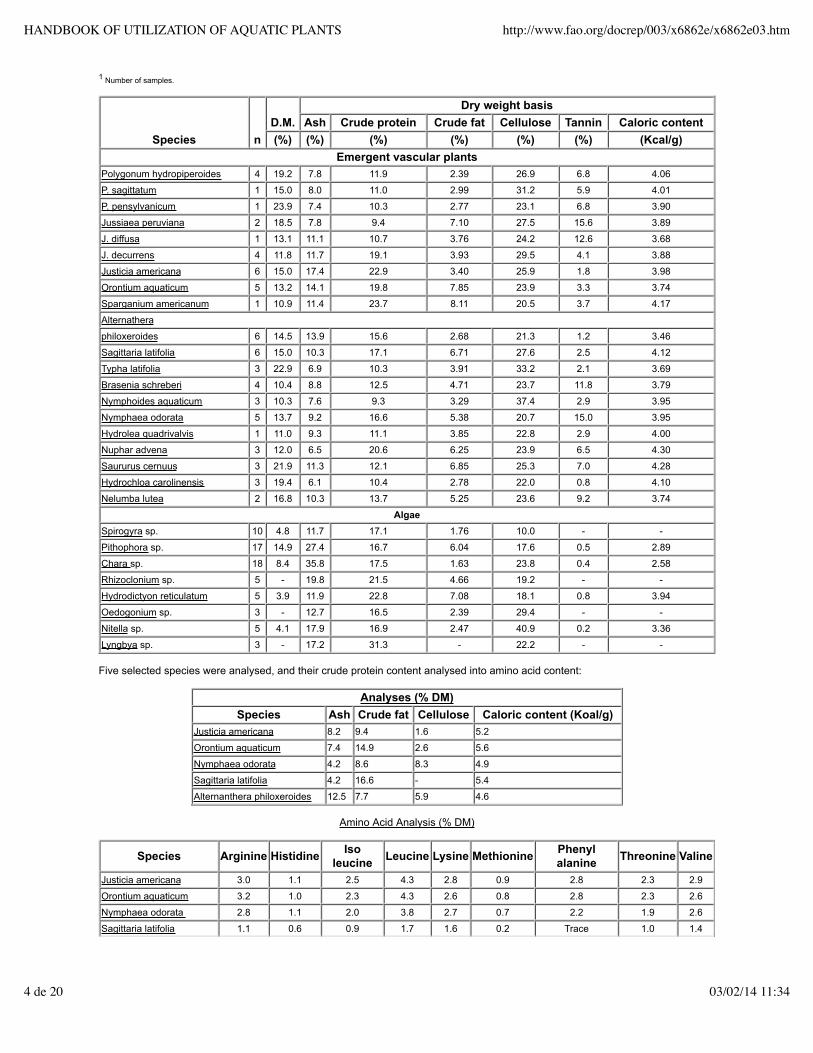
1 Number of samples.
Species nD.M.
Dry weight basisAsh Crude protein Crude fat Cellulose Tannin Caloric content
(%) (%) (%) (%) (%) (%) (Kcal/g)Emergent vascular plants
Polygonum hydropiperoides 4 19.2 7.8 11.9 2.39 26.9 6.8 4.06
P. sagittatum 1 15.0 8.0 11.0 2.99 31.2 5.9 4.01
P. pensylvanicum 1 23.9 7.4 10.3 2.77 23.1 6.8 3.90
Jussiaea peruviana 2 18.5 7.8 9.4 7.10 27.5 15.6 3.89
J. diffusa 1 13.1 11.1 10.7 3.76 24.2 12.6 3.68
J. decurrens 4 11.8 11.7 19.1 3.93 29.5 4.1 3.88
Justicia americana 6 15.0 17.4 22.9 3.40 25.9 1.8 3.98
Orontium aquaticum 5 13.2 14.1 19.8 7.85 23.9 3.3 3.74
Sparganium americanum 1 10.9 11.4 23.7 8.11 20.5 3.7 4.17
Alternathera
philoxeroides 6 14.5 13.9 15.6 2.68 21.3 1.2 3.46
Sagittaria latifolia 6 15.0 10.3 17.1 6.71 27.6 2.5 4.12
Typha latifolia 3 22.9 6.9 10.3 3.91 33.2 2.1 3.69
Brasenia schreberi 4 10.4 8.8 12.5 4.71 23.7 11.8 3.79
Nymphoides aquaticum 3 10.3 7.6 9.3 3.29 37.4 2.9 3.95
Nymphaea odorata 5 13.7 9.2 16.6 5.38 20.7 15.0 3.95
Hydrolea quadrivalvis 1 11.0 9.3 11.1 3.85 22.8 2.9 4.00
Nuphar advena 3 12.0 6.5 20.6 6.25 23.9 6.5 4.30
Saururus cernuus 3 21.9 11.3 12.1 6.85 25.3 7.0 4.28
Hydrochloa carolinensis 3 19.4 6.1 10.4 2.78 22.0 0.8 4.10
Nelumba lutea 2 16.8 10.3 13.7 5.25 23.6 9.2 3.74
AlgaeSpirogyra sp. 10 4.8 11.7 17.1 1.76 10.0 - -
Pithophora sp. 17 14.9 27.4 16.7 6.04 17.6 0.5 2.89
Chara sp. 18 8.4 35.8 17.5 1.63 23.8 0.4 2.58
Rhizoclonium sp. 5 - 19.8 21.5 4.66 19.2 - -
Hydrodictyon reticulatum 5 3.9 11.9 22.8 7.08 18.1 0.8 3.94
Oedogonium sp. 3 - 12.7 16.5 2.39 29.4 - -
Nitella sp. 5 4.1 17.9 16.9 2.47 40.9 0.2 3.36
Lyngbya sp. 3 - 17.2 31.3 - 22.2 - -
Five selected species were analysed, and their crude protein content analysed into amino acid content:
Analyses (% DM)Species Ash Crude fat Cellulose Caloric content (Koal/g)
Justicia americana 8.2 9.4 1.6 5.2
Orontium aquaticum 7.4 14.9 2.6 5.6
Nymphaea odorata 4.2 8.6 8.3 4.9
Sagittaria latifolia 4.2 16.6 - 5.4
Alternanthera philoxeroides 12.5 7.7 5.9 4.6
Amino Acid Analysis (% DM)
Species Arginine Histidine Isoleucine Leucine Lysine Methionine Phenyl
alanine Threonine Valine
Justicia americana 3.0 1.1 2.5 4.3 2.8 0.9 2.8 2.3 2.9
Orontium aquaticum 3.2 1.0 2.3 4.3 2.6 0.8 2.8 2.3 2.6
Nymphaea odorata 2.8 1.1 2.0 3.8 2.7 0.7 2.2 1.9 2.6
Sagittaria latifolia 1.1 0.6 0.9 1.7 1.6 0.2 Trace 1.0 1.4
HANDBOOK OF UTILIZATION OF AQUATIC PLANTS http://www.fao.org/docrep/003/x6862e/x6862e03.htm
4 de 20 03/02/14 11:34
Alternantheraphiloxeroides
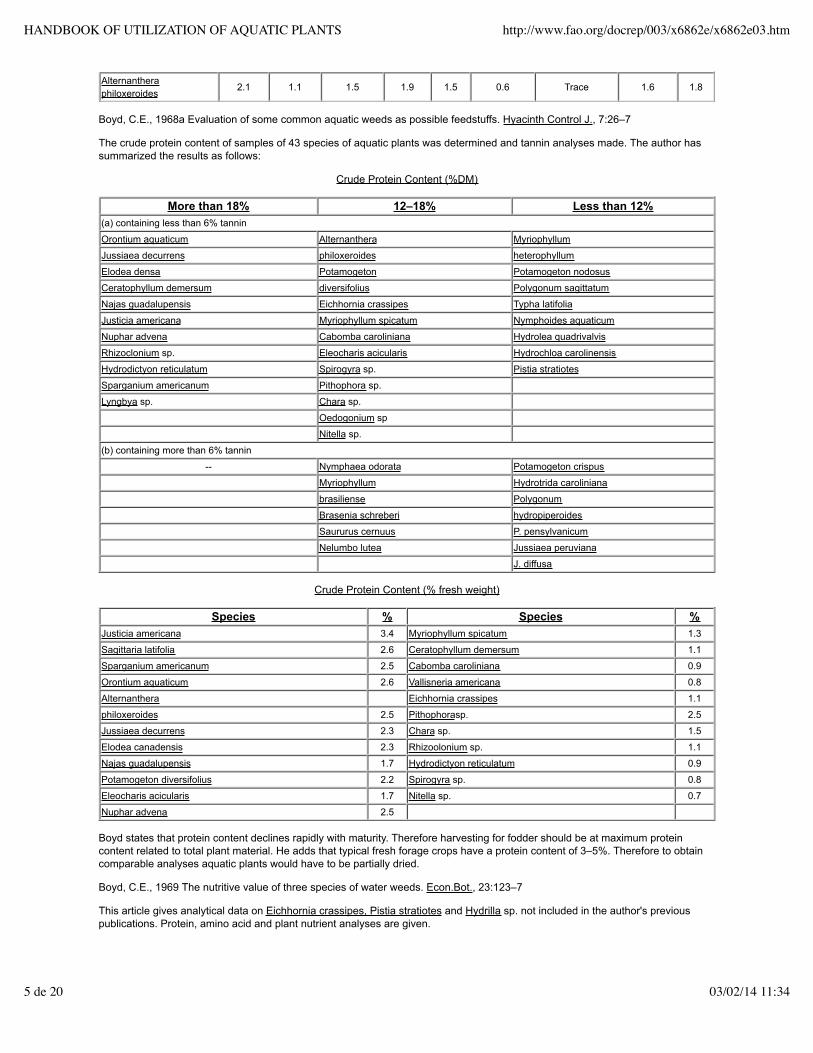
2.1 1.1 1.5 1.9 1.5 0.6 Trace 1.6 1.8
Boyd, C.E., 1968a Evaluation of some common aquatic weeds as possible feedstuffs. Hyacinth Control J., 7:26–7
The crude protein content of samples of 43 species of aquatic plants was determined and tannin analyses made. The author hassummarized the results as follows:
Crude Protein Content (%DM)
More than 18% 12–18% Less than 12%(a) containing less than 6% tannin
Orontium aquaticum Alternanthera Myriophyllum
Jussiaea decurrens philoxeroides heterophyllum
Elodea densa Potamogeton Potamogeton nodosus
Ceratophyllum demersum diversifolius Polygonum sagittatum
Najas guadalupensis Eichhornia crassipes Typha latifolia
Justicia americana Myriophyllum spicatum Nymphoides aquaticum
Nuphar advena Cabomba caroliniana Hydrolea quadrivalvis
Rhizoclonium sp. Eleocharis acicularis Hydrochloa carolinensis
Hydrodictyon reticulatum Spirogyra sp. Pistia stratiotes
Sparganium americanum Pithophora sp.
Lyngbya sp. Chara sp.
Oedogonium sp
Nitella sp.
(b) containing more than 6% tannin
-- Nymphaea odorata Potamogeton crispus
Myriophyllum Hydrotrida caroliniana
brasiliense Polygonum
Brasenia schreberi hydropiperoides
Saururus cernuus P. pensylvanicum
Nelumbo lutea Jussiaea peruviana
J. diffusa
Crude Protein Content (% fresh weight)
Species % Species %Justicia americana 3.4 Myriophyllum spicatum 1.3
Sagittaria latifolia 2.6 Ceratophyllum demersum 1.1
Sparganium americanum 2.5 Cabomba caroliniana 0.9
Orontium aquaticum 2.6 Vallisneria americana 0.8
Alternanthera Eichhornia crassipes 1.1
philoxeroides 2.5 Pithophorasp. 2.5
Jussiaea decurrens 2.3 Chara sp. 1.5
Elodea canadensis 2.3 Rhizoolonium sp. 1.1
Najas guadalupensis 1.7 Hydrodictyon reticulatum 0.9
Potamogeton diversifolius 2.2 Spirogyra sp. 0.8
Eleocharis acicularis 1.7 Nitella sp. 0.7
Nuphar advena 2.5
Boyd states that protein content declines rapidly with maturity. Therefore harvesting for fodder should be at maximum proteincontent related to total plant material. He adds that typical fresh forage crops have a protein content of 3–5%. Therefore to obtaincomparable analyses aquatic plants would have to be partially dried.
Boyd, C.E., 1969 The nutritive value of three species of water weeds. Econ.Bot., 23:123–7
This article gives analytical data on Eichhornia crassipes, Pistia stratiotes and Hydrilla sp. not included in the author's previouspublications. Protein, amino acid and plant nutrient analyses are given.
HANDBOOK OF UTILIZATION OF AQUATIC PLANTS http://www.fao.org/docrep/003/x6862e/x6862e03.htm
5 de 20 03/02/14 11:34
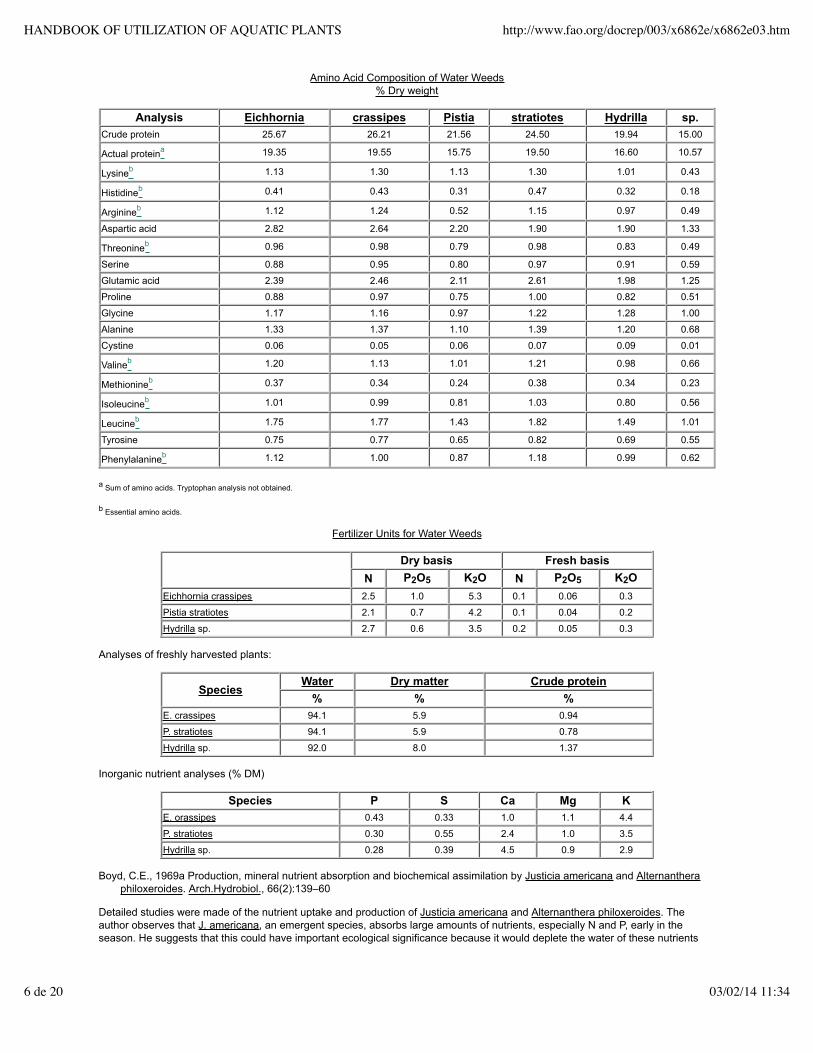
Amino Acid Composition of Water Weeds% Dry weight
Analysis Eichhornia crassipes Pistia stratiotes Hydrilla sp.Crude protein 25.67 26.21 21.56 24.50 19.94 15.00
Actual proteina 19.35 19.55 15.75 19.50 16.60 10.57
Lysineb 1.13 1.30 1.13 1.30 1.01 0.43
Histidineb 0.41 0.43 0.31 0.47 0.32 0.18
Arginineb 1.12 1.24 0.52 1.15 0.97 0.49
Aspartic acid 2.82 2.64 2.20 1.90 1.90 1.33
Threonineb 0.96 0.98 0.79 0.98 0.83 0.49
Serine 0.88 0.95 0.80 0.97 0.91 0.59
Glutamic acid 2.39 2.46 2.11 2.61 1.98 1.25
Proline 0.88 0.97 0.75 1.00 0.82 0.51
Glycine 1.17 1.16 0.97 1.22 1.28 1.00
Alanine 1.33 1.37 1.10 1.39 1.20 0.68
Cystine 0.06 0.05 0.06 0.07 0.09 0.01
Valineb 1.20 1.13 1.01 1.21 0.98 0.66
Methionineb 0.37 0.34 0.24 0.38 0.34 0.23
Isoleucineb 1.01 0.99 0.81 1.03 0.80 0.56
Leucineb 1.75 1.77 1.43 1.82 1.49 1.01
Tyrosine 0.75 0.77 0.65 0.82 0.69 0.55
Phenylalanineb 1.12 1.00 0.87 1.18 0.99 0.62
a Sum of amino acids. Tryptophan analysis not obtained.
b Essential amino acids.
Fertilizer Units for Water Weeds
Dry basis Fresh basis
N P2O5 K2O N P2O5 K2OEichhornia crassipes 2.5 1.0 5.3 0.1 0.06 0.3
Pistia stratiotes 2.1 0.7 4.2 0.1 0.04 0.2
Hydrilla sp. 2.7 0.6 3.5 0.2 0.05 0.3
Analyses of freshly harvested plants:
SpeciesWater Dry matter Crude protein
% % %E. crassipes 94.1 5.9 0.94
P. stratiotes 94.1 5.9 0.78
Hydrilla sp. 92.0 8.0 1.37
Inorganic nutrient analyses (% DM)
Species P S Ca Mg KE. orassipes 0.43 0.33 1.0 1.1 4.4
P. stratiotes 0.30 0.55 2.4 1.0 3.5
Hydrilla sp. 0.28 0.39 4.5 0.9 2.9
Boyd, C.E., 1969a Production, mineral nutrient absorption and biochemical assimilation by Justicia americana and Alternantheraphiloxeroides. Arch.Hydrobiol., 66(2):139–60
Detailed studies were made of the nutrient uptake and production of Justicia americana and Alternanthera philoxeroides. Theauthor observes that J. americana, an emergent species, absorbs large amounts of nutrients, especially N and P, early in theseason. He suggests that this could have important ecological significance because it would deplete the water of these nutrients
HANDBOOK OF UTILIZATION OF AQUATIC PLANTS http://www.fao.org/docrep/003/x6862e/x6862e03.htm
6 de 20 03/02/14 11:34
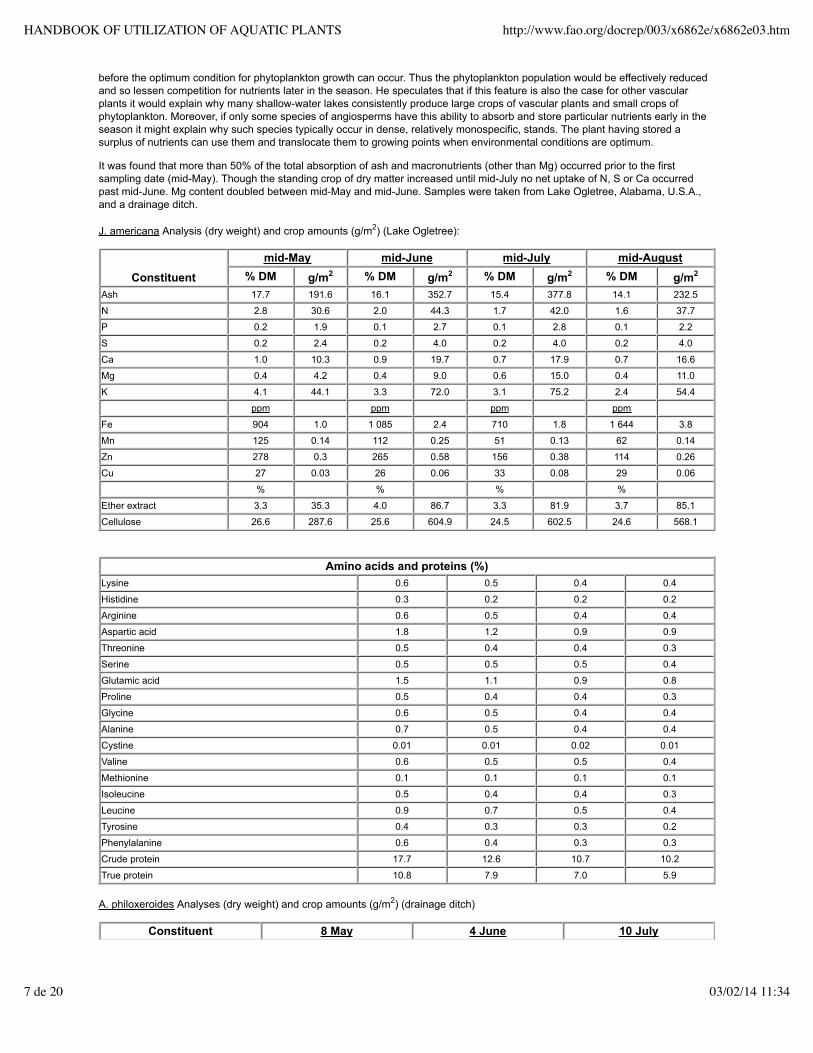
before the optimum condition for phytoplankton growth can occur. Thus the phytoplankton population would be effectively reducedand so lessen competition for nutrients later in the season. He speculates that if this feature is also the case for other vascularplants it would explain why many shallow-water lakes consistently produce large crops of vascular plants and small crops ofphytoplankton. Moreover, if only some species of angiosperms have this ability to absorb and store particular nutrients early in theseason it might explain why such species typically occur in dense, relatively monospecific, stands. The plant having stored asurplus of nutrients can use them and translocate them to growing points when environmental conditions are optimum.
It was found that more than 50% of the total absorption of ash and macronutrients (other than Mg) occurred prior to the firstsampling date (mid-May). Though the standing crop of dry matter increased until mid-July no net uptake of N, S or Ca occurredpast mid-June. Mg content doubled between mid-May and mid-June. Samples were taken from Lake Ogletree, Alabama, U.S.A.,and a drainage ditch.
J. americana Analysis (dry weight) and crop amounts (g/m2) (Lake Ogletree):
Constituentmid-May mid-June mid-July mid-August
% DM g/m2 % DM g/m2 % DM g/m2 % DM g/m2
Ash 17.7 191.6 16.1 352.7 15.4 377.8 14.1 232.5
N 2.8 30.6 2.0 44.3 1.7 42.0 1.6 37.7
P 0.2 1.9 0.1 2.7 0.1 2.8 0.1 2.2
S 0.2 2.4 0.2 4.0 0.2 4.0 0.2 4.0
Ca 1.0 10.3 0.9 19.7 0.7 17.9 0.7 16.6
Mg 0.4 4.2 0.4 9.0 0.6 15.0 0.4 11.0
K 4.1 44.1 3.3 72.0 3.1 75.2 2.4 54.4
ppm ppm ppm ppm
Fe 904 1.0 1 085 2.4 710 1.8 1 644 3.8
Mn 125 0.14 112 0.25 51 0.13 62 0.14
Zn 278 0.3 265 0.58 156 0.38 114 0.26
Cu 27 0.03 26 0.06 33 0.08 29 0.06
% % % %
Ether extract 3.3 35.3 4.0 86.7 3.3 81.9 3.7 85.1
Cellulose 26.6 287.6 25.6 604.9 24.5 602.5 24.6 568.1
Amino acids and proteins (%)Lysine 0.6 0.5 0.4 0.4
Histidine 0.3 0.2 0.2 0.2
Arginine 0.6 0.5 0.4 0.4
Aspartic acid 1.8 1.2 0.9 0.9
Threonine 0.5 0.4 0.4 0.3
Serine 0.5 0.5 0.5 0.4
Glutamic acid 1.5 1.1 0.9 0.8
Proline 0.5 0.4 0.4 0.3
Glycine 0.6 0.5 0.4 0.4
Alanine 0.7 0.5 0.4 0.4
Cystine 0.01 0.01 0.02 0.01
Valine 0.6 0.5 0.5 0.4
Methionine 0.1 0.1 0.1 0.1
Isoleucine 0.5 0.4 0.4 0.3
Leucine 0.9 0.7 0.5 0.4
Tyrosine 0.4 0.3 0.3 0.2
Phenylalanine 0.6 0.4 0.3 0.3
Crude protein 17.7 12.6 10.7 10.2
True protein 10.8 7.9 7.0 5.9
A. philoxeroides Analyses (dry weight) and crop amounts (g/m2) (drainage ditch)
Constituent 8 May 4 June 10 July
HANDBOOK OF UTILIZATION OF AQUATIC PLANTS http://www.fao.org/docrep/003/x6862e/x6862e03.htm
7 de 20 03/02/14 11:34

% DM g/m2 % DM g/m2 % DM g/m2
Ash 13.8 52.8 14.7 123.8 11.1 88.3
N 3.5 13.5 2.9 21.1 2.3 18.0
P 0.4 1.4 0.3 2.7 0.4 3.1
S 0.4 1.4 0.3 2.4 0.2 1.9
Ca 0.6 2.4 0.5 4.4 0.7 5.4
Mg 0.6 2.3 0.5 4.4 0.4 3.2
K 5.9 22.4 5.2 43.7 3.0 24.5
Ether extract 4.8 18.5 4.2 35.0 3.1 24.4
Cellulose 21.9 83.4 24.1 203.0 21.8 173.6
Boyd points out that A. philoxeroides also has the apparent ability to absorb large quantities of mineral nutrients prior to the periodof maximum dry matter production. Though this plant and J.americana are strong competitors, yet they tend, when presenttogether, to form individual monospecific stands without substantial mutual invasion.
Boyd, C.E., 1970 Production, mineral accumulation and pigment concentrations in Typha latifolia and Scirpus americanus. Ecology,51(2):285–90
Maximum shoot standing crop of Typhalatifolia and Scirpusamericanus was recorded as 684 g/m2. Levels of nutrients andpigments declined in both species as the plants aged, as shown in the following table:
Unit
T. latifolia S. americanusApril May July April May June
Ash % DM 10.1 7.3 4.2 10.7 7.7 6.8
N % DM 2.4 1.0 0.5 2.7 1.0 0.8
P % DM 0.3 0.2 0.1 0.3 0.2 0.1
S % DM 0.2 0.2 0.1 0.7 0.6 0.6
Ca % DM 0.8 0.9 0.5 0.5 0.6 0.6
Mg % DM 0.2 0.2 0.1 0.2 0.3 0.3
K % DM 3.5 2.1 1.6 3.6 1.9 2.2
Na % DM 0.2 0.3 0.2 0.1 0.2 0.1
Carotenoids mg/g DM 4.6 4.0 0.5 4.2 3.6 3.2
Chlorophylla mg/g DM 4.0 2.8 0.6 3.8 2.2 2.1
Chlorophyllb mg/g DM 0.7 0.8 0.1 1.1 0.4 0.5
Water % fresh weight 89.2 - 69.5 85.5 - 77.0
Analysis (%) of nutrients in Typha seed heads:
N = 0.81; P = 0.23; S = 0.10; Ca = 0.25; Mg = 0.22; K = 2.41; Na = 0.07.
The most rapid uptake of several nutrients in both plants was found to occur earlier than maximum growth rates.
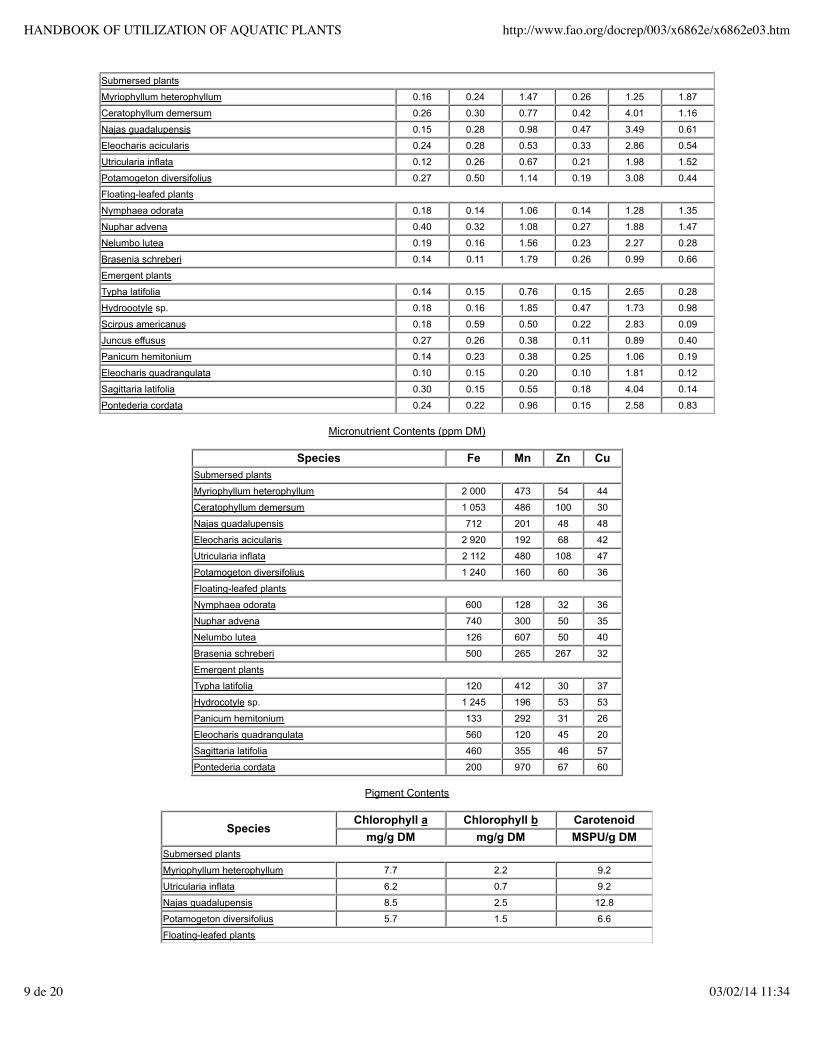
Boyd, C.E., 1970a Chemical analyses of some vascular aquatic plants. Arch.Hydrobiol., 67(1): 78–85
This paper contains analyses of various plants all collected from the same site (a 1 200-ha lake) in autumn.
The author draws attention to the wide interspecific differences in analysis from plants growing in water of the following chemicalcomposition (ppm):
Alkalinity 19.21 K 1.61NH4 - N 0.09 Na 6.70NO3 - N 0.07 Fe 0.029PO4 - P 0.008 Mn 0.002SO4 - S 1.03 Zn 0.008Ca 2.64 Cu TraceMg 1.04
Macronutrient Contents (% DM)
Species P S Ca Mg K Na
HANDBOOK OF UTILIZATION OF AQUATIC PLANTS http://www.fao.org/docrep/003/x6862e/x6862e03.htm
8 de 20 03/02/14 11:34
Submersed plants
Myriophyllum heterophyllum 0.16 0.24 1.47 0.26 1.25 1.87
Ceratophyllum demersum 0.26 0.30 0.77 0.42 4.01 1.16
Najas guadalupensis 0.15 0.28 0.98 0.47 3.49 0.61
Eleocharis acicularis 0.24 0.28 0.53 0.33 2.86 0.54
Utricularia inflata 0.12 0.26 0.67 0.21 1.98 1.52
Potamogeton diversifolius 0.27 0.50 1.14 0.19 3.08 0.44
Floating-leafed plants
Nymphaea odorata 0.18 0.14 1.06 0.14 1.28 1.35
Nuphar advena 0.40 0.32 1.08 0.27 1.88 1.47
Nelumbo lutea 0.19 0.16 1.56 0.23 2.27 0.28
Brasenia schreberi 0.14 0.11 1.79 0.26 0.99 0.66
Emergent plants
Typha latifolia 0.14 0.15 0.76 0.15 2.65 0.28
Hydroootyle sp. 0.18 0.16 1.85 0.47 1.73 0.98
Scirpus americanus 0.18 0.59 0.50 0.22 2.83 0.09
Juncus effusus 0.27 0.26 0.38 0.11 0.89 0.40
Panicum hemitonium 0.14 0.23 0.38 0.25 1.06 0.19
Eleocharis guadrangulata 0.10 0.15 0.20 0.10 1.81 0.12
Sagittaria latifolia 0.30 0.15 0.55 0.18 4.04 0.14
Pontederia cordata 0.24 0.22 0.96 0.15 2.58 0.83
Micronutrient Contents (ppm DM)
Species Fe Mn Zn CuSubmersed plants
Myriophyllum heterophyllum 2 000 473 54 44
Ceratophyllum demersum 1 053 486 100 30
Najas guadalupensis 712 201 48 48
Eleocharis acicularis 2 920 192 68 42
Utricularia inflata 2 112 480 108 47
Potamogeton diversifolius 1 240 160 60 36
Floating-leafed plants
Nymphaea odorata 600 128 32 36
Nuphar advena 740 300 50 35
Nelumbo lutea 126 607 50 40
Brasenia schreberi 500 265 267 32
Emergent plants
Typha latifolia 120 412 30 37
Hydrocotyle sp. 1 245 196 53 53
Panicum hemitonium 133 292 31 26
Eleocharis quadrangulata 560 120 45 20
Sagittaria latifolia 460 355 46 57
Pontederia cordata 200 970 67 60
Pigment Contents
SpeciesChlorophyll a Chlorophyll b Carotenoid
mg/g DM mg/g DM MSPU/g DMSubmersed plants
Myriophyllum heterophyllum 7.7 2.2 9.2
Utricularia inflata 6.2 0.7 9.2
Najas guadalupensis 8.5 2.5 12.8
Potamogeton diversifolius 5.7 1.5 6.6
Floating-leafed plants
HANDBOOK OF UTILIZATION OF AQUATIC PLANTS http://www.fao.org/docrep/003/x6862e/x6862e03.htm
9 de 20 03/02/14 11:34
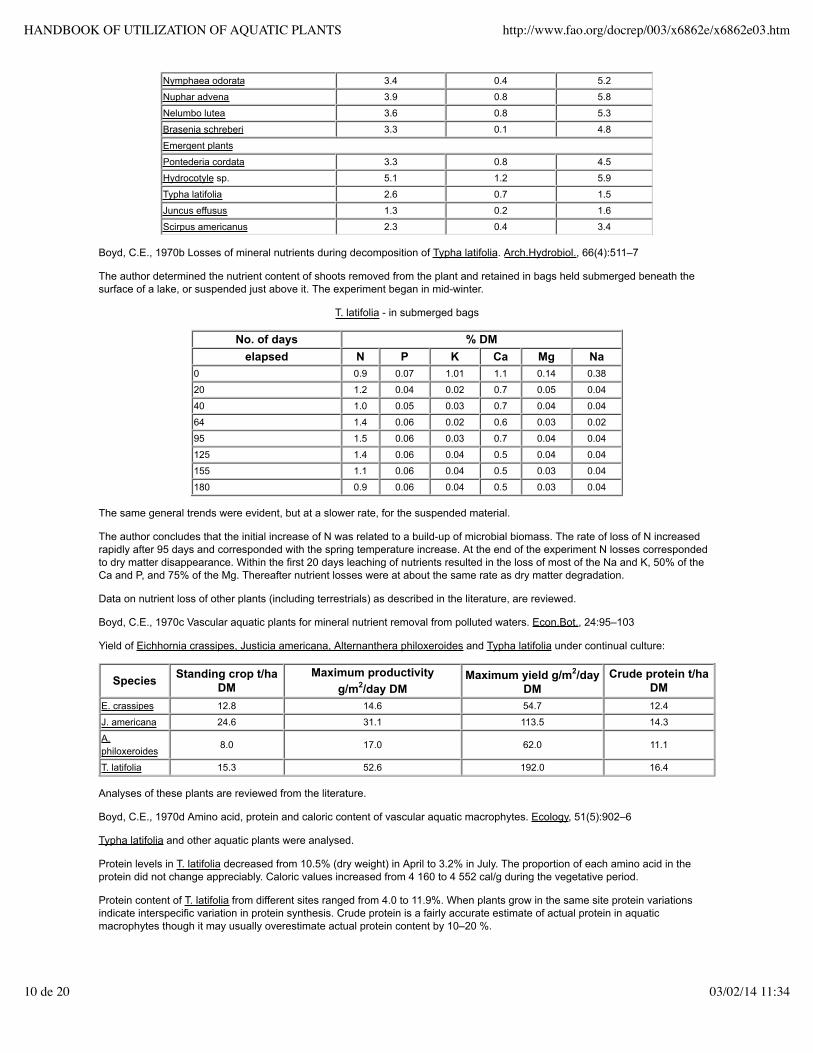
Nymphaea odorata 3.4 0.4 5.2
Nuphar advena 3.9 0.8 5.8
Nelumbo lutea 3.6 0.8 5.3
Brasenia schreberi 3.3 0.1 4.8
Emergent plants
Pontederia cordata 3.3 0.8 4.5
Hydrocotyle sp. 5.1 1.2 5.9
Typha latifolia 2.6 0.7 1.5
Juncus effusus 1.3 0.2 1.6
Scirpus americanus 2.3 0.4 3.4
Boyd, C.E., 1970b Losses of mineral nutrients during decomposition of Typha latifolia. Arch.Hydrobiol., 66(4):511–7
The author determined the nutrient content of shoots removed from the plant and retained in bags held submerged beneath thesurface of a lake, or suspended just above it. The experiment began in mid-winter.
T. latifolia - in submerged bags
No. of days % DMelapsed N P K Ca Mg Na
0 0.9 0.07 1.01 1.1 0.14 0.38
20 1.2 0.04 0.02 0.7 0.05 0.04
40 1.0 0.05 0.03 0.7 0.04 0.04
64 1.4 0.06 0.02 0.6 0.03 0.02
95 1.5 0.06 0.03 0.7 0.04 0.04
125 1.4 0.06 0.04 0.5 0.04 0.04
155 1.1 0.06 0.04 0.5 0.03 0.04
180 0.9 0.06 0.04 0.5 0.03 0.04
The same general trends were evident, but at a slower rate, for the suspended material.
The author concludes that the initial increase of N was related to a build-up of microbial biomass. The rate of loss of N increasedrapidly after 95 days and corresponded with the spring temperature increase. At the end of the experiment N losses correspondedto dry matter disappearance. Within the first 20 days leaching of nutrients resulted in the loss of most of the Na and K, 50% of theCa and P, and 75% of the Mg. Thereafter nutrient losses were at about the same rate as dry matter degradation.
Data on nutrient loss of other plants (including terrestrials) as described in the literature, are reviewed.
Boyd, C.E., 1970c Vascular aquatic plants for mineral nutrient removal from polluted waters. Econ.Bot., 24:95–103
Yield of Eichhornia crassipes, Justicia americana, Alternanthera philoxeroides and Typha latifolia under continual culture:
Species Standing crop t/haDM
Maximum productivityg/m2/day DM
Maximum yield g/m2/dayDM
Crude protein t/haDM
E. crassipes 12.8 14.6 54.7 12.4
J. americana 24.6 31.1 113.5 14.3
A.philoxeroides
8.0 17.0 62.0 11.1
T. latifolia 15.3 52.6 192.0 16.4
Analyses of these plants are reviewed from the literature.
Boyd, C.E., 1970d Amino acid, protein and caloric content of vascular aquatic macrophytes. Ecology, 51(5):902–6
Typha latifolia and other aquatic plants were analysed.
Protein levels in T. latifolia decreased from 10.5% (dry weight) in April to 3.2% in July. The proportion of each amino acid in theprotein did not change appreciably. Caloric values increased from 4 160 to 4 552 cal/g during the vegetative period.
Protein content of T. latifolia from different sites ranged from 4.0 to 11.9%. When plants grow in the same site protein variationsindicate interspecific variation in protein synthesis. Crude protein is a fairly accurate estimate of actual protein in aquaticmacrophytes though it may usually overestimate actual protein content by 10–20 %.
HANDBOOK OF UTILIZATION OF AQUATIC PLANTS http://www.fao.org/docrep/003/x6862e/x6862e03.htm
10 de 20 03/02/14 11:34
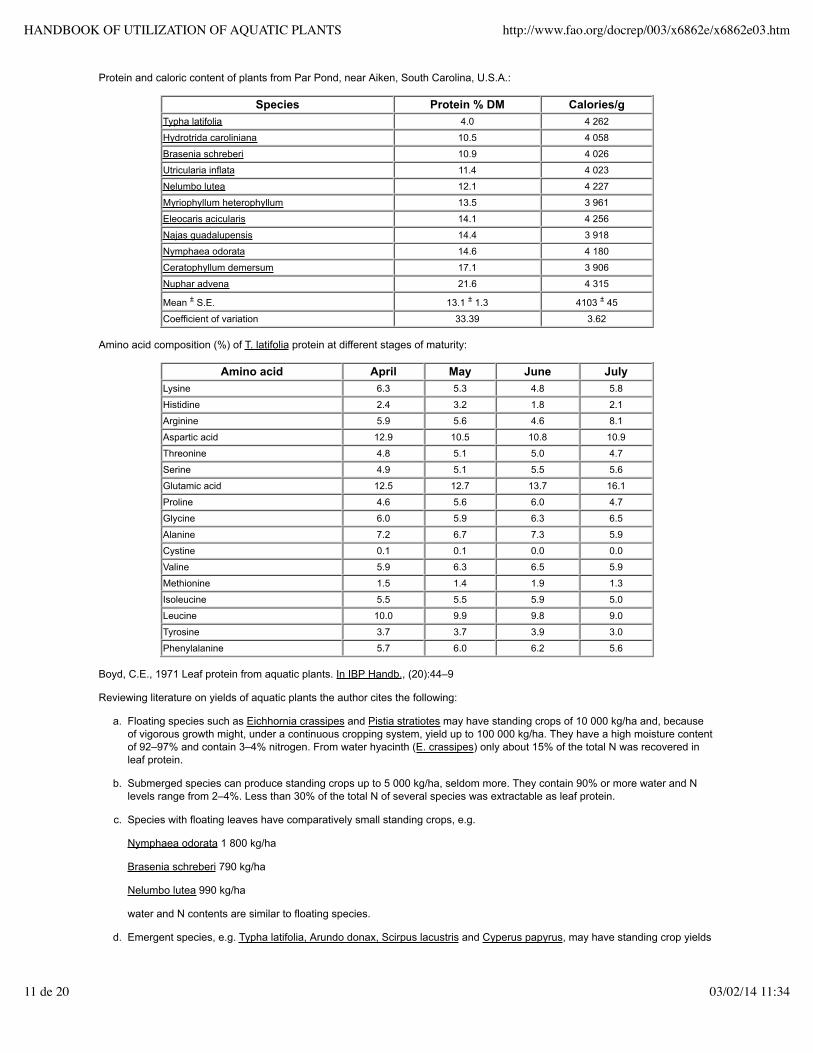
Protein and caloric content of plants from Par Pond, near Aiken, South Carolina, U.S.A.:
Species Protein % DM Calories/gTypha latifolia 4.0 4 262
Hydrotrida caroliniana 10.5 4 058
Brasenia schreberi 10.9 4 026
Utricularia inflata 11.4 4 023
Nelumbo lutea 12.1 4 227
Myriophyllum heterophyllum 13.5 3 961
Eleocaris acicularis 14.1 4 256
Najas guadalupensis 14.4 3 918
Nymphaea odorata 14.6 4 180
Ceratophyllum demersum 17.1 3 906
Nuphar advena 21.6 4 315
Mean ± S.E. 13.1 ± 1.3 4103 ± 45
Coefficient of variation 33.39 3.62
Amino acid composition (%) of T. latifolia protein at different stages of maturity:
Amino acid April May June JulyLysine 6.3 5.3 4.8 5.8
Histidine 2.4 3.2 1.8 2.1
Arginine 5.9 5.6 4.6 8.1
Aspartic acid 12.9 10.5 10.8 10.9
Threonine 4.8 5.1 5.0 4.7
Serine 4.9 5.1 5.5 5.6
Glutamic acid 12.5 12.7 13.7 16.1
Proline 4.6 5.6 6.0 4.7
Glycine 6.0 5.9 6.3 6.5
Alanine 7.2 6.7 7.3 5.9
Cystine 0.1 0.1 0.0 0.0
Valine 5.9 6.3 6.5 5.9
Methionine 1.5 1.4 1.9 1.3
Isoleucine 5.5 5.5 5.9 5.0
Leucine 10.0 9.9 9.8 9.0
Tyrosine 3.7 3.7 3.9 3.0
Phenylalanine 5.7 6.0 6.2 5.6
Boyd, C.E., 1971 Leaf protein from aquatic plants. In IBP Handb., (20):44–9
Reviewing literature on yields of aquatic plants the author cites the following:
Floating species such as Eichhornia crassipes and Pistia stratiotes may have standing crops of 10 000 kg/ha and, becauseof vigorous growth might, under a continuous cropping system, yield up to 100 000 kg/ha. They have a high moisture contentof 92–97% and contain 3–4% nitrogen. From water hyacinth (E. crassipes) only about 15% of the total N was recovered inleaf protein.
a.
Submerged species can produce standing crops up to 5 000 kg/ha, seldom more. They contain 90% or more water and Nlevels range from 2–4%. Less than 30% of the total N of several species was extractable as leaf protein.
b.
Species with floating leaves have comparatively small standing crops, e.g.
Nymphaea odorata 1 800 kg/ha
Brasenia schreberi 790 kg/ha
Nelumbo lutea 990 kg/ha
water and N contents are similar to floating species.
c.
Emergent species, e.g. Typha latifolia, Arundo donax, Scirpus lacustris and Cyperus papyrus, may have standing crop yieldsd.
HANDBOOK OF UTILIZATION OF AQUATIC PLANTS http://www.fao.org/docrep/003/x6862e/x6862e03.htm
11 de 20 03/02/14 11:34
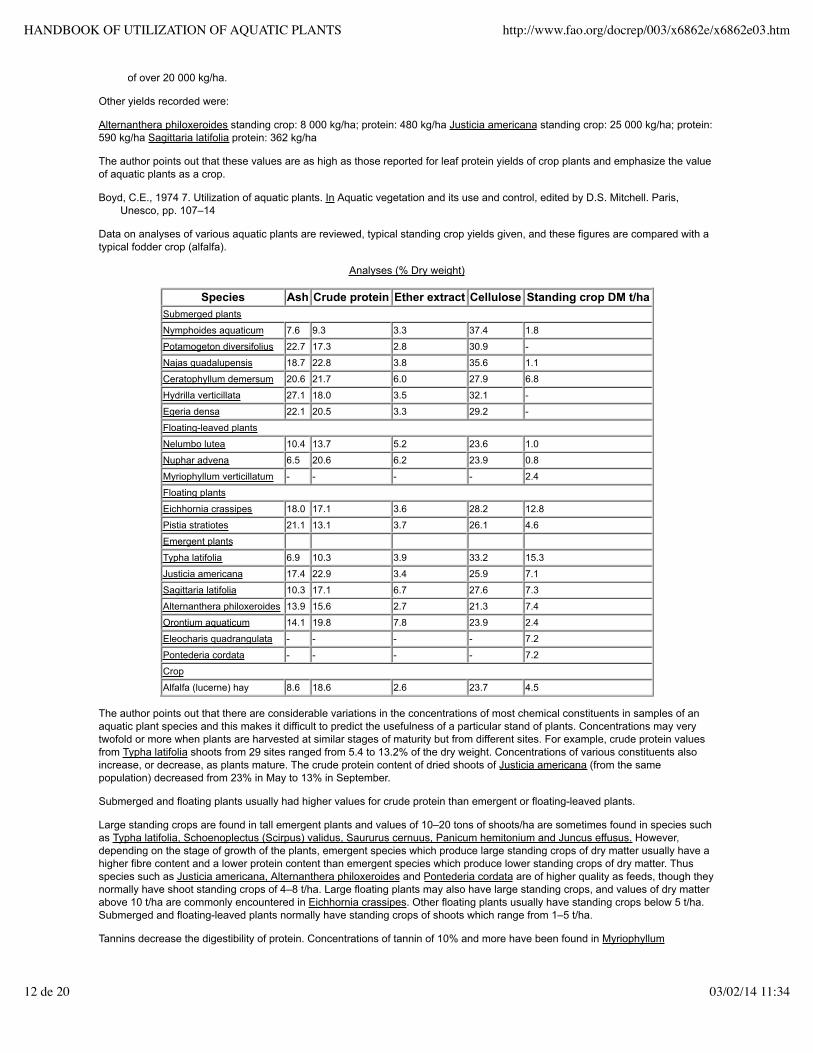
of over 20 000 kg/ha.
Other yields recorded were:
Alternanthera philoxeroides standing crop: 8 000 kg/ha; protein: 480 kg/ha Justicia americana standing crop: 25 000 kg/ha; protein:590 kg/ha Sagittaria latifolia protein: 362 kg/ha
The author points out that these values are as high as those reported for leaf protein yields of crop plants and emphasize the valueof aquatic plants as a crop.
Boyd, C.E., 1974 7. Utilization of aquatic plants. In Aquatic vegetation and its use and control, edited by D.S. Mitchell. Paris,Unesco, pp. 107–14
Data on analyses of various aquatic plants are reviewed, typical standing crop yields given, and these figures are compared with atypical fodder crop (alfalfa).
Analyses (% Dry weight)
Species Ash Crude protein Ether extract Cellulose Standing crop DM t/haSubmerged plants
Nymphoides aquaticum 7.6 9.3 3.3 37.4 1.8
Potamogeton diversifolius 22.7 17.3 2.8 30.9 -
Najas guadalupensis 18.7 22.8 3.8 35.6 1.1
Ceratophyllum demersum 20.6 21.7 6.0 27.9 6.8
Hydrilla verticillata 27.1 18.0 3.5 32.1 -
Egeria densa 22.1 20.5 3.3 29.2 -
Floating-leaved plants
Nelumbo lutea 10.4 13.7 5.2 23.6 1.0
Nuphar advena 6.5 20.6 6.2 23.9 0.8
Myriophyllum verticillatum - - - - 2.4
Floating plants
Eichhornia crassipes 18.0 17.1 3.6 28.2 12.8
Pistia stratiotes 21.1 13.1 3.7 26.1 4.6
Emergent plants
Typha latifolia 6.9 10.3 3.9 33.2 15.3
Justicia americana 17.4 22.9 3.4 25.9 7.1
Sagittaria latifolia 10.3 17.1 6.7 27.6 7.3
Alternanthera philoxeroides 13.9 15.6 2.7 21.3 7.4
Orontium aquaticum 14.1 19.8 7.8 23.9 2.4
Eleocharis quadrangulata - - - - 7.2
Pontederia cordata - - - - 7.2
Crop
Alfalfa (lucerne) hay 8.6 18.6 2.6 23.7 4.5
The author points out that there are considerable variations in the concentrations of most chemical constituents in samples of anaquatic plant species and this makes it difficult to predict the usefulness of a particular stand of plants. Concentrations may verytwofold or more when plants are harvested at similar stages of maturity but from different sites. For example, crude protein valuesfrom Typha latifolia shoots from 29 sites ranged from 5.4 to 13.2% of the dry weight. Concentrations of various constituents alsoincrease, or decrease, as plants mature. The crude protein content of dried shoots of Justicia americana (from the samepopulation) decreased from 23% in May to 13% in September.
Submerged and floating plants usually had higher values for crude protein than emergent or floating-leaved plants.
Large standing crops are found in tall emergent plants and values of 10–20 tons of shoots/ha are sometimes found in species suchas Typha latifolia, Schoenoplectus (Scirpus) validus, Saururus cernuus, Panicum hemitonium and Juncus effusus. However,depending on the stage of growth of the plants, emergent species which produce large standing crops of dry matter usually have ahigher fibre content and a lower protein content than emergent species which produce lower standing crops of dry matter. Thusspecies such as Justicia americana, Alternanthera philoxeroides and Pontederia cordata are of higher quality as feeds, though theynormally have shoot standing crops of 4–8 t/ha. Large floating plants may also have large standing crops, and values of dry matterabove 10 t/ha are commonly encountered in Eichhornia crassipes. Other floating plants usually have standing crops below 5 t/ha.Submerged and floating-leaved plants normally have standing crops of shoots which range from 1–5 t/ha.
Tannins decrease the digestibility of protein. Concentrations of tannin of 10% and more have been found in Myriophyllum
HANDBOOK OF UTILIZATION OF AQUATIC PLANTS http://www.fao.org/docrep/003/x6862e/x6862e03.htm
12 de 20 03/02/14 11:34
brasiliense, Cabomba caroliniana, Ludwigia peruviana, L. stolonifera, Brasenia schreberi and Nymphaea odorata.
Inorganic elements are found in aquatic plants at concentrations within the range of values reported for crop plants and deserve nospecial mention. However, submerged aquatic plants from hard water often have marl encrustations on external surfaces whichgreatly increase the proportion of inorganic to organic matter. Ash values of 25–50% of the dry weight are common. Such plantswould be of low nutritive value but would be useful as a calcium supplement in diets of low calcium content.
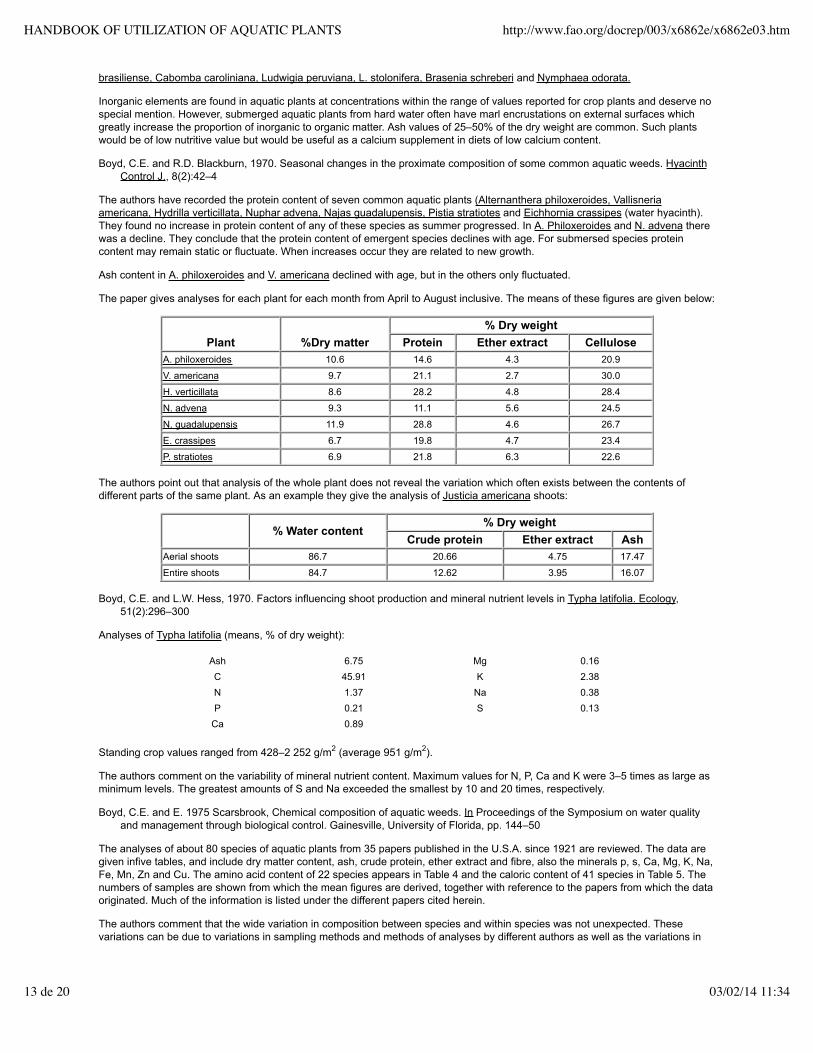
Boyd, C.E. and R.D. Blackburn, 1970. Seasonal changes in the proximate composition of some common aquatic weeds. HyacinthControl J., 8(2):42–4
The authors have recorded the protein content of seven common aquatic plants (Alternanthera philoxeroides, Vallisneriaamericana, Hydrilla verticillata, Nuphar advena, Najas guadalupensis, Pistia stratiotes and Eichhornia crassipes (water hyacinth).They found no increase in protein content of any of these species as summer progressed. In A. Philoxeroides and N. advena therewas a decline. They conclude that the protein content of emergent species declines with age. For submersed species proteincontent may remain static or fluctuate. When increases occur they are related to new growth.
Ash content in A. philoxeroides and V. americana declined with age, but in the others only fluctuated.
The paper gives analyses for each plant for each month from April to August inclusive. The means of these figures are given below:
Plant %Dry matter% Dry weight
Protein Ether extract CelluloseA. philoxeroides 10.6 14.6 4.3 20.9
V. americana 9.7 21.1 2.7 30.0
H. verticillata 8.6 28.2 4.8 28.4
N. advena 9.3 11.1 5.6 24.5
N. guadalupensis 11.9 28.8 4.6 26.7
E. crassipes 6.7 19.8 4.7 23.4
P. stratiotes 6.9 21.8 6.3 22.6
The authors point out that analysis of the whole plant does not reveal the variation which often exists between the contents ofdifferent parts of the same plant. As an example they give the analysis of Justicia americana shoots:
% Water content% Dry weight
Crude protein Ether extract AshAerial shoots 86.7 20.66 4.75 17.47
Entire shoots 84.7 12.62 3.95 16.07
Boyd, C.E. and L.W. Hess, 1970. Factors influencing shoot production and mineral nutrient levels in Typha latifolia. Ecology,51(2):296–300
Analyses of Typha latifolia (means, % of dry weight):
Ash 6.75 Mg 0.16C 45.91 K 2.38N 1.37 Na 0.38P 0.21 S 0.13
Ca 0.89
Standing crop values ranged from 428–2 252 g/m2 (average 951 g/m2).
The authors comment on the variability of mineral nutrient content. Maximum values for N, P, Ca and K were 3–5 times as large asminimum levels. The greatest amounts of S and Na exceeded the smallest by 10 and 20 times, respectively.
Boyd, C.E. and E. 1975 Scarsbrook, Chemical composition of aquatic weeds. In Proceedings of the Symposium on water qualityand management through biological control. Gainesville, University of Florida, pp. 144–50
The analyses of about 80 species of aquatic plants from 35 papers published in the U.S.A. since 1921 are reviewed. The data aregiven infive tables, and include dry matter content, ash, crude protein, ether extract and fibre, also the minerals p, s, Ca, Mg, K, Na,Fe, Mn, Zn and Cu. The amino acid content of 22 species appears in Table 4 and the caloric content of 41 species in Table 5. Thenumbers of samples are shown from which the mean figures are derived, together with reference to the papers from which the dataoriginated. Much of the information is listed under the different papers cited herein.
The authors comment that the wide variation in composition between species and within species was not unexpected. Thesevariations can be due to variations in sampling methods and methods of analyses by different authors as well as the variations in
HANDBOOK OF UTILIZATION OF AQUATIC PLANTS http://www.fao.org/docrep/003/x6862e/x6862e03.htm
13 de 20 03/02/14 11:34

content within the same species when growing in different sites and at different stages of growth.
*Byers, M.,1961 Extraction of protein from the leaves of some plants growing in Ghana. J.Sci.Food Agric., 12: 20–30
Analyses of three common aquatic plants:
Dry matter % of leaf N % of DMPistia stratiotes 5.69 1.71
Nymphaea lotus 10.0 3.14
Polygonum sp. (= senegalense?) 20.6 3.02
Caines, L.A., 1965 The phosphorous content of some aquatic macrophytes with special reference to seasonal fluctuations andapplications of phosphate fertilizer. Hydrobiologia, 25:289–301
In studies of phosphorous content of various aquatic plants the analyses (whole plant) were:
P Content (mg/g DM)Carex rostrata 0.78Eleogiton fluitans 1.52Equisetum fluviatile 1.90Littorella uniflora 2.47Lobelia dortmanna 2.05Myriophyllum alterniflorum 0.95Potamogeton praelongus 1.58
The lake in which these plants were growing was later fertilized with calcium superphosphate (at 126 kg/ha). Only the last twospecies showed evidence of greater uptake. The analyses taken 14 days later were:
M. alterniflorum P (mg/kg) 2.58P. praelongus P (mg/kg) 2.38
Analyses of the P content of two species of Myriophyllum, from two different lakes in Scotland, were made at intervals from springto autumn (% dry weight):
MonthM. spicatum M. alterniflorum (1957)
1954 1955 Entire plant Growing tipApril - 2.5 - -
May - - 4.3 6.7
June 1.5 1.8 2.2 2.7
August 0.9 1.5 1.7 3.9
September - - 1.2 2.8
October - 1.8 1.7 4.2
November - - 1.4 3.5
December - - 1.8 3.0
The author points out the seasonal variation in P content of the plants which he says is related to their growing, flowering andfruiting phases. He showed that the highest concentration was found in the growing tips.
Chalmers, M.I., 1968 Report to World Food Programme on a visit to Sudan. In Animal production WFP. Mission report on animalnutrition in Sudan. Study on the use of water hyacinths in ruminant animal feeding and also as a means of weed control.Rome, FAO, Acc. No. 02787–68–WS
Analysis of water hyacinth:
% of Fresh weight % of Oven-dried weight Lamina1 & petiole Lamina only Lamina Petiole Root
Dry matter 9.6 - 94.0 93.2 94.5
Organic matter 8.5 - - - -
Crude protein 0.75 2.08 11.8 0.7 1.2
Total ash 1.1 - - - -
Insoluble ash 0.08 - - - -
HANDBOOK OF UTILIZATION OF AQUATIC PLANTS http://www.fao.org/docrep/003/x6862e/x6862e03.htm
14 de 20 03/02/14 11:34
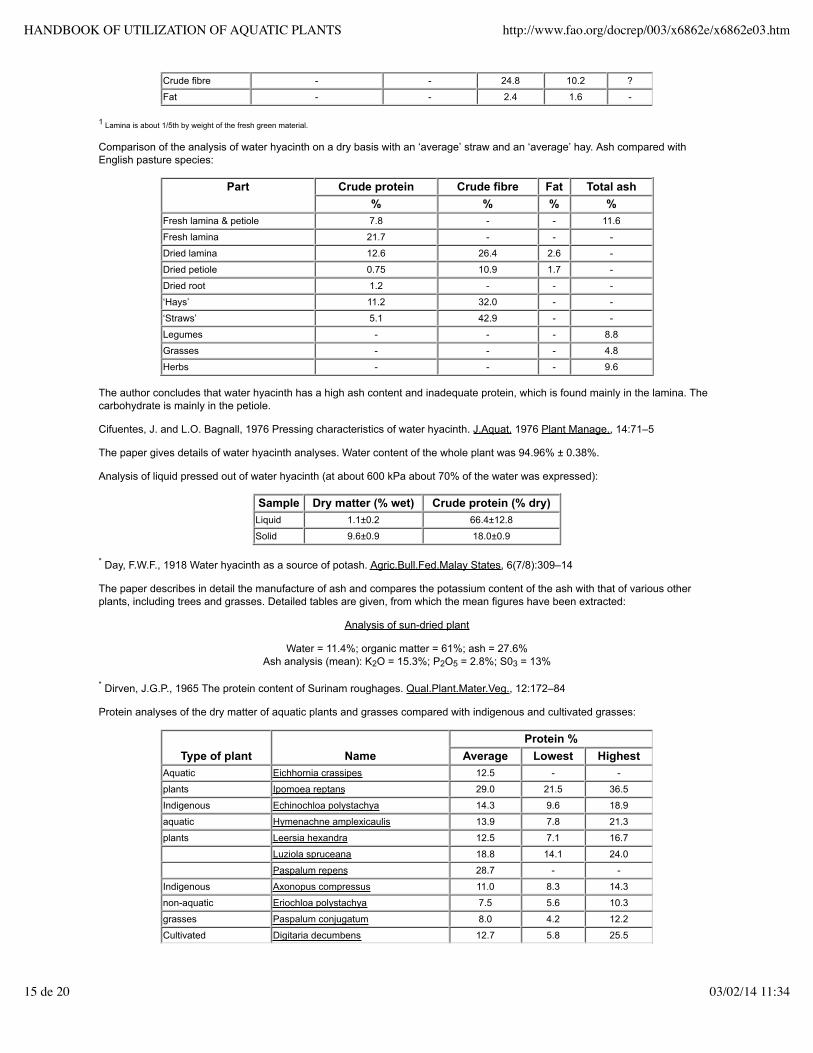
Crude fibre - - 24.8 10.2 ?
Fat - - 2.4 1.6 -
1 Lamina is about 1/5th by weight of the fresh green material.
Comparison of the analysis of water hyacinth on a dry basis with an ‘average’ straw and an ‘average’ hay. Ash compared withEnglish pasture species:
Part Crude protein Crude fibre Fat Total ash% % % %
Fresh lamina & petiole 7.8 - - 11.6
Fresh lamina 21.7 - - -
Dried lamina 12.6 26.4 2.6 -
Dried petiole 0.75 10.9 1.7 -
Dried root 1.2 - - -
‘Hays’ 11.2 32.0 - -
‘Straws’ 5.1 42.9 - -
Legumes - - - 8.8
Grasses - - - 4.8
Herbs - - - 9.6
The author concludes that water hyacinth has a high ash content and inadequate protein, which is found mainly in the lamina. Thecarbohydrate is mainly in the petiole.
Cifuentes, J. and L.O. Bagnall, 1976 Pressing characteristics of water hyacinth. J.Aquat. 1976 Plant Manage., 14:71–5
The paper gives details of water hyacinth analyses. Water content of the whole plant was 94.96% ± 0.38%.
Analysis of liquid pressed out of water hyacinth (at about 600 kPa about 70% of the water was expressed):
Sample Dry matter (% wet) Crude protein (% dry)Liquid 1.1±0.2 66.4±12.8
Solid 9.6±0.9 18.0±0.9
* Day, F.W.F., 1918 Water hyacinth as a source of potash. Agric.Bull.Fed.Malay States, 6(7/8):309–14
The paper describes in detail the manufacture of ash and compares the potassium content of the ash with that of various otherplants, including trees and grasses. Detailed tables are given, from which the mean figures have been extracted:
Analysis of sun-dried plant
Water = 11.4%; organic matter = 61%; ash = 27.6%Ash analysis (mean): K2O = 15.3%; P2O5 = 2.8%; S03 = 13%
* Dirven, J.G.P., 1965 The protein content of Surinam roughages. Qual.Plant.Mater.Veg., 12:172–84
Protein analyses of the dry matter of aquatic plants and grasses compared with indigenous and cultivated grasses:
Type of plant NameProtein %
Average Lowest HighestAquatic Eichhornia crassipes 12.5 - -
plants Ipomoea reptans 29.0 21.5 36.5
Indigenous Echinochloa polystachya 14.3 9.6 18.9
aquatic Hymenachne amplexicaulis 13.9 7.8 21.3
plants Leersia hexandra 12.5 7.1 16.7
Luziola spruceana 18.8 14.1 24.0
Paspalum repens 28.7 - -
Indigenous Axonopus compressus 11.0 8.3 14.3
non-aquatic Eriochloa polystachya 7.5 5.6 10.3
grasses Paspalum conjugatum 8.0 4.2 12.2
Cultivated Digitaria decumbens 12.7 5.8 25.5
HANDBOOK OF UTILIZATION OF AQUATIC PLANTS http://www.fao.org/docrep/003/x6862e/x6862e03.htm
15 de 20 03/02/14 11:34
grasses Ischaemum aristatum 9.2 5.5 14.2
I. timorense 7.5 5.1 10.7
Brachiaria purpurascens 8.5 4.3 18.9
Pennisetum purpureum 8.3 3.1 15.6
Zea mays 7.2 3.3 12.9
Easley, J.F. and R.L. Shirley,1974. Nutrient elements for livestock in aquatic plants. Hyacinth Control J., 12:82–5
Analyses of Hydrilla verticillata, Eichhornia crassipes, Ceratophyllum demersum, Potamogeton pectinatus, Vallisneria americanaand Najas guadalupensis for their value as stock food showed that the elements K, Mg, Cu, Zn and Mn were present at a range ofconcentrations similar to those of land plants. Na, Fe and Ca were higher, while P tended to be lower. E. crassipes (waterhyacinth), exceptionally, had a lower Ca concentration (only 2%) (see Chapter VII).
Fekete, A., D. Riemer and H.L. Motto, 1972. Removal of Rhizoclonium from a pond and its relationship to dissolved nutrients.Proc.Northeast.Weed Sci.Soc., 26:193–6
The paper gives details of studies of a filamentous alga, Rhizoclonium sp. Analysis: N = 3.64 - 3.87%; P = 0.14 - 0.17%Yield: 4 600 kg/ha dry weight.
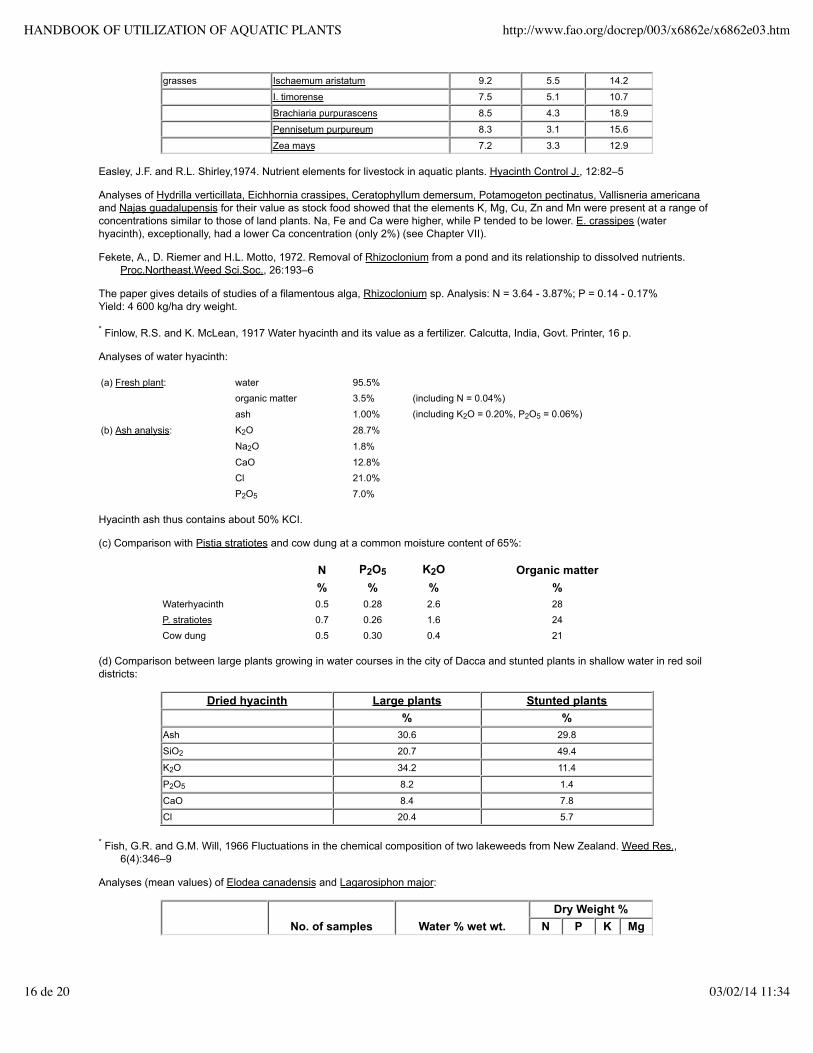
* Finlow, R.S. and K. McLean, 1917 Water hyacinth and its value as a fertilizer. Calcutta, India, Govt. Printer, 16 p.
Analyses of water hyacinth:
(a) Fresh plant: water 95.5%organic matter 3.5% (including N = 0.04%)ash 1.00% (including K2O = 0.20%, P2O5 = 0.06%)
(b) Ash analysis: K2O 28.7%Na2O 1.8%CaO 12.8%Cl 21.0%P2O5 7.0%
Hyacinth ash thus contains about 50% KCI.
(c) Comparison with Pistia stratiotes and cow dung at a common moisture content of 65%:
N P2O5 K2O Organic matter % % % %
Waterhyacinth 0.5 0.28 2.6 28P. stratiotes 0.7 0.26 1.6 24Cow dung 0.5 0.30 0.4 21
(d) Comparison between large plants growing in water courses in the city of Dacca and stunted plants in shallow water in red soildistricts:
Dried hyacinth Large plants Stunted plants % %
Ash 30.6 29.8
SiO2 20.7 49.4
K2O 34.2 11.4
P2O5 8.2 1.4
CaO 8.4 7.8
Cl 20.4 5.7
* Fish, G.R. and G.M. Will, 1966 Fluctuations in the chemical composition of two lakeweeds from New Zealand. Weed Res.,6(4):346–9
Analyses (mean values) of Elodea canadensis and Lagarosiphon major:
No. of samples Water % wet wt.
Dry Weight %N P K Mg
HANDBOOK OF UTILIZATION OF AQUATIC PLANTS http://www.fao.org/docrep/003/x6862e/x6862e03.htm
16 de 20 03/02/14 11:34
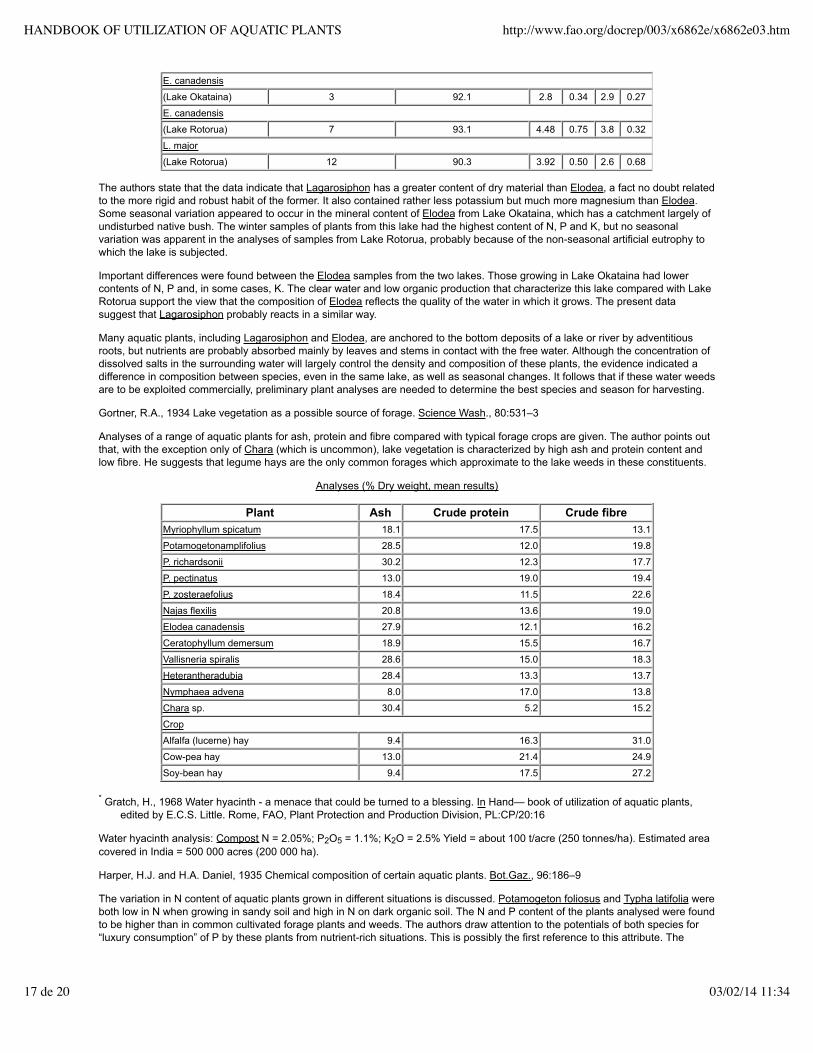
E. canadensis
(Lake Okataina) 3 92.1 2.8 0.34 2.9 0.27
E. canadensis
(Lake Rotorua) 7 93.1 4.48 0.75 3.8 0.32
L. major
(Lake Rotorua) 12 90.3 3.92 0.50 2.6 0.68
The authors state that the data indicate that Lagarosiphon has a greater content of dry material than Elodea, a fact no doubt relatedto the more rigid and robust habit of the former. It also contained rather less potassium but much more magnesium than Elodea.Some seasonal variation appeared to occur in the mineral content of Elodea from Lake Okataina, which has a catchment largely ofundisturbed native bush. The winter samples of plants from this lake had the highest content of N, P and K, but no seasonalvariation was apparent in the analyses of samples from Lake Rotorua, probably because of the non-seasonal artificial eutrophy towhich the lake is subjected.
Important differences were found between the Elodea samples from the two lakes. Those growing in Lake Okataina had lowercontents of N, P and, in some cases, K. The clear water and low organic production that characterize this lake compared with LakeRotorua support the view that the composition of Elodea reflects the quality of the water in which it grows. The present datasuggest that Lagarosiphon probably reacts in a similar way.
Many aquatic plants, including Lagarosiphon and Elodea, are anchored to the bottom deposits of a lake or river by adventitiousroots, but nutrients are probably absorbed mainly by leaves and stems in contact with the free water. Although the concentration ofdissolved salts in the surrounding water will largely control the density and composition of these plants, the evidence indicated adifference in composition between species, even in the same lake, as well as seasonal changes. It follows that if these water weedsare to be exploited commercially, preliminary plant analyses are needed to determine the best species and season for harvesting.
Gortner, R.A., 1934 Lake vegetation as a possible source of forage. Science Wash., 80:531–3
Analyses of a range of aquatic plants for ash, protein and fibre compared with typical forage crops are given. The author points outthat, with the exception only of Chara (which is uncommon), lake vegetation is characterized by high ash and protein content andlow fibre. He suggests that legume hays are the only common forages which approximate to the lake weeds in these constituents.
Analyses (% Dry weight, mean results)
Plant Ash Crude protein Crude fibreMyriophyllum spicatum 18.1 17.5 13.1
Potamogetonamplifolius 28.5 12.0 19.8
P. richardsonii 30.2 12.3 17.7
P. pectinatus 13.0 19.0 19.4
P. zosteraefolius 18.4 11.5 22.6
Najas flexilis 20.8 13.6 19.0
Elodea canadensis 27.9 12.1 16.2
Ceratophyllum demersum 18.9 15.5 16.7
Vallisneria spiralis 28.6 15.0 18.3
Heterantheradubia 28.4 13.3 13.7
Nymphaea advena 8.0 17.0 13.8
Chara sp. 30.4 5.2 15.2
Crop
Alfalfa (lucerne) hay 9.4 16.3 31.0
Cow-pea hay 13.0 21.4 24.9
Soy-bean hay 9.4 17.5 27.2
* Gratch, H., 1968 Water hyacinth - a menace that could be turned to a blessing. In Hand— book of utilization of aquatic plants,edited by E.C.S. Little. Rome, FAO, Plant Protection and Production Division, PL:CP/20:16
Water hyacinth analysis: Compost N = 2.05%; P2O5 = 1.1%; K2O = 2.5% Yield = about 100 t/acre (250 tonnes/ha). Estimated areacovered in India = 500 000 acres (200 000 ha).
Harper, H.J. and H.A. Daniel, 1935 Chemical composition of certain aquatic plants. Bot.Gaz., 96:186–9
The variation in N content of aquatic plants grown in different situations is discussed. Potamogeton foliosus and Typha latifolia wereboth low in N when growing in sandy soil and high in N on dark organic soil. The N and P content of the plants analysed were foundto be higher than in common cultivated forage plants and weeds. The authors draw attention to the potentials of both species for“luxury consumption” of P by these plants from nutrient-rich situations. This is possibly the first reference to this attribute. The
HANDBOOK OF UTILIZATION OF AQUATIC PLANTS http://www.fao.org/docrep/003/x6862e/x6862e03.htm
17 de 20 03/02/14 11:34
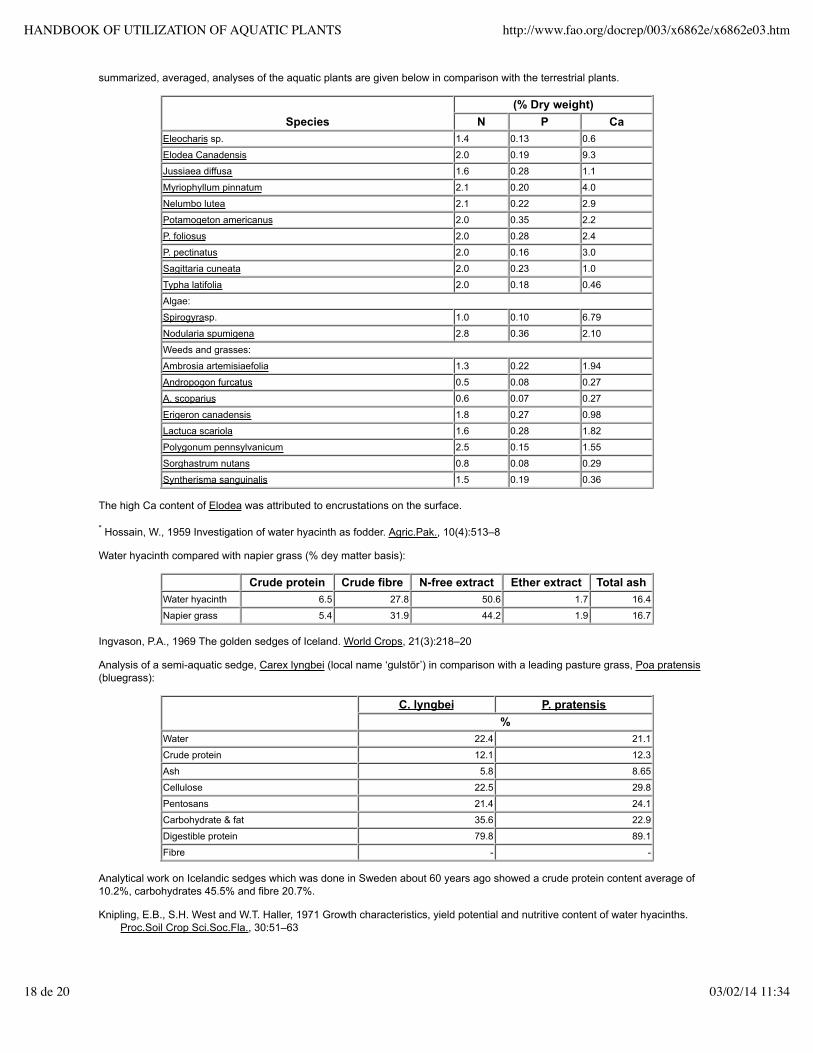
summarized, averaged, analyses of the aquatic plants are given below in comparison with the terrestrial plants.
Species(% Dry weight)
N P CaEleocharis sp. 1.4 0.13 0.6
Elodea Canadensis 2.0 0.19 9.3
Jussiaea diffusa 1.6 0.28 1.1
Myriophyllum pinnatum 2.1 0.20 4.0
Nelumbo lutea 2.1 0.22 2.9
Potamogeton americanus 2.0 0.35 2.2
P. foliosus 2.0 0.28 2.4
P. pectinatus 2.0 0.16 3.0
Sagittaria cuneata 2.0 0.23 1.0
Typha latifolia 2.0 0.18 0.46
Algae:
Spirogyrasp. 1.0 0.10 6.79
Nodularia spumigena 2.8 0.36 2.10
Weeds and grasses:
Ambrosia artemisiaefolia 1.3 0.22 1.94
Andropogon furcatus 0.5 0.08 0.27
A. scoparius 0.6 0.07 0.27
Erigeron canadensis 1.8 0.27 0.98
Lactuca scariola 1.6 0.28 1.82
Polygonum pennsylvanicum 2.5 0.15 1.55
Sorghastrum nutans 0.8 0.08 0.29
Syntherisma sanguinalis 1.5 0.19 0.36
The high Ca content of Elodea was attributed to encrustations on the surface.
* Hossain, W., 1959 Investigation of water hyacinth as fodder. Agric.Pak., 10(4):513–8
Water hyacinth compared with napier grass (% dey matter basis):
Crude protein Crude fibre N-free extract Ether extract Total ashWater hyacinth 6.5 27.8 50.6 1.7 16.4
Napier grass 5.4 31.9 44.2 1.9 16.7
Ingvason, P.A., 1969 The golden sedges of Iceland. World Crops, 21(3):218–20
Analysis of a semi-aquatic sedge, Carex lyngbei (local name ‘gulstör’) in comparison with a leading pasture grass, Poa pratensis(bluegrass):
C. lyngbei P. pratensis
%Water 22.4 21.1
Crude protein 12.1 12.3
Ash 5.8 8.65
Cellulose 22.5 29.8
Pentosans 21.4 24.1
Carbohydrate & fat 35.6 22.9
Digestible protein 79.8 89.1
Fibre - -
Analytical work on Icelandic sedges which was done in Sweden about 60 years ago showed a crude protein content average of10.2%, carbohydrates 45.5% and fibre 20.7%.
Knipling, E.B., S.H. West and W.T. Haller, 1971 Growth characteristics, yield potential and nutritive content of water hyacinths.Proc.Soil Crop Sci.Soc.Fla., 30:51–63
HANDBOOK OF UTILIZATION OF AQUATIC PLANTS http://www.fao.org/docrep/003/x6862e/x6862e03.htm
18 de 20 03/02/14 11:34

Water hyacinth analysis (% of dry matter):
N =1.75; Ca =3.06; P = 0.63; K = 3.07; Mg = 0.63
Optimum temperature for growth is stated as 28–30°C.
Koegel, R.G., 1973 et al., 1973 Increasing the efficiency of aquatic plant management through processing. Hyacinth Control J.,11:24–30
Analysis of Eurasian water milfoil, Myriophyllum spicatum:
Fresh DryWater 93.5% Protein 20–25 %
Crude fibre 10–12%
Xanthophylls 650–1100 ppm
Lancaster, R.J., M.R. Coup and J.W. Hughes, 1971 Toxicity of arsenic present in lakeweed. N.Z.Vet.J., 19(7):141–5
Analysis of three species of aquatic weeds compared with good pasture:
% Dry weight Water content % N P K Na Ca Mg Ash
Elodea sp. 87.7 2.6 0.43 3.1 0.97 2.6 0.29 7.3
Lagarosiphon sp. 88.1 2.9 0.35 1.6 1.2 2.5 0.43 7.0
Lagarosiphon sp. 94.2 3.8 0.74 3.5 0.71 1.0 0.29 29.9
Ceratophyllum sp. 91.5 3.3 0.47 5.9 0.68 0.66 0.52 7.0
High quality
pasture 85.0 3.5 0.4 3.0 0.3 0.8 0.2 10.0
The authors do not comment on the substantial differences in analysis between the two samples of Lagarosiphon - especially thehigh ash content of the second sample.
Lawrence, J.M. and W.W. Mixon, 1970 Comparative nutrient content of aquatic plants from different habitats.Proc.Annu.Meet.South.Weed Sci.Soc., 23:306–10
Analyses of Eichhornia crassipes (water hyacinth), Alternanthera philoxeroides (alligator weed) and Justicia americana (waterwillow) from different habitats containing a wide range of nutrients, and covering a period of four years, are recorded. The results,averaged and summarized below, reveal the wide range of N, P and K the plants can contain if growing in water fertilized to variousdegrees with these elements.
Water habitat
% Dry weightN P K
E. crassipes Raw sewage 2.20 0.38 3.83
Agricultural pollution 2.55 0.42 4.4
Unfertilized pools 1.11 0.16 2.15
A. philoxeroides Raw sewage 3.19 0.27 4.74
Agricultural pollution 1.76 0.14 4.23
Unfertilized pools 0.88 0.08 0.99
J. americana Raw sewage 3.25 0.21 2.65
Agricultural pollution 3.20 0.34 4.20
Unfertilized pools 1.00 0.23 1.12
The authors conclude that these results clearly demonstrate the variation in elemental composition of plants of the same species.They have shown how aquatic plants, when growing in water containing ample quantities of N, P and K, will exploit the situation by“luxury consumption” of these elements, far in excess of what they need for healthy growth. The plants growing in low N pools, forexample, appeared just as healthy as those growing in water with high N from sewage. An extreme example was in K uptake by A.philoxeroides. In one case consumption was 20 times the content of plants grown in unfertilized pools (7.3% K compared with0.36%).
Linn, J.G., 1975 et al., Nutritive value of dried or ensiled aquatic plants. 1. Chemical composition. J.Anim.Sci., 41(1):601–9
HANDBOOK OF UTILIZATION OF AQUATIC PLANTS http://www.fao.org/docrep/003/x6862e/x6862e03.htm
19 de 20 03/02/14 11:34

HANDBOOK OF UTILIZATION OF AQUATIC PLANTS http://www.fao.org/docrep/003/x6862e/x6862e03.htm
20 de 20 03/02/14 11:34