handbook of urban statisticsmohua.gov.in/pdf/5c80e1b20f2e2handbook of urban statistics 2016.… ·...
TRANSCRIPT

GOVERNMENT OF INDIA
MINISTRY OF URBAN DEVELOPMENT
HANDBOOK OF
URBAN STATISTICS
2016


Handbookof
Urban Statistics2016
GOVERNMENT OF INDIAMINISTRY OF URBAN DEVELOPMENT


It gives me immense pleasure to know that the Ministry of Urban Development in
collaboration with National Institute of Urban Affairs (NIUA) is publishing a Handbook of
Urban Statistics for the first time. The effort to develop a statistical compendium on Urban
Development with all key information at one place is laudable. The Handbook contains
authentic and reliable data in a usable form for the purpose of informed decision-making.
2. The Handbook of Urban Statistics is a compilation of data on various indicators of Urban
India such as Demography, Employment, Transportation, Sanitation, Housing, Socio-economic
Indicators and Public Expenditure on Urban Development. The Handbook also includes write-
ups on flagship schemes of the Ministry of Urban Development, namely, Swachh Bharat Mission
(Urban), National Heritage City Development and Augmentation Yojana (HRIDAY), Smart City
Mission (SCM) and Atal Mission for Rejuvenation and Urban Transformation (AMRUT).
3. I express my compliments to the officers engaged in this endeavour for their meticulous
work in bringing out this Publication with data pooled from various reliable sources. I am
confident that this Publication will serve as a valuable tool in the hands of policy makers,
planners, administrators, researchers and other stakeholders in urban development.
(M. Venkaiah Naidu)
M. Venkaiah Naidu
MESSAGE
MINISTER OF URBAN DEVELOPMENT,HOUSING & URBAN POVERTY ALLEVIATION
AND PARLIAMENTARY AFFAIRSGOVERNMENT OF INDIA
Office :-Room No. 104-C, Nirman Bhawan, New Delhi-110108; Phone : 011-23061166, 23061162, 23062089 (Fax)Residence :- 30, APJ Abdul Kalam Road, New Delhi-110011; 23019387, 23019388 (Telefax)


I am glad to know that Ministry of Urban Development and National Institute of Urban
Affairs (NIUA) are bringing out the Handbook of Urban Statistics. The need for such a publication,
with all important information on the urban sector of India at one place, has been felt for
long. This Handbook is an effort to compile salient data pertaining to urban development from
various reliable sources. Care has been taken to ensure that the latest census data released by
the Registrar General of India (RGI), National Sample Survey (NSSO) Reports and other agencies
are included in the Handbook.
The Handbook is intended to provide authentic and reliable database covering various
aspects of urban sector such as urban demography, socio-economic indicators of various urban
centres in the country, urban employment, public expenditure on urban development, urban
transport and performance of cities under urban reform indicators. Information on flagship
schemes launched by this Ministry such as Swachh Bharat Mission (Urban), National Heritage
City Development and Augmentation Yojana (HRIDAY), Smart City Mission (SCM) and Atal
Mission for Rejuvenation and Urban Transformation (AMRUT) and Urban Transport have also
been included.
I appreciate the efforts put in by the officials of this Ministry and NIUA team. I am
confident that this Handbook will serve as an information base for the purpose of planning,
policy-making, project and programme design, implementation, monitoring and evaluation of
programmes in the urban sector. Also, the information on our urban landscape at one place
will be useful to the State Governments, Urban Local Bodies, researchers, consultants and
various other stakeholders.
M. PRASADSecretary
FOREwORD
Government of IndiaMinistry of Urban Development
Nirman Bhawan, New Delhi-110011


Introduction
India is witnessing rapid urbanization. According to Census 2011, about 377 million
Indians comprising 31.14% of the country’s population lived in urban areas. The urban
population is projected to grow to about 600 million (40%) by 2031 and 850 million (50%) by
2051. Rapid urbanization brings challenges, including meeting accelerated demand for basic
services, infrastructure, jobs, land and affordable housing, particularly for the urban poor. There
is a need for evidence-based policy making to address these challenges in an effective and
efficient manner.
2. At present, data on various aspects of urbanization is brought out by different agencies
and there is no compendium of statistics on urban development. It is imperative to have
concrete and reliable datasets to help formulate appropriate policies. However, non-availability
of authentic and reliable data in an easily accessible manner has often been one of the important
constraints to informed policy making and also for the researchers studying diverse aspects of
urban development in India. A need was, therefore, felt for a compilation of data related to
urban sector, which would also facilitate comparisons across various countries and across States
within India. The ‘Handbook of Urban Statistics’ aims at fulfilling this need.
3. In this first edition of the ‘Handbook of Urban Statistics’, efforts have been made to compile
salient information pertaining to trends and pattern of urban demography, socio-economic
indicators, employment, public expenditure on urban development, urban transportation,
sanitation and housing in urban India. Wherever possible, international comparisons have
been included. A Town Directory with population as per census 2011 has been included as
Annexure-1 of the Handbook. Performance of various cities and States under the erstwhile
Jawaharlal Nehru National Urban Renewal Mission (JNNURM) are included in Annexure-2.
Government of India has undertaken some major initiatives to address the challenges of rapid
urbanization, which include the launch of missions like Atal Mission for Rejuvenation and Urban
Transformation (AMRUT), Smart City Mission, Swachh Bharat Mission (SBM), and National
Heritage City Development and Augmentation Yojana (HRIDAY). Annexure-3 of the Handbook
contains brief information on these missions.
4. Chapter 1 focuses on key demographic indicators of urban India. The data in this
Chapter facilitate comparison of demographic indicators across States in India. International
comparisons are also included, particularly in the context of Brazil-Russia-India-China-South

Africa (BRICS) and South Asian Association for Regional Cooperation (SAARC) countries.
Urban population in India grew from 286 million in 2001 to 377 million in 2011. Though this
is a large number in absolute terms, we still lag behind relatively in the world arena as 53.6%
of the world population lived in urban areas in 2014 as per the World Urbanization Prospects
(2014) published by United Nations. For the first time since independence, the increase in
urban population of 91 million is larger than increase in the rural population of 90.5 million.
Annual growth rate of urban population was 2.76% during 2001-2011, which is slightly above
that experienced during 1991-2001. In terms of overall urban population, Maharashtra had
the largest urban population of 50.8 million followed by Uttar Pradesh, which had an urban
population of 44.5 million in 2011.
5. Socio-economic indicators provide an understanding of how growth has impacted
development. The socio-economic indicators covered in Chapter 2 include data on education,
health, gender, poverty, housing, amenities and other development indicators. As seen in the
data in Chapter 2, there has been an improvement in all the socio-economic indicators in urban
areas in the last decade. Poverty ratio in urban areas has shown improvement from 25.5% in
2004-05 to 13.7% in 2011-12. Literacy rate in urban India has shown an improvement from
73.08% in 1991 to 79.9% in 2001 and 84.1% in 2011. Sex ratio in urban India improved from
900 (females per thousand males) in 2001 to 929 in 2011. The data in the Chapter also shows
that though there has been an improvement in various socio-economic indicators, wide inter-
State disparity persists.
6. Employment generation is one of the main challenges for economic policy makers
in India so as to exploit the demographic dividend and boost economic growth. Chapter
3 focuses on urban employment indicators such as labour force participation rate, work
force participation rate, unemployment rate, wages of employees, etc. NSSO data on urban
employment shows an encouraging trend of decline in unemployment rates in urban areas.
Urban unemployment rate in terms of usual status declined from 5.2% in 1999-2000 to 3.8%
in 2011-12. Although the unemployment rates declined for both males and females, it was
seen that unemployment continues to be higher among females than males.
7. Investment in the urban development sector has traditionally been undertaken by the
Government. Chapter 4 provides an overview of public expenditure on urban development. To
lend perspective to the analysis, data regarding Net State Domestic Product (NSDP) and growth
in income levels of the States are also provided. Some of the poorer states have registered
impressive growth in NSDP in recent years e.g., Madhya Pradesh registered a growth of 20.3%

in 2012-13 and 21.9% in 2013-14. This chapter also contains data on additional transfers of
funds consequent upon acceptance of recommendations of Fourteenth Finance Commission
(FFC) and indicates that special category states such as Arunachal Pradesh, Mizoram, Nagaland
and Jammu & Kashmir stand to benefit immensely from such transfers.
8. The burgeoning urban population of India along with urban sprawl has also resulted in
fast escalation of urban travel demand. Chapter 5 contains statistics on urban transportation.
The share of motorised personal transport is very high and increasing in Indian cities. The share
of public transport in large cities has declined. The High Powered Expert Committee 2011
(HPEC 2011) has estimated the investment requirements over 2010-2030 at Rs. 22.7 trillion
for urban transport, whereas McKinsey study (2010) puts it at Rs. 27 trillion. Data regarding
parking charges in various cities in the world reveals that parking charges in Indian cities is
much lower than the cities abroad. This is significant because high parking charges create
disincentive for using private vehicles for transport. Considering the increasing importance of
Metro railin urban mobility, some details on metro use in the country have also been included.
9. Chapter 6 presents data on urban sanitation such as availability of bathing facility, type of
drainage system, availability and type of latrine facility. The Government of India has launched
the Swachh Bharat Mission (SBM) on 2nd October, 2014, with a target to make the country
clean by 2nd October, 2019. Data on various indicators under SBM up to end August, 2015 and
sanitation ranking of 476 Class I Cities based on SBM indicators have also been included.
10. Rapid urbanization has led to increasing problem of housing, overcrowding in small
houses, steady growth of slums and unplanned settlements and severe deleterious effect on
civic services in urban areas. Chapter 7 on Urban Housing provides a detailed picture of change
in living standard of urban households, change in percentage of households living in houses by
number of rooms of owned/rented dwellings, ownership/tenure status of dwelling units and
change in condition of houses over the last decade. The central government acknowledges the
importance of housing issue in the country and has launched a Mission to provide housing to
all Indians by the year 2022.
11. The data/ information given in the Handbook have been sourced from various
publications such as the Census, National Sample Survey Organisation (NSSO) Reports, UN-
World Urbanization Prospects, etc. The Handbook has been deliberated upon at draft stage in
two rounds of meeting in the Ministry. National Institute of Urban Affairs (NIUA) has provided
assistance in preparing the Handbook.
12. The Handbook of Urban Statistics is a result of teamwork and collaboration. I express

my sincere compliments to Kumar V Pratap, Economic Adviser who provided overall guidance
and other officers of Economic Division, specially, Ashwini Kumar, Manoj Kumar Madholia,
Meenakshi Bhardwaj, A.K. Bobin and Neetu Meena, for their meticulous work in bringing
out this Handbook. All the Divisional Heads in the Ministry have helped in sharpening the
presentation during the discussion. The Handbook has greatly benefited from the comments
and inputs of Jagan Shah, Debolina Kundu, Arpita Banerjee, Pragya Sharma, T.C. Sharma and
Sangeeta Vijh of National Institute of Urban Affairs.
13. It is hoped that the Handbook of Urban Statistics will act as a ready reckoner for
policy makers and planners at the National, State and urban local body levels, administrators,
research community and various other stakeholders. This Handbook is being made available
on the Ministry’s website: moud.gov.in. for wider dissemination.
14. We intend to update this Handbook at regular intervals. The first edition will be
improved further in the light of suggestions/comments received from different quarters. I
would, therefore, welcome suggestions for improving the Handbook, which may be sent to
(Durga Shanker Mishra)
Additional Secretary (UD)

CHAPTER/TABLE
Definitions
Abbreviations
Chapter 1 : Urban Demography
1.1 Demographic Profile of India 11
1.2 Level of Urbanization 13
1.3 Number of Urban Agglomerations (UAs) in India 16
1.4 State-wise Birth and Death Rates (per 1000 population) 17
1.5 Slum Population and Basic Amenities Available to Urban population 19
1.6 Number of Statutory and slum reported towns with type wise slum population
20
1.7 Growth Indicators for Slum Households 21
1.8 Slum and Urban Population (Slum reported towns) 22
1.9 Slum and Urban Population (all towns) 23
1.10 State Share of Slum Population to Total Slum Population of India 24
1.11 Urban Population, Urbanization Level and Urban Growth Rate 27
1.12 Selected Demographic Indicators in India and across Continents 29
1.13 Selected Demographic Indicators in BRICS countries 31
1.14 Selected Demographic Indicators in SAARC countries 33
1.15 The 30 Largest Urban Agglomerations Ranked by Population Size (2010) 35
Chapter 2 : Socio-economic Indicators of Urban India
2.1 Access to Basic Amenities in Urban India 40
2.2 Literacy Rate in Urban India 44
2.3 Sex Ratio in Urban India 46
2.4 Percentage of Population Below Poverty Line in India 47
2.5 Per Capita Municipal Income and Expenditure in India 49
2.6 Infant Mortality Rate (IMR) in Urban India 50
2.7 Total surplus/Shortfall after transfer under Central Assistance to States (CAS) but preserving the fiscal space
52
Chapter 3 : Urban Employment
3.1 Labour Force Participation Rate of Urban Persons, 1999-2000 and 2011-2012
57
Contents
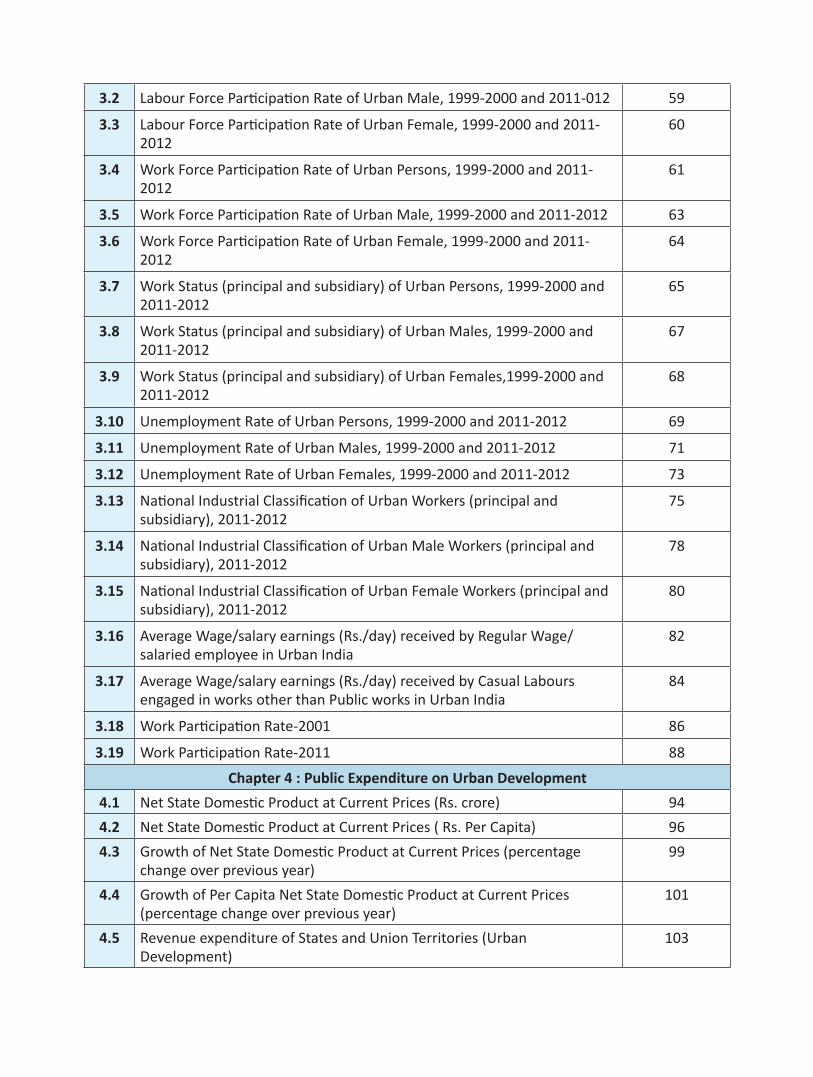
3.2 Labour Force Participation Rate of Urban Male, 1999-2000 and 2011-012 59
3.3 Labour Force Participation Rate of Urban Female, 1999-2000 and 2011-2012
60
3.4 Work Force Participation Rate of Urban Persons, 1999-2000 and 2011-2012
61
3.5 Work Force Participation Rate of Urban Male, 1999-2000 and 2011-2012 63
3.6 Work Force Participation Rate of Urban Female, 1999-2000 and 2011-2012
64
3.7 Work Status (principal and subsidiary) of Urban Persons, 1999-2000 and 2011-2012
65
3.8 Work Status (principal and subsidiary) of Urban Males, 1999-2000 and 2011-2012
67
3.9 Work Status (principal and subsidiary) of Urban Females,1999-2000 and 2011-2012
68
3.10 Unemployment Rate of Urban Persons, 1999-2000 and 2011-2012 69
3.11 Unemployment Rate of Urban Males, 1999-2000 and 2011-2012 71
3.12 Unemployment Rate of Urban Females, 1999-2000 and 2011-2012 73
3.13 National Industrial Classification of Urban Workers (principal and subsidiary), 2011-2012
75
3.14 National Industrial Classification of Urban Male Workers (principal and subsidiary), 2011-2012
78
3.15 National Industrial Classification of Urban Female Workers (principal and subsidiary), 2011-2012
80
3.16 Average Wage/salary earnings (Rs./day) received by Regular Wage/salaried employee in Urban India
82
3.17 Average Wage/salary earnings (Rs./day) received by Casual Labours engaged in works other than Public works in Urban India
84
3.18 Work Participation Rate-2001 86
3.19 Work Participation Rate-2011 88
Chapter 4 : Public Expenditure on Urban Development
4.1 Net State Domestic Product at Current Prices (Rs. crore) 94
4.2 Net State Domestic Product at Current Prices ( Rs. Per Capita) 96
4.3 Growth of Net State Domestic Product at Current Prices (percentage change over previous year)
99
4.4 Growth of Per Capita Net State Domestic Product at Current Prices (percentage change over previous year)
101
4.5 Revenue expenditure of States and Union Territories (Urban Development)
103

4.6 Capital Expenditure of States and Union Territories (Urban Development) 104
4.7 Additional FFC Transfers (in 2015-16 over 2014-15) 105
4.8 Decomposition of FFC Transfers to States 107
Chapter 5 : Urban Transportation
5.1 Mode Share in Various Indian Cities (%) 113
5.2 Pattern of Public Transport in Selected Indian Cities 115
5.3 Public Transport Share Comparison, 1994 and 2007 116
5.4 Desirable Modal Shares for Different City sizes 117
5.5 Vehicular Penetration in Select Developed and Developing Countries 119
5.6 Registered Motor Vehicles per 1,000 Population in Million-Plus Indian Cities
121
5.7 Comparison of Investment estimates for Urban transport by various Committees (2012-30) (Rs. Trillion)
123
5.8 Comparison of Parking Charges in Various Cities, 2011 124
5.9 Vehicle Population in India (in ’000) 125
5.10 Vehicular Composition in India (%) 127
5.11 Metro Rail Projects approved by Government of India(as on August, 2015) 129
5.12 Average number of passengers travelled in Metro Rail 132
5.13 Revenues of Metro Rail in various cities 133
Chapter 6 : Urban Sanitation
6.1 Bathing and Drainage Facilities, 2001-11 138
6.2 Urban Household Latrine Availability Data as per 2001 Census 141
6.3 Urban Household Latrine Availability Data as per 2011 Census 142
6.4 State-wise Status of Implementation of Various components under Swachh Bharat Mission (SBM) upto 04th September, 2015
144
6.5 Sanitation Rating of Class I Cities Based on SBM Indicators 146
Chapter 7 : Urban Housing
7.1 State wise Households having number of Dwelling Rooms-2001 (%) 160
7.2 State wise Households having number of Dwelling Rooms -2011 (%) 161
7.3 State wise Households living in houses by number of rooms of owned dwellings - 2001
163
7.4 State wise Households living in houses by number of rooms of owned dwellings -2011
164
7.5 State wise Households living in houses by number of rooms of rented dwellings -2001
166
7.6 State wise Households living in houses by number of rooms of rented dwellings-2011
167
7.7 State-wise Urban Households living in Houses by Ownership/Tenure Status of Dwelling Units - 2001
169

7.8 State-wise Urban Households living by Ownership/Tenure Status of Dwelling Units - 2011
171
7.9 Households with condition of House-2001-11 173
Annexure1 Directory of Urban Centers in the Country with Population (2011) 177
2 Performance of Cities under Urban reforms Indicators 317
2.1 JnNURM Reforms Implementation-Introduction 317
2.2 City wise JnNURM Reform Status (%) 319
2.3 Summary sheet of reform implementation (State wise) 321
3 Flagship Schemes of Urban Development 355
3.1 Swachh Bharat Mission (SBM) 355
3.2 Smart City Mission (SCM) 357
3.3 Atal Mission for Rejuvenation and Urban Transformation (AMRUT) 360
3.4 National Heritage City Development and Augmentation Yojana (HRIDAY)
362

Chapter 1 : Urban Demography1.1 Level of Urbanization (%) 141.2 Level of Urbanization-AEGR (1991-2001) 151.3 State-wise Birth Rates 181.4 State-wise Death Rates 181.5 State share of Slum Population to total Slum Population of India (2001) 251.6 State share of Slum Population to total Slum Population of India (2011) 251.7 Percentage of Slum Population (2001-2011) 261.8 Urbanization – International Comparison 281.9 Demographic Indicators in BRICS countries – Urban Population (%) 321.10 Demographic Indicators in BRICS countries – Average annual Rate of Change of the
Urban Population32
1.11 Demographic Indicators in SAARC countries – Population of Urban areas at Mid Year– 2014 (%)
34
1.12 Demographic Indicators in SAARC countries- Average Annual Rate of Change of the Urban Population
34
Chapter 2 : Socio-economic Indicators of Urban India2.1 Access to Basic Amenities in Urban India- Households with SDW (%) 412.2 Access to Basic Amenities in Urban India- Households with electricity (%) 422.3 Access to Basic Amenities in Urban India- Households with no latrine (%) 432.4 Literacy Rate in Urban India 452.5 Population below Poverty Line in Urban India (%) 482.6 Infant Mortality Rate 51
Chapter 3 : Urban employment3.1 Labour Force Participation Rate of Urban Persons (Principal & subsidiary status) (%) 583.2 Work Force Participation Rate of Urban Persons (Principal & subsidiary status) (%) 623.3 Work Status (Principal & subsidiary status) of Urban Persons (%) 663.4 Unemployment Rate of Urban Persons (Usual Status) (%) 703.5 Unemployment Rate of Urban Males (Usual Status) (%) 723.6 Unemployment Rate of Urban Females (Usual Status) (%) 743.7 National Industrial Classification of Urban Workers (principal and subsidiary),
2011-12(%)77
3.8 Average Wage/salary earnings (Rs. /day) Received by Regular wage/ Salaried Employees in Urban India.
83
3.9 Average Wage/salary earnings (Rs. / day) received by Casual Labours Engaged in Works other than Public Work in Urban India
85
List of Graphs

Chapter 4 : Public Expenditure on urban Development
4.1 Net State Domestic Product at Current Prices (Rs. Per Capita) (2012-13) 98
4.2 Growth of Net State Domestic Product at current prices (2010-13) (Percentage change over previous year)
100
4.3 Growth of Per Capita Net State Domestic Product at current prices (2010-13) (Percentage change over previous year)
102
4.4 Additional FFC Transfers (in 2015-16 over 2014-15)- Benefits from FFC (Rs. In crore) 106
4.5 Additional FFC Transfers (in 2015-16 over 2014-15)- FFC transfer Benefits as % of NSDP 106
Chapter 5 : Urban Transportation
5.1 Mode Share in Various Indian Cities 114
5.2 Desirable Modal Shares for Different City Sizes 118
5.3 Vehicular Penetration-Comparison of BRICS Nation 120
5.4 Registered Motor Vehicles per 1,000 Population in Million-Plus Indian Cities 122
5.5 Vehicle Population in India(in ‘000) 126
5.6 Vehicular Composition in India (Per Cent) 128
Chapter 6 : Urban Sanitation
6.1 Percentage of Households having bathroom facility within premises 139
6.2 Percentage of Households having drainage facility 140
6.3 Urban Household Latrine Availability Data as per Census (%) (2001) 143
6.4 Urban Household Latrine Availability Data as per Census (%) (2011) 143
Chapter 7 : Urban Housing
7.1 Percentage of Households with No. of Dwelling rooms-India (2001-2011) 162
7.2 Percentage of Households Living in Houses by No. of Rooms of Owned Dwellings-India (2001-11)
165
7.3 Percentage of Households Living in Houses by No. of Rooms of Rented Dwellings-India (2001-11)
168
7.4 State-wise Urban Households living in Houses by ‘Ownership/Tenure Status of Dwelling Units in India - 2001 (%)
170
7.5 State-wise Urban Households living in Houses by ‘Ownership/Tenure Status of Dwelling Units in India - 2011 (%)
172
7.6 Condition of Census Houses-2001 174
7.7 Condition of Census Houses-2011 174

Definitions
1
Average annual population growth rate is the compound annual population growth rate.
Average household size is total population divided by total number of households.
Birth rate: Number of live births per thousand population.
Census house: A ‘Census house’ is a building or part of a building having a separate main entrance from the road or common courtyard or staircase, etc. used or recognised as a separate unit. It may be occupied or vacant. It may be used for residential or non-residential purpose or both.
Death Rate: Number of deaths per thousand population.
Household: A ‘Household’ is a group of persons who commonly live together and would take their meals from a common kitchen unless the exigencies of work prevented any of them from doing so. There may be a household of persons related by blood or a household of unrelated persons or having a mix of both.
Chawl/bastee: is a collection of huts of tenements generally of Katcha or semi-pucca type inhabited by a large number of households.
Dwelling House (unit): is the existing house accommodation available to the household for residential purpose.
Households with drainage facility: Households having either closed or open drainage connectivity for waste water outlet.
Households with Safe Drinking Water (SDW): Households with main source of drinking water from tap (both treated and untreated source, hand pump and tube well/borehole.
Independent House: is a free standing structure or structures with a separate entrance. In other words, if the dwelling unit and the entire structure of the houses are physically coterminous, it is considered to be an independent house.
Katcha Structure: Katcha structure is one, which has walls and roofs made of non-pucca materials.
Pucca Structure: is one in which walls and roof are made of pucca materials.
Semi-Pucca: It is one in which either the walls or the roof (but not both) are made of pucca material. Walls/roof made partially of pucca material are regarded as Katcha walls/roof.
Definitions

Handbook of Urban Statistics
2
Infant Mortality Rate: Number of infant deaths (< 1 year) during the year per number of live birth during that year, or
Number of infant deaths during the year × 1000
Number of live births during the year
Latrines (Types):
Other Latrine: This category includes service latrines, latrines serviced by animals such as pigs, etc. and all latrines other than the pit and the water closet types of latrine. Service latrines are dry type of latrines from where human excreta are removed by scavengers.
Pit Latrine: These latrines are attached to a pit that is dug into the ground for the receiving human excreta.
Water Closet Latrine: The sanitary water flush latrines are those that have water closets fitted with flushing cistern. Such latrines may be connected to a septic tank or an underground sewerage system. The human excreta from these types of latrines is removed without the need for scavenging.
Labour Force: Persons who are either ‘working’ (or employed) or ‘seeking or available for work’ (or unemployed).
Labour Force Participation Rate (LFPR): It is the proportion of persons/person-days in the labour force to the total persons/person-days. These ratios are given in per 1000 of persons/person-days.
Level of Urbanization: It is the percentage of urban population to total population in the indicated year.
Literacy rate: Percentage of literates to the total population aged 7 years and above. As per Census, a person aged seven and above who can both read and write with understanding in any language, is treated as literate.
Notified Slums: Areas notified as slums by the respective municipalities, corporations, local bodies or development authorities.
Non-notified Slums: Area with inadequate basic services are considered as non-notified slums if at least 20 households live in that area.
Out Growths (OG): An Out Growth (OG) is a viable unit such as a village or a hamlet or an enumeration block made up of such village or hamlet and clearly identifiable in terms of its boundaries and location. Some of the examples are railway colony, university campus, port area, military camps, etc., which have come up near a statutory town outside its statutory limits but within the revenue limits of a village or villages contiguous to the town. While determining the outgrowth of a town, it should be

Definitions
3
ensured that it possesses the urban features in terms of infrastructure and amenities such as pucca roads, electricity, taps, drainage system for disposal of waste water etc. educational institutions, post offices, medical facilities, banks etc. and physically contiguous with the core town of the Urban Area. Each town together with its outgrowth(s) is treated as an integrated urban area and is designated as an ‘urban agglomeration’.
Population density is population divided by land area in square kilometers.
Poverty line: Planning Commission updated the poverty lines and poverty ratios for the year 2009-10 as per the recommendations of the Tendulkar Committee using NSS 66th round (2009-10) data of Household Consumer Expenditure Survey and released poverty estimates for 2009-10 on 19th March 2012. According to this, poverty line at all India level is estimated as Monthly Per-capita Consumption Expenditure of Rs. 672.8 for rural areas and Rs 859.6 for urban areas in 2009-10.
Sex Ratio: Number of females per 1000 males.
Slum: Slums are those residential areas where dwellings are in any respect unfit for human habitation by reasons of dilapidation, overcrowding, faulty arrangements and designs of such buildings, narrowness or faulty arrangement of streets, lack of ventilation, light, sanitation facilities or any combination of these factors which are detrimental to safety, health and morals. A slum is characterized by lack of durable housing, insufficient living area, lack of access to clean water, inadequate sanitation and insecure tenure.
Total population of a country includes all residents regardless of legal status or citizenship - except for refugees not permanently settled in the country of asylum, which is generally considered part of the population of their country of origin.
Unemployment rate: This is defined as the number of persons / person days unemployed per thousand persons / person days in the labour force (which includes both the employed and the unemployed).
Urban Agglomeration:
A town together with its outgrowth(s) is treated as an integrated urban area and is designated as “Urban agglomeration”. It constitutes:
(i) A city or a town with a continuous outgrowth, the outgrowth being outside the statutory limit but falling within the boundaries of the adjoining village or villages; or
(ii) Two or more adjoining towns with their outgrowth, if any, as in (i) above; or
(iii) A city and one or more adjoining towns with or without outgrowth all of which form a continuous spread.

Handbook of Urban Statistics
4
Urban area:
Census defines urban area as:-
(a) all places with a municipality, corporation, cantonment board or notified town area committee, etc.
(b) all other places which satisfy the following criteria:
(i) a minimum population of 5,000
(ii) at least 75% of male working population engaged in non-agricultural pursuits; and
(iii) a density of population of at least 400 persons per square kilometer.
Census town:
Places which satisfy criterion (b) above are referred to as census towns or non-municipal towns.
Statutory town:
All places with criterion (a) above are called statutory towns.
Usual activity status: According to the usual status, workers are those who perform some work activity either in the principal status or in the subsidiary status. The two categories of usual activity status are as under:
Current daily activity status: The activity pattern of the population, particularly in the informal sector, is such that during a week, and sometimes, even during a day, a person could pursue more than one activity. Moreover, many people could even undertake both economic and non-economic activities on the same day of a reference week. The current daily activity status for a person was determined on the basis of his/her activity status on each day of the reference week using a priority-cum-major time criterion (day to day labour time disposition).
Current weekly activity status: The current weekly activity status of a person is the activity status obtained for a person during a reference period of 7 days preceding the date of enumeration. A person was considered working (or employed) if he/she, while pursuing any economic activity, had worked for at least one hour on at least one day during the 7 days preceding the date of enumeration.
Usual principal activity status: The usual activity status relates to the activity status of a person during the reference period of 365 days preceding the date of enumeration. The activity status on which a person spent relatively longer time (i.e. major time criterion) during the 365 days preceding the date of enumeration is considered as the usual principal activity status of the person.

Definitions
5
Usual subsidiary economic activity status: A person whose usual principal status was determined on the basis of the major time criterion could have pursued some economic activity for a shorter time throughout the reference year of 365 days preceding the date of enumeration or for a minor period, which is not less than 30 days, during the reference year. The status in which such economic activity pursued was the subsidiary economic activity status of that person.
Work: Work is defined as participation in any economically productive activity. Such participation may be physical or mental in nature. Work involves not only actual work but also effective supervision and direction of work. It also includes unpaid work on farm and enterprise.
Workers:
Agricultural Labourer: A person who works on another person’s land for wages or money, kind or share is regarded as an agricultural Labourer.
Casual wage labour: A person casually engaged in others farm or non-farm enterprises (both household and non-household) and getting in return wage according to the terms of the daily or periodic work contract is defined as a casual wage labour.
Cultivator: A person is considered working as cultivator if he/she is engaged as employer, single worker or family worker in cultivation of land owned or held from Government or held from private person or institutions for payment in money, kind or share. Cultivation includes supervision or direction of cultivation.
Main Workers are those who had worked in some economic activity for a major part of the year i.e. for a period of six months (183 days) or more and,
Marginal Workers are those who had worked for some time during the last year but not for a major part that is for six months.
Regular salaried/wage employee: Persons working in others farm or non-farm enterprises (both household and non-household) and getting in return salary or wages on a regular basis (and not on the basis of daily or periodic renewal of work contract) are defined as regular salaried/wage employees.
Self-employed: Defined as persons who operate their own farm or non-farm enterprises or are engaged independently in a profession or trade on own-account or with one or a few partners are self-employed in household enterprises. The essential feature of the self-employed is that they have autonomy and economic independence for carrying out operation.
Work force participation rate (WFPR): WFPR is defined as the number of persons / person –days employed per thousand persons / person-days.
Work participation Rate: Percentage of total workers (main and marginal) to total population.

Handbook of Urban Statistics
6
AEGR Annual Exponential Growth rate
BBMP Bruhat Bangaluru Mahanagara Palike
CAS Central Assistance to States
CB Cantonment Board/Cantonment
CMC City Municipal Council
CT Census Town
DJB Delhi Jal Board
EO Estate Office
EwS Economically Weaker Section
FFC Fourteenth Finance Commission
GCS General Category States
GP Gram Panchayat
GVMC Greater Vishakhapatnam Municipal Corporation
HHs Households
INA Industrial Notified Area
ITS Industrial Township
LIG Lower Income Group
M Municipality
MB Municipal Board
MC Municipal Committee
MCl Municipal Council
MCorp Municipal Corporation
NA Notified Area
NAC Notified Area Committee/Notified Area Council
NCT National Capital Territory
NDMC New Delhi Municipal Council
NP Nagar Panchayat
NSDP Net State Domestic Product
NT Notified Town
NTA Notified Town Area
OG Out Growth
O & M Operation & Management
OTR Own Tax Revenue Receipts
RITES Rail India Technical and Economic Services
SCS Special Category States
SDw Source of Drinking Water
SRS Sample Registration System
STC Small town Committee
SwM Solid Waste Management
TC Town Committee/Town Area Committee
TMC Town Municipal Council
TP Town Panchayat
TS Township
UA Urban Agglomeration
wSA Wilmer Smith Associates
Abbreviations
Urban Demography
7
Urban Demography
1Chapter


Urban Demography
9
Urban Demography
The demographics of India is remarkably diverse. India is the second most populous country in the
world with more than one sixth of the world’s population. According to the 2011 Census, the urban
population grew to 377.1 million as compared to 286.1 million in 2001 census showing a growth of
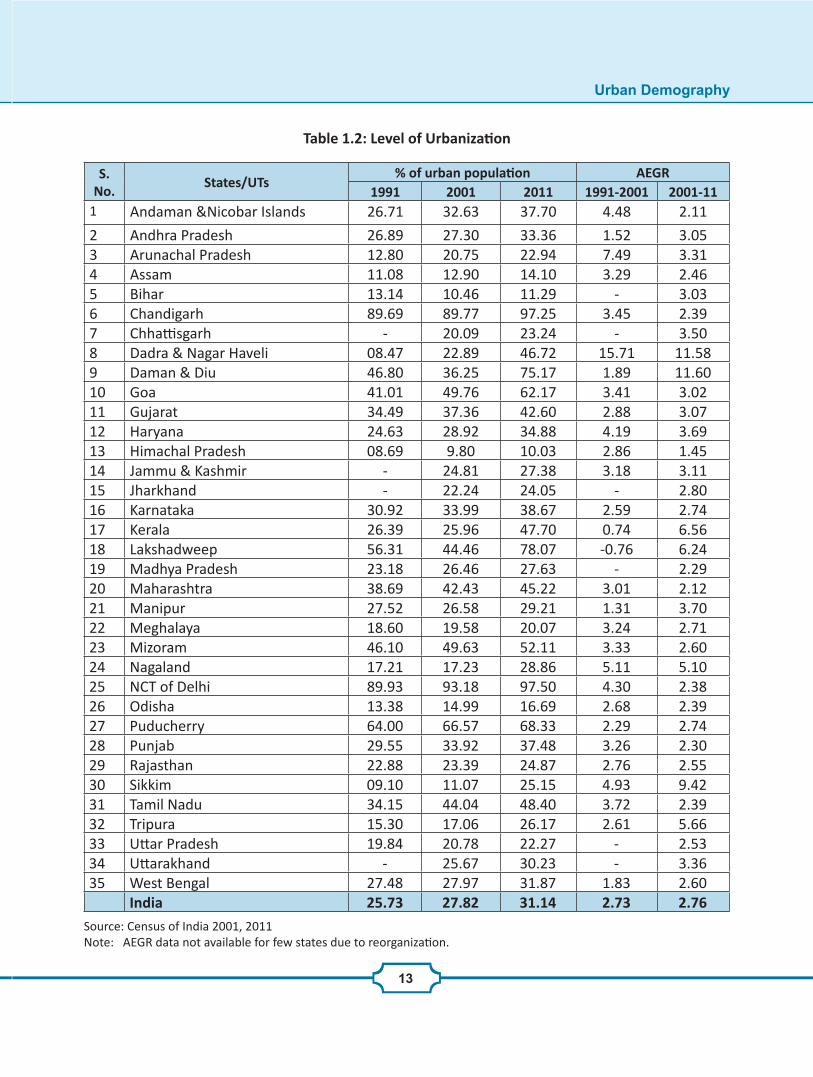
2.76% per annum during 2001-2011. The level of urbanization in the country as a whole increased
from 25.7% in 1991 to 27.82% in 2001 and to 31.14% in 2011 – an increase of 3.3 percentage points
during 2001-2011 compared to an increase of 2.1 percentage points during 1991-2001.
A large number of new towns emerged during the decade, contributing significantly to the speeding
up of urbanization. The number of statutory towns in India increased from 3,799 to 4,041 during
2001-2011 whereas the number of census towns have increased from 1,362 to 3,892 during the
decade. Among the states, Tamil Nadu had the largest number of towns (1097-721 statutory towns
and 376 census towns in 2011).
In terms of overall urban population, Maharashtra had the largest urban population of 50.8 million
followed by Uttar Pradesh, which had an urban population of 44.5 million in 2011. If we look at the level
of urbanization, defined as urban population as a proportion of total population, Goa was the most
urbanized state with 62.17% urbanization in 2011 followed by Mizoram at 52.11% urban population.
Among the Union Territories, Delhi had urbanization level of 97.50% followed by Chandigarh with
an urbanization level of 97.25% in 2011. Himachal Pradesh had the lowest urbanization with only
10.03% population living in urban areas in 2011, followed by Bihar (11.29%).
Sikkim witnessed the most rapid growth in urban population registering an annual exponential growth
rate (AEGR) of 9.42% during 2001-2011. On the other hand, Himachal Pradesh registered slowest
growth in urban population with an AEGR of 1.45% during the decade. Among the UTs, Daman &
Diu witnessed the sharpest growth in urban population with an AEGR of 11.60% during the decade
closely followed by Dadra & Nagar Haveli (11.58%).
According to Census 2011, the number of urban agglomeration (1 lakh and above population) in India
stood at 298. Uttar Pradesh had the largest number of urban agglomerations (39) followed by Andhra
Pradesh (36). Birth rate and death rate decreased to 17.60 and 5.70 respectively in 2011. Birth rate
was highest in Uttar Pradesh (23.70) and least in Tripura (11). Arunachal Pradesh recorded the lowest
death rate (2.50), whereas Puducherry registered the highest death rate at 6.80.
According to the estimates of United Nations Economic & Social Commission for Asia and the Pacific
(UNESCAP), 29.4% of India’s urban population lived in slums in 2009. The global figure for slum

Handbook of Urban Statistics
10
population was estimated at 33.1% in 2009. Further, 96% urban population in India was estimated to
have access to improved water sources and 59% urban population had access to improved sanitation
in 2010. The global figure for urban population with improved water sources was 96.1% in 2010 and
those with improved sanitation was 79.4% in 2010.
Table 1.8 shows number of statutory and slum reported towns with type wise slum population
in India. Out of 4,041 statutory towns, 2,613 are towns which reported slums with an estimated
population of over 6.5 crore living in slums. If we look at State share of slum population to total slum
population of India (Table 1.10), Maharashtra followed by Andhra Pradesh reported highest share
of slum population in 2001-11. In 2001, Jammu & Kashmir, Uttarakhand, Jharkhand, Chandigarh,
Meghalaya, Assam, Puducherry, Tripura and Kerala reported less than 1% of their population living
in slums whereas states such as Himachal Pradesh, Arunachal Pradesh, Sikkim, Arunachal Pradesh,
Nagaland, Manipur, Mizoram, Daman & Diu, Dadra & Nagar Haveli, Lakshadweep and Andaman &
Nicobar Islands did not report any slums. In 2011, Jammu & Kashmir, Uttarakhand, Jharkhand, Assam,
Kerala, Tripura, Tripura, Puducherry, Himachal Pradesh, Chandigarh, Nagaland, Mizoram, Nagaland,
Mizoram, Meghalaya, Sikkim, Arunachal Pradesh, Goa and Andaman & Nicobar Islands reported
slums less than 1%. Manipur, Daman & Diu, Dadra & Nagar Haveli and Lakshadweep reported no
slums in 2011.
To put a global perspective on urbanization in India, international comparison is presented in Tables
1.11, 1.12 and 1.13. According to the World Urbanization Prospects, 2014, 53.6% of world population
lived in urban areas in 2014 as compared to 32.4% in India in 2014. The average annual growth rate of
urban population in world is projected at 2.05% during 2010-15. India’s urban population is projected
to grow at 2.38% during this period.

Urban Demography
11
Table 1.1: Demographic Profile of India
S. No.
States/UTsStatutory Towns Increase
(%)Census towns Increase
(%)Villages Increase
(%)2001 2011 2001 2011 2001 2011
1Andaman &Nicobar Islands
1 1 0.0 2 4 100.0 547 555 1.46
2 Andhra Pradesh 117 126 7.7 93 227 144.1 28,123 27,800 -1.153 Arunachal Pradesh 0 26 - 17 1 -94.1 4,065 5,589 37.494 Assam 80 91 13.8 45 123 173.3 26,312 26,395 0.325 Bihar 125 139 11.2 5 60 1100.0 45,098 44,874 -0.506 Chandigarh 1 1 0.0 0 5 - 24 5 -79.177 Chhattisgarh 75 168 124.0 22 14 -36.4 20,308 20,126 -0.90
8Dadra & Nagar Haveli
0 1 - 2 5 150.0 70 65 -7.14
9 Daman & Diu 2 2 0.0 0 6 - 23 19 -17.3910 Goa 14 13 -7.1 30 57 90.0 359 334 -6.9611 Gujarat 168 195 16.1 74 153 106.8 18,539 18,225 -1.6912 Haryana 84 80 -4.8 22 74 236.4 6,955 6,841 -1.6413 Himachal Pradesh 56 56 0.0 1 3 200.0 20,118 20,690 2.8414 Jammu & Kashmir 72 86 19.4 3 36 1100.0 6,652 6,551 -1.5215 Jharkhand 44 39 -11.4 108 189 75.0 32,615 32,394 -0.6816 Karnataka 226 220 -2.7 44 127 188.6 29,406 29,340 -0.2217 Kerala 60 58 -3.3 99 462 366.7 1,364 1,018 -25.3718 Lakshadweep 0 0 - 3 6 100.0 24 21 -12.5019 Madhya Pradesh 339 364 7.4 55 112 103.6 55,393 54,903 -0.8820 Maharashtra 251 255 1.6 127 279 119.7 43,711 43,663 -0.1121 Manipur 28 28 0.0 5 23 360.0 2,391 2,588 8.2422 Meghalaya 10 10 0.0 6 12 100.0 6,026 6,839 13.4923 Mizoram 22 23 4.5 0 0 - 817 830 1.5924 Nagaland 8 19 137.5 1 7 600.0 1,317 1,428 8.4325 NCT of Delhi 3 3 0.0 59 110 86.4 165 112 -32.1226 Odisha 107 107 0.0 31 116 274.2 51,349 51,313 -0.07
27 Puducherry 6 6 0.0 0 4 - 92 90 -2.17
28 Punjab 139 143 2.9 18 74 311.1 12,673 12581 -0.7329 Rajasthan 184 185 0.5 38 112 194.7 41,353 44,672 8.0330 Sikkim 8 8 0.0 1 1 0.0 452 452 0.00
31 Tamil Nadu 721 721 0.0 111 376 238.7 16,317 15,979 -2.07
32 Tripura 13 16 23.1 10 26 160.0 870 875 0.5733 Uttar Pradesh 638 648 1.6 66 267 304.5 107,452 106,704 -0.7034 Uttarakhand 74 74 0.0 12 41 241.7 16,826 16,793 -0.2035 West Bengal 123 129 4.9 252 780 209.5 40,782 40,203 -1.42 India 3,799 4,041 6.4 1,362 3,892 185.8 638,588 640,867 0.36
Source: Census of India 2001, 2011.

Handbook of Urban Statistics
12
Table 1.1: Demographic Profile of India (Contd….)
S. No.
States/UTs
No. of Districts
2001 Population 2011 Population
2001 2011 Rural Urban Total Rural Urban Total
1Andaman & Nicobar Islands
2 3 239,954 116,198 356,152 237,093 143,488 380,581
2 Andhra Pradesh 23 23 55,401,067 20,808,940 76,210,007 56,361,702 28,219,075 84,580,7773 Arunachal Pradesh 13 16 870,087 227,881 1,097,968 1,066,358 317,369 1,383,7274 Assam 23 27 23,216,288 3,439,240 26,655,528 26,807,034 4,398,542 31,205,576
5 Bihar 37 38 74,316,709 8,681,800 82,998,509 92,341,436 11,758,016 104,099,452
6 Chandigarh 1 1 92,120 808,515 900,635 28,991 1,026,459 1,055,450
7 Chhattisgarh 16 18 16,648,056 4,185,747 20,833,803 19,607,961 5,937,237 25,545,198
8 Dadra & Nagar Haveli 1 1 170,027 50,463 220,490 183,114 160,595 343,709
9 Daman & Diu 2 2 100,856 57,348 158,204 60,396 182,851 243,247
10 Goa 2 2 677,091 670,577 1,347,668 551,731 906,814 1,458,545
11 Gujarat 25 26 31,740,767 18,930,250 50,671,017 34,694,609 25,745,083 60,439,692
12 Haryana 19 21 15,029,260 6,115,304 21,144,564 16,509,359 8,842,103 25,351,462
13 Himachal Pradesh 12 12 5,482,319 595,581 6,077,900 6,176,050 688,552 6,864,60214 Jammu & Kashmir 14 22 7,627,062 2,516,638 10,143,700 9,108,060 3,433,242 12,541,302
15 Jharkhand 18 24 20,952,088 5,993,741 26,945,829 25,055,073 7,933,061 32,988,134
16 Karnataka 27 30 34,889,033 17,961,529 52,850,562 37,469,335 23,625,962 61,095,297
17 Kerala 14 14 23,574,449 8,266,925 31,841,374 17,471,135 15,934,926 33,406,061
18 Lakshadweep 1 1 33,683 26,967 60,650 14,141 50,332 64,473
19 Madhya Pradesh 45 50 44,380,878 15,967,145 60,348,023 52,557,404 20,069,405 72,626,809
20 Maharashtra 35 35 55,777,647 41,100,980 96,878,627 61,556,074 50,818,259 112,374,333
21 Manipur 9 9 1,717,928 575,968 2,293,896 2,021,640 834,154 2,855,794
22 Meghalaya 7 7 1,864,711 454,111 2,318,822 2,371,439 595,450 2,966,889
23 Mizoram 8 8 447,567 441,006 888,573 52,5435 571,771 1,097,206
24 Nagaland 8 11 1647,249 342,787 1,990,036 1,407,536 570,966 1,978,502
25 NCT of Delhi 9 9 9,44,727 12,905,780 13,850,507 419,042 16,368,899 16,787,941
26 Odisha 30 30 31,287,422 5,517,238 36,804,660 34,970,562 7,003,656 41,974,218
27 Puducherry 4 4 325,726 648,619 974,345 395,200 852,753 1,247,953
28 Punjab 17 20 16,096,488 8,262,511 24,358,999 17,344,192 10,399,146 27,743,338
29 Rajasthan 32 33 43,292,813 13,214,375 56,507,188 51,500,352 17,048,085 68,548,437
30 Sikkim 4 4 480,981 59,870 540,851 456,999 153,578 610,577
31 Tamil Nadu 30 32 34,921,681 27,483,998 62,405,679 37,229,590 34,917,440 72,147,030
32 Tripura 4 4 2,653,453 545,750 3,199,203 2,712,464 961,453 3,673,917
33 Uttar Pradesh 70 71 131,658,339 34,539,582 166,197,921 155,317,278 44,495,063 199,812,34134 Uttarakhand 13 13 6,310,275 2,179,074 8,489,349 7,036,954 3,049,338 10,086,29235 West Bengal 18 19 57,748,946 22,427,251 80,176,197 62,183,113 29,093,002 91,276,115
India 593 640 742,617,747 286,119,689 1,028,737,436 833,748,852 377,106,125 1,210,854,977
Source: Census of India 2001, 2011.
Urban Demography
13
Table 1.2: Level of Urbanization
S. No.
States/UTs% of urban population AEGR
1991 2001 2011 1991-2001 2001-111 Andaman &Nicobar Islands 26.71 32.63 37.70 4.48 2.11
2 Andhra Pradesh 26.89 27.30 33.36 1.52 3.053 Arunachal Pradesh 12.80 20.75 22.94 7.49 3.314 Assam 11.08 12.90 14.10 3.29 2.465 Bihar 13.14 10.46 11.29 - 3.036 Chandigarh 89.69 89.77 97.25 3.45 2.397 Chhattisgarh - 20.09 23.24 - 3.508 Dadra & Nagar Haveli 08.47 22.89 46.72 15.71 11.589 Daman & Diu 46.80 36.25 75.17 1.89 11.6010 Goa 41.01 49.76 62.17 3.41 3.0211 Gujarat 34.49 37.36 42.60 2.88 3.0712 Haryana 24.63 28.92 34.88 4.19 3.6913 Himachal Pradesh 08.69 9.80 10.03 2.86 1.4514 Jammu & Kashmir - 24.81 27.38 3.18 3.1115 Jharkhand - 22.24 24.05 - 2.8016 Karnataka 30.92 33.99 38.67 2.59 2.7417 Kerala 26.39 25.96 47.70 0.74 6.5618 Lakshadweep 56.31 44.46 78.07 -0.76 6.2419 Madhya Pradesh 23.18 26.46 27.63 - 2.2920 Maharashtra 38.69 42.43 45.22 3.01 2.1221 Manipur 27.52 26.58 29.21 1.31 3.7022 Meghalaya 18.60 19.58 20.07 3.24 2.7123 Mizoram 46.10 49.63 52.11 3.33 2.6024 Nagaland 17.21 17.23 28.86 5.11 5.1025 NCT of Delhi 89.93 93.18 97.50 4.30 2.3826 Odisha 13.38 14.99 16.69 2.68 2.3927 Puducherry 64.00 66.57 68.33 2.29 2.7428 Punjab 29.55 33.92 37.48 3.26 2.3029 Rajasthan 22.88 23.39 24.87 2.76 2.5530 Sikkim 09.10 11.07 25.15 4.93 9.4231 Tamil Nadu 34.15 44.04 48.40 3.72 2.3932 Tripura 15.30 17.06 26.17 2.61 5.6633 Uttar Pradesh 19.84 20.78 22.27 - 2.5334 Uttarakhand - 25.67 30.23 - 3.3635 West Bengal 27.48 27.97 31.87 1.83 2.60
India 25.73 27.82 31.14 2.73 2.76Source: Census of India 2001, 2011Note: AEGR data not available for few states due to reorganization.

Handbook of Urban Statistics
14
Gra
ph 1
.1 :
Leve
l of U
rban
izati
on (%
)
Sour
ce: C
ensu
s of
Indi
a 19
91, 2
001
& 2
011
0
10
20
30
40
50
60
70
80
90
10
0
Andaman&NicobarIslands
AndhraPradesh
ArunachalPradesh
Assam
Bihar
Chandigarh
Chhattisgarh
Dadra&NagarHaveli
Daman&Diu
Goa
Gujarat
Haryana
HimachalPradesh
Jammu&Kashmir
Jharkhand
Karnataka
Kerala
Lakshadweep
MadhyaPradesh
Maharashtra
Manipur
Meghalaya
Mizoram
Nagaland
NCTofDelhi
Odisha
Puducherry
Punjab
Rajasthan
Sikkim
TamilNadu
Tripura
UttarPradesh
Uttarakhand
WestBengal
India
19
91
20
01
20
11

Urban Demography
15
Gra
ph 1
.2: L
evel
of U
rban
izati
on-A
EGR-
1991
-201
1
Sour
ce: C
ensu
s of
Indi
a 19
91, 2
001
& 2
011
-2024681012141618
Andaman&NicobarIslands
AndhraPradesh
ArunachalPradesh
Assam
Bihar
Chandigarh
Chhattisgarh
Dadra&NagarHaveli
Daman&Diu
Goa
Gujarat
Haryana
HimachalPradesh
Jammu&Kashmir
Jharkhand
Karnataka
Kerala
Lakshadweep
MadhyaPradesh
Maharashtra
Manipur
Meghalaya
Mizoram
Nagaland
NCTofDelhi
Odisha
Puducherry
Punjab
Rajasthan
Sikkim
TamilNadu
Tripura
UttarPradesh
Uttarakhand
WestBengal
India
1991
-200
120
01-1
1

Handbook of Urban Statistics
16
Table 1.3 : Number of Urban Agglomerations(UAs) in India
S. No.
States/UTsNo. of UAs
1991 2001 (all urban centres) 20111 Andaman &Nicobar Islands - NA NA2 Andhra Pradesh 15 37 583 Arunachal Pradesh - NA NA4 Assam 6 10 125 Bihar 21 9 146 Chandigarh 1 NA 17 Chhattisgarh - 12 148 Dadra & Nagar Haveli - NA NA9 Daman & Diu - NA NA
10 Goa 3 3 311 Gujarat 46 41 3812 Haryana 7 11 1213 Himachal Pradesh 2 1 314 Jammu & Kashmir - 7 715 Jharkhand - 11 1116 Karnataka 22 24 2217 Kerala 16 17 1918 Lakshadweep - NA NA19 Madhya Pradesh 60 42 3720 Maharashtra 18 15 1721 Manipur 1 1 122 Meghalaya 1 1 123 Mizoram - NA NA24 Nagaland - NA NA25 NCT of Delhi 1 1 126 Odisha 9 10 1427 Puducherry 1 1 228 Punjab 22 19 1829 Rajasthan 19 23 2830 Sikkim - NA NA31 Tamil Nadu 34 27 2532 Tripura - NA NA33 Uttar Pradesh 31 32 6734 Uttarakhand - 8 1135 West Bengal 38 21 38
India 374 384 474
Source: Census of India 1991, 2001 & 2011.

Urban Demography
17
Table 1.4: State-wise Birth and Death Rates (per 1000 population)
S.No. States/UTsBirth Rate Death Rate
2001 2011 2001 20111 Andaman &Nicobar Islands 14.20 15.30 4.10 3.602 Andhra Pradesh 19.60 16.60 5.60 5.203 Arunachal Pradesh 12.80 14.20 2.30 2.504 Assam 18.50 15.50 6.60 5.605 Bihar 23.40 21.70 6.30 5.506 Chandigarh 15.60 14.40 3.70 4.107 Chhattisgarh 22.40 18.30 7.00 6.108 Dadra & Nagar Haveli 20.00 28.10 2.90 3.009 Daman & Diu 22.00 17.90 5.90 4.80
10 Goa 13.90 13.70 6.50 5.9011 Gujarat 21.50 19.00 5.60 5.7012 Haryana 22.80 19.50 7.40 5.3013 Himachal Pradesh 16.80 11.20 5.30 3.6014 Jammu & Kashmir 16.30 13.10 6.10 4.7015 Jharkhand 19.50 19.00 6.00 5.2016 Karnataka 19.00 17.20 6.40 5.4017 Kerala 16.60 14.40 6.10 6.6018 Lakshadweep 18.70 13.70 5.20 6.7019 Madhya Pradesh 23.00 20.10 7.20 6.1020 Maharashtra 20.10 15.80 5.90 5.1021 Manipur 15.90 15.00 6.10 4.2022 Meghalaya 15.00 14.60 3.90 5.5023 Mizoram 13.20 12.60 3.40 3.4024 Nagaland 12.40 15.50 2.60 2.9025 NCT of Delhi 18.10 17.20 5.00 4.3026 Odisha 19.60 14.70 6.80 6.5027 Puducherry 17.30 15.90 6.60 6.8028 Punjab 18.70 15.20 6.40 5.6029 Rajasthan 24.70 22.50 6.20 5.8030 Sikkim 16.70 16.60 3.20 3.5031 Tamil Nadu 17.80 15.70 6.00 6.4032 Tripura 13.50 11.00 5.20 5.4033 Uttar Pradesh 27.00 23.70 7.80 6.1034 Uttarakhand 16.60 16.00 6.10 4.9035 West Bengal 13.80 11.50 6.40 6.50
India 20.20 17.60 6.30 5.70
Source: SRS Bulletin, October 2002 & October 2012, Registrar General, India.

Handbook of Urban Statistics
18
Graph 1.3: State-wise Birth Rates
Source: SRS Bulletin, October 2002 & October 2012, Registrar General, India.
Graph 1.4: State-wise Death Rates
Source: SRS Bulletin, October 2002 & October 2012, Registrar General, India.

Urban Demography
19
Table 1.5: Slum Population and Basic Amenities Available to Urban Population
Country/Regions
Slum Population (in percent)
Urban Population with Improved Water
Sources (in percent)
Urban Population with Improved Sanitation
(in percent)
1990 2000 2009 1990 2000 2010 1990 2000 2010
India 54.9 41.5 29.4 89.0 92.0 96.0 50.0 54.0 59.0
Africa 56.5 53.8 50 85.4 85.7 86.4 55.4 54.6 53.5
Asia and Pacific 49.4 39.9 30.4 94.3 95.5 96.9 65.3 69.3 75.1
Europe NA NA NA 99.7 99.8 99.8 98.6 98.7 98.7
Latin America and Caribbean
35.4 30.2 NA 94.4 95.8 96.8 79.9 83.5 86.5
North America NA NA NA 100.0 100.0 100.0 100.0 100.0 100.0
Pacific NA NA NA 99.3 99.4 100.0 97.8 97.8 97.8
World 46.8 39.6 33.1 95.0 95.5 96.1 75.7 77.0 79.4
Source: Statistical Year Book for Asia and Pacific, 2014, UNESCAP

Handbook of Urban Statistics
20
Table 1.6: Number of Statutory and slum reported towns with type wise slum population
States/ UTsTowns Type wise Slum Population
Statutory towns
Slum reported towns
Total population
Notified slums
Recognised slums
Identified slums
Andaman & Nicobar Island 1 1 14,172 0 0 14,172Andhra Pradesh 125 125 10,186,934 8,338,154 877,172 971,608Arunachal Pradesh 26 5 15,562 0 0 15,562Assam 88 31 197,266 9,163 70,979 117,124Bihar 139 88 1,237,682 0 0 1,237,682Chandigarh 1 1 95,135 95,135 0 0Chhattisgarh 168 94 1,898,931 713,654 764,851 420,426Dadra & Nagar Haveli 1 0 0 0 0 0Daman & Diu 2 0 0 0 0 0Goa 14 3 26,247 6,107 0 20,140Gujarat 195 103 1,680,095 0 0 1,680,095Haryana 80 75 1,662,305 14,912 0 1,647,393Himachal Pradesh 56 22 61,312 60,201 0 1,111Jammu & Kashmir 86 40 662,062 162,909 136,649 362,504Jharkhand 40 31 372,999 64,399 59,432 249,168Karnataka 220 206 3,291,434 2,271,990 445,899 573,545Kerala 59 19 202,048 186,835 8,215 6,998Lakshadweep 0 0 0 0 0 0Madhya Pradesh 364 303 5,688,993 1,900,942 2,530,637 1,257,414Maharashtra 256 189 11,848,423 3,709,309 3,485,783 4,653,331Manipur 28 0 0 0 0 0Meghalaya 10 6 57,418 34,699 8,006 14,713Mizoram 23 1 78,561 0 78,561 0Nagaland 19 11 82,324 0 48,249 34,075NCT Delhi 3 22 1,785,390 738,915 0 1,046,475Odisha 107 76 1,560,303 0 812,737 747,566Puducherry 6 6 144,573 70,092 73,928 553Punjab 143 73 1,460,518 787,696 193,305 479,517Rajasthan 185 107 2,068,000 0 0 2,068,000Sikkim 8 7 31,378 31,378 0 0Tamil Nadu 721 507 5,798,459 2,541,345 1,978,441 1,278,673Tripura 16 15 139,780 0 124,036 15,744Uttar Pradesh 648 293 6,239,965 562,548 4,678,326 999,091Uttarakhand 74 31 487,741 185,832 52,278 249,631West Bengal 129 122 6,418,594 48,918 3,703,852 2,665,824INDIA 4,041 2,613 65,494,604 22,535,133 20,131,336 22,828,135
Source: Census of India-2011

Urban Demography
21
Table 1.7: Growth Indicators for Slum Households
IndicatorAbsolute Absolute change
2001-11Decadal Growth
2001-11 (%)2001 2011
Slum
Households 10,150,719 13,920,191 3,769,472 37.1
Household Size 5.2 4.7 -0.5
Urban (slum reported towns)
Households 43,556,155 62,792,741 19,236,586 44.2
Household Size 0.6 0.5 -0.1
Urban (all towns)
Households 55,832,570 80,888,766 25,056,196 44.9
Household Size 5.1 4.7 -0.4
Source: Census of India-2001 & 2011

Handbook of Urban Statistics
22
Table 1.8: Slum and Urban Population (Slum reported towns)
Indicator
AbsoluteAbsolute change
2001-11Decadal Growth
2001-11
Slum Percentage
2001 2011 2001 2011
Slum
Persons 52,371,589 65,494,604 13,123,015 25.1 23.5 22.4
Males 27,759,224 33,968,203 6,208,979 22.4 23.6 22.4
Females 24,612,365 31,526,401 6,914,036 28.1 23.3 22.5
Sex ratio 887 928 41
Urban (slum reported towns)
Persons 223,111,858 291,838,124 68,726,266 30.8 100 100
Males 117,6 10,448 151,666,671 34,056,223 29 100 100
Females 105,501,410 140,171,453 34,670,043 32.9 100 100
Sex ratio 897 924 27
Source: Census of India-2001 & 2011

Urban Demography
23
Table 1.9: Slum and Urban Population (all towns)
Indicator
AbsoluteAbsolute change
2001-11Decadal Growth
2001-11
Slum Percentage
2001 2011 2001 2011
Slum
Persons 52,371,589 65,494,604 13,123,015 25.1 18.3 17.4
Males 27,759,224 33,968,203 6,208,979 22.4 18.4 17.4
Females 24,612,365 31,526,401 6,914,036 28.1 18.2 17.4
Sex ratio 887 928 41
Urban (all towns)
Persons 286,119,689 377,106,125 90,986,436 31.8 100 100
Males 150,554,098 195,489,200 44,935,102 29.8 100 100
Females 135,565,591 181,616,925 46,051,334 34 100 100
Sex ratio 900 929 29
Source: Census of India-2001 & 2011

Handbook of Urban Statistics
24
Table 1.10: State Share of Slum Population to Total Slum Population of India
States/UTs 2001 2011
Andhra Pradesh 12 15.6
Bihar 1.6 1.9
Chhattisgarh 2.1 2.9
Gujarat 3.8 2.6
Haryana 3.2 2.5
Karnataka 4.5 5.0
Madhya Pradesh 7.2 8.7
Maharashtra 22.9 18.1
NCT of Delhi 3.9 2.7
Odisha 2.1 2.4
Other States/UTs 3.1 3.8
Punjab 2.8 2.2
Rajasthan 3 3.2
Tamil Nadu 8.1 8.9
Uttar Pradesh 11 9.5
West Bengal 8.9 9.8
Note : In 2001-Other States/UTs includes :1. Reported slum less than 1%-Jammu & Kashmir, Uttarakhand, Jharkhand, Chandigarh, Meghalaya, Assam, Puducherry,
Tripura and Kerala 2. States/UTs not reported slum-Himachal Pradesh, Sikkim, Arunachal Pradesh, Nagaland, Manipur, Mizoram, Daman
& Diu, Dadra & Nagar Haveli, Lakshadweep and Andaman & Nagar Islands In 2011-Other States/UTs includes:1. Reported slum less than 1%-Jammu & Kashmir, Uttarakhand, Jharkhand, Assam, Kerala, Tripura, Tripura, Puducherry,
Himachal Pradesh, Chandigarh, Nagaland, Mizoram, Nagaland, Mizoram, Meghalaya, Sikkim, Arunachal Pradesh, Goa and Andaman & Nicobar Islands
2. States/UTs not reported slum-Manipur, Daman & Diu, Dadra & Nagar Haveli and LakshadweepSource: Census of India-2001 & 2011

Urban Demography
25
Graph 1.5: State Share of Slum Population to Total Slum Population of India (2001)
Andhra Pradesh
12%
Bihar
2%
Chhattisgarh
2%
Gujarat
4%
Haryana
3%
Karnataka
4%
Madhya Pradesh
7%
Maharashtra
23%
NCT of Delhi
4%
Odisha
2%
Other State/UTs
3%
Punjab
3%
Rajasthan
3%
Tamil Nadu
8%
Uttar Pradesh
11%
West Bengal
9%
Source: Census of India-2001
Graph 1.6: State Share of Slum Population to Total Slum Population of India (2011)
Andhra Pradesh
16%
Bihar
2%Chhattisgarh
3%
Gujarat
3%
Haryana
3%
Karnataka
5%
Madhya Pradesh
9%
Maharashtra
18%
NCT of Delhi
3%
Odisha
2%
Other State/UTs
4%
Punjab
2%
Rajasthan
3%
Tamil Nadu
9%
Uttar Pradesh
10%
West Bengal
10%
Source: Census of India-2011

Handbook of Urban Statistics
26
Graph 1.7: Percentage of Slum Population (2001-2011)
Source: Primary Census Abstract for Slum, 2011 Office of the Registrar General & Census Commissioner, India

Urban Demography
27
Table 1.11: Urban Population, Urbanization Level and Urban Growth Rate
India Africa Asia EuropeLatin America and Caribbean
North America
Oceania World
Annual Urban Population at Mid-year (‘000)
2000 288,365 278,770 1,392,740 516,827 396,276 249,504 22,013 2,856,131
2005 329,517 330,742 1,621,843 525,635 432,804 264,278 23,711 3,199,013
2010 372,902 394,940 1,864,836 537,982 467,642 279,949 25,924 3,571,272
2015* 419,939 471,602 2,113,137 547,066 502,793 294,834 27,853 3,957,285
Percentage of Population Living in Urban Areas
2000 27.7 34.5 37.5 70.9 75.3 79.1 70.5 46.6
2005 29.2 36.3 41.1 71.7 76.9 80.0 70.5 49.1
2010 30.9 38.3 44.8 72.7 78.4 80.8 70.7 51.6
2014 32.4 40.0 47.5 73.4 79.5 81.5 70.8 53.6
2015 32.7 40.4 48.2 73.6 79.8 81.6 70.8 54.0
Average Annual Rate of Change of Urban Population
2000-2005 2.67 3.42 3.05 0.34 1.76 1.15 1.49 2.27
2005-2010 2.47 3.55 2.79 0.46 1.55 1.15 1.78 2.20
2010-2015 2.38 3.55 2.50 0.33 1.45 1.04 1.44 2.05
*ProjectedSource: World Urbanization Prospects: The 2014 Revision

Handbook of Urban Statistics
28
Gra
ph 1
.8 :
Urb
aniz
ation
- Int
erna
tion
al C
ompa
riso
n
Sour
ce: W
orld
Urb
aniz
ation
Pro
spec
ts: T
he 2
014
Revi
sion
05
10
15
20
25
30
35
40
45
50
55
60
65
70
75
80
85
90
95
10
0
20
00
20
05
20
10
20
15
Ind
iaA
fric
a
Asia
Eu
ro
pe
La
tin
Am
eric
aa
nd
Ca
rib
be
an
No
rth
Am
eric
a
Oce
an
iaW
orld

Urban Demography
29
Table 1.12: Selected Demographic Indicators in India and across Continents
India Africa Asia EuropeLatin
America and Caribbean
North America
Oceania World
Total Population ('000)
2000 1,042,262 808,304 3,717,372 729,105 526,278 315,417 31,224 6,127,700
2005 1,127,144 911,528 3,942,882 732,970 562,546 330,546 33,623 6,514,095
2010 1,205,625 1,031,084 4,165,440 740,308 596,191 346,501 36,659 6,916,183
2015 1,282,390 1,166,239 4,384,844 743,123 630,089 361,128 39,359 7,324,782
Population Growth Rate (Average Annual Growth Rate in Percent)
2000-2005 1.57 2.4 1.18 0.11 1.33 0.94 1.48 1.22
2005-2010 1.35 2.47 1.10 0.20 1.16 0.94 1.73 1.20
2010-2015 1.24 2.46 1.03 0.08 1.11 0.83 1.42 1.15
Sex Ratio (Males per 100 Females)
2000 107.6 99.7 104.8 92.7 97.3 96.5 99.6 101.5
2005 107.4 99.8 104.8 92.7 96.9 96.8 99.7 101.6
2010 107.2 99.9 104.8 92.8 96.9 96.9 100.1 101.6
2015 107 100.1 104.8 93.0 96.8 97.1 100.0 101.7
Sex Ratio at Birth (Number of male per Female Birth)
2000-2005 1.11 1.04 1.10 1.06 1.05 1.05 1.06 1.07
2005-2010 1.11 1.04 1.10 1.06 1.05 1.05 1.06 1.08
2010-2015 1.11 1.04 1.10 1.06 1.05 1.05 1.06 1.07
Crude Birth Rate (per 1,000 population)
2000-2005 25 38 19 10 22 14 18 21
2005-2010 22 37 18 11 19 14 18 20
2010-2015 21 36 18 11 18 13 17 20
Crude Death Rate (deaths per 1,000 population)
2000-2005 9 13 7 12 6 8 7 8
2005-2010 8 12 7 11 6 8 7 8
2010-2015 8 10 7 12 6 8 7 8
Infant Mortality Rates [Infant death (B/w 0-1 years) by per 1,000 live births]
2000-2005 58 84 43 8 25 7 25 48
2005-2010 51 73 37 7 21 7 22 42
2010-2015 44 64 31 6 18 6 20 37

Handbook of Urban Statistics
30
India Africa Asia EuropeLatin
America and Caribbean
North America
Oceania World
Life Expectancy at Birth (years)
2000-2005 63.10 52.91 68.76 73.76 72.14 77.39 75.28 67.10
2005-2010 64.93 55.55 70.28 75.28 73.45 78.36 76.84 68.72
2010-2015 66.30 58.20 71.40 76.10 74.70 79.10 77.60 70.00
Total Fertility Rate (children per woman)
2000-2005 3.00 5.08 2.35 1.43 2.53 1.99 2.41 2.60
2005-2010 2.66 4.88 2.25 1.54 2.30 2.02 2.47 2.53
2010-2015 2.50 4.67 2.19 1.58 2.18 1.94 2.40 2.50
Median Age of the Population (in years)
2000 23.00 18.50 25.80 37.60 24.20 35.40 30.80 26.30
2005 24.10 18.90 27.30 39.00 25.70 36.50 31.80 27.40
2010 25.50 19.20 28.80 40.30 27.30 37.30 32.20 28.50
2015 26.90 19.50 30.20 41.40 28.90 37.90 32.80 29.60
Dependency Ratio (Age 0-14 and 65 +/Age 15-64) (%)
2000 62.80 84.30 56.90 47.70 60.60 50.40 55.20 58.80
2005 58.60 81.70 51.00 46.60 57.00 48.50 54.00 54.50
2010 54.40 80.40 47.60 46.50 53.60 48.50 53.10 52.20
2015 51.00 79.00 47.00 49.00 51.00 51.00 55.00 52.00
Child Dependency Ratio (Age 0-14/Age 15-64) (%)
2000 55.70 78.20 47.80 26.00 51.50 31.80 39.90 47.90
2005 51.10 75.60 41.40 23.30 47.30 30.10 38.20 43.20
2010 46.60 74.20 37.60 22.60 43.20 29.00 36.70 40.50
2015 43.00 73.00 36.00 24.00 39.00 29.00 37.00 40.00
Old age Dependency Ratio (Age 65+/Age 15-64)(%)
2000 7.10 6.10 9.10 21.80 9.10 18.60 15.30 11.00
2005 7.50 6.10 9.60 23.30 9.70 18.40 15.70 11.30
2010 7.80 6.20 10.10 23.90 10.40 19.60 16.40 11.70
2015 8.00 6.00 11.00 26.00 12.00 22.00 18.00 13.00
Source: World Population Prospects: The 2012 Revision and online UN data for 2015

Urban Demography
31
Table 1.13: Selected Demographic Indicators in BRICS countries
Population of Urban Areas at Mid-Year (thousands) and Percentage Urban, 2014
Country Urban Total Percentage urban
Brazil 172,604 202,034 85.4
Russian Federation 105,318 142,468 73.9
India 410,204 1,267,402 32.4
China* 758,360 1 393 784 54.4
South Africa 34,168 53,140 64.3
Percentage of Population at Mid-Year Residing in Urban Areas
Country 1990 2000 2010
Brazil 73.9 81.2 84.3
Russian Federation 73.4 73.4 73.7
India 25.5 27.7 30.9
China* 26.4 35.9 49.2
South Africa 52.0 56.9 62.2
Average Annual Rate of Change of the Urban Population
Country 1990-1995 1995-2000 2000-2005 2005-2010
Brazil 2.55 2.40 1.69 1.31
Russian Federation 0.06 -0.26 -0.36 0.02
India 2.72 2.51 2.67 2.47
China* 4.36 3.63 3.98 3.55
South Africa 3.29 2.45 2.37 2.17
*The data for China do not include Hong Kong and Macao, Special Administrative Regions (SAR) of China.
Source: World Urbanization Prospects: The 2014 Revision. According to the World Urbanization Prospects “there exists no common global definition of what constitutes an urban settlement. The estimates in the World Urbanization Prospects are based on national statistics.”

Handbook of Urban Statistics
32
Graph 1.9: Demographic Indicators in BRICS countries- Urban Population (%)
Source: World Urbanization Prospects: The 2014 Revision
Graph 1.10: Demographic Indicators in BRICS countries-Average Annual Rate of Change of the urban population.
-1.00
0
1.00
2.00
3.00
4.00
5.00
1990-1995 1995-2000 2000-2005 2005-2010
Brazil Russian Federation India China South Africa
Source: World Urbanization Prospects: The 2014 Revision

Urban Demography
33
Table 1.14: Selected Demographic Indicators in SAARC countries.
Population of Urban and Rural Areas at Mid-Year (thousands) and Percentage Urban, 2014
Country Urban Total Percentage urban
Afghanistan 8,221 31,281 26.3
Bangladesh 53,127 158,513 33.5
Bhutan 290 766 37.9
India 410,204 1,267,402 32.4
Maldives 156 352 44.5
Nepal 5,130 28,121 18.2
Pakistan 70,912 185,133 38.3
Sri Lanka 3,929 21,446 18.3
Percentage of Population at Mid-Year Residing in Urban Areas
1990 2000 2010
Afghanistan 18.3 21.3 24.7
Bangladesh 19.8 23.6 30.5
Bhutan 16.4 25.4 34.8
India 25.5 27.7 30.9
Maldives 25.8 27.7 40.0
Nepal 8.9 13.4 16.8
Pakistan 30.6 33.2 36.6
Sri Lanka 18.6 18.4 18.3
Average Annual Rate of Change of the Urban Population
1990-1995 1995-2000 2000-2005 2005-2010
Afghanistan 9.61 4.65 5.23 4.17
Bangladesh 4.01 3.66 4.12 3.64
Bhutan 3.49 6.32 6.79 4.28
India 2.72 2.51 2.67 2.47
Maldives 2.37 3.70 5.69 5.20
Nepal 6.71 6.56 4.19 3.24
Pakistan 3.44 3.35 2.80 2.88
Sri Lanka 0.97 0.59 1.07 0.73
Source: World Urbanization Prospects: The 2014 Revision. According to the World Urbanization Prospects “there exists no common global definition of what constitutes an urban settlement. The estimates in the World Urbanization Prospects are based on national statistics.”

Handbook of Urban Statistics
34
Graph 1.11: Demographic Indicators in SAARC countries- Population of Urban areas at Mid Year-2014 (%)
Source: World Urbanization Prospects: The 2014 Revision
Graph 1.12: Demographic Indicators in SAARC countries- Average Annual Rate of Change of the Urban Population
0
2.00
4.00
6.00
8.00
10.00
12.00
1990-1995 1995-2000 2000-2005 2005-2010
Afghanistan Bangladesh Bhutan India Maldives Nepal Pakistan Sri Lanka
Source: World Urbanization Prospects: The 2014 Revision

Urban Demography
35
Table 1.15: The 30 Largest Urban Agglomerations Ranked by Population Size (2010)
Rank order Country Urban Agglomeration Population (millions)
1 Japan Tokyo 36.83
2 India Delhi 21.94
3 Mexico Mexico City 20.13
4 China Shanghai 19.98
5 Brazil São Paulo 19.66
6 Japan Osaka 19.49
7 India Mumbai 19.42
8 United States of America New York-Newark 18.37
9 Egypt Cairo 16.90
10 China Beijing 16.19
11 Bangladesh Dhaka 14.73
12 India Kolkata 14.28
13 Argentina Buenos Aires 14.25
14 Pakistan Karachi 14.08
15 Turkey Istanbul 12.70
16 Brazil Rio de Janeiro 12.37
17 United States of America Los Angeles-Long Beach-Santa Ana 12.16
18 Philippines Manila 11.89
19 Russian Federation Moscow 11.46
20 China Chongqing 11.24
21 Nigeria Lagos 10.78
22 France Paris 10.46
23 China Shenzhen 10.22
24 Republic of Korea Seoul 9.80
25 United Kingdom London 9.70
26 Indonesia Jakarta 9.63
27 China Guangzhou 9.62
28 China Tianjin 9.45
29Democratic Republic of the Congo
Kinshasa 9.38
30 Japan Nagoya 9.16
Source: World Urbanization Prospects: The 2014 Revision. According to the World Urbanization Prospects “there exists no common global definition of what constitutes an urban settlement. The estimates in the World Urbanization Prospects are based on national statistics.”


Socio-economic Indicators of Urban India
2Chapter


Socio-economic Indicators of Urban India
39
Socio-economic indicators provide an understanding of how growth has impacted development. The socio-economic indicators covered in this chapter include data on education, health, gender, poverty, housing, amenities and other development indicators.
Estimates of National Sample Survey (NSS) 69th Round in 2012 indicate that 97.9% households in urban India had access to electricity, which shows an improvement of over 6 percentage points over 91.6% estimated in 2002 during NSS 58th round. Nagaland, Dadra & Nagar Haveli, Daman & Diu, Goa, Lakshadweep, Mizoram and Sikkim topped on this aspect with all the households having access to electricity in 2012. Bihar was at the bottom of this list with only 89.20% urban households having access to electricity in 2012. In urban areas, 81.60% households had septic tank/flush whereas 8.8% households had no latrine facilities in 2012.
According to Census 2011, 91.4% households in urban India had access to source of drinking water as compared to 90% in 2001. Wide inter-state disparities exist here as well. In Chandigarh 99.4% households had access to source of drinking water. On the other hand, in Lakshadweep only 20.2% households had access to source of drinking water in 2011.
Literacy rate in urban India has shown an improvement from 73.08% in 1991 to 79.92% in 2001 and 84.1% in 2011. Mizoram had the highest urban literacy of 97.6% followed by Kerala at 95.1% in 2011, whereas Uttar Pradesh and Bihar had the lowest urban literacy at 77.1% and 76.9%, respectively.
Sex ratio in urban India declined from 894 in 1991 to 900 (females per thousand male) in 2001 and showed an improvement to 929 in 2011. However, the child sex ratio (0-6 years) declined from 906 in 2001 to 905 in 2011. Kerala, Puducherry, Manipur and Meghalaya had more women in urban areas than men, with sex ratios of 1091, 1042, 1026 and 1001, respectively.
Table 2.4 provides data on incidence of poverty in urban areas in India. Poverty ratio in urban areas has shown improvement during 2004-05 to 2011-12. 13.7% people in urban areas were below poverty line in 2011-12 as compared to 25.5% in 2004-05. There is wide inter-state disparity in incidence of poverty. Andaman & Nicobar Islands had lowest urban poverty ratio estimated at negligible whereas
Manipur had the highest urban poverty incidence rate at 32.6% in 2011-12.
Socio-economic Indicators of Urban India

Handbook of Urban Statistics
40
Table 2.1: Access to Basic Amenities in Urban India
S.No. States/UTs
HHs with SDw (%)
HHs with Electricity (%)
HHs with Septic Tank/ Flush (%)
HHs with No Latrine (%)
2001 2011 2002 2008-09 2012 2002 2008-09 2012 2002 2008-09 20121 Andaman &
Nicobar Islands97.8 98.1 97.2 98.5 99.9 85.9 93.9 95.0 14.0 6.1 5.0
2 Andhra Pradesh 90.2 94.5 93.7 97.5 99.3 76.8 85.3 88.2 19.8 11.2 8.13 Arunachal
Pradesh90.7 91.3 95.8 98.5 98.1 51.6 61.5 88.7 0.6 0.1 0.0
4 Assam 70.4 78.2 86.8 94.6 98.9 76.2 84.8 89.5 1.8 0.9 0.35 Bihar 91.2 94.7 66.0 79.4 89.2 61.3 61.9 71.3 31.0 27.7 20.86 Chandigarh 99.8 99.4 99.7 98.5 98.3 92.9 99.4 97.1 5.0 0.6 1.67 Chhattisgarh 88.8 93.9 86.5 96.7 99.1 56.2 64.3 72.1 41.5 31.5 24.98 Dadra & Nagar
Haveli96.1 98.4 100.0 100.0 100.0 92.9 87.1 67.8 3.8 7.1 32.2
9 Daman & Diu 98.9 99.0 99.9 97.4 100.0 87.0 86.7 99.9 11.7 6.4 0.110 Goa 82.1 90.4 99.7 97.3 100.0 83.1 87.6 95.1 12.1 9.6 4.011 Gujarat 95.4 97.0 95.9 99.0 98.9 87.5 79.5 90.2 6.8 7.3 6.212 Haryana 97.3 96.7 97.7 98.3 99.3 76.2 73.5 84.6 15.0 8.4 1.413 Himachal
Pradesh97.0 97.8 99.8 99.4 99.7 68.6 87.5 95.3 10.3 8.8 4.3
14 Jammu & Kash-mir
95.7 96.1 99.5 97.5 99.9 59.3 71.3 77.1 12.6 11.8 6.0
15 Jharkhand 68.2 78.4 86.5 93.9 94.4 62.8 70.6 79.1 30.9 24.5 17.716 Karnataka 92.1 92.3 94.9 97.9 99.5 60.2 72.8 74.6 20.1 11.3 9.017 Kerala 42.8 39.4 90.4 97.9 98.7 49.1 50.6 51.5 3.7 1.5 1.218 Lakshadweep 4.6 20.2 100.0 100.0 100.0 73.7 62.0 70.8 8.2 1.0 2.319 Madhya Pradesh 88.6 92.1 92.0 96.9 99.4 51.4 66.2 76.8 33.1 24.3 14.020 Maharashtra 95.4 95.7 95.9 98.5 99.1 82.7 89.4 91.5 15.2 5.9 6.921 Manipur 59.4 60.8 93.4 99.5 99.4 45.6 51.6 51.4 N.A. N.A. 0.022 Meghalaya 73.5 79.5 93.9 99.3 98.3 77.7 79.1 87.6 0.9 0.2 0.223 Mizoram 47.8 75.8 99.8 99.8 100.0 55.8 82.3 91.2 N.A. N.A. 0.024 Nagaland 42.3 51.8 97.5 100.0 99.5 72.0 70.1 92.1 N.A. 1.3 0.025 NCT Of Delhi 97.7 95.2 99.5 98.6 99.9 76.4 92.8 98.6 6.9 1.2 0.026 Odisha 72.3 79.8 86.6 90.1 97.3 59.2 56.2 68.8 32.9 29.1 18.227 Puducherry 95.5 97.0 95.3 99.3 99.1 76.2 84.8 90.6 21.7 9.1 6.328 Punjab 98.9 98.9 98.0 99.3 99.7 74.5 84.1 86.6 11.6 5.0 6.229 Rajasthan 93.5 94.3 87.1 97.0 98.4 57.7 70.3 65.4 30.7 12.6 14.230 Sikkim 97.1 92.2 99.1 99.4 100.0 92.3 98.9 97.9 0.7 N.A. 0.031 Tamil Nadu 85.9 92.9 93.7 97.8 98.8 74.4 79.1 79.9 21.9 16.0 12.232 Tripura 85.8 91.9 90.3 95.3 98.9 43.1 48.6 54.1 0.8 0.9 0.133 Uttar Pradesh 97.2 97.9 86.3 89.8 92.4 67.5 72.8 83.8 16.7 14.2 10.734 Uttarakhand 97.8 98.7 98.0 98.6 99.1 65.9 70.6 67.8 16.5 3.3 1.635 West Bengal 92.3 93.9 83.7 93.3 96.8 65.4 73.4 75.2 11.2 5.6 5.4 India 90.0 91.4 91.6 96.1 97.9 70.7 77.3 81.6 17.9 11.3 8.8
SDW: Source of Drinking Water; HHs: HouseholdsSource: Household tables, Census of India and NSSO 58th , 65th and 69th Rounds, 2002, 2008-09 and 2012 respectively

Socio-economic Indicators of Urban India
41
Gra
ph 2
.1: A
cces
s to
Bas
ic A
men
ities
in U
rban
Indi
a-H
ouse
hold
s w
ith
SDW
(%)
Sour
ce: H
ouse
hold
tabl
es, C
ensu
s of
Indi
a an
d N
SSO
58t
h, 6
5th
and
69th
Rou
nds,
200
2, 2
008-
09 a
nd 2
012
resp
ectiv
ely
20
01
20
11
0
10
20
30
40
50
60
70
80
90
10
0
Andaman&NicobarIslands
AndhraPradesh
ArunachalPradesh
Assam
Bihar
Chandigarh
Chhattisgarh
Dadra&NagarHaveli
Daman&Diu
Goa
Gujarat
Haryana
HimachalPradesh
Jammu&Kashmir
Jharkhand
Karnataka
Kerala
Lakshadweep
MadhyaPradesh
Maharashtra
Manipur
Meghalaya
Mizoram
Nagaland
NCTofDelhi
Odisha
Puducherry
Punjab
Rajasthan
Sikkim
TamilNadu
Tripura
UttarPradesh
Uttarakhand
WestBengal
India

Handbook of Urban Statistics
42
Gra
ph 2
.2: A
cces
s to
Bas
ic A
men
ities
in U
rban
Indi
a-H
ouse
hold
s w
ith
elec
tric
ity
(%)
Sour
ce: H
ouse
hold
tabl
es, C
ensu
s of
Indi
a an
d N
SSO
58th
, 65th
and
69th
Rou
nds,
200
2, 2
008-
09 a
nd 2
012
resp
ectiv
ely
0
10
20
30
40
50
60
70
80
90
10
0
Andaman&NicobarIslands
AndhraPradesh
ArunachalPradesh
Assam
Bihar
Chandigarh
Chhattisgarh
Dadra&NagarHaveli
Daman&Diu
Goa
Gujarat
Haryana
HimachalPradesh
Jammu&Kashmir
Jharkhand
Karnataka
Kerala
Lakshadweep
MadhyaPradesh
Maharashtra
Manipur
Meghalaya
Mizoram
Nagaland
NCTofDelhi
Odisha
Puducherry
Punjab
Rajasthan
Sikkim
TamilNadu
Tripura
UttarPradesh
Uttarakhand
WestBengal
India
20
02
20
08
-09
20
12

Socio-economic Indicators of Urban India
43
Gra
ph 2
.3: A
cces
s to
Bas
ic A
men
ities
in U
rban
Indi
a-H
ouse
hold
s w
ith
no la
trin
e (%
)
Sour
ce: H
ouse
hold
tabl
es, C
ensu
s of
Indi
a an
d N
SSO
58t
h, 6
5th
and
69th
Rou
nds,
200
2, 2
008-
09 a
nd 2
012
resp
ectiv
ely.
05
10
15
20
25
30
35
40
45
Andaman&NicobarIslands
AndhraPradesh
ArunachalPradesh
Assam
Bihar
Chandigarh
Chhattisgarh
Dadra&NagarHaveli
Daman&Diu
Goa
Gujarat
Haryana
HimachalPradesh
Jammu&Kashmir
Jharkhand
Karnataka
Kerala
Lakshadweep
MadhyaPradesh
Maharashtra
Manipur
Meghalaya
Mizoram
Nagaland
NCTofDelhi
Odisha
Puducherry
Punjab
Rajasthan
Sikkim
TamilNadu
Tripura
UttarPradesh
Uttarakhand
WestBengal
India
20
02
20
08
- 09
20
12

Handbook of Urban Statistics
44
Table 2.2: Literacy Rate in Urban India
S.No. States/UTs Literacy Rate1991 2001 2011
1 Andaman & Nicobar Islands 81.69 86.57 90.12 Andhra Pradesh 66.35 76.09 80.13 Arunachal Pradesh 71.59 78.26 82.9
4 Assam 79.39 85.34 88.55 Bihar 67.89 71.93 76.96 Chandigarh 79.87 82.64 86.27 Chhattisgarh - 80.58 84.08 Dadra & Nagar Haveli 78.44 84.36 89.89 Daman & Diu 81.61 82.31 89.010 Goa 80.10 84.39 90.011 Gujarat 76.54 81.84 86.312 Haryana 73.66 79.16 83.113 Himachal Pradesh 84.17 88.95 91.114 Jammu & Kashmir - 71.92 77.115 Jharkhand - 79.14 82.316 Karnataka 79.67 80.58 85.817 Kerala 92.25 93.19 95.118 Lakshadweep 83.99 88.62 91.919 Madhya Pradesh 70.81 79.39 82.820 Maharashtra 79.20 85.48 88.721 Manipur 70.53 79.28 85.422 Meghalaya 81.74 86.30 90.823 Mizoram 93.45 96.13 97.624 Nagaland 83.10 84.74 89.625 NCT Of Delhi 76.18 81.93 86.326 Odisha 71.99 80.84 85.727 Puducherry 79.88 84.84 88.528 Punjab 72.08 79.10 83.229 Rajasthan 65.33 76.20 79.730 Sikkim 80.89 83.91 88.731 Tamil Nadu 77.99 82.53 87.032 Tripura 83.09 89.21 93.533 Uttar Pradesh 61.00 69.75 75.134 Uttarakhand - 81.44 84.535 West Bengal 75.27 81.25 84.8
India 73.08 79.92 84.1
Source: Census of India 1991, 2001 & 2011.

Socio-economic Indicators of Urban India
45
Gra
ph 2
.4: L
iter
acy
Rate
in U
rban
Indi
a
Sour
ce: C
ensu
s of
Indi
a 19
91, 2
001
& 2
011
0
10
20
30
40
50
60
70
80
90
10
0
Andaman&NicobarIslands
AndhraPradesh
ArunachalPradesh
Assam
Bihar
Chandigarh
Chhattisgarh
Dadra&NagarHaveli
Daman&Diu
Goa
Gujarat
Haryana
HimachalPradesh
Jammu&Kashmir
Jharkhand
Karnataka
Kerala
Lakshadweep
MadhyaPradesh
Maharashtra
Manipur
Meghalaya
Mizoram
Nagaland
NCTOfDelhi
Odisha
Puducherry
Punjab
Rajasthan
Sikkim
TamilNadu
Tripura
UttarPradesh
Uttarakhand
WestBengal
India
19
91
20
01
20
11

Handbook of Urban Statistics
46
Table 2.3: Sex Ratio in Urban India
S. No.
States/UTs Urban Sex Ratio Child Sex Ratio (0-6)1991 2001 2011 2001 2011
1 Andaman & Nicobar Islands 769 815 874 936 9542 Andhra Pradesh 959 965 987 955 9353 Arunachal Pradesh 728 819 890 980 9574 Assam 838 872 946 943 9445 Bihar 844 868 895 924 9126 Chandigarh 810 796 822 845 8807 Chhattisgarh NA 932 956 938 9378 Dadra & Nagar Haveli 817 691 682 888 8729 Daman & Diu 1024 984 551 943 89410 Goa 930 934 956 924 94011 Gujarat 907 880 880 837 85212 Haryana 868 847 873 808 83213 Himachal Pradesh 831 795 853 844 88114 Jammu & Kashmir No census 819 840 873 85015 Jharkhand NA 870 910 930 90816 Karnataka 930 942 963 940 94617 Kerala 1034 1058 1,091 958 96318 Lakshadweep 930 935 945 900 91119 Madhya Pradesh 893 898 918 907 90120 Maharashtra 875 873 903 908 89921 Manipur 975 1009 1,026 961 94922 Meghalaya 910 982 1,001 969 95423 Mizoram 932 948 998 963 97424 Nagaland 749 829 908 939 97325 NCT Of Delhi 830 822 868 870 87326 Odisha 866 895 932 933 91327 Puducherry 985 1007 1,042 967 97528 Punjab 868 849 875 796 85229 Rajasthan 879 890 914 887 87430 Sikkim 750 830 913 922 93431 Tamil Nadu 960 982 1,000 955 95232 Tripura 958 959 973 948 94733 Uttar Pradesh 860 876 894 890 88534 Uttarakhand NA 845 884 872 86835 West Bengal 858 893 944 948 947
India 894 900 929 906 905
Source: Census of India-1991, 2001 & 2011.

Socio-economic Indicators of Urban India
47
Table 2.4: Percentage of Population below Poverty Line in Urban India
S. No.
States/UTs Population Below Poverty Line (%)
2004-05 2009-10 2011-121 Andaman & Nicobar Islands 0.8 0.3 0.02 Andhra Pradesh 23.4 17.7 5.83 Arunachal Pradesh 23.5 24.9 20.34 Assam 21.8 26.1 20.55 Bihar 43.7 39.4 31.26 Chandigarh 10.1 9.2 22.37 Chhattisgarh 28.4 23.8 24.88 Dadra & Nagar Haveli 17.8 17.7 15.49 Daman & Diu 14.4 33.0 12.610 Goa 22.2 6.9 4.111 Gujarat 20.1 17.9 10.112 Haryana 22.4 23.0 10.313 Himachal Pradesh 4.6 12.6 4.314 Jammu & Kashmir 10.4 12.8 7.215 Jharkhand 23.8 31.1 24.816 Karnataka 25.9 19.6 15.317 Kerala 18.4 12.1 5.018 Lakshadweep 10.5 1.7 3.419 Madhya Pradesh 35.1 22.9 21.020 Maharashtra 25.6 18.3 9.121 Manipur 34.5 46.4 32.622 Meghalaya 24.7 24.1 9.323 Mizoram 7.9 11.5 6.424 Nagaland 4.3 25 16.525 NCT Of Delhi 12.9 14.4 9.826 Odisha 37.6 25.9 17.327 Puducherry 9.9 1.6 6.328 Punjab 18.7 18.1 9.229 Rajasthan 29.7 19.9 10.730 Sikkim 25.9 5 3.731 Tamil Nadu 19.7 12.8 6.532 Tripura 22.5 10 7.433 Uttar Pradesh 34.1 31.7 26.134 Uttarakhand 26.2 25.2 10.535 West Bengal 24.4 22 14.7
India 25.5 20.9 13.7Note: Poverty Ratios given in this table are as per the methodology recommended by Tendulkar Committee.Source: Planning Commission, 2012.

Handbook of Urban Statistics
48
Gra
ph 2
.5: P
opul
ation
bel
ow P
over
ty L
ine
in U
rban
Indi
a (%
)
Sour
ce: P
lann
ing
Com
mis
sion
, 201
2.
2004
-05
2009
-10
2011
-12
05
101520253035404550
Andaman&NicobarIslands
AndhraPradesh
ArunachalPradesh
Assam
Bihar
Chandigarh
Chhattisgarh
Dadra&NagarHaveli
Daman&Diu
Goa
Gujarat
Haryana
HimachalPradesh
Jammu&Kashmir
Jharkhand
Karnataka
Kerala
Lakshadweep
MadhyaPradesh
Maharashtra
Manipur
Meghalaya
Mizoram
Nagaland
NCTofDelhi
Odisha
Puducherry
Punjab
Rajasthan
Sikkim
TamilNadu
Tripura
UttarPradesh
Uttarakhand
WestBengal
India

Socio-economic Indicators of Urban India
49
Table 2.5: Per Capita Municipal Income and Expenditure in India
S. No.
States/UTsPer Capita NSDP
(in Rs.)Average Per Capita
Municipal Income (in Rs.)Average Per Capita Municipal
Expenditure (in Rs.)2001 2011 2003-05 2006-08 2003-05 2006-08
1 Andaman & Nicobar Islands
24,560 85,741 N.A. N.A. N.A. N.A.
2 Andhra Pradesh 16,708 62,912 1,735.89 2,529.96 1,725.5 2,555.443 Arunachal Pradesh 14,683 55,789 N.A. N.A. N.A. N.A.4 Assam 10,718 30,569 410.3 628.05 462.05 743.155 Bihar 5,333 18,928 270.66 990.12 336.93 986.956 Chandigarh 46,498 1,30,461 N.A. N.A. N.A. N.A.7 Chhattisgarh 9,922 41,167 1,813.01 3,475.23 2,161.62 3,789.658 Dadra & Nagar Haveli N.A. N.A. N.A. N.A. N.A. N.A.9 Daman & Diu N.A. N.A. N.A. N.A. N.A. N.A.
10 Goa 48,582 1,59,244 1,100.91 2,454.43 936.64 1,192.4511 Gujarat 18,560 75,115 2,397.41 3,374.44 2,451.1 3,426.2912 Haryana 23,286 94,464 792.68 1,467.34 811.08 1,480.6213 Himachal Pradesh 19,784 68,020 1,968.54 2,534.23 2,079.34 2278
14 Jammu & Kashmir 12,781 37,593 652.67 1,999.56 734.33 1,208.2215 Jharkhand 8,749 31,993 501.63 771.48 500.68 771.5216 Karnataka 17,806 59,975 1,766.9 2,726.22 1,725.66 2,974.3317 Kerala 19,951 71,434 1,322.42 1,255.93 1,056.14 1,218.5318 Lakshadweep N.A. N.A. N.A. N.A. N.A. N.A.19 Madhya Pradesh 10,704 32,253 1,126.04 2,088.22 1,307.54 2,348.0520 Maharashtra 21,871 87,686 4,557.94 6,565.55 4,359.55 6,193.7121 Manipur 10,658 29,684 517.52 438.43 312.47 319.3122 Meghalaya 14,654 47,164 N.A. N.A. N.A. N.A.23 Mizoram 18,491 48,591 N.A. N.A. N.A. N.A.24 Nagaland 17,629 52,966 N.A. N.A. N.A. N.A.25 NCT Of Delhi 42,378 1,50,653 N.A. N.A. N.A. N.A.26 Odisha 9,281 40,412 662.22 1,067.69 662.22 1,067.6927 Puducherry 35,190 98,719 N.A. N.A. N.A. N.A.28 Punjab 24,283 68,998 2,050.19 3,222.88 1,935.46 2,547.8929 Rajasthan 12,570 42,434 118.04 1,760.08 1,200.34 1,603.8530 Sikkim 16,658 1,04,506 N.A. N.A. N.A. N.A.31 Tamil Nadu 20,361 75,449 1,730.5 2,162.06 1,921.75 2,326.2332 Tripura 15,253 44,965 828.4 1,315.07 657.77 969.0233 Uttar Pradesh 9,178 26,903 779 1,235.02 1,085.67 1,065.6134 Uttarakhand 12,687 72,093 1,023.33 937.33 696.9 816.9535 West Bengal 16,146 47,738 1,122.62 1,508.04 1,220.92 1,810.36
India 53,331 1,708.71 2,493.25 1,747.78 2,461.91NSDP: Net State Domestic Product.Source: Economic Survey, 2012-13 and 13th Finance Commission, 2010.

Handbook of Urban Statistics
50
Table 2.6: Infant Mortality Rate (IMR) in Urban India
S. No. States/UTsIMR
2001 20111 Andaman & Nicobar Islands 8 142 Andhra Pradesh 39 313 Arunachal Pradesh 11 104 Assam 33 345 Bihar 52 346 Chandigarh 23 207 Chhattisgarh 56 418 Dadra & Nagar Haveli 9 229 Daman & Diu 35 2910 Goa 16 1311 Gujarat 42 2712 Haryana 54 3513 Himachal Pradesh 32 2814 Jammu & Kashmir 39 2815 Jharkhand 40 2816 Karnataka 27 2617 Kerala 9 918 Lakshadweep 33 2719 Madhya Pradesh 53 3920 Maharashtra 27 1721 Manipur 23 1222 Meghalaya 41 3823 Mizoram 12 1924 Nagaland 13 2025 NCT Of Delhi 28 2626 Odisha 60 4027 Puducherry 15 1828 Punjab 37 2529 Rajasthan 57 3230 Sikkim 31 1731 Tamil Nadu 35 1932 Tripura 30 1933 Uttar Pradesh 62 4134 Uttarakhand 26 2335 West Bengal 38 26
India 42 29
Source: SRS Bulletin, October 2002 & October 2012, Registrar General, India.
Note: 1. Infant Mortality Rates for smaller states and Union Territories for the year 2001 are based on three years period 1998-00; 2. Infant Mortality Rates for smaller states and Union Territories for the year 2011 are based on three-years period 2009-11

Socio-economic Indicators of Urban India
51
Gra
ph 2
.6: I
nfan
t M
orta
lity
Rate
Sour
ce: S
RS B
ulle
tin, O
ctob
er 2
002
& O
ctob
er 2
012,
Reg
istr
ar G
ener
al, I
ndia
.
0
10
20
30
40
50
60
70
Andaman&NicobarIslands
AndhraPradesh
ArunachalPradesh
Assam
Bihar
Chandigarh
Chhattisgarh
Dadra&NagarHaveli
Daman&Diu
Goa
Gujarat
Haryana
HimachalPradesh
Jammu&Kashmir
Jharkhand
Karnataka
Kerala
Lakshadweep
MadhyaPradesh
Maharashtra
Manipur
Meghalaya
Mizoram
Nagaland
NCTofDelhi
Odisha
Puducherry
Punjab
Rajasthan
Sikkim
TamilNadu
Tripura
UttarPradesh
Uttarakhand
WestBengal
India
20
01
20
11

Handbook of Urban Statistics
52
Table 2.7: Total Surplus/shortfall after transfer under Central Assistance to States (CAS) but preserving the fiscal space (in 2015-16 over 2014- 15)
(in Rs. crore)
S.No. StatesCAS over and above legally
backed schemes
Surplus/shortfall after transfer under CAS but preserving the fiscal space for centre
Absolute Per capita % of NSDP % of OTR
1 Andhra Pradesh (united) 5,062 10,134 1,198 1.5 19.0
2 Arunachal Pradesh 2,555 4,572 33,038 41.8 1439.2
3 Assam 5,860 4,378 1,403 3.5 57.3
4 Bihar 6,998 8,783 844 3.2 69.6
5 Chhattisgarh 2,673 5,258 2,058 3.8 49.1
6 Goa 180 995 6,820 2.7 39.6
7 Gujarat 4179 2,454 406 0.4 5.5
8 Haryana 1,509 714 282 0.2 3.5
9 Himachal Pradesh 3,593 6,826 9,944 11.7 166.2
10 Jammu & Kashmir 8,185 10,679 8,515 17.1 225.0
11 Jharkhand 2,870 4,650 1,410 3.6 66.9
12 Karnataka 4,873 5,300 867 1.1 11.4
13 Kerala 2,778 7,834 2,345 2.5 30.5
14 Madhya Pradesh 7,959 10,389 1,431 3.1 38.5
15 Maharashtra 5,365 7,496 667 0.6 8.6
16 Manipur 2,029 1,250 4,861 11.4 339.5
17 Meghalaya 1,536 661 2,226 4.1 94.8
18 Mizoram 1,157 1,967 17,925 26.0 1,100.7
19 Nagaland 2,019 1,839 9293 12.7 605.0
20 Odisha 6,826 3,497 833 1.7 26.0
21 Punjab 1,820 2,478 893 1.0 13.2
22 Rajasthan 6,618 2,423 353 0.6 9.5
23 Sikkim 1,415 489 8,006 5.2 166.3
24 Tamil Nadu 2,376 2,644 366 0.4 4.4
25 Tripura 2,139 458 1,246 2.0 53.3
26 Uttar Pradesh 9,110 18,716 937 2.7 35.6
27 Uttarakhand 3,014 -48 -48 -0.1 -0.9
28 West Bengal 8,386 11,365 1,245 2.0 45.6
TOTAL 113,081 138,198
NSDP: Net State Domestic Product; OTR: Own tax revenue Receipts; CAS: Central assistance to StatesSource: Ministry of Finance

Urban Employment
3Chapter


Urban Employment
55
Employment generation is one of the main challenges for economic policy makers in India so as
to exploit the demographic dividend and boost economic growth. The share of agriculture in GDP
has declined significantly. However, agriculture continues to be the major occupation in India. It is
important to create adequate jobs in urban areas so that labour force can be shifted out of agriculture
and employed in more productive sectors such as manufacturing and services. This chapter contains
data on various indicators of urban employment.
According to estimates of National Sample Survey (NSS) 68th round, labour force participation rate
(LFPR) in urban India was 36.7% in 2011-12 by Usual Principal and Subsidiary Status (UPSS), up
from 35.4% in 1999-2000 (NSSO 55th round estimates). Typically, LFPR was higher for urban male as
compared to urban female, and LFPR for both categories, urban male and urban female, witnessed
an increase during this period. LFPR for urban male by UPSS increased from 54.2% in 1999-2000 to
56.3% in 2011-12. LFPR for urban female by UPSS increased from 14.7% in 1999-2000 to 15.5% in
2011-12. Among the States, West Bengal had the highest (63%) and Bihar the least (44.1%) LFPR
of urban male in year 2011-12. As for female LFPR, Sikkim registered the highest participation rate
(27.4%) and Bihar registered the least participation rate (5.4%).
Workforce participation rate (WFPR) in urban India was 35.5% in 2011-12 by UPSS, up from 33.7%
in 1999-2000. Male WFPR was 54.6% in 2011-12 by UPSS, whereas female WFPR was 14.7% only.
Sikkim had the highest male and female WFPR at 60.9% and 27.3% respectively. On the other hand,
Nagaland had the lowest male WFPR at 41.2% while Bihar had lowest female WFPR at 4.5%.
Given that one of the greatest challenges in India is the lack of decent work in the organized sector,
it is crucial to look in further detail at the characteristics of work status of urban male and female.
In year 2011-12, the percentage of urban male workforce population self-employed stood at 41.7%,
while 14.9% of urban male workforce was engaged as casual labourers. In case of female workers,
42.8% of workforce is self-employed and 14.3% of female workforce was engaged as casual labourers.
Overall, the workforce employed as casual labourers has declined from 17.8% in 1999-2000 to 14.6%
in 2011-12.
An encouraging sign is reflected in decline of unemployment rates in urban areas during the first
decade of this century. Overall, urban unemployment rate in terms of usual status declined from
5.2% in 1999-2000 to 3.8% in 2011-12. Although the unemployment rates declined for both male
and female, it was seen that unemployment continues to be higher among females than males.
Urban Employment

Handbook of Urban Statistics
56
Unemployment rates stood at 3.2% for urban male and at 6.6% for urban female at all-India level in
2011-12. The highest unemployment rate has been registered in Nagaland (21.9%) for urban male
and in Tripura (57.9%) for urban female for the year 2011-12.
Majority of urban males are employed in manufacturing sector (22.3%) followed by wholesale and
retail trade, repair of motor vehicles and motorcycles segment. Construction segment also employs
10.7% of urban male. In case of females, 28.7% of workforce is employed in manufacturing segment
followed by education segment which incorporates 13.3% of urban female workforce. The next major
employer of urban female workforce is agriculture, forestry and fishing (10.9%).

Urban Employment
57
Table 3.1: Labour Force Participation Rate of Urban Persons, 1999-2000 and 2011-2012
(in percent)
States/UTs
1999-2000
2011-2012
1999-2000
2011-2012
1999-2000
2011-2012 1999-20002011-2012
Principal StatusPrincipal and
Subsidiary StatusCurrent
Weekly StatusCurrent
Daily StatusAndaman & Nicobar Islands 44.1 43.4 45.4 43.7 44.8 42.8 43.6 42.1Andhra Pradesh 35.2 37.5 36.2 38.0 35.3 37.5 34.1 36.8Arunachal Pradesh 27.5 31.5 27.5 31.8 23.4 31.8 22.9 31.6Assam 35.7 34.3 36.8 34.8 36.8 34.5 34.5 34.2Bihar 28.1 25.8 28.7 26.7 28.4 26.5 27.8 26.0Chandigarh 35.7 37.5 36.9 37.9 37.5 37.9 36.8 37.8Chhattisgarh 32.4 37.9 33.1 39.3 32.3 38.9 31.2 37.2Dadra & Nagar Haveli 40.9 36.5 40.9 36.7 40.2 36.5 39.2 36.5Daman & Diu 38.4 34.9 38.7 35.7 38.4 35.7 36.5 34.8Delhi 33.2 34.7 34.3 34.9 35.8 34.8 34.4 34.8Goa 37.5 35.2 37.9 35.3 37.8 35.2 37.0 35.0Gujarat 34.0 37.8 35.2 38.7 34.6 38.5 32.8 37.8Haryana 30.4 32.5 32.3 33.1 32.6 33.1 30.7 32.7Himachal Pradesh 32.8 42.1 34.4 43.3 33.8 42.9 33.0 42.2Jammu & Kashmir 28.4 34.3 29.6 36.2 28.7 35.3 28.2 34.7Jharkhand 28.1 29.0 28.7 30.0 28.4 29.7 27.8 29.1Karnataka 37.2 38.5 37.8 38.8 37.3 38.5 36.0 37.9Kerala 38.5 37.0 41.5 38.6 38.7 36.9 36.0 35.1Lakshadweep 30.2 37.2 34.3 39.3 30.6 37.2 29.8 36.2Madhya Pradesh 32.4 32.4 33.1 33.4 32.3 32.7 31.2 32.3Maharashtra 35.9 36.2 36.7 37.4 36.3 36.8 35.2 36.1Manipur 31.7 33.2 35.3 34.7 34.3 34.7 31.4 33.2Meghalaya 31.0 35.0 31.0 35.0 31.1 35.2 30.5 34.3Mizoram 36.4 38.6 37.4 38.6 38.5 38.3 34.5 37.2Nagaland 31.5 35.3 33.5 37.6 33.5 36.5 32.1 34.8Odisha 32.3 38.5 33.9 39.5 31.9 38.5 30.9 37.9Puducherry 36.2 34.9 36.8 36.0 36.3 34.2 35.1 33.7Punjab 33.6 35.9 36.3 37.9 35.2 37.6 34.1 36.7Rajasthan 31.0 31.4 33.2 33.6 31.6 33.2 30.8 32.2Sikkim 40.5 46.3 40.7 46.3 40.6 46.3 39.6 46.2Tamil Nadu 40.0 39.6 41.0 40.3 40.2 40.1 38.6 39.1Tripura 31.0 42.3 31.3 42.7 31.1 42.4 30.7 42.2Uttar Pradesh 30.1 31.4 31.7 33.1 31.0 32.5 29.8 31.4Uttarakhand 30.1 31.1 31.7 32.2 31.0 32.1 29.8 31.1West Bengal 37.0 39.2 37.8 41.9 37.7 41.3 36.5 39.4
India 34.2 35.6 35.4 36.7 34.7 36.3 33.5 35.4
Note: In 1999-2000, the figures of Bihar, Madhya Pradesh and Uttar Pradesh are used for Jharkhand, Chhattisgarh and Uttarakhand respectively.Source: National Sample Survey Organization, Employment and Unemployment, Report No.458 (1999-2000; 55th Round) and Report No. 554(2011-2012; 68th Round).

Handbook of Urban Statistics
58
Gra
ph 3
.1: L
abou
r Fo
rce
Parti
cipa
tion
Rat
e of
Urb
an P
erso
ns (P
rinc
ipal
& s
ubsi
diar
y st
atus
) (%
)
Sour
ce: N
ation
al S
ampl
e Su
rvey
Org
aniz
ation
, Em
ploy
men
t and
Une
mpl
oym
ent,
Rep
ort N
o.45
8 (1
999-
2000
; 55th
Rou
nd) a
nd R
epor
t No.
554
(201
1-20
12;
68th
Rou
nd).

Urban Employment
59
Table 3.2: Labour Force Participation Rate of Urban Male, 1999-2000 and 2011-2012
(in percent)
States/UTs
1999-2000
2011-2012
1999-2000
2011-2012
1999-2000
2011-2012
1999-2000
2011-2012
Principal StatusPrincipal and
Subsidiary StatusCurrent
Weekly StatusCurrent
Daily StatusAndaman & Nicobar Islands 65.2 63.1 65.3 63.3 65.5 61.6 65.3 60.8Andhra Pradesh 53.0 57.4 53.2 57.6 52.7 57.4 51.7 56.7Arunachal Pradesh 40.6 47.5 40.6 47.5 35.6 47.6 34.9 47.5Assam 55.8 56.9 56.5 57.3 56.7 56.9 53.3 56.7Bihar 46.3 43.7 46.6 44.1 46.3 43.9 45.8 43.8Chandigarh 55.9 57.9 56.6 57.9 56.6 57.9 56.5 57.9Chhattisgarh 50.5 51.2 50.9 51.7 50.3 51.6 49.1 49.9Dadra & Nagar Haveli 66.4 57.6 66.4 57.6 66.3 57.6 64.8 57.6Daman & Diu 55.4 59.4 55.7 59.5 55.6 59.5 53.7 59.5Delhi 54.4 54.8 54.6 54.8 56.7 54.7 55.5 54.7Goa 58.5 52.6 58.5 52.6 57.6 52.5 56.6 52.5Gujarat 54.4 60.5 54.7 60.7 54.4 60.6 52.5 60.4Haryana 51.9 53.4 52.0 53.5 52.1 53.4 51.0 53.2Himachal Pradesh 53.1 61.1 53.3 61.2 53.2 60.7 53.2 60.6Jammu & Kashmir 49.6 55.8 50.0 56.3 49.3 55.7 49.0 55.5Jharkhand 46.3 49.7 46.6 50.3 46.3 50.1 45.8 49.6Karnataka 56.0 59.3 56.2 59.4 55.8 59.3 54.6 58.6Kerala 57.4 55.8 59.1 56.7 56.9 55.1 53.9 52.8Lakshadweep 45.3 57.2 46.0 58.2 45.0 57.0 44.2 55.5Madhya Pradesh 50.5 52.9 50.9 53.3 50.3 53.1 49.1 52.8Maharashtra 56.2 55.6 56.3 56.0 56.2 55.7 55.1 55.3Manipur 47.0 48.3 47.8 48.3 47 48.2 44.9 47.7Meghalaya 40.7 51.5 40.7 51.5 40.7 51.8 40.0 50.6Mizoram 48.1 50.7 48.7 50.7 49.9 50.5 46.0 49.2Nagaland 43.2 50.8 43.3 50.9 43.3 50.3 43.1 49.8Odisha 50.8 60.1 51.1 60.3 49.7 59.8 49.1 59.3Puducherry 57.3 55.5 57.4 56.3 57.4 53.8 56.3 53.4Punjab 55.9 58.4 56.5 58.6 55.9 58.5 55.5 58.3Rajasthan 49.6 50.6 49.9 50.7 49.7 50.7 49.4 50.6Sikkim 55.3 62.8 55.7 62.8 55.6 62.8 54.9 62.8Tamil Nadu 58.2 59.6 58.5 59.9 58.1 59.8 56.9 59Tripura 51.9 59.3 52.2 59.4 51.7 59.3 51.1 59Uttar Pradesh 50.7 52.7 51.2 53.3 50.7 52.9 49.8 52.2Uttarakhand 50.7 51.5 51.2 51.9 50.7 51.5 49.8 51.3West Bengal 60.8 62.1 61.2 63.0 61 62.6 60.2 61.5India 53.9 56.0 54.2 56.3 53.9 56.1 52.8 55.5
Note: In 1999-2000, the figures of Bihar, Madhya Pradesh and Uttar Pradesh are used for Jharkhand, Chhattisgarh and Uttarakhand respectively. Source: National Sample Survey Organization, Employment and Unemployment, Report No.458 (1999-2000; 55th Round) and Report No. 554 (2011-2012; 68th Round)

Handbook of Urban Statistics
60
Table 3.3: Labour Force Participation Rate of Urban Female, 1999-2000 and 2011-2012
(in percent)
States/UTs1999-00 2011-12 1999-00 2011-12 1999-00 2011-12 1999-00 2011-12
Principal StatusPrincipal and
Subsidiary StatusCurrent
Weekly StatusCurrent
Daily StatusAndaman & Nicobar Islands 22.3 24.4 24.9 24.8 23.5 24.8 21.2 24.1Andhra Pradesh 16.6 17.1 18.4 18.0 17.1 17.2 15.8 16.6Arunachal Pradesh 11.0 13.1 11.0 13.9 8.1 13.8 8.0 13.3Assam 12.4 9.0 13.8 9.7 13.8 9.3 12.8 9.1Bihar 7.1 3.7 8.2 5.4 7.8 5.0 7.0 4.1Chandigarh 13.4 12.8 15.3 13.5 16.4 13.7 15.1 13.3Chhattisgarh 12.4 22.9 13.6 25.2 12.6 24.6 11.6 22.8Dadra & Nagar Haveli 11.2 11.1 11.2 11.5 9.9 11.1 9.5 11.1Daman & Diu 19.8 13.7 20.3 15.2 19.7 15.2 17.8 13.5Delhi 8.7 10.5 10.9 10.9 11.8 10.9 10.0 10.8Goa 15.1 17.2 15.9 17.4 16.5 17.4 16.0 16.9Gujarat 11.7 11.7 13.8 13.5 13.0 13.2 11.2 11.9Haryana 6.1 9.0 10.1 10.2 10.4 10.2 7.8 9.6Himachal Pradesh 10.9 21.1 14.2 23.6 13.0 23.2 11.4 21.8Jammu & Kashmir 4.8 10.8 6.8 14.5 5.7 13.1 5.0 11.9Jharkhand 7.1 6.0 8.2 7.3 7.8 7.0 7.0 6.3Karnataka 17.5 16.7 18.6 17.1 18.0 16.7 16.5 16.0Kerala 21.2 19.9 25.4 22.2 22.0 20.4 19.5 19.0Lakshadweep 14.4 14.5 22.1 17.8 15.7 14.6 14.9 14.1Madhya Pradesh 12.4 10.3 13.6 11.9 12.6 10.8 11.6 10.3Maharashtra 13.2 15.2 14.6 17.2 14.0 16.4 12.9 15.3Manipur 15.8 17.3 22.5 20.4 21.1 20.5 17.4 18.0Meghalaya 21.0 21.0 21.1 21.0 21.2 21.1 20.7 20.4Mizoram 25.2 26.7 26.5 26.7 27.6 26.3 23.4 25.5Nagaland 17.6 17.7 21.7 22.4 21.7 20.8 18.9 17.8Odisha 12.0 13.8 15.3 15.8 12.5 14.4 11.1 13.6Puducherry 17.1 14.0 18.1 15.3 17.3 14.2 15.9 13.7Punjab 7.5 10.0 12.8 14.1 11.1 13.6 9.0 11.8Rajasthan 9.7 9.8 14.1 14.4 11.1 13.6 9.7 11.5Sikkim 22.5 27.4 22.5 27.4 22.5 27.4 21.1 27.4Tamil Nadu 20.9 20.0 22.7 21.1 21.4 20.7 19.5 19.6Tripura 7.9 25.4 8.1 26.0 8.3 25.4 8.1 25.3Uttar Pradesh 6.9 7.7 9.7 10.6 8.8 9.8 7.3 8.4Uttarakhand 6.9 8.7 9.7 10.8 8.8 10.8 7.3 9.1West Bengal 11.5 13.8 12.9 18.6 12.7 17.7 11.2 14.8India 12.6 13.4 14.7 15.5 13.8 14.8 12.3 13.6
Note: In 1999-2000, the figures of Bihar, Madhya Pradesh and Uttar Pradesh are used for Jharkhand, Chhattisgarh and Uttarakhand respectively.Source: National Sample Survey Organization, Employment and Unemployment, Report No.458 (1999-2000; 55th Round) and Report No. 554(2011-2012; 68th Round).

Urban Employment
61
Table 3.4: Work Force Participation Rate of Urban Persons, 1999-2000 and 2011-2012
(in percent)
States/UTs
1999-2000
2011-2012
1999-2000
2011-2012
1999-2000
2011-2012
1999-2000
2011-2012
Principal Status Principal and Sub-sidiary Status
CurrentWeekly Status
CurrentDaily Status
Andaman & Nicobar Islands 40.1 38.4 42.2 39.9 41.1 38.2 39.4 37.3Andhra Pradesh 33.7 35.8 34.8 36.4 33.5 35.4 31.5 34.5Arunachal Pradesh 26.7 29.9 26.7 30.3 22.7 30.4 22.3 30.1Assam 31.7 32.4 33.2 32.9 33.0 32.5 30.4 32.2Bihar 25.8 24.1 26.6 25.3 26.0 24.7 25.2 24.1Chandigarh 33.6 35.1 35.1 35.4 34.4 35.3 33.9 35.1Chhattisgarh 31.1 35.8 31.9 37.6 30.5 35.9 29.0 33.9Dadra & Nagar Haveli 40.4 36.5 40.4 36.7 39.4 36.5 38.4 36.5Daman & Diu 37.1 34.7 37.6 35.5 37.3 35.5 35.4 34.6Delhi 32.0 33.4 33.2 33.7 34.6 33.4 33.0 33.3Goa 30.3 33.6 30.9 33.7 28.8 33.6 27.3 33.3Gujarat 33.3 37.5 34.5 38.4 33.6 38.2 31.4 37.2Haryana 29.6 31.1 31.4 31.8 31.3 31.6 29.3 31.3Himachal Pradesh 30.4 40.4 32.2 41.6 31.4 41.4 30.4 40.6Jammu & Kashmir 26.8 31.6 28.1 33.7 27.0 32.6 26.3 31.7Jharkhand 25.8 27.5 26.6 28.4 26.0 27.9 25.2 27.3Karnataka 35.9 37.2 36.6 37.6 35.8 37.2 34.0 36.3Kerala 33.7 34.1 37.3 36.3 33.3 33.8 29.1 30.8Lakshadweep 26.1 32.5 30.8 34.7 26.3 32.4 24.9 30.8Madhya Pradesh 31.1 31.5 31.9 32.5 30.5 31.6 29.0 30.8Maharashtra 33.6 35.3 34.6 36.5 33.8 35.7 32.3 34.8Manipur 29.1 30.6 33.0 32.2 32.0 32.2 29.2 30.7Meghalaya 29.6 34.0 29.6 34.0 29.7 34.1 29.1 33.2Mizoram 35.1 36.6 36.3 36.7 37.5 36.3 33.2 35.3Nagaland 28.5 25.6 30.5 28.7 30.2 27.4 29.9 25.6Odisha 30.0 37.0 31.7 38.1 29.3 36.7 27.9 35.7Puducherry 34.6 33.6 35.2 35.0 33.6 32.3 30.7 31.0Punjab 32.5 34.8 35.3 36.8 33.8 36.3 32.4 35.1Rajasthan 30.1 30.3 32.3 32.6 30.4 31.7 29.5 30.5Sikkim 37.3 45.2 37.5 45.2 37.5 45.2 36.7 45.2Tamil Nadu 38.2 38.5 39.3 39.2 38.1 38.4 35.2 36.4Tripura 29.1 31.6 29.5 31.9 29.2 31.6 28.8 30.5Uttar Pradesh 28.8 30.0 30.4 31.7 29.4 30.8 28.0 29.5Uttarakhand 28.8 29.3 30.4 30.5 29.4 30.2 28.0 28.9West Bengal 34.0 36.9 35.0 40.0 34.4 39.0 32.6 36.7India 32.4 34.2 33.7 35.5 32.7 34.7 30.9 33.5
Note: In 1999-2000, the figures of Bihar, Madhya Pradesh and Uttar Pradesh are used for Jharkhand, Chhattisgarh and Uttarakhand respectively.Source: National Sample Survey Organization, Employment and Unemployment, Report No.458 (1999-2000; 55th Round) and Report No. 554(2011-2012; 68th Round).

Handbook of Urban Statistics
62
Gra
ph 3
.2: W
ork
Forc
e Pa
rtici
pati
on R
ate
of U
rban
Per
sons
(Pri
ncip
al &
sub
sidi
ary
stat
us) (
%)
Sour
ce: N
ation
al S
ampl
e Su
rvey
Org
aniz
ation
, Em
ploy
men
t and
Une
mpl
oym
ent,
Rep
ort N
o.45
8 (1
999-
2000
; 55th
Rou
nd) a
nd R
epor
t No.
554
(201
1-20
12;
68th
Rou
nd)

Urban Employment
63
Table 3.5: Work Force Participation Rate of Urban Male, 1999-2000 and 2011-2012(in percent)
States/UTs
1999-2000
2011-2012
1999-2000
2011-2012
1999-2000
2011-2012
1999-2000
2011-2012
Principal StatusPrincipal and
Subsidiary StatusCurrent
Weekly StatusCurrent
Daily StatusAndaman & Nicobar Islands 62.7 59.6 63.2 60.7 62.9 58.6 62.0 57.7Andhra Pradesh 50.8 55.1 51.1 55.4 50.2 54.7 48.0 53.6Arunachal Pradesh 39.9 45.7 39.9 45.7 34.8 45.8 34.1 45.8Assam 50.7 53.8 52.2 54.2 51.9 53.8 48.0 53.4Bihar 42.8 41.4 43.2 42.1 42.8 41.6 41.8 41.2Chandigarh 53.7 54.7 54.7 54.7 54.4 54.7 54.0 54.5Chhattisgarh 48.3 48.6 48.8 49.6 47.3 47.5 45.5 45.3Dadra & Nagar Haveli 65.6 57.6 65.6 57.6 64.9 57.6 63.4 57.6Daman & Diu 54.5 59.4 54.9 59.5 54.8 59.5 52.8 59.5Delhi 52.6 52.9 52.8 53.0 54.8 52.6 53.2 52.4Goa 49.5 51.1 49.8 51.1 46.7 50.9 44.5 50.9Gujarat 53.2 60.1 53.6 60.3 52.9 60.1 50.4 59.6Haryana 50.5 51.2 50.6 51.4 50.2 51.2 48.7 51.1Himachal Pradesh 49.8 59.9 49.9 60.0 49.7 59.5 49.4 59.3Jammu & Kashmir 47.3 53.2 47.8 53.9 46.7 53.2 46.1 52.6Jharkhand 42.8 47.3 43.2 48.0 42.8 47.2 41.8 46.8Karnataka 54.3 57.5 54.5 57.9 53.6 57.5 51.7 56.5Kerala 53.4 54.0 55.8 55.2 51.3 52.5 45.6 48.2Lakshadweep 41.2 53.7 43.2 55.0 40.3 53.4 38.4 51.0Madhya Pradesh 48.3 51.6 48.8 52.0 47.3 51.3 45.5 50.4Maharashtra 52.8 54.5 53.2 54.9 52.6 54.4 50.9 53.7Manipur 43.6 45.5 44.5 45.6 43.9 45.5 41.9 44.9Meghalaya 39.3 50.2 39.3 50.3 39.3 50.5 38.6 49.3Mizoram 46.0 48.7 47.1 48.7 48.4 48.4 44.3 47.1Nagaland 39.1 39.7 39.3 41.2 39.1 40.3 38.9 39.6Odisha 47.2 57.7 47.5 57.9 45.7 56.7 44.3 55.5Puducherry 55.3 53.6 55.5 54.8 53.3 50.7 48.9 48.6Punjab 54.1 56.8 54.9 57.0 53.7 56.5 52.9 55.8Rajasthan 48.3 48.8 48.6 49.0 47.7 48.2 47.1 47.9Sikkim 51.5 60.9 51.9 60.9 52.2 60.9 51.4 60.9Tamil Nadu 56.0 58.3 56.3 58.7 55.2 57.8 51.8 55.3Tripura 49.0 52.5 49.4 52.5 48.8 52.5 48.2 50.6Uttar Pradesh 48.4 50.4 49.0 51.1 47.9 50.2 46.7 49.0Uttarakhand 48.4 50.2 49.0 50.6 47.9 49.9 46.7 49.1West Bengal 56.1 58.9 56.7 60.2 56.0 59.4 54.1 57.6India 51.3 54.2 51.8 54.6 50.9 53.9 49.0 52.8
Note: In 1999-2000, the figures of Bihar, Madhya Pradesh and Uttar Pradesh are used for Jharkhand, Chhattisgarh and Uttarakhand respectively.Source: National Sample Survey Organization, Employment and Unemployment, Report No.458 (1999-2000; 55th Round) and Report No. 554(2011-2012; 68th Round)

Handbook of Urban Statistics
64
Table 3.6: Work Force Participation Rate of Urban Female, 1999-2000 and 2011-2012
(in percent)
States/UTs1999-2000 2011-2012 1999-2000 2011-2012 1999-2000 2011-2012 1999-2000 2011-2012
Principal Status Principal and Subsidiary Status Current Weekly Status Current Daily Status
Andaman & Nicobar Islands 16.9 18.1 20.6 20.0 18.6 18.6 16.1 17.8
Andhra Pradesh 15.9 16.0 17.8 17.0 16.1 15.7 14.4 15.0Arunachal Pradesh 10.0 11.9 10.0 12.7 7.5 12.6 7.5 12.1Assam 9.7 8.4 11.2 9.0 11.1 8.6 10.0 8.4Bihar 6.4 2.8 7.5 4.5 6.9 3.9 6.1 3.0Chandigarh 11.4 11.4 13.6 12.1 12.5 11.8 11.7 11.6Chhattisgarh 12.2 21.3 13.4 24.0 12.1 22.8 10.9 20.9Dadra & Nagar Haveli 11.2 11.1 11.2 11.5 9.9 11.1 9.5 11.1Daman & Diu 18.1 13.4 18.6 14.8 18.2 14.8 16.3 13.2Delhi 8.2 10.0 10.5 10.4 11.3 10.4 9.6 10.3Goa 9.8 15.5 10.6 15.7 9.6 15.7 8.9 15.2Gujarat 11.4 11.4 13.5 13.3 12.5 13.0 10.6 11.6Haryana 5.8 8.5 9.8 9.7 10.0 9.6 7.4 9.0Himachal Pradesh 9.6 18.8 13.0 21.2 11.7 21.5 10.1 20.1Jammu & Kashmir 4.1 8.1 6.2 11.7 5.1 10.2 4.3 9.0Jharkhand 6.4 5.3 7.5 6.6 6.9 6.3 6.1 5.7Karnataka 16.7 15.8 17.8 16.3 17.2 15.9 15.6 15.2Kerala 15.6 16.1 20.3 19.1 16.9 16.8 14.0 15.0Lakshadweep 10.3 8.4 17.9 11.6 11.8 8.5 10.8 7.9Madhya Pradesh 12.2 9.9 13.4 11.5 12.1 10.3 10.9 9.8Maharashtra 12.2 14.6 13.7 16.6 12.9 15.5 11.6 14.3Manipur 14.2 15.1 21.1 18.2 19.7 18.3 16.1 15.8Meghalaya 19.6 20.2 19.7 20.2 19.7 20.2 19.3 19.5Mizoram 24.6 24.9 25.9 24.9 27.0 24.6 22.7 23.8Nagaland 15.8 9.5 19.9 14.4 19.6 12.7 17.0 9.8Odisha 11.2 13.5 14.5 15.5 11.6 14.0 10.2 13.2Puducherry 15.9 13.2 16.9 14.7 15.8 13.6 14.2 13.0Punjab 7.3 9.5 12.5 13.6 10.6 13.0 8.5 11.3Rajasthan 9.3 9.5 13.8 14.1 10.8 13.1 9.4 11.0Sikkim 20.0 27.3 20.0 27.3 19.7 27.3 18.9 27.3Tamil Nadu 19.7 19.0 21.5 20.1 20.1 19.4 17.8 17.9Tripura 7.2 10.7 7.5 11.3 7.6 10.7 7.4 10.5Uttar Pradesh 6.6 7.3 9.4 10.2 8.4 9.3 7.0 7.9Uttarakhand 6.6 6.5 9.4 8.6 8.4 8.7 7.0 6.9West Bengal 10.2 12.4 11.7 17.4 11.3 16.3 9.7 13.5India 11.7 12.5 13.9 14.7 12.8 13.8 11.1 12.5Note: In 1999-2000, the figures of Bihar, Madhya Pradesh and Uttar Pradesh are used for Jharkhand, Chhattisgarh and Uttarakhand respectively.
Source: National Sample Survey Organization, Employment and Unemployment, Report No.458 (1999-2000; 55th Round) and Report No. 554(2011-2012; 68th Round)

Urban Employment
65
Table 3.7: Work Status (principal and subsidiary) of Urban Persons, 1999-2000 and 2011-2012
(in percent)
States/UTs1999-2000 2011-2012 1999-2000 2011-2012 1999-2000 2011-2012
Self-employed Regular Salaried Casual Labourers
Andaman & Nicobar Islands 29.1 18.5 44.2 58.1 26.7 23.3Andhra Pradesh 36.7 37.6 38.7 46.7 24.6 15.9Arunachal Pradesh 24.1 35.6 59.0 53.1 16.9 11.2Assam 44.7 53.8 42.9 36.5 12.4 9.7Bihar 53.7 60.5 30.2 22.1 16.1 17.4Chandigarh 33.1 37.3 61.5 55.9 5.4 7.1Chhattisgarh 46.3 35.1 33.0 36.2 20.7 28.7Dadra & Nagar Haveli 34.3 16.3 51.4 81.5 14.3 2.2Daman & Diu 55.7 35.5 39.1 53.8 5.2 10.7Delhi 41.1 34.7 54.8 61.4 4.1 3.6Goa 26.3 27.9 51.4 65.3 22.3 6.8Gujarat 41.0 41.7 34.1 49.5 24.9 8.9Haryana 44.8 40.6 42.8 49.4 12.4 10.1Himachal Pradesh 37.6 30.3 51.6 60.6 10.8 9.1Jammu & Kashmir 48.1 48.7 40.4 40.9 11.5 10.4Jharkhand 53.7 43.7 30.2 38.0 16.1 18.3Karnataka 38.8 39.4 39.6 44.9 21.6 16.0Kerala 41.3 36.4 29.1 35.8 29.6 27.8Lakshadweep 45.7 35.4 38.3 42.4 16.0 22.2Madhya Pradesh 46.3 48.3 33.0 34.8 20.7 16.9Maharashtra 33.8 36.2 51.5 54.5 14.7 9.3Manipur 60.3 73.0 30.6 22.0 9.1 5.0Meghalaya 26.3 35.9 56.4 50.0 17.3 14.1Mizoram 49.5 52.3 33.8 39.8 16.7 7.6Nagaland 24.2 42.9 71.7 54.0 4.1 2.8Odisha 42.8 51.2 35.8 34.6 21.4 14.2Puducherry 29.3 23.7 40.8 54.9 29.9 21.1Punjab 47.7 44.6 40.9 47.8 11.4 7.6Rajasthan 49.9 45.4 36.5 38.7 13.6 15.6Sikkim 32.7 38.3 56.5 58.2 10.8 3.8Tamil Nadu 34.7 34.4 44.1 43.4 21.2 22.4Tripura 31.3 39.2 53.0 44.5 15.7 16.3Uttar Pradesh 55.0 54.6 32.3 28.7 12.7 17.0Uttarakhand 55.0 51.5 32.3 40.0 12.7 8.9West Bengal 43.2 45.0 40.0 38.0 16.8 16.8India 42.2 42.0 40.0 43.4 17.8 14.6
Note: In 1999-2000, the figures of Bihar, Madhya Pradesh and Uttar Pradesh are used for Jharkhand, Chhattisgarh and Uttarakhand respectively.
Source: National Sample Survey Organization, Employment and Unemployment, Report No.458 (1999-2000; 55th Round) and Report No. 554(2011-2012; 68th Round)

Handbook of Urban Statistics
66
Gra
ph 3
.3:
Wor
k St
atus
(Pri
ncip
al &
sub
sidi
ary
stat
us) o
f Urb
an P
erso
ns (%
)
Sour
ce: N
ation
al S
ampl
e Su
rvey
Org
aniz
ation
, Em
ploy
men
t and
Une
mpl
oym
ent,
Rep
ort N
o. 5
54(2
011-
2012
; 68t
h Ro
und)
.

Urban Employment
67
Table 3.8: Work Status (principal and subsidiary) of Urban Males, 1999-2000 and 2011-2012
(in percent)
States/UTs1999-2000 2011-2012 1999-2000 2011-2012 1999-2000 2011-2012
Self-employed Regular Salaried Casual LabourersAndaman & Nicobar Islands 26.2 20.9 46.9 58.3 26.9 20.8Andhra Pradesh 35.8 35.4 42.0 49.5 22.2 15.2Arunachal Pradesh 21.6 32.2 59.0 56.7 19.4 11.2Assam 48.3 55.0 40.5 35.2 11.2 9.8Bihar 54.1 61.0 31.0 21.9 14.9 17.1Chandigarh 36.2 36.7 58.3 55.0 5.5 8.2Chhattisgarh 45.2 35.9 36.9 36.3 17.9 27.8Dadra & Nagar Haveli 32.8 18.1 55.7 80.2 11.5 1.6Daman & Diu 54.1 33.1 41.8 59.2 4.1 7.7Delhi 41.9 36.8 54.1 59.4 4.0 4.0Goa 23.3 32.5 53.5 60.1 23.2 7.4Gujarat 40.8 40.3 35.9 51.9 23.3 7.8Haryana 43.3 42.6 44.4 46.3 12.3 11.1Himachal Pradesh 33.7 28.5 54.3 61.0 12.0 10.5Jammu & Kashmir 48.9 49.9 40.4 39.1 10.7 11.1Jharkhand 54.1 45.0 31.0 37.1 14.9 17.7Karnataka 37.9 41.6 41.7 42.7 20.4 15.7Kerala 37.4 36.4 28.0 31.5 34.6 32.1Lakshadweep 34.5 34.5 43.1 39.3 22.4 26.0Madhya Pradesh 45.2 48.3 36.9 34.6 17.9 17.3Maharashtra 33.0 36.8 54.0 54.6 13.0 8.6Manipur 53.1 68.6 35.5 25.2 11.4 6.1Meghalaya 25.6 32.2 55.2 50.7 19.2 17.1Mizoram 42.6 41.9 39.8 47.2 17.6 10.7Nagaland 20.0 36.2 75.5 60.0 4.5 3.9Odisha 41.9 49.6 39.9 36.4 18.2 14.0Puducherry 29.2 24.8 41.0 52.0 29.8 23.2Punjab 47.4 45.3 40.4 46.5 12.2 8.2Rajasthan 46.1 41.8 40.4 41.8 13.5 16.5Sikkim 40.5 35.0 51.4 59.9 8.1 5.1Tamil Nadu 33.0 32.4 45.4 43.6 21.6 23.9Tripura 33.8 43.4 50.4 39.8 15.8 16.8Uttar Pradesh 53.1 52.1 33.4 29.9 13.5 18.0Uttarakhand 53.1 51.2 33.4 39.3 13.5 9.5West Bengal 43.1 44.9 39.9 37.5 17.0 17.8India 41.5 41.7 41.7 43.4 16.8 14.9
Note: In 1999-2000, the figures of Bihar, Madhya Pradesh and Uttar Pradesh are used for Jharkhand, Chhattisgarh and Uttarakhand respectively.
Source: National Sample Survey Organization, Employment and Unemployment, Report No.458 (1999-2000; 55th Round) and Report No. 554(2011-2012; 68th Round)

Handbook of Urban Statistics
68
Table 3.9: Work Status (principal and subsidiary) of Urban Females, 1999-2000 and 2011-2012
(in percent)
States/UTs1999-2000 2011-2012 1999-2000 2011-2012 1999-2000 2011-2012
Self-employed Regular Salaried Casual LabourersAndaman & Nicobar Islands 38.3 11.5 35.8 58.0 25.9 30.5Andhra Pradesh 39.3 44.7 28.5 37.6 32.2 18.2Arunachal Pradesh 35.7 48.8 57.1 38.6 7.2 11.8Assam 25.1 46.7 55.6 44.4 19.3 7.8Bihar 51.3 53.3 25.2 26.7 23.5 17.8Chandigarh 19.4 39.7 75.9 60.3 4.7 0.0Chhattisgarh 50.4 33.3 17.2 35.8 32.4 30.8Dadra & Nagar Haveli 44.4 7.0 22.2 88.7 33.4 4.3Daman & Diu 62.2 43.9 28.9 35.1 8.9 21.6Delhi 36.4 23.1 59.1 74.0 4.5 1.9Goa 41.4 12.7 41.1 82.8 17.5 4.5Gujarat 41.9 48.1 26.4 36.8 31.7 15.0Haryana 53.5 27.8 33.0 67.0 13.5 5.2Himachal Pradesh 53.3 35.8 40.6 59.0 6.1 5.2Jammu & Kashmir 41.0 42.7 41.3 50.4 17.7 6.0Jharkhand 51.3 33.3 25.2 45.5 23.5 21.2Karnataka 41.5 30.1 32.6 53.4 25.9 16.6Kerala 50.9 36.1 31.9 46.6 17.2 17.3
Lakshadweep 69.6 39.7 26.1 59.5 4.3 0.9Madhya Pradesh 50.4 48.7 17.2 35.7 32.4 15.7Maharashtra 37.4 33.1 41.0 54.2 21.6 12.0Manipur 75.8 84.6 19.7 13.7 4.5 1.6
Meghalaya 27.7 43.6 58.8 48.5 13.5 8.4
Mizoram 61.6 72.3 23.3 25.7 15.1 2.0
Nagaland 34.3 64.6 62.9 35.4 2.8 0.0Odisha 46.0 58.1 21.2 27.1 32.8 14.8Puducherry 29.8 19.7 40.5 66.7 29.7 13.6Punjab 49.1 41.2 43.4 54.4 7.5 4.4Rajasthan 65.3 60.3 20.9 27.0 13.8 12.8Sikkim 11.4 46.5 74.3 53.5 14.3 0.0Tamil Nadu 39.4 39.8 40.7 41.8 19.9 18.4Tripura 12.8 20.4 72.3 66.4 14.9 13.3Uttar Pradesh 66.1 67.6 25.7 21.6 8.2 10.8Uttarakhand 66.1 53.5 25.7 43.0 8.2 4.7
West Bengal 43.6 46.0 40.1 40.2 16.3 13.2India 45.3 42.8 33.3 42.8 21.4 14.3
Note: In 1999-2000, the figures of Bihar, Madhya Pradesh and Uttar Pradesh are used for Jharkhand, Chhattisgarh and Uttarakhand respectively.
Source: National Sample Survey Organization, Employment and Unemployment, Report No.458 (1999-2000; 55th Round) and Report No. 554(2011-2012; 68th Round)

Urban Employment
69
Table 3.10: Unemployment Rate of Urban Persons, 1999-2000 and 2011-2012
(in percent)
States/UTs
1999-2000
2011-2012
1999-2000
2011-2012
1999-2000
2011-2012
1999-2000
2011-2012
Usual Status Usual Status (adjusted)
Current
Weekly Status
Current
Daily StatusAndaman & Nicobar Islands 8.8 11.4 6.9 8.6 8.4 10.7 9.7 11.3Andhra Pradesh 4.2 4.5 3.9 4.3 5.1 5.5 7.6 6.4Arunachal Pradesh 2.9 4.9 2.9 4.8 2.7 4.7 2.9 4.7Assam 11.3 5.7 9.7 5.6 10.4 5.7 11.9 6.0Bihar 7.9 6.6 7.4 5.6 8.3 6.7 9.3 7.4Chandigarh 5.8 6.5 4.8 6.4 8.1 7.0 8.1 7.0Chhattisgarh 3.8 5.6 3.5 4.3 5.6 7.8 7.0 8.9Dadra & Nagar Haveli 1.4 0.0 1.4 0.0 1.4 0.0 1.9 0.0Daman & Diu 3.1 0.5 3.0 0.5 3.1 0.5 3.1 0.6Delhi 3.5 3.6 3.3 3.5 3.4 4.0 4.1 4.3Goa 19.1 4.6 18.5 4.6 23.8 4.6 26.1 4.7Gujarat 2.2 0.9 2.0 0.8 2.8 0.9 4.2 1.6Haryana 2.9 4.2 2.7 4.2 3.8 4.3 4.5 4.4Himachal Pradesh 7.2 4.2 6.6 4.0 7.3 3.4 7.8 3.6Jammu & Kashmir 5.4 7.8 5.0 7.0 5.7 7.6 6.6 8.4Jharkhand 7.9 5.5 7.4 5.1 8.3 6.0 9.3 6.2Karnataka 3.4 3.4 3.3 2.9 4.0 3.4 5.4 4.1Kerala 12.5 7.8 10.2 6.1 13.8 8.5 19.1 12.3Lakshadweep 13.9 13.2 10.0 11.5 13.8 13.2 16.5 14.7Madhya Pradesh 3.8 2.8 3.5 2.6 5.6 3.6 7.0 4.6Maharashtra 6.4 2.4 5.8 2.3 6.8 3.0 8.1 3.7Manipur 8.1 7.6 6.7 7.1 6.7 7.2 6.9 7.4Meghalaya 4.6 2.8 4.6 2.8 4.6 3.0 4.6 3.3Mizoram 3.8 5.0 3.0 5.0 2.7 5.0 3.6 5.2Nagaland 9.7 27.5 9.1 23.8 9.6 24.9 10.0 26.4Odisha 7.1 3.7 6.7 3.5 8.0 4.7 9.5 5.8Puducherry 4.4 3.7 4.1 2.9 7.5 5.4 12.5 8.3Punjab 3.2 3.1 2.7 2.8 3.9 3.5 4.9 4.3Rajasthan 2.9 3.5 2.5 3.1 3.8 4.7 4.5 5.2Sikkim 7.6 2.3 7.5 2.3 7.5 2.3 7.5 2.3Tamil Nadu 4.4 3.0 4.0 2.7 5.2 4.1 8.9 6.8Tripura 5.9 25.4 5.8 25.2 6.2 25.4 6.2 27.6Uttar Pradesh 4.5 4.4 4.1 4.1 5.2 5.0 6.2 6.1Uttarakhand 4.5 5.6 4.1 5.3 5.2 5.7 6.2 7.1West Bengal 8.2 5.9 7.6 4.8 8.7 5.6 10.6 6.8India 5.2 3.8 4.7 3.4 5.9 4.4 7.7 5.5
Note: In 1999-2000, the figures of Bihar, Madhya Pradesh and Uttar Pradesh are used for Jharkhand, Chhattisgarh and Uttarakhand respectively.
Source: National Sample Survey Organization, Employment and Unemployment, Report No.458 (1999-2000; 55th Round) and Report No. 554(2011-2012; 68th Round).

Handbook of Urban Statistics
70
Gra
ph 3
.4: U
nem
ploy
men
t Ra
te o
f Urb
an P
erso
ns (U
sual
Sta
tus)
(%)
Sour
ce: N
ation
al S
ampl
e Su
rvey
Org
aniz
ation
, Em
ploy
men
t an
d U
nem
ploy
men
t, R
epor
t N
o.45
8 (1
999-
2000
; 55t
h Ro
und)
and
Rep
ort
No.
554
(20
11-
2012
; 68th
Rou
nd)

Urban Employment
71
Table 3.11: Unemployment Rate of Urban Males, 1999-2000 and 2011-2012
(in percent)
States/UTs
1999-2000
2011-2012
1999-2000
2011-2012
1999-2000
2011-2012
1999-2000
2011-2012
Usual Status Usual Status (adjusted)
Current Weekly Status Current Daily Status
Andaman & Nicobar Islands 3.8 5.7 3.0 4.0 3.8 5.0 5.1 5.1
Andhra Pradesh 4.2 4.0 4.0 3.9 4.8 4.7 7.2 5.4Arunachal Pradesh 1.4 3.6 1.4 3.6 2.4 3.6 2.2 3.7Assam 9.1 5.4 7.7 5.4 8.4 5.5 9.9 5.8Bihar 7.6 5.3 7.3 4.5 7.7 5.2 8.7 5.9Chandigarh 3.9 5.7 3.2 5.7 4.0 5.7 4.4 5.8Chhattisgarh 4.3 5.1 4.1 4.1 6.0 8.0 7.2 9.3Dadra & Nagar Haveli 1.6 0.0 1.6 0.0 1.6 0.0 2.1 0.0Daman & Diu 1.4 0.0 1.4 0.0 1.4 0.0 1.5 0.0Delhi 3.2 3.4 3.2 3.3 3.4 4.0 4.0 4.2Goa 15.3 2.9 14.7 2.9 18.9 2.9 21.4 3.1Gujarat 2.1 0.7 2.0 0.6 2.7 0.8 4.0 1.4Haryana 2.7 4.0 2.7 4.0 3.8 4.0 4.5 4.1Himachal Pradesh 6.3 2.1 6.2 1.9 6.7 2.1 7.0 2.3Jammu & Kashmir 4.7 4.7 4.5 4.1 5.1 4.5 6.0 5.3Jharkhand 7.6 4.9 7.3 4.6 7.7 5.6 8.7 5.7Karnataka 3.0 3.0 3.0 2.4 3.8 3.0 5.3 3.7Kerala 6.9 3.3 5.6 2.7 9.7 4.7 15.5 8.7Lakshadweep 8.2 6.7 6.5 5.3 10.0 6.8 13.1 8.3Madhya Pradesh 4.3 2.4 4.1 2.4 6.0 3.4 7.2 4.5Maharashtra 6.1 1.9 5.6 1.8 6.5 2.3 7.7 3.0Manipur 7.4 5.8 6.9 5.6 6.6 5.8 6.6 5.8Meghalaya 3.4 2.4 3.4 2.4 3.4 2.4 3.5 2.7Mizoram 4.4 4.0 3.4 4.0 2.9 4.0 3.8 4.2Nagaland 9.3 21.9 9.3 19.1 9.7 19.8 9.8 20.5Odisha 7.2 4.0 7.0 3.9 8.2 5.1 9.8 6.4Puducherry 3.5 3.3 3.3 2.7 7.1 5.6 13.1 9.0Punjab 3.1 2.8 2.8 2.6 3.9 3.4 4.8 4.3Rajasthan 2.7 3.5 2.6 3.2 4.0 5.0 4.7 5.4Sikkim 6.7 3.2 6.7 3.2 5.9 3.2 6.4 3.1Tamil Nadu 3.9 2.3 3.6 2.1 4.9 3.4 9.0 6.3Tripura 5.5 11.5 5.4 11.5 5.7 11.5 5.7 14.2Uttar Pradesh 4.5 4.3 4.3 4.2 5.3 5.1 6.3 6.2Uttarakhand 4.5 2.6 4.3 2.5 5.3 3.1 6.3 4.3West Bengal 7.7 5.1 7.2 4.3 8.2 5.1 10.0 6.4India 4.8 3.2 4.5 3.0 5.6 3.8 7.3 4.9
Note: In 1999-2000, the figures of Bihar, Madhya Pradesh and Uttar Pradesh are used for Jharkhand, Chhattisgarh and Uttarakhand respectively.
Source: National Sample Survey Organization, Employment and Unemployment, Report No.458 (1999-2000; 55th Round) and Report No. 554(2011-2012; 68th Round)

Handbook of Urban Statistics
72
Gra
ph 3
.5:
Une
mpl
oym
ent R
ate
of U
rban
Mal
es (U
sual
Sta
tus)
(%)
Sour
ce:
Nati
onal
Sam
ple
Surv
ey O
rgan
izati
on, E
mpl
oym
ent
and
Une
mpl
oym
ent,
Rep
ort
No.
458
(199
9-20
00;
55th
Rou
nd)
and
Repo
rt N
o. 5
54(2
011-
2012
; 68t
h Ro
und)

Urban Employment
73
Table 3.12: Unemployment Rate of Urban Females, 1999-2000 and 2011-2012
(in percent)
States/UTs
1999-2000
2011-2012
1999-2000
2011-2012
1999-2000
2011-2012
1999-2000
2011-2012
Usual Status Usual Status (adjusted)
Current
Weekly StatusCurrent Daily Status
Andaman & Nicobar Islands 23.9 26.2 17.3 19.7 20.7 25.2 24.0 26.5Andhra Pradesh 4.2 6.3 3.7 5.4 6.0 8.5 8.9 9.7Arunachal Pradesh 10.0 9.2 10.0 8.7 9.1 8.0 6.5 8.6Assam 22.3 7.5 18.9 7.0 19.7 7.1 21.9 7.3Bihar 9.4 25.0 8.1 16.5 11.8 22.8 13.5 27.1Chandigarh 14.4 11.0 10.9 10.4 23.8 13.8 22.9 13.0Chhattisgarh 1.6 7.0 1.4 4.7 3.8 7.2 5.7 8.1Dadra & Nagar Haveli 0.0 0.0 0.0 0.0 0.0 0.0 0.0 0.0Daman & Diu 8.3 2.4 8.0 2.2 8.3 2.2 8.2 2.8Delhi 5.3 4.8 3.9 4.6 3.9 4.6 4.2 4.6Goa 35.2 9.8 33.3 9.7 42.1 9.7 44.2 10.1Gujarat 2.6 1.9 2.0 1.7 3.4 1.4 5.4 2.4Haryana 4.6 5.6 2.8 5.0 3.9 5.9 4.9 6.3Himachal Pradesh 11.8 11.0 7.9 9.9 9.9 7.4 11.9 7.7Jammu & Kashmir 12.8 25.6 8.9 19.0 11.4 21.8 13.4 24.2Jharkhand 9.4 10.9 8.1 8.9 11.8 9.3 13.5 10.3Karnataka 4.7 5.1 4.4 4.4 4.7 5.1 5.9 5.6Kerala 26.4 19.2 20.0 13.9 23.5 17.9 28.2 21.3Lakshadweep 26.3 41.2 17.9 35.0 25.0 41.2 26.9 43.4Madhya Pradesh 1.6 4.5 1.4 3.5 3.8 4.6 5.7 4.9Maharashtra 7.8 4.3 6.6 3.8 8.1 5.7 10.0 6.6Manipur 10.3 12.9 6.2 10.8 6.8 10.8 7.6 11.9Meghalaya 6.8 3.7 6.8 3.7 6.8 4.4 6.9 4.6Mizoram 2.6 6.8 2.4 6.7 2.4 6.7 3.1 6.9Nagaland 10.8 46.3 8.7 36.0 9.8 39.2 10.4 45.1Odisha 6.7 2.3 5.3 2.0 7.3 2.8 8.2 2.8Puducherry 6.9 5.4 6.4 3.7 8.6 4.5 10.4 5.4Punjab 3.5 5.1 2.1 3.6 4.3 4.1 5.3 4.8Rajasthan 3.7 3.7 2.1 2.5 2.7 3.4 3.5 4.2Sikkim 10.0 0.0 10.0 0.0 12.5 0.0 10.7 0.2Tamil Nadu 5.8 5.1 5.1 4.5 6.0 6.1 8.6 8.5Tripura 8.8 57.9 8.5 56.4 8.9 57.8 9.6 58.6Uttar Pradesh 4.6 5.2 3.3 3.7 4.2 4.5 5.0 5.5Uttarakhand 4.6 25.3 3.3 20.0 4.2 19.3 5.0 24.3West Bengal 11.1 9.8 9.5 6.4 11.5 7.6 13.9 8.8India 7.1 6.6 5.7 5.2 7.3 6.7 9.4 8.0
Note: In 1999-2000, the figures of Bihar, Madhya Pradesh and Uttar Pradesh are used for Jharkhand, Chhattisgarh and Uttarakhand respectively
Source: National Sample Survey Organization, Employment and Unemployment, Report No.458 (1999-2000; 55th Round) and Report No. 554(2011-2012; 68th Round).

Handbook of Urban Statistics
74
Gra
ph 3
.6: U
nem
ploy
men
t Ra
te o
f Urb
an F
emal
es (U
sual
Sta
tus)
(%)
Sour
ce: N
ation
al S
ampl
e Su
rvey
Org
aniz
ation
, Em
ploy
men
t and
Une
mpl
oym
ent,
Rep
ort N
o.45
8 (1
999-
2000
; 55th
Rou
nd) a
nd R
epor
t No.
554
(201
1-20
12;
68th
Rou
nd)

Urban Employment
75
Tabl
e 3.
13: N
ation
al In
dust
rial
Cla
ssifi
cati
on o
f Urb
an W
orke
rs (p
rinc
ipal
and
sub
sidi
ary)
, 201
1-20
12(in
per
cent
)
Stat
es/U
TsA
BC
DE
FG
HI
JK
LM
NO
PQ
RS
TU
Tota
l
And
aman
& N
icob
ar Is
land
s3.
90.
07.
32.
00.
916
.215
.911
.22.
90.
70.
90.
00.
61.
521
.87.
23.
70.
31.
51.
50.
010
0.0
And
hra
Prad
esh
4.9
1.3
16.4
0.7
0.1
12.1
19.0
10.6
3.0
3.3
2.5
0.8
1.6
2.0
6.0
6.7
2.0
0.5
4.0
2.5
0.0
100.
0
Aru
nach
al P
rade
sh14
.70.
02.
30.
00.
212
.515
.11.
51.
20.
40.
70.
02.
53.
530
.47.
42.
30.
13.
12.
20.
010
0.0
Ass
am4.
44.
09.
50.
10.
38.
030
.66.
93.
20.
92.
70.
11.
21.
38.
65.
60.
71.
37.
23.
70.
010
0.0
Biha
r9.
40.
115
.20.
20.
08.
428
.76.
15.
30.
92.
10.
11.
44.
44.
96.
31.
60.
04.
90.
10.
010
0.0
Chan
diga
rh0.
60.
014
.10.
01.
28.
226
.06.
06.
41.
32.
70.
61.
88.
114
.33.
54.
10.
00.
01.
10.
010
0.0
Chha
ttisg
arh
14.9
2.2
11.9
1.6
0.4
18.8
17.0
4.5
4.5
1.1
1.8
0.1
0.9
0.6
2.6
7.9
3.2
0.2
4.4
1.6
0.0
100.
0
Dad
ra &
Nag
ar H
avel
i5.
70.
055
.30.
00.
05.
35.
39.
32.
91.
40.
00.
30.
00.
01.
66.
02.
10.
03.
31.
60.
010
0.0
Dam
an &
Diu
11.0
0.0
13.7
0.0
1.4
3.8
16.1
13.4
6.1
0.0
3.3
0.0
0.3
0.0
8.8
11.2
3.6
2.6
2.1
2.7
0.0
100.
0
Del
hi0.
00.
021
.60.
10.
84.
424
.58.
24.
13.
32.
81.
53.
73.
77.
94.
72.
91.
02.
42.
40.
110
0.0
Goa
3.1
5.7
8.9
2.3
2.1
6.1
20.4
5.9
11.3
1.2
5.4
0.3
2.7
3.6
6.9
6.9
3.4
1.0
2.0
1.2
0.0
100.
0
Guj
arat
4.3
0.6
39.4
0.4
3.4
5.6
18.9
5.5
4.3
1.1
1.7
0.2
1.4
1.4
3.5
2.8
2.3
0.1
2.2
1.0
0.0
100.
0
Har
yana
6.2
0.0
22.2
1.0
0.4
10.7
18.8
6.3
1.8
5.0
2.8
1.4
2.2
0.6
5.6
8.0
3.6
0.0
2.5
0.9
0.0
100.
0
Him
acha
l Pra
desh
8.4
0.3
33.3
0.8
0.4
5.8
11.4
1.9
4.3
1.0
2.9
0.0
3.1
4.0
7.1
8.5
1.6
0.0
4.9
0.2
0.0
100.
0
Jam
mu
& K
ashm
ir8.
80.
116
.00.
61.
114
.221
.86.
12.
31.
81.
60.
20.
41.
18.
58.
53.
00.
32.
90.
60.
010
0.0
Jhar
khan
d3.
77.
410
.50.
30.
314
.325
.99.
62.
70.
72.
30.
62.
52.
84.
85.
11.
20.
13.
41.
90.
010
0.0
Karn
atak
a7.
80.
318
.40.
60.
39.
718
.16.
36.
47.
52.
10.
82.
62.
82.
66.
62.
10.
51.
82.
80.
010
0.0
Kera
la8.
70.
316
.40.
70.
114
.018
.88.
24.
32.
53.
20.
91.
61.
43.
75.
13.
81.
03.
32.
20.
010
0.0
Laks
hadw
eep
36.4
0.4
4.2
1.3
1.4
13.4
5.3
5.9
2.1
0.9
0.0
0.0
1.0
1.2
10.6
10.8
2.6
1.8
0.7
0.0
0.0
100.
0
Mad
hya
Prad
esh
11.1
0.8
15.7
0.5
0.5
11.9
23.4
7.7
2.3
1.4
2.4
0.1
0.9
1.1
5.9
6.8
1.7
0.5
4.8
0.6
0.0
100.
0
Mah
aras
htra
4.5
0.2
22.2
0.6
0.4
8.1
18.0
9.5
3.4
3.2
4.1
0.6
1.7
2.1
3.9
5.3
2.2
0.7
4.7
4.5
0.0
100.
0
Man
ipur
20.0
0.0
18.1
0.2
0.1
9.7
19.5
6.2
2.8
0.6
0.7
0.0
0.4
0.7
11.8
6.2
0.8
0.4
1.5
0.6
0.0
100.
0
Meg
hala
ya4.
81.
13.
50.
10.
011
.027
.35.
23.
20.
52.
80.
00.
20.
225
.18.
41.
40.
03.
12.
20.
010
0.0
Miz
oram
26.8
0.3
2.8
0.3
0.3
7.8
21.2
4.3
0.6
0.3
0.3
0.0
0.1
0.9
21.4
10.2
1.4
0.1
0.9
0.2
0.0
100.
0

Handbook of Urban Statistics
76
Stat
es/U
TsA
BC
DE
FG
HI
JK
LM
NO
PQ
RS
TU
Tota
l
Nag
alan
d17
.80.
05.
33.
80.
35.
117
.34.
62.
20.
00.
00.
00.
01.
127
.712
.91.
30.
00.
20.
30.
010
0.0
Odi
sha
14.1
0.8
10.6
1.1
0.6
10.0
22.1
9.3
4.6
2.7
2.8
0.2
1.0
0.2
5.8
6.5
1.5
1.8
3.6
0.8
0.0
100.
0
Pudu
cher
ry6.
50.
517
.40.
20.
515
.718
.15.
63.
82.
73.
91.
11.
50.
65.
65.
64.
10.
24.
32.
20.
010
0.0
Punj
ab5.
70.
027
.81.
31.
07.
319
.07.
12.
91.
32.
21.
01.
30.
63.
27.
33.
70.
56.
00.
70.
010
0.0
Raja
stha
n6.
81.
025
.01.
50.
514
.418
.26.
03.
01.
11.
90.
71.
91.
72.
96.
71.
60.
24.
20.
70.
010
0.0
Sikk
im1.
50.
18.
71.
33.
96.
521
.78.
08.
94.
00.
70.
00.
14.
518
.95.
91.
10.
92.
90.
70.
010
0.0
Tam
il N
adu
10.5
0.7
28.1
0.7
0.2
8.3
16.7
6.9
4.8
3.2
2.7
0.8
0.9
1.8
1.9
4.0
1.4
0.4
3.4
2.4
0.0
100.
0
Trip
ura
3.3
0.5
6.8
0.0
0.0
16.1
20.9
10.2
1.8
1.0
2.7
0.5
1.1
0.6
12.4
10.2
4.5
0.1
2.9
4.3
0.0
100.
0
Utt
ar P
rade
sh8.
90.
828
.80.
50.
99.
921
.04.
93.
30.
81.
20.
11.
51.
53.
53.
52.
30.
65.
50.
80.
010
0.0
Utt
arak
hand
4.8
0.1
18.2
0.8
0.3
11.9
28.1
7.8
5.7
0.2
1.3
0.2
0.6
1.4
4.3
7.7
2.4
0.3
3.3
0.7
0.0
100.
0
Wes
t Ben
gal
2.4
0.9
31.4
0.4
0.6
6.2
18.7
7.9
3.0
1.8
2.5
0.3
1.7
2.0
2.7
6.9
2.1
0.4
2.9
5.4
0.0
100.
0
Indi
a6.
70.
823
.60.
60.
79.
319
.67.
43.
82.
52.
50.
61.
61.
94.
15.
52.
20.
53.
82.
30.
010
0.0
A: A
gric
ultu
re, f
ores
try
and
fishi
ng
B: M
inin
g an
d qu
arry
ing
C: M
anuf
actu
ring
D
: Ele
ctri
city
, gas
, ste
am a
nd a
ir c
ondi
tioni
ng s
uppl
y
E: W
ater
sup
ply;
sew
erag
e, w
aste
man
agem
ent a
nd re
med
iatio
n ac
tiviti
es
F: C
onst
ructi
on
G: W
hole
sale
and
reta
il tr
ade;
repa
ir o
f mot
or v
ehic
les
and
mot
orcy
cles
H
: Tra
nspo
rtati
on a
nd s
tora
ge
I: A
ccom
mod
ation
and
Foo
d se
rvic
e ac
tiviti
es
J: In
form
ation
and
com
mun
icati
on
K: F
inan
cial
and
insu
ranc
e ac
tiviti
es
L: R
eal e
stat
e ac
tiviti
es
M: P
rofe
ssio
nal,
scie
ntific
and
tech
nica
l acti
vitie
s N
: Adm
inis
trati
ve a
nd s
uppo
rt s
ervi
ce a
ctivi
ties
O: P
ublic
adm
inis
trati
on a
nd d
efen
ce; c
ompu
lsor
y so
cial
sec
urity
P:
Edu
catio
n
Q: H
uman
hea
lth a
nd s
ocia
l wor
k ac
tiviti
es
R: A
rts,
ent
erta
inm
ent a
nd re
crea
tion
S: O
ther
ser
vice
acti
vitie
s T:
Acti
vitie
s of
hou
seho
lds
as e
mpl
oyer
s; u
ndiff
eren
tiate
d go
ods
and
U: A
ctivi
ties
of e
xtra
terr
itori
al o
rgan
izati
ons
and
bodi
es
serv
ices
pro
duci
ng a
ctivi
ties
of h
ouse
hold
s fo
r ow
n us
e
Not
e: N
ation
al In
dust
rial
Cla
ssifi
catio
n of
wor
kers
is b
ased
on
NIC
200
8.
Sour
ce: N
ation
al S
ampl
e Su
rvey
Org
aniz
ation
, Em
ploy
men
t and
Une
mpl
oym
ent,
Rep
ort N
o. 5
54(2
011-
2012
; 68t
h Ro
und)

Urban Employment
77
Gra
ph 3
.7: N
ation
al In
dust
rial
Cla
ssifi
cati
on o
f Urb
an W
orke
rs (p
rinc
ipal
and
sub
sidi
ary)
, 201
1-12
(%)
Sour
ce: N
ation
al S
ampl
e Su
rvey
Org
aniz
ation
, Em
ploy
men
t and
Une
mpl
oym
ent,
Rep
ort N
o. 5
54(2
011-
2012
; 68t
h Ro
und)
AB
C D
E
F
G
H
I
JKLM
N
O
P
QR
ST
U
A:
Agriculture
,fo
restr
yand
fishin
gB
:M
inin
gand
quarr
yin
g
C:
Manufa
ctu
ring
D:
Ele
ctr
icity,
gas,ste
am
and
air
conditio
nin
gsupply
E:
Wate
rsupply
;sew
era
ge,w
aste
managem
entand
rem
edia
tion
activitie
sF
:C
onstr
uction
G:
Whole
sale
and
reta
iltr
ade;re
pair
ofm
oto
rvehic
les
and
moto
rcycle
sH
:T
ransport
ation
and
sto
rage
I:A
ccom
modation
and
Food
serv
ice
activitie
sJ:
Info
rmation
and
com
munic
ation
K:
Fin
ancia
land
insura
nce
activitie
sL:
Realesta
teactivitie
s
M:
Pro
fessio
nal,
scie
ntific
and
technic
alactivitie
sN
:A
dm
inis
trative
and
support
serv
ice
activitie
s
O:
Public
adm
inis
tration
and
defe
nce;com
puls
ory
socia
lsecurity
P:
Education
Q:
Hum
an
health
and
socia
lw
ork
activitie
sR
:A
rts,ente
rtain
mentand
recre
ation
S:
Oth
er
serv
ice
activitie
sT:
Activitie
sofhousehold
sas
em
plo
yers
;undiffe
rentiate
d
and
serv
ices
pro
ducin
gactivitie
sofhousehold
sfo
row
nuse
goods
U:
Activitie
sofextr
ate
rritorialorg
aniz
ations
and
bodie
s

Handbook of Urban Statistics
78
Tabl
e 3.
14: N
ation
al In
dust
rial
Cla
ssifi
cati
on o
f Urb
an M
ale
Wor
kers
(pri
ncip
al a
nd s
ubsi
diar
y), 2
011-
2012
(in p
erce
nt)
Stat
es/U
Ts
AB
CD
EF
GH
IJ
KL
MN
OP
QR
ST
UTo
tal
And
aman
& N
icob
ar Is
land
s5.
30.
06.
52.
51.
218
.016
.814
.12.
90.
50.
80.
00.
81.
122
.03.
82.
40.
01.
50.
00.
010
0
And
hra
Prad
esh
3.9
1.6
13.2
0.8
0.1
14.1
19.6
13.5
2.6
3.8
2.8
1.0
2.0
2.3
6.5
5.5
2.0
0.6
3.4
0.9
0.0
100
Aru
nach
al P
rade
sh10
.40.
02.
80.
00.
213
.215
.41.
91.
30.
40.
90.
03.
03.
532
.28.
11.
70.
03.
41.
60.
010
0
Ass
am4.
04.
59.
20.
20.
39.
032
.77.
93.
61.
01.
70.
11.
31.
29.
03.
50.
41.
46.
82.
40.
010
0
Biha
r8.
30.
114
.80.
20.
08.
729
.86.
65.
60.
92.
30.
11.
54.
75.
05.
11.
70.
04.
60.
10.
010
0
Chan
diga
rh0.
70.
014
.30.
00.
99.
826
.76.
57.
51.
52.
70.
81.
58.
214
.61.
82.
50.
00.
00.
10.
010
0
Chha
ttisg
arh
11.8
3.0
12.6
2.1
0.5
18.1
21.7
6.2
5.1
1.4
2.6
0.2
1.2
0.9
3.3
4.9
2.6
0.3
1.3
0.4
0.0
100
Dad
ra &
Nag
ar H
avel
i5.
80.
061
.90.
00.
04.
75.
010
.83.
41.
70.
00.
40.
00.
01.
90.
50.
50.
03.
50.
00.
010
0
Dam
an &
Diu
13.1
0.0
11.4
0.0
1.1
5.0
14.4
16.7
7.9
0.0
4.3
0.0
0.4
0.0
8.0
10.6
1.3
3.3
2.7
0.0
0.0
100
Del
hi0.
00.
023
.50.
10.
95.
025
.39.
04.
83.
22.
81.
73.
23.
78.
01.
92.
21.
12.
31.
40.
010
0
Goa
3.4
6.9
10.8
3.0
2.5
5.7
23.4
7.4
13.5
1.1
3.5
0.4
1.3
2.2
6.0
3.7
2.0
0.7
1.6
1.0
0.0
100
Guj
arat
3.4
0.5
39.5
0.4
4.0
6.2
20.8
6.5
4.5
1.1
1.7
0.3
1.4
1.5
3.7
1.9
1.0
0.1
1.4
0.1
0.0
100
Har
yana
5.2
0.0
24.5
0.9
0.4
12.2
21.2
7.3
1.9
4.5
2.9
1.7
2.6
0.6
5.9
3.6
3.0
0.0
1.5
0.3
0.0
100
Him
acha
l Pra
desh
4.9
0.4
32.7
1.0
0.5
7.0
13.0
2.6
5.2
1.3
3.6
0.0
3.5
5.2
7.3
5.4
0.4
0.0
5.8
0.2
0.0
100
Jam
mu
& K
ashm
ir5.
20.
116
.40.
61.
315
.625
.67.
22.
72.
01.
60.
20.
41.
48.
45.
22.
40.
42.
80.
50.
010
0
Jhar
khan
d3.
17.
510
.10.
30.
315
.328
.010
.42.
90.
81.
90.
72.
83.
15.
23.
70.
90.
12.
60.
50.
010
0
Karn
atak
a7.
70.
315
.80.
70.
311
.521
.18.
05.
87.
62.
11.
02.
63.
52.
84.
71.
20.
51.
80.
90.
010
0
Kera
la8.
20.
313
.80.
70.
218
.020
.810
.84.
82.
33.
11.
21.
71.
53.
62.
01.
91.
03.
60.
60.
010
0
Laks
hadw
eep
37.3
0.0
3.2
1.0
1.6
15.9
6.3
6.6
2.5
1.1
0.0
0.0
1.2
1.5
10.4
8.2
0.4
2.1
0.8
0.0
0.0
100
Mad
hya
Prad
esh
9.9
0.9
14.5
0.6
0.4
13.2
25.4
9.1
2.5
1.5
2.5
0.1
1.1
1.2
6.5
4.8
1.4
0.6
3.8
0.1
0.0
100
Mah
aras
htra
3.3
0.2
21.6
0.7
0.3
9.2
21.0
12.0
3.8
3.4
4.0
0.7
1.7
2.3
4.4
3.6
1.5
0.9
3.8
1.5
0.0
100
Man
ipur
23.2
0.0
8.2
0.2
0.1
13.2
17.4
8.5
2.3
0.8
0.9
0.0
0.6
1.0
14.0
6.0
0.7
0.5
1.6
0.7
0.0
100
Meg
hala
ya3.
51.
52.
20.
20.
015
.524
.67.
43.
10.
82.
40.
00.
30.
327
.45.
90.
80.
01.
42.
80.
010
0
Miz
oram
22.1
0.4
2.8
0.5
0.3
11.1
14.5
6.5
0.1
0.3
0.4
0.0
0.2
1.0
26.6
10.6
1.0
0.1
1.4
0.2
0.0
100
Nag
alan
d13
.40.
03.
43.
70.
36.
716
.16.
02.
80.
00.
00.
00.
01.
531
.912
.90.
80.
00.
30.
30.
010
0
Odi
sha
12.1
1.0
9.3
1.3
0.7
9.9
23.3
11.2
4.4
3.4
3.3
0.3
1.1
0.3
6.9
4.6
0.9
2.2
3.4
0.5
0.0
100
Pudu
cher
ry6.
90.
615
.50.
20.
517
.120
.16.
84.
52.
65.
01.
31.
60.
46.
42.
63.
40.
34.
10.
10.
010
0
Punj
ab4.
40.
028
.81.
41.
18.
722
.28.
53.
51.
62.
51.
21.
60.
73.
02.
62.
80.
44.
50.
50.
010
0
Raja
stha
n3.
81.
323
.01.
80.
415
.921
.17.
43.
41.
32.
00.
82.
31.
93.
15.
21.
30.
23.
70.
10.
010
0
Sikk
im1.
00.
19.
91.
74.
09.
017
.58.
97.
85.
41.
00.
00.
26.
217
.76.
01.
11.
31.
30.
00.
010
0

Urban Employment
79
Stat
es/U
Ts
AB
CD
EF
GH
IJ
KL
MN
OP
QR
ST
UTo
tal
Tam
il N
adu
9.2
0.8
25.1
0.6
0.0
10.2
18.9
9.2
5.5
3.5
2.9
1.0
1.2
2.1
2.1
2.1
0.9
0.4
3.5
0.9
0.0
100
Trip
ura
3.1
0.6
6.0
0.0
0.0
17.8
24.3
12.4
1.8
1.3
2.0
0.3
1.4
0.7
11.5
9.1
3.7
0.2
3.1
0.9
0.0
100
Utt
ar P
rade
sh8.
00.
925
.60.
50.
711
.223
.55.
73.
70.
81.
40.
11.
81.
53.
92.
42.
00.
75.
20.
50.
010
0
Utt
arak
hand
4.3
0.1
17.2
0.8
0.2
13.7
30.9
8.5
5.6
0.2
1.5
0.2
0.7
1.5
4.4
4.7
1.8
0.3
3.1
0.3
0.0
100
Wes
t Ben
gal
2.6
1.1
31.0
0.5
0.5
7.6
21.2
9.7
3.4
2.0
2.6
0.3
1.9
2.1
2.9
4.0
1.5
0.3
2.8
2.1
0.0
100
Indi
a5.
60.
922
.30.
70.
710
.722.0
9.1
4.0
2.6
2.5
0.7
1.8
2.1
4.5
3.6
1.6
0.6
3.3
0.9
0.0
100
A: A
gric
ultu
re, f
ores
try
and
fishi
ng
B: M
inin
g an
d qu
arry
ing
C: M
anuf
actu
ring
D
: Ele
ctri
city
, gas
, ste
am a
nd a
ir c
ondi
tioni
ng s
uppl
y
E: W
ater
sup
ply;
sew
erag
e, w
aste
man
agem
ent a
nd re
med
iatio
n ac
tiviti
es
F: C
onst
ructi
on
G: W
hole
sale
and
reta
il tr
ade;
repa
ir o
f mot
or v
ehic
les
and
mot
orcy
cles
H
: Tra
nspo
rtati
on a
nd s
tora
ge
I: A
ccom
mod
ation
and
Foo
d se
rvic
e ac
tiviti
es
J:
Info
rmati
on a
nd c
omm
unic
ation
K: F
inan
cial
and
insu
ranc
e ac
tiviti
es
L: R
eal e
stat
e ac
tiviti
es
M: P
rofe
ssio
nal,
scie
ntific
and
tech
nica
l acti
vitie
s
N: A
dmin
istr
ative
and
sup
port
ser
vice
acti
vitie
s
O: P
ublic
adm
inis
trati
on a
nd d
efen
ce; c
ompu
lsor
y so
cial
sec
urity
P: E
duca
tion
Q: H
uman
hea
lth a
nd s
ocia
l wor
k ac
tiviti
es
R: A
rts,
ent
erta
inm
ent a
nd re
crea
tion
S: O
ther
ser
vice
acti
vitie
s
T:
Acti
vitie
s of
hou
seho
lds
as e
mpl
oyer
s; u
ndiff
eren
tiate
d go
ods
and
U: A
ctivi
ties
of e
xtra
terr
itori
al o
rgan
izati
ons
and
bodi
es
serv
ices
pro
duci
ng a
ctivi
ties
of h
ouse
hold
s fo
r ow
n us
e
Not
e: N
ation
al In
dust
rial
Cla
ssifi
catio
n of
wor
kers
is b
ased
on
NIC
200
8.So
urce
: Nati
onal
Sam
ple
Surv
ey O
rgan
izati
on, E
mpl
oym
ent a
nd U
nem
ploy
men
t, R
epor
t No.
554
(201
1-20
12; 6
8th
Roun
d)

Handbook of Urban Statistics
80
Tabl
e 3.
15: N
ation
al In
dust
rial
Cla
ssifi
cati
on o
f Urb
an F
emal
e W
orke
rs (p
rinc
ipal
and
sub
sidi
ary)
, 201
1-20
12
(in p
erce
nt)
Sta
tes/
UTs
AB
CD
EF
GH
IJ
KL
MN
OP
QR
ST
UTo
tal
And
aman
& N
icob
ar Is
land
s0.
00.
09.
70.
60.
011
.113
.22.
82.
81.
31.
30.
00.
02.
621
.317
.27.
71.
31.
35.
90.
010
0.0
And
hra
Prad
esh
8.4
0.6
27.1
0.2
0.4
5.5
16.8
0.9
4.2
1.5
1.6
0.0
0.4
0.9
4.4
10.9
2.4
0.2
6.0
7.8
0.0
100.
0
Aru
nach
al P
rade
sh32
.40.
00.
50.
00.
09.
314
.10.
00.
60.
00.
00.
00.
33.
722
.94.
34.
80.
51.
84.
70.
010
0.0
Ass
am7.
40.
511
.20.
00.
00.
916
.50.
00.
60.
09.
30.
00.
12.
06.
220
.22.
80.
09.
612
.80.
010
0.0
Biha
r22
.10.
019
.90.
00.
04.
216
.30.
01.
80.
00.
00.
00.
71.
83.
320
.10.
90.
08.
20.
80.
010
0.0
Chan
diga
rh0.
00.
013
.10.
03.
10.
022
.23.
00.
00.
02.
60.
03.
27.
512
.912
.913
.30.
00.
06.
30.
010
0.0
Chha
ttisg
arh
22.3
0.4
10.0
0.2
0.0
20.2
6.1
0.6
2.9
0.5
0.0
0.1
0.0
0.0
0.9
14.9
4.6
0.0
11.7
4.5
0.0
100.
0
Dad
ra &
Nag
ar H
avel
i4.
60.
015
.30.
00.
08.
57.
70.
00.
00.
00.
00.
00.
00.
00.
039
.111
.70.
01.
911
.30.
010
0.0
Dam
an &
Diu
3.6
0.0
21.7
0.0
2.5
0.0
21.9
2.1
0.0
0.0
0.0
0.0
0.0
0.0
11.4
13.2
11.6
0.0
0.0
12.0
0.0
100.
0
Del
hi0.
00.
010
.10.
00.
00.
619
.03.
20.
04.
23.
20.
07.
14.
16.
821
.77.
50.
52.
98.
70.
410
0.0
Goa
2.1
1.5
2.3
0.0
0.6
7.1
10.0
0.8
4.1
1.5
12.0
0.0
7.3
8.2
9.8
17.6
8.1
2.0
3.0
2.1
0.0
100.
0
Guj
arat
8.8
0.7
38.7
0.1
0.3
2.5
9.1
0.4
3.5
1.0
1.9
0.0
1.1
1.0
2.5
7.9
9.0
0.0
6.0
5.3
0.0
100.
0
Har
yana
12.7
0.0
8.2
1.5
0.2
2.1
4.4
0.0
1.2
7.9
2.6
0.0
0.0
0.6
4.3
34.0
7.4
0.0
8.5
4.6
0.0
100.
0
Him
acha
l Pra
desh
19.3
0.0
35.1
0.5
0.0
2.3
6.3
0.0
1.5
0.1
0.8
0.0
1.7
0.0
6.6
18.3
5.2
0.0
2.2
0.2
0.0
100.
0
Jam
mu
& K
ashm
ir26
.50.
013
.80.
50.
37.
03.
10.
40.
00.
61.
60.
00.
30.
19.
225
.36.
40.
03.
81.
10.
010
0.0
Jhar
khan
d8.
67.
014
.00.
00.
25.
69.
63.
01.
10.
05.
60.
00.
00.
31.
616
.33.
80.
09.
513
.70.
010
0.0
Karn
atak
a8.
10.
228
.20.
20.
02.
66.
80.
28.
77.
22.
20.
02.
60.
21.
713
.55.
10.
62.
19.
70.
010
0.0
Kera
la10
.10.
222
.91.
00.
13.
513
.51.
32.
82.
93.
20.
01.
30.
94.
013
.28.
81.
22.
76.
40.
010
0.0
Laks
hadw
eep
31.9
2.7
9.8
2.4
0.0
0.0
0.0
2.0
0.0
0.0
0.0
0.0
0.0
0.0
11.4
24.9
14.8
0.0
0.0
0.0
0.0
100.
0
Mad
hya
Prad
esh
17.2
0.1
21.3
0.0
1.2
5.4
13.9
1.0
1.2
1.1
2.0
0.0
0.1
0.4
2.9
16.3
3.3
0.1
9.5
3.0
0.0
100.
0
Mah
aras
htra
8.9
0.1
24.2
0.5
0.7
4.0
7.3
0.7
1.9
2.5
4.2
0.5
2.0
1.4
2.1
11.3
4.7
0.0
8.1
15.0
0.0
100.
0
Man
ipur
11.6
0.0
44.2
0.0
0.0
0.3
24.8
0.0
4.1
0.0
0.0
0.0
0.0
0.0
6.1
6.7
1.0
0.1
1.0
0.2
0.0
100.
0
Meg
hala
ya7.
40.
46.
20.
00.
01.
532
.90.
43.
30.
03.
80.
00.
00.
020
.213
.72.
80.
06.
60.
90.
010
0.0
Miz
oram
35.8
0.0
2.7
0.0
0.5
1.6
34.0
0.0
1.3
0.2
0.0
0.0
0.0
0.7
11.3
9.4
2.2
0.0
0.0
0.2
0.0
100.
0
Nag
alan
d32
.00.
011
.54.
00.
30.
021
.50.
00.
50.
00.
00.
00.
00.
013
.913
.03.
00.
00.
00.
30.
010
0.0
Odi
sha
22.7
0.0
16.4
0.2
0.1
10.4
16.7
1.3
5.3
0.0
0.9
0.0
0.4
0.0
0.9
14.4
4.2
0.0
4.3
1.9
0.0
100.
0
Pudu
cher
ry5.
00.
024
.80.
00.
310
.210
.31.
11.
03.
00.
30.
01.
11.
62.
616
.56.
90.
05.
110
.20.
010
0.0
Punj
ab11
.90.
023
.10.
70.
40.
83.
90.
40.
40.
10.
80.
00.
00.
34.
029
.87.
90.
613
.01.
80.
010
0.0
Raja
stha
n18
.70.
032
.80.
40.
68.
66.
90.
41.
30.
31.
60.
00.
60.
82.
012
.82.
50.
26.
23.
20.
010
0.0
Sikk
im2.
60.
05.
70.
23.
70.
032
.55.
511
.60.
30.
00.
00.
00.
021
.85.
61.
00.
06.
92.
50.
010
0.0

Urban Employment
81
Sta
tes/
UTs
AB
CD
EF
GH
IJ
KL
MN
OP
QR
ST
UTo
tal
Tam
il N
adu
14.3
0.4
36.8
0.8
0.5
2.9
10.4
0.4
3.0
2.4
2.2
0.2
0.3
1.1
1.4
9.3
3.1
0.3
3.4
6.6
0.0
100.
0
Trip
ura
4.2
0.0
10.5
0.0
0.0
8.0
5.5
0.0
1.8
0.0
6.1
1.5
0.0
0.0
16.7
14.9
8.3
0.0
2.2
20.3
0.0
100.
0
Utt
ar P
rade
sh14
.00.
046
.40.
51.
92.
56.
80.
51.
30.
60.
20.
00.
11.
01.
09.
43.
90.
37.
52.
40.
010
0.0
Utt
arak
hand
8.3
0.0
24.4
0.7
0.7
0.5
9.8
3.1
6.6
0.0
0.4
0.0
0.0
0.9
3.5
26.5
6.3
0.8
4.5
3.0
0.0
100.
0
Wes
t Ben
gal
1.6
0.2
32.9
0.0
1.2
0.8
9.1
1.0
1.6
0.7
1.8
0.0
1.0
1.8
1.7
18.4
4.3
0.6
3.2
18.2
0.0
100.
0
Indi
a10
.90.
328
.70.
40.
64.
010
.00.
72.
82.
02.
20.
11.
11.
12.
613
.34.
60.
35.
98.
30.
010
0.0
A: A
gric
ultu
re, f
ores
try
and
fishi
ng
B: M
inin
g an
d qu
arry
ing
C: M
anuf
actu
ring
D
: Ele
ctri
city
, gas
, ste
am a
nd a
ir c
ondi
tioni
ng s
uppl
y
E: W
ater
sup
ply;
sew
erag
e, w
aste
man
agem
ent a
nd re
med
iatio
n ac
tiviti
es
F:
Con
stru
ction
G: W
hole
sale
and
reta
il tr
ade;
repa
ir o
f mot
or v
ehic
les
and
mot
orcy
cles
H: T
rans
port
ation
and
sto
rage
I: A
ccom
mod
ation
and
Foo
d se
rvic
e ac
tiviti
es
J:
Info
rmati
on a
nd c
omm
unic
ation
K: F
inan
cial
and
insu
ranc
e ac
tiviti
es
L: R
eal e
stat
e ac
tiviti
es
M: P
rofe
ssio
nal,
scie
ntific
and
tech
nica
l acti
vitie
s
N: A
dmin
istr
ative
and
sup
port
ser
vice
acti
vitie
s
O: P
ublic
adm
inis
trati
on a
nd d
efen
ce; c
ompu
lsor
y so
cial
sec
urity
P:
Edu
catio
n
Q: H
uman
hea
lth a
nd s
ocia
l wor
k ac
tiviti
es
R: A
rts,
ent
erta
inm
ent a
nd re
crea
tion
S: O
ther
ser
vice
acti
vitie
s
T:
Acti
vitie
s of
hou
seho
lds
as e
mpl
oyer
s; u
ndiff
eren
tiate
d
U: A
ctivi
ties
of e
xtra
terr
itori
al o
rgan
izati
ons
and
bodi
es
Goo
ds a
nd s
ervi
ces
prod
ucin
g ac
tiviti
es o
f hou
seho
lds
for
own
use
Not
e: N
ation
al In
dust
rial
Cla
ssifi
catio
n of
wor
kers
is b
ased
on
NIC
200
8.
Sour
ce: N
ation
al S
ampl
e Su
rvey
Org
aniz
ation
, Em
ploy
men
t and
Une
mpl
oym
ent,
Rep
ort N
o. 5
54(2
011-
2012
; 68t
h Ro
und)

Handbook of Urban Statistics
82
Table 3.16: Average Wage/Salary earnings (Rs./day) received by Regular Wage/Salaried Employees in Urban India
States/UTsMale Female Persons
2009-2010 2011-2012 2009-10 2011-2012 2009-2010 2011-2012Andaman & Nicobar Islands 548.91 654.08 397.69 773.96 509.61 684.32
Andhra Pradesh 341.63 427.82 248.05 244.30 325.10 395.35Arunachal Pradesh 628.30 705.38 553.27 629.15 614.98 694.41Assam 491.19 615.23 380.92 561.63 479.62 606.96Bihar 338.31 417.10 500.75 369.02 354.29 412.24Chandigarh 708.70 568.13 479.84 654.22 654.09 582.63Chhattisgarh 500.26 351.60 266.09 252.07 454.73 322.84Dadra & Nagar Haveli 289.70 324.00 238.00 390.06 289.25 334.28Daman & Diu 283.24 459.66 230.30 423.02 274.98 454.34Delhi 355.34 569.56 348.69 683.98 354.62 589.29Goa 340.01 459.04 359.52 435.98 344.06 452.29Gujarat 306.58 326.34 221.35 271.86 291.83 319.71Haryana 316.91 810.93 330.10 635.59 318.96 776.85Himachal Pradesh 487.56 426.03 435.70 306.55 478.13 396.75Jammu & Kashmir 379.61 497.61 321.86 484.71 368.37 494.95Jharkhand 491.94 576.69 215.50 380.00 448.37 551.39Karnataka 414.95 518.58 293.37 391.97 387.58 486.92Kerala 450.76 519.84 320.61 412.47 399.29 480.43Lakshadweep 637.11 690.68 583.30 591.57 619.14 669.29Madhya Pradesh 325.15 459.66 230.33 320.58 306.78 436.12Maharashtra 439.30 516.55 391.71 370.30 430.59 485.72Manipur 380.19 666.55 339.65 646.92 373.06 663.17Meghalaya 349.75 527.21 319.43 444.08 338.98 501.52Mizoram 382.36 850.29 416.84 610.51 389.88 797.23Nagaland 478.11 596.60 386.09 417.63 470.42 569.24Odisha 358.89 457.66 238.48 286.42 346.29 431.66Puducherry 428.05 409.82 308.37 224.19 394.93 364.09Punjab 342.35 352.58 374.49 399.38 347.62 361.75Rajasthan 374.42 417.14 317.85 412.89 365.61 416.54Sikkim 340.33 541.06 205.19 418.87 313.53 510.07Tamil Nadu 319.60 420.76 277.23 297.63 310.92 389.81Tripura 316.15 409.66 325.86 301.52 318.83 380.23Uttar Pradesh 360.29 496.53 285.54 378.00 351.92 482.87Uttarakhand 385.05 447.54 386.34 445.76 385.27 447.26West Bengal 391.77 454.61 277.08 323.56 371.09 424.85India 377.16 469.87 308.79 366.15 364.95 449.65
Note: In this Table, workers belonging to 15-59 years are taken into account and regular wage/salaried employees includes persons with activity status of 31(worked as regular wage/salaried employee), 71 (did not work owing to sickness but had regular salaried/wage employment) and 72(did not work owing to other reasons but had regular salaried/wage employment)
Source: National Sample Survey Organization, Employment and Unemployment, Report No.537 (2009-2010; 66th Round) and Report No. 554(2011-2012; 68th Round).

Urban Employment
83
Graph 3.8: Average Wage/salary earnings (Rs. /day) Received by Regular wage/ Salaried
Employees in Urban India.
Source: National Sample Survey Organization, Employment and Unemployment, Report No.537 (2009-2010; 66th Round) and Report No. 554(2011-2012; 68th Round)

Handbook of Urban Statistics
84
Table 3.17: Average Wage/salary earnings (Rs./day) received by Casual Labours Engaged in Works
other than Public Works in Urban India
States/UTs Male Female Persons2009-2010 2011-2012 2009-2010 2011-2012 2009-2010 2011-2012
Andaman & Nicobar Islands 150.25 190.51 157.97 169.69 151.86 184.06Andhra Pradesh 155.2 193.52 92.85 126.6 138.2 178.34Arunachal Pradesh 161.22 234.68 148.34 96.52 160.63 207.96Assam 115.65 159.4 82.01 101.68 104.59 155.38Bihar 94.04 158.28 59.63 134.41 91.9 157.33Chandigarh 148.48 197.21 89.02 - 134.43 197.21Chhattisgarh 127.18 119.48 71.65 81.87 110.55 106.16Dadra & Nagar Haveli 141.94 170.01 100 - 140.62 170.01Daman & Diu 109.51 272.39 162.22 81.29 113.1 207.95Delhi 173.35 284.85 - 86.26 173.35 277.27Goa 185.61 181.46 79.1 218.97 170.42 186.45Gujarat 119.02 160.64 66.32 88.84 106.17 144.52Haryana 154.27 206.67 70.58 165.75 142.97 204.46Himachal Pradesh 149.23 170.87 157.57 131.78 152.4 167.23Jammu & Kashmir 152.23 216.86 136.87 178.40 150.41 210.47Jharkhand 108.53 154.44 74.41 83.75 105.34 145.48Karnataka 123.03 192.24 67.88 101.77 108.64 174.05Kerala 237.42 335.76 120.9 167.56 217.66 309.9Lakshadweep 234.33 289.54 131.39 - 224.26 289.54Madhya Pradesh 88.92 129.9 75.48 98.13 86.54 125.89Maharashtra 121.55 173.18 57.64 95.91 109.90 154.62Manipur 126.97 168.16 111.55 170.38 125.41 168.29
Meghalaya 147.77 214.85 86.88 134.06 133.03 198.47Mizoram 162.64 231.53 122.37 164.83 159.05 227.4Nagaland 128.37 174.94 - - 128.37 174.94Odisha 100.26 165.34 72.80 91.17 94.69 150.85Puducherry 173.66 215.67 76.81 157.25 154.73 205.07Punjab 142.65 198.45 85.68 79.05 138.67 187.95Rajasthan 146.04 180.62 100.04 131.84 141.48 173.67Sikkim 163.4 201.62 - - 163.4 201.62Tamil Nadu 155.4 227.66 76.19 126.53 136.71 208.34Tripura 129.68 174.09 78.35 147.54 122.83 172.05Uttar Pradesh 109.3 145.23 72.37 116.56 106.81 143.2Uttarakhand 140.66 173.26 99.27 108.26 136.45 170.41West Bengal 98.98 134.58 78.46 89.56 96.86 128.24India 131.92 182.04 76.73 110.62 121.83 170.1
Note: In this Table, workers belonging to 15-59 years are taken into account and casual labours include persons with activity status of 51 (worked as casual labour in other types of works).
Source: National Sample Survey Organization, Employment and Unemployment, Report No.537 (2009-2010; 66th Round) and Report No. 554(2011-2012; 68th Round).

Urban Employment
85
Graph 3.9: Average Wage/salary earnings (Rs. / day) received by Casual Labours Engaged in Works
other than Public Work in Urban India
Source: National Sample Survey Organization, Employment and Unemployment, Report No.537 (2009-2010; 66th Round) and Report No. 554(2011-2012; 68th Round).

Handbook of Urban Statistics
86
Tabl
e 3.
18: W
ork
Parti
cipa
tion
Rat
e- 2
001
S. No
Nam
e
wor
k Pa
rtici
pati
on
Rate
% o
f Mai
n W
orke
rs
to T
otal
Po
pula
tion
% o
f M
ain
Wor
kers
to
Tot
al
wor
ker
% o
f CL
to M
ain
wor
ker
% o
f AL
to M
ain
wor
ker
% o
f HH
to
Mai
n w
orke
r
% o
f OT
to M
ain
wor
ker
% o
f M
argi
nal
Wor
kers
to
Tot
al
Popu
lati
on
% o
f M
argi
nal
Wor
kers
to
Tot
al
wor
ker
% o
f CL
to
Mar
gina
l w
orke
r
% o
f A
L to
M
argi
nal
wor
ker
% o
f H
H to
M
argi
nal
wor
ker
% o
f O
T to
M
argi
nal
wor
ker
% o
f Non
w
orke
r to
Tot
al
Popu
lati
on
1A
ndam
an &
Nic
obar
Is
land
s36
.32
34.5
695
.14
0.09
0.26
0.86
98.7
91.
764.
860.
291.
814.
0593
.85
63.6
8
2A
ndhr
a Pr
ades
h32
.30
29.1
490
.21
1.55
5.04
5.57
87.8
43.
169.
791.
2221
.59
10.2
366
.96
67.7
0
3A
runa
chal
Pra
desh
35.5
032
.90
92.6
94.
180.
911.
1893
.73
2.59
7.31
12.9
18.
906.
2871
.92
64.5
0
4A
ssam
33.2
030
.92
93.1
41.
380.
572.
2295
.83
2.28
6.86
4.22
5.13
9.84
80.8
166
.80
5Bi
har
25.5
922
.35
87.3
15.
339.
735.
7279
.22
3.25
12.6
95.
3429
.56
12.0
153
.09
74.4
1
5Ch
andi
garh
37.1
335
.97
96.8
70.
210.
080.
8998
.83
1.16
3.13
0.41
0.45
5.81
93.3
362
.87
6Ch
hatti
sgar
h31
.11
27.9
789
.91
3.78
3.16
3.58
89.4
83.
1410
.09
6.49
24.5
95.
4163
.51
68.8
9
7D
adra
& N
agar
Hav
eli
44.7
541
.95
93.7
54.
570.
940.
5793
.92
2.80
6.25
34.1
421
.53
3.61
40.7
255
.25
8D
aman
& D
iu35
.42
33.2
593
.88
0.36
0.16
1.80
97.6
82.
176.
121.
131.
6922
.75
74.4
464
.58
9D
elhi
32.8
931
.33
95.2
80.
240.
142.
9796
.65
1.55
4.72
0.49
0.84
6.33
92.3
467
.11
10G
oa37
.04
32.8
788
.72
1.19
0.74
2.06
96.0
24.
1811
.28
6.76
11.0
75.
3076
.87
62.9
6
11G
ujar
at33
.08
31.2
394
.39
1.58
2.16
2.04
94.2
31.
865.
613.
4614
.54
13.6
668
.35
66.9
2
12H
arya
na31
.49
28.1
689
.42
3.00
1.68
3.45
91.8
83.
3310
.58
3.98
12.5
37.
5075
.99
68.5
1
13H
imac
hal P
rade
sh36
.96
34.4
293
.14
2.28
0.40
1.28
96.0
52.
546.
8621
.94
5.04
4.64
68.3
863
.04
14Ja
mm
u &
Kas
hmir
32.9
529
.64
89.9
82.
951.
334.
8590
.88
3.30
10.0
211
.91
11.0
823
.35
53.6
667
.05
15Jh
arkh
and
25.6
822
.38
87.1
41.
611.
242.
6994
.46
3.30
12.8
64.
6212
.13
6.15
77.1
074
.32
16Ka
rnat
aka
35.6
732
.86
92.1
23.
183.
965.
2887
.58
2.81
7.88
2.34
18.1
210
.22
69.3
264
.33
17Ke
rala
31.6
127
.08
85.6
91.
103.
193.
3292
.40
4.52
14.3
11.
5111
.33
5.36
81.8
068
.39
18La
ksha
dwee
p27
.24
21.5
679
.15
0.00
0.00
1.74
98.2
65.
6820
.85
0.00
0.00
23.6
376
.37
72.7
6
19M
ahar
asht
ra33
.85
31.3
792
.68
1.69
2.79
2.87
92.6
62.
487.
322.
5613
.89
9.82
73.7
266
.15
20M
anip
ur (E
xcl.
3 Su
b-D
ivis
ions
)38
.57
28.5
874
.11
12.2
55.
119.
4073
.24
9.98
25.8
915
.54
22.0
823
.57
38.8
061
.43
21M
izor
am47
.87
36.4
776
.19
23.7
74.
221.
8070
.20
11.4
023
.81
21.8
520
.53
3.08
54.5
452
.13
22N
agal
and
31.0
327
.90
89.9
33.
270.
582.
0994
.06
3.13
10.0
716
.46
4.49
11.7
767
.28
68.9
7
23O
dish
a30
.62
27.5
089
.80
2.82
2.70
2.91
91.5
73.
1210
.20
4.00
21.0
28.
6066
.38
69.3
8
24Pu
duch
erry
33.1
331
.44
94.8
90.
894.
921.
7292
.46
1.69
5.11
0.80
18.2
85.
8875
.04
66.8
7
25Pu
njab
33.4
931
.32
93.5
12.
452.
873.
7390
.95
2.17
6.49
1.70
12.0
39.
0677
.21
66.5
1
26Ra
jast
han
29.5
926
.30
88.8
75.
031.
245.
3088
.44
3.29
11.1
310
.11
10.1
610
.84
68.8
970
.41
27Si
kkim
37.9
435
.07
92.4
30.
190.
131.
0498
.64
2.87
7.57
0.52
0.29
1.80
97.3
856
.93
28Ta
mil
Nad
u37
.54
34.4
591
.75
3.41
9.11
6.05
81.4
33.
108.
252.
4028
.33
9.53
59.7
462
.46

Urban Employment
87
S. No
Nam
e
Wor
k Pa
rtici
patio
n Ra
te
% o
f Mai
n W
orke
rs
to T
otal
Po
pula
tion
% o
f M
ain
Wor
kers
to
Tot
al
Wor
ker
% o
f CL
to M
ain
Wor
ker
% o
f AL
to M
ain
Wor
ker
% o
f HH
to
Mai
n W
orke
r
% o
f OT
to M
ain
Wor
ker
% o
f M
argi
nal
Wor
kers
to
Tot
al
Popu
latio
n
% o
f M
argi
nal
Wor
kers
to
Tot
al
Wor
ker
% o
f CL
to
Mar
gina
l W
orke
r
% o
f A
L to
M
argi
nal
Wor
ker
% o
f H
H to
M
argi
nal
Wor
ker
% o
f O
T to
M
argi
nal
Wor
ker
% o
f Non
W
orke
r to
Tot
al
Popu
latio
n
29Tr
ipur
a32
.45
30.1
492
.86
1.35
1.52
1.36
95.7
62.
327.
141.
607.
247.
5883
.59
67.5
5
30U
ttar
Pra
desh
27.0
823
.60
87.1
44.
853.
776.
2785
.11
3.48
12.8
63.
1514
.36
13.8
468
.66
72.9
2
31U
ttar
akha
nd29
.15
26.4
790
.80
2.04
1.77
2.08
94.1
22.
689.
203.
728.
516.
1581
.62
70.8
5
32W
est B
enga
l33
.85
30.8
491
.11
0.85
1.13
5.07
92.9
63.
018.
891.
416.
5815
.31
76.7
066
.15
AL:
Agr
icul
tura
l Lab
oure
rs
CL: C
ultiv
ator
s
HH
: (w
orke
rs in
) Hou
seho
ld In
dust
ry
OT:
Oth
er w
orke
rs
Sour
ce: C
ensu
s of
Indi
a, 2
001

Handbook of Urban Statistics
88
Tabl
e 3.
19: W
ork
Parti
cipa
tion
Rat
e- 2
011
S.N
o.N
ame
wor
k Pa
rtici
pati
on
Rate
% o
f Mai
n W
orke
rs
to T
otal
Po
pula
tion
% o
f M
ain
Wor
kers
to
Tot
al
wor
ker
% o
f CL
to M
ain
wor
ker
% o
f AL
to M
ain
wor
ker
% o
f HH
to
Mai
n w
orke
r
% o
f OT
to M
ain
wor
ker
% o
f M
argi
nal
Wor
kers
to
Tot
al
Popu
lati
on
% o
f M
argi
nal
Wor
kers
to
Tot
al
wor
ker
% o
f CL
to
Mar
gina
l w
orke
r
% o
f AL
to
Mar
gina
l w
orke
r
% o
f H
H to
M
argi
nal
wor
ker
% o
f O
T to
M
argi
nal
wor
ker
% o
f Non
w
orke
r to
Tot
al
Popu
lati
on
1A
ndam
an &
Nic
obar
Isla
nds
40.4
737
.32
92.2
10.
540.
220.
7098
.54
3.15
7.79
2.01
0.95
1.64
95.4
059
.53
2A
ndhr
a Pr
ades
h36
.75
31.5
285
.77
2.09
7.45
4.75
85.7
15.
2314
.23
2.58
13.6
96.
9776
.76
63.2
5
3A
runa
chal
Pra
desh
36.9
731
.93
86.3
63.
441.
461.
3493
.76
5.04
13.6
46.
897.
066.
0779
.98
63.0
3
4A
ssam
36.4
131
.29
85.9
32.
291.
292.
6493
.77
5.12
14.0
74.
966.
019.
1979
.84
63.5
9
5Bi
har
28.6
222
.42
78.3
25.
7511
.83
5.87
76.5
56.
2021
.68
5.01
27.6
98.
6858
.62
71.3
8
6Ch
andi
garh
38.1
736
.46
95.5
20.
470.
341.
1098
.09
1.71
4.48
2.01
1.49
3.24
93.2
661
.83
7Ch
hatti
sgar
h35
.66
31.6
088
.63
4.31
6.05
3.03
86.6
14
.05
11.3
79.
4834
.73
3.60
52.2
064
.34
8D
adra
& N
agar
Hav
eli
45.4
842
.40
93.2
22.
431.
070.
8795
.63
3.08
6.78
7.41
10.1
45.
0577
.39
54.5
2
9D
aman
& D
iu53
.58
51.9
596
.97
0.63
0.18
0.27
98.9
21.
623.
032.
221.
723.
0792
.99
46.4
2
10D
elhi
33.3
431
.70
95.0
90.
310.
493.
2196
.00
1.64
4.91
1.44
2.09
4.52
91.9
566
.66
11G
oa39
.89
34.3
586
.13
1.13
0.88
2.09
95.9
15.
5313
.87
3.11
7.01
3.61
86.2
660
.11
12G
ujar
at35
.73
32.9
792
.28
2.07
3.35
1.60
92.9
72.
767.
722.
8710
.35
5.63
81.1
464
.27
13H
arya
na32
.95
29.1
788
.54
2.72
3.23
4.36
89.7
03.
7811
.46
3.63
11.6
54.
7779
.95
67.0
5
14H
imac
hal P
rade
sh39
.22
34.9
189
.02
2.32
0.98
2.16
94.5
44.
3110
.98
26.6
38.
134.
4960
.75
60.7
8
15Ja
mm
u &
Kas
hmir
35.2
328
.38
80.5
52.
581.
872.
2193
.33
6.85
19.4
516
.91
13.1
67.
6062
.34
64.7
7
16Jh
arkh
and
29.2
624
.35
83.2
31.
802.
142.
9093
.17
4.91
16.7
77.
0714
.24
5.09
73.6
070
.74
17Ka
rnat
aka
39.6
635
.28
88.9
62.
563.
893.
8089
.74
4.38
11.0
42.
539.
157.
1181
.22
60.3
4
18Ke
rala
33.1
227
.61
83.3
71.
443.
602.
1392
.83
5.51
16.6
32.
279.
273.
2485
.22
66.8
8
19La
ksha
dwee
p28
.01
17.0
460
.84
0.00
0.00
0.90
99.1
010
.97
39.1
60.
000.
001.
7098
.30
71.9
9
20M
adhy
a Pr
ades
h34
.18
29.7
687
.08
5.52
5.47
5.01
83.9
94.
4212
.92
4.62
19.6
47.
1868
.57
65.8
2
21M
ahar
asht
ra36
.95
33.9
591
.88
1.78
3.59
3.17
91.4
63.
008.
122.
949.
556.
5280
.99
63.0
5
22M
anip
ur41
.41
31.2
575
.46
14.6
93.
616.
7274
.99
10.1
624
.54
14.4
017
.55
19.2
548
.80
58.5
9
23M
egha
laya
35.6
332
.01
89.8
43.
711.
690.
6693
.94
3.62
10.1
65.
9713
.56
2.21
78.2
564
.37
24M
izor
am40
.98
34.4
984
.16
16.3
57.
111.
9874
.57
6.49
15.8
413
.93
23.4
03.
9058
.77
59.0
2
25N
agal
and
37.4
430
.39
81.1
76.
831.
501.
6989
.97
7.05
18.8
322
.51
11.6
49.
0556
.81
62.5
6
26O
dish
a34
.81
29.7
585
.47
2.90
3.10
4.60
89.4
05.
0614
.53
3.75
15.9
37.
9172
.42
65.1
9
27Pu
duch
erry
34.8
432
.54
93.4
10.
992.
951.
5794
.50
2.30
6.59
1.80
10.0
04.
3283
.88
65.1
6

Urban Employment
89
S.N
o.N
ame
wor
k Pa
rtici
pati
on
Rate
% o
f Mai
n W
orke
rs
to T
otal
Po
pula
tion
% o
f M
ain
Wor
kers
to
Tot
al
wor
ker
% o
f CL
to M
ain
wor
ker
% o
f AL
to M
ain
wor
ker
% o
f HH
to
Mai
n w
orke
r
% o
f OT
to M
ain
wor
ker
% o
f M
argi
nal
Wor
kers
to
Tot
al
Popu
lati
on
% o
f M
argi
nal
Wor
kers
to
Tot
al
wor
ker
% o
f CL
to
Mar
gina
l w
orke
r
% o
f AL
to
Mar
gina
l w
orke
r
% o
f H
H to
M
argi
nal
wor
ker
% o
f O
T to
M
argi
nal
wor
ker
% o
f Non
w
orke
r to
Tot
al
Popu
lati
on
28Pu
njab
35.7
532
.16
89.9
32.
532.
673.
8290
.98
3.60
10.0
72.
676.
566.
1084
.67
64.2
5
29Ra
jast
han
32.2
728
.65
88.7
94.
352.
514.
6788
.48
3.62
11.2
17.
8313
.52
7.42
71.2
367
.73
30Si
kkim
41.9
036
.93
88.1
31.
050.
751.
2996
.90
4.97
11.8
73.
578.
884.
7582
.80
58.1
0
31Ta
mil
Nad
u40
.16
36.0
989
.87
2.61
7.79
4.47
85.1
34.
0710
.13
2.38
15.3
07.
0075
.33
59.8
4
32Tr
ipur
a36
.76
31.2
585
.00
2.94
3.31
1.62
92.1
35.
5115
.00
2.59
8.98
6.28
82.1
563
.24
33U
ttar
Pra
desh
31.1
624
.94
80.0
44.
265.
918.
3381
.50
6.22
19.9
63.
0313
.48
10.3
573
.14
68.8
4
34U
ttar
akha
nd32
.36
28.6
488
.50
2.03
2.49
3.48
92.0
03.
7211
.50
3.56
7.70
6.19
82.5
567
.64
35W
est B
enga
l36
.69
31.6
186
.17
1.33
2.49
6.99
89.1
95.
0813
.83
2.83
7.85
14.5
374
.79
63.3
1
Indi
a35
.31
30.9
587
.65
2.66
4.46
4.36
88.5
24.
3612
.35
3.77
12.9
37.
9175
.38
64.6
9
AL:
Agr
icul
tura
l Lab
oure
rs
CL: C
ultiv
ator
s
HH
: (w
orke
rs in
) Hou
seho
ld In
dust
ry
OT:
Oth
er w
orke
rs
Sour
ce: C
ensu
s of
Indi
a, 2
011


Public Expenditure onUrban Development
4Chapter


Public Expenditure on Urban Development
93
Public Expenditure on Urban Development
Investment in the urban development sector has traditionally been undertaken by the Government. Chapter 4 provides an overview of public expenditure on urban development. To lend perspective to the analysis, data regarding Net State Domestic Product (NSDP) and growth in income levels of the States are also provided.
Among the major states, Maharashtra, Haryana and Tamil Nadu had a per capita NSDP of over Rs. 100,000 in 2013-14 as compared to all India per capita NSDP of Rs. 74,380 in 2013-14. Some of the smaller states such as Uttarakhand, Sikkim and Goa also had high levels of per capita NSDP. Among Union Territories, Delhi, Chandigarh, Puducherry and Andaman & Nicobar Islands were the UTs with per capita NSDP over Rs. 100,000. Bihar was the poorest state with a per capita NSDP of Rs. 31,229 in 2013-14. Other major states with low levels of per capita NSDP in 2013-14 were Uttar Pradesh (Rs.37,630), Jharkhand (Rs.46,131), Assam (Rs.46,354), Madhya Pradesh (Rs.54,030) and Odisha (Rs.54,241).
If we look at the growth rates of various states, we find that some of the poorer states have registered impressive growth in NSDPs in recent years. E.g. Madhya Pradesh registered a growth of over 20% in 2012-13 and 2013-14. Similarly Bihar has also registered high levels of growth in last 5 years. All India NSDP registered a growth of 11.1% in 2013-14.
Tables 4.5 and 4.6 contain data on Public Expenditure on urban development as a proportion of both, the development expenditure and the total expenditure, for all the states. At all-India level, in terms of revenue expenditure, the share of urban development in development expenditure was 10.14% in 2009-10 (Actuals), which declined to 8.79% in 2010-11 (Revised Estimates). Further, the share of urban development in total expenditure was 9.83% in 2009-10 (Actuals) which declined to 8.50% in 2010-11 (Revised Estimates) in terms of revenue expenditure. At all India level, in terms of capital expenditure, the share of urban development in development expenditure was 4.69% in 2009-10 (Actuals) which increased to 5.02% in 2010-11 (Revised Estimates). Similarly, at all India level, in terms of capital expenditure, the share of urban development in total expenditure was 4.52% in 2009-10 (Actuals) which increased to 4.78% in 2010-11 (Revised Estimates).
Table 4.7 contains data on additional transfers of funds consequent upon recommendations of Fourteenth Finance Commission (FFC). The table indicates that special category states such as Arunachal Pradesh, Mizoram, Nagaland and Jammu & Kashmir stand to benefit immensely from additional transfer of funds. The total additional benefit to states on account of FFC transfers amount
to Rs.204,198 crores in 2015-16 over 2014-15.

Handbook of Urban Statistics
94
Tabl
e 4.
1: N
et S
tate
Dom
esti
c Pr
oduc
t at C
urre
nt P
rice
s (R
s. c
rore
)
S.
No.
Stat
es/U
Ts20
04-0
520
05-0
620
06-0
720
07-0
820
08-0
920
09-1
020
10-1
120
11-1
220
12-1
320
13-1
4
1A
ndam
an &
Nic
obar
Isla
nds
1,63
31,
848
2,29
62,
715
3,16
83,
742
3,93
94,
500
5,03
15,
672
2A
ndhr
a Pr
ades
h (u
nite
d)20
1,30
322
9,36
726
9,12
032
5,95
538
4,00
542
7,56
052
4,69
559
4,11
767
8,52
477
0,22
5
3A
runa
chal
Pra
desh
3,18
83,
439
3,76
54,
407
5,19
96,
840
8,35
29,
632
10,9
4112
,468
4A
ssam
47,1
8152
,440
57,0
3362
,342
71,4
7885
,253
100,
627
112,
126
126,
149
146,
199
5Bi
har
70,1
6774
,144
91,3
3110
2,85
312
9,69
014
8,15
118
5,74
522
2,44
227
1,43
931
5,52
9
6Ch
andi
garh
7,61
09,
179
11,0
7412
,327
13,7
4515
,739
17,8
8320
,259
21,9
9825
,489
7Ch
hatti
sgar
h41
,387
45,6
6457
,536
69,3
4882
,809
84,1
9610
2,91
212
3,33
313
7,75
615
4,48
8
8D
elhi
94,7
1710
,912
712
8,27
614
9,51
917
8,82
220
5,37
624
1,23
428
2,71
733
2,52
138
7,09
7
9G
oa10
,999
12,4
8814
,394
17,0
4522
,149
25,2
2429
,387
38,0
6137
,035
N.A
.
10G
ujar
at17
2,26
520
6,44
024
0,73
328
1,57
931
4,48
537
1,18
745
4,85
351
8,56
058
4,36
7N
.A.
11H
arya
na86
,222
97,9
0311
6,10
413
6,58
416
4,63
620
3,85
523
7,16
327
3,19
231
0,99
035
0,16
7
12H
imac
hal
Prad
esh
21,1
8923
,743
26,2
4728
,873
33,1
1539
,141
46,2
1651
,885
58,4
8964
,995
13Ja
mm
u &
Kas
hmir
23,2
9225
,278
27,6
5230
,720
34,2
9038
,718
46,7
4055
,174
62,4
4970
,874
14Jh
arkh
and
53,0
5653
,358
58,5
1274
,388
76,2
3487
,112
108,
652
115,
975
129,
402
150,
333
15Ka
rnat
aka
148,
729
174,
911
203,
819
243,
028
278,
534
300,
747
368,
338
4,06
,821
462,
395
516,
516
16Ke
rala
104,
776
120,
269
135,
104
153,
981
180,
134
206,
070
233,
177
272,
065
309,
332
N.A
.
17M
adhy
a Pr
ades
h99
,940
109,
612
127,
663
142,
917
175,
503
202,
225
232,
794
276,
789
3,33
,010
406,
055
18M
ahar
asht
ra37
0,02
343
7,10
352
6,91
061
9,88
467
7,78
177
0,79
495
0,77
11,
064,
689
1,19
6,75
41,
333,
684
19M
anip
ur4,
603
5,13
85,
504
6,04
86,
612
7,37
28,
020
9,74
610
,919
N.A
.
20M
egha
laya
5,84
66,
461
7,70
18,
619
10,3
4111
,122
12,8
5215
,144
16,0
7018
,504
21M
izor
am2,
400
2,66
42,
944
3,41
14,
154
4,71
75,
772
6,23
07,
556
N.A
.
22N
agal
and
5,42
16,
116
6,72
87,
477
8,78
49,
711
10,8
5012
,788
14,4
4116
,328
23O
dish
a67
,987
73,5
5087
,921
111,
109
127,
516
135,
837
164,
760
176,
822
210,
683
235,
166
24Pu
duch
erry
5,03
37,
135
7,42
98,
179
8,90
811
,085
11,7
8613
,034
14,7
7119
,754
25Pu
njab
86,1
0895
,902
113,
013
135,
706
154,
827
176,
187
202,
025
227,
387
251,
852
281,
128
26Ra
jast
han
112,
636
125,
333
151,
428
172,
250
203,
939
233,
767
300,
907
361,
067
410,
834
459,
322

Public Expenditure on Urban Development
95
S.
No.
Stat
es/U
Ts20
04-0
520
05-0
620
06-0
720
07-0
820
08-0
920
09-1
020
10-1
120
11-1
220
12-1
320
13-1
4
27Si
kkim
1,51
11,
733
1,87
12,
139
2,79
65,
463
6,63
68,
029
9,43
211
,137
28Ta
mil
Nad
u19
3,64
522
8,84
627
6,71
131
3,81
235
9,39
143
0,01
352
7,91
260
2,85
167
1,72
877
1,76
2
29Tr
ipur
a8,
170
9,04
09,
981
10,8
0812
,509
14,1
6216
,573
19,6
9022
,453
N.A
.
30U
ttar
Pra
desh
231,
029
258,
643
296,
767
335,
810
392,
771
463,
583
532,
218
609,
924
693,
539
789,
483
31U
ttar
akha
nd22
,288
26,9
6832
,670
40,2
7948
,616
61,1
3872
,970
85,6
0293
,730
106,
512
32W
est B
enga
l19
0,02
92,
09,7
2623
8,62
927
3,55
731
0,53
036
2,51
742
1,23
148
0,37
655
7,09
26,
35,7
84
All-
Indi
a N
DP
2,65
1,57
33,
026,
782
3,53
4,54
74,
097,
390
4,73
8,36
95,
449,
104
6,48
8,64
17,
511,
795
8,37
2,74
49,
299,
345
Sour
ce: E
cono
mic
Sur
vey,
201
4-15

Handbook of Urban Statistics
96
Tabl
e 4.
2: N
et S
tate
Dom
esti
c Pr
oduc
t at C
urre
nt P
rice
s (R
s. P
er C
apit
a)
SL.
No.
Stat
es/U
Ts20
04-0
520
05-0
620
06-0
720
07-0
820
08-0
920
09-1
020
10-1
120
11-1
220
12-1
320
13-1
4
1A
ndam
an &
Nic
obar
Isla
nds
40,9
2144
,754
53,7
7861
,430
69,1
7778
,936
80,5
5889
,642
97,6
8710
7,41
8
2A
ndhr
a Pr
ades
h (u
nite
d)25
,321
28,5
3933
,135
39,7
2746
,345
51,1
1462
,148
69,7
4278
,958
88,8
76
3A
runa
chal
Pra
desh
26,7
2128
,171
30,1
3234
,466
39,7
2651
,068
60,9
3568
,667
76,2
1884
,869
4A
ssam
16,7
8218
,396
19,7
3721
,290
24,0
9928
,383
33,0
8736
,415
40,4
7546
,354
5Bi
har
7,91
48,
223
9,96
711
,051
13,7
2815
,457
19,1
1122
,582
27,2
0231
,229
6Ch
andi
garh
74,1
7384
,993
97,5
6810
2,98
010
8,48
611
7,37
112
6,65
113
6,88
314
1,92
615
6,95
1
7Ch
hatti
sgar
h18
,559
20,1
1724
,800
29,3
8534
,360
34,3
6641
,165
48,3
6652
,983
58,2
97
8D
elhi
63,8
7772
,208
83,2
7595
,241
111,
756
125,
936
145,
129
166,
883
192,
587
2,19
,979
9G
oa76
,968
84,7
2194
,882
108,
708
135,
966
149,
164
168,
024
211,
570
200,
514
N.A
.
10G
ujar
at32
,021
37,7
8043
,395
50,0
1655
,068
64,0
9777
,485
87,1
7596
,976
N.A
.
11H
arya
na37
,972
42,3
0949
,261
56,9
1767
,405
82,0
3793
,852
106,
358
119,
158
132,
089
12H
imac
hal
Prad
esh
33,3
4836
,949
40,3
9343
,966
49,9
0358
,402
68,2
9775
,185
83,8
9992
,300
13Ja
mm
u &
Kas
hmir
21,7
3423
,240
25,0
5927
,448
30,2
1233
,650
40,0
8946
,734
52,2
5058
,593
14Jh
arkh
and
18,5
1018
,326
19,7
8924
,789
25,0
4628
,223
34,7
2136
,554
40,2
3846
,131
15Ka
rnat
aka
26,8
8231
,239
35,9
8142
,419
48,0
8451
,364
62,2
5168
,053
76,5
7884
,709
16Ke
rala
31,8
7136
,276
40,4
1945
,700
53,0
4660
,226
67,6
5278
,387
88,5
27N
.A.
17M
adhy
a Pr
ades
h15
,442
16,6
3119
,028
20,9
3525
,278
28,6
5132
,453
37,9
7944
,989
54,0
30
18M
ahar
asht
ra36
,077
41,9
6549
,831
57,7
6062
,234
69,7
6584
,858
93,7
4810
3,99
111
4,39
2
19M
anip
ur18
,640
20,3
9521
,423
23,0
9024
,764
27,0
9328
,931
34,5
1836
,937
N.A
.
20M
egha
laya
24,0
8626
,284
30,9
5224
,229
40,5
8343
,142
49,2
6150
,316
52,0
9058
,522
21M
izor
am24
,662
26,6
9828
,764
32,4
8838
,582
42,7
1550
,956
53,6
2463
,413
N.A
.
22N
agal
and
30,4
4133
,792
36,5
6839
,985
46,2
0750
,263
55,5
8263
,781
70,2
7477
,529
23O
dish
a17
,650
18,8
4622
,237
27,7
3531
,416
33,0
2939
,537
41,8
7649
,241
54,2
41
24Pu
duch
erry
48,3
0267
,205
68,6
7374
,201
79,3
0696
,860
101,
072
103,
149
114,
034
148,
784
25Pu
njab
33,1
0336
,199
41,8
8349
,380
55,3
1561
,805
69,5
8276
,895
84,5
2692
,638
26Ra
jast
han
18,5
6520
,275
24,0
5526
,882
31,2
7935
,254
44,6
4452
,735
59,0
9765
,098
27Si
kkim
2669
030
,252
32,1
9936
,448
46,9
8390
,749
108,
972
130,
127
151,
395
176,
491
28Ta
mil
Nad
u30
,062
35,2
4342
,288
47,6
0654
,137
64,3
3878
,473
89,0
5098
,628
112,
664

Public Expenditure on Urban Development
97
SL.
No.
Stat
es/U
Ts20
04-0
520
05-0
620
06-0
720
07-0
820
08-0
920
09-1
020
10-1
120
11-1
220
12-1
320
13-1
4
29Tr
ipur
a24
,394
26,6
6829
,081
31,1
1135
,587
39,8
1546
,050
54,0
7760
,963
N.A
.
30U
ttar
Pra
desh
12,9
5014
,221
16,0
1317
,785
20,4
2223
,671
26,6
9830
,071
33,6
1637
,630
31U
ttar
akha
nd24
,726
29,4
4135
,111
42,6
1950
,657
62,7
5773
,819
85,3
7292
,191
103,
349
32W
est B
enga
l22
,649
24,7
2027
,823
31,5
6735
,487
41,0
3947
,245
53,3
8361
,352
69,4
13
All-
Indi
a N
DP
24
,143
27,1
3131
,206
35,8
2540
,775
46,2
4954
,021
61,8
5567
,839
74,3
80
Sour
ce: E
cono
mic
Sur
vey,
201
4-15

Handbook of Urban Statistics
98
Gra
ph 4
.1: N
et S
tate
Dom
esti
c Pr
oduc
t at
Cur
rent
Pri
ces
(Rs.
Per
Cap
ita)
(201
2-13
)
Sour
ce: E
cono
mic
Sur
vey,
201
4-15

Public Expenditure on Urban Development
99
Tabl
es 4
.3 :
Gro
wth
of N
et S
tate
Dom
esti
c Pr
oduc
t at c
urre
nt p
rice
s (P
erce
ntag
e ch
ange
ove
r pr
evio
us y
ear)
S. N
o.St
ates
/UTs
2005
-06
2006
-07
2007
-08
2008
-09
2009
-10
2010
-11
2011
-12
2012
-13
2013
-14
1A
ndam
an &
Nic
obar
Isla
nds
13.2
24.2
18.2
16.7
18.1
5.3
14.2
11.8
12.7
2A
ndhr
a Pr
ades
h (u
nite
d)13
.917
.321
.117
.811
.322
.713
.214
.213
.53
Aru
nach
al P
rade
sh7.
99.
517
.118
.031
.622
.115
.313
.614
.04
Ass
am11
.18.
89.
314
.719
.318
.011
.412
.515
.95
Biha
r5.
723
.212
.626
.114
.225
.419
.822
.016
.26
Chan
diga
rh20
.620
.611
.311
.514
.513
.613
.38.
615
.97
Chha
ttisg
arh
10.3
26.0
20.5
19.4
1.7
22.2
19.8
11.7
12.1
8D
elhi
15.2
17.5
16.6
19.6
14.8
17.5
17.2
17.6
16.4
9G
oa13
.515
.318
.429
.913
.916
.529
.5-2
.7N
.A.
10G
ujar
at19
.816
.617
.011
.718
.022
.514
.012
.7N
.A.
11H
arya
na13
.518
.617
.620
.523
.816
.315
.213
.812
.612
Him
acha
l Pr
ades
h12
.110
.510
.014
.718
.218
.112
.312
.711
.113
Jam
mu
& K
ashm
ir8.
59.
411
.111
.612
.920
.718
.013
.213
.514
Jhar
khan
d0.
69.
727
.12.
514
.324
.76.
711
.616
.215
Karn
atak
a17
.616
.519
.214
.68.
022
.510
.413
.711
.716
Kera
la14
.812
.314
.017
.014
.413
.216
.713
.7N
.A.
17M
adhy
a Pr
ades
h9.
716
.511
.922
.815
.215
.118
.920
.321
.918
Mah
aras
htra
18.1
20.5
17.6
9.3
13.7
23.3
12.0
12.4
11.4
19M
anip
ur11
.67.
19.
99.
311
.58.
821
.512
.0N
.A.
20M
egha
laya
10.5
19.2
11.9
20.0
7.6
15.6
17.8
6.1
15.1
21M
izor
am11
.010
.515
.921
.813
.622
.47.
921
.3N
.A.
22N
agal
and
12.8
10.0
11.1
17.5
10.6
11.7
17.9
12.9
13.1
23O
dish
a8.
219
.526
.414
.86.
521
.37.
319
.111
.624
Pudu
cher
ry41
.84.
110
.18.
924
.46.
310
.613
.333
.725
Punj
ab11
.417
.820
.114
.113
.814
.712
.610
.811
.626
Raja
stha
n11
.320
.813
.818
.414
.628
.720
.013
.811
.827
Sikk
im14
.78.
014
.330
.795
.421
.521
.017
.518
.128
Tam
il N
adu
18.2
20.9
13.4
14.5
19.7
22.8
14.2
11.4
14.9
29Tr
ipur
a10
.610
.48.
315
.713
.217
.018
.814
.0N
.A.
30U
ttar
Pra
desh
12.0
14.7
13.2
17.0
18.0
14.8
14.6
13.7
13.8
31U
ttar
akha
nd21
.021
.123
.320
.725
.819
.417
.39.
513
.632
Wes
t Ben
gal
10.4
13.8
14.6
13.5
16.7
16.2
14.0
16.0
14.1
All-
Indi
a N
DP
14.2
16.8
15.9
15.6
15.0
19.1
15.8
11.5
11.1
Sour
ce: E
cono
mic
Sur
vey,
201
4-15

Handbook of Urban Statistics
100
Gra
ph 4
.2 :
Gro
wth
of N
et S
tate
Dom
esti
c Pr
oduc
t at c
urre
nt p
rice
s (2
010-
13) (
Perc
enta
ge c
hang
e ov
er p
revi
ous
year
)
Sour
ce: E
cono
mic
Sur
vey,
201
4-15

Public Expenditure on Urban Development
101
Tabl
es 4
.4: G
row
th o
f Per
Cap
ita
Net
Sta
te D
omes
tic
Prod
uct a
t cur
rent
pri
ces
(Per
cent
age
chan
ge o
ver
prev
ious
yea
r)
S. N
o.St
ates
/UTs
2005
-06
2006
-07
2007
-08
2008
-09
2009
-10
2010
-11
2011
-12
2012
-13
2013
-14
1A
ndam
an &
Nic
obar
Isla
nds
9.4
20.2
14.2
12.6
14.1
2.1
11.3
9.0
10.0
2A
ndhr
a Pr
ades
h (u
nite
d)12
.716
.119
.916
.710
.321
.612
.213
.212
.63
Aru
nach
al P
rade
sh5.
47.
014
.415
.328
.619
.312
.711
.011
.44
Ass
am9.
67.
37.
913
.217
.816
.610
.111
.114
.55
Biha
r3.
921
.210
.924
.212
.623
.618
.220
.514
.86
Chan
diga
rh14
.614
.85.
55.
38.
27.
98.
13.
710
.67
Chha
ttisg
arh
8.4
23.3
18.5
16.9
0.0
19.8
17.5
9.5
10.0
8D
elhi
13.0
15.3
14.4
17.3
12.7
15.2
15.0
15.4
14.2
9G
oa10
.112
.014
.625
.19.
712
.625
.9-5
.2N
.A.
10G
ujar
at18
.014
.915
.310
.116
.420
.912
.511
.2N
.A.
11H
arya
na11
.416
.415
.518
.421
.714
.413
.312
.010
.912
Him
acha
l Pr
ades
h10
.89.
38.
813
.517
.016
.910
.111
.610
.013
Jam
mu
& K
ashm
ir6.
97.
89.
510
.111
.419
.116
.611
.812
.114
Jhar
khan
d-1
.08.
025
.31.
012
.723
.05.
310
.114
.615
Karn
atak
a16
.215
.217
.913
.46.
821
.29.
312
.510
.616
Kera
la13
.811
.413
.116
.113
.512
.315
.912
.9N
.A.
17M
adhy
a Pr
ades
h7.
714
.410
.120
.713
.313
.317
.018
.520
.118
Mah
aras
htra
16.3
18.7
15.9
7.7
12.1
21.6
10.5
10.9
10.0
19M
anip
ur9.
45.
07.
87.
29.
46.
819
.37.
0N
.A.
20M
egha
laya
9.1
17.8
10.6
18.6
6.3
14.2
2.1
3.5
12.3
21M
izor
am8.
37.
712
.918
.810
.719
.35.
218
.3N
.A.
22N
agal
and
11.0
8.2
9.3
15.6
8.8
10.6
14.8
10.2
10.3
23O
dish
a6.
818
.024
.713
.35.
119
.75.
917
.610
.224
Pudu
cher
ry39
.12.
28.
06.
922
.14.
32.
110
.630
.525
Punj
ab9.
415
.717
.912
.011
.712
.610
.59.
99.
626
Raja
stha
n9.
218
.611
.816
.412
.726
.618
.112
.110
.227
Sikk
im13
.36.
413
.228
.993
.220
.119
.416
.316
.628
Tam
il N
adu
17.2
20.0
12.6
13.7
18.8
22.0
13.5
10.8
14.2
29Tr
ipur
a9.
39.
07.
014
.411
.915
.717
.412
.7N
.A.
30U
ttar
Pra
desh
9.8
12.6
11.1
14.8
15.9
12.8
12.6
11.8
11.9
31U
ttar
akha
nd19
.119
.321
.418
.923
.917
.615
.78.
012
.132
Wes
t Ben
gal
9.1
12.6
13.5
12.4
15.6
15.1
13.0
14.9
13.1
All-
Indi
a Pe
r Ca
pita
NN
I 12
.415
.014
.813
.813
.416
.814
.59.
79.
6
Sour
ce: E
cono
mic
Sur
vey,
201
4-15

Handbook of Urban Statistics
102
Gra
ph 4
.3:
Gro
wth
of
Per
Capi
ta N
et S
tate
Dom
esti
c Pr
oduc
t at
cur
rent
pri
ces
(201
0-13
) (P
erce
ntag
e ch
ange
ove
r
prev
ious
yea
r)
Sour
ce: E
cono
mic
Sur
vey,
201
4-15

Public Expenditure on Urban Development
103
Table 4.5: Revenue expenditure of States and Union Territories (Urban development)
S.No. States/UTs
Revenue Expenditure2009-10 2010-11 2011-12Actuals Revised estimates Budget estimates
% of Urban Development
to Development Expenditure
% of Urban Development
to Total Expenditure
% of Urban Development
to Development Expenditure
% of Urban Development
to Total Expenditure
% of Urban Development
to Development Expenditure
% of Urban Development
to Total Expenditure
1 Andhra Pradesh 11.05 10.92 11.03 10.95 9.33 9.22 Arunachal Pradesh 0.07 0.07 0.12 0.11 0.07 0.063 Assam 5.65 5.59 10.15 9.05 9.95 8.614 Bihar 10.22 9.78 7.26 7.11 5.89 5.825 Chhattisgarh 4.67 4.62 4.88 4.85 5.29 5.256 Goa 8.26 8.13 7.01 6.82 7.87 7.647 Gujarat 20.42 19.77 17.4 16.45 13.37 12.488 Haryana 4.07 4.02 12.23 12.11 11.95 11.859 Himachal Pradesh 5.21 5.03 1.79 1.76 2.43 2.3910 Jammu & Kashmir 0.31 0.31 0.81 0.8 0.71 0.711 Jharkhand 0.1 0.09 1.26 1.23 1.09 1.0512 Karnataka 5.35 4.97 7.62 7.19 3.66 3.3512 Kerala 8.61 7.85 14.29 13.66 10.53 10.3514 Madhya Pradesh 5.16 4.91 5.69 5.43 5.27 5.0315 Maharashtra 22.05 21.64 14.74 14.4 14.99 14.4916 Manipur 3.14 3.05 3.64 3.56 3.38 3.3717 Meghalaya 2.76 2.64 2.09 2.02 1.77 1.718 Mizoram 2.55 2.49 2.13 1.93 2.22 219 Nagaland 0.18 0.17 0.14 0.14 0.21 0.2120 NCT of Delhi 25.18 24.75 15.72 15.37 19.42 18.9321 Odisha 4.44 4.38 2.75 2.73 3.33 3.2922 Puducherry 4.45 4.18 5.7 5.54 7.41 7.2323 Rajasthan 4.18 4.11 3.41 3.32 3.1 2.9424 Sikkim 1.67 1.56 3.03 2.96 1.86 1.825 Tamil Nadu 13.54 13.21 8.04 7.76 9.27 8.8926 Tripura 6.63 6.53 6.73 6.69 6.19 627 Uttar Pradesh 4.86 4.6 5.78 5.52 5.57 5.4328 Uttarakhand 23.91 23.84 13.82 13.69 8.41 8.429 West Bengal 15.01 14.84 13.3 13.01 17.79 17.5
All States 10.14 9.83 8.79 8.5 8.28 7.97
Source: State Finances, A Study of Budgets of 2011-12, Reserve Bank of India.

Handbook of Urban Statistics
104
Table 4.6: Capital Expenditure of States and Union Territories (Urban Development)
S. No. States/UTs
Capital Expenditure2009-10 2010-11 2011-12Actuals Revised estimates Budget estimates
% of Urban Development
to Development Expenditure
% of Urban Development
to Total Expenditure
% of Urban Development
to Development Expenditure
% of Urban Development
to Total Expenditure
% of Urban Development
to Development Expenditure
% of Urban Development
to Total Expenditure
1 Andaman & Nicobar Islands NA NA NA NA NA NA
2 Andhra Pradesh NA NA NA NA NA NA3 Arunachal Pradesh 7.62 7.15 9.12 5.52 11.51 4.124 Assam 7.53 7.34 1.75 1.72 0.25 0.245 Bihar 0.16 0.15 0.08 0.07 0.07 0.066 Chandigarh NA NA NA NA NA NA7 Chhattisgarh 11.44 11.12 7.16 6.04 9.81 9.56
8 Dadar & Nagar Haveli NA NA NA NA NA NA
9 Daman & Diu NA NA NA NA NA NA10 Goa 0.22 0.18 0.32 0.26 0.29 0.2311 Gujarat 1.18 1.15 1.02 1 6.56 6.1912 Haryana NA NA 8.93 8.44 10.8 10.3813 Himachal Pradesh 0.69 0.67 0.78 0.75 0.07 0.0714 Jammu & Kashmir 6.96 5.76 6.5 5.48 9.99 8.6915 Jharkhand 15.01 14.38 14.79 14.49 16.05 15.7116 Karnataka 4.34 4.18 1.02 0.98 0.4 0.3917 Kerala NA NA NA NA 2.41 2.3718 Lakshadweep NA NA NA NA NA NA19 Madhya Pradesh 0.89 0.87 0.66 0.65 0.74 0.7320 Maharashtra 1.63 1.59 NA NA NA NA21 Manipur 8.8 8.23 7.02 6.07 5.11 4.422 Meghalaya 3.24 2.91 16.18 14.62 13.92 12.7623 Mizoram 9.5 8.97 16.97 16.02 13.7 13.0124 Nagaland 10.03 8.07 15.06 12.94 12.78 8.4525 NCT of Delhi NA NA NA NA NA NA26 Odisha 0.26 0.25 0.1 0.1 0.18 0.1727 Puducherry NA NA NA NA NA NA28 Punjab 12.81 12.36 23.05 21.6 24.22 23.5329 Rajasthan 8.04 7.89 14.46 14.13 13.78 13.4530 Sikkim 10.71 9.24 20.62 19.11 21.75 21.131 Tamil Nadu 3.54 3.37 2.41 2.3 16.4 16.0632 Tripura NA NA NA NA 0.11 0.0733 Uttar Pradesh 12.87 12.75 12.91 12.74 9.74 9.5334 Uttarakhand NA NA NA NA 0.02 0.0235 West Bengal 0.63 0.6 2.15 2.03 3.31 3.17 All States 4.69 4.52 5.02 4.78 6.34 5.99
Source: State Finances, A Study of Budgets of 2011-12, Reserve Bank of India.

Public Expenditure on Urban Development
105
Table 4.7: Additional FFC Transfers (in 2015-16 over 2014-15)
S. No.States Category
Benefits from FFC (Rs. in
crore)
Benefits Per Capita (Rs)
Benefits as % of OTR
Benefits as % of NSDP
1 Andhra Pradesh(United) GCS 14,620 1,728 27.4 2.2
2 Arunachal Pradesh SCS 5,585 40,359 1,758.1 51.0
3 Assam SCS 7,295 2,338 95.5 5.8
4 Bihar GCS 13,279 1,276 105.3 4.9
5 Chhattisgarh GCS 7,227 2,829 67.5 5.2
6 Goa GCS 1,107 7,591 44.1 3.0
7 Gujarat GCS 4,551 753 10.3 0.8
8 Haryana GCS 1,592 628 7.8 0.5
9 Himachal Pradesh SCS 8,533 12,430 207.7 14.6
10 Jammu & Kashmir SCS 13,970 11,140 294.4 22.4
11 Jharkhand GCS 6,196 1,878 89.1 4.8
12 Karnataka GCS 8,401 1,375 18.1 1.8
13 Kerala GCS 9,508 2,846 37.0 3.1
14 Madhya Pradesh GCS 15,072 2,075 55.9 4.5
15 Maharashtra GCS 10,682 951 12.2 0.9
16 Manipur SCS 2,130 8,286 578.7 19.5
17 Meghalaya SCS 1,381 4,655 198.0 8.6
18 Mizoram SCS 2,519 22,962 1,410.1 33.3
19 Nagaland SCS 2,694 13,616 886.5 18.7
20 Odisha GCS 6,752 1,609 50.2 3.2
21 Punjab GCS 3,457 1,246 18.3 1.4
22 Rajasthan GCS 6,479 945 25.5 1.6
23 Sikkim SCS 1,010 16,543 343.7 10.7
24 Tamil Nadu GCS 5,973 828 10.0 0.9
25 Tripura SCS 1,560 4,247 181.8 6.9
26 Uttar Pradesh GCS 24,608 1,232 46.8 3.5
27 Uttarakhand SCS 1,303 1,292 23.2 1.4
28 West Bengal GCS 16,714 1,831 67.0 3.0
Total 204,198 1,715
FFC: Fourteenth Finance Commission
GCS: General Category States
SCS: Special Category States
OTR: Own Tax Revenue Receipts
NSDP: Net State Domestic Product
Source: Economic Survey 2014-15

Handbook of Urban Statistics
106
Graph 4.4: Additional FFC Transfers (in 2015-16 over 2014-15)- Benefits from FFC (Rs. In crore)
Source : State Finances, A Study of Budgets of 2011-12, Reserve Bank of India.
Graph 4.5: Additional FFC Transfers (in 2015-16 over 2014-15)- FFC transfer Benefits as % of NSDP
Source : State Finances, A Study of Budgets of 2011-12, Reserve Bank of India

Public Expenditure on Urban Development
107
Table 4.8: Decomposition of FFC Transfers to States
S. No. States State share in 14th FC
State share in 13th FC
Decomposition of FFC Transfers
Due to change in Divisible pool
Due to change in Share
1 Andhra Pradesh(United) 6.74 6.94 107.5 -7.5
2 Arunachal Pradesh 1.37 0.33 24.9 75.1
3 Assam 3.31 3.63 129.0 -29.0
4 Bihar 9.66 10.92 142.8 -42.8
5 Chhattisgarh 3.08 2.47 64.9 35.1
6 Goa 0.38 0.27 53.9 46.1
7 Gujarat 3.08 3.04 96.7 3.3
8 Haryana 1.08 1.05 92.3 7.7
9 Himachal Pradesh 0.71 0.78 128.9 -28.9
10 Jammu & Kashmir 1.85 1.55 69.5 30.5
11 Jharkhand 3.14 2.80 78.2 21.8
12 Karnataka 4.71 4.33 82.7 17.3
13 Kerala 2.50 2.34 86.1 13.9
14 Madhya Pradesh 7.55 7.12 87.4 12.6
15 Maharashtra 5.52 5.20 87.1 12.9
16 Manipur 0.62 0.45 56.6 43.4
17 Meghalaya 0.64 0.41 47.7 52.3
18 Mizoram 0.46 0.27 43.7 56.3
19 Nagaland 0.50 0.31 47.3 52.7
20 Odisha 4.64 4.78 107.7 -7.7
21 Punjab 1.58 1.39 76.2 23.8
22 Rajasthan 5.49 5.85 118.4 -18.4
23 Sikkim 0.37 0.24 49.0 51.0
24 Tamil Nadu 4.02 4.97 207.5 -107.5
25 Tripura 0.64 0.51 64.1 35.9
26 Uttar Pradesh 17.96 19.68 129.0 -29.0
27 Uttarakhand 1.05 1.12 118.2 -18.2
28 West Bengal 7.32 7.26 98.0 2.0
Source: Economic Survey 2014-15


Urban Transportation
5Chapter


Urban Transportation
111
Urban Transportation
With growing urbanization, incessant growth of personal transport and expansion of cities, urban
transportation has become a major concern for policy makers and urban planners.
The distribution of travel among various modes of transportation varies significantly across Indian
cities. Table 5.1 gives an overview of modal share of transportation in various Indian cities. Among
the large cities, use of public transport ranges between 15% in Ahmedabad to 57% in Kolkata. The
share of motorised personal transport is very high in case of cites where public transport is less used.
For example, in Ahmedabad the share of motorized personal transport is 44%, whereas in Mumbai
and Kolkata it is 14% and 10%, respectively. Auto rickshaws considered to be intermediate public
transport has also a prominent share in overall transport in cities like Bengaluru (18%) and Mumbai
(9%). It is seen that the share of public transport is very low in case of small cities with a population
of 0.5-1 million (9%) and cities with a population 1-2 million (13%). Not surprisingly, share of walking
and cycle is higher for smaller cities. The pattern of public transport in selected Indian cities can be
seen at table 5.2.
Table 5.3 provides a comparison of share of public transport in various cities categorized on the
basis of their population in two studies conducted in 1994 and 2007. It shows that the share of pub-
lic transport in large cities (cities with population of 4-8 million and above 8 million) has declined,
whereas for cities with a population of 1-2 million the share of public transport has increased.
Table 5.4 contains desirable modal shares for different city sizes. It clearly indicates that for small and
medium-sized cities, non-motorized forms of urban mobility should be dominant. For towns and cit-
ies with a population of up to 2 million, walking should be the dominant form of mobility and should
constitute 30% of the trips made. This is followed by cycle and motorized two-wheelers. But in case
of large cities, the public transport should constitute the dominant share of the modal-mix. For a city
of population exceeding 2 million, it is appropriate that public transport constitutes more than a third
of the trips made.
Table 5.5 provides international comparison regarding vehicular penetration in select developed and
developing countries. It shows that passenger cars and total vehicles per 1000 persons is high in
the developed countries, though the number of two-wheelers per 1000 persons is higher for the
developing countries. Table 5.7 contains a comparison of investment estimates for urban transport
by various committees. The High Powered Expert Committee 2011 (HPEC 2011) has estimated the

Handbook of Urban Statistics
112
investment requirements over 2010-2030 at Rs. 22.68 trillion, whereas McKinsey study (2010) puts
it at Rs. 27.04 trillion.
Table 5.8 contains data regarding parking charges in various cities in the world. It reveals that park-
ing charges in Indian cities is much lower than the cities abroad. While cities such as London, Tokyo
and New York have high parking charges, it can be seen that cities in even developing countries like
Bangkok and Mexico City have much higher parking charges. This is significant because high park-
ing charges create disincentive for using private vehicles for transport and are an important tool in
promoting public transport. In cities like London, parking charges have been used as an instrument
to reduce the congestion on roads. Parking charges can also be an important source of financing of
urban local body.
Table 5.9 and table 5.10 indicates composition of India’s vehicle population over the years. It shows
that overall registered vehicles have increased from 0.3 million in 1951 to 141.8 million in 2011. The
share of two wheelers in total vehicle has increased significantly from 8.8% in 1951 to 71.8% in 2011.
The share of cars, jeeps and taxis has declined from 52% in 1951 to 13.6% in 2011. The share of buses
in total vehicle has declined from 11.1% in 1951 to 1.1% in 2011.
Another mode of transportation playing an increasingly important role in urban mobility is metro
rail. Table 5.11 provides details of Metro Rail Projects approved by Government of India upto August,
2015. Details of average number of passengers travelled in Delhi Metro and Bangalore Metro for the
year 2014-15 and 2015-16 (April-September) can be seen at Table 5.12.

Urban Transportation
113
Tabl
e 5.
1: M
ode
Shar
e in
Var
ious
Indi
an C
ities
(%)
CITY
SIZ
E CA
TEG
ORY
(M
ILLI
ON
PO
PULA
TIO
N)
CI
TY N
AM
E
POPU
LATI
ON
IN
TH
E CI
TY
(MIL
LIO
N)
w
ALK
NO
N-M
OTO
RISE
D
TRA
NSP
ORT
INTE
RMED
IATE
PU
BLIC
TR
AN
SPO
RTPU
BLIC
TR
AN
SPO
RT
MO
TORI
SED
PE
RSO
NA
L TR
AN
SPO
RT
CYCL
ERI
CKSH
AwA
UTO
RI
CKSH
AwO
THER
SCA
RSTw
O
wH
EELE
RS>
8.0
–-
228
7-
4410
9>
5.0
--
298
11
-47
410
Mum
bai
16.4
285
-9
-44
95
Kolk
ata
13.2
1812
-3
-57
73
Del
hi12
.920
12-
6-
4314
5Ch
enna
i6.
5622
6-
9-
329
22Be
ngal
uru
5.7
285
-18
-26
167
Hyd
erab
ad6.
3422
6-
7-
498
8A
hmed
abad
5.41
2214
-5
-15
2024
4-8
--
2511
-7
-21
1026
2-5
--
2913
27
-33
121
Pu
ne3.
7824
88
--
1210
38Ka
npur
2.
7230
18-
7-
67
32Lu
ckno
w2.
2438
26-
8-
-4
241-
2-
-30
85
2-
241
300.
5 -1
--
3220
-3
-9
1224
< 0.
5(ca
tego
ry 1
a)-
-34
3-
5-
527
26
< 0.
5(ca
tego
ry
1b fo
r hi
lly to
wns
)-
-57
1-
0-
828
6
0.1-
0.5
--
3815
123
-13
118
.05-
0.1
--
3817
134
-11
116
Sour
ce: N
ation
al T
rans
port
Dev
elop
men
t Pol
icy
Com
mitt
ee, 2
013

Handbook of Urban Statistics
114
Graph 5.1: Mode Share in Various Indian Cities
Source: National Transport Development Policy Committee, 2013

Urban Transportation
115
Table 5.2: Pattern of Public Transport in Selected Indian Cities
(All figures in numbers)
CITY MUMBAI DELHI CHENNAIBANGA-
LOREKOLKATA PUNE
Public Transport Buses oper-ated by State Road Transport Undertaking (SRTU)
BEST DTC MTC BMTCCALCUTTA
STCPUNE MPML
4,652 5,771 3,414 6,111 956 1,549
Other Buses (Registered buses excluding SRTU buses)
8,189 39,986 33,791 22,150 3,293 13,459
Paratransit-registered commercial transport vehicles including taxis and three to six seater passenger vehicles
159,629 253,532 174,314 162,431 49,648 78,778
Source: National Transport Development Policy Committee, 2013
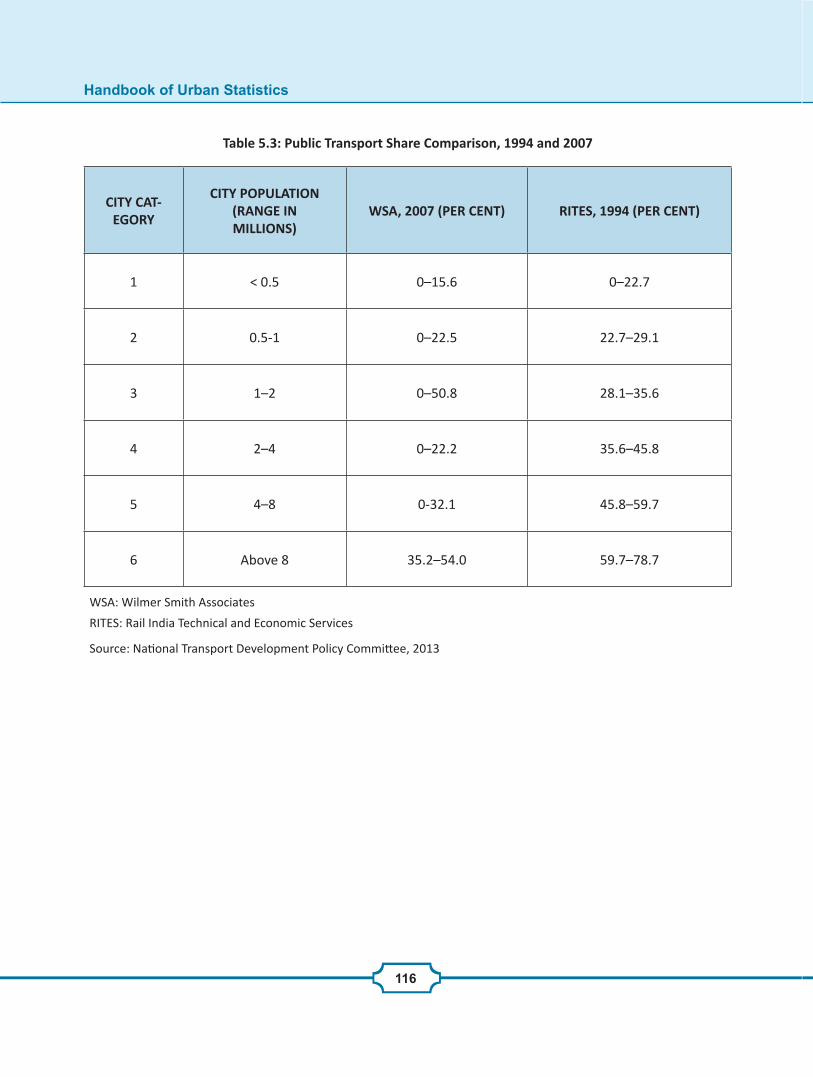
Handbook of Urban Statistics
116
Table 5.3: Public Transport Share Comparison, 1994 and 2007
CITY CAT-EGORY
CITY POPULATION (RANGE IN MILLIONS)
wSA, 2007 (PER CENT) RITES, 1994 (PER CENT)
1 < 0.5 0–15.6 0–22.7
2 0.5-1 0–22.5 22.7–29.1
3 1–2 0–50.8 28.1–35.6
4 2–4 0–22.2 35.6–45.8
5 4–8 0-32.1 45.8–59.7
6 Above 8 35.2–54.0 59.7–78.7
WSA: Wilmer Smith Associates
RITES: Rail India Technical and Economic Services
Source: National Transport Development Policy Committee, 2013

Urban Transportation
117
Table 5.4:Desirable Modal Shares for Different City Sizes
CITY SIZE IN MILLIONS
0.05-0.1 0.1-0.5 0.5-1 1.0-2.0 2.0-5.0 >5
Walk 30 30 30 30 25 25
Cycle 25 20 15 12 10 10
Rickshaw 12 10 8 6 1 1
TSR 8 3 5 3 3 1
PT 12 15 15 20 33 38
Cars 1 1 2 4 8 10
MTw 12 21 25 25 20 15
Note: MTW: Motorized Two-Wheeler; PT: Para-Transit; TSR: Three-wheeler Scooter Rickshaws
Source: National Transport Development Policy Committee, 2013

Handbook of Urban Statistics
118
Graph 5.2 : Desirable Modal Shares for Different City Sizes
Source: National Transport Development Policy Committee, 2013

Urban Transportation
119
Table 5.5: Vehicular Penetration in Select Developed and Developing Countries
COUNTRYGROSS NATIONAL
INCOME PER CAPITA 2009 (US $)
PER 1,000 PERSON
PASSENGER CARS TOTAL VEHICLES** TwO wHEELERS
DEVELOPED
US 46,360 439 828 26
UK 41,370 460 544 21
Japan 38,080 617 617 28
Germany 42,620 510 610 46
Australia 40,240 550 717 28
France 42,620 496 654 56
DEVELOPING
Mexico 8,960 191 288 11
Malaysia 7,350 313 675 325
South Africa 5,760 110 170 7
Brazil (*) 8,070 165 275 68
China 3,650 34 119 72
Korea, Rep 19,830 267 393 37
India (##) 1,220 13 117 76
**: India Vehicle include passenger cars, buses + coaches, vans + lorries and Two wheelers(*): Data relates to 2008##: Data relates to 2011
Source: National Transport Development Policy Committee, 2013

Handbook of Urban Statistics
120
Graph 5.3 : Vehicular Penetration-Comparison of BRICS Nation
Source: National Transport Development Policy Committee, 2013

Urban Transportation
121
Table 5.6: Registered Motor Vehicles per 1,000 Population in Million-Plus Indian Cities
CITY MVS/’000 POPULATION (2012)
Agra 366
Bangalore 434
Bhopal 401
Chennai 388
Coimbatore 577
Delhi 332
Greater Mumbai 90
Gwalior 408
Hyderabad 391
Indore 560
Jaipur 551
Jodhpur 559
Kanpur 343
Kochi 193
Kolkata 30
Lucknow 417
Madurai 412
Pune 415
Visakhapatnam 356
Average of 35 Million + cities 293
Source: National Transport Development Policy Committee, 2013

Handbook of Urban Statistics
122
Graph 5.4 : Registered Motor Vehicles per 1,000 Population in Million-Plus Indian Cities
Source: National Transport Development Policy Committee, 2013

Urban Transportation
123
Table 5.7: Comparison of Investment Estimates for Urban Transport by Various Committees (2010-30)(Rs. trillion)
ITEM MGI HPEC wGUT
SPRAwL INTERMEDIARY DESIRED
Urban Roads 8.9 17.29 12.08 9.41 9.17
Transit 17.64 4.49 10.55 7.44 5.56
Others 0.5 0.9 0.15 0.15 0.27
TOTAL 27.04 22.68 22.78 17.00 15.00
MGI: McKinsey Global Institute; HPEC: High-Power Expert Committee, Government of India;
WGUT: Working Group on Urban Transport, NTDPC.
Source: National Transport Development Policy Committee, 2013

Handbook of Urban Statistics
124
Table 5.8: Comparison of Parking Charges in Various Cities, 2011
(CBD daily parking charges in US $)
City Parking Charges
Bangkok 13.2
Beijing 7.05
Bengaluru 1.54
Chennai 0.99
Delhi 1.32
Dubai 4.08
Hong Kong 28.25
London 65.97
Mexico City 15
Mumbai 1.11
New York 41
Singapore 24.59
Tokyo 62
CBD: Central Business District
Source: National Transport Development Policy Committee, 2013

Urban Transportation
125
Table 5.9: Vehicle Population in India(in ‘000)
YEAR(AS ON
31 MARCH)ALL VEHICLES
TwO wHEEL-ERS
CARS, JEEPS AND TAXIS
BUSESGOODS
VEHICLESOTHERS
1951 306 27 159 34 82 4
1956 426 41 203 47 119 16
1961 665 88 310 57 168 42
1966 1,099 226 456 73 259 85
1971 1,865 576 682 94 343 170
1976 2,700 1,057 779 115 351 398
1981 5,391 2,618 1,160 162 554 897
1986 10,577 6,245 1,780 227 863 1,462
1991 21,374 14,200 2,954 331 1,356 2,533
1996 33,786 23,252 4,204 449 2,031 3,850
2001 54,991 38,556 7,058 634 2,948 5,795
2002 58,924 41,581 7,613 635 2,974 6,121
2003 67,007 47,519 8,599 721 3,492 6,676
2004 72,718 51,922 9,451 768 3,749 6,828
2005 81,501 58,799 10,320 892 4,031 7,459
2006 89,618 64,743 11,526 992 4,436 7,921
2007 96,707 69,129 12,649 1,350 5,119 8,460
2008 105,353 75,336 13,950 1,427 5,601 9,039
2009 114,951 82,402 15,313 1,486 6,041 9,709
Source: National Transport Development Policy Committee, 2013

Handbook of Urban Statistics
126
Graph 5.5 : Vehicle Population in India (in ‘000)
Source: National Transport Development Policy Committee, 2013

Urban Transportation
127
Table 5.10: Vehicular Composition in India (%)
YEAR(AS ON
31 MARCH 2013)ALL VEHICLES TwO wHEELERS
CARS, JEEPS
AND TAXISBUSES
GOODS VEHICLES
OTHERS
1956 100 9.6 47.7 11 27.9 3.8
1961 100 13.2 46.6 8.6 25.3 6.3
1966 100 20.6 41.5 6.6 23.6 7.7
1971 100 30.9 36.6 5 18.4 9.1
1976 100 39.1 28.9 4.3 13 14.7
1981 100 48.6 21.5 3 10.3 16.6
1986 100 59 16.8 2.1 8.2 13.8
1991 100 66.4 13.8 1.5 6.3 11.9
1996 100 68.8 12.4 1.3 6 11.4
2001 100 70.1 12.8 1.2 5.4 10.5
2002 100 70.6 12.9 1.1 5 10.4
2003 100 70.9 12.8 1.1 5.2 10
2004 100 71.4 13 1.1 5.2 9.4
2005 100 72.1 12.7 1.1 4.9 9.2
2006 100 72.2 12.9 1.1 4.9 8.8
2007 100 71.5 13.1 1.4 5.3 8.7
2008 100 71.5 13.2 1.4 5.3 8.6
2009 100 71.7 13.3 1.3 5.3 8.4
2011 100 71.8 13.6 1.1 5 8.5
Source: National Transport Development Policy Committee, 2013

Handbook of Urban Statistics
128
Graph 5.6 : Vehicular Composition in India (Per Cent)
Source: National Transport Development Policy Committee, 2013

Urban Transportation
129
Table 5.11: METRO RAIL PROJECTS APPROVED BY GOVERNMENT OF INDIA(as on August, 2015)
S. NO.
PROJECT STRETCH/LENGTH IN KM.LENGTH
(KM)
APPROVED PROJECT
COST(Rs. cr.)
CENTRAL GOVT. FUNDING*
(Rs. cr.)
1. Delhi Metro Rail Project-Delhi & NCR
Delhi MRTS Phase-I 65.10 10,571.00 1,716.00
Delhi MRTS Phase-II 54.68 11,691.36 2,634.70
Delhi Metro Extension from New Ashok Nagar to Noida Sec. 32
7.00 827.00 191.20
Delhi Metro Extension from Ambedkar Nagar to Sushant Lok in Gurgaon
14.47 1589.44 326.09
Delhi Metro Extension to Vaishali, Ghaziabad
2.574 320.00 -
Airport Express Line (Public Private Partnership mode)
22.7 4,379.39 995.42
Delhi MRTS Phase-III 103.05 35,242.00 6,298.50
Delhi Metro Extension from Badarpur to YMCA Chowk, Faridabad
13.88 2,494.00 536.60
Delhi Metro Extension from Mundka to Bahadurgarh
11.182 1,991.00 445.50
Central Secretariat to Badarpur 20.16 4,012.00 895.00
Metro Link from Dwarka Sector-9 to Sector-21
2.76 356.11 -
Delhi Metro extension from Dwarka to Najafgarh
5.50 1,070.00 352.50
2. Bangalore Metro Project- Phase – IKarnataka
East-West Corridor (Bayappanahalli to Mysore Road)North-South Corridor (Yeshwanthpur to R.V. Road Jayanagar)Extension –Yeshwanthapur to HesaraghattaExtension- RV Road Terminal to Puttenahally Cross
42.30 13,845.01 3,073.20

Handbook of Urban Statistics
130
3. Bangalore Metro Project- Phase – IIKarnataka
Extension of E-W line. Mysore Road Terminal to Kengeri Extension of E-W lineBaiyappanahalli to ITPL – Whitefield Extension of N-S line.Hesaraghatta Cross to BIEC Extension of N-S line Puttenahalli Cross to Anjanapura Township (up to NICE Road).New Line – N-S IIMB to Nagawara. New Line - E-WR.V. Road to Bommasandra.
72.1 26,405.14 5,281.00
4. Chennai Metro Rail ProjectTamil Nadu
Corridor I from Washermanpet to Chennai Airport & Corridor II from Chennai Central to St. Thomas Mount.
45.05 14,600.00 2,920.00
5. Kochi Metro Rail Project- Kerala
Alwaye to Petta. 25.61 5,181.79 1,002.23
6. Ahmadabad Metro Rail Project- Phase-1 Gujarat
North South Corridor: APMC – Motera Stadium
35.96 10,773.00 1,990.00
East West Corridor: Thaltej Gam – Vastral Gam.
7. Nagpur Metro Rail ProjectMaharashtra
Line 1 (North South corridor) :Automotive Square – MIHAN Line 2 (East West corridor) Prajapati Nagar – Lokmanya Nagar.
38.22 8,680.00 1,555.00
8. Mumbai Metro Line-III Mumbai Metro Line 3 (Colaba – Bandra – SEEPZ).
33.50 23,136.00 3,427.20
9. Jaipur Metro Phase –IRajasthan
Mansarover to Badi Chaupar. 12.067 3,149.00 630.00
10. Kolkata Metro Corridor(Under Ministry of Railways)
Dum Dum- Tollyganj Desin & construction of rapid transit system including extension between Tollyganj- Garia, Dum Dum Barangar & Noapara –NSCB Airport.Noapara to Barasat Via Bimanbandwar.Baranagar- Barrackpore-Dakshineshwar.NSCB Airport to New Garia Via Rajarhat.Joka to Binoy Badal Dinesh bagh via Majerhat.Howarh Maidan to Salt lake
36.55
18.0014.5032.0018.72
14.67
3,829.77
3,159.002,069.604,259.502,913.50
4,874.58
3,403.47
3,159.592,069.604,259.502,913.50
2,681.5811. Mumbai Metro Line-I Versova-Andheri-Ghatkopar.(PPP Mode) 11.40 2,356.00 471.00

Urban Transportation
131
12. Mumbai Metro Line-II^^
Charkop – Bandra – Mankhurd Corridor.(PPP Mode)
31.87 7,660.00 1,532.00
13. Hyderabad Metro Miyapur-LB Nagar.JBS-Falaknuma.Nagole- Shiparama.(PPP Mode)
71.16 14,132.00 1,458.00
14. Metro Link between Sikanderpur and NH-8 Gurgaon, Haryana
Sikanderpur and NH-8.(Private Ownership)
5.10 1,088.00 -
15. Extension of Metro Link from Sikanderpur to Sector-56 Gurgaon
Sikanderpur to Sector-56(Private Ownership)
7.00 2,143.00 -
* Central Govt. funding includes equity/subordinate debt/grant/viability gap funding but excludes sovereign loan from multilateral/bilateral agencies.
^^ The Concession Agreement between Mumbai Metro Transport Pvt. Ltd and Mumbai Metropolitan Region Develop-ment has been terminated with mutual consent of both the parties.
Source: Ministry of Urban Development, Government of India

Handbook of Urban Statistics
132
Table 5.12: AVERAGE NUMBER OF PASSENGERS TRAVELLED IN METRO RAIL
A. DELHI METRO RAIL PROJECT
Metro LineAverage per day ridership
2014-15 2015-16 (April-September)
Line 1 341,726 360,007
Line 2 833,342 891,333
Line 3&4 915,922 973,542
Line 5 93,355 97,957
Line 6 187,479 220,710
Line 9* 14,231 12,489
Airport Line 16,706 22,391
Total 2,402,761 2,578,429
* As there is common ticketing system for Rapid Metro and DMRC, passengers of Rapid Metro who either enter or exit from DMRC network, are added in DMRC Ridership
B. BANGALORE METRO RAIL PROJECT
Metro LineAverage per day ridership
2014-15 2015-16 (April-September)
Line-1 17,000 18,056
Line-2 18,000 25,313
Total 35,000 43,369
Source: Ministry of Urban Development, Government of India

Urban Transportation
133
Table 5.13: REVENUES OF METRO RAIL IN VARIOUS CITIES
Metro Rail ProjectRevenue Earned (Rs. In crore)
2012-13 2013-14 2014-15
Delhi Metro Rail Project 2,687.48 3,198.02 3,562.27
Bangalore Metro Rail Project 13.64 18.08 37.24
Chennai Metro Rail Project* - - -
*The first phase of the project has started commercial operation w.e.f. 29.06.2015. Upto June, 2015, Rs.2.07 crore rev-enue has been earned.
Source: Ministry of Urban Development, Government of India


Urban Sanitation
6Chapter


Urban Sanitation
137
Urban Sanitation
Universalization of good sanitation and drainage system is a necessary requirement to ensure
betterment of community health and hygiene. The chapters present data on availability of bathing
facility, type of drainage system, availability and type of latrine facility. A comparison of the 2001 and
2011 Census figures has been made to facilitate understanding the progress during the decade.
The level of urbanization in the country as a whole increased from 25.7% in 1991 to 27.82% in 2001
and to 31.14% in 2011. Cities act as beacons for the rural population as they provide a higher standard
of living and offer opportunities not available in rural areas. This results in large scale migration
from rural to urban areas. Negative consequences of urban pull often results in growth of slums
characterized by housing shortage and critical infrastructure inadequacies.
Table 6.1 provides details of Bathing and Drainage Facilities from 2001 to 2011. Bathing facility within
house was 70% in 2001 which increased to 87% in 2011. Households having drainage facility in
2001 was 78% which also increased to 82% in 2011. Chandigarh, Maharashtra, Karnataka and Delhi
are some of the states which have decent percentage of households having bathroom and drainage
facility. Tables 6.2 and 6.3 provide data on urban household latrine availability as per 2001 and 2011
census. In 2001, 26% of households had no latrine facility available within the house, which decreased
to 18.60 % in 2011.
The Government of India has launched the Swachh Bharat Mission (SBM) on 2nd October, 2014,
with a target to make the country clean by 2nd October, 2019. Table 6.4 provides State-wise Status
implementation of various component such as individual household toilets, community toilets, public
toilets, municipal solid waste management etc. under Swachh Bharat Mission up to end - August,
2015. Table 6.5 contains sanitation ranking of 476 Class I Cities based on SBM Indicators.

Handbook of Urban Statistics
138
Table 6.1: Bathing and Drainage Facilities, 2001-11
S.No. States/UTs
2001 2011
Percentage of HHs having
bathroom facility within premises
Percentage of HHs having
Drainage facility
Percentage of HHs having bathing
facility within the premises
Percentage of HHs having
drainage facility
1 Andaman & Nicobar Islands 78.18 74.13 93.87 86.042 Andhra Pradesh 78.48 82.29 92.61 88.263 Arunachal Pradesh 53.93 63.26 80.65 66.214 Assam 52.98 52.62 84.54 56.355 Bihar 43.13 68.61 68.63 71.396 Chandigarh 78.38 89.89 89.72 967 Chhattisgarh 51.88 62.96 67.36 68.98 Dadra & Nagar Haveli 69.01 52.18 89.99 62.79 Daman & Diu 86.96 50.87 84.17 77.24
10 Goa 77.21 69.03 94.91 77.9611 Gujarat 80.62 78.29 90.45 82.6412 Haryana 75.41 88.41 92.63 92.2513 Himachal Pradesh 74.93 86.08 92.8 93.5614 Jammu & Kashmir 77.74 81.84 91.38 83.1215 Jharkhand 54.55 72.36 69.8 70.816 Karnataka 79.15 80.97 96.39 87.617 Kerala 78.91 30.89 92.87 54.5518 Lakshadweep 84.78 0 97.64 25.9319 Madhya Pradesh 63.21 75.93 85.35 82.3420 Maharashtra 81.6 87.58 95.36 91.1521 Manipur 16.35 57.14 65.74 70.422 Meghalaya 69.81 76.66 79.9 80.3423 Mizoram 64.8 63 89.72 79.4824 Nagaland 58.29 72.24 94.38 76.5225 NCT of Delhi 71.72 91.04 91.28 96.0426 Odisha 48.94 57.49 64.33 59.0427 Puducherry 70.94 68.07 91.98 82.5828 Punjab 82.76 89.77 94.82 90.929 Rajasthan 71.4 80.19 89.18 86.0430 Sikkim 83.38 94.19 91.99 92.1231 Tamil Nadu 66.42 70.02 85.17 74.9432 Tripura 43.37 53.06 63.96 53.4533 Uttar Pradesh 63.76 92.38 84.61 93.3634 Uttarakhand 77.87 88.24 93.1 92.935 West Bengal 58.56 67.14 70.66 66.83
INDIA 70.40 77.87 86.98 81.77
HHs: Households
Source: Census of India-2001 & 2011

Urban Sanitation
139
Gra
ph 6
.1: P
erce
ntag
e of
Hou
seho
lds
havi
ng b
athr
oom
faci
lity
wit
hin
prem
ises
Sour
ce: C
ensu
s of
Indi
a-20
01 &
201
1

Handbook of Urban Statistics
140
Gra
ph 6
.2: P
erce
ntag
e of
Hou
seho
lds
havi
ng d
rain
age
faci
lity
Sour
ce: C
ensu
s of
Indi
a-20
01 &
201
1

Urban Sanitation
141
Table 6.2 Urban Household Latrine Availability Data as per 2001 Census (%)
S. No. State / UT Water Closet* Pit LatrineOther
Latrine#Total HHs
with Latrines No Latrine1 Andaman & Nicobar islands 58.69 6.74 11.06 76.49 23.512 Andhra Pradesh 46.97 15.1 16 78.07 21.933 Arunachal Pradesh 28.06 32.08 26.82 86.95 13.054 Assam 58.88 26.39 9.33 94.6 5.45 Bihar 43.45 11.37 14.88 69.69 30.316 Chandigarh 70.77 1.02 8.28 80.07 19.937 Chhattisgarh 38.82 5.15 8.62 52.59 47.418 Dadra & Nagar Haveli 71.58 3.47 2.15 77.2 22.89 Daman & Diu 60.55 3.42 1.46 65.43 34.57
10 Goa 38.88 18.74 11.61 69.23 30.7711 Gujarat 62.11 9.75 8.69 80.55 19.4512 Haryana 30.99 26.48 23.19 80.66 19.3413 Himachal Pradesh 49.72 11.99 15.51 77.22 22.7814 Jammu & Kashmir 26.54 20.17 40.17 86.87 13.1315 Jharkhand 41.24 7.41 18.03 66.68 33.3216 Karnataka 44.86 20.7 9.67 75.23 24.7717 Kerala 74.76 11.11 6.16 92.02 7.9818 Lakshadweep 70.17 0.77 12.83 83.77 16.2319 Madhya Pradesh 41.1 11.89 14.74 67.74 3.2620 Maharashtra 44.37 7.08 6.63 58.08 41.9221 Manipur 20.55 66.96 7.8 95.31 4.6922 Meghalaya 43.54 33.13 14.91 91.58 8.4223 Mizoram 34.52 54.5 9.01 98.03 1.9724 Nagaland 19.87 40.47 33.78 94.12 5.8825 NCT of Delhi 47.36 15.18 16.49 79.03 20.9726 Odisha 43.05 9.48 7.15 59.69 40.3127 Puducherry 59.4 2.19 3.44 65.03 34.9728 Punjab 46.52 20.53 19.48 86.52 13.4829 Rajasthan 40.58 18.21 17.33 76.11 23.8930 Sikkim 86.99 1.93 2.87 91.79 8.2131 Tamil Nadu 45.47 11.16 7.71 64.33 35.6732 Tripura 43.13 44.8 9.03 96.96 3.0433 Uttar Pradesh 31.98 18.07 29.96 80.01 19.9934 Uttarakhand 40.82 26.72 19.35 86.88 13.1235 West Bengal 55.2 22.89 6.76 84.85 15.15
INDIA 46.12 14.60 13.00 73.72 26.28
HHs: Households
Note: * Water Closet-Flush/Pour Flush Latrine connected to Piped Sewer/Septic Tank/Others
# Other Latrines include night soil disposed into open drains and service latrines.
Source: Census of India-2001

Handbook of Urban Statistics
142
Table 6.3 Urban Household Latrine Availability Data as per 2011 Census (%)
S. No. State / UT Water Closet Pit Latrine Other LatrineTotal HHs with
Latrines No Latrine
1 Andaman & Nicobar Island 86.80 0.20 0.10 87.10 12.90
2 Andhra Pradesh 79.40 4.10 2.60 86.10 13.90
3 Arunachal Pradesh 74.90 13.90 0.70 89.50 10.50
4 Assam 71.00 21.00 1.70 93.70 6.30
5 Bihar 63.40 4.60 1.00 69.00 31.00
6 Chandigarh 87.00 0.50 0.10 87.60 12.40
7 Chhattisgarh 58.70 1.10 0.40 60.20 39.80
8 Dadra & Nagar Haveli 80.30 0.70 0.30 81.30 18.70
9 Daman & Diu 84.20 1.10 0.10 85.40 14.60
10 Goa 80.60 3.50 1.10 85.20 14.70
11 Gujarat 85.20 2.10 0.40 87.70 12.30
12 Haryana 80.50 7.70 1.70 89.90 10.10
13 Himachal Pradesh 87.00 0.80 1.30 89.10 10.90
14 Jammu & Kashmir 68.50 4.30 14.70 87.50 12.50
15 Jharkhand 64.70 1.80 0.60 67.10 32.80
16 Karnataka 71.60 12.00 1.40 85.00 15.10
17 Kerala 75.30 21.90 0.30 97.50 2.60
18 Lakshadweep 97.20 0.50 0.00 97.70 2.30
19 Madhya Pradesh 71.50 1.70 1.00 74.20 25.80
20 Maharashtra 67.30 2.40 1.60 71.30 28.70
21 Manipur 63.70 23.30 8.80 95.80 4.20
22 Meghalaya 82.90 12.30 0.60 95.80 4.30
23 Mizoram 80.90 17.20 0.50 98.60 1.50
24 Nagaland 79.10 15.00 0.50 94.60 5.40
25 NCT of Delhi 86.00 1.70 2.10 89.80 10.20
26 Odisha 58.80 4.20 1.80 64.80 35.20
27 Puducherry 81.10 0.60 0.30 82.00 18.00
28 Punjab 85.60 6.80 1.00 93.40 6.60
29 Rajasthan 73.70 5.40 2.90 82.00 18.00
30 Sikkim 91.80 3.30 0.10 95.20 4.80
31 Tamil Nadu 66.50 6.80 1.80 75.10 24.90
32 Tripura 50.00 47.00 0.90 97.90 2.10
33 Uttar Pradesh 77.20 2.90 3.00 83.10 16.90
34 Uttarakhand 85.90 6.50 1.10 93.50 6.40
35 West Bengal 61.60 22.50 0.90 85.00 15.00
INDIA 72.60 7.10 1.70 81.40 18.60HHs: HouseholdsNote: * Water Closet-Flush/Pour Flush Latrine connected to Piped Sewer/Septic Tank/Others# Other Latrines include night soil disposed into open drains and service latrines.
Source: Census of India-2001

Urban Sanitation
143
Graph 6.3: Urban Household Latrine Availability Data as per Census (%) (2001)
Source: Census of India, 2001
Graph 6.4: Urban Household Latrine Availability Data as per Census (%) (2011)
Source: Census of India, 2011
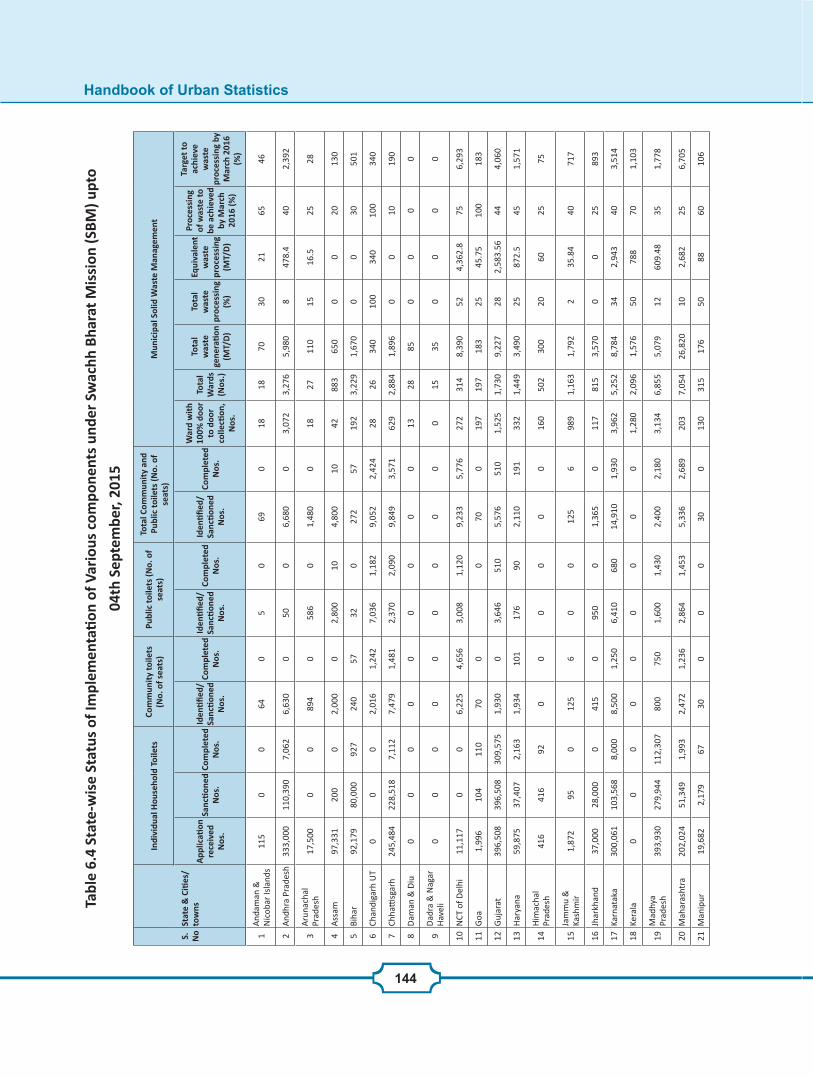
Handbook of Urban Statistics
144
Tabl
e 6.
4 St
ate-
wis
e St
atus
of I
mpl
emen
tati
on o
f Var
ious
com
pone
nts
unde
r Sw
achh
Bha
rat M
issi
on (S
BM) u
pto
04th
Sep
tem
ber,
2015
S. No
Stat
e &
Citi
es/
tow
ns
Indi
vidu
al H
ouse
hold
Toi
lets
Com
mun
ity
toile
ts
(No.
of s
eats
)Pu
blic
toile
ts (N
o. o
f se
ats)
Tota
l Com
mun
ity
and
Publ
ic to
ilets
(No.
of
seat
s)M
unic
ipal
Sol
id W
aste
Man
agem
ent
App
licati
on
rece
ived
N
os.
Sanc
tion
ed
Nos
.Co
mpl
eted
N
os.
Iden
tifie
d/
Sanc
tion
ed
Nos
.
Com
plet
ed
Nos
.
Iden
tifie
d/
Sanc
tion
ed
Nos
.
Com
plet
ed
Nos
.
Iden
tifie
d/
Sanc
tion
ed
Nos
.
Com
plet
ed
Nos
.
war
d w
ith
100%
doo
r to
doo
r co
llecti
on,
Nos
.
Tota
l W
ards
(N
os.)
Tota
l w
aste
ge
nera
tion
(M
T/D
)
Tota
l w
aste
pr
oces
sing
(%
)
Equi
vale
nt
was
te
proc
essi
ng
(MT/
D)
Proc
essi
ng
of w
aste
to
be a
chie
ved
by M
arch
20
16 (%
)
Targ
et to
ac
hiev
e w
aste
pr
oces
sing
by
Mar
ch 2
016
(%)
1A
ndam
an &
N
icob
ar Is
land
s11
50
064
05
069
018
1870
3021
6546
2A
ndhr
a Pr
ades
h33
3,00
011
0,39
07,
062
6,63
00
500
6,68
00
3,07
23,
276
5,98
08
478.
440
2,39
2
3A
runa
chal
Pr
ades
h17
,500
00
894
058
60
1,48
00
1827
110
1516
.525
28
4A
ssam
97,3
3120
00
2,00
00
2,80
010
4,80
010
4288
365
00
020
130
5Bi
har
92,1
7980
,000
927
240
5732
027
257
192
3,22
91,
670
00
3050
1
6Ch
andi
garh
UT
00
02,
016
1,24
27,
036
1,18
29,
052
2,42
428
2634
010
034
010
034
0
7Ch
hatti
sgar
h24
5,48
422
8,51
87,
112
7,47
91,
481
2,37
02,
090
9,84
93,
571
629
2,88
41,
896
00
1019
0
8D
aman
& D
iu0
00
00
00
00
1328
850
00
0
9D
adra
& N
agar
Hav
eli
00
00
00
00
00
1535
00
00
10N
CT o
f Del
hi11
,117
00
6,22
54,
656
3,00
81,
120
9,23
35,
776
272
314
8,39
052
4,36
2.8
756,
293
11G
oa1,
996
104
110
700
070
019
719
718
325
45.7
510
018
3
12G
ujar
at39
6,50
839
6,50
830
9,57
51,
930
03,
646
510
5,57
651
01,
525
1,73
09,
227
282,
583.
5644
4,06
0
13H
arya
na59
,875
37,4
072,
163
1,93
410
117
690
2,11
019
133
21,
449
3,49
025
872.
545
1,57
1
14H
imac
hal
Prad
esh
416
416
920
00
00
016
050
230
020
6025
75
15Ja
mm
u &
Ka
shm
ir1,
872
950
125
60
012
56
989
1,16
31,
792
235
.84
4071
7
16Jh
arkh
and
37,0
0028
,000
041
50
950
01,
365
011
781
53,
570
00
2589
3
17Ka
rnat
aka
300,
061
103,
568
8,00
08,
500
1,25
06,
410
680
14,9
101,
930
3,96
25,
252
8,78
434
2,94
340
3,51
4
18Ke
rala
00
00
00
00
01,
280
2,09
61,
576
5078
870
1,10
3
19M
adhy
a Pr
ades
h39
3,93
027
9,94
411
2,30
780
075
01,
600
1,43
02,
400
2,18
03,
134
6,85
55,
079
1260
9.48
351,
778
20M
ahar
asht
ra20
2,02
451
,349
1,99
32,
472
1,23
62,
864
1,45
35,
336
2,68
920
37,
054
26,8
2010
2,68
225
6,70
5
21M
anip
ur19
,682
2,17
967
300
00
300
130
315
176
5088
6010
6

Urban Sanitation
145
S. No
Stat
e &
Citi
es/
tow
ns
Indi
vidu
al H
ouse
hold
Toi
lets
Com
mun
ity
toile
ts
(No.
of s
eats
)Pu
blic
toile
ts (N
o. o
f se
ats)
Tota
l Com
mun
ity
and
Publ
ic to
ilets
(No.
of
seat
s)M
unic
ipal
Sol
id W
aste
Man
agem
ent
App
licati
on
rece
ived
N
os.
Sanc
tion
ed
Nos
.Co
mpl
eted
N
os.
Iden
tifie
d/
Sanc
tion
ed
Nos
.
Com
plet
ed
Nos
.
Iden
tifie
d/
Sanc
tion
ed
Nos
.
Com
plet
ed
Nos
.
Iden
tifie
d/
Sanc
tion
ed
Nos
.
Com
plet
ed
Nos
.
war
d w
ith
100%
doo
r to
doo
r co
llecti
on,
Nos
.
Tota
l W
ards
(N
os.)
Tota
l w
aste
ge
nera
tion
(M
T/D
)
Tota
l w
aste
pr
oces
sing
(%
)
Equi
vale
nt
was
te
proc
essi
ng
(MT/
D)
Proc
essi
ng
of w
aste
to
be a
chie
ved
by M
arch
20
16 (%
)
Targ
et to
ac
hiev
e w
aste
pr
oces
sing
by
Mar
ch 2
016
(%)
22M
egha
laya
3,10
50
023
017
00
193
06
114
268
5815
5.44
8422
5
23M
izor
am2,
000
550
300
305
3018
6023
6619
355
24
22.0
820
110
24N
agal
and
9,33
00
00
00
00
016
523
427
00
025
68
25O
dish
a62
1,25
010
3,00
01,
000
420
420
1,81
015
02,
230
570
300
1,01
22,
460
249
.250
1,23
0
26Pu
duch
erry
UT
6,59
06,
590
800
100
3310
00
200
3360
129
495
2099
6029
7
27Pu
njab
37,3
6213
,482
7,48
02,
040
01,
158
03,
198
01,
500
2,47
93,
900
1039
050
1,95
0
28Ra
jast
han
95,0
0070
,000
3,80
02,
800
730
300
300
3,10
01,
030
825
5,02
25,
037
1575
5.55
653,
274
29Si
kkim
1,29
040
08
80
08
84
4849
00
2010
30Ta
mil
Nad
u77
,879
00
7,11
62,
048
00
7,11
62,
048
9,93
513
,667
14,5
3215
2,17
9.8
253,
633
31Te
lang
ana
227,
139
75,9
6192
51,
220
375
1,64
078
02,
860
1,15
590
21,
862
5,52
048
2,64
9.6
603,
312
32Tr
ipur
a0
00
00
00
00
024
440
70
00
0
33U
ttar
Pra
desh
106,
501
23,7
3886
263
50
436
01,
071
032
011
,290
19,1
8013
2,49
3.4
275,
179
34U
ttar
akha
nd25
,953
20,8
1676
1,15
022
110
01,
260
2287
706
1,01
30.
55.
0725
253
35W
est B
enga
l12
,200
12,2
000
00
00
00
1,13
02,
875
8,67
40
00
0
Tota
l/A
vera
ge
3,43
5,68
91,
645,
055
464,
651
57,3
6614
,420
37,2
879,
813
94,6
5324
,233
31,5
9078
,003
142,
580
17.3
424
,725
.135
.18
50,1
61.5
5
Sour
ce: M
inis
try
of U
rban
dev
elop
men
t, G
over
nmen
t of I
ndia
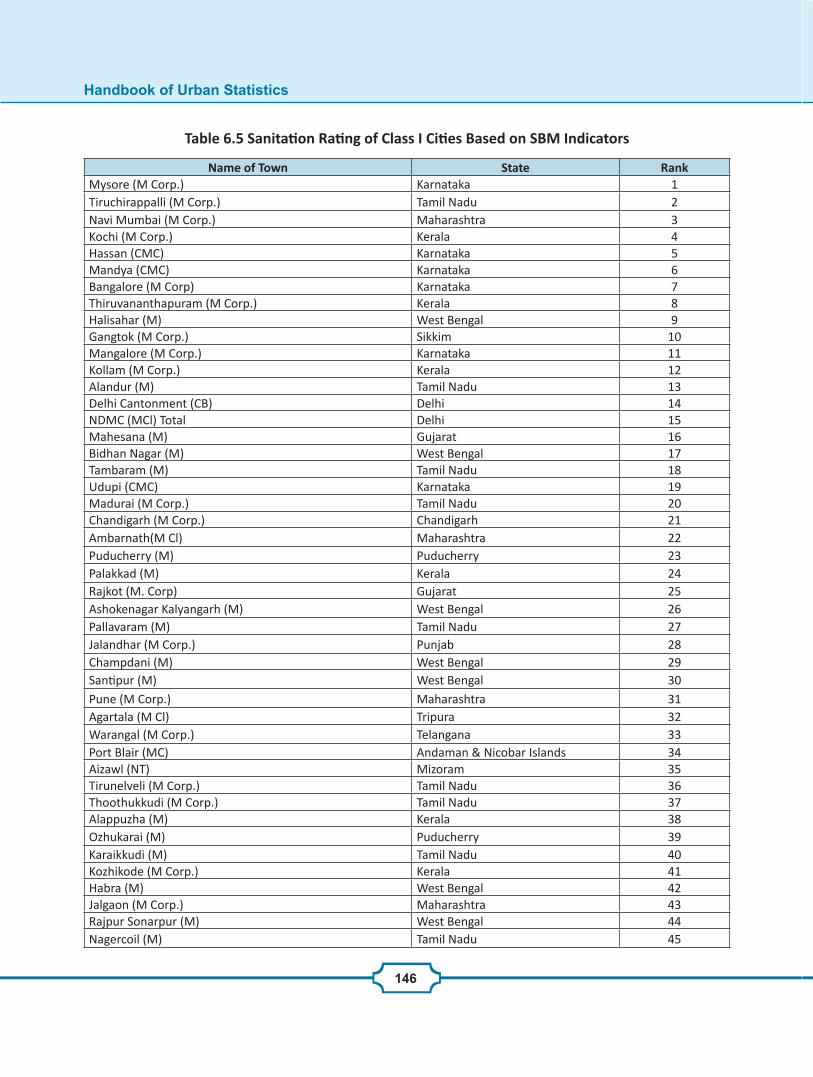
Handbook of Urban Statistics
146
Table 6.5 Sanitation Rating of Class I Cities Based on SBM Indicators
Name of Town State RankMysore (M Corp.) Karnataka 1Tiruchirappalli (M Corp.) Tamil Nadu 2Navi Mumbai (M Corp.) Maharashtra 3Kochi (M Corp.) Kerala 4Hassan (CMC) Karnataka 5Mandya (CMC) Karnataka 6Bangalore (M Corp) Karnataka 7Thiruvananthapuram (M Corp.) Kerala 8Halisahar (M) West Bengal 9Gangtok (M Corp.) Sikkim 10Mangalore (M Corp.) Karnataka 11Kollam (M Corp.) Kerala 12Alandur (M) Tamil Nadu 13Delhi Cantonment (CB) Delhi 14NDMC (MCl) Total Delhi 15Mahesana (M) Gujarat 16Bidhan Nagar (M) West Bengal 17Tambaram (M) Tamil Nadu 18Udupi (CMC) Karnataka 19Madurai (M Corp.) Tamil Nadu 20Chandigarh (M Corp.) Chandigarh 21Ambarnath(M Cl) Maharashtra 22Puducherry (M) Puducherry 23Palakkad (M) Kerala 24Rajkot (M. Corp) Gujarat 25Ashokenagar Kalyangarh (M) West Bengal 26Pallavaram (M) Tamil Nadu 27Jalandhar (M Corp.) Punjab 28Champdani (M) West Bengal 29Santipur (M) West Bengal 30Pune (M Corp.) Maharashtra 31Agartala (M Cl) Tripura 32Warangal (M Corp.) Telangana 33Port Blair (MC) Andaman & Nicobar Islands 34Aizawl (NT) Mizoram 35Tirunelveli (M Corp.) Tamil Nadu 36Thoothukkudi (M Corp.) Tamil Nadu 37Alappuzha (M) Kerala 38Ozhukarai (M) Puducherry 39Karaikkudi (M) Tamil Nadu 40Kozhikode (M Corp.) Kerala 41Habra (M) West Bengal 42Jalgaon (M Corp.) Maharashtra 43Rajpur Sonarpur (M) West Bengal 44Nagercoil (M) Tamil Nadu 45

Urban Sanitation
147
Name of Town State RankBidar (CMC) Karnataka 46Dibrugarh (MB) Assam 47South Dum Dum (M) West Bengal 48Uluberia (M) West Bengal 49Nagapattinam (M) Tamil Nadu 50Guwahati (M Corp.) Assam 51Rajapalayam (M) Tamil Nadu 52Bhadreswar (M) West Bengal 53Chhindwara (M) Madhya Pradesh 54Ambur (M) Tamil Nadu 55Kolkata (M Corp.) West Bengal 56Chikmagalur (CMC) Karnataka 57Vizianagaram (M) Andhra Pradesh 58Narasaraopet (M) Andhra Pradesh 59Chennai (M Corp.) Tamil Nadu 60Bally (M) West Bengal 61Morvi (M) Gujarat 62Surat (M Corp.) Gujarat 63Nabadwip (M) West Bengal 64Davanagere (M Corp.) Karnataka 65Bhavnagar (M Corp.) Gujarat 66Thrissur (M Corp) Kerala 67Khardaha (M) West Bengal 68Barddhaman (M) West Bengal 69Guntur (M Corp.) Andhra Pradesh 70Jamnagar (M Corp.) Gujarat 71Robertson Pet (CMC) Karnataka 72Thanjavur (M) Tamil Nadu 73South Dum Dum (M) West Bengal 74Kamarhati (M) West Bengal 75Dimapur (MC) Nagaland 76Hugli-Chinsurah (M) West Bengal 77Kanchrapara (M) West Bengal 78Ahmadabad (M Corp.) Gujarat 79Nashik (M Corp.) Maharashtra 80Tiruppur (M Corp.) Tamil Nadu 81Nizamabad (M Corp.) Telangana 82Imphal (M Cl) Manipur 83S.A.S. Nagar (M Cl) Punjab 84Etawah (NPP) Uttar Pradesh 85English Bazar (M) West Bengal 86Raiganj (M) West Bengal 87Dewas (M Corp.) Madhya Pradesh 88Rajarhat Gopalpur (M) West Bengal 89Shimla (M Corp.) Himachal Pradesh 90Kalol (M) Gujarat 91Baidyabati (M) West Bengal 92Baranagar (M) West Bengal 93Bokaro Steel City (CT) Jharkhand 94

Handbook of Urban Statistics
148
Name of Town State RankBilaspur (M Corp.) Chhattisgarh 95Siliguri (M Corp.) West Bengal 96Porbandar (M) Gujarat 97Pimpri-Chinchwad (M Corp.) Maharashtra 98Ratlam (M Corp.) Madhya Pradesh 99Nagaon (MB) Assam 100Tumkur (CMC) Karnataka 101Madhyamgram (M) West Bengal 102Chandrapur (M Cl) Maharashtra 103North Dum Dum (M) West Bengal 104Bhopal (M Corp.) Madhya Pradesh 105Mira-Bhayandar (M Corp.) Maharashtra 106Medinipur (M) West Bengal 107Raichur (CMC) Karnataka 108Jamshedpur (NAC) Jharkhand 109Cuddalore (M) Tamil Nadu 110Ranibennur (CMC) Karnataka 111Basirhat (M) West Bengal 112Bhadravati (CMC) Karnataka 113Kalyani (M) West Bengal 114Anantnag (M Cl) Jammu & Kashmir 115Kanpur (CB) Uttar Pradesh 116Erode (M Corp.) Tamil Nadu 117Vasai Virar City (M Corp.) Mahashtra 118Haldia (M) West Bengal 119Shillong (MB) Meghalaya 120Tiruvannamalai (M) Tamil Nadu 121Haora (M Corp.) West Bengal 122Shimoga (CMC) Karnataka 123Kolar (CMC) Karnataka 124Aligarh (M Corp.) Uttar Pradesh 125Seoni (M) Madhya Pradesh 126North Barrackpur (M) West Bengal 127Titagarh (M) West Bengal 128Darjiling (M) West Bengal 129Singrauli (M Corp.) Madhya Pradesh 130Bathinda (M Corp.) Punjab 131Godhra (M) Gujarat 132Rishra (M) West Bengal 133Shamli (NPP) Uttar Pradesh 134Hosur (M) Tamil Nadu 135Belgaum. (M Corp) Karnataka 136Tirupati (M Corp.) Andhra Pradesh 137Ghaziabad (M Corp.) Uttar Pradesh 138Panihati (M) West Bengal 139Greater Mumbai (M Corp.) Maharashtra 140Bhatpara (M) West Bengal 141Ramagundam (M) Telangana 142Pilibhit (NPP) Uttar Pradesh 143

Urban Sanitation
149
Name of Town State RankAmbattur (M) Tamil Nadu 144Agra (M Corp.) Uttar Pradesh 145Barrackpur (M) West Bengal 146Baharampur (M) West Bengal 147Adoni (M) Andhra Pradesh 148Indore (M Corp.) Madhya Pradesh 149Muzaffarpur (M Corp.) Bihar 150Gonda (NPP) Uttar Pradesh 151Srinagar (M Corp.) Jammu & Kashmir 152Naihati (M) West Bengal 153Amreli (M) Gujarat 154Biharsharif (M Corp.) Bihar 155Nellore (M Corp.) Andhra Pradesh 156Srikakulam (M) Andhra Pradesh 157Kolhapur (M Corp.) Maharashtra 158Bongaon (M) West Bengal 159Maheshtala (M) West Bengal 160Madhavaram (M) Tamil Nadu 161Uttarpara Kotrung (M) West Bengal 162Satna (M Corp.) Madhya Pradesh 163Ahmadnagar (M Corp.) Maharashtra 164Chandannagar (M Corp.) West Bengal 165Tenali (M) Andhra Pradesh 166Botad (M) Gujarat 167Kashipur (NPP) Uttarakhand 168Miryalaguda (M) Telangana 169Durg (M Corp.) Chhattisgarh 170Vellore (M Corp.) Tamil Nadu 171Chitradurga (CMC) Karnataka 172Badlapur (M Cl) Maharashtra 173Patan (M) Gujarat 174Bijapur (CMC) Karnataka 175Chandausi (NPP) Uttar Pradesh 176Anand (M) Gujarat 177Bikaner (M Corp.) Rajasthan 178Bhagalpur (M Corp.) Bihar 179Korba (M Corp.) Chhattisgarh 180Anantapur (M Corp.) Andhra Pradesh 181Jabalpur (M Corp.) Madhya Pradesh 182Bhiwandi (M Corp.) Maharashtra 183Ichalkaranji (M Cl) Maharashtra 184Avadi (M) Tamil Nadu 185Batala (M Cl) Punjab 186Chilakaluripet (M) Andhra Pradesh 187Gulbarga (M Corp.) Karnataka 188Serampore (M) West Bengal 189Aurangabad (NP) Maharashtra 190Secunderabad (CB) Telangana 191Balurghat (M) West Bengal 192

Handbook of Urban Statistics
150
Name of Town State RankBarasat (M) West Bengal 193Satara (M Cl) Maharashtra 194Farrukhabad-cum-Fatehgarh (NP) Uttar Pradesh 195Coimbatore (M Corp.) Tamil Nadu 196Junagadh (M Corp.) Gujarat 197Proddatur (M) Andhra Pradesh 198Durgapur (M Corp.) West Bengal 199Madanapalle (M) Andhra Pradesh 200Solapur (M Corp.) Maharashtra 201Bagalkot (CMC) Karnataka 202Jetpur Navagadh (M) Gujarat 203Kumbakonam (M) Tamil Nadu 204GV MC Andhra Pradesh 205Pathankot (M Cl) Punjab 206Raniganj (M) West Bengal 207Salem (M Corp.) Tamil Nadu 208Loni (NPP) Uttar Pradesh 209Dinapur Nizamat (NP) Bihar 210Kadapa (M Corp.) Andhra Pradesh 211Bundi (M) Rajasthan 212Thane (M Corp.) Maharashtra 213Vadodara (M Corp.) Gujarat 214Osmanabad (M Cl) Maharashtra 215Jamuria (M) West Bengal 216Tiruvottiyur (M) Tamil Nadu 217Jehanabad (NP) Bihar 218Gangawati (CMC) Karnataka 219Lucknow (M Corp.) Uttar Pradesh 220Kharagpur (M) West Bengal 221Asansol (M Corp.) West Bengal 222Ranchi (M Corp.) Jharkhand 223Dharmavaram (M) Andhra Pradesh 224Mainpuri (NPP) Uttar Pradesh 225Baraut (NPP) Uttar Pradesh 226Bankura (M) West Bengal 227Rajahmundry (M Corp.) Andhra Pradesh 228Panchkula (M Cl) (incl.spl) Haryana 229Mahbubnagar (M) Telangana 230Khandwa (M Corp.) Madhya Pradesh 231Unnao (NPP) Uttar Pradesh 232Hathras (NPP) Uttar Pradesh 233Kulti (M) West Bengal 234Hardoi (NPP) Uttar Pradesh 235Haldwani-cum-Kathgodam (NPP Uttarakhand 236Sangli Miraj Kupwad (M Corp.) Maharashtra 237Firozabad (NPP) Uttar Pradesh 238Tadpatri (M) Andhra Pradesh 239Rae Bareli (NPP) Uttar Pradesh 240Kanpur (M Corp.) Uttar Pradesh 241

Urban Sanitation
151
Name of Town State RankHubli-Dharwad (M Corp.) Karnataka 242Karnal (M Cl) Haryana 243Nanded Waghala (M Corp.) Maharashtra 244Modinagar (NPP) Uttar Pradesh 245Gadag-Betigeri (CMC) Karnataka 246Vapi (M) Gujarat 247Budaun (NPP) Uttar Pradesh 248Eluru (M Corp.) Andhra Pradesh 249Sambhal (NPP) Uttar Pradesh 250Kalyan-Dombivli (M Corp.) Maharashtra 251Moradabad (M Corp.) Uttar Pradesh 252Bareilly (M Corp.) Uttar Pradesh 253Kasganj (NPP) Uttar Pradesh 254Valsad (M) Gujarat 255Nagpur (M Corp.) Maharashtra 256Silchar (MB) Assam 257Dehri (NP) Bihar 258Karimnagar (M Corp.) Telangana 259Khanna (M Cl) Punjab 260Sitapur (NPP) Uttar Pradesh 261Jalpaiguri (M) West Bengal 262Shikohabad (NPP) Uttar Pradesh 263Panvel (M Cl) Maharashtra 264Kishanganj (NP) Bihar 265Vijayawada (M Corp.) Andhra Pradesh 266Bhusawal (M Cl) Maharashtra 267Lalitpur (NPP) Uttar Pradesh 268Bellary (M Corp.) Karnataka 269Nandurbar (M Cl) Maharashtra 270Dindigul (M) Tamil Nadu 271Raurkela Industrial Township (IT) Odisha 272Arrah (M Corp.) Bihar 273Navsari (M) Gujarat 274GHMC Telangana 275Hinganghat (M Cl) Maharashtra 276Hospet (CMC) Karnataka 277Fatehpur (NPP) Uttar Pradesh 278Bansberia (M) West Bengal 279Burhanpur (M Corp.) Madhya Pradesh 280Latur (M Cl) Maharashtra 281Bharuch (M) Gujarat 282Suryapet (M) Telangana 283Mango (NAC) Jharkhand 284Datia (M) Madhya Pradesh 285Akola (M Corp.) Maharashtra 286Murwara (Katni) (M Corp.) Madhya Pradesh 287Rohtak (M Cl) Haryana 288Krishnanagar (M) West Bengal 289Kancheepuram (M) Tamil Nadu 290

Handbook of Urban Statistics
152
Name of Town State RankTonk (M Cl) Rajasthan 291Etah (NPP) Uttar Pradesh 292Raipur (M Corp.) Chhattisgarh 293Raigarh (M Corp.) Chhattisgarh 294Bhiwadi (M) Rajasthan 295Cuttack (M Corp.) Odisha 296Munger (M Corp.) Bihar 297Giridih (NP) Jharkhand 298Mathura (NPP) Uttar Pradesh 299Kakinada (M Corp.) Andhra Pradesh 300Machilipatnam (M) Andhra Pradesh 301Hardwar (NPP) Uttarakhand 302Mirzapur-cum-Vindhyachal (NPP) Uttar Pradesh 303Patiala (M Corp.) Punjab 304Nalgonda (M) Telangana 305Jalna (M Cl) Maharashtra 306Orai (NPP) Uttar Pradesh 307Khammam (M) Telangana 308Rampur (NPP) Uttar Pradesh 309Gandhinagar (NA) Gujarat 310Nagda (M) Madhya Pradesh 311Vidisha (M) Madhya Pradesh 312Nagaur (M) Rajasthan 313Gandhidham (M) Gujarat 314Betul (M) Madhya Pradesh 315Sirsa (M Cl) Haryana 316Ulhasnagar (M Corp.) Maharashtra 317Amroha (NPP) Uttar Pradesh 318Moga (M Cl) Punjab 319Barshi (M Cl) Maharashtra 320Nadiad (M) Gujarat 321Guntakal (M) Andhra Pradesh 322Yavatmal (M Cl) Maharashtra 323Jhansi (M Corp.) Uttar Pradesh 324Hazaribag (NP) Jharkhand 325Veraval (M) Gujarat 326Siwan (NP) Bihar 327Muzaffarnagar (NPP) Uttar Pradesh 328Mandsaur (M) Madhya Pradesh 329Kurnool (M Corp.) Andhra Pradesh 330Bhubaneswar Town (M Corp.) Odisha 331Parbhani (M Cl) Maharashtra 332Gondiya (M Cl) Maharashtra 333Gaya (M Corp.) Bihar 334Palanpur (M) Gujarat 335Hajipur (NP) Bihar 336Jodhpur (M Corp.) Rajasthan 337Amravati (M Corp.) Maharashtra 338Gorakhpur (M Corp.) Uttar Pradesh 339

Urban Sanitation
153
Name of Town State RankSagar (M Corp.) Madhya Pradesh 340Deoghar (M Corp.) Jharkhand 341Bhimavaram (M) Andhra Pradesh 342Dhanbad (M Corp.) Jharkhand 343Wardha (M Cl) Maharashtra 344Sujangarh (M) Rajasthan 345Deesa (M) Gujarat 346Pudukkottai (M) Tamil Nadu 347Purnia (M Corp.) Bihar 348Adilabad (M) Telangana 349Hisar (M Cl) Haryana 350Sonipat (M Cl) Haryana 351Tadepalligudem (M) Andhra Pradesh 352Baran (M) Rajasthan 353Nandyal (M) Andhra Pradesh 354Ujjain (M Corp.) Madhya Pradesh 355Mughalsarai (NPP) Uttar Pradesh 356Ongole (M) Andhra Pradesh 357Pali (M Cl) Rajasthan 358Surendranagar Dudhrej (M) Gujarat 359Dehradun (M Corp.) Uttarakhand 360Bhuj (M) Gujarat 361Malegoan (M Corp.) Maharashtra 362Achalpur (M Cl) Maharashtra 363Churu (M Cl) Rajasthan 364Jhunjhunun (M Cl) Rajasthan 365Khurja (NPP) Uttar Pradesh 366Chittoor (M) Andhra Pradesh 367Udgir (M Cl) Maharashtra 368Sikar (M Cl) Rajasthan 369Jaipur (M Corp.) Rajasthan 370Chas (NP) Jharkhand 371Hoshangabad (M) Madhya Pradesh 372Firozpur (M Cl) Punjab 373Hapur (NPP) Uttar Pradesh 374Sasaram (NP) Bihar 375Basti (NPP) Uttar Pradesh 376Jind (M Cl) Haryana 377Beawar (M Cl) Rajasthan 378Bhilai Nagar (M Corp.) Chhattisgarh 379Faizabad (NPP) Uttar Pradesh 380Ludhiana (M Corp.) Punjab 381Bhadrak (M) Odisha 382Allahabad (M Corp.) Uttar Pradesh 383Muktsar (M Cl) Punjab 384Katihar (M Corp.) Bihar 385Gangapur City (M) Rajasthan 386Shivpuri (M) Madhya Pradesh 387Banda (NPP) Uttar Pradesh 388

Handbook of Urban Statistics
154
Name of Town State RankPithampur (M) Madhya Pradesh 389Chapra (NP) Bihar 390Khargone (M) Madhya Pradesh 391Guna (M) Madhya Pradesh 392Ambala Sadar (M CL) Haryana 393Jagdalpur (M Corp.) Chhattisgarh 394Ambala (M Cl) Haryana 395Bid (M Cl) Maharashtra 396DMC (U) (M Corp.) Delhi 397Puri Town (M) Odisha 398Rajnandgaon (M Corp.) Chhattisgarh 399Gwalior (M Corp.) Madhya Pradesh 400Ajmer (M Corp.) Rajasthan 401Sawai Madhopur (M) Rajasthan 402Kaithal (M Cl) Haryana 403Aditya (NP) Jharkhand 404Panipat (M Cl) Haryana 405Dhule (M Corp.) Maharashtra 406Ghazipur (NPP) Uttar Pradesh 407Hanumangarh (M Cl) Rajasthan 408Saharanpur (M Corp.) Uttar Pradesh 409Jaunpur (NPP) Uttar Pradesh 410Saharsa (NP) Bihar 411Alwar (M Cl) Rajasthan 412Kishangarh (M Cl) Rajasthan 413Lakhimpur (NPP) Uttar Pradesh 414Rewa (M Corp.) Madhya Pradesh 415Raurkela Town (M) Odisha 416Udaipur (M Cl) Rajasthan 417Varanasi (M Corp.) Uttar Pradesh 418Puruliya (M) West Bengal 419Abohar (M Cl) Punjab 420Faridabad (M Corp.) Haryana 421Kota (M Corp.) Rajasthan 422Sehore (M) Madhya Pradesh 423Ballia (NPP) Uttar Pradesh 424Shahjahanpur (NPP) Uttar Pradesh 425Brahmapur Town (M Corp.) Odisha 426Jammu (MC) Jammu & Kashmir 427Morena (M) Madhya Pradesh 428Patna (M Corp.) Bihar 429Amritsar (M Corp.) Punjab 430Barnala (M Cl) Punjab 431Chhattarpur (M) Madhya Pradesh 432Yamunanagar (M Cl) Haryana 433Darbhanga (M Corp.) Bihar 434Dhaulpur (M) Rajasthan 435Begusarai (M Corp.) Bihar 436Bahadurgarh (M Cl) Haryana 437

Urban Sanitation
155
Name of Town State RankBaleshwar Town (M) Odisha 438Malerkotla (M Cl) Punjab 439Roorkee (NPP) Uttarakhand 440Bhilwara (M Cl) Rajasthan 441Jamalpur (NP) Bihar 442Maunath Bhanjan (NPP) Uttar Pradesh 443Motihari (NP) Bihar 444Akbarpur (NPP) Uttar Pradesh 445Jagadhri (M Cl) Haryana 446Hoshiarpur (M Cl) Punjab 447Baripada Town (M) Odisha 448Bahraich (NPP) Uttar Pradesh 449Gudivada (M) Andhra Pradesh 450Rudrapur (NPP) Uttarakhand 451Azamgarh (NPP) Uttar Pradesh 452Bagaha (NP) Bihar 453Gondal (M) Gujarat 454Buxar (NP) Bihar 455Deoria (NPP) Uttar Pradesh 456Hindupur (M) Andhra Pradesh 457Sultanpur (NPP) Uttar Pradesh 458Ganganagar (M Cl) Rajasthan 459Thanesar (M Cl) Haryana 460Aurangabad (NP) Bihar 461Bharatpur (M Cl) Rajasthan 462Bettiah (NP) Bihar 463Ambikapur (M Corp.) Chhattisgarh 464Meerut (M Corp.) Uttar Pradesh 465Gurgaon (M Corp.) Haryana 466Sambalpur Town (M) Odisha 467Hindaun (M) Rajasthan 468Rewari (M Cl) Haryana 469Neemuch (M) Madhya Pradesh 470Bulandshahr (NPP) Uttar Pradesh 471Chittaurgarh (M) Rajasthan 472Bhiwani (M Cl) Haryana 473Palwal (M Cl) Haryana 474Bhind (M) Madhya Pradesh 475Damoh (M) Madhya Pradesh 476
Source: Ministry of Urban Development, Government of India.


Urban Housing
7Chapter


Urban Housing
159
Urban Housing
Rapid urbanization has led to increasing problem of housing, overcrowding in small houses, steady growth of slums and unplanned settlements and severe deleterious effect on civic services in urban areas.
Total number of households in urban areas in 2001 were 53.7 million which increased to 78.9 million in 2011. Table 7.1 and 7.2 provide a detailed picture of change in living standard of urban households. The distribution of households by size and number of rooms during the year 2001 and 2011 shows that majority of households dwell in one room i.e. 35.11% of households lived in one room house in 2001, though this decreased to 32.13% in 2011. The percentage of households not having any separate space or those that dwell in non-exclusive rooms was 2.32% in 2001 and it has increased to 3.08% in 2011. One-third of population has been using two-rooms for living purpose in 2001-11. 17.09% households in 2001 and 18.38% households in 2011 had three rooms size dwelling. The table also shows that only 15.94% households in 2001 and 15.81% households in 2011 have four rooms and above as their living space.
Tenure status of houses is another dimension of housing stock that exists in urban areas. Tables 7.3 and 7.4 show change in percentage of households living in houses by number of rooms of owned dwellings. In 2001, 35.8 million households were in owned dwelling and the number increased to 54.5 million in 2011. In 2001, majority of households lived in one room (29.25%) and two rooms (29.27%) owned dwellings. The trend has been similar in 2011 as well wherein 26.46% household had one room dwellings and 30.43% in two room dwelling. Only 20.56% in 2001 and 20.27% in 2011 had owned dwelling of four rooms and above.
Tables 7.5 and 7.6 show the change in percentage of households living in houses by number of rooms of rented dwellings. It shows that two-third of rented households have less than three rooms. The percentage of households not having any exclusive rooms has increased from 2.75% in 2001 to 4.20% in 2011. Tables 7.7 and 7.8 give the ownership/tenure status of dwelling units of 2001 and 2011 re-spectively. In 2001, 66.79 % of households stayed in owned dwellings while 28.53% of households stayed in rented dwellings whereas in 2011, 69.16% households stayed in owned dwellings while 27.55 % households stayed in rented dwellings.
Table 7.9 shows the qualitative condition of Households. It shows that the percentage of households living in good condition dwellings has increased from 64.16% in 2001 to 68.44% in 2011. Another trend visible from the table is decrease in percentage of households living in houses in dilapidated
condition from 3.6% in 2001 to 2.88% in 2011.

Handbook of Urban Statistics
160
Tabl
e 7.
1: S
tate
wis
e H
ouse
hold
s ha
ving
num
ber
of D
wel
ling
Room
s-20
01 (%
)
S.N
o.St
ates
/UTs
Tota
l num
ber
of
hous
ehol
ds
Perc
enta
ge o
f hou
seho
lds
havi
ngN
o ex
clu-
sive
room
One
room
Two
room
sTh
ree
room
sFo
ur ro
oms
Five
room
sSi
x ro
oms
and
abov
eFo
ur ro
oms
and
abov
e1
And
aman
& N
icob
ar Is
land
s23
,409
2.86
34.9
540
.33
13.6
55.
071.
401.
738.
212
And
hra
Prad
esh
4,17
3,63
91.
6335
.28
29.5
918
.99
9.08
2.70
2.72
14.5
13
Aru
nach
al P
rade
sh48
,114
1.17
26.8
640
.60
21.6
26.
041.
871.
849.
754
Ass
am71
5,18
51.
2629
.72
28.0
218
.81
10.4
45.
616.
1422
.19
5Bi
har
1,32
2,58
30.
9230
.03
29.4
117
.69
10.3
74.
407.
1821
.95
6Ch
andi
garh
UT
180,
576
0.96
38.3
826
.25
19.9
78.
052.
903.
4914
.44
7Ch
hatti
sgar
h78
9,44
00.
5224
.72
34.2
421
.15
10.0
94.
005.
2719
.37
8D
aman
& D
iu11
,190
3.32
44.5
035
.03
12.5
23.
230.
800.
604.
639
Dad
ra &
Nag
ar H
avel
i12
,251
0.76
27.3
829
.18
18.8
811
.74
4.58
7.49
23.8
010
NCT
of D
elhi
138,
461
2.75
23.2
225
.54
23.2
013
.49
5.62
6.19
25.3
011
Goa
3,75
8,02
80.
9141
.35
31.4
516
.07
6.10
1.95
2.15
10.2
112
Guj
arat
1,07
5,17
91.
3227
.91
31.3
220
.13
11.0
73.
934.
3219
.32
13H
arya
na14
3,11
31.
4734
.14
31.1
814
.78
9.28
3.82
5.32
18.4
314
Him
acha
l Pra
desh
390,
411
2.16
20.2
722
.35
18.8
916
.71
6.54
13.0
836
.33
15Ja
mm
u &
Kas
hmir
1,06
0,17
80.
6825
.94
38.7
717
.61
8.97
3.26
4.78
17.0
016
Jhar
khan
d3,
556,
960
4.85
30.4
429
.59
17.7
39.
374.
014.
0117
.39
17Ka
rnat
aka
1,65
2,65
61.
139.
0523
.37
27.8
820
.05
9.63
8.89
38.5
618
Kera
la3,
889
1.31
9.05
20.7
024
.17
21.9
912
.03
10.7
544
.77
19M
adhy
a Pr
ades
h2,
794,
858
1.00
26.1
431
.61
19.5
210
.83
4.28
6.62
21.7
320
Mah
aras
htra
8,06
9,52
63.
8646
.71
26.9
013
.49
5.38
1.70
1.96
9.04
21M
anip
ur10
1,30
21.
6114
.51
25.6
728
.77
14.6
47.
107.
7029
.44
22M
egha
laya
90,5
682.
4522
.80
28.7
620
.52
11.1
36.
048.
3025
.47
23M
izor
am81
,604
1.18
21.2
040
.96
22.1
98.
823.
182.
4814
.48
24N
agal
and
66,7
161.
6628
.91
30.7
619
.65
10.6
14.
184.
2319
.02
25O
dish
a2,
384,
621
0.88
38.3
427
.03
17.9
38.
872.
874.
0715
.82
26Pu
duch
erry
UT
1,08
7,24
81.
2030
.06
33.6
218
.09
8.81
3.59
4.63
17.0
327
Punj
ab13
6,45
61.
4549
.73
29.2
311
.49
4.38
1.37
2.35
8.11
28Ra
jast
han
1,48
9,69
40.
7926
.11
29.6
320
.88
12.8
15.
064.
7222
.59
29Si
kkim
2,18
5,59
10.
9927
.45
29.5
318
.41
11.9
15.
136.
5823
.61
30Ta
mil
Nad
u13
,015
0.88
33.8
832
.45
16.6
17.
713.
175.
2916
.17
31Te
lang
ana
5,89
8,83
65.
9037
.30
29.2
316
.18
6.65
2.34
2.40
11.3
932
Trip
ura
122,
343
1.19
61.4
023
.47
9.09
3.12
0.98
0.75
4.85
33U
ttar
Pra
desh
5,17
0,52
71.
6230
.76
31.4
616
.91
9.77
3.91
5.58
19.2
534
Utt
arak
hand
390,
164
0.64
32.3
332
.68
17.4
99.
873.
443.
5516
.86
35W
est B
enga
l4,
554,
045
0.88
45.8
729
.30
12.9
96.
111.
892.
9710
.97
IND
IA53
,692
,376
2.32
35.1
129
.53
17.0
98.
673.
274.
0015
.94
Sou
rce:
Cen
sus
of In
dia-
2001

Urban Housing
161
Tabl
e 7.
2 : S
tate
wis
e H
ouse
hold
s ha
ving
num
ber
of d
wel
lings
Roo
ms
- 201
1 (%
)
S. N
o.St
ates
/UTs
Tota
l num
ber
of
hous
ehol
ds
Perc
enta
ge o
f hou
seho
lds
havi
ngN
o ex
clu-
sive
room
One
room
Two
room
sTh
ree
room
sFo
ur ro
oms
Five
room
sSi
x ro
oms
and
abov
eFo
ur ro
oms
and
abov
e1
And
aman
& N
icob
ar Is
land
s34
,346
1.85
26.2
241
.52
20.1
66.
661.
961.
6410
.25
2A
ndhr
a Pr
ades
h6,
778,
225
2.26
32.6
832
.59
20.3
48.
372.
141.
6312
.13
3A
runa
chal
Pra
desh
65,8
911.
5821
.03
39.5
324
.61
7.63
2.81
2.81
13.2
64
Ass
am99
2,74
22.
1324
.19
27.9
319
.70
12.8
16.
646.
6126
.06
5Bi
har
2,01
3,67
12.
2732
.45
30.7
615
.72
9.59
3.61
5.59
18.7
96
Chan
diga
rh22
8,27
61.
4338
.45
25.7
419
.01
8.67
3.20
3.50
15.3
77
Chha
ttisg
arh
1,23
8,73
81.
4527
.27
33.4
819
.52
10.0
43.
754.
5018
.29
8D
adra
& N
agar
Hav
eli
37,6
556.
5450
.75
26.2
912
.25
2.83
0.68
0.67
4.17
9D
aman
& D
iu47
,631
4.13
62.8
316
.34
9.34
3.87
1.40
2.09
7.36
10D
elhi
3,26
1,42
31.
3232
.25
29.6
719
.95
10.3
82.
983.
4416
.81
11G
oa19
8,13
93.
5920
.36
24.9
625
.82
13.6
45.
825.
8125
.27
12G
ujar
at5,
416,
315
2.41
35.5
433
.34
17.8
16.
792.
261.
8510
.90
13H
arya
na1,
751,
901
1.76
26.2
429
.52
21.2
812
.89
4.39
3.92
21.2
014
Him
acha
l Pra
desh
166,
043
1.76
27.4
430
.44
16.5
511
.79
5.04
6.97
23.8
015
Jam
mu
& K
ashm
ir51
7,16
82.
8815
.08
22.4
923
.13
15.6
56.
9113
.87
36.4
316
Jhar
khan
d1,
495,
642
2.84
22.1
338
.50
18.2
610
.61
3.38
4.28
18.2
717
Karn
atak
a5,
315,
715
7.10
29.6
230
.96
18.7
78.
322.
862.
3713
.54
18Ke
rala
3,62
0,69
60.
916.
2823
.34
32.4
421
.36
8.63
7.02
37.0
219
Laks
hadw
eep
8,18
00.
427.
3519
.60
29.1
921
.99
10.7
710
.68
43.4
520
Mad
hya
Prad
esh
3,84
5,23
21.
3525
.23
32.3
019
.22
11.8
24.
285.
8021
.90
21M
ahar
asht
ra10
,813
,928
4.85
41.6
928
.41
15.3
65.
991.
891.
809.
6822
Man
ipur
171,
400
1.42
13.4
828
.57
30.3
214
.28
6.54
5.40
26.2
223
Meg
hala
ya11
6,10
20.
8421
.56
28.0
020
.93
11.9
76.
6610
.03
28.6
724
Miz
oram
116,
203
1.67
12.8
041
.10
24.7
811
.32
4.56
3.78
19.6
525
Nag
alan
d11
5,05
40.
9822
.19
29.8
422
.40
13.3
05.
835.
4724
.60
26O
dish
a1,
517,
073
1.69
28.2
933
.57
19.4
99.
583.
573.
8016
.96
27Pu
duch
erry
206,
143
4.58
40.5
031
.81
15.5
94.
851.
501.
187.
5328
Punj
ab2,
094,
067
1.29
25.2
729
.23
21.5
412
.91
5.28
4.48
22.6
729
Raja
stha
n3,
090,
940
1.65
25.8
729
.06
18.9
013
.20
5.33
5.98
24.5
230
Sikk
im35
,761
2.22
31.0
230
.23
15.3
89.
424.
517.
2321
.16
31Ta
mil
Nad
u8,
929,
104
4.68
36.7
431
.62
17.1
16.
332.
081.
449.
8532
Trip
ura
235,
002
3.66
62.0
923
.61
6.95
2.43
0.67
0.59
3.69
33U
ttar
Pra
desh
7,44
9,19
52.
4031
.27
30.5
516
.64
10.6
43.
854.
6419
.13
34U
ttar
akha
nd59
2,22
31.
0729
.25
30.8
218
.68
11.8
64.
244.
0820
.17
35W
est B
enga
l6,
350,
113
2.97
41.6
931
.70
13.5
26.
121.
742.
2610
.12
IND
IA78
,865
,937
3.08
32.1
330
.60
18.3
89.
263.
243.
3115
.81
Sour
ce: C
ensu
s of
Indi
a-20
11
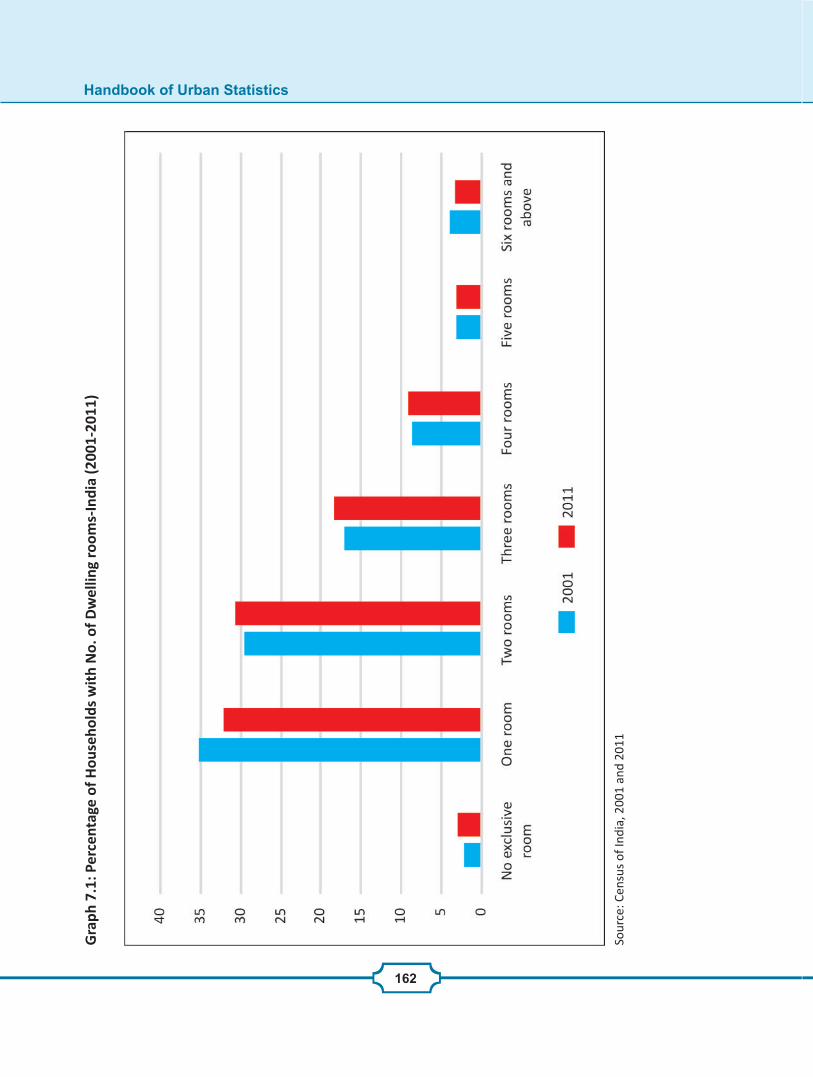
Handbook of Urban Statistics
162
Gra
ph 7
.1: P
erce
ntag
e of
Hou
seho
lds
wit
h N
o. o
f Dw
ellin
g ro
oms-
Indi
a (2
001-
2011
)
Sour
ce: C
ensu
s of
Indi
a, 2
001
and
2011

Urban Housing
163
Tab
le 7
.3 :
Stat
e w
ise
Hou
seho
lds
livin
g in
hou
ses
by n
umbe
r of
room
s of
ow
ned
dwel
lings
- 20
01 (%
)
S. N
o.St
ates
/UTs
Tota
l num
ber
of h
ouse
hold
s
Perc
enta
ge H
ouse
hold
s ha
ving
num
ber
of d
wel
ling
room
s
No
excl
usiv
e ro
omO
ne ro
omTw
o ro
oms
Thre
e ro
oms
Four
room
sFi
ve ro
oms
Six
room
s
and
abov
eFo
ur ro
oms
and
abov
e
1A
ndam
an &
Nic
obar
Isla
nds
10,0
822.
5528
.65
37.5
716
.89
8.49
2.72
3.13
14.3
42
And
hra
Prad
esh
2,33
7,46
11.
6332
.51
28.8
618
.46
10.7
93.
654.
1018
.54
3A
runa
chal
Pra
desh
11,9
940.
9820
.14
36.1
823
.85
10.0
24.
094.
7418
.86
4A
ssam
396,
935
1.26
19.4
226
.05
21.1
614
.24
8.45
9.42
32.1
15
Biha
r1,
019,
701
0.87
27.8
127
.50
17.7
612
.01
5.31
8.75
26.0
66
Chan
diga
rh85
,251
1.10
35.1
922
.95
18.1
111
.92
4.68
6.04
22.6
47
Chha
ttisg
arh
506,
659
0.50
21.6
431
.89
20.2
512
.63
5.53
7.56
25.7
28
Dad
ra &
Nag
ar H
avel
i4,
179
1.34
31.5
442
.26
16.6
15.
261.
681.
328.
269
Dam
an &
Diu
8,23
40.
8619
.06
27.4
120
.72
15.2
16.
2210
.53
31.9
510
Del
hi1,
580,
853
0.71
26.7
628
.77
22.3
311
.81
3.96
5.67
21.4
411
Goa
93,6
481.
5012
.86
24.2
627
.04
17.7
37.
908.
7234
.35
12G
ujar
at2,
749,
173
0.64
33.9
133
.49
18.9
27.
692.
532.
8213
.04
13H
arya
na84
4,28
21.
1822
.21
31.8
022
.23
12.9
24.
674.
9922
.59
14H
imac
hal P
rade
sh60
,485
1.39
15.7
625
.28
20.6
117
.86
7.99
11.1
236
.97
15Ja
mm
u &
Kas
hmir
323,
508
1.93
13.1
621
.81
20.9
319
.27
7.63
15.2
642
.17
16Jh
arkh
and
542,
281
0.68
22.3
431
.65
18.8
013
.02
5.35
8.16
26.5
317
Karn
atak
a1,
942,
982
3.99
26.0
027
.79
19.0
211
.71
5.45
6.04
23.2
018
Kera
la1,
446,
667
1.06
7.67
22.3
328
.20
20.9
710
.19
9.58
40.7
419
Laks
hadw
eep
2,91
21.
374.
2213
.32
24.0
427
.54
15.4
514
.05
57.0
420
Mad
hya
Prad
esh
1,93
7,98
90.
9922
.48
29.3
619
.62
13.1
05.
578.
8927
.55
21M
ahar
asht
ra5,
419,
455
3.47
41.3
327
.94
15.4
46.
872.
302.
6511
.82
22M
anip
ur91
,300
1.49
11.7
325
.39
30.1
315
.53
7.65
8.09
31.2
723
Meg
hala
ya36
,041
1.63
9.66
20.1
923
.54
16.0
811
.34
17.5
644
.98
24M
izor
am41
,038
0.77
13.5
636
.53
28.0
712
.21
4.92
3.95
21.0
725
Nag
alan
d23
,098
1.19
13.6
522
.85
26.5
018
.31
8.58
8.90
35.7
926
Odi
sha
581,
156
1.22
26.4
530
.23
18.7
411
.42
5.05
6.88
23.3
527
Pudu
cher
ry81
,974
1.38
46.1
629
.10
12.7
05.
641.
893.
1410
.66
28Pu
njab
1,14
9,54
30.
5618
.45
30.0
323
.59
15.4
56.
205.
7127
.37
29Ra
jast
han
1,71
5,72
60.
9421
.87
28.7
820
.24
14.0
86.
207.
9028
.17
30Si
kkim
2,98
60.
8713
.26
19.2
620
.03
17.6
210
.11
18.8
546
.58
31Ta
mil
Nad
u3,
452,
816
5.99
33.3
728
.45
17.3
98.
373.
213.
2214
.80
32Tr
ipur
a86
,716
0.76
55.0
826
.81
11.0
83.
991.
281.
016.
2733
Utt
ar P
rade
sh4,
140,
288
1.57
26.8
830
.80
18.3
711
.27
4.63
6.48
22.3
834
Utt
arak
hand
229,
421
0.59
23.7
028
.89
21.6
114
.37
5.30
5.55
25.2
235
Wes
t Ben
gal
2,90
5,31
00.
6435
.48
32.2
216
.35
8.51
2.74
4.07
15.3
1IN
DIA
35,8
62,1
442.
0429
.25
29.2
718
.88
10.8
64.
325.
3820
.56
Sour
ce: C
ensu
s of
Indi
a-20
01
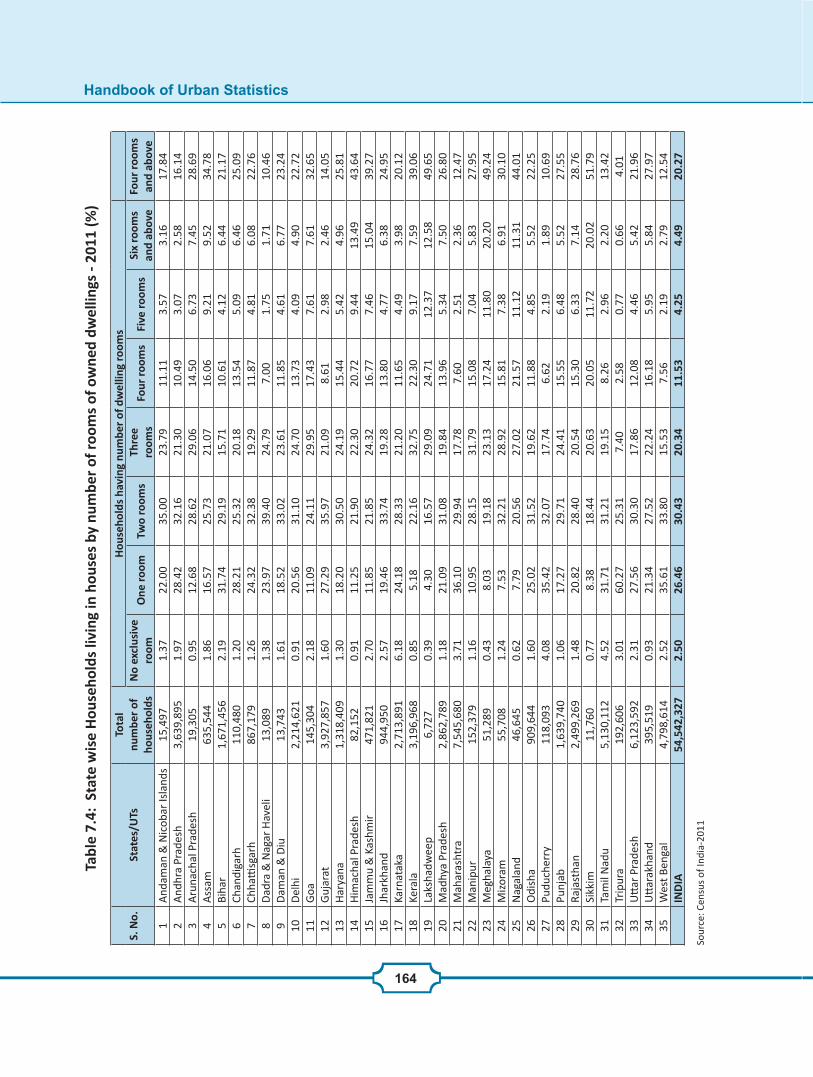
Handbook of Urban Statistics
164
Tabl
e 7.
4: S
tate
wis
e H
ouse
hold
s liv
ing
in h
ouse
s by
num
ber
of ro
oms
of o
wne
d dw
ellin
gs -
2011
(%)
S. N
o.St
ates
/UTs
Tota
l nu
mbe
r of
ho
useh
olds
Hou
seho
lds
havi
ng n
umbe
r of
dw
ellin
g ro
oms
No
excl
usiv
e ro
omO
ne ro
omTw
o ro
oms
Thre
e ro
oms
Four
room
sFi
ve ro
oms
Six
room
s an
d ab
ove
Four
room
s an
d ab
ove
1A
ndam
an &
Nic
obar
Isla
nds
15,4
971.
3722
.00
35.0
023
.79
11.1
13.
573.
1617
.84
2A
ndhr
a Pr
ades
h3,
639,
895
1.97
28.4
232
.16
21.3
010
.49
3.07
2.58
16.1
43
Aru
nach
al P
rade
sh19
,305
0.95
12.6
828
.62
29.0
614
.50
6.73
7.45
28.6
94
Ass
am63
5,54
41.
8616
.57
25.7
321
.07
16.0
69.
219.
5234
.78
5Bi
har
1,67
1,45
62.
1931
.74
29.1
915
.71
10.6
14.
126.
4421
.17
6Ch
andi
garh
110,
480
1.20
28.2
125
.32
20.1
813
.54
5.09
6.46
25.0
97
Chha
ttisg
arh
867,
179
1.26
24.3
232
.38
19.2
911
.87
4.81
6.08
22.7
68
Dad
ra &
Nag
ar H
avel
i13
,089
1.38
23.9
739
.40
24.7
97.
001.
751.
7110
.46
9D
aman
& D
iu13
,743
1.61
18.5
233
.02
23.6
111
.85
4.61
6.77
23.2
410
Del
hi2,
214,
621
0.91
20.5
631
.10
24.7
013
.73
4.09
4.90
22.7
211
Goa
145,
304
2.18
11.0
924
.11
29.9
517
.43
7.61
7.61
32.6
512
Guj
arat
3,92
7,85
71.
6027
.29
35.9
721
.09
8.61
2.98
2.46
14.0
513
Har
yana
1,31
8,40
91.
3018
.20
30.5
024
.19
15.4
45.
424.
9625
.81
14H
imac
hal P
rade
sh82
,152
0.91
11.2
521
.90
22.3
020
.72
9.44
13.4
943
.64
15Ja
mm
u &
Kas
hmir
471,
821
2.70
11.8
521
.85
24.3
216
.77
7.46
15.0
439
.27
16Jh
arkh
and
944,
950
2.57
19.4
633
.74
19.2
813
.80
4.77
6.38
24.9
517
Karn
atak
a2,
713,
891
6.18
24.1
828
.33
21.2
011
.65
4.49
3.98
20.1
218
Kera
la3,
196,
968
0.85
5.18
22.1
632
.75
22.3
09.
177.
5939
.06
19La
ksha
dwee
p6,
727
0.39
4.30
16.5
729
.09
24.7
112
.37
12.5
849
.65
20M
adhy
a Pr
ades
h2,
862,
789
1.18
21.0
931
.08
19.8
413
.96
5.34
7.50
26.8
021
Mah
aras
htra
7,54
5,68
03.
7136
.10
29.9
417
.78
7.60
2.51
2.36
12.4
722
Man
ipur
152,
379
1.16
10.9
528
.15
31.7
915
.08
7.04
5.83
27.9
523
Meg
hala
ya51
,289
0.43
8.03
19.1
823
.13
17.2
411
.80
20.2
049
.24
24M
izor
am55
,708
1.24
7.53
32.2
128
.92
15.8
17.
386.
9130
.10
25N
agal
and
46,6
450.
627.
7920
.56
27.0
221
.57
11.1
211
.31
44.0
126
Odi
sha
909,
644
1.60
25.0
231
.52
19.6
211
.88
4.85
5.52
22.2
527
Pudu
cher
ry11
8,09
34.
0835
.42
32.0
717
.74
6.62
2.19
1.89
10.6
928
Punj
ab1,
639,
740
1.06
17.2
729
.71
24.4
115
.55
6.48
5.52
27.5
529
Raja
stha
n2,
499,
269
1.48
20.8
228
.40
20.5
415
.30
6.33
7.14
28.7
630
Sikk
im11
,760
0.77
8.38
18.4
420
.63
20.0
511
.72
20.0
251
.79
31Ta
mil
Nad
u5,
130,
112
4.52
31.7
131
.21
19.1
58.
262.
962.
2013
.42
32Tr
ipur
a19
2,60
63.
0160
.27
25.3
17.
402.
580.
770.
664.
0133
Utt
ar P
rade
sh6,
123,
592
2.31
27.5
630
.30
17.8
612
.08
4.46
5.42
21.9
634
Utt
arak
hand
395,
519
0.93
21.3
427
.52
22.2
416
.18
5.95
5.84
27.9
735
Wes
t Ben
gal
4,79
8,61
42.
5235
.61
33.8
015
.53
7.56
2.19
2.79
12.5
4IN
DIA
54,5
42,3
272.
5026
.46
30.4
320
.34
11.5
34.
254.
4920
.27
Sour
ce: C
ensu
s of
Indi
a-20
11

Urban Housing
165
Gra
ph 7
.2: P
erce
ntag
e of
Hou
seho
lds
Livi
ng in
Hou
ses
by N
o. o
f Roo
ms
of O
wne
d D
wel
lings
-Indi
a (2
001-
11)
Sour
ce: C
ensu
s of
Indi
a, 2
001
and
2011

Handbook of Urban Statistics
166
Tabl
e 7.
5: S
tate
wis
e H
ouse
hold
s liv
ing
in h
ouse
s by
num
ber
of ro
oms
of re
nted
dw
ellin
gs -2
001
(%)
S.N
o.St
ates
/UTs
2001
2001
Tota
l num
ber
of h
ouse
hold
s
Perc
enta
ge o
f hou
seho
lds
havi
ngN
o ex
clus
ive
room
One
room
Two
room
sTh
ree
room
sFo
ur ro
oms
Five
room
sSi
x ro
oms
and
abov
eFo
ur ro
oms
and
abov
e1
And
aman
& N
icob
ar Is
land
s9,
796
2.27
43.1
440
.67
10.6
92.
340.
380.
523.
242
And
hra
Prad
esh
1,71
3,49
41.
4138
.89
31.0
719
.50
6.71
1.47
0.94
9.12
3A
runa
chal
Pra
desh
15,1
502.
0343
.72
37.9
411
.33
3.19
0.90
0.88
4.98
4A
ssam
261,
790
1.18
46.7
529
.29
13.8
65.
211.
771.
938.
915
Biha
r24
6,81
70.
8536
.94
36.7
017
.44
4.94
1.32
1.81
8.07
6Ch
andi
garh
72,8
950.
5929
.68
34.6
826
.57
5.76
1.54
1.18
8.47
7Ch
hatti
sgar
h22
5,49
00.
4831
.03
39.9
620
.98
5.35
1.16
1.04
7.56
8D
aman
& D
iu68
404.
2452
.13
30.9
410
.20
2.03
0.28
0.18
2.49
9D
adra
& N
agar
Hav
eli
3,45
60.
4645
.11
33.8
014
.58
4.08
0.98
0.98
6.05
10N
CT o
f Del
hi39
,444
4.75
43.0
229
.86
16.1
04.
680.
790.
816.
2711
Goa
856,
636
1.43
61.9
426
.25
8.10
1.66
0.37
0.26
2.29
12G
ujar
at19
0,96
51.
5248
.62
29.8
212
.69
4.36
1.22
1.77
7.35
13H
arya
na73
,276
1.18
47.0
036
.68
10.5
52.
880.
691.
024.
5914
Him
acha
l Pra
desh
52,9
232.
5653
.27
26.5
19.
484.
531.
232.
418.
1715
Jam
mu
& K
ashm
ir36
2,53
40.
5930
.28
45.3
216
.63
4.91
1.08
1.19
7.18
16Jh
arkh
and
1,49
3,27
25.
6935
.47
32.2
916
.24
6.54
2.23
1.54
10.3
117
Karn
atak
a16
8,71
31.
0917
.12
31.1
726
.58
14.1
25.
894.
0324
.03
18Ke
rala
917
0.87
23.4
543
.29
24.3
25.
341.
740.
988.
0719
Mad
hya
Prad
esh
691,
171
0.85
35.8
837
.31
18.2
15.
111.
271.
377.
7520
Mah
aras
htra
2,29
6,10
74.
3657
.62
25.3
79.
432.
250.
460.
513.
2121
Man
ipur
8,67
52.
5242
.06
27.9
715
.11
6.19
2.02
4.13
12.3
322
Meg
hala
ya48
,664
3.06
33.0
734
.56
17.6
87.
432.
341.
8611
.63
23M
izor
am37
,908
1.57
29.4
145
.83
15.7
15.
201.
330.
957.
4824
Nag
alan
d39
,587
1.90
39.5
835
.13
14.6
45.
721.
531.
518.
7525
Odi
sha
621,
962
0.89
57.9
925
.80
10.2
33.
390.
780.
935.
1026
Pudu
cher
ry36
0,75
70.
9931
.59
38.7
118
.47
6.30
1.88
2.05
10.2
327
Punj
ab47
,453
1.33
52.3
531
.49
10.3
52.
680.
651.
154.
4828
Raja
stha
n27
9,66
90.
8653
.66
27.6
711
.42
3.87
1.18
1.34
6.38
29Si
kkim
399,
766
1.00
49.1
431
.96
11.2
83.
881.
111.
636.
6230
Tam
il N
adu
7,80
80.
8846
.06
35.7
111
.57
3.86
0.88
1.05
5.79
31Te
lang
ana
2,26
6,21
55.
5642
.88
30.6
914
.38
4.18
1.11
1.19
6.48
32Tr
ipur
a32
,461
2.04
76.8
415
.58
4.16
1.04
0.22
0.12
1.38
33U
ttar
Pra
desh
849,
799
1.48
46.3
134
.86
10.8
63.
630.
991.
886.
4934
Utt
arak
hand
120,
278
0.60
43.2
439
.48
11.8
23.
500.
740.
614.
8535
Wes
t Ben
gal
1,41
4,66
41.
1465
.00
23.7
96.
851.
830.
381.
023.
23IN
DIA
15,3
17,3
522.
7546
.93
30.4
013
.40
4.24
1.13
1.15
6.52
Sour
ce: C
ensu
s of
Indi
a-20
01

Urban Housing
167
Tabl
e 7.
6: S
tate
wis
e H
ouse
hold
s liv
ing
in h
ouse
s by
num
ber
of ro
oms
of re
nted
dw
ellin
gs—
2011
(%)
S. N
o.St
ates
/UTs
Tota
l num
ber
of h
ouse
hold
s
Perc
enta
ge o
f hou
seho
lds
havi
ngN
o ex
clus
ive
room
One
room
Two
room
sTh
ree
room
sFo
ur ro
oms
Five
room
sSi
x ro
oms
and
abov
eFo
ur ro
oms
and
abov
e1
And
aman
& N
icob
ar Is
land
s17
,363
1.90
29.4
647
.99
16.7
82.
970.
560.
343.
872
And
hra
Prad
esh
3,00
4,70
22.
3637
.09
33.6
719
.46
5.87
1.05
0.50
7.42
3A
runa
chal
Pra
desh
37,1
861.
8426
.60
44.6
120
.93
4.30
0.97
0.76
6.02
4A
ssam
306,
723
2.54
39.8
831
.63
16.1
96.
591.
921.
259.
765
Biha
r27
4,98
32.
1833
.78
40.1
916
.44
4.86
1.15
1.39
7.41
6Ch
andi
garh
UT
105,
357
1.50
46.2
727
.05
18.6
84.
321.
500.
686.
507
Chha
ttisg
arh
293,
600
1.76
34.2
036
.82
19.8
95.
481.
170.
677.
328
Dam
an &
Diu
2369
88.
7265
.77
19.4
45.
330.
540.
080.
110.
749
Dad
ra &
Nag
ar H
avel
i32
,330
5.00
81.6
49.
163.
420.
560.
070.
140.
7810
NCT
of D
elhi
44,7
917.
2144
.63
28.3
215
.23
3.15
0.78
0.68
4.61
11G
oa1,
315,
157
4.37
57.6
126
.49
9.09
1.92
0.32
0.19
2.43
12G
ujar
at38
0,25
42.
7651
.46
26.4
812
.01
5.26
1.30
0.74
7.29
13H
arya
na75
,029
2.28
42.4
740
.12
11.0
12.
890.
700.
534.
1114
Him
acha
l Pra
desh
33,5
313.
9147
.02
30.5
211
.48
4.29
1.12
1.67
7.08
15Ja
mm
u &
Kas
hmir
408,
108
3.37
27.9
846
.41
15.7
74.
980.
880.
626.
4716
Jhar
khan
d2,
447,
718
7.77
35.3
234
.06
16.2
74.
801.
130.
656.
5817
Karn
atak
a36
2,15
31.
1113
.36
32.9
330
.93
14.5
04.
572.
5921
.67
18Ke
rala
1,28
90.
3922
.27
35.0
731
.19
8.46
1.40
1.24
11.0
919
Mad
hya
Prad
esh
811,
821
1.69
38.3
136
.10
16.7
75.
281.
100.
767.
1320
Mah
aras
htra
2,94
0,73
17.
2954
.99
25.1
69.
492.
190.
420.
463.
0721
Man
ipur
15,6
482.
9333
.74
32.8
118
.87
7.34
2.50
1.82
11.6
622
Meg
hala
ya58
,765
1.19
33.4
535
.31
18.5
27.
382.
371.
7911
.53
23M
izor
am57
,059
1.93
17.6
549
.79
20.7
97.
041.
920.
879.
8324
Nag
alan
d63
,227
1.21
32.8
236
.62
18.4
67.
402.
081.
4110
.89
25O
dish
a92
9,11
21.
8856
.83
27.0
89.
923.
370.
620.
314.
3026
Pudu
cher
ry47
6,40
21.
7530
.67
37.2
520
.67
6.70
1.77
1.20
9.67
27Pu
njab
80,2
744.
6746
.40
32.5
113
.14
2.53
0.54
0.21
3.28
28Ra
jast
han
390,
177
1.85
55.4
027
.18
10.7
83.
310.
840.
654.
7929
Sikk
im52
3,15
92.
0847
.85
31.8
811
.87
4.25
1.06
1.01
6.32
30Ta
mil
Nad
u22
,752
3.00
42.4
436
.33
12.3
04.
100.
940.
895.
9331
Tela
ngan
a3,
590,
179
4.72
43.4
432
.51
14.3
63.
710.
870.
404.
9832
Trip
ura
35,6
266.
3670
.41
15.7
25.
151.
860.
250.
252.
3633
Utt
ar P
rade
sh1,
114,
832
2.44
49.4
231
.58
10.7
23.
880.
990.
965.
8434
Utt
arak
hand
157,
724
1.28
46.4
337
.67
10.6
52.
860.
700.
413.
9735
Wes
t Ben
gal
1,29
2,26
34.
2460
.90
25.2
47.
071.
610.
350.
592.
55IN
DIA
21,7
23,7
234.
2044
.89
31.2
613
.97
4.14
0.93
0.61
5.68
Sour
ce: C
ensu
s of
Indi
a-20
11

Handbook of Urban Statistics
168
Gra
ph 7
.3: P
erce
ntag
e of
Hou
seho
lds
Livi
ng in
Hou
ses
by N
o. o
f Roo
ms
of R
ente
d D
wel
lings
-Indi
a (2
001-
11)
Sour
ce: C
ensu
s of
Indi
a, 2
001
and
2011

Urban Housing
169
Table 7.7: State-wise Urban Households living in Houses by ‘Ownership/Tenure Status of Dwelling Units’ - 2001
S. No.
States/UTsTotal
number of households
No. of Households by Ownership/Tenure Status of dwelling rooms-2001
Owned Rented Any others
Numbers Percentage Numbers Percentage Numbers Percentage
1 Andaman & Nicobar Islands
23,409 10,082 43.07 9,796 41.85 3,531 15.08
2 Andhra Pradesh 4,173,639 2,337,461 56.01 1,713,494 41.06 122,684 2.943 Arunachal Pradesh 48,114 11,994 24.93 15,150 31.49 20,970 43.584 Assam 715,185 396,935 55.50 261,790 36.60 56,460 7.895 Bihar 1,322,583 1,019,701 77.10 246,817 18.66 56,065 4.246 Chandigarh 180,576 85,251 47.21 72,895 40.37 22,430 12.427 Chhattisgarh 789,440 506,659 64.18 225,490 28.56 57,291 7.268 Dadra & nagar
Haveli11,190 4,179 37.35 6,840 61.13 171 1.53
9 Daman & Diu 12,251 8,234 67.21 3,456 28.21 561 4.5810 Goa 138,461 93,648 67.63 39,444 28.49 5,369 3.8811 Gujarat 3,758,028 2,749,173 73.15 856,636 22.79 152,219 4.0512 Haryana 1,075,179 844,282 78.52 190,965 17.76 39,932 3.7113 Himachal Pradesh 143,113 60,485 42.26 73,276 51.20 9,352 6.5314 Jammu & Kashmir 390,411 323,508 82.86 52,923 13.56 13,980 3.5815 Jharkhand 1,060,178 542,281 51.15 362,534 34.20 155,363 14.6516 Karnataka 3,556,960 1,942,982 54.62 1,493,272 41.98 120,706 3.3917 Kerala 1,652,656 1,446,667 87.54 168,713 10.21 37,276 2.2618 Lakshadweep 3,889 2,912 74.88 917 23.58 60 1.5419 Madhya Pradesh 2,794,858 1,937,989 69.34 691,171 24.73 165,698 5.9320 Maharashtra 8,069,526 5,419,455 67.16 2,296,107 28.45 353,964 4.3921 Manipur 101,302 91,300 90.13 8,675 8.56 1,327 1.3122 Meghalaya 90,568 36,041 39.79 48,664 53.73 5,863 6.4723 Mizoram 81,604 41,038 50.29 37,908 46.45 2,658 3.2624 Nagaland 66,716 23,098 34.62 39,587 59.34 4,031 6.0425 NCT Of Delhi 2,384,621 1,580,853 66.29 621,962 26.08 181,806 7.6226 Odisha 1,087,248 581,156 53.45 360,757 33.18 145,335 13.3727 Puducherry 136,456 81,974 60.07 47,453 34.78 7,029 5.1528 Punjab 1,489,694 1,149,543 77.17 279,669 18.77 60,482 4.0629 Rajasthan 2,185,591 1,715,726 78.50 399,766 18.29 70,099 3.2130 Sikkim 13,015 2,986 22.94 7,808 59.99 2,221 17.0631 Tamil Nadu 5,898,836 3,452,816 58.53 2,266,215 38.42 179,805 3.0532 Tripura 122,343 86,716 70.88 32,461 26.53 3,166 2.5933 Uttar Pradesh 5,170,527 4,140,288 80.07 849,799 16.44 180,440 3.4934 Uttarakhand 390,164 229,421 58.80 120,278 30.83 40,465 10.3735 West Bengal 4,554,045 2,905,310 63.80 1,414,664 31.06 234,071 5.14
India 53,692,376 35,862,144 66.79 15,317,352 28.53 2,512,880 4.68
Source: Census of India-2001

Handbook of Urban Statistics
170
Gra
ph 7
.4: S
tate
-wis
e U
rban
Hou
seho
lds
livin
g in
Hou
ses
by ‘O
wne
rshi
p/Te
nure
Sta
tus
of D
wel
ling
Uni
ts’ i
n In
dia
- 200
1 (%
)
Sour
ce: C
ensu
s of
Indi
a, 2
001.

Urban Housing
171
Table 7.8: State-wise Urban Households living in Houses by ‘Ownership/Tenure Status of Dwelling Units’ - 2011
S. No. States/UTsTotal
number of households
No. of Households by Ownership/Tenure Status of dwelling rooms
Owned Rented Any others
Numbers Percentage Numbers Percentage Numbers Percentage
1 Andaman & Nicobar Islands 34,346 15,497 45.12 17,363 50.55 1,486 4.33
2 Andhra Pradesh 6,778,225 3,639,895 53.70 3,004,702 44.33 133,628 1.97
3 Arunachal Pradesh 65,891 19,305 29.30 37,186 56.44 9,400 14.27
4 Assam 992,742 635,544 64.02 306,723 30.90 50,475 5.08
5 Bihar 2,013,671 1,671,456 83.01 274,983 13.66 67,232 3.34
6 Chandigarh 228,276 110,480 48.40 105,357 46.15 12,439 5.45
7 Chhattisgarh 1,238,738 867,179 70.01 293,600 23.70 77,959 6.29
8 Dadra & Nagar Haveli 37,655 13,089 34.76 23,698 62.93 868 2.31
9 Daman & Diu 47,631 13,743 28.85 32,330 67.88 1,558 3.27
10 Goa 198,139 145,304 73.33 44,791 22.61 8,044 4.06
11 Gujarat 5,416,315 3,927,857 72.52 1,315,157 24.28 173,301 3.20
12 Haryana 1,751,901 1,318,409 75.26 380,254 21.71 53,238 3.04
13 Himachal Pradesh 166,043 82,152 49.48 75,029 45.19 8,862 5.34
14 Jammu & Kashmir 517,168 471,821 91.23 33,531 6.48 11,816 2.28
15 Jharkhand 1,495,642 944,950 63.18 408,108 27.29 142,584 9.53
16 Karnataka 5,315,715 2,713,891 51.05 2,447,718 46.05 154,106 2.90
17 Kerala 3,620,696 3,196,968 88.30 362,153 10.00 61,575 1.70
18 Lakshadweep 8,180 6,727 82.24 1,289 15.76 164 2.00
19 Madhya Pradesh 3,845,232 2,862,789 74.45 811,821 21.11 170,622 4.44
20 Maharashtra 10,813,928 7,545,680 69.78 2,940,731 27.19 327,517 3.03
21 Manipur 171,400 152,379 88.90 15,648 9.13 3,373 1.97
22 Meghalaya 116,102 51,289 44.18 58,765 50.61 6,048 5.21
23 Mizoram 116,203 55,708 47.94 57,059 49.10 3,436 2.96
24 Nagaland 115,054 46,645 40.54 63,227 54.95 5,182 4.50
25 NCT Of Delhi 3,261,423 2,214,621 67.90 929,112 28.49 117,690 3.61
26 Odisha 1,517,073 909,644 59.96 476,402 31.40 131,027 8.64
27 Puducherry 206,143 118,093 57.29 80,274 38.94 7,776 3.77
28 Punjab 2,094,067 1,639,740 78.30 390,177 18.63 64,150 3.06
29 Rajasthan 3,090,940 2,499,269 80.86 523,159 16.93 68,512 2.22
30 Sikkim 35,761 11,760 32.88 22,752 63.62 1,249 3.49
31 Tamil Nadu 8,929,104 5,130,112 57.45 3,590,179 40.21 208,813 2.34
32 Tripura 235,002 192,606 81.96 35,626 15.16 6,770 2.88
33 Uttar Pradesh 7,449,195 6,123,592 82.20 1,114,832 14.97 210,771 2.83
34 Uttarakhand 592,223 395,519 66.79 157,724 26.63 38,980 6.58
35 West Bengal 6,350,113 4,798,614 75.57 1,292,263 20.35 259,236 4.08
India 78,865,937 54,542,327 69.16 21,723,723 27.55 2,599,887 3.30
Source: Census of India-2011

Handbook of Urban Statistics
172
Gra
ph 7
.5: S
tate
-wis
e U
rban
Hou
seho
lds
livin
g in
Hou
ses
by ‘O
wne
rshi
p/Te
nure
Sta
tus
of D
wel
ling
Uni
ts’ i
n In
dia
- 201
1 (%
)
Sou
rce:
Cen
sus
of In
dia,
201
1

Urban Housing
173
Table7.9: Households with condition of House-2001-11
S. No. States/UTs
2001 2011Percentage of households with condition of Census House as
Percentage of households with condition of Census House as
Good Liveable Dilapidated Good Liveable Dilapidated1 Andaman & Nicobar Islands 62.08 35.04 2.88 76.52 22.19 1.292 Andhra Pradesh 71.92 25.87 2.21 78.95 19.57 1.483 Arunachal Pradesh 56.31 39.1 4.59 58.52 38.69 2.804 Assam 51.98 41.49 6.53 58.92 35.42 5.665 Bihar 54.22 37.75 8.03 53.05 40.04 6.916 Chandigarh 69.72 27.48 2.8 69.86 26.60 3.537 Chhattisgarh 60.16 37.01 2.82 64.24 33.13 2.648 Dadra & Nagar Haveli 61.91 35.91 2.18 78.96 20.80 0.249 Daman & Diu 84.35 14.42 1.23 65.31 34.16 0.54
10 Goa 68.53 27.49 3.98 76.89 21.80 1.3111 Gujarat 67.25 30.8 1.94 76.52 22.62 0.8612 Haryana 58.64 37.49 3.87 62.92 33.70 3.3813 Himachal Pradesh 73.28 23.93 2.78 80.12 18.47 1.4114 Jammu & Kashmir 57.16 40.15 2.69 70.86 26.28 2.8615 Jharkhand 59.58 36.03 4.39 59.94 36.33 3.7316 Karnataka 58.41 38.25 3.34 72.40 25.67 1.9317 Kerala 64.85 29.45 5.7 72.37 23.69 3.9418 Lakshadweep 80.23 18.59 1.18 85.21 14.32 0.4819 Madhya Pradesh 63.49 33.37 3.14 67.60 29.70 2.7020 Maharashtra 62.61 34.34 3.04 73.13 24.99 1.8721 Manipur 62.17 34.14 3.7 63.38 32.14 4.4822 Meghalaya 60.88 34.61 4.51 69.53 27.73 2.7423 Mizoram 59.62 39.33 1.05 73.64 24.86 1.5024 Nagaland 49.6 45.97 4.43 62.04 36.07 1.8925 NCT Of Delhi 58.94 35.64 5.41 66.02 31.21 2.7726 Odisha 46.25 45.92 7.83 51.54 42.65 5.8127 Puducherry 91.34 8.06 0.61 79.95 18.86 1.1928 Punjab 63.94 32.24 3.82 57.32 37.44 5.2429 Rajasthan 62.38 35.34 2.28 68.90 29.29 1.8130 Sikkim 85.8 12.7 1.5 80.29 17.95 1.7631 Tamil Nadu 89.94 9.34 0.72 76.40 22.42 1.1832 Tripura 61.6 34.15 4.25 63.63 32.14 4.2333 Uttar Pradesh 54.9 40.46 4.64 56.98 39.15 3.8834 Uttarakhand 70.95 25.75 3.3 74.41 23.06 2.5335 West Bengal 53.77 39.75 6.48 57.52 35.87 6.60
India 64.16 32.24 3.6 68.44 28.67 2.88
Source: Census of India-2001 & 2011

Handbook of Urban Statistics
174
Graph 7.6: Condition of Census Houses-2001
Source: Census of India, 2001
Graph 7.7: Condition of Census Houses-2011
Source: Census of India, 2011

Directory of Urban Centers in the Country with Population (2011)
1Annexure


Annexure-1: Directory of Urban Centers in the Country with Population (2011)
177
Tow
n N
ame
Popu
latio
n
Jam
mu
& K
ashm
ir
Srin
agar
(M C
orp.
)1,
180,
570
Jam
mu
(M C
orp.
)50
2,19
7
Ana
ntn
ag (M
Cl)
109,
433
Sopo
re (M
Cl)
61,0
98
Bara
mul
a (M
Cl)
58,0
53
Kath
ua (M
Cl)
51,9
91
Udh
ampu
r (M
Cl)
35,5
07
Punc
h (M
Cl)
26,8
54
Band
ipor
e (M
C)37
,081
Leh
Lada
kh (M
C)30
,870
Raja
uri (
MC)
29,4
86
Gan
derb
al (M
C)28
,233
Kulg
am (M
C)23
,584
Dur
u Ve
rina
g (M
C)22
,968
Bijb
ehar
a (M
C)22
,789
Kupw
ara
(MC)
21,7
71
Pam
pore
(MC)
21,6
80
Dod
a (M
C)21
,605
Akh
noor
(MC)
20,7
56
Patt
an (M
C)19
,538
Pulw
ama
(MC)
18,4
40
Tral
(MC)
17,8
44
Ach
haba
l (M
C)17
,556
Shup
iyan
(MC)
16,3
60
Karg
il (M
C)16
,338
Tow
n N
ame
Popu
latio
nBa
ri B
rahm
ana
(MC)
15,4
53
Badg
am (M
C) 1
5,33
8
R.S.
Por
a (M
C)15
,197
Sum
bal (
MC)
15,0
41
Kish
twar
(MC)
14,8
65
Han
dwar
a (M
C)13
,600
Haj
an (M
C)13
,239
Qui
moh
(MC)
13,1
38
Sam
ba (M
C)12
,700
Aw
antip
ora
(MC)
12,6
47
Yari
Por
a (M
C)12
,123
Arw
ani (
MC)
11,8
15
Char
ar-i-
Shar
ief (
MC)
11,5
33
Bhad
erw
ah (M
C)11
,084
Meh
moo
d Po
ra (M
C)10
,910
Bish
na (M
C)10
,719
Now
sheh
ra (M
C)10
,408
Qaz
i Gun
d (M
C)9,
871
Khre
w (M
C)9,
851
Dev
sar
(MC)
9,76
5
Uri
(MC)
9,36
6
Paha
lgam
(MC)
9,26
4
Matt
an (M
C)9,
246
Katr
a (M
C)9,
008
Arn
ia (M
C)8,
948
Hira
naga
r (M
C)8,
294
Ann
exur
e 1.
Dir
ecto
ry o
f Urb
an C
ent e
rs in
the
Coun
try
wit
h Po
pula
tion
(201
1)

Handbook of Urban Statistics
178
Tow
n N
ame
Popu
latio
nSe
er H
amda
n (M
C)8,
233
Beer
wah
(MC)
8,19
2
Vija
y Pu
r (M
C)8,
044
Shan
gus
(MC)
7,87
5
Reas
i (M
C)7,
796
Paro
le (M
C)7,
681
Wat
ra G
am (M
C)7,
015
Khor
e (M
C)6,
931
Sund
erba
ni (M
C)6,
930
Sura
nkot
e (M
C)6,
743
Koke
r N
ag (M
C)6,
553
Ais
hmuq
uam
(MC)
6,51
9
Chad
ura
(MC)
6,48
2
Ram
Nag
ar (M
C)6,
292
Ram
garh
(MC)
5,61
2
Ash
muj
i Kha
lsa
(MC)
5,56
7
Than
aman
di (M
C)5,
490
Mag
am (M
C)5,
470
Bash
ohli
(MC)
5,43
3
Fris
al (M
C)5,
132
Billa
war
(MC)
4,97
8
Bato
te (M
C)4,
315
Gho
man
hasa
n (M
C)3,
944
Jour
ian
(MC)
3,93
4
Bani
hal (
MC)
3,90
0
Ram
ban
(MC)
3,59
6
Lakh
anpu
r (M
C)3,
461
Khan
sahi
b (M
C)2,
630
Chen
ani (
MC)
2,62
0
Tow
n N
ame
Popu
latio
nG
ulm
arg
(MC)
1,96
5
Kunz
er (M
C)1,
890
Kud
(MC)
1,56
5
Pura
na D
aroo
rh (M
C)67
5
Jam
mu
Cantt
. (CB
)28
,396
Bada
mi B
agh
(CB)
22,2
14
Raip
ur D
oman
a (C
T)20
,238
Treh
gam
(CT)
15,5
87
Bhal
wal
(CT)
14,1
74
Kral
Por
a (C
T)13
,889
Nag
rota
(CT)
13,8
36
Dru
g M
ulla
(CT)
12,9
30
Chug
lam
sar
(CT)
10,7
54
Safa
Por
a (C
T)10
,471
Tang
dhar
(CT)
9,90
4
Dar
a Po
ra (C
T)8,
464
Wai
l (CT
)8,
335
Rakh
Gad
i Gar
h (C
T)7,
588
Ichg
am (C
T)7,
461
Nag
am (C
T)7,
365
Reha
mba
l (CT
)7,
351
Birp
ur (C
T)7,
177
Kral
Por
a (C
T)6,
518
Rath
ian
(CT)
6,36
5
Bhor
e (C
T)6,
360
Her
i (CT
)6,
348
Now
anga
bra
(CT)
5,63
4
Lasj
an (C
T)5,
281
Chak
Ra
tnu
(CT)
5,22
8

Annexure-1: Directory of Urban Centers in the Country with Population (2011)
179
Tow
n N
ame
Popu
latio
nTa
lwar
a (C
T)5,
125
Nak
a M
ajia
ri (C
T)5,
033
Dha
nde
Kala
n (C
T)4,
887
Chha
tha
(CT)
4,75
8
Chak
Kal
u (C
T)4,
725
Gor
ah S
alat
hian
(CT)
4,62
9
Mar
hi (C
T)4,
392
Mar
alia
(CT)
4,32
7
Spitu
k (C
T)4,
047
Sool
Koo
t (CT
)3,
973
Nih
alpu
r Si
mba
l (CT
)3,
869
Khon
moh
(CT
)2,
664
Now
Gam
(CT
)2,
490
Him
acha
l Pra
desh
Shim
la (M
Cor
p.)
169,
578
Sola
n (M
Cl)
39,2
56
Nah
an (M
Cl)
28,8
99
Man
di (M
Cl)
26,4
22
Badd
i (M
Cl)
25,6
39
Paon
ta S
ahib
(M C
l)25
,183
Sund
arna
gar
(M C
l)24
,344
Dha
rmsa
la (M
Cl)
22,5
79
Cham
ba (M
Cl)
19,9
33
Una
(M C
l)18
,722
Kullu
(M C
l)18
,536
Ham
irpu
r (M
Cl)
17,6
04
Bila
spur
(M C
l)13
,654
Nal
agar
h (M
Cl)
10,7
08
Nur
pur
(M C
l)9,
807
Tow
n N
ame
Popu
latio
nKa
ngra
(M C
l)9,
528
Parw
anoo
(M C
l)8,
758
Man
ali (
M C
l)8,
096
Ghu
mar
win
(M C
l)7,
899
Dal
hous
ie (M
Cl)
7,05
1
Rohr
u (M
Cl)
6,87
5
Nag
rota
Bag
wan
(M C
l)5,
900
Ram
pur
(M C
l)5,
655
Theo
g (M
Cl)
4,35
3
Pala
mpu
r (M
Cl)
3,54
3
Nai
na D
evi (
M C
l)1,
204
Yol (
CB)
12,0
28
Kasa
uli (
CB)
3,88
5
Saba
thu
(CB)
3,68
5
Dal
hous
ie (C
B)3,
549
Dag
shai
(CB)
2,90
4
Juto
gh (C
B)2,
062
Bakl
oh (C
B)1,
805
Sant
okhg
arh
(NP)
9,36
3
Meh
atpu
r Ba
sdeh
ra (N
P)9,
218
Tira
Suj
anpu
r (N
P)7,
943
Jaw
alam
ukhi
(NP)
5,36
1
Jogi
ndar
naga
r (N
P)5,
335
Der
a G
opip
ur (N
P)4,
816
Sark
agha
t (N
P)4,
715
Bhun
tar
(NP)
4,47
5
Nad
aun
(NP)
4,43
0
Gag
ret (
NP)
3,84
7
Chua
ri K
has
(NP)
3,77
0

Handbook of Urban Statistics
180
Tow
n N
ame
Popu
latio
nD
aula
tpur
(NP)
3,76
3
Rajg
arh
(NP)
3,08
3
Ark
i (N
P)3,
040
Seon
i (N
P)2,
591
Tala
i (N
P)2,
372
Chau
pal (
NP)
1,
851
Raw
alsa
r (N
P)1,
821
Jubb
al (N
P)1,
640
Bhot
a (N
P)1,
453
Banj
ar (N
P)1,
414
Kotk
hai (
NP)
1,19
0
Nar
kand
a (N
P)90
1
Sham
shi (
CT)
8,87
0
Jhak
hri (
CT)
4,65
5
Indo
ra (C
T)4,
534
Punj
ab
Ludh
iana
(M C
orp.
)1,
618,
879
Am
rits
ar (M
Cor
p.)
1,13
2,38
3
Jala
ndha
r (M
Cor
p.)
862,
886
Patia
la (M
Cor
p.)
406,
192
Bath
inda
(M C
orp.
)28
5,78
8
Hos
hiar
pur
(M C
l)16
8,65
3
Bata
la (M
Cl)
156,
619
Mog
a (M
Cl)
150,
411
Path
anko
t (M
Cl)
148,
937
S.A
.S. N
agar
(M C
l)14
6,21
3
Abo
har
(M C
l)14
5,30
2
Mal
erko
tla (M
Cl)
135,
424
Khan
na (M
Cl)
128,
137
Tow
n N
ame
Popu
latio
nM
ukts
ar (M
Cl)
116,
747
Barn
ala
(M C
l)11
6,44
9
Firo
zpur
(M C
l)11
0,31
3
Kapu
rtha
la (M
Cl)
98,9
16
Phag
war
a (M
Cl)
97,8
64
Zira
kpur
(M C
l)95
,553
Rajp
ura
(M C
l)92
,301
Kot K
apur
a (M
Cl)
91,9
79
Sang
rur
(M C
l)88
,043
Fari
dkot
(M C
l)85
,435
Man
sa (M
Cl)
82,9
56
Mal
out (
M C
l)81
,406
Fazi
lka
(M C
l)76
,492
Gur
dasp
ur (M
Cl)
75,5
49
Khar
ar (M
Cl)
74,4
60
Gob
indg
arh
(M C
l)73
,130
Nab
ha (M
Cl)
67,9
72
Tarn
Tar
an (M
Cl)
66,8
47
Jagr
aon
(M C
l)65
,240
Sirh
ind
Fate
hgar
h Sa
hib
(M C
l)58
,097
Rupn
agar
(M C
l)56
,038
Suna
m U
dham
Sin
gh W
ala
(M C
l)55
,455
Dhu
ri (M
Cl)
55,2
25
Sam
ana
(M C
l)54
,072
Ram
pura
Phu
l (M
Cl)
48,4
50
Naw
ansh
ahr
(M C
l)46
,024
Gid
derb
aha
(M C
l)45
,370
Nan
gal (
M C
l)41
,172
Patti
(M C
l)40
,976

Annexure-1: Directory of Urban Centers in the Country with Population (2011)
181
Tow
n N
ame
Popu
latio
nJa
lala
bad
(M C
l)38
,965
Jaitu
(M C
l)37
,004
Nak
odar
(M C
l)36
,973
Zira
(M C
l)36
,732
Mau
r (M
Cl)
31,8
49
Ahm
edga
rh (M
Cl)
31,3
02
Kura
li (M
Cl)
31,0
60
Muk
eria
n (M
Cl)
29,8
41
Jand
iala
(M C
l)29
,232
Raik
ot (M
Cl)
28,7
34
Suja
npur
(M C
l)28
,270
Patr
an (M
Cl)
27,9
63
Der
a Ba
ssi (
M C
l)26
,295
Budh
lada
(M C
l)26
,172
Kart
arpu
r (M
Cl)
25,6
62
Dor
aha
(M C
l)25
,424
Bagh
a Pu
rana
(M C
l)25
,206
Das
ua (M
Cl)
25,1
92
Mac
hhiw
ara
(M C
l)24
,916
Phill
aur
(M C
l)24
,688
Mor
inda
(M C
l)24
,022
Din
a N
agar
(M C
l)23
,976
Long
owal
(M C
l)23
,851
Urm
ar T
anda
(M C
l)23
,419
Tapa
(M C
l)23
,248
Lehr
agag
a (M
Cl)
22,5
88
Ram
an (M
Cl)
22,5
53
Bhaw
anig
arh
(M C
l)22
,320
Qad
ian
(M C
l)21
,899
Tow
n N
ame
Popu
latio
nBa
lach
aur
(M C
l)21
,631
Sana
ur (M
Cl)
21,2
01
Ada
mpu
r (M
Cl)
20,9
22
Bang
a (M
Cl)
20,9
06
Bass
i Pat
hana
(M C
l)20
,288
Dha
naul
a (M
Cl)
19,9
20
Sam
rala
(M C
l)19
,678
Dha
ram
kot (
M C
l)19
,057
Banu
r (M
Cl)
18,7
75
Bhad
aur
(M C
l)18
,561
Bare
ta (M
Cl)
17,4
32
Talw
andi
Bha
i (M
Cl)
17,2
85
Gur
u H
ar S
ahai
(M
Cl)
17,1
92
Gar
hsha
nkar
(M C
l)16
,955
Sulta
npur
(M C
l)16
,877
Dha
riw
al (M
Cl)
16,7
72
Ana
ndpu
r Sa
hib
(M C
l)16
,282
Raho
n (M
Cl)
15,6
76
Gon
iana
(M C
l)15
,208
Bhuc
ho M
andi
(M C
l)14
,961
Am
loh
(M C
l)14
,696
Nur
mah
al (M
Cl)
14,5
60
Maj
itha
(M C
l)14
,503
Fate
hgar
h Ch
uria
n (M
Cl)
13,0
70
Har
iana
(M C
l)8,
928
Sri H
argo
bind
pur
(M C
l)8,
241
Paya
l (M
Cl)
7,92
3
Ala
wal
pur
(M C
l)7,
815
Gar
dhiw
ala
(M C
l)7,
593

Handbook of Urban Statistics
182
Tow
n N
ame
Popu
latio
nKo
t Fatt
a (M
Cl)
7,41
2
Ram
das
(M C
l)6,
398
Der
a Ba
ba N
anak
(M C
l)6,
394
Sham
Cha
uras
i (M
Cl)
4,42
6
Sang
at (M
Cl)
2,74
4
Firo
zpur
Can
tt (C
B)53
,199
Jala
ndha
r Ca
ntt. (
CB)
47,8
45
Am
rits
ar C
antt
. (CB
)10
,410
Nay
a G
aon
(NP)
50,8
69
Sahn
ewal
(N
P)22
,484
Ajn
ala
(NP)
21,1
07
Talw
andi
Sab
o (N
P)20
,589
Sard
ulga
rh (N
P)19
,219
Moo
nak
(NP)
18,1
41
Bhik
hi (N
P)17
,825
Bhog
pur
(NP)
17,5
49
Dir
ba (N
P)16
,952
Gor
aya
(NP)
16,4
62
Mul
lanp
ur D
akha
(NP)
16,3
56
Mal
lanw
ala
Khas
s (N
P)16
,183
Mak
hu (N
P)14
,658
Rayy
a (N
P)14
,506
Shah
kot (
NP)
14,4
88
Bhag
ta B
hai K
a (N
P)14
,467
Raja
San
si (N
P)14
,298
Khan
auri
(NP)
14,0
96
Cham
kaur
Sah
ib (N
P)13
,920
Khem
Kar
an (N
P)13
,446
Han
diay
a (N
P)12
,507
Tow
n N
ame
Popu
latio
nCh
eem
a (N
P)11
,615
Mah
ilpur
(NP)
11,3
60
Bhul
ath
(NP)
10,5
48
Mud
ki (N
P)10
,415
Lohi
an K
hass
(NP)
10,3
62
Gha
gga
(NP)
10,1
62
Kham
anon
(NP)
1013
5
Bego
wal
(NP)
10,1
16
Bari
wal
a (N
P)8,
668
Dhi
lwan
(NP)
8,15
7
Mal
oud
(NP)
7,56
7
Bhad
son
(NP)
7,26
0
Gha
naur
(NP)
6,98
5
Badh
ni K
alan
(NP)
6,78
6
Mam
un (C
T)32
,689
Gill
(CT)
28,8
84
Meh
na (C
T)27
,733
Lalr
u (C
T)21
,394
Bhik
hiw
ind
(CT)
20,5
26
Nan
gli (
CT)
20,4
40
Phag
war
a Sh
arki
(CT)
20,1
02
Talw
ara
(CT)
19,4
85
Balo
ngi (
CT)
15,9
82
Hus
sain
pur
(CT)
15
,575
Jugi
al (C
T)15
,210
Bham
ian
Kala
n (C
T)13
,174
Dau
latp
ur (C
T)12
,988
Kot I
se K
han
(CT)
12,8
00
Thar
ike
(CT)
12,2
94

Annexure-1: Directory of Urban Centers in the Country with Population (2011)
183
Tow
n N
ame
Popu
latio
nTi
bri (
CT)
11,8
45
Bhatti
an (C
T)11
,066
Budh
a Th
eh (C
T)10
,979
Part
ap S
ingh
wal
a (C
T)10
,843
Bhan
khar
pur
(CT)
10,7
68
Kath
ania
n (C
T)10
,679
Rurk
i Kas
ba (C
T)10
,509
Alh
oran
(CT)
10,2
18
Hal
war
a (C
T)9,
761
Neh
on (C
T)9,
439
Sufip
ind
(CT)
9,40
6
Soha
na (C
T)9,
306
Baba
Bak
ala
(CT)
8,94
6
Nar
ot M
ehra
(CT)
8,88
5
Saty
ewal
a (C
T)8,
724
Jand
iala
(CT)
8,48
7
Nilp
ur (C
T)8,
391
Fate
h N
anga
l (CT
)7,
721
Aka
lgar
h (C
T)7,
678
Rail
(CT)
7,58
9
Am
arga
rh (C
T)7,
339
Choh
al (C
T)73
04
Sara
i Kha
s (C
T)7,
044
Gho
h (C
T)6,
883
Badd
owal
(CT)
6,82
5
Man
wal
(CT)
6,49
6
Apr
a (C
T)6,
258
Mul
lanp
ur G
arib
Das
s (C
T)6,
165
Haz
ipur
(CT)
6,09
1
Tow
n N
ame
Popu
latio
nM
irpu
r (C
T)5,
967
Dhi
n (C
T)5,
961
Dap
er (C
T)5,
936
Sarn
a (C
T)5,
847
Kori
anw
ali (
CT)
5,77
0Ra
kri (
CT)
5,72
2Kh
ambr
a (C
T)5,
483
Behr
ampu
r (C
T)5,
432
Chog
awan
(CT)
5,41
6Ko
t (CT
)5,
406
Bung
al (C
T)5,
257
Mub
arak
pur
(CT)
5,21
7Th
aria
l (CT
)5,
081
Khot
hran
(CT)
5,04
6G
hana
uli (
CT)
4,89
4Bh
isia
na (C
T)4,
890
Kotla
Nih
ang
(CT)
4,71
5Sa
nsar
pur
(CT)
4,65
7M
alik
pur
(CT)
4,64
5Kh
ilchi
an (C
T)4,
588
Salo
h (C
T)4,
481
Chac
hoki
(CT)
4,30
7D
haki
(CT)
4,20
3A
ur (C
T)4,
063
Shik
ar (C
T)4,
001
Raip
ur R
asul
pur
(CT)
3,91
6M
udal
(CT)
3,88
2Jo
dhan
(CT)
3,84
5Ch
omon
(CT)
3,70
4Ba
ryar
(CT)
3,52
0

Handbook of Urban Statistics
184
Tow
n N
ame
Popu
latio
nCh
andi
garh
Chan
diga
rh (M
Cor
p.)
961,
587
Man
i Maj
ra (R
), Ba
sti K
isha
ngar
h, B
asti
Bhag
wan
pura
(CT)
15,4
89
Dar
ia (C
T)14
,470
Mau
li Ja
gran
(CT)
10,7
86
Behl
ana
(CT)
8,28
1
Khud
a A
lishe
r (C
T)6,
831
Utt
arak
hand
Deh
radu
n (M
Cor
p.)
569,
578
Deh
radu
n (C
B)52
,716
Clem
ent T
own
(CB)
22,5
57
Rani
khet
(CB)
18,8
86
Roor
kee
(CB)
14,6
89
Lans
dow
ne (C
B)5,
667
Chak
rata
(CB)
5,11
7
Land
aur
(CB)
3,53
9
Nai
nita
l (CB
)1,
398
Alm
ora
(CB)
1,39
1
Laks
ar (N
P)21
,760
Land
haur
a (N
P)18
,370
Mah
ua K
hera
ganj
(NP)
12,5
84
Din
eshp
ur (N
P)11
,343
Jhab
rera
(NP)
11,1
86
Kela
Khe
ra (N
P)10
,929
Mun
i Ki R
eti (N
P)10
,620
Sulta
npur
(NP)
9,88
1
Her
bert
pur
(NP)
9,78
2
Goc
har
(NP)
8,86
4
Tow
n N
ame
Popu
latio
nD
oiw
ala
(NP)
8,70
9
Karn
apra
yag
(NP)
8,29
7
Loha
ghat
(NP)
7,92
6
Cham
ba (N
P)
7,77
1
Bhim
tal (
NP)
7,72
2
Lalk
uan
(NP)
7,64
4
Kala
dhun
gi (N
P)7,
611
Mah
ua D
abra
Har
ipur
a (N
P)7,
326
Dha
rchu
la (N
P)7,
039
Bark
ot (N
P)6,
720
Did
ihat
(NP)
6,52
2
Shak
tigar
h (N
P)6,
309
Cham
paw
at (N
P)4,
801
Dev
apra
yag
(NP)
2,86
8
Dw
arah
at (N
P)2,
749
Badr
inat
hpur
i (N
P)2,
438
Nan
dpra
yag
(NP)
1,64
1
Kirti
naga
r (N
P)1,
517
Keda
rnat
h (N
P)61
2
Gan
gotr
i (N
P)11
0
Har
dwar
(NPP
)22
8,83
2
Hal
dwan
i-cum
-Kat
hgod
am (N
PP)
156,
078
Rudr
apur
(NPP
)14
0,85
7
Kash
ipur
(NPP
)12
1,62
3
Roo
rkee
(NPP
)11
8,20
0
Ris
hike
sh (N
PP)
70,4
99
Pith
orag
arh
(NPP
)56
,044
Ram
naga
r (N
PP)
54,7
87
Man
glau
r (N
PP)
52,9
71

Annexure-1: Directory of Urban Centers in the Country with Population (2011)
185
Tow
n N
ame
Popu
latio
nJa
spur
(NPP
)50
,523
Kich
ha (N
PP)
41,9
65
Nai
nita
l (N
PP)
41,3
77
Alm
ora
(NPP
)34
,122
Mus
soor
ie (N
PP)
30,1
18
Sita
rgan
j (N
PP)
29,9
65
Kotd
war
a (N
PP)
28,8
59
Bajp
ur (N
PP)
25,5
24
Paur
i (N
PP)
25,4
40
Tehr
i (N
PP)
24,0
14
Cham
oli G
opes
hwar
(NPP
)21
,447
Srin
agar
(NPP
)20
,115
Gad
arpu
r (N
PP)
19,3
01
Tana
kpur
(NPP
)17
,626
Utt
arka
shi (
NPP
)17
,475
Josh
imat
h (N
PP)
16,7
09
Khati
ma
(NPP
)15
,093
Vika
snag
ar (N
PP)
13,9
27
Rudr
apra
yag
(NPP
)9,
313
Bage
shw
ar (N
PP)
9,07
9
Bhow
ali (
NPP
)6,
309
Nar
endr
anag
ar (N
PP)
6,04
9
Dog
adda
(NPP
)2,
422
Bhar
at H
eavy
Ele
ctri
cals
Lim
ited
Rani
pur
(ITS)
46,9
48
Virb
hadr
a ID
PL (I
TS)
8,58
0
Raip
ur (C
T)32
,900
Dha
nder
a (C
T)23
,276
Muk
hani
(CT)
22,4
75
Tow
n N
ame
Popu
latio
nN
agla
(CT)
22,2
58
Um
ru K
hurd
(CT)
20,5
93
Dha
luw
ala
(CT)
18,0
16
Raw
ali M
ahdo
od (C
T)17
,467
Cent
ral H
ope
Tow
n (C
T)16
,880
Jagj
eetp
ur (C
T)15
,043
Moh
anpu
r M
oham
mad
pur
(CT)
14,3
94
Natt
han
Pur
(CT)
13,9
05
Meh
u W
ala
Mafi
(CT)
13,4
75
Sunh
aira
(CT)
13,2
48
Pada
li G
ujar
(CT)
12,9
01
Fate
hpur
Ran
ge (D
ham
ua D
unga
Are
a)
(CT)
12,7
91
Jiwan
garh
(CT)
11,8
70
Band
iya
(CT)
11,3
92
Shafi
pur
(CT)
11,1
35
Mah
oliy
a (C
T)10
,965
Kash
iram
pur
(CT)
10,8
37
Har
ipur
Kal
an (C
T)10
,367
Sale
mpu
r Ra
jput
an (C
T)10
,340
Baha
dara
bad
(CT)
10,0
96
Pira
n Ka
liyar
(CT)
10,0
43
Pada
mpu
r Su
khra
n (C
T)9,
802
Prati
tnag
ar (C
T)9,
564
Natt
huw
ala
(CT)
9,20
6
Bang
heri
mah
abat
pur
(CT)
8,58
3
Khar
ak m
afi (C
T)8,
404
Hal
dwan
i Tal
li (C
T)8,
159
Rish
ikes
h (C
T)8,
033

Handbook of Urban Statistics
186
Tow
n N
ame
Popu
latio
nBa
nbas
a (C
T)7,
990
Bhag
wan
pur
(CT)
7,57
3
Gum
aniw
ala
(CT)
6,95
3
Khan
jarp
ur (C
T)6,
435
Nag
ala
Imar
ti (C
T)5,
774
Shah
pur
(CT)
5,68
4
Said
pura
(CT)
5,64
0
Khat
yari
(CT)
5,16
6
Jonk
(CT)
4,66
9
Kanc
hal G
osai
n (C
T)4,
632
Har
yana
Fari
daba
d (M
Cor
p.)
1,41
4,05
0
Gur
gaon
(M C
orp.
)87
6,96
9
Roht
ak (M
Cl)
374,
292
His
ar (M
Cl)
301,
383
Pani
pat (
M C
l)29
4,29
2
Karn
al (M
Cl)
286,
827
Soni
pat (
M C
l)27
8,14
9
Yam
unan
agar
(M C
l)21
6,67
7
Panc
hkul
a (M
Cl)
211,
355
Bhiw
ani (
M C
l)19
6,05
7
Am
bala
(M C
l)19
5,15
3
Sirs
a (M
Cl)
182,
534
Baha
durg
arh
(M C
l)17
0,76
7
Jind
(M C
l)16
7,59
2
Than
esar
(M C
l)15
5,15
2
Kaith
al (M
Cl)
144,
915
Rew
ari (
M C
l)14
3,02
1
Palw
al (M
Cl)
128,
730
Tow
n N
ame
Popu
latio
nJa
gadh
ri (M
Cl)
124,
894
Am
bala
Sad
ar (M
Cl)
103,
093
Han
si (M
Cl)
86,7
70
Nar
naul
(M C
l)74
,581
Fate
haba
d (M
Cl)
70,7
77
Toha
na (M
Cl)
63,8
71
Nar
wan
a (M
Cl)
62,0
90
Pund
ri (M
C)18
,872
Goh
ana
(MC)
65,7
08
Char
khi D
adri
(MC)
56,3
37
Man
di D
abw
ali (
MC)
52,8
73
Hod
al (M
C)50
,143
Jhaj
jar
(MC)
48,4
24
Barw
ala
(MC)
43,3
84
Shah
bad
(MC)
42,6
07
Chee
ka (M
C)38
,952
Peho
wa
(MC)
38,8
53
Sam
alkh
a (M
C)38
,675
Gha
raun
da (M
C)37
,816
Ratia
(MC)
37,1
52
Elle
naba
d (M
C)36
,623
Sohn
a (M
C)36
,552
Pin
jore
(MC)
35,9
12
Gan
aur
(MC)
35,6
03
Safid
on (M
C)34
,728
Kalk
a (M
C)32
,255
Dha
ruhe
ra (M
C)30
,344
Mah
endr
agar
h (M
C)29
,128
Ladw
a (M
C)28
,887

Annexure-1: Directory of Urban Centers in the Country with Population (2011)
187
Tow
n N
ame
Popu
latio
nA
ssan
dh (M
C)27
,125
Tara
ori (
MC)
25,9
44
Rani
a (M
C)25
,123
Khar
khod
a (M
C)25
,051
Fero
zepu
r jh
irka
(MC)
24,7
50
Puna
hana
(MC)
24,7
34
Kala
naur
(MC)
23,3
19
Nar
aing
arh
(MC)
22,8
32
Taor
u (M
C)22
,599
Kala
nwal
i (M
C)22
,095
Hai
ley
Man
di (M
C)20
,906
Sam
pla
(MC)
20,5
63
Mah
am (M
C)20
,484
Pata
udi (
MC)
20,4
18
Baw
ani k
hera
(MC)
20,2
89
Siw
ani (
MC)
19,1
43
Jula
na (M
C)18
,755
Kala
yat (
MC)
18,6
60
Nilo
kher
i (M
C)17
,938
Indr
i (M
C)17
,487
Nis
sing
(MC)
17,4
38
Nar
naun
d (M
C)17
,242
Uch
ana
(MC)
16,8
15
Baw
al (M
C)16
,776
Nuh
(MC)
16,2
60
Beri
(MC)
15,9
34
Hat
hin
(MC)
14,4
21
Loha
ru (M
C)13
,937
Farr
ukhn
agar
(MC)
13,5
13
Tow
n N
ame
Popu
latio
nKa
nina
(MC)
12,9
89
Has
san
Pur
(MC)
11,5
69
Atel
i (M
C)7,
619
Am
bala
Can
tt. (
CB)
55,3
70
Pani
pat T
araf
Mak
hdum
Zad
gan
(CT)
67,9
98
Pani
pat T
araf
Ans
ar (C
T)42
,877
Pani
pat T
araf
Raj
puta
n (C
T)28
,803
Babi
yal (
CT)
26,4
12
Gan
gwa
(CT)
25,8
47
Ada
mpu
r (C
T)25
,531
Ugr
a Kh
eri (
CT)
24,4
40
Man
esar
(CT)
23,4
48
Palw
al (R
ural
) (Pa
rt) (
CT)
23,0
72
Sasa
uli (
CT)
22,4
79
Kund
li (C
T)21
,633
Bara
ra (C
T)21
,545
Tilp
at (
CT)
20,5
14
Kans
epur
(CT)
18,9
09
Kard
han
(CT)
18,6
62
Kher
i Nan
gal (
CT)
18,1
95
Bhon
dsi
(CT)
17,4
10
Bads
hahp
ur (C
T) (P
art)
15,5
93
Tosh
am (C
T)15
,559
Sada
ura
(CT)
14,8
18
Jand
li (P
art)
(CT)
14,3
97
Ism
aila
bad
(CT)
13,7
26
Rada
ur (C
T)13
,690
Ukl
ana
Man
di (C
T)13
,219
Ping
wan
(CT)
12,6
12

Handbook of Urban Statistics
188
Tow
n N
ame
Popu
latio
nSa
trod
Kal
an (C
T)11
,932
Bila
spur
(CT)
11,7
33
Nag
ina
(CT)
11,4
17
Satr
od K
has
(CT)
10,9
32
Buri
a (C
T)10
,903
Chha
chhr
auli
(CT)
10,5
33
Bhak
ali (
CT)
9,97
0
Fara
khpu
r (C
T)9,
569
Badh
i Maj
ra (C
T)9,
188
Mah
esha
ri (C
T)9,
180
Chan
di M
andi
r (C
T)9,
051
Mus
tafa
bad
(CT)
9,04
2
Raip
ur R
ani (
CT)
9,02
8
Unc
ha S
iwan
a (C
T)8,
922
Sika
nder
pur
(CT)
8,89
4
Sect
or 1
1,12
Par
t I &
II (C
T)8,
876
Nag
al C
haud
hry
(CT)
8,53
8
Boh
(CT)
8,48
2
Saha
(CT)
8,10
0
Gar
hi H
arsa
ru (C
T)7,
894
Jhak
al M
andi
(CT)
7,78
8
Suna
ri K
alan
(101
) (CT
)7,
506
Aak
era
(CT)
7,11
0
Kabr
i (CT
)7,
049
Badh
Mal
ak (C
T)6,
938
Ladr
awan
(CT)
6,90
5
Asa
n Kh
urd
(CT)
6,87
3
May
yer
(CT)
6,03
9
Nan
hera
(CT)
6,03
5
Tow
n N
ame
Popu
latio
nKh
ori K
alan
(CT)
6,00
7
Gha
tal M
ahan
iaw
as (C
T)6,
005
Ram
pura
(CT)
5,95
4
Sala
mba
(CT)
5,72
7
Tund
la (C
T)5,
658
Bhur
an (C
T)5,
603
Satr
od K
hurd
(CT)
5,56
8
Bagh
ola
(CT)
5,41
3
Bayy
anpu
r (C
T)5,
406
Kach
raul
i (CT
)5,
400
Man
ethi
(CT)
5,07
0
Kanw
la (C
T)5,
024
Bir
Gha
ghar
(CT)
4,94
3
Ram
Gar
h (C
T)4,
934
Maj
ra (C
T)4,
884
Pial
a (C
T)4,
291
HM
T Pi
njor
e (C
T)3,
873
Faza
lpur
(CT)
3,69
2
Kaka
r M
ajra
(CT)
3,24
6
Faiz
abad
(CT)
1,30
9
NCT
of D
elhi
DM
C (U
) (M
Cor
p.)
11,0
34,5
55
N.D
.M.C
. (M
Cl)
257,
803
Del
hi C
antt
(CB)
110,
351
Kira
ri S
ulem
an N
agar
(CT)
283,
211
Kara
wal
Nag
ar (C
T)22
4,28
1
Nan
gloi
Jat (
CT)
205,
596
Bhal
swa
Jaha
ngir
Pur
(CT)
197,
148
Sulta
n Pu
r M
ajra
(CT)
181,
554

Annexure-1: Directory of Urban Centers in the Country with Population (2011)
189
Tow
n N
ame
Popu
latio
nH
asts
al (C
T)17
6,87
7
Deo
li (C
T)16
9,12
2
Dal
lo P
ura
(CT)
154,
791
Bura
ri (C
T)14
6,19
0
Mus
tafa
bad
(CT)
127,
167
Gok
al P
ur (C
T)12
1,87
0
Man
doli
(CT)
120,
417
Sada
t Pur
Guj
ran
(CT)
97,6
41
Poot
h Ka
lan
(CT)
96,0
02
Gha
roli
(CT)
92,5
40
Mol
ar B
and
(CT)
91,4
02
Chill
a Sa
roda
Ban
gar
(CT)
83,2
17
Khaj
oori
Kha
s (C
T)76
,640
Kapa
s H
era
(CT)
74,0
73
Baw
ana
(CT)
73,6
80
Mith
e Pu
r (C
T)69
,837
Pul P
ehla
d (C
T)69
,657
Ziau
ddin
Pur
(CT)
68,9
93
Taj P
ul (C
T)68
,796
Jait
Pur
(CT)
59,3
30
Rosh
an P
ura
alia
s D
icha
on K
hurd
(CT)
57,2
17
Muk
and
Pur
(CT)
57,1
35
Sahi
baba
d D
aula
t Pur
(CT)
54,7
73
Jaff
raba
d (C
T)54
,601
Mun
dka
(CT)
54,5
41
Begu
m P
ur (C
T)53
,682
Bapr
aula
(CT)
52,7
44
Nith
ari (
CT)
50,4
64
Tigr
i (CT
)46
,974
Tow
n N
ame
Popu
latio
nCh
attar
Pur
(CT)
46,7
76
Lib
as P
ur (C
T)44
,375
Nilo
thi (
CT)
43,3
71
Kam
al P
ur M
ajra
Bur
ari (
CT)
43,0
86
Jiwan
Pur
alia
s Jo
hri P
ur (C
T)43
054
Kond
li (C
T)38
,207
Gha
rond
a N
eem
ka B
anga
r al
ias
Patp
ar
Gan
j (CT
)37
,876
Nan
gli S
akra
wati
(CT)
37,7
06
Baba
r Pu
r (C
T)37
,058
Din
dar
Pur
(CT)
35,8
56
Kar
ala
(CT)
35,7
30
Aya
Nag
ar (C
T)33
,123
Shafi
Pur
Ran
hola
(CT)
31,9
44
Sira
s Pu
r (C
T)30
,445
Aal
i (CT
)27
,169
Qua
mm
rudd
in N
agar
(CT)
25,1
26
Mal
ik P
ur K
ohi a
lias
Rang
Pur
i (CT
)23
,726
Pehl
ad P
ur B
anga
r (C
T)22
,968
Jhar
oda
Maj
ra B
urar
i (CT
)22
,878
Mor
adab
ad P
ahar
i (CT
)21
,502
Day
al P
ur (C
T)20
,589
Ali
Pur
(CT)
20,3
32
Jhar
oda
Kala
n (C
T)19
,578
Raja
Pur
Khu
rd (C
T)19
,312
Rajo
kri (
CT)
19,1
48
Mir
Pur
Tur
k (C
T)19
,098
Bhati
(CT)
18,8
64
Qad
i Pur
(CT)
18,3
69
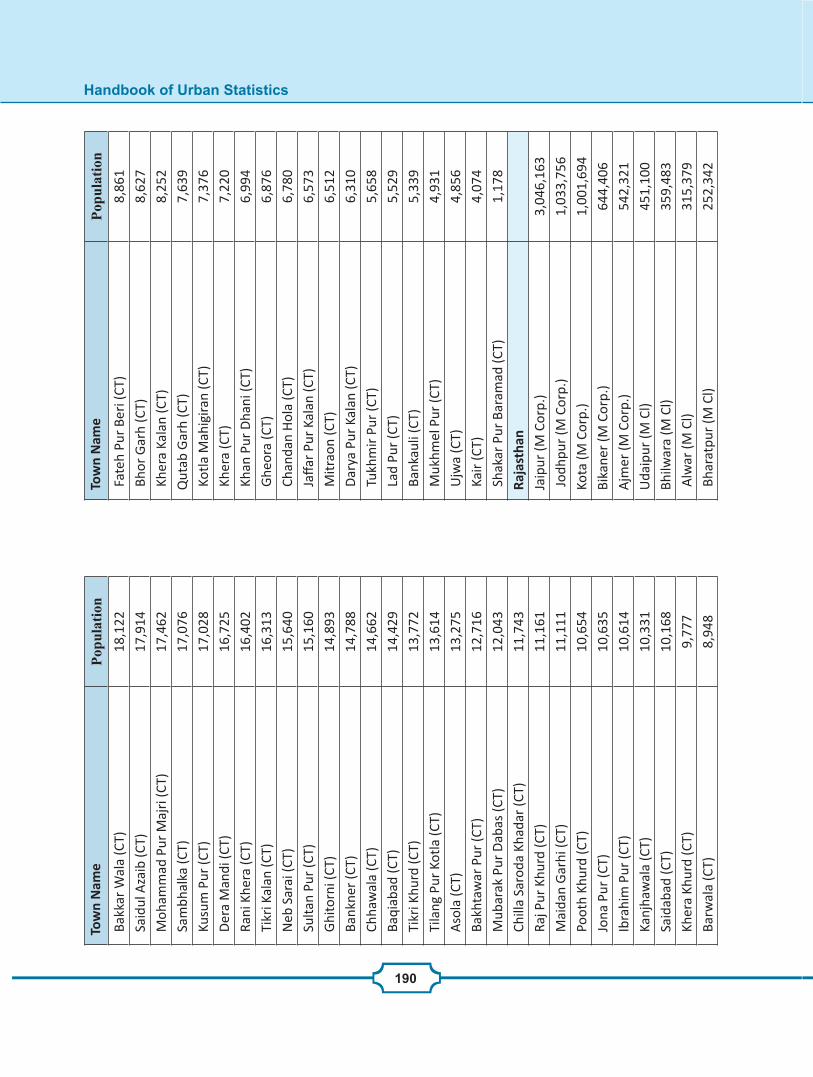
Handbook of Urban Statistics
190
Tow
n N
ame
Popu
latio
n B
akka
r W
ala
(CT)
18,1
22
Sai
dul A
zaib
(CT)
17,9
14
Moh
amm
ad P
ur M
ajri
(CT)
17,4
62
Sam
bhal
ka (C
T)17
,076
Kus
um P
ur (C
T)17
,028
Der
a M
andi
(CT)
16,7
25
Ran
i Khe
ra (C
T)16
,402
Tik
ri K
alan
(CT)
16,3
13
Neb
Sar
ai (C
T)15
,640
Sul
tan
Pur
(CT)
15,1
60
Ghi
torn
i (CT
)14
,893
Ban
kner
(CT)
14,7
88
Chh
awal
a (C
T)14
,662
Baq
iaba
d (C
T)14
,429
Tik
ri K
hurd
(CT)
13,7
72
Tila
ng P
ur K
otla
(CT)
13,6
14
Aso
la (C
T)13
,275
Bak
htaw
ar P
ur (C
T)12
,716
Mub
arak
Pur
Dab
as (C
T)12
,043
Chi
lla S
arod
a Kh
adar
(CT)
11,7
43
Raj
Pur
Khu
rd (C
T)11
,161
Mai
dan
Gar
hi (C
T)11
,111
Poo
th K
hurd
(CT)
10,6
54
Jona
Pur
(CT)
10,6
35
Ibra
him
Pur
(CT)
10,6
14
Kan
jhaw
ala
(CT)
10,3
31
Sai
daba
d (C
T)10
,168
Khe
ra K
hurd
(CT)
9,77
7
Bar
wal
a (C
T)8,
948
Tow
n N
ame
Popu
latio
n F
ateh
Pur
Ber
i (CT
)8,
861
Bho
r G
arh
(CT)
8,62
7
Khe
ra K
alan
(CT)
8,25
2
Qut
ab G
arh
(CT)
7,63
9
Kot
la M
ahig
iran
(CT)
7,37
6
Khe
ra (C
T)7,
220
Kha
n Pu
r D
hani
(CT)
6,99
4
Ghe
ora
(CT)
6,87
6
Cha
ndan
Hol
a (C
T)6,
780
Jaffa
r Pu
r Ka
lan
(CT)
6,57
3
Mitr
aon
(CT)
6,51
2
Dar
ya P
ur K
alan
(CT)
6,31
0
Tuk
hmir
Pur
(CT)
5,65
8
Lad
Pur
(CT)
5,52
9
Ban
kaul
i (CT
)5,
339
Muk
hmel
Pur
(CT)
4,93
1
Ujw
a (C
T)4,
856
Kai
r (C
T)4,
074
Sha
kar
Pur
Bara
mad
(CT)
1,17
8
Raja
stha
n
Jaip
ur (M
Cor
p.)
3,04
6,16
3
Jodh
pur
(M C
orp.
)1,
033,
756
Kota
(M C
orp.
)1,
001,
694
Bika
ner
(M C
orp.
)64
4,40
6
Ajm
er (M
Cor
p.)
542,
321
Uda
ipur
(M C
l)45
1,10
0
Bhilw
ara
(M C
l)35
9,48
3
Alw
ar (M
Cl)
315,
379
Bha
ratp
ur (M
Cl)
252,
342

Annexure-1: Directory of Urban Centers in the Country with Population (2011)
191
Tow
n N
ame
Popu
latio
n S
ikar
(M C
l)23
7,53
2
Pali
(M C
l)23
0,07
5
Gan
gana
gar
(M C
l)22
4,53
2
Tonk
(M C
l)16
5,29
4
Kish
anga
rh (M
Cl)
154,
886
Han
uman
garh
(M C
l)15
0,95
8
Bea
war
(M C
l)14
5,50
4
Chu
ru (M
Cl)
119,
856
Jhun
jhun
un (M
Cl)
118,
473
Dha
ulpu
r (M
)12
5,98
9
Saw
ai M
adho
pur
(M)
121,
106
Gan
gapu
r Ci
ty (M
)11
9,09
0
Bara
n (M
)11
7,99
2
Chitt
aurg
arh
(M)
116,
406
Hin
daun
(M)
105,
452
Bhiw
adi (
M)
104,
921
Bund
i (M
)10
3,28
6
Nag
aur
(M)
102,
872
Suja
ngar
h (M
)10
1,52
3
Bans
war
a (M
)99
,969
Barm
er (M
)96
,225
Sard
arsh
ahar
(M)
95,9
11
Mak
rana
(M)
93,0
94
Fate
hpur
(M)
92,5
95
Dau
sa (M
)85
,960
Kara
uli (
M)
82,9
60
Balo
tra
(M)
74,4
96
Rata
ngar
h (M
)71
,124
Sura
tgar
h (M
)70
,536
Tow
n N
ame
Popu
latio
nRa
jsam
and
(M)
67,7
98
Jhal
awar
(M)
66,9
19
Ladn
u (M
)65
,575
Jais
alm
er (M
)65
,471
Chom
u (M
)64
,417
Naw
alga
rh (M
)63
,948
Bari
(M)
62,7
21
Nok
ha (M
)62
,699
Kuch
aman
City
(M)
61,9
69
Nim
bahe
ra (M
)61
,949
Rajg
arh
(M)
59,1
93
Jalo
r (M
)54
,081
Lach
hman
garh
(M)
53,3
92
Did
wan
a (M
)53
,328
Dun
garg
arh
(M)
53,2
94
Abu
Roa
d (M
)52
,363
Noh
ar (M
)49
,835
Phal
odi (
M)
49,7
66
Kotp
utli
(M)
49,2
02
Bhin
mal
(M)
47,9
32
Dun
garp
ur (M
)47
,706
Mer
ta C
ity (M
)46
,070
Dee
g (M
)44
,999
Band
ikui
(M)
44,6
64
Chira
wa
(M)
43,9
53
Soja
t (M
)43
,023
Bhaw
ani M
andi
(M)
42,2
83
Prat
apga
rh (M
)42
,079
Nat
hdw
ara
(M)
42,0
16

Handbook of Urban Statistics
192
Tow
n N
ame
Popu
latio
nKe
kri (
M)
41,8
90
Ram
ganj
Man
di (M
)41
,328
Bhad
ra (M
)40
,662
Bila
ra (M
)39
,590
Siro
hi (M
)39
,229
Baya
na (M
)38
,502
Khai
rtha
l (M
)38
,298
Kam
an (M
)38
,040
Niw
ai (M
)37
,765
Raw
atbh
ata
(M)
37,6
99
Jhal
rapa
tan
(M)
37,5
06
Pilib
anga
(M)
37,2
88
Sum
erpu
r (M
)37
,093
Pipa
r Ci
ty (M
)36
,810
Sang
aria
(M)
36,6
19
Nee
m-K
a-Th
ana
(M)
36,2
31
Bida
sar
(M)
35,6
83
Raw
atsa
r (M
)35
,102
Lals
ot (M
)34
,363
Shah
pura
(M)
33,8
95
Raja
kher
a (M
)33
,666
Chak
su (M
)33
,432
Ram
garh
(M)
33,0
24
Sanc
hore
(M)
32,8
75
Tara
naga
r (M
)32
,640
Ant
ah (M
)32
,377
Chha
bra
(M)
32,2
85
Vija
inag
ar (M
)32
,124
Sri M
adho
pur
(M)
31,3
66
Tow
n N
ame
Popu
latio
nBa
gru
(M)
31,2
29
Anu
pgar
h (M
)30
,877
Shah
pura
(M)
30,3
20
Pila
ni (M
)29
,741
Lakh
eri (
M)
29,5
72
Behr
or (M
)29
,531
Sagw
ara
(M)
29,4
39
Mal
pura
(M)
29,2
95
Uda
ipur
wati
(M)
29,2
36
Kish
anga
rh R
enw
al (M
)29
,201
Losa
l (M
)28
,504
Rais
ingh
naga
r (M
)28
,330
Raja
ldes
ar (M
)27
,419
Sadr
i (M
)27
,390
Gul
abpu
ra (M
)27
,215
Sheo
ganj
(M)
27,1
98
Rajg
arh
(M)
26,6
31
Nad
bai (
M)
26,4
11
Akl
era
(M)
26,2
40
Reen
gus
(M)
26,1
39
Nag
ar (M
)25
,572
Man
grol
(M)
25,0
73
Sadu
lsha
har
(M)
24,9
80
Faln
a (M
)24
,839
Tija
ra (M
)24
,747
Kesh
orai
pata
n (M
)24
,627
Pind
war
a (M
)24
,487
Kaith
oon
(M)
24,2
60
Toda
rais
ingh
(M)
23,5
59

Annexure-1: Directory of Urban Centers in the Country with Population (2011)
193
Tow
n N
ame
Popu
latio
nPo
kara
n (M
)23
,554
Kum
her
(M)
23,5
40
Kuch
era
(M)
23,4
68
Man
daw
a (M
)23
,335
Phul
era
(M)
23,2
84
Biss
au (M
)23
,227
Toda
bhim
(M)
22,9
77
Mou
nt A
bu (M
)22
,943
Fate
hnag
ar (M
)22
,812
Khan
dela
(M)
22,7
56
Jaita
ran
(M)
22,6
21
Sam
bhar
(M)
22,3
27
Naw
a (M
)22
,088
Deo
li (M
)22
,065
Sang
od (M
)21
,846
Sura
jgar
h (M
)21
,666
Push
kar
(M)
21,6
26
Kara
npur
(M)
21,2
97
Kapa
san
(M)
20,8
69
Kapr
ain
(M)
20,7
48
Begu
n (M
)20
,705
Jaha
zpur
(M)
20,5
86
Vira
tnag
ar (M
)20
,568
Sarw
ar (M
)20
,372
Bhus
awar
(M)
19,9
46
Bali
(M)
19,8
80
Chha
par
(M)
19,7
44
Nai
nwa
(M)
19,4
85
Wei
r (M
)19
,385
Tow
n N
ame
Popu
latio
nG
anga
pur
(M)
18,7
77
Des
hnok
e (M
)18
,470
Muk
andg
arh
(M)
18,4
69
Vija
inag
ar (M
)18
,425
Pada
mpu
r (M
)18
,420
Chho
ti Sa
dri (
M)
18,3
60
Khet
ri (M
)18
,209
Bhin
der
(M)
17,8
78
Kher
li (M
)17
,634
Deo
garh
(M)
17,6
04
Am
et (M
)17
,335
Mun
dwa
(M)
16,8
71
Takh
atga
rh (M
)16
,729
Asi
nd (M
)16
,611
Salu
mba
r (M
)16
,425
Bari
Sad
ri (M
)15
,713
Vidy
avih
ar (M
)15
,644
Parb
atsa
r (M
)15
,172
Bagg
ar (M
)14
,238
Kesr
isin
ghpu
r (M
)14
,010
Rani
(M)
13,8
80
Man
dalg
arh
(M)
13,8
44
Kano
r (M
)13
,239
Rata
nnag
ar (M
)12
,841
Pira
wa
(M)
12,8
07
Uni
ara
(M)
12,5
51
Jobn
er (M
)11
,354
Kush
alga
rh (M
)10
,666
Gaj
sing
hpur
(M)
9,99
5

Handbook of Urban Statistics
194
Tow
n N
ame
Popu
latio
nIn
drag
arh
(M)
7,44
4
Nas
iraba
d (C
B)50
,804
Kuri
Bha
gtas
ani (
CT)
38,4
29
Basn
i Bel
ima
(CT)
29,1
87
Bass
i (CT
)26
,029
Bora
war
(CT)
24,9
75
Mah
wa
(CT)
24,8
46
Sang
ariy
a (C
T)22
853
Suke
t (CT
)22
,319
Mak
rana
Vill
age
(CT)
21,8
08
Nan
dri V
illag
e (C
T)20
,827
Man
ohar
pur
(CT)
20,2
87
Chhi
paba
rod
(CT)
18,8
37
Sarm
athu
ra (C
T)17
,988
Got
han
(CT)
17,7
00
Bhuw
ana
(CT)
17,6
65
Got
hra
(CT)
16,9
33
Mer
ta R
oad
(CT)
16,9
05
Aho
re (C
T)16
,867
Sata
lkhe
ri (C
T)15
,617
Dan
ta (C
T)15
,594
Aje
etga
rh (C
T)15
,414
Bhav
ri (C
T)15
,312
Kasb
a Bo
nli (
CT)
15,3
00
Beej
oliy
a Ka
lan
(CT)
14,1
40
Khan
pur
(CT)
13,8
48
Mal
sisa
r (C
T)13
,719
Ram
garh
(CT)
13,5
29
Bana
stha
li (C
T)12
,835
Tow
n N
ame
Popu
latio
nSo
jat R
oad
(CT)
12,4
72
Kish
anga
rh (C
T)12
,429
3 e
Villa
ge (C
T)12
,134
Mar
war
Junc
tion
(CT)
12,0
04
Kher
abad
(CT)
11,9
93
Man
daw
ar (C
T)11
,960
Saw
a (C
T)11
,923
Beri
yaw
ali (
CT)
11,8
31
Kelw
a (C
T)11
,712
Chec
hat (
CT)
11,6
90
Ham
eer
Gar
h (C
T)11
,678
8 PS
D-B
(CT)
11,6
75
3 ST
R (C
T)11
,667
Bhim
(CT)
11,5
68
Gov
indg
arh
(CT)
11,5
52
Sing
hana
(CT)
11,3
72
Dha
riaw
ad (C
T)11
,368
8 LL
G (L
ALG
ARH
) (CT
)11
,361
Man
ohar
than
a (C
T)11
,292
Kano
ta (C
T)11
,250
Diw
akar
i (CT
)11
,188
Bask
hoh
(CT)
11,1
50
Atru
(CT)
11,1
41
Mah
u Ka
lan
(CT)
10,9
71
Bagr
ana
(CT)
10,7
90
Part
apur
(CT)
10,7
58
Gor
edi C
hanc
ha (C
T)10
,655
Baba
i (CT
)10
,620
Isla
mpu
r (C
T)10
,247

Annexure-1: Directory of Urban Centers in the Country with Population (2011)
195
Tow
n N
ame
Popu
latio
nU
dpur
a (C
T)10
,051
Shah
jaha
npur
(CT)
9,83
7
Baka
ni (C
T)9,
812
Kola
yat (
CT)
9,68
4
Kaw
ai (C
T)9,
487
Tapo
okra
(CT)
9,47
1
Mod
ak (C
T)9,
204
Mav
li (C
T)9,
199
Barg
aon
(Rur
al) (
CT)
9,19
3
San
tpur
(CT)
9,18
6
Rish
abhd
eo (C
T)9,
171
Ake
dado
onga
r (C
T)9,
062
Bor
aj-K
ajip
ura
(CT)
8,78
0
Gog
unda
(CT)
8,75
1
Kolv
i @ (M
andi
Raje
ndra
pur)
(CT)
8,58
4
Reod
ar (C
T)8,
117
Ram
garh
(CT)
7,92
4
Kanw
at (C
T)7,
903
Gov
indg
arh
(CT)
7,73
5
Bho
ogar
(CT)
7,66
6
Jam
wa
Ram
garh
(CT)
7,66
5
Alig
arh
(CT)
7,62
6
Kher
war
a Ch
haon
i (CT
)7,
581
Des
oola
(CT)
7,30
6
1 G
B-A
(CT)
7,29
7
Tale
ra (C
T)7,
203
Nee
mra
na (C
T)7,
143
Kher
ligan
j (CT
)7,
022
Tow
n N
ame
Popu
latio
nSe
emal
war
a (C
T)6,
891
Sapo
tra
(CT)
6,71
6
24 A
S-C
(CT)
6,64
8
Kum
bhko
t (CT
)6,
602
Sard
arga
rh (C
T)6,
600
Dho
rim
anna
(CT)
6,51
3
Bara
l (CT
)6,
344
Guh
ala
(CT)
6,34
3
Noo
an (C
T)6,
049
Bay
(CT)
5,93
6
Baya
na R
ural
(CT)
5,86
6
Bedl
a (C
T)5,
766
Goy
li (C
T)5,
728
Jhag
arw
as (C
T)5,
728
Chen
ar V
illag
e (C
T)5,
579
Gar
hi (C
T)5,
180
Badl
ya (C
T)5,
111
Budh
pura
(CT)
5,07
0
Emri
(CT)
4,75
8
Gal
iako
t (CT
)4,
707
Sem
ari (
CT)
4,61
2
Uta
rlai
(CT)
4,60
3
Del
war
a (C
T)4,
429
Bich
hri (
CT)
4,29
5
Chaw
and
(CT)
4,25
2
Bhal
ariy
a (C
T)3,
962
Sum
erga
nj M
andi
(CT)
3,63
3
New
a Ta
lai (
CT)
2,52
5

Handbook of Urban Statistics
196
Tow
n N
ame
Popu
latio
nU
ttar
Pra
desh
Luc
know
(M C
orp.
)2,
817,
105
Kan
pur
(M C
orp.
)2,
765,
348
Gha
ziab
ad (M
Cor
p.)
1,64
8,64
3
Agr
a (M
Cor
p.)
1,58
5,70
4
Mee
rut (
M C
orp.
)1,
305,
429
Vara
nasi
(M C
orp.
)1,
198,
491
Alla
haba
d (M
Cor
p.)
1,11
2,54
4
Bare
illy
(M C
orp.
)90
3,66
8
Mor
adab
ad (M
Cor
p.)
887,
871
Alig
arh
(M C
orp.
)87
4,40
8
Saha
ranp
ur (M
Cor
p.)
705,
478
Gor
akhp
ur (M
Cor
p.)
673,
446
Jhan
si (M
.Cor
p.)
505,
693
Gan
gagh
at (N
PP)
84,0
72
Gaj
raul
a (N
P)55
,048
Baks
hi K
a Ta
lab
(NP)
49,1
66
Khek
ada
(NP)
48,6
76
Obr
a (N
P)46
,574
Ruda
uli (
NPP
)43
,091
Muh
amm
adab
ad (N
P)41
,780
Sada
bad
(NP)
40,9
26
Budh
ana
(NP)
39,8
67
Gho
si (N
P)39
,165
Shah
abad
(NP)
38,2
76
Than
a Bh
awan
(NP)
36,6
69
Khag
a (N
P)35
,637
Fate
hpur
(NP)
35,5
82
Das
na (N
P)34
,914
Tow
n N
ame
Popu
latio
nKo
paga
nj (N
P)34
,782
Zaid
pur
(NP)
34,4
43
Rudr
apur
(NP)
34,0
14
Kher
i (N
P)33
355
Nau
gaw
an S
adat
(NP)
32,9
54
Sahj
anw
an (N
P)32
,886
Katr
a (N
P)32
,440
Jew
ar (N
P)32
,269
Bidh
una
(NP)
32,2
52
Sam
dhan
(NP)
31,4
79
Bhoj
pur
Dha
ram
pur
(NP)
31,3
05
Isla
mna
gar
(NP)
31,0
22
Bhog
aon
(NP)
30,8
74
Dom
ariy
agan
j (N
P)30
,698
Kund
arki
(NP)
29,9
51
Baba
rpur
Ajit
mal
(NP)
29,2
84
Mira
npur
(NP)
29,2
83
Kem
ri (N
P)28
,698
Pow
ayan
(NP)
28,6
13
Kabr
ai (N
P)28
,564
Sham
saba
d (N
P)28
,454
Lar
(NP)
28,3
07
Lal G
opal
ganj
Nin
daur
a (N
P)28
,288
Ram
pur
Man
ihar
an (N
P)27
,979
Kith
aur
(NP)
27,9
33
Jala
laba
d (N
P)27
,921
Meh
daw
al (N
P)27
,897
Karh
al (N
P)27
,701
Sum
erpu
r (N
P)27
,587

Annexure-1: Directory of Urban Centers in the Country with Population (2011)
197
Tow
n N
ame
Popu
latio
nPu
rqua
zi (N
P)27
,516
Kund
a (N
P)27
,179
Kant
h (N
P)27
,137
Fate
hgan
j Pas
hchi
mi (
NP)
26,6
07
Aur
anga
bad
(NP)
26,5
44
Sirs
i (N
P)26
,519
Has
tinap
ur (N
P)26
,452
Kant
h (N
P)26
,381
Kora
Jaha
naba
d (N
P)26
,359
Reoti
(NP)
26,3
59
Dat
agan
j (N
P)26
,244
Mac
hhlis
hahr
(NP)
26,1
07
Tam
baur
-cum
-Aha
mda
bad
(NP)
26,0
52
Kham
aria
(NP)
25,9
29
Shis
hgar
h (N
P)25
,815
Safip
ur (N
P)25
,688
Sidh
auli
(NP)
24,9
76
Kura
oali
(NP)
24,9
69
Sew
alkh
as (N
P)24
,882
Moh
amm
adab
ad (N
P)24
,687
Dha
ureh
ra (N
P)24
,518
Tuls
ipur
(NP)
24,4
88
Ujh
ari (
NP)
24,4
88
Purw
a (N
P)24
,467
Saha
spur
(NP)
24,4
63
Usk
a Ba
zar
(NP)
24,4
44
Said
pur
(NP)
24,3
38
Tirw
agan
j (N
P)24
,082
Saha
war
(NP)
24,0
67
Tow
n N
ame
Popu
latio
nJh
injh
ak (N
P)24
,027
Sika
nder
pur
(NP)
23,9
86
Alla
pur
(NP)
23,9
85
Kira
oali
(NP)
23,7
88
Bhin
ga (N
P)23
,780
Bew
ar (N
P)23
,729
Dha
ura
Tand
a (N
P)23
,727
Gun
naur
(NP)
23,6
65
Sira
uli (
NP)
23,6
50
Chha
ta (N
P)23
,537
Kapt
anga
nj (N
P)23
,526
War
hapu
r (N
P)23
,456
Fate
haba
d (N
P)23
,278
Thir
iya
Niz
amat
Kha
n (N
P)23
,184
Lalg
anj (
NP)
23,1
24
Sew
arhi
(NP)
23,0
77
Chan
daul
i (N
P)23
,020
Phul
pur
(NP)
22,9
98
Mar
iahu
(NP)
22,7
78
Nar
aura
(NP)
22,7
75
Gov
ardh
an (N
P)22
,576
Nan
auta
(NP)
22,5
51
Kush
inag
ar (N
P)22
,214
Rasu
laba
d (N
P)22
,196
Law
ar (N
P)22
,024
Bhar
gain
(NP)
21,8
91
Purd
ilnag
ar (N
P)21
,885
Chitb
ara
Gao
n (N
P)21
,879
Waz
irgan
j (N
P)21
,844

Handbook of Urban Statistics
198
Tow
n N
ame
Popu
latio
nN
yori
a H
usai
npur
(NP)
21,8
12
Han
dia
(NP)
21,7
98
Saha
npur
(NP)
21,6
39
Kher
agar
h (N
P)21
,470
Raya
(NP)
21,3
44
Mah
oli (
NP)
21,3
31
Bank
i (N
P)21
,317
Barh
alga
nj (N
P)21
,290
Bans
dih
(NP)
21,2
01
Chha
rra
Rafa
tpur
(NP)
21,1
46
Sale
mpu
r (N
P)21
,124
Man
daw
ar (N
P)21
,078
Jhal
u (N
P)20
,978
Rich
ha (N
P)20
,977
Sisw
a Ba
zar
(NP)
20,9
63
Har
gaon
(NP)
20,9
20
Maj
haul
iraj (
NP)
20,8
18
Deo
rani
an (N
P)20
,815
Gho
sia
Baza
r (N
P)20
,760
Bana
t (N
P)20
,728
Paha
su (N
P)20
,672
Char
thaw
al (N
P)20
,653
Saha
twar
(NP)
20,6
15
Beha
t (N
P)20
,474
Akb
arpu
r (N
P)20
,445
Belth
ara
Road
(NP)
20,4
04
Jala
laba
d (N
P)20
,360
Jala
li (N
P)20
,238
Shah
pur
(NP)
20,1
54
Tow
n N
ame
Popu
latio
nKu
l Pah
ar (N
P)20
,096
Baha
durg
anj (
NP)
19,9
92
Phal
auda
(NP)
19,9
08
Man
iyar
(NP)
19,8
90
Pari
kshi
tgar
h (N
P)19
,830
Jans
ath
(NP)
19,7
86
Dau
rala
(NP)
19,7
76
Mau
Aim
a (N
P)19
,645
Sara
i Aqu
il (N
P)19
,538
Chilk
ana
Sulta
npur
(NP)
19,5
01
Khet
asar
ai (N
P)19
,438
Kako
ri (N
P)19
,403
Jarw
al (N
P)19
,289
Sing
ahi B
hira
ura
(NP)
19,1
96
Mag
har
(NP)
19,1
81
Sara
i Mir
(NP)
19,0
55
Chha
prau
li (N
P)18
,970
Suri
yaw
an (N
P)18
,843
Jhin
jhan
a (N
P)18
,740
Pina
hat (
NP)
18,7
09
Pali
(NP)
18,7
08
Nic
hlau
l (N
P)18
,414
Jata
ri (N
P)18
,387
Joya
(NP)
18,3
77
Nar
auli
(NP)
18,3
46
Dar
iyab
ad (N
P)18
,338
Saiy
ad R
aza
(NP)
18,3
15
Rani
pur
(NP)
18,1
32
Babr
ala
(NP)
18,1
08

Annexure-1: Directory of Urban Centers in the Country with Population (2011)
199
Tow
n N
ame
Popu
latio
nBh
okar
hedi
(NP)
17,8
29
Mal
ihab
ad (N
P)17
,818
Um
ri K
alan
(NP)
17,8
03
Shan
karg
arh
(NP)
17,7
85
Mas
was
i (N
P)17
,737
Phap
hund
(NP)
17,6
37
Mirg
anj (
NP)
17,5
42
Khut
ar (N
P)17
,423
Chak
ia (N
P)17
,356
Bhar
war
i (N
P)17
,260
Khan
pur
(NP)
17,2
47
Pach
perw
a (N
P)17
,220
Hai
derg
arh
(NP)
17,2
00
Rith
ora
(NP)
17,1
86
Shah
i (N
P)16
,950
Ajh
uwa
(NP)
16,9
36
Kara
ri (N
P)16
,467
Man
ikpu
r Sa
rhat
(NP)
16,4
67
Man
jhan
pur
(NP)
16,4
57
Use
hat (
NP)
16,3
61
Bhar
atga
nj (N
P)16
,345
Sher
garh
(NP)
16,2
47
Rura
(NP)
16,2
33
Khad
da (N
P)16
,117
Bils
anda
(NP)
16,0
36
Bish
arat
ganj
(NP)
15,9
75
Kach
hwa
(NP)
15,9
58
Ghi
raur
(NP)
15,9
11
Ash
rafp
ur K
ichh
auch
ha (N
P)15
,838
Tow
n N
ame
Popu
latio
nSi
dhpu
ra (N
P)15
,740
Am
beht
a (N
P)15
,739
Dew
a (N
P)15
,662
Kach
haun
a Pa
tsen
i (N
P)15
,647
Pipr
aich
(NP)
15,6
21
Said
pur
(NP)
15,5
45
Gop
amau
(NP)
15,5
26
Mau
raw
an (N
P)15
,484
Igla
s (N
P)15
,478
Kam
alga
nj (N
P)15
,477
Rabu
pura
(NP)
15,4
54
Man
ikpu
r (N
P)15
,435
Bhat
ni B
azar
(NP)
15,3
52
Sain
thal
(NP)
15,3
32
Bans
gaon
(NP)
15,3
13
Babe
ru (N
P)15
,156
Un
(NP)
15,1
24
Sisa
uli (
NP)
15,0
91
Moh
an (N
P)15
,071
Prat
apga
rh C
ity (N
P)15
,071
Pipr
i (N
P)15
,063
Bugr
asi (
NP)
14,9
92
Bake
war
(NP)
14,9
65
Kada
ura
(NP)
14,9
03
Ikau
na (N
P)14
,869
Meh
naga
r (N
P)14
,841
Bhat
par
Rani
(NP)
14,8
39
Kora
on (N
P)14
,821
Salo
n (N
P)14
,757

Handbook of Urban Statistics
200
Tow
n N
ame
Popu
latio
nA
llahg
anj (
NP)
14,7
55
Khud
agan
j (N
P)14
,737
Barh
ani B
azar
(NP)
14,4
92
Men
du (N
P)14
,484
Bika
pur
(NP)
14,4
53
Ram
kola
(NP)
14,4
33
Sira
thu
(NP)
14,4
23
Patiy
ali (
NP)
14,3
66
Khar
khod
a (N
P)14
,364
Jaha
naba
d (N
P)14
,328
Chop
an (N
P)14
,302
Bhab
nan
Baza
r (N
P)14
,282
Ram
naga
r (N
P)14
,255
Barw
ar (N
P)14
,196
Talb
ehat
(NP)
14,1
76
Dog
hat (
NP)
14,1
66
Tikr
i (N
P)14
,092
Dos
tpur
(NP)
14,0
11
Pain
tepu
r (N
P)13
,917
Jhus
i (N
P)13
,878
Aga
rwal
Man
di (T
atiri
) (N
P)13
,873
Am
ethi
(NP)
13,8
49
Niz
amab
ad (N
P)13
,848
Sube
ha (N
P)13
,772
Risi
ya B
azar
(NP)
13,7
50
Khar
ela
(NP)
13,7
45
Ada
ri (N
P)13
,717
Har
duag
anj (
NP)
13,6
90
Mur
san
(NP)
13,6
37
Tow
n N
ame
Popu
latio
nSi
kand
ra (N
P)13
,580
Am
ethi
(NP)
13,5
30
Kera
kat (
NP)
13,5
25
Dan
kaur
(NP)
13,5
20
Pipi
ganj
(NP)
13,5
17
Katg
har
Lalg
anj (
NP)
13,4
67
Raja
pur
(NP)
13,4
39
Mai
lani
(NP)
13,4
16
Kura
ra (N
P)13
,408
Nai
Baz
ar (N
P)13
,408
Nar
aini
(NP)
13,4
00
Gol
a Ba
zar
(NP)
13,3
35
Usa
wan
(NP)
13,3
27
Sasn
i (N
P)13
,291
Chau
muh
an (N
P)13
,173
Bhad
arsa
(NP)
13,1
54
Iltifa
tgan
j Baz
ar (N
P)13
,136
Bila
riag
anj (
NP)
13,0
96
Oel
Dha
kwa
(NP)
12,9
58
Mot
h (N
P)12
,947
Ram
pura
(NP)
12,9
44
Gos
aing
anj (
NP)
12,9
31
Mad
hoga
rh (N
P)12
,858
Dild
arna
gar
Fate
hpur
Baz
ar (N
P)12
,855
Gya
npur
(NP)
12,8
08
Hat
a (N
P)12
,801
Fari
dnag
ar (N
P)12
,785
Sirs
a (N
P)12
,686
Dud
hi (N
P)12
,560

Annexure-1: Directory of Urban Centers in the Country with Population (2011)
201
Tow
n N
ame
Popu
latio
nBa
chhr
awan
(NP)
12,5
21
Saur
ikh
(NP)
12,4
98
Sidd
haur
(NP)
12,4
38
Bilra
m (N
P)12
,429
Ren
ukoo
t (N
P)12
,409
Sada
t (N
P)12
,361
Faiz
ganj
(NP)
12,3
34
Kaur
iaga
anj (
NP)
12,2
44
Jang
ipur
(NP)
12,2
23
Azm
atga
rh (N
P)12
,160
Aila
m (N
P)12
,110
Satr
ikh
(NP)
12,1
07
Jaith
ara
(NP)
12,0
09
Bark
hera
(NP)
11,9
64
Shiv
rajp
ur (N
P)11
,948
Kusm
ara
(NP)
11,9
38
Tond
i Fat
ehpu
r (N
P)11
,855
Pars
adep
ur (N
P)11
,853
Hat
hgra
m (N
P)11
,847
Jiyan
pur
(NP)
11,8
16
Bald
eo (N
P)11
,813
Doh
righ
at (N
P)11
,799
Bahs
uma
(NP)
11,7
53
Gar
hi P
ukht
a (N
P)11
,748
Talg
ram
(NP)
11,6
65
Karn
awal
(NP)
11,6
63
Raja
Ka
Ram
pur
(NP)
11,6
44
Bisa
nda
Buzu
rg (N
P)11
,611
Jagn
er (N
P)11
,575
Tow
n N
ame
Popu
latio
nAt
asu
(NP)
11,5
68
Naw
abga
nj (N
P)11
,545
Mad
hoga
nj (N
P)11
,523
Pilk
hana
(NP)
11,5
18
Nan
dgao
n (N
P)11
,517
Railw
ay S
ettle
men
t Roz
a (N
P)11
,489
Chha
tari
(NP)
11,3
73
Ekdi
l (N
P)11
,310
Bith
oor
(NP)
11,3
00
Har
ihar
pur
(NP)
11,2
85
Kalin
agar
(NP)
11,2
82
Ghu
ghul
i (N
P)11
,271
Bars
ana
(NP)
11,1
84
Am
inag
ar S
arai
(NP)
11,1
74
Tind
war
i (N
P)11
,113
Kish
ni (N
P)11
,098
Unc
haha
r (N
P)11
,033
Bahu
wa
(NP)
11,0
31
Jaha
ngir
pur
(NP)
11,0
06
Mah
aban
(NP)
10,9
95
Aw
agar
h (N
P)10
,983
Gan
j Mur
adab
ad (N
P)10
,957
Lakh
na (N
P)10
,902
Titr
on (N
P)10
,898
Am
anpu
r (N
P)10
,830
Mun
dera
Baz
ar (N
P)10
,818
Gar
auth
a (N
P)10
,807
Jafa
raba
d (N
P)10
,792
Patti
(NP)
10,7
88

Handbook of Urban Statistics
202
Tow
n N
ame
Popu
latio
nJa
sran
a (N
P)10
,648
Nag
ram
(NP)
10,6
48
Sakh
anu
(NP)
10,6
27
Khar
gupu
r (N
P)10
,472
Am
raud
ha (N
P)10
,436
Fara
h (N
P)10
,412
Kam
pil (
NP)
10,2
81
Bhaw
an B
ahad
ur N
agar
(NP)
10,1
88
Beni
ganj
(NP)
10,1
73
Ana
ndna
gar
(NP)
10,1
13
Dal
mau
(NP)
9,98
3
Ram
pur
Kark
hana
(NP)
9,94
3
Chai
l (N
P)9,
820
Gos
aing
anj (
NP)
9,64
9
Gaw
an (N
P)9,
568
Saun
kh (N
P)9,
556
Eric
h (N
P)9,
531
Pata
la (N
P)9,
500
Fate
hgan
j Pur
vi (N
P)9,
480
Kach
hla
(NP)
9,47
1
Man
kapu
r (N
P)9,
461
Tika
it N
agar
(NP)
9,45
6
Ach
hald
a (N
P)9,
431
Mah
roni
(NP)
9,41
5
Atra
uliy
a (N
P)9,
374
Mat
aund
h (N
P)9,
371
Phul
pur
(NP)
9,32
9
Shoh
ratg
arh
(NP)
9,32
6
Sari
la (N
P)9,
271
Tow
n N
ame
Popu
latio
nPa
li (N
P)9,
267
Um
ri (N
P)9,
248
Kako
d (N
P)9,
213
Sika
nder
pur
(NP)
9,20
9
Niw
ari (
NP)
9,20
5
Har
raiy
a (N
P)9,
158
Bajn
a (N
P)8,
991
Bila
spur
(NP)
8,98
0
Koer
ipur
(NP)
8,92
7
Sahp
au (N
P)8,
920
Shiv
li (N
P)8,
621
Bara
gaon
(NP)
8,58
5
Mah
ona
(NP)
8,55
7
Ant
u (N
P)8,
504
Nid
haul
i Kal
an (N
P)8,
418
Kotr
a (N
P)8,
390
Katr
a (N
P)8,
108
Saki
t (N
P)8,
089
Kunw
arga
on (N
P)8,
053
Kadi
pur
(NP)
8,01
0
Mus
afirk
hana
(NP)
7,99
9
Nad
igao
n (N
P)7,
991
Katr
a M
edni
ganj
(NP)
7,93
1
Rasu
laba
d (N
P)7,
928
Hyd
erab
ad (N
P)7,
697
Fari
dpur
(NP)
7,67
3
Ruda
yan
(NP)
7,62
0
Nyo
tini (
NP)
7,57
7
Gan
gapu
r (N
P)7,
561

Annexure-1: Directory of Urban Centers in the Country with Population (2011)
203
Tow
n N
ame
Popu
latio
nD
erap
ur (N
P)7,
533
Kath
era
(NP)
7,53
3
Radh
akun
d (N
P)7,
511
Goh
and
(NP)
7,50
3
Itau
nja
(NP)
7,30
5
Gho
raw
al (N
P)7,
291
Ora
n (N
P)7,
212
Vija
igar
h (N
P)7,
124
Kish
unpu
r (N
P)7,
000
Bhag
wan
t Nag
ar (N
P)6,
995
Fari
ha (N
P)6,
887
Chur
k G
hurm
a (N
P)6,
883
Kurs
ath
(NP)
6,77
0
Mah
rajg
anj (
NP)
6,73
5
Fate
hpur
Cha
uras
i (N
P)6,
715
Mah
araj
ganj
(NP)
6,67
3
Has
ayan
(NP)
6,62
1
Bigh
apur
(NP)
6,50
1
Gau
ri B
azar
(NP)
6,46
8
Aur
as (N
P)6,
466
Mun
diya
(NP)
6,38
4
Ugu
(NP)
6,31
8
Besw
an (N
P)6,
278
Gul
ariy
a Bh
inda
ra (N
P)6,
172
Kurs
ath
(NP)
5,92
4
Jyoti
Khu
riya
(NP)
5,66
5
Gul
ariy
a (N
P)5,
539
Babu
garh
(NP)
5,45
2
Am
ila (N
P)5,
234
Tow
n N
ame
Popu
latio
nM
ohan
pur
(NP)
4,91
9
Gok
ul (N
P)4,
916
Day
alba
gh (N
P)2,
830
Swam
ibag
h (N
P)2,
039
Firo
zaba
d (N
PP)
604,
214
Loni
(NPP
)51
6,08
2
Muz
affar
naga
r (N
PP)
392,
768
Mat
hura
(NPP
)34
9,90
9
Shah
jaha
npur
(NPP
)32
9,73
6
Ram
pur
(NPP
)32
5,31
3
Mau
nath
Bha
njan
(NPP
)27
8,74
5
Farr
ukha
bad-
cum
-Fat
ehga
rh (N
PP)
276,
581
Hap
ur (N
PP)
262,
983
Etaw
ah (N
PP)
256,
838
Mir
zapu
r-cu
m-V
indh
yach
al (N
PP)
234,
871
Bula
ndsh
ahar
(NPP
)22
2,51
9
Sam
bhal
(NPP
)22
0,81
3
Am
roha
(NPP
)19
8,47
1
Fate
hpur
(NPP
)19
3,19
3
Rae
Bare
li (N
PP)
191,
316
Ora
i (N
PP)
187,
137
Bahr
aich
(NPP
)18
6,22
3
Jaun
pur
(NPP
)18
0,36
2
Unn
ao (N
PP)
177,
658
Sita
pur
(NPP
)17
7,23
4
Faiz
abad
(NPP
)16
5,22
8
Buda
un (N
PP)
159,
285
Band
a (N
PP)
154,
428
Lakh
impu
r (N
PP)
151,
993

Handbook of Urban Statistics
204
Tow
n N
ame
Popu
latio
nH
athr
as (N
PP)
135,
594
Lalit
pur
(NPP
)13
3,30
5
Mod
inag
ar (N
PP)
130,
325
Deo
ria
(NPP
)12
9,47
9
Pilib
hit (
NPP
)12
7,98
8
Har
doi (
NPP
)12
6,85
1
Mai
npur
i (N
PP)
120,
400
Etah
(NPP
)11
8,51
7
Basti
(NPP
)11
4,65
7
Chan
daus
i (N
PP)
114,
383
Gon
da (N
PP)
114,
046
Akb
arpu
r (N
PP)
111,
447
Khur
ja (N
PP)
111,
062
Aza
mga
rh (N
PP)
110,
983
Gha
zipu
r (N
PP)
110,
587
Mug
hals
arai
(NPP
)10
9,65
0
Sulta
npur
(NPP
)10
7,64
0
Shik
ohab
ad (N
PP)
107,
404
Sham
li (N
PP)
107,
266
Balli
a (N
PP)
104,
424
Bara
ut (N
PP)
103,
764
Kasg
anj (
NPP
)10
1,27
7
Deo
band
(NPP
)97
,037
Tand
a (N
PP)
95,5
16
Nag
ina
(NPP
)95
,246
Mah
oba
(NPP
)95
,216
Mur
adna
gar
(NPP
)95
,208
Bhad
ohi (
NPP
)94
,620
Bijn
or (N
PP)
93,2
97
Tow
n N
ame
Popu
latio
nD
adri
(NPP
)91
,189
Kaira
na (N
PP)
89,0
00
Naj
ibab
ad (N
PP)
88,5
35
Aur
aiya
(NPP
)87
,736
Kann
auj (
NPP
)84
,862
Pilk
huw
a (N
PP)
83,7
36
Chan
dpur
(NPP
)83
,441
Maw
ana
(NPP
)81
,443
Naw
abga
nj (N
PP)
81,1
63
Balra
mpu
r (N
PP)
81,0
54
Sika
ndra
bad
(NPP
)81
,028
Shah
abad
(NPP
)80
,226
Fari
dpur
(NPP
)78
,249
Bela
Pra
tapg
arh
(NPP
)76
,133
Bisa
lpur
(NPP
)73
,551
Khat
haul
i (N
PP)
72,9
49
Mub
arak
pur
(NPP
)70
,463
Bahe
ri (N
PP)
68,4
13
Saha
swan
(NPP
)66
,204
Rath
(NPP
)65
,056
Vrin
dava
n (N
PP)
63,0
05
Sher
kot (
NPP
)62
,226
Ujh
ani (
NPP
)62
,039
Laha
rpur
(NPP
)61
,990
Tilh
ar (N
PP)
61,4
44
Has
anpu
r (N
PP)
61,2
43
Kira
tpur
(NPP
)61
,186
Chhi
bram
au (N
PP)
60,9
86
Gol
a G
okar
an N
ath
(NPP
)60
,172

Annexure-1: Directory of Urban Centers in the Country with Population (2011)
205
Tow
n N
ame
Popu
latio
nJa
hang
iraba
d (N
PP)
59,8
58
Gan
goh
(NPP
)59
,279
Sand
ila (N
PP)
58,3
46
Sard
hana
(NPP
)58
,252
Mau
rani
pur
(NPP
)58
,229
Chitr
akoo
t Dha
m (K
arw
i) (N
PP)
57,4
02
Jala
un (N
PP)
56,9
09
Ayod
hya
(NPP
)55
,890
Bisw
an (N
PP)
55,7
80
Aon
la (N
PP)
55,6
29
Konc
h (N
PP)
53,4
12
Kosi
Kal
an (N
PP)
53,3
07
Kalp
i (N
PP)
51,6
70
Dha
mpu
r (N
PP)
50,9
97
Gul
aoth
i (N
PP)
50,8
23
Mah
mud
abad
(NPP
)50
,777
Tund
la (N
PP)
50,4
23
Atra
uli (
NPP
)50
,412
Bagh
pat (
NPP
)50
,310
Padr
auna
(NPP
)49
,723
Ram
naga
r (N
PP)
49,1
32
Seoh
ara
(NPP
)48
,557
Khai
raba
d (N
PP)
48,5
38
Nan
para
(NPP
)48
,337
Tand
a (N
PP)
48,0
59
Khal
ilaba
d (N
PP)
47,8
47
Neh
taur
(NPP
)47
,834
Atar
ra (N
PP)
47,4
19
Kand
hla
(NPP
)46
,796
Tow
n N
ame
Popu
latio
nG
arhm
ukht
eshw
ar (N
PP)
46,0
77
Gur
saha
igan
j (N
PP)
46,0
60
Sika
ndra
rao
(NPP
)46
,038
Gan
j Dun
daw
ara
(NPP
)45
,385
Moh
amm
adi (
NPP
)44
,968
Sian
a (N
PP)
44,4
15
Thak
urdw
ara
(NPP
)44
,255
Bang
arm
au (N
PP)
44,2
04
Bhar
than
a (N
PP)
44,1
20
Bila
spur
(NPP
)43
,908
Paliy
a Ka
lan
(NPP
)41
,126
Bans
i (N
PP)
41,0
57
Gha
tam
pur
(NPP
)40
,623
Pura
npur
(NPP
)40
,007
Mau
daha
(NPP
)40
,003
Dib
ai (N
PP)
39,8
18
Naw
abga
nj (N
PP)
39,2
41
Noo
rpur
(NPP
)38
,806
Moh
amm
adab
ad (N
PP)
38,3
28
Jala
laba
d (N
PP)
38,2
02
Jale
sar
(NPP
)38
,130
Kakr
ala
(NPP
)37
,986
Shik
arpu
r (N
PP)
37,9
69
Bila
ri (N
PP)
37,5
67
Chun
ar (N
PP)
37,1
85
Bahj
oi (N
PP)
37,0
37
Bind
ki (N
PP)
36,9
26
Mal
law
an (N
PP)
36,9
15
Sonb
hadr
a (N
PP)
36,6
89

Handbook of Urban Statistics
206
Tow
n N
ame
Popu
latio
nG
aura
Bar
haj (
NPP
)36
,459
Piha
ni (N
PP)
36,0
14
Khai
r (N
PP)
35,7
51
Ham
irpu
r (N
PP)
35,4
75
Kaim
ganj
(NPP
)34
,384
Mah
araj
ganj
(NPP
)33
,930
Nau
tanw
a (N
PP)
33,7
53
Zam
ania
(NPP
)33
,243
Sham
saba
d (N
PP)
33,1
44
Fate
hpur
Sik
ri (N
PP)
32,9
05
Bisa
uli (
NPP
)32
,780
Suar
(NPP
)32
,158
Utr
aula
(NPP
)32
,145
Jala
lpur
(NPP
)31
,972
Rasr
a (N
PP)
31,7
65
Sirs
agan
j (N
PP)
31,3
77
Bach
hrao
n (N
PP)
31,1
01
Mila
k (N
PP)
30,5
53
Dha
naur
a (N
PP)
30,0
07
Bilg
ram
(NPP
)29
,768
Colo
nelg
anj (
NPP
)29
,435
Afz
alga
rh (N
PP)
29,1
01
Anu
psha
hr (N
PP)
29,0
87
Alig
anj (
NPP
)28
,396
Jasw
antn
agar
(NPP
)28
,164
Char
khar
i (N
PP)
27,7
60
Soro
n (N
PP)
27,4
68
Dib
iyap
ur (N
P)27
,237
Gur
sara
i (N
PP)
26,8
69
Tow
n N
ame
Popu
latio
nJa
is (N
PP)
26,7
35
Bils
i (N
PP)
26,6
04
Shah
ganj
(NPP
)26
,556
Sand
i (N
PP)
26,0
07
Sidd
hart
hnag
ar (N
PP)
25,4
22
Baru
a Sa
gar
(NPP
)25
,028
Ahr
aura
(NPP
)24
,967
Pukh
raya
n (N
PP)
24,2
58
Ach
hner
a (N
PP)
22,7
81
Nak
ur (N
PP)
22,7
12
Sam
thar
(NPP
)22
,455
Etm
adpu
r (N
PP)
21,8
97
Bilh
aur
(NPP
)20
,493
Mog
ra B
adsh
ahpu
r (N
PP)
20,0
04
Hal
daur
(NPP
)19
,567
Mar
ehra
(NPP
)19
,542
Gop
igan
j (N
PP)
19,0
58
Sars
awa
(NPP
)18
,956
Mis
rikh
-cum
-Nee
msa
r (N
PP)
18,3
88
Naw
abga
nj (N
PP)
17,3
14
Chirg
aon
(NPP
)16
,724
Bah
(NPP
)16
,211
Hin
dalc
o In
dust
ries
Ltd
. (IT
S) (R
enuk
oot)
41,7
92
Mug
hals
arai
Rly
. Sett
elem
ent (
ITS)
20,4
41
Mar
uadi
h Rl
y. S
ettle
men
t (IT
S)14
,298
Jhan
si R
ailw
ay S
ettle
men
t (IT
S)13
,602
Kana
udia
Cha
mic
al &
Indu
stri
es L
td.
(ITS)
(Ren
ukoo
t)3,
631
Kanp
ur (C
B)10
8,53
4

Annexure-1: Directory of Urban Centers in the Country with Population (2011)
207
Tow
n N
ame
Popu
latio
nM
eeru
t (CB
)93
,312
Luck
now
(CB)
63,0
03
Agr
a (C
B)53
,053
Bare
illy
(CB)
30,0
03
Jhan
si (C
B)28
,343
Babi
na (C
B)27
,852
Alla
haba
d (C
B)26
,944
Mat
hura
(CB)
25,6
81
Shah
jaha
npur
(CB)
18,1
16
Fate
hgar
h (C
B)14
,793
Vara
nasi
(CB)
14,1
19
Faiz
abad
(CB)
12,3
91
Noi
da (C
T)63
7,27
2
Khor
a (C
T)19
0,00
5
Gre
ater
Noi
da (C
T)10
2,05
4
Pakb
ara
(CT)
36,7
28
Sarw
at (C
T)34
,846
Am
ilo (C
T)30
,339
Kukr
a (C
T)29
,454
Dha
naul
i (CT
)28
,990
Bare
l (CT
)27
,207
Katr
i Pip
er K
hera
(CT)
26,4
75
Loht
a (C
T)25
,596
Wal
idpu
r (C
T)25
,589
Maj
hara
Pip
ar A
hatm
ali (
CT)
25,3
10
Shah
budi
npur
(CT)
25,1
57
Para
si (C
T)23
,966
Moh
enpu
r (C
T)21
,812
Khur
ja R
ural
(CT)
21,3
83
Tow
n N
ame
Popu
latio
nVi
lem
ar K
undi
(CT)
21,0
82
Nor
ther
n Rl
y Co
lony
(CT)
20,9
16
Dha
nipu
r (C
T)20
,511
Phul
war
ia (C
T)20
,466
Jhus
i Koh
na (C
T)20
,023
Begu
mab
ad B
udha
na (C
T)19
,898
Ram
garh
Pan
joop
ur (C
T)18
,897
Rust
amna
gar
Saha
spur
(CT)
18,6
77
Anp
ara
(CT)
17,9
78
Kakg
aina
(CT)
17,9
49
Pakr
iya
Nau
gwan
Mus
tqil
(CT)
17,4
72
Chip
yana
Buz
urg
(CT)
17,4
00
Kew
alpu
r (C
T)16
,445
Shiv
dasp
ur (C
T)16
,405
Dhe
tora
(CT)
16,0
20
Aur
anga
bad
Bang
ar (C
T)15
,792
Kwar
asi (
CT)
15,7
63
Runk
ata
(CT)
15,5
82
Arm
apur
Est
ate
(CT)
15,4
63
Suza
bad
(CT)
15,3
84
Ajit
pur
(CT)
15,3
73
Bara
hatir
Jagd
ishp
ur (C
T)15
,367
Haq
iqat
pur
Urf
Khu
daw
as (C
T)15
,324
Chha
prau
la (C
T)15
,154
Khat
auli
Rura
l (CT
)14
,949
Bad
CT)
14,5
59
Baka
lpur
Mat
hura
(CT)
14,4
55
Kotw
a (C
T)14
,394
Gird
Gon
da (C
T)14
,391

Handbook of Urban Statistics
208
Tow
n N
ame
Popu
latio
nBi
sokh
ar (C
T)14
,332
Chhu
tmal
pur
(CT)
14,2
74
Kurt
hi Ja
farp
ur (C
T)14
,157
Muk
ram
pur
Khem
a (C
T)14
,089
Ledw
a M
ahua
(CT)
13,8
44
Satp
okha
ri (C
T)13
,757
Sala
rpur
Kha
dar
(CT)
13,6
00
Kota
(CT)
13,4
09
Alm
aspu
r (C
T)13
,318
Kalw
ari (
CT)
13,2
69
Dha
urra
Mafi
(CT)
13,2
41
Khai
lar
(CT)
13,2
32
Said
hari
(CT)
13,0
92
Khai
raba
d (C
T)13
,016
Nai
nana
Jat (
CT)
12,9
41
Ranc
hi B
anga
r (C
T)12
,536
Beni
pur
(CT)
12,4
70
Bhag
ipur
(CT)
12,4
14
Rori
(CT)
12,3
50
Deo
reth
a (C
T)12
,335
Ara
il U
parh
ar (C
T)12
,190
Kali
Pash
chim
(CT)
12,1
57
Chhi
tpur
(CT)
12,1
56
Roth
a (C
T)12
,063
Kasb
a Kh
anpu
r (C
T)11
,938
Oba
ree
(CT)
11,8
58
Ash
rafp
ur Ja
lal (
CT)
11,7
85
Kand
wa
(CT)
11,6
85
Hat
hras
Deh
at (C
T)11
,620
Tow
n N
ame
Popu
latio
nKa
thau
ra (C
T)11
,605
Kare
li (C
T)11
,554
Buxe
r (C
T)11
,499
Kaila
shpu
r (C
T)11
,422
Bara
gaon
(CT)
11,3
83
Sir
Gob
ardh
an (C
T)11
,350
Mai
gal G
anj (
CT)
11,3
25
Mar
uadi
h (C
T)11
,228
Kotw
ali (
CT)
11,2
21
Kand
harp
ur (C
T)11
,191
Azi
zpur
(CT)
11,1
03
Nai
para
pur
(CT)
10,8
81
Barh
a (C
T)10
,803
Chou
bepu
r Ka
lan
(CT)
10,7
85
Lalh
apur
(CT)
10,7
84
Bihk
a U
rf P
ura
Muft
i (CT
)10
,749
Sars
awan
(CT)
10,6
55
Sora
on (C
T)10
,624
Khar
iya
(CT)
10,4
82
Susu
wah
i (CT
)10
,454
Jank
i Nag
ar (C
T)10
,195
Sala
rpur
(CT)
10,1
26
Rani
yan
(CT)
10,0
11
Suth
ana
Bars
ola
(CT)
9,93
6
Gad
hi (C
T)9,
933
Suja
valp
ur (C
T)9,
835
Pipa
lsan
a Ch
audh
ari (
CT)
9,71
3
Khoj
n Pu
r (C
T)9,
618
Shek
hpur
a (C
T)9,
529

Annexure-1: Directory of Urban Centers in the Country with Population (2011)
209
Tow
n N
ame
Popu
latio
nBa
rwar
a M
azra
(CT)
9,45
5
Hafi
z G
anj (
CT)
9,44
7
Said
pur
Khaj
uria
(CT)
9,43
9
Bijp
ur (C
T)9,
420
Man
joor
Gar
hi (C
T)9,
381
Sars
aul (
CT)
9,26
7
Alh
aipu
r (C
T)9,
064
Karw
i Mafi
(CT)
9,02
4
Birj
apur
(CT)
8,86
2
Pada
rath
pur
(CT)
8,85
2
Chak
Sik
ari (
CT)
8,82
0
Gau
sgan
j (CT
)8,
700
Bast
a (C
T)8,
697
Rajp
ur B
anga
r (C
T)8,
683
Pali
Kher
a (C
T)8,
632
Khan
daul
i (CT
)8,
625
Saijn
i Nan
ker
(CT)
8,57
2
Har
sew
akpu
r N
o.2
(CT)
8,53
4
Baha
durp
ur (C
T)8,
515
Kasi
ya (C
T)8,
490
Pata
di (C
T)8,
479
Bagh
Nag
ar U
rf B
akhi
ra (C
T)8,
477
Shah
a U
rf P
ipal
gaon
(CT)
8,34
2
Jang
l Hak
eem
No.
2 (C
T)8,
328
Kasb
a Su
ltanp
ur (C
T)8,
304
Itw
a (C
T)8,
253
Dul
hipu
r (C
T)8,
243
Birb
hanp
ur (C
T)8,
233
Hafi
zpur
(CT)
8,19
5
Tow
n N
ame
Popu
latio
nKa
ranp
ur (C
T)81
85
Chau
rhat
(CT)
7,97
1
Kher
li H
afizp
ur (C
T)7,
932
Jam
shila
(CT)
7,92
3
Mad
iya
(CT)
7,89
1
Path
oli (
CT)
7,88
4
Rash
idpu
r G
arhi
(CT)
7,87
0
Ibra
him
pur
(CT)
7,85
3
Tata
rpur
Lal
lu (C
T)7,
847
Qas
impu
r Po
wer
Hou
se C
olon
y (C
T)7,
791
Gag
alhe
di (C
T)7,
776
Ach
alga
nj (C
T)7,
748
Har
palp
ur (C
T)7,
710
Tilth
i (CT
)7,
665
Ord
nanc
e Fa
ctor
y M
urad
naga
r (C
T)7,
569
Chak
eri (
CT)
7,52
6
Tund
la R
ly. C
olon
y (C
T)7,
404
Saka
ldih
a (C
T)7,
394
Ahr
auli
Shek
h (C
T)7,
383
Kaka
rmatt
a (C
T)7,
377
Mai
na M
aujp
ur (C
T)7,
351
Nih
al G
arh
Chak
Jang
la (C
T)7,
345
Bhag
awan
pur
(CT)
7,26
9
Jam
uhan
(CT)
7,13
9
Barg
o (C
T)7,
139
Niv
i (CT
)7,
125
Tund
la K
ham
(CT)
7,07
9
Prem
chak
Urf
Bah
eri (
CT)
7,06
3
Pari
chha
(CT)
7,04
7

Handbook of Urban Statistics
210
Tow
n N
ame
Popu
latio
nSi
kri K
alan
(CT)
7,03
7
Beel
na (C
T)7,
024
Paha
r G
anj (
CT)
7,01
9
Mak
hanp
ur (C
T)7,
012
Hal
laur
(CT)
6,99
9
Indi
an T
ehep
hone
Indu
stry
, Man
kapu
r (S
peci
al G
ram
) (CT
)6,
998
Pars
ona
(CT)
6,94
6
Lerh
upur
(CT
6,93
4
Deo
sain
i (CT
)6,
920
Har
iyaw
an (C
T)6,
769
Dha
mpu
r H
usai
npur
(CT)
6,75
2
Mal
hipu
r (C
T)6,
720
Khan
upur
(CT)
6,68
1
Bhar
uhan
a (C
T)6,
629
Got
(CT)
6,59
9
Am
ara
Khai
ra C
hak
(CT)
6,57
7
Has
anga
rh (C
T)6,
541
Korw
a (C
T)6,
524
Mid
dha
(CT)
6,52
3
Mah
roni
Rur
al (C
T)6,
509
Gad
doo
Pur
(CT)
6,47
8
Bhul
epur
(CT)
6,44
5
Um
arha
(CT)
6,42
9
Chan
dpur
(CT)
6,42
7
Para
(CT)
6,42
7
Mah
ewa
Patti
Pas
hchi
m U
parh
ar (C
T)6,
408
Jala
lpur
Deh
at (C
T)6,
376
Din
dasp
ur (C
T)6,
352
Tow
n N
ame
Popu
latio
nKa
llipu
r (C
T)6,
295
Jakh
aon
(CT)
6,28
6
Juga
uli (
CT)
6,28
6
Isap
ur B
anga
r (C
T)6,
280
Pipr
ayli
Buju
rg (C
T)6,
270
Gar
hi T
aman
a (C
T)6,
269
Abu
pur
(CT)
6,24
7
Mah
ul K
has
Or
Mah
ul (C
T)6,
246
Satiy
ava
(CT)
6,22
5
Fazi
Nag
ar (C
T)6,
216
Dha
nauh
a (C
T)6,
212
Chhi
taun
i (CT
)6,
195
Aur
anga
bad
Gad
ana
(CT)
6,17
0
Asa
pur
(CT)
6,15
3
Am
inag
ar U
rf B
hurb
aral
(CT)
6,14
1
Art
auni
(CT)
6,06
1
Jala
l Patti
(CT)
6,03
3
Dah
ilam
au (C
T)6,
016
Dev
inag
ar (C
T)5,
982
Baro
un (C
T)5,
886
Gab
hana
(CT)
5,88
6
Kach
nar
(CT)
5,87
0
Kotw
a (C
T)5,
825
Deo
ri S
ingh
pura
(CT)
5,80
0
Bant
hla
(CT)
5,76
6
Gan
war
ia T
ulsi
pur
(Deh
at) (
CT)
5,74
8
Ram
dasp
ur U
rf N
agal
(CT)
5,73
0
Palp
ur (C
T)5,
702
Dha
kaul
i (CT
)5,
682

Annexure-1: Directory of Urban Centers in the Country with Population (2011)
211
Tow
n N
ame
Popu
latio
nA
met
hi Ja
did
(CT)
5,64
2
Gau
ra (C
T)5,
618
Lach
him
an P
atti (C
T)5,
580
Gan
giri
(CT)
5,57
6
Basa
ntpu
r Sa
itli (
CT)
5,56
3
Atra
ri (C
T)5,
555
Mah
eshp
ur (C
T)5,
553
Basw
ar (C
T)5,
552
Ram
pur
(CT)
5,49
9
Am
ehra
Adi
pur
(CT)
5,48
5
Jasr
a (C
T)5,
483
Kaul
akha
(CT)
5,43
8
Pipa
ra D
and
(CT)
5,42
0
Kesa
ripu
r (C
T)5,
381
Gar
auri
(CT)
5,37
8
Sind
haw
ali (
CT)
5,33
5
Mah
imap
ur (C
T)5,
280
Gird
Bar
agao
n (C
T)5,
241
Kaka
ri (C
T)5,
221
Moh
iudd
inpu
r (C
T)5,
200
Palh
ni (C
T)5,
189
Parm
anan
dpur
(CT)
5,13
9
Lah
arta
ra (C
T)5,
124
Mur
adgr
am P
ur P
ursi
(CT)
5,12
0
Banj
arep
ur (C
T)5,
108
Mah
mud
pur
Talu
ka M
adpu
r Su
lt (C
T)5,
065
Lahs
ari (
CT)
5,05
1
Kata
ka (C
T)4,
926
Baha
limpu
r (C
T)4,
921
Tow
n N
ame
Popu
latio
nCh
ak B
abur
a A
limab
ad (C
T)4,
876
Chak
man
o U
rf D
arga
h (C
T)4,
837
Sara
y M
ohan
a (C
T)4,
824
Sara
i Abd
ulm
alik
(CT)
4,81
5
Sada
tmas
aura
(CT)
4,80
0
Gau
ra K
ala
(CT)
4,65
3
Chak
Imam
Ali
(CT)
4,64
1
Pure
Tiw
ari (
CT)
4,60
9
Air
For
ce A
rea
(CT)
4,58
1
Anu
rudh
pur
Pura
b Pa
tti (C
T)4,
568
Nai
nana
-Bra
hman
(CT)
4,50
0
Sara
i Lah
ur U
rf L
ahur
pur
(CT)
4,40
6
Rata
npur
a (C
T)4,
405
Bish
unip
ur (C
T)4,
302
Pura
Pan
dey
(CT)
4,06
6
Iffco
Cen
sus
Villa
ge (C
T)4,
014
Sadr
uddi
n N
agar
(CT)
3,50
6
Bang
uwan
Kal
an (C
T)2,
706
Pavi
Sad
akpu
r (C
T)75
7
Biha
r
Patn
a (M
Cor
p.)
1684
,222
Gay
a (M
Cor
p.)
468,
614
Bhag
alpu
r (M
Cor
p.)
400,
146
Muz
affar
pur
(M C
orp.
)35
4,46
2
Biha
rsha
rif (
M C
orp.
)29
7,26
8
Dar
bhan
ga (M
Cor
p.)
296,
039
Purn
ia (M
Cor
p.)
282,
248
Arr
ah (M
Cor
p.)
261,
430
Begu
sara
i (M
Cor
p.)
252,
008

Handbook of Urban Statistics
212
Tow
n N
ame
Popu
latio
nKa
tihar
(M C
orp.
)22
6,26
1
Mun
ger
(M C
orp.
)21
3,30
3
Tegh
ra (N
P)56
,234
Dau
dnag
ar (N
P)52
,364
Fatw
ah (N
P)50
,961
Nau
gach
hia
(NP)
49,0
69
Bikr
amga
nj (N
P)48
,465
Ram
naga
r (N
P)48
,411
Mah
nar
Baza
r (N
P)48
,293
Bakh
tiarp
ur (N
P)47
,897
Balia
(NP)
47,5
50
Biht
a (N
P)47
,549
Barb
igha
(NP)
46,0
75
Bank
a (N
P)45
,977
Bara
hiya
(NP)
43,0
32
Bairg
ania
(NP)
42,8
95
Dha
ka (N
P)42
,063
Bara
uli (
NP)
41,8
77
Rajg
ir (N
P)41
,587
Sher
ghati
(NP)
40,6
66
Jhaj
ha (N
P)40
,646
Man
er (N
P)40
,068
Bakh
ri (N
P)40
,043
Joga
bani
(NP)
39,2
81
Reve
lgan
j (N
P)39
,039
Suga
uli (
NP)
38,8
15
Bodh
Gay
a (N
P)38
,439
Sone
pur
(NP)
37,7
76
Gog
ri Ja
mal
pur
(NP)
37,7
53
Tow
n N
ame
Popu
latio
nLa
lgan
j (N
P)37
,098
Baha
durg
anj (
NP)
36,9
93
Isla
mpu
r (N
P)35
,641
Rafig
anj (
NP)
35,5
36
War
isal
igan
j (N
P)34
,056
Piro
(NP)
33,7
85
Colg
ong
(NP)
33,7
00
Dig
hwar
a (N
P)32
,741
His
ua (N
P)32
,585
Jagd
ishp
ur (N
P)32
,447
Mak
hdum
pur
(NP)
31,9
94
Khar
agpu
r (N
P)31
,385
Rose
ra (N
P)31
,155
Jhan
jhar
pur
(NP)
30,5
90
Kasb
a (N
P)30
,421
Banm
ankh
i Baz
ar (N
P)30
,336
Raja
uli (
NP)
30,1
70
Mar
haur
a (N
P)29
,932
Pakr
i Day
al (N
P)29
,582
Mur
ligan
j (N
P)28
,691
Moti
pur
(NP)
28,5
72
Sheo
har
(NP)
28,1
16
Nok
ha (N
P)27
,302
Chan
patia
(NP)
27,0
95
Behe
a (N
P)26
,707
Man
ihar
i (N
P)26
,629
Mirg
anj (
NP)
26,2
40
Are
raj (
NP)
26,0
14
Meh
si (N
P)25
,995

Annexure-1: Directory of Urban Centers in the Country with Population (2011)
213
Tow
n N
ame
Popu
latio
nSi
lao
(NP)
25,6
74
Am
arpu
r (N
P)25
,336
Kanti
(NP)
25,0
51
Nau
batp
ur (N
P)25
,011
Mah
araj
ganj
(NP)
24,2
82
Nab
inag
ar (N
P)23
,984
Dal
sing
hsar
ai (N
P)23
,862
Nas
riga
nj (N
P)23
,819
Mai
rwa
(NP)
23,5
65
Sahe
bgan
j (N
P)23
,224
Bikr
am (N
P)22
,486
Jain
agar
(NP)
21,7
82
Tika
ri (N
P)21
,324
Chak
ia (N
P)20
,686
Bels
and
(NP)
20,5
66
Kata
iya
(NP)
20,1
93
Nir
mal
i (N
P)20
,189
Birp
ur (N
P)19
,932
Kesa
ria
(NP)
18,9
84
Koat
h (N
P)18
,890
Thak
urga
nj (N
P)18
,348
Gho
ghar
diha
(NP)
18,2
57
Shah
pur
(NP)
17,7
67
Koilw
ar (N
P)17
,725
Mad
huba
n (N
P)17
,510
Khus
rupu
r (N
P)15
,731
Jana
kpur
Roa
d (N
P)15
,129
Chap
ra (N
agar
Par
isha
d)20
2,35
2
Din
apur
Niz
amat
(Nag
ar P
aris
had)
182,
429
Tow
n N
ame
Popu
latio
nSa
hars
a (N
agar
Par
isha
d)15
6,54
0
Haj
ipur
(Nag
ar P
aris
had)
147,
688
Sasa
ram
(Nag
ar P
aris
had)
147,
408
Deh
ri (N
agar
Par
isha
d)13
7,23
1
Siw
an (N
agar
Par
isha
d)13
5,06
6
Betti
ah (N
agar
Par
isha
d)13
2,20
9
Moti
hari
(Nag
ar P
aris
had)
126,
158
Baga
ha (N
agar
Par
isha
d)11
2,63
4
Kish
anga
nj (N
agar
Par
isha
d)10
5,78
2
Jam
alpu
r (N
agar
Par
isha
d)10
5,43
4
Jeha
naba
d (N
agar
Par
isha
d)
103,
202
Buxa
r (N
agar
Par
isha
d)10
2,86
1
Aur
anga
bad
(Nag
ar P
aris
had)
102,
244
Lakh
isar
ai (N
agar
Par
isha
d)99
,979
Naw
ada
(Nag
ar P
aris
had)
98,0
29
Jam
ui (N
agar
Par
isha
d)87
,357
Phul
war
isha
rif (
Nag
ar P
aris
had)
81,7
40
Ara
ria
(Nag
ar P
aris
had)
79,0
21
Mad
huba
ni (N
agar
Par
isha
d)75
,736
Beni
pur
(Nag
ar P
aris
had)
75,3
17
Bara
uni (
Nag
ar P
aris
had)
71,6
60
Biha
t (N
agar
Par
isha
d)67
,952
Sita
mar
hi (N
agar
Par
isha
d)67
,818
Gop
alga
nj (N
agar
Par
isha
d)67
,339
Supa
ul (N
agar
Par
isha
d)65
,437
Sam
astip
ur (N
agar
Par
isha
d)62
,935
Shei
khpu
ra (N
agar
Par
isha
d)62
,927
Barh
(Nag
ar P
aris
had)
61,4
70
Mok
ameh
(Nag
ar P
aris
had)
60,6
78

Handbook of Urban Statistics
214
Tow
n N
ame
Popu
latio
nM
asau
rhi (
Nag
ar P
aris
had)
59,8
03
Raxa
ul B
azar
(N
agar
Par
isha
d)55
,536
Mad
hepu
ra (N
agar
Par
isha
d)54
,472
Dum
raon
(Nag
ar P
aris
had)
53,6
18
Sulta
ngan
j (N
agar
Par
isha
d)52
,892
Arw
al (N
agar
Par
isha
d)51
,849
Hils
a (N
agar
Par
isha
d)51
,052
Forb
esga
nj (N
agar
Par
isha
d)50
,475
Bhab
ua (N
agar
Par
isha
d)50
,179
Nar
katia
ganj
(Nag
ar P
aris
had)
49,5
07
Khag
aria
(Nag
ar P
aris
had)
49,4
06
Khag
aul (
Nag
ar P
aris
had)
44,3
64
Dum
ra (N
agar
Pan
chay
at)
15,6
74
Din
apur
Can
tom
ent (
CB)
28,7
23
Pura
ini (
CT)
30,8
29
Bhad
auni
(CT)
20,7
39
Noh
sa (C
T)16
,680
Obr
a (C
T)14
,786
Rajo
patti
alia
s Ko
ta B
azar
(CT)
14,6
31
Dam
odar
pur
(CT)
13,8
84
Sabo
ur (C
T)12
,575
Mal
hipu
r (C
T)12
,439
Hab
ibpu
r (C
T)12
,063
Sand
ha (C
T)11
,362
Gaz
ipur
(CT)
11,2
99
Janp
ur (C
T)10
,614
Shek
hpur
a (C
T)10
,204
Karg
ahia
Pur
ab (C
T)9,
995
Kurt
haur
(CT)
9,88
0
Tow
n N
ame
Popu
latio
nLa
ruar
a (C
T)9,
376
Ram
garh
(CT)
8,69
0
Pare
o (C
T)8,
435
Sara
iya
(CT)
8,26
0
Satg
hara
(CT)
8,06
0
Sari
mpu
r (C
T)8,
020
Talk
hapu
r D
umra
(CT)
7,97
0
Han
spur
a (C
T)7,
940
Mat
hura
pur
(CT)
7,62
7
Padr
i (CT
)7,
566
Tara
pur
(CT)
7,45
0
Said
pura
(CT)
7,
392
Nur
pur
(CT)
7,20
2
Hat
hua
(CT)
7,15
6
Mad
huba
ni (C
T)7,
070
Hat
Sar
aiya
(CT)
6,86
3
Maj
haul
i Khe
tal (
CT)
6,82
0
Anw
ari (
CT)
6,70
2
Ekan
gar
Sara
i (CT
)6,
672
Bhui
ndha
ra (C
T)6,
614
Chan
ari (
CT)
6,56
9
Tola
Man
sara
ut (C
T)6,
451
Ragh
unat
hpur
(CT)
6,35
5
Asa
rgan
j (CT
)6,
327
Dum
ri A
lias
Dam
odar
pur
Shah
jaha
n(CT
)6,
301
Tola
Cha
in (C
T)6,
072
Tola
Pai
ram
atiha
na (C
T)5,
858
Moh
anpu
r (C
T)5,
815
Nur
pur
(CT)
5,59
5

Annexure-1: Directory of Urban Centers in the Country with Population (2011)
215
Tow
n N
ame
Popu
latio
nTo
la B
alia
dih
(CT)
5,40
0
Man
sur
Chak
(CT)
5,35
9
Bhag
irath
pur
(CT)
5,32
3
Bhar
dua
(CT)
5,31
7
Sing
hesa
r A
stha
n (C
T)5,
298
Dha
ram
pur(
CT)
5,29
1
Bara
(CT)
5,18
5
Pari
a (C
T)4,
922
Yahi
apur
(CT)
4,91
9
Dar
iapu
r (C
T)4,
851
Telk
ap (C
T)4,
504
Baha
durp
ur (C
T)4,
406
Shah
jang
i (CT
)3,
866
Patil
iput
ra H
ousi
ng C
olon
y (C
T)
3,53
1
Paha
rpur
(CT)
1,89
4
Colg
ong
(CT)
1,79
7
Sikk
im
Gan
gtok
(M C
orp.
)1,
00,2
86
Nam
chi (
M C
l)12
,190
Rang
po (N
P)10
,450
Jore
than
g (N
P)9,
009
Sing
tam
(NP)
5,86
8
Man
gan
(NP)
4,64
4
Gya
lshi
ng (N
P)4,
013
Nay
abaz
ar(N
otifie
d Ba
zar
Are
a)1,
235
Rhen
ak (C
T)5,
883
Aru
nach
al P
rade
sh
Itan
agar
(NT)
59,4
90
Nah
arla
gun
(NT)
36,1
58
Tow
n N
ame
Popu
latio
nPa
sigh
at (N
T)24
,656
Aal
o (N
T)20
,684
Sepp
a (N
T)18
,350
Tezu
(NT)
18,1
84
Nam
sai (
NT)
14,2
46
Dap
orijo
(NT)
13,4
05
Ziro
(NT)
12,8
06
Roin
g (N
T)11
,389
Taw
ang
(NT)
11,2
02
Khon
sa (N
T)9,
928
Bom
dila
(NT)
8,37
0
Jaira
mpu
r (N
T)7,
151
Deo
mal
i (N
T)6,
648
Ying
kion
g (N
T)6,
540
Chan
glan
g (N
T)6,
236
Mia
o (N
T)5,
841
Basa
r (N
T)4,
284
Long
ding
4,23
4
Dira
ng (N
T)3,
750
Bole
ng (N
T)2,
979
Ani
ni (N
T)2,
384
Kolo
rian
g (N
T)2,
345
Saga
lee
(NT)
1,31
5
Haw
ai (N
T)98
2
Rupa
(CT)
3,81
2
Nag
alan
d
Mok
okch
ung
(MC)
35,9
13
Dim
apur
(MC)
122,
834
Kohi
ma
(MC)
99,0
39

Handbook of Urban Statistics
216
Tow
n N
ame
Popu
latio
nTu
ensa
ng (T
C)36
,774
Wok
ha (T
C)35
,004
Mon
(TC)
26,3
28
Chum
uked
ima
(TC)
25,8
85
Zunh
ebot
o (T
C)22
,633
Kiph
ire (T
C)16
,487
Phek
(TC)
14,2
04
Pfut
sero
(TC)
10,3
71
Med
ziph
ema
(TC)
8,73
8
Jalu
kie
(TC)
8,70
6
Nag
inim
ora
(TC)
8,11
6
Tuli
(TC)
7,86
4
Long
leng
(TC)
7,61
3
Chan
gton
gya
(TC)
7,53
2
Tsem
inyu
(TC)
6,31
5
Pere
n (T
C)5,
084
Kuda
(CT)
16,1
08
Kohi
ma
Villa
ge (C
T)15
,734
Dip
hupa
r ‘A
’ (CT
)10
,246
Pura
naba
zar
‘A’ (
CT)
7,38
5
Rang
apah
ar (C
T)6,
673
Sata
kha
Hq.
(CT)
4,96
4
Tsud
ikon
g (1
3th
Mile
Tul
i Pap
er M
ill )
(CT)
4,41
6
Man
ipur
Imph
al (M
Cl)
268,
243
Thou
bal (
MCI
)45
,947
Kakc
hing
(M C
l)32
,138
May
ang
Imph
al (M
Cl)
24,2
39
Nam
bol (
MCI
)22
,512
Tow
n N
ame
Popu
latio
nM
oira
ng (M
CI)
19,8
93
Nin
gtho
ukho
ng (M
Cl)
13,0
78
Bish
nupu
r (M
CI)
12,1
67
Jirib
am (M
Cl)
7,34
3
Lilo
ng (T
houb
al) (
NP)
24,9
00
Sam
urou
(NP)
16,5
82
Thon
gkho
ng L
axm
i Baz
ar (N
P)14
,878
Lilo
ng (I
mph
al W
est)
(NP)
12,4
27
Kakc
hing
Khu
nou
(NP)
11,3
79
Yair
ipok
(NP)
9,56
9
Kum
bi (N
P)9,
546
Wan
goi (
NP)
9,10
6
And
ro (N
P)8,
744
Kwak
ta (N
P)8,
579
Lam
shan
g (N
P)8,
130
Wan
gjin
g (N
P)8,
055
Sikh
ong
Sekm
ai (N
P)7,
390
Oin
am (N
P)7,
161
Sugn
u (N
P)5,
132
Sekm
ai B
azar
(NP)
5,06
5
Lam
lai (
NP)
4,60
1
Hei
rok
(NP)
2,97
4
Mor
eh (S
T)16
,847
Ukh
rul (
CT)
27,1
87
Tam
engl
ong
(CT)
19,3
63
Thon
gju
(CT)
10,8
36
Lam
jaot
ongb
a (C
T)10
,593
Kshe
trig
ao (C
T)10
,534
Reng
kai (
CT)
8,29
3

Annexure-1: Directory of Urban Centers in the Country with Population (2011)
217
Tow
n N
ame
Popu
latio
nKh
urai
Saj
or L
eika
i (CT
)7,
987
Zenh
ang
Lam
ka (C
T)7,
771
Nao
riya
Pak
hang
lakp
a (C
T)7,
501
Kang
pokp
i (CT
)7,
476
Poro
mpa
t (CT
)6,
191
Hei
ngan
g (C
T)6,
115
Khon
gman
(CT)
6,09
6
Taky
el M
apal
(CT)
5,77
5
Torb
an (K
shet
ri L
eika
i) (C
T)5,
459
Lang
jing
(CT)
5,45
1
Kiya
mge
i (CT
)5,
336
Laip
ham
Sip
hai (
CT)
5,26
8
Sago
lban
d (P
art)
(CT)
4,96
4
Chin
gang
bam
Lei
kai (
CT)
4,90
4
Lair
ikye
ngba
m L
eika
i (CT
)4,
586
Luw
angs
angb
am (C
T)3,
458
Hill
Tow
n (C
T)2,
293
Miz
oram
Aiz
awl (
NT)
2,93
,416
Lung
lei (
NT)
57,0
11
Cham
phai
(NT)
32,7
34
Saih
a (N
T)25
,110
Kola
sib
(NT)
24,2
72
Serc
hhip
(NT)
21,1
58
Law
ngtla
i (N
T)
20
,830
Saitu
al (N
T)11
,619
Khaw
zaw
l (N
T)11
,022
Vaire
ngte
(NT)
10,5
54
Mam
it (N
T)7,
884
Tow
n N
ame
Popu
latio
nN
. Kaw
npui
(NT)
7,73
2
Then
zaw
l (N
T)7,
259
Hna
hthi
al (N
T)7,
187
Saira
ng (N
T)5,
950
Tlab
ung
(NT)
4,55
4
Baira
bi (N
T)4,
320
Dar
law
n (N
T)3,
769
Zaw
lnua
m (N
T)3,
733
Nor
th V
anla
ipha
i (N
T)3,
602
Leng
pui (
NT)
3,28
2
Khaw
hai (
NT)
2,49
6
Biat
e (N
T)2,
277
Trip
ura
Aga
rtal
a (M
Cl)
400,
004
Dha
rman
agar
(NP)
40,5
95
Uda
ipur
(NP)
32,7
58
Kaila
saha
r (N
P)22
,405
Bish
alga
rh (N
P)21
,085
Telia
mur
a (N
P)21
,032
Belo
nia
(NP)
19,9
96
Khow
ai (N
P)18
,526
Am
bass
a (N
P)16
,285
Rani
rbaz
ar (N
P)13
,104
Kum
argh
at (N
P)13
,054
Santi
r Ba
zar
(NP)
11,9
21
Sona
mur
a (N
P)11
,285
Kam
alpu
r (N
P)10
,872
Am
arpu
r (N
P)10
,838
Sabr
oom
(NP)
7,14
2

Handbook of Urban Statistics
218
Tow
n N
ame
Popu
latio
nCh
arip
ara
(CT)
19,5
98
Duk
li (C
T)16
,941
Mad
huba
n (C
T)16
,579
Tara
naga
r (C
T)15
,481
Kanc
hanp
ur (C
T)15
,341
Pani
saga
r (C
T)14
,758
Gan
dhig
ram
(CT)
14,5
72
Mad
hupu
r (C
T)14
,105
Radh
akis
hore
naga
r (C
T)13
,866
Ana
ndan
agar
(CT)
13,8
14
Sing
arbi
l (CT
)12
,917
Bank
imna
gar
(CT)
11,9
49
Gak
ulna
gar
(CT)
11,3
69
Utt
ar C
ham
pam
ura
(CT)
11,3
59
Fulk
umar
i (Pa
rt) (
CT)
11,1
60
Dhw
ajna
gar
(CT)
9,05
2
Dew
anpa
sa (C
T)8,
761
Man
u (C
T)8,
515
Gak
ulpu
r (C
T)8,
361
Nar
sing
arh
(CT)
7,40
4
Brid
dhan
agar
(CT)
7,04
1
Mat
arba
ri (C
T)6,
530
Chan
diga
rh (C
T)5,
607
Fatik
roy
(CT)
5,37
1
Leba
chha
ra (C
T)5,
273
Kala
chha
ri (C
T)4,
827
Meg
hala
ya
Tura
(M)
74,8
58
Jow
ai (M
)28
,430
Tow
n N
ame
Popu
latio
nSh
illon
g (M
B)14
3,22
9
Will
iam
naga
r (M
B)24
,597
Resu
belp
ara
(MB)
19,5
95
Bagh
mar
a (M
B)13
,131
Non
gsto
in (T
C)28
,742
Non
gpoh
(TC)
17,0
55
Mai
rang
(TC)
14,3
63
Shill
ong
Cantt
. (CB
)11
,930
Maw
lai (
CT)
55,0
12
Non
gthy
mm
ai (C
T)38
,004
Mad
anrti
ng (C
T)29
,194
Pynt
horu
mkh
rah
(CT)
27,2
19
Non
gmyn
song
(CT)
15,0
17
Cher
rapu
njee
(CT)
11,7
22
Um
plin
g (C
T)8,
529
Law
soht
un (C
T)8,
214
Um
roi (
CT)
8,19
8
Um
lyng
ka (C
T)7,
381
Maw
pat (
CT)
6,18
4
Non
gkse
h (C
T)4,
846
Ass
am
Guw
ahati
(M C
orp.
)95
7,35
2
Silc
har
(MB)
172,
830
Dib
ruga
rh (M
B)13
9,56
5
Nag
aon
(MB)
117,
722
Tins
ukia
(MB)
99,4
48
Jorh
at (M
B)71
,782
Bong
aiga
on (M
B)67
,322
Dhu
bri (
MB)
63,3
88

Annexure-1: Directory of Urban Centers in the Country with Population (2011)
219
Tow
n N
ame
Popu
latio
nN
orth
Lak
him
pur
(MB)
59,8
14
Tezp
ur (M
B)58
,559
Kari
mga
nj (M
B)56
,854
Goa
lpar
a (M
B)53
,430
Sibs
agar
(MB)
50,7
81
Barp
eta
(MB)
42,6
49
Gol
agha
t (M
B)41
,989
Lank
a (M
B)36
,805
Hoj
ai (M
B)36
,638
Barp
eta
Road
(MB)
35,5
71
Kokr
ajha
r (M
B)34
,136
Hai
laka
ndi (
MB)
33,6
37
Lum
ding
(MB)
31,3
47
Mar
igao
n (M
B)29
,164
Rang
ia (M
B)27
,889
Nal
bari
(MB)
27,8
39
Man
gald
oi (M
B)25
,989
Dhe
kiaj
uli (
MB)
21,5
79
Der
gaon
(MB)
20,0
59
Sona
ri (M
B)19
,810
Naz
ira (M
B)13
,304
Lakh
ipur
(MB)
10,2
77
Am
guri
(MB)
8,00
2
Pala
sbar
i (M
B)4,
925
Dip
hu (T
C)61
,797
Hafl
ong
(TC)
43,7
56
Bila
sipa
ra (T
C)37
,410
Mar
gher
ita (T
C)26
,914
Sila
path
ar (T
C)25
,662
Tow
n N
ame
Popu
latio
nG
auri
pur
(TC)
25,1
24
Dig
boi (
TC)
21,7
36
Doo
m D
oom
a (T
C)21
,572
Mar
iani
(TC)
20,8
01
Chap
ar (T
C)20
,322
Boka
jan
(TC)
19,8
77
Dhi
ng (T
C)19
,235
Bisw
anat
h Ch
aria
li (T
C)19
,145
Nah
arka
tiya
(TC)
18,9
37
Khar
upati
a (T
C)18
,501
Rang
apar
a (T
C)18
,393
How
li (T
C)18
,301
Tita
bor
Tow
n (T
C)17
,920
Tang
la (T
C)17
,183
Mak
um (T
C)16
,923
Abh
ayap
uri (
TC)
15,8
47
Lakh
ipur
(TC)
15,6
33
Uda
lgur
i (TC
)15
,279
Basu
gaon
(TC)
13,8
49
Dha
kuak
hana
(TC)
13,5
02
Bada
rpur
(TC)
13,2
98
Bijn
i (TC
)13
,257
Dob
oka
(TC)
13,1
18
Dhe
maj
i (TC
)12
,816
Goh
pur
(TC)
12,2
23
Sapa
tgra
m (T
C)12
,163
Bihp
uria
(TC)
12,0
16
Lala
(TC)
11,7
71
Path
sala
(TC)
11,2
42

Handbook of Urban Statistics
220
Tow
n N
ame
Popu
latio
nRa
ha (T
C)11
,030
Um
rang
so (T
C)10
,376
Kam
pur
Tow
n (T
C)10
,371
Nor
th G
uwah
ati (T
C)10
,328
Boka
khat
(TC)
10,1
43
Saru
path
ar (T
C)9,
931
Don
kam
okam
(TC)
9,11
6
Gos
saig
aon
(TC)
9,06
8
Chab
ua (T
C)8,
966
Teok
(TC)
8,
795
Ham
ren
(TC)
8,74
7
Sim
alug
uri (
TC)
8,28
6
Sarb
hog
(TC)
8,11
2
Barp
atha
r (T
C)7,
657
Sart
heba
ri (T
C)6,
913
Mai
bong
(TC)
6,23
6
Nar
ayan
pur
(TC)
6,00
1
Mor
anha
t (TC
)5,
679
Dok
mok
a (T
C)5,
478
How
ragh
at (T
C)5,
443
Lakh
i Nep
ali (
CT)
5,34
8
Tihu
(TC)
4,59
9
Jona
i Baz
ar (C
T)4,
459
Mah
ur (T
C)2,
121
Ana
nd N
agar
(CT)
2,05
0
Dul
iaja
n O
il To
wn
(CT)
28,6
26
Man
kach
ar (C
T)26
,162
Lum
ding
Rly
Col
ony
(CT)
22,6
58
Jagi
road
(CT)
17,7
39
Tow
n N
ame
Popu
latio
nN
amru
p (C
T)15
,719
Niz
-Haj
o (C
T)15
,188
New
Bon
gaig
aon
Rly.
Col
ony
(CT)
14,8
96
Am
bika
pur
Part
-X (C
T)14
,283
Sual
kuch
i (CT
)13
,898
Dig
boi O
il To
wn
(CT)
12,7
26
Gob
inda
pur
(CT)
11,8
63
Nah
ira (C
T)11
,790
Lido
Tow
n (C
T)11
,717
Salp
ara
Mol
andu
bi P
t.-I (
CT)
11,7
09
Am
bica
pur
Pt V
III (C
T)11
,691
Chap
ra (C
T)11
,220
Ger
imar
i Cha
pori
(CT)
11,0
04
Gut
long
Gao
n (C
T)10
,900
Mor
ongi
al (C
T)10
,318
Chap
akho
wa
Tow
n (C
T)10
,305
Dim
arug
uri (
CT)
10,2
35
Khai
ra B
ari (
CT)
10,2
10
Kam
alab
aria
N.C
. (CT
)10
,071
Kahi
Kuc
hi (C
T)9,
917
Bhur
agao
n (R
ev.)
Tow
n (C
T)9,
845
Gol
agha
tia B
asti
(CT)
9,80
9
Bhal
ukdu
bi (C
T)9,
636
Kana
kpur
Par
t-II
(CT)
9,51
9
Dur
ga N
agar
Pt.
V (C
T)9,
051
Chek
onid
hara
(CT)
9,02
6
Bada
rpur
Rly
. Tow
n (C
T)8,
882
Am
in G
aon
(CT)
8,85
5
Jhag
ra P
t.III
(CT)
8,83
8

Annexure-1: Directory of Urban Centers in the Country with Population (2011)
221
Tow
n N
ame
Popu
latio
nA
zara
(CT)
8,78
0
Tara
pur
Pt V
I (CT
)8,
753
Saru
path
ar B
enga
li (C
T)8,
752
Bels
or (C
T)8,
523
Mor
an T
own
(CT)
8,43
4
Dah
ali (
CT)
8,39
7
Borp
ukhu
ri (C
T)8,
318
Boha
ri (C
T)8,
264
Gol
okga
nj (C
T)8,
244
Chati
bor
Gao
n (C
T)8,
231
Maj
gaon
(CT)
8,15
4
Dha
rapu
r (C
T)8,
095
Kum
ar K
aiba
rta
Gao
n (C
T)8,
056
Rupa
hi T
own
(CT)
8,05
2
Am
bica
pur
Pt V
I (CT
)7,
971
Nid
anpu
r Pt
-II (C
T)7,
954
Bari
ka C
hubu
ri (C
T)7,
911
Iron
gmar
a (C
T)7,
685
Bam
un S
ualk
uchi
(CT)
7,62
8
Koch
para
(CT)
7,54
0
Jam
unam
ukh
(CT)
7,37
7
Kani
sail
Pt I
(CT)
7,35
8
Asu
dubi
(CT)
7,35
6
Mai
raba
ri T
own
(CT)
7,17
7
Upa
r H
ali (
CT)
7,09
5
Bata
rash
i (CT
)7,
001
Tara
pur
VII (
CT)
6,97
7
Utt
ar K
rish
napu
r Pa
rt-I
(CT)
6,96
0
Padm
abil
(CT)
6,87
4
Tow
n N
ame
Popu
latio
nBa
hbar
i Gao
n (C
T)6,
821
Takh
libila
r Pa
thar
(CT)
6,61
1
Sarp
ara
(CT)
6,52
9
Jala
h (C
T)6,
468
Bali
Kori
a (C
T)6,
359
Chot
a H
aibo
r (C
T)6,
315
Silc
har
Part
-X (C
T)6,
313
Pub
- Dha
nira
m P
athe
r (C
T)6,
280
Kana
kpur
I (C
T)6,
219
Katir
ail T
.E. (
CT)
6,18
2
Fore
st V
ill. L
akhi
path
ar (C
T)6,
129
Utt
ar A
thia
bari
(CT)
6,09
1
B.R.
P.L.
Tow
nshi
p (C
T)6,
001
Niz
- Man
kata
(CT)
5,92
4
Bang
aon
(CT)
5,87
3
Parl
li Pa
rt (C
T)5,
788
Sona
pur
Gao
n (C
T)5,
771
Chal
anta
para
Pt I
V (C
T)5,
744
Niz
Kati
gora
h Pt
III (
CT)
5,68
7
Moh
mai
ki (C
T)5,
639
No.
2 G
ores
war
(CT)
5,63
1
Thek
ashu
Pt.-
II (C
T)5,
625
Tegh
eria
(CT)
5,56
7
Kaka
ya (C
T)5,
550
Khar
ijapi
kon
(CT)
5,55
0
Baru
a Ba
ri G
aon
(CT)
5,44
4
Chan
gsar
i (CT
)5,
354
Dig
heli
(CT)
5,28
5
Borg
olai
Gra
nt N
o.II
(CT)
5,24
1

Handbook of Urban Statistics
222
Tow
n N
ame
Popu
latio
nU
ttar
Kri
shna
pur
Pt II
I (CT
)5,
187
Niz
-Bah
jani
(CT)
5,18
3
Kala
igao
n To
wn
Part
(CT)
5,11
2
Chan
drap
ur B
aghi
cha
(CT)
5,10
6
Char
ingi
a G
aon
(CT)
5,09
4
Lido
Tik
ok (C
T)5,
091
Mos
li Pt
I (C
T)5,
087
Dud
hpati
l Pt V
I (CT
)5,
083
Nau
bais
a G
oan
(CT)
5,01
5
Rupi
abat
han
(CT)
4,98
1
Dam
ara
Patp
ara
(CT)
4,92
2
Sala
kati
(CT)
4,86
3
Maj
ir G
aon
(CT)
4,77
4
Maj
arku
ri (C
T)4,
727
Dhe
korg
orha
(CT)
4,70
8
Udi
ana
(CT)
4,64
4
Tupk
hana
Pt I
(CT)
4,64
0
Pipa
libar
i (CT
)4,
534
Sanp
ara
(CT)
4,53
4
Gar
al (C
T)4,
400
Thek
ashu
Pt-
I (CT
)4,
384
Now
solia
Gao
n (C
T)4,
312
Sepo
n (C
T)4,
234
Dud
hpati
l Pt V
(CT)
4,12
1
Mar
owa
(CT)
4,00
4
Nak
hula
Gra
nt (C
T)3,
806
Kach
ujan
Gao
n (C
T)3,
246
Dig
aru
Gao
n (D
igar
ubar
Gao
n) (C
T)3,
207
Barb
ari (
AM
C A
REA
) (CT
)2,
884
Tow
n N
ame
Popu
latio
nH
.P.C
. Tow
nshi
p (C
T)2,
732
Laha
rija
n N
atun
Bos
ti (C
T)2,
508
Num
alig
arh
Refin
ery
Tow
nshi
p (C
T)2,
318
Wes
t Ben
gal
Kolk
ata
(M C
orp.
)4,
496,
694
Hao
ra (M
Cor
p.)
1,07
7,07
5
Dur
gapu
r (M
Cor
p.)
566,
517
Asa
nsol
(M C
orp.
)56
3,91
7
Silig
uri (
M C
orp.
)51
3,26
4
Chan
dann
agar
(M C
orp.
)16
6,86
7
Mah
esht
ala
(M)
448,
317
Rajp
ur S
onar
pur
(M)
424,
368
Sout
h D
um D
um (M
)40
3,31
6
Raja
rhat
Gop
alpu
r (M
)40
2,84
4
Bhat
para
(M)
383,
762
Pani
hati
(M)
377,
347
Kam
arha
ti (M
)33
0,21
1
Bard
dham
an (M
)31
4,26
5
Kulti
(M)
313,
809
Bally
(M)
293,
373
Bara
sat (
M)
278,
435
Nor
th D
um D
um (M
)24
9,14
2
Bara
naga
r (M
)24
5,21
3
Ulu
beri
a (M
)22
2,24
0
Nai
hati
(M)
217,
900
Bidh
an N
agar
(M)
215,
514
Khar
agpu
r (M
)20
7,60
4
Engl
ish
Baza
r (M
)20
5,52
1
Hal
dia
(M)
200,
827

Annexure-1: Directory of Urban Centers in the Country with Population (2011)
223
Tow
n N
ame
Popu
latio
nM
adhy
amgr
am (M
)19
6,12
7
Baha
ram
pur
(M)
195,
223
Raig
anj (
M)
183,
612
Sera
mpo
re (M
)18
1,84
2
Hug
li-Ch
insu
rah
(M)
177,
259
Med
inip
ur (M
)16
9,26
4
Utt
arpa
ra K
otru
ng (M
)15
9,14
7
Kris
hnan
agar
(M)
153,
062
Barr
ackp
ur (M
)15
2,78
3
Santi
pur
(M)
151,
777
Balu
rgha
t (M
)15
1,41
6
Hab
ra (M
)14
7,22
1
Jam
uria
(M)
145,
276
Bank
ura
(M)
137,
386
Nor
th B
arra
ckpu
r (M
)13
2,80
6
Rani
ganj
(M)
129,
441
Nab
adw
ip (M
)12
5,54
3
Basi
rhat
(M)
125,
254
Hal
isah
ar (M
)12
4,93
9
Rish
ra (M
)12
4,57
7
Ash
okna
gar
Kaly
anga
rh (M
)12
1,59
2
Baid
yaba
ti (M
)12
1,11
0
Puru
liya
(M)
121,
067
Kanc
hrap
ara
(M)
120,
345
Dar
jilin
g (M
)11
8,80
5
Tita
garh
(M)
116,
541
Dum
Dum
(M)
114,
786
Cham
pdan
i (M
)11
1,25
1
Bong
aon
(M)
108,
864
Tow
n N
ame
Popu
latio
nKh
arda
ha (M
)10
8,49
6
Jalp
aigu
ri (M
)10
7,34
1
Bans
beri
a (M
)10
3,92
0
Bhad
resw
ar (M
)10
1,47
7
Kaly
ani (
M)
100,
575
Dhu
lian
(M)
95,7
06
Chak
daha
(M)
95,2
03
Dan
kuni
(M)
94,9
36
Cont
ai (M
)92
,226
Jang
ipur
(M)
88,1
65
Gar
ulia
(M)
85,3
36
Old
Mal
dah
(M)
84,0
12
Katw
a (M
)81
,615
Bol
pur
(M)
80,2
10
Koch
Bih
ar (M
)77
,935
New
Bar
rack
pur
(M)
76,8
46
Budg
e Bu
dge
(M)
76,8
37
Konn
agar
(M)
76,1
72
Rana
ghat
(M)
75,3
65
Suri
(M)
67,8
64
Bish
nupu
r (M
)67
,783
Ara
mba
g (M
)66
,175
Tam
luk
(M)
65,3
06
Alip
urdu
ar (M
)65
,232
Jhar
gram
(M)
61,7
12
Gay
espu
r (M
)58
,998
Pans
kura
(M)
57,9
32
Ram
purh
at (M
)57
,833
Kaln
a (M
)56
,722

Handbook of Urban Statistics
224
Tow
n N
ame
Popu
latio
nG
anga
ram
pur
(M)
56,2
17
Kand
i (M
)55
,632
Gha
tal (
M)
54,5
91
Isla
mpu
r (M
)54
,340
Kalia
ganj
(M)
53,5
30
Baru
ipur
(M)
53,1
28
Badu
ria
(M)
52,4
93
Jiaga
nj-A
zim
ganj
(M)
51,7
90
Kalim
pong
(M)
49,4
03
Gob
arda
nga
(M)
45,3
77
Dhu
pgur
i (M
)44
,719
Sain
thia
(M)
44,6
01
Mur
shid
abad
(M)
44,0
19
Kurs
eong
(M)
42,4
46
Dia
mon
d H
arbo
ur (M
)41
,802
Nal
hati
(M)
41,5
34
Mem
ari (
M)
41,4
51
Taki
(M)
38,2
63
Dub
rajp
ur (M
)38
,041
Puja
li (M
)37
,047
Dal
khol
a (M
)36
,930
Din
hata
(M)
36,1
24
Gus
kara
(M)
35,3
88
Tara
kesw
ar (M
)30
,947
Birn
agar
(M)
30,7
99
Egra
(M)
30,1
48
Beld
anga
(M)
29,2
05
Sona
muk
hi (M
)29
,085
Jayn
agar
Maz
ilpur
(M)
25,9
22
Tow
n N
ame
Popu
latio
nRa
ghun
athp
ur (M
)25
,561
Mal
(M)
25,2
18
Dai
nhat
(M)
24,3
97
Mat
habh
anga
(M)
23,8
90
Chan
drak
ona
(M)
23,6
29
Tufa
ngan
j (M
)20
,998
Ram
jiban
pur
(M)
19,6
11
Jhal
da (M
)19
,544
Kshi
rpai
(M)
16,3
84
Hal
diba
ri (M
)14
,404
Khar
ar (M
)12
,118
Mek
ligan
j (M
)9,
127
Tahe
rpur
(NA
)20
,894
Coop
er’s
Cam
p (N
A)
18,8
43
Mir
ik (N
A)
11,5
13
Barr
ackp
ur C
anto
nmen
t (CB
)17
,380
Nab
adig
anta
Indu
stri
al T
owns
hip
(ITS)
1,09
5
Dab
gram
(P) (
CT)
119,
040
Bally
(CT)
113,
377
Khar
agpu
r Rl
y. S
ettle
men
t (CT
)82
,735
Bank
ra (C
T)63
,957
Khar
ia (P
) (CT
)61
,661
Binn
agur
i (CT
)58
,840
Phul
ia (C
T)55
,653
Jayg
aon
(CT)
42,2
54
Pasc
him
Pun
ropa
ra (C
T)40
,683
Aur
anga
bad
(CT)
39,2
61
Chitt
aran
jan
(CT)
39,0
98
Kank
uria
(CT)
36,9
25

Annexure-1: Directory of Urban Centers in the Country with Population (2011)
225
Tow
n N
ame
Popu
latio
nCh
akap
ara
(CT)
35,2
82
Mat
la (C
T)31
,920
Pand
ua (C
T)30
,700
Mai
nagu
ri (C
T)30
,490
Bans
hra
(CT)
29,5
21
Sank
rail
(CT)
29,1
14
Jafr
abad
(CT)
28,3
32
Nib
ra (C
T)27
,818
Kajo
ra (C
T)27
,275
Kala
ra (C
T)27
,210
Kana
ipur
(CT)
26,8
14
Panc
hla
(CT)
26,4
32
Neb
adha
i Dutt
apuk
ur (C
T)25
,557
Chal
tia (C
T)25
,336
Sare
nga
(CT)
25,2
00
Kola
ghat
(CT)
25,1
91
Tegh
ari (
CT)
25,0
58
Utt
ar B
agdo
gra
(CT)
25,0
44
Chat
a Ka
likap
ur (C
T)24
,985
Bala
ram
pur
(CT)
24,4
31
Ghu
ni (C
T)24
,249
Ukh
ra (C
T)24
,104
Jaga
dana
ndap
ur (C
T)23
,822
Kank
sa (C
T)23
,789
Dhu
laga
ri (C
T)23
,740
Gop
jan
(CT)
23,4
15
Saha
jadp
ur (C
T)23
,280
Bhas
aipa
ikar
(CT)
23,1
41
Khag
raba
ri (C
T)23
,122
Tow
n N
ame
Popu
latio
nU
ttar
Ray
pur
(CT)
23,0
84
Sala
r (C
T)22
,894
Bagu
la (C
T)22
,649
Hin
dust
han
Cabl
es T
own
(CT)
22,5
99
Baru
ipur
(P) (
CT)
22,4
30
Para
npar
a (C
T)22
,297
Birl
apur
(CT)
22,0
78
Shya
mpu
r (C
T)22
,024
Juja
rsah
a (C
T)21
,820
Mah
adeb
Nag
ar (C
T)21
,737
Poda
ra (C
T)21
,589
Sing
ur (C
T)21
,382
Arr
a (C
T)21
,272
Gur
iaha
ti (C
T)21
,064
Dhu
ilya
(CT)
20,9
62
Shim
ulpu
r (C
T)20
,803
Ais
tala
(CT)
20,6
62
Fara
kka
Barr
age
Tow
nshi
p (C
T)20
,126
Kam
gach
hi (C
T)19
,998
Ond
al (C
T)19
,924
Srira
mpu
r (C
T)19
,830
Man
ikpu
r (C
T)19
,804
Fala
kata
(CT)
19,7
16
Panc
hpar
a (C
T)19
,283
Mal
likpu
r (C
T)19
,120
Jafa
rpur
(CT)
19,0
62
Keot
a (P
) (CT
)18
,875
Utt
ar S
atal
i (CT
)18
,454
Dom
jur
(CT)
18,4
33

Handbook of Urban Statistics
226
Tow
n N
ame
Popu
latio
nN
abag
ram
Col
ony
(CT)
18,3
58
Mah
iari
(CT)
18,2
23
Badk
ulla
(CT)
18,0
51
Talb
andh
a (C
T)17
,802
Dhu
sari
para
(CT)
17,8
00
Tele
ni P
ara
(CT)
17,7
81
Ruiy
a (C
T)17
,661
Bahu
la (C
T)17
,510
Nah
azar
i (CT
)17
,422
Mag
raha
t (CT
)17
,392
Alip
ur (C
T)17
,347
Gir
ia (C
T)17
,131
Nas
arat
pur
(CT)
17,0
44
Kaug
achh
i (CT
)17
,001
Patu
lia (C
T)16
,979
Jhor
hat (
CT)
16,9
40
Buita
(CT)
16,7
64
Am
ta (C
T)16
,699
Daf
arpu
r (C
T)16
,587
Rekj
uani
(CT)
16,5
53
Rish
ra (C
T)16
,503
Rajb
alha
t (CT
)16
,479
Kris
hnap
ur (C
T)16
,470
Utt
ar L
atab
ari (
CT)
16,3
50
Jaga
dish
pur
(CT)
16,2
59
Baha
ru (C
T)16
,155
Joyp
ul (C
T)16
,134
Ban
Har
ishp
ur (C
T)16
,067
Sim
la (C
T)15
,988
Tow
n N
ame
Popu
latio
nKu
lihan
da (C
T)15
,969
Gop
alpu
r (C
T)15
,967
Dig
hirp
ar (C
T)15
,881
Bara
Suz
apur
(CT)
15,8
08
Kalu
a (C
T)15
,735
Kend
a (C
T)15
,731
Baid
yana
thpu
r (C
T)15
,704
Daf
ahat
(CT)
15,6
88
Bana
rhat
Tea
Gar
den
(CT)
15,6
52
Bara
Moh
ansi
ngh
(CT)
15,6
16
Khan
dra
(CT)
15,3
83
Mith
ipur
(CT)
15,2
60
Sala
p (C
T)15
,171
Dal
urba
nd (C
T)15
,107
Beni
a G
ram
(CT)
15,0
46
Isla
mpu
r (C
T)15
,019
Sagu
na (P
) (CT
)14
,991
Adr
a (C
T)14
,956
Ragh
unat
hpur
(PS-
Mag
ra) (
CT)
14,9
19
Tari
(CT)
14,5
58
Biki
hako
la (C
T)14
,540
Cart
Roa
d (C
T)14
,444
Mira
(CT)
14,3
91
Pasc
him
Jitp
ur (C
T)14
,334
Shuv
arar
ah (C
T)14
,330
Mati
ari (
CT)
14,2
93
Am
alha
ra (C
T)14
,261
Chac
hand
a (C
T)14
,244
Odl
abar
i (CT
)14
,194

Annexure-1: Directory of Urban Centers in the Country with Population (2011)
227
Tow
n N
ame
Popu
latio
nRa
ghud
ebba
ti (C
T)14
,165
Chap
ra (C
T)14
,123
Gad
igac
hha
(CT)
14,0
85
Dak
shin
Ray
pur
(CT)
14,0
76
Srik
anta
bati
(CT)
14,0
27
Barj
ora
(CT)
14,0
12
Hiju
li (C
T)13
,969
Rajn
agar
(CT)
13,9
65
Chho
ra (C
T)13
,806
Balic
hak
(CT)
13,7
84
Dak
shin
Jhap
arda
ha (C
T)13
,704
Mad
anpu
r (C
T)13
,675
Dig
nala
(CT)
13,6
33
Patih
al (C
T)13
,573
Bam
angr
am (C
T)13
,550
Sula
ngga
ri (C
T)13
,496
Chak
Ban
kola
(CT)
13,4
92
Jaga
nnat
hpur
(CT)
13,4
54
Dum
rigu
ri (C
T)13
,416
Mur
agac
hha
(CT)
13,2
49
Basa
ntap
ur (C
T)13
,183
Jem
ari (
J.K. N
agar
Tow
nshi
p) (C
T)13
,179
Nal
dang
a (C
T)13
,140
Sukd
al (C
T)13
,093
Basu
debp
ur (C
T)13
,091
Kalik
apot
a (C
T)13
,086
Nar
i (P)
(CT)
13,0
72
Purb
a Bi
shnu
pur
(M) (
CT)
13,0
60
Utt
ampu
r (C
T)13
,000
Tow
n N
ame
Popu
latio
nKh
alis
ani (
CT)
12,9
70
Pasc
him
Bha
tjan
gla
(CT)
12,9
63
Anu
p N
agar
(CT)
12,9
40
Jana
i (CT
)12
,837
Sibd
anga
Bad
arpu
r (C
T)12
,829
Bahi
r Sa
rbam
anga
la (C
T)12
,819
Teha
tta
(CT)
12,7
70
Nab
abpu
r (C
T)12
,728
Chan
duri
a (C
T)12
,700
Bhol
ar D
abri
(CT)
12,6
70
Sila
mpu
r (C
T)12
,664
Bish
nupu
r (C
T)12
,660
Deu
lpur
(CT)
12,6
18
Jayk
rish
napu
r (C
T)12
,599
Brin
daba
npur
(CT)
12,5
83
Milk
i (CT
)12
,581
Chatt
a Ba
ria
(CT)
12,5
37
Dom
ohni
(CT)
12,4
80
Tald
i (CT
)12
,459
Taka
gach
(CT)
12,4
18
Pasc
him
Bai
nan
(CT)
12,4
05
Balia
dang
a (C
T)12
,379
Mas
ila (C
T)12
,239
Kum
irm
ora
(CT)
12,2
08
Suru
l (CT
)12
,160
Cham
paha
ti (C
T)12
,111
Kesa
bpur
(CT)
12,0
73
Chak
Kas
hipu
r (C
T)12
,035
Har
ihar
pur
(CT)
12,0
27

Handbook of Urban Statistics
228
Tow
n N
ame
Popu
latio
nG
uma
(CT)
12,0
25
Utt
ar K
amak
hyag
uri (
CT)
12,0
22
Dea
ra (C
T)11
,994
Cham
rail
(CT)
11,9
23
Kasi
m B
azar
(CT)
11,7
24
Sona
da K
hasm
ahal
(CT)
11,6
35
Koyr
a (C
T)11
,615
Telip
ara
Tea
Gar
den
(D) (
CT)
11,5
35
Mat
hapa
ri (C
T)11
,529
Kant
aber
ia (C
T)11
,507
Dih
i Kal
as (C
T)11
,494
Baru
ihud
a (C
T)11
,474
Para
ngar
par
(CT)
11,4
08
Nri
sing
hapu
r (C
T)11
,336
Jagt
aj (C
T)11
,261
Dak
shin
Raj
yadh
arpu
r (C
T)11
,254
Chho
ta S
uzap
ur (C
T)11
,216
Para
shko
l (CT
)11
,212
Mak
hal T
ala
(CT)
11,1
92
Shan
kara
(CT)
11,1
71
Tior
khal
i (CT
)11
,148
Chak
Ala
mpu
r (C
T)11
,144
Ank
urha
ti (C
T)11
,130
Chak
Kan
thal
ia (C
T)11
,108
Bara
Jum
la (C
T)11
,074
Bhim
ram
(CT)
11,0
58
Belu
milk
i (CT
)10
,998
Bagn
an (C
T)10
,996
Bow
ali (
CT)
10,9
68
Tow
n N
ame
Popu
latio
nKa
rari
Cha
ndpu
r (C
T)10
,941
Chan
dpur
(CT)
10,9
30
Beld
ubi (
CT)
10,8
71
Kany
anag
ar (C
T)10
,823
Birp
ara
(CT)
10,8
21
Noa
para
(P) (
CT)
10,8
19
Mas
land
apur
(CT)
10,7
90
Kend
ra K
hott
amdi
(CT)
10,7
50
Bera
ndar
i Bag
aria
(CT)
10,7
48
Kris
hna
Sali
(CT)
10,7
42
Bira
(CT)
10,7
41
Alip
urdu
ar R
ly.J
nc.(C
T)10
,733
Utt
ar K
usum
(CT)
10,7
16
Arg
ari (
CT)
10,7
15
Nas
ra (C
T)10
,707
Dak
shin
San
tosh
pur
(CT)
10,6
00
Sona
tala
(CT)
10,5
89
Kshi
dirp
ur (C
T)10
,556
Osm
anpu
r (C
T)10
,512
Bega
mpu
r (C
T)10
,487
Am
bhua
(CT)
10,4
77
Kari
dhya
(CT)
10,4
66
Kulia
(P) (
CT)
10,4
06
Banj
etia
(CT)
10,4
00
Chik
rand
(CT)
10,3
75
Chak
Ban
shbe
ria
(CT)
10,3
57
Ram
chan
drap
ur (C
T)10
,312
Ragh
abpu
r (C
T)10
,280
Jayp
ur (C
T)10
,259

Annexure-1: Directory of Urban Centers in the Country with Population (2011)
229
Tow
n N
ame
Popu
latio
nSi
rako
l (CT
)10
,250
Fate
hpur
(CT)
10,1
76
Gan
gnap
ur (C
T)10
,168
Dha
kuri
a (C
T)10
,165
Sash
pur
(P) (
CT)
10,1
00
Kala
ria
(CT)
10,0
75
Kasb
a (C
T)10
,067
Dha
mua
(CT)
10,0
55
Deb
ipur
(CT)
9,96
7
Dha
trig
ram
(CT)
9,95
1
Saha
pur
(CT)
9,90
6
Mam
rejp
ur (C
T)9,
851
Satig
achh
a (C
T)9,
847
Kash
imna
gar
(CT)
9,79
6
Dhu
nki (
CT)
9,78
4
Gob
inda
pur
(CT)
9,76
3
Raja
pur
(CT)
9,75
4
Shan
tipur
(CT)
9,74
6
Deu
lia (C
T)9,
663
Kari
mpu
r (C
T)9,
661
Ragh
unat
hpur
(PS-
Dan
kuni
) (CT
)9,
650
Khal
or (C
T)9,
636
Utt
ar M
adar
ihat
(CT)
9,63
1
Banu
pur
(CT)
9,62
6
Jayp
ur B
il (C
T)9,
598
Petu
a (C
T)9,
596
Chik
anpa
ra (C
T)9,
594
Mec
hiab
asti
(CT)
9,59
2
Parb
batip
ur (C
T)9,
584
Tow
n N
ame
Popu
latio
nBe
hari
a (C
T)9,
584
Kant
lia (C
T)9,
567
Ram
naga
r (C
T)9,
528
Man
baza
r (C
T)9,
521
Kakr
amar
i (CT
)9,
423
Har
hari
a Ch
ak (C
T)9,
411
Bipr
a N
oapa
ra (C
T)9,
408
Betp
uli (
CT)
9,40
4
Jhal
da (P
) (CT
)9,
384
Solg
ohal
ia (C
T)9,
373
Kala
ikun
da (C
T)9,
344
Joka
(CT)
9,30
2
Khad
inan
(CT)
9,29
7
Ahm
adpu
r (C
T)9,
242
Nay
abah
adur
pur
(CT)
9,23
9
Kalk
ut (P
) (CT
)9,
184
Ana
ntab
ati (C
T)9,
171
Pang
achh
iya
(CT)
9,16
5
Bam
anpu
kur
(CT)
9,13
7
Moh
anpu
r (C
T)9,
096
Saha
pur
(CT)
9,02
2
Deu
li (C
T)9,
007
Koda
lia (C
T)8,
994
Har
ishp
ur (C
T)8,
980
Jate
shw
ar (C
T)8,
963
Sidu
li (C
T)8,
961
Baba
npur
(P) (
CT)
8,94
2
Kaly
anpu
r (C
T)8,
914
Serp
ur (C
T)8,
900

Handbook of Urban Statistics
230
Tow
n N
ame
Popu
latio
nPa
rasi
a (C
T)8,
894
Ajo
dhya
Nag
ar (P
) (CT
)8,
883
Mal
lik B
agan
(CT)
8,86
9
Bhan
owar
a (C
T)8,
855
Baru
a (P
) (CT
)8,
852
Sank
railj
ala
(CT)
8,81
2
Naz
irpu
r (C
T)8,
778
Basa
i (CT
)8,
772
Am
tala
(CT)
8,76
5
Gen
i (CT
)8,
747
Batik
a (C
T)8,
717
Mak
arda
ha (C
T)8,
713
Itind
a (C
T)8,
679
Bagb
ari(C
T)8,
660
Poal
i (CT
)8,
657
Shan
khan
agar
(CT)
8,60
1
Chak
chak
a (C
T)8,
582
Bilp
ahar
i (CT
)8,
565
Lalp
ur (P
) (CT
)8,
536
Balib
hara
(CT)
8,52
1
Tegh
ari (
CT)
8,49
1
Kona
rdih
i (CT
)8,
488
Kotu
lpur
(CT)
8,48
3
Mird
hang
a (C
T)8,
482
Dha
rmap
ur (C
T)8,
456
Char
ka (C
T)8,
451
Dak
shin
Kha
nda
(CT)
8,44
9
Panc
hgha
ra (C
T)8,
428
Utt
ar Jh
apar
daha
(CT)
8,42
5
Tow
n N
ame
Popu
latio
nPa
nuri
a (C
T)8,
399
Baya
rsin
g (C
T)8,
346
Dar
appu
r (C
T)8,
275
Utt
ar M
aham
mad
pur
(CT)
8,26
4
Raig
achh
i (CT
)8,
245
Kris
hnap
ur (C
T)8,
205
Ram
chan
drap
ur (C
T)8,
196
Nag
daha
(CT)
8,19
2
Hin
galg
anj (
CT)
8,17
9
Haf
ania
(CT)
8,17
1
Dig
ha (C
T)8,
159
Man
ushp
ur (C
T)8,
148
Kris
hna
Chan
drap
ur (C
T)8,
146
Sam
ukto
la (C
T)8,
132
Bish
nupu
r (C
T)8,
118
Band
ipur
(CT)
8,11
5
Fate
pur
(CT)
8,10
5
Chak
Bar
bari
a (C
T)8,
088
Bara
baza
r (C
T)8,
056
Nim
pith
(CT)
8,01
4
Mas
at (C
T)8,
007
Mug
kaly
an (C
T)7,
961
Purb
ba N
aray
anpu
r (C
T)7,
950
Hiju
li (C
T)7,
917
Am
odgh
ata
(CT)
7,91
0
Dih
iman
dalg
hat (
CT)
7,91
0
Gan
gadh
arpu
r (C
T)7,
862
Seha
ra (C
T)7,
858
Nau
pala
(CT)
7,85
6

Annexure-1: Directory of Urban Centers in the Country with Population (2011)
231
Tow
n N
ame
Popu
latio
nKh
arim
ala
Khag
raba
ri (C
T)7,
844
Gho
rsal
a (C
T)7,
837
Maj
dia
(CT)
7,83
1
Gop
alpu
r (C
T)7,
818
Arr
a (C
T)7,
808
Mat
hura
pur
(CT)
7,79
7
Pani
ara
(CT)
7,78
7
Sadp
ur (C
T)7,
773
Bhab
ki (C
T)7,
772
Dw
ari G
eria
(CT)
7,75
4
Kuld
anga
(CT)
7,74
2
Nok
pul (
CT)
7,73
7
Mir
zapu
r (C
T)7,
733
Chas
para
(CT)
7,73
1
Sant
oshp
ur (C
T)7,
695
Jot K
amal
(CT)
7,68
5
Han
sgha
ra (C
T)7,
665
Egar
a (C
T)7,
623
Chec
hakh
ata
(CT)
7,61
3
Gar
shya
mna
gar
(CT)
7,61
1
Jadu
pur
(CT)
7,58
5
Gai
rkat
a (C
T)7,
577
Baru
nda
(CT)
7,53
4
Gan
gadh
arpu
r (C
T)7,
533
Nas
ibpu
r (C
T)7,
517
Eks
ara
(CT)
7,50
0
Jang
alpa
ra (C
T)7,
478
Chel
ad (C
T)7,
471
Dak
shin
Kha
grab
ari (
CT)
7,46
9
Tow
n N
ame
Popu
latio
nJir
at (C
T)7,
430
Man
iram
pur
(CT)
7,42
8
Bani
ban
Jaga
dish
pur
(CT)
7,40
2
Khat
ra (C
T)7,
382
Khaj
utti (C
T)7,
380
Mur
gath
aul (
CT)
7,37
1
Shya
mpu
r (C
T)7,
354
Khod
aram
pur
(CT)
7,27
7
Dak
shin
Cha
tra
(CT)
7,27
5
Kola
(CT)
7,27
1
Naw
apar
a (C
T)7,
262
Baks
inag
ar (C
T)7,
255
Nam
ajgr
am (C
T)7,
252
Srip
ur (C
T)7,
224
Nati
bpur
(CT)
7,21
2
Fate
llapu
r (C
T)7,
207
Sim
lapa
l (CT
)7,
206
Tent
ulku
li (C
T)7,
203
Ram
esw
arpu
r (C
T)7,
200
Bara
Bam
onia
(CT)
7,19
3
Sam
ali (
CT)
7,18
0
Utt
ar G
oara
(CT)
7,17
8
Hira
pur
(CT)
7,17
7
Hat
sim
la (C
T)7,
141
Lask
arpa
ra (C
T)7,
137
Bari
jhati
(CT)
7,13
6
Ilam
baza
r (C
T)7,
125
Chan
dpar
a (C
T)7,
113
Jaga
tbal
lavp
ur (C
T)7,
113

Handbook of Urban Statistics
232
Tow
n N
ame
Popu
latio
nSa
hebp
ur (C
T)7,
109
Ragh
udeb
pur
(CT)
7,08
1
Bhag
abati
pur
(CT)
7,06
8
Purb
ba T
ajpu
r (C
T)7,
035
Gop
alpu
r (C
T)7,
016
Nai
ti (C
T)6,
996
Kulb
eria
(CT)
6,99
3
Mah
endr
apur
(CT)
6,97
9
Jayn
agar
(CT)
6,97
7
Pasc
him
Pan
chla
(CT)
6,95
1
Sim
hat (
CT)
6,94
5
Sona
tikir
i (CT
)6,
919
Dig
ha (C
T)6,
916
Shas
hati
(CT)
6,91
4
Nal
pur
(CT)
6,91
1
Mih
itikr
i (CT
)6,
906
Bank
ra (C
T)6,
897
Lalm
an (C
T)6,
894
Jatr
agac
hhi (
CT)
6,89
0
Kank
i (P)
(CT)
6,88
4
Pung
lia (C
T)6,
857
Basu
debp
ur (C
T)6,
830
Bam
anga
chhi
(CT)
6,82
4
Sibn
agar
(CT)
6,81
2
Ram
anat
hpur
(CT)
6,81
1
Utt
arpa
rani
j (CT
)6,
810
Rudr
apur
(CT)
6,81
0
Babl
ari D
ewan
ganj
(CT)
6,80
6
Mat
hura
pur
(CT)
6,80
3
Tow
n N
ame
Popu
latio
nBe
nudi
a (C
T)6,
797
Dur
llabh
ganj
(CT)
6,79
6
Dun
gra
Khas
mah
al (C
T)6,
789
Bank
ul (C
T)6,
779
Chan
dpur
(M) (
CT)
6,77
7
Nai
nan
(CT)
6,77
2
Dan
ga (C
T)6,
766
Bang
alpu
r (C
T)6,
760
Chak
Ena
yetn
agar
(CT)
6,75
4
Pala
shi (
CT)
6,74
8
Uda
ng (C
T)6,
747
Ula
(CT)
6,73
8
Baru
ipar
a (C
T)6,
731
Deo
ra (C
T)6,
715
Mad
husu
danp
ur (C
T)6,
685
Radh
anag
ar (C
T)66
75
Bam
unar
a (C
T)6,
665
Gar
h Ka
mal
pur
(CT)
6,66
4
Khar
ibar
i (CT
)6,
660
Dha
nia
(CT)
6,65
9
Jala
Ken
dua
(CT)
6,65
8
Kang
anba
ria
(CT)
6,65
7
Hal
yan
(CT)
6,63
7
Har
idas
mati
(CT)
6,62
7
Basa
nti (C
T)6,
625
Chin
chur
ia (C
T)6,
617
Baru
a G
opal
pur
(CT)
6,61
4
Bask
a (C
T)6,
609
Bani
ban
(CT)
6,59
7

Annexure-1: Directory of Urban Centers in the Country with Population (2011)
233
Tow
n N
ame
Popu
latio
nG
oasa
fat (
CT)
6,59
7
Dau
latp
ur (C
T)6,
568
Chap
ari (
CT)
6,55
6
Khan
tora
(CT)
6,54
7
Bora
i (CT
)6,
522
Deu
lgra
m (C
T)6,
517
Deb
ipur
(CT)
6,50
6
Chan
dipu
r (C
T)6,
488
God
a (P
) (CT
)6,
483
Jagi
jhor
a Ba
raba
k (C
T)6,
474
Utt
ar K
alas
(CT)
6,47
4
Panu
hat (
CT)
6,47
3
Balla
vpur
(CT)
6,46
8
Belia
tore
(CT)
6,46
3
Chan
drap
ur (C
T)6,
456
Kend
ua (C
T)6,
452
Patu
li (C
T)6,
441
Baks
a (C
T)6,
432
Chan
dapu
r Ch
ampa
gach
hi (C
T)6,
431
Palta
para
(CT)
6,40
8
Am
arsh
i Kas
ba (C
T)6,
400
Sank
arpu
r (C
T)6,
399
Dak
hin
Ram
pur
(CT)
6,39
2
Dan
dirh
at (P
) (CT
)6,
387
Khod
ar B
azar
(CT)
6,36
0
Nis
chin
tapu
r (C
T)6,
353
Jetia
(CT)
6,34
9
Bhat
enda
(CT)
6,34
9
Begu
n Ko
dar
(CT)
6,34
7
Tow
n N
ame
Popu
latio
nG
angp
ur (C
T)6,
347
Ram
akan
tapu
r (C
T)6,
347
Panc
hgha
ra (C
T)6,
340
Kend
ua (C
T)6,
338
Bila
ndap
ur (C
T)6,
330
Koka
pur
(CT)
6,31
7
Mad
na (C
T)6,
312
And
ul (C
T)6,
302
Gan
gapu
r (C
T)6,
301
Raip
ur B
azar
(CT)
6,28
0
Asu
ti (C
T)6,
272
Chak
Bhr
igu
(CT)
6,26
9
Bam
unar
i (CT
)6,
266
Khal
ia (C
T)6,
265
Ram
chan
drap
ur (C
T)6,
252
Sadi
gach
hi (C
T)6,
248
Khar
sara
i (CT
)6,
247
Ust
hi (C
T)6,
230
Gho
la N
oapa
ra (C
T)6,
210
Chau
lia (C
T)6,
186
And
al(G
ram
) (CT
)6,
177
Band
hail
(CT)
6,17
5
Nab
a Ko
la (C
T)6,
169
Bhan
dar
Gac
hha
(CT)
6,15
6
Kalik
apur
Bar
asat
(CT)
6,10
4
Bada
mta
m T
ea G
arde
n (C
T)6,
102
Kotb
ar (C
T)6,
083
Mir
zapu
r (C
T)6,
083
Bilk
anda
(CT)
6,08
1

Handbook of Urban Statistics
234
Tow
n N
ame
Popu
latio
nD
onal
ia (C
T)6,
081
Kanp
ur (C
T)6,
069
Arj
unpu
r (C
T)6,
042
Bhan
gar
Ragh
unat
hpur
(CT)
6,03
7
Utt
ar B
agun
di (C
T)6,
027
Itah
ar (C
T)6,
022
Ichh
lam
pur
(CT)
6,01
5
Nac
hhra
tpur
Kat
abar
i (CT
)6,
011
Ragh
unat
hcha
k (C
T)6,
006
Man
sinh
apur
(CT)
6,00
4
Chek
ya (C
T)5,
995
Palla
daha
(CT)
5,99
4
Band
oan
(CT)
5,99
3
Hat
gach
ha (C
T)5,
980
Ram
kris
hnap
ur (C
T)5,
971
Nab
agra
m (C
T)5,
963
Han
skun
da (C
T)5,
939
Alip
ur (C
T)5,
937
Man
galb
ari (
CT)
5,93
4
Kaiju
ri (C
T)5,
932
Mur
ulia
(CT)
5,92
9
Nad
abha
nga
(CT)
5,92
7
Har
ipur
(CT)
5,91
0
Aih
o (C
T)5,
898
Ana
rbar
ia (C
T)5,
895
Kulit
apar
a (C
T)5,
895
Jitu
(CT)
5,89
2
Hut
mur
a (C
T)5,
878
Nab
ghar
a (C
T)5,
875
Tow
n N
ame
Popu
latio
nU
ttar
Pir
pur
(CT)
5,86
8
Nau
l (CT
)5,
865
Kalik
apur
(CT)
5,86
0
Belg
hari
a (C
T)5,
858
Khor
ddab
amon
ia (C
T)5,
856
Am
lajo
ra (C
T)5,
856
Mas
at (C
T)5,
839
Shib
alay
a (C
T)5,
830
Gab
beri
a (C
T)5,
823
Pash
chim
Kha
lna
(CT)
5,81
3
Dho
la (C
T)5,
804
Nan
digr
am (C
T)5,
803
Cong
tong
Tea
Gar
den
(CT)
5,80
2
Sing
tam
Tea
Gar
den
(CT)
5,79
2
Kom
arha
t (CT
)5,
782
Chop
ra (C
T)5,
777
Mur
arai
(CT)
5,77
0
Priy
anag
ar (C
T)5,
763
Suba
rnap
ur (C
T)5,
759
Kach
u Pu
kur
(CT)
5,75
2
Ragh
abpu
r (P
) (CT
)5,
748
Shild
a (C
T)5,
724
Utt
ar D
urga
pur
(CT)
5,72
3
Dog
achh
ia (C
T)5,
705
Bans
hra
(CT)
5,70
3
Swan
gram
pur
(CT)
5,69
9
Lagd
a (C
T)56
94
Gho
sal C
hak
(CT)
5,68
1
Bha
ndar
daha
(CT)
5,66
7
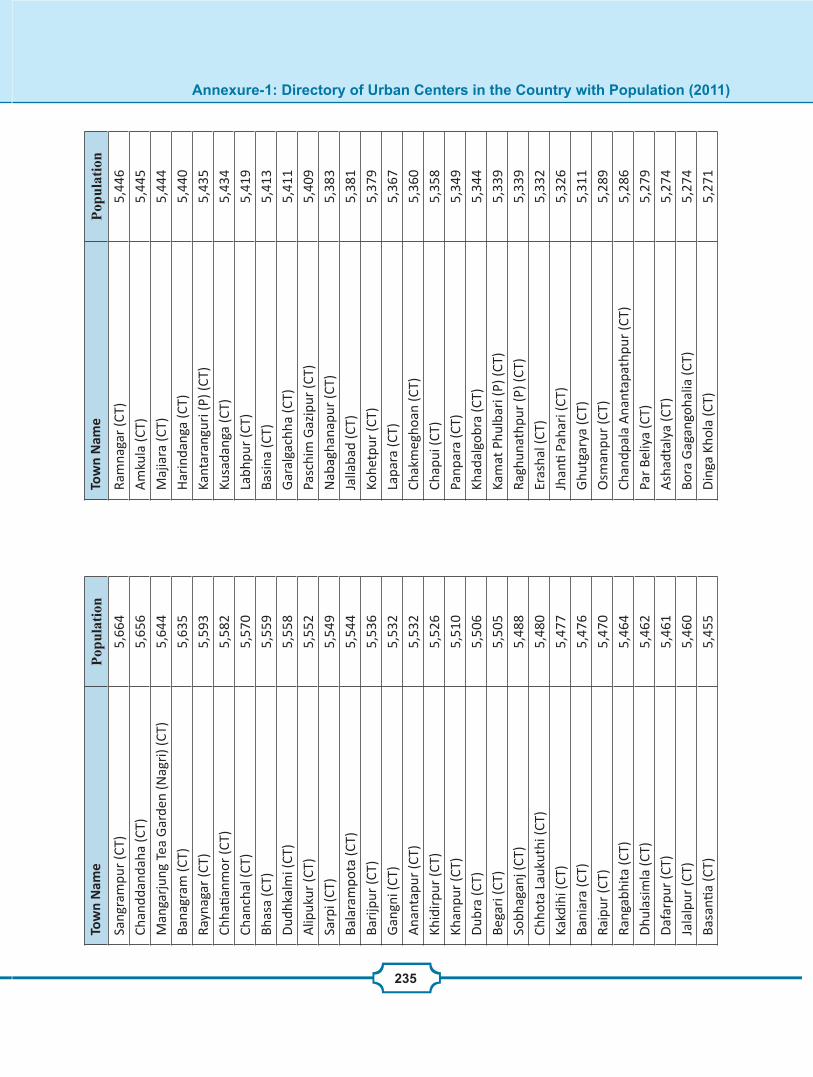
Annexure-1: Directory of Urban Centers in the Country with Population (2011)
235
Tow
n N
ame
Popu
latio
nSa
ngra
mpu
r (C
T)5,
664
Chan
ddan
daha
(CT)
5,65
6
Man
garj
ung
Tea
Gar
den
(Nag
ri) (
CT)
5,64
4
Bana
gram
(CT)
5,63
5
Rayn
agar
(CT)
5,59
3
Chha
tianm
or (C
T)5,
582
Chan
chal
(CT)
5,57
0
Bhas
a (C
T)5,
559
Dud
hkal
mi (
CT)
5,55
8
Alip
ukur
(CT)
5,55
2
Sarp
i (CT
)5,
549
Bala
ram
pota
(CT)
5,54
4
Bari
jpur
(CT)
5,53
6
Gan
gni (
CT)
5,53
2
Ana
ntap
ur (C
T)5,
532
Khid
irpu
r (C
T)5,
526
Khan
pur
(CT)
5,51
0
Dub
ra (C
T)5,
506
Bega
ri (C
T)5,
505
Sobh
agan
j (CT
)5,
488
Chho
ta L
auku
thi (
CT)
5,48
0
Kakd
ihi (
CT)
5,47
7
Bani
ara
(CT)
5,47
6
Raip
ur (C
T)5,
470
Rang
abhi
ta (C
T)5,
464
Dhu
lasi
mla
(CT)
5,46
2
Daf
arpu
r (C
T)5,
461
Jala
lpur
(CT)
5,46
0
Basa
ntia
(CT)
5,45
5
Tow
n N
ame
Popu
latio
nRa
mna
gar
(CT)
5,44
6
Am
kula
(CT)
5,44
5
Maj
iara
(CT)
5,44
4
Har
inda
nga
(CT)
5,44
0
Kant
aran
guri
(P) (
CT)
5,43
5
Kusa
dang
a (C
T)5,
434
Labh
pur
(CT)
5,41
9
Basi
na (C
T)5,
413
Gar
alga
chha
(CT)
5,41
1
Pasc
him
Gaz
ipur
(CT)
5,40
9
Nab
agha
napu
r (C
T)5,
383
Jalla
bad
(CT)
5,38
1
Kohe
tpur
(CT)
5,37
9
Lapa
ra (C
T)5,
367
Chak
meg
hoan
(CT)
5,36
0
Chap
ui (C
T)5,
358
Panp
ara
(CT)
5,34
9
Khad
algo
bra
(CT)
5,34
4
Kam
at P
hulb
ari (
P) (C
T)5,
339
Ragh
unat
hpur
(P) (
CT)
5,33
9
Eras
hal (
CT)
5,33
2
Jhan
ti Pa
hari
(CT)
5,32
6
Ghu
tgar
ya (C
T)5,
311
Osm
anpu
r (C
T)5,
289
Chan
dpal
a A
nant
apat
hpur
(CT)
5,28
6
Par
Beliy
a (C
T)5,
279
Ash
adta
lya
(CT)
5,27
4
Bora
Gag
ango
halia
(CT)
5,27
4
Din
ga K
hola
(CT)
5,27
1

Handbook of Urban Statistics
236
Tow
n N
ame
Popu
latio
nD
akra
(P) (
CT)
5,26
8
Gho
ralia
(CT)
5,26
8
Has
imna
gar
(CT)
5,26
7
Paro
ta (C
T)5,
267
Gau
r D
aha
(CT)
5,26
0
Bal
aram
pur
(CT)
5,25
1
Chak
iabh
ita (C
T)5,
251
Jaga
tnag
ar (C
T)5,
242
Anu
lia (C
T)5,
220
Ichh
apur
Def
ence
Est
ate
(CT)
5,21
9
Bang
sidh
arpu
r (M
) (P)
(CT)
5,21
8
Gan
ye G
anga
dhar
pur
(CT)
5,21
0
Purb
a Ra
nagh
at (C
T)5,
207
Hal
alpu
r Kr
ishn
apur
(CT)
5,20
2
Gor
a Ba
zar
(CT)
5,20
0
Shya
mdh
an (C
T)5,
192
Benj
anha
ri A
char
ial (
P) (C
T)5,
187
Ekab
barp
ur (C
T)5,
187
Jayk
rish
napu
r (C
T)5,
180
Dak
shin
Bag
uan
(CT)
5,18
0
Bara
(CT)
5,17
2
Am
lago
ra (C
T)5,
165
Bard
a (C
T)5,
155
Rong
moo
k Ce
der
Tea
Gar
den
(CT)
5,15
0
Kapa
shan
ria
(CT)
5,14
8
Dha
nyak
uria
(CT)
5,14
8
Kunu
star
a (C
T)5,
127
Mir
japu
r (C
T)5,
114
Bakt
arna
gar
(CT)
5,11
2
Tow
n N
ame
Popu
latio
nKh
asja
lals
i (CT
)5,
111
Gar
beta
(CT)
5,10
9
Jang
al (C
T)5,
106
Salto
r (C
T)5,
094
Salip
ur (P
) (CT
)5,
091
Bala
ram
bati
(CT)
5,06
8
Ledi
sol (
CT)
5,05
6
Char
Bra
hman
agar
(CT)
5,05
3
Badh
agac
hhi (
CT)
5,05
2
Chan
drap
ur (C
T)5,
047
Bish
nupu
r (C
T)5,
030
Sim
ural
i (CT
)5,
027
Jhan
gra
(CT)
5,02
2
Bais
guri
(CT)
5,02
1
Har
iram
pur
(CT)
5,02
1
Char
Mai
jdia
(CT)
5,01
3
Oad
ipur
(CT)
5,00
2
Dak
shin
Odl
abar
i (CT
)4,
997
Chhe
kati
(CT)
4,99
5
Patd
aha
(CT)
4,99
3
Har
inad
ibha
stsa
la (C
T)4,
983
Lata
guri
(CT)
4,98
1
Chal
sa M
ahab
ari (
CT)
4,97
3
Hin
cha
Ger
ya (C
T)4,
958
Baira
tisal
(CT)
4,91
6
Chak
Bar
ia (C
T)4,
914
Tisa
(CT)
4,88
2
Barg
achh
ia (C
T)4,
872
Goa
ljan
(CT)
4,85
0

Annexure-1: Directory of Urban Centers in the Country with Population (2011)
237
Tow
n N
ame
Popu
latio
nM
ohan
pur
(CT)
4,84
5
Mar
icha
(CT)
4,84
2
Bane
swar
(CT)
4,84
1
Mah
al (C
T)4,
841
Pala
shba
n (C
T)4,
811
Gar
ia (C
T)4,
805
Ichh
apur
(CT)
4,79
5
Kana
ipur
(CT)
4782
Kalip
ur (C
T)4,
770
Chan
drap
ur (C
T)4,
742
Bane
shw
arpu
r (C
T)4,
741
Kari
a (C
T)4,
737
Sahe
bgan
j (CT
)4,
715
Batu
l (CT
)4,
707
Paira
gach
ha (C
T)4,
703
Utt
ar B
ishn
upur
(CT)
4,70
3
Path
arbe
ria
(CT)
4,69
8
Lalp
ur (C
T)4,
691
Gop
inat
hpur
(CT)
4,68
8
Dur
gana
gar
(CT)
4,65
8
Bark
alik
apur
(CT)
4,65
0
Bidy
adha
rpur
(CT)
4,63
0
Nab
gram
(CT)
4,62
6
Radh
apur
(CT)
4,62
3
Abh
iram
pur
(CT)
4,61
8
Alik
hoja
(CT)
4,61
3
Gho
rabe
ria
(CT)
4,61
2
Sirs
ha (C
T)4,
600
Chon
g G
hura
li (C
T)4,
596
Tow
n N
ame
Popu
latio
nM
anda
rban
i (CT
)4,
592
Kam
rang
a (C
T)4,
585
Jalu
idan
ga (C
T)4,
571
Barg
achh
ia (C
T)4,
566
Budb
ud (C
T)4,
558
Bam
na (C
T)4,
517
Sond
a (P
) (CT
)4,
511
Ratib
ati (C
T)4,
508
Nag
ar C
hang
raba
ndha
(CT)
4,48
3
Pray
agpu
r (C
T)4,
479
Gon
dalp
ara
(CT)
4,47
4
Bele
bath
an (C
T)4,
459
Sukh
iapo
khri
(CT)
4,45
0
Alip
ur (C
T)4,
420
Ajo
dhya
naga
r (C
T)4,
409
Dha
liaba
ri (C
T)4,
383
Bhan
gri P
rath
am K
hand
a (C
T)4,
379
Srim
anta
pur
(P) (
CT)
4,37
4
Tuls
high
ata
(CT)
4,36
6
Balu
hati
(CT)
4,36
3
Deo
ra (C
T)4,
360
Tops
i (CT
)4,
329
Nar
idan
a (C
T)4,
277
Mati
alih
at (C
T)4,
215
Mah
ira (C
T)4,
188
Sish
a-Ju
mrh
a (C
T)4,
130
Khar
isha
(CT)
4,12
0
Gin
g Te
a G
arde
n (C
T)4,
089
Har
ingh
ata
Farm
(CT)
3,98
9

Handbook of Urban Statistics
238
Tow
n N
ame
Popu
latio
nRa
nagh
at (C
T)3,
982
Han
spuk
uria
(CT)
3,88
7
Biro
dhi (
CT)
3,83
8
Krip
aram
pur
(CT)
3,77
8
Piar
inag
ar (C
T)3,
678
Puru
sott
ampu
r (C
T)3,
665
Balih
ati (C
T)3,
637
Min
akha
n (C
T)3,
474
Nim
sa (C
T)3,
459
Kam
alap
ur (C
T)3,
348
Par
Patir
am (C
T)3,
225
Dak
shin
Bag
dogr
a (C
T)2,
647
Sant
aldi
h Th
erm
al P
ower
Pro
ject
-Tow
n (C
T)2,
507
Mah
ishr
ekha
(CT)
2,01
7
Jhar
khan
d
Dha
nbad
(M C
orp.
)1,
162,
472
Ranc
hi (M
Cor
p.)
1,07
3,42
7
Deo
ghar
(M
Cor
p.)
203,
123
Jugs
alai
(M)
49,6
60
Gum
la (N
P)51
,264
God
da (N
P)48
,480
Gar
hwa
(NP)
46,0
59
Paka
ur (N
P)45
,840
Chir
kund
a (N
P)45
,508
Sim
dega
(NP)
42,9
44
Bish
ram
pur
(NP)
42,9
25
Mih
ijam
(NP)
40,4
63
Khun
ti (N
P)36
,390
Tow
n N
ame
Popu
latio
nJa
mta
ra (N
P)29
,415
Hus
sain
abad
(NP)
29,2
41
Late
har
(NP)
26,9
81
Koda
rma
(NP)
24,6
33
Rajm
ahal
(NP)
22,5
14
Bund
u (N
P)21
,054
Maj
hion
(NP)
18,3
49
Basu
kina
th (N
P)17
,123
Sera
ikel
a (N
P)14
,252
Adi
tyap
ur (N
agar
Par
isha
d)17
4,35
5
Haz
arib
ag (N
agar
Par
isha
d)14
2,48
9
Chas
(Nag
ar P
aris
had)
141,
640
Gir
idih
(Nag
ar P
aris
had)
114,
533
Phus
ro (N
agar
Par
isha
d)89
,178
Sahi
bgan
j (N
agar
Par
isha
d)88
,214
Jhum
ri T
ilaiy
a (N
agar
Par
isha
d)87
,867
Med
nina
gar
(Nag
ar P
aris
had)
78,3
96
Chai
basa
(Nag
ar P
aris
had)
69,5
65
Loha
rdag
a (N
agar
Par
isha
d)57
,411
Chak
ardh
arpu
r (N
agar
Par
isha
d)56
,531
Mad
hupu
r (N
agar
Par
isha
d)55
,238
Chat
ra (N
agar
Par
isha
d)49
,985
Dum
ka (N
agar
Par
isha
d)47
,584
Jam
shed
pur
(NAC
)63
1,36
4
Man
go (N
AC)
223,
805
Ram
garh
Can
tonm
ent (
CB)
88,7
81
Boka
ro S
teel
City
(CT)
414,
820
Saun
da (C
T)81
,915
Bagb
era
(CT)
78,3
56

Annexure-1: Directory of Urban Centers in the Country with Population (2011)
239
Tow
n N
ame
Popu
latio
nG
umia
(CT)
48,1
41
Kopa
li (C
T)43
,256
Gha
tshi
la (C
T)40
,624
Boka
ro (C
T)39
,305
Patr
atu
(CT)
32,8
99
Jari
dih
Baza
r (C
T)31
,882
Chho
ta G
obin
dpur
(CT)
31,8
43
Gom
oh (C
T)31
,495
Mus
aban
i (CT
)31
,035
Chan
drap
ura
(CT)
27,4
25
Hal
udba
ni (C
T)25
,360
Chur
i (CT
)24
,876
Baru
ghut
u (C
T)24
,202
Siul
iban
(CT)
24,1
25
Sarj
amda
(CT)
23,7
88
Chita
r Pu
r (C
T)22
,837
Dug
da (C
T)22
,740
Ratu
(CT)
22,3
79
Tenu
dam
-Cum
-Kat
hhar
a (C
T)22
,080
Kuju
(CT)
21,3
56
Gho
raba
ndha
(CT)
20,7
18
Khel
ari (
CT)
20,0
10
Sirk
a (C
T)19
,871
Bark
i Sar
aiya
(CT)
18,9
33
Mai
thon
(CT)
18,8
30
Gad
hra
(CT)
18,8
01
Jadu
gora
(CT)
18,5
63
Bark
akan
a (C
T)18
,475
Noa
mun
di (C
T)17
,954
Tow
n N
ame
Popu
latio
nKa
nke
(CT)
17,5
60
Berm
o (C
T)17
,401
Chak
ulia
(NP)
16,3
06
Kedl
a (C
T)16
,054
Dom
chan
ch (C
T)15
,809
Sara
m (C
T)15
,212
Bara
tola
(CT)
14,8
80
Pala
wa
(CT)
14,8
48
Nirs
a (C
T)14
,794
Sund
na (C
T)14
,552
Telo
(CT)
14,2
74
Ara
(CT
)13
,547
Shah
Pur
(CT)
13,5
13
Gid
i (CT
)13
,356
Band
h D
ih (C
T)13
,192
Jhin
kpan
i (CT
)13
,068
Bach
ra (C
T)12
,969
Tati
(CT)
12,8
78
Mur
i (CT
)12
,744
Barh
arw
a (C
T)12
,617
Gua
(CT)
12,5
54
Rerm
a (C
T)12
,497
Man
ohar
Pur
(CT)
12,4
53
Chan
dwa
(CT)
12,0
46
Barh
i (CT
)11
,867
Egar
kunr
(CT)
11,8
29
Satg
awan
Alia
s H
arih
arga
nj (C
T)11
,811
Dum
arku
nda
(CT)
11,4
34
Gob
indp
ur (C
T)11
,318

Handbook of Urban Statistics
240
Tow
n N
ame
Popu
latio
nH
asir
(CT)
11,1
95
Tund
iul (
CT)
11,1
90
Okn
i No.
II (C
T)11
,106
Mah
agm
a (C
T)10
,969
Hal
udpu
khur
(CT)
10,4
85
Mar
ai K
alan
(CT)
10,4
47
Man
du (C
T)10
,223
Balia
pur
(CT)
10,0
97
Pura
na D
umka
(CT)
10,0
34
Berh
ait S
anta
li (C
T)9,
753
Isri
(CT)
9,74
9
Ars
ande
(CT)
9,58
2
Panr
ra (C
T)9,
563
Patr
a (C
T)9,
536
Baua
Kal
an (C
T)9,
489
Nag
ri K
alan
(CT)
9,41
0
Kiri
buru
(CT)
9,37
2
Para
tdih
(CT)
8,85
4
Rajb
hita
Alia
s Ra
jgan
j (CT
)8,
820
Dha
nwar
(CT)
8,77
7
Bara
jam
da (C
T)8,
629
Barg
arw
a (C
T)8,
615
Torp
a (C
T)8,
592
Gha
gra
(CT)
8,58
0
Ragh
unan
danp
ur (C
T)8,
335
Rasi
kpur
(CT)
8,32
0
Konr
a (C
T)8,
258
Relig
ara
Alia
s Pa
chhi
ari (
CT)
8,23
9
Mal
kera
(CT)
8,23
2
Tow
n N
ame
Popu
latio
nCh
ain
Pur
(CT)
8,18
8
Kand
ra (C
T)8,
157
Jena
(CT)
8,14
3
Lapa
nga
(CT)
8,01
7
Tanr
Bal
idih
(CT)
7,98
2
Puri
hasa
(CT)
7,89
7
Barw
adih
(CT
)7,
888
Sew
ai (C
T)7,
874
Band
hgor
a (C
T)7,
859
Kurp
ania
(CT)
7,78
9
Mer
u (C
T)7,
780
Dan
didi
h (C
T)7,
769
Jang
alpu
r (C
T)7,
603
Chho
ta G
amha
ria
(CT)
7,50
5
Mah
esh
Mun
di (C
T)7,
389
Jaga
nnat
hpur
(CT)
7,31
0
Panc
het (
CT)
7,29
6
Kadm
a N
o-II
(CT)
7,23
9
Beko
bar
(CT)
7,18
4
Sirs
ia (C
T)7,
181
Kum
arpu
r (C
T)7,
153
Dud
hani
(CT)
7,11
7
Mer
a (C
T)7,
051
Bhoj
udih
(CT)
7,00
5
Ray
(CT)
6,97
7
Telo
dih
(CT)
6,97
0
Bori
o (C
T)6,
964
Har
ihar
pur
(CT)
6,93
8
Gun
ghas
a (C
T)6,
845

Annexure-1: Directory of Urban Centers in the Country with Population (2011)
241
Tow
n N
ame
Popu
latio
nCh
arhi
(CT)
6,84
2
Sahn
idih
(CT)
6,77
7
Dum
ra (C
T)6,
772
Pond
arka
nali
(CT)
6,61
1
Seot
a (C
T)6,
554
Dar
i (CT
)6,
405
Karm
atan
r (C
T)6,
392
Sini
(CT)
6,38
2
Mah
lidih
(CT)
6,38
1
Mur
aidi
h (C
T)6,
360
Ara
(CT)
6,34
6
Akd
oni K
hurd
(CT)
6,32
1
Jam
tara
(CT)
6,25
5
Sanr
i Alia
s Ti
laiy
a (C
T)6,
186
Saga
rmpu
r (C
T)6,
184
Topc
hanc
hi (C
T)6,
082
Mas
ratu
(CT)
5,99
6
Meg
haha
tubu
ru F
ores
t Vill
age
(CT)
5,99
2
Phul
war
tanr
(CT)
5,88
4
Karm
a Ta
nr (C
T)5,
868
Orl
a (C
T)5,
809
Karm
a (C
T)5,
753
Mati
gara
(CT)
5,68
5
Khar
khar
i (CT
)5,
656
Sial
gudr
i (CT
)5,
450
Nar
ra (C
T)5,
390
Chau
para
n (C
T)5,
361
Jai N
agar
(CT)
5,34
7
Tin
Paha
r (C
T)5,
336
Tow
n N
ame
Popu
latio
nM
arar
(CT)
5,29
8
Patr
odih
(CT)
5,29
3
Cher
ra (C
T)5,
279
Sind
uria
(CT)
5,26
2
Toto
(CT)
5,23
7
Bong
abar
(CT)
5,23
6
Irba
(CT)
5,21
0
Mah
uda
(CT)
5,19
6
Bhim
Kan
ari (
CT)
5,17
0
Term
i (CT
)5,
111
Tapi
ng (C
T)5,
080
Topa
(CT
)5,
028
Sara
uni (
CT)
4,97
0
Uri
mar
i (CT
)4,
948
Ala
udia
(CT)
4,94
3
Bish
nuga
rh (C
T)4,
847
Chan
dil (
CT)
4,83
9
Panc
hmah
ali (
CT)
4,83
2
Bham
al (C
T)4,
818
Berh
ait B
azar
(CT)
4,73
2
Sura
nga
(CT)
4,70
8
Ara
lgor
ia (C
T)4,
647
Mar
ma
(CT)
4,64
0
Har
ina
(CT)
4,63
7
Am
laba
d (C
T)4,
636
Ala
gdih
a (C
T)4,
609
Bhan
dra
(CT)
4,60
6
Dan
guw
apas
i (CT
)4,
606
Sans
ikha
ra (C
T)4,
570

Handbook of Urban Statistics
242
Tow
n N
ame
Popu
latio
nJh
ingh
ipah
ari (
CT)
4,55
0
Tenu
(CT
)4,
533
Bish
ram
pur
(CT)
4,48
7
Hes
la (C
T)4,
451
Nan
dkha
rki (
CT)
4,42
7
Sijh
ua (C
T)4,
376
Mad
huba
n (
CT)
4,31
6
Bard
ubhi
(CT)
4,18
5
Burs
era
(CT)
4,07
0
Balk
undr
a (C
T)3,
915
Baro
ra (C
T)3,
890
Lalp
ania
(CT)
3,65
9
Odi
sha
Bhub
anes
war
Tow
n (M
Cor
p.)
840,
834
Cutt
ack
(M C
orp.
)61
0,18
9
Brah
map
ur (M
Cor
p.)
356,
598
Raur
kela
Tow
n (M
)27
2,72
1
Puri
(M)
200,
564
Sam
balp
ur T
own
(M)
184,
000
Bale
shw
ar T
own
(M)
118,
162
Bari
pada
Tow
n (M
)10
9,74
3
Bhad
rak
(M)
107,
463
Jhar
sugu
da (M
)97
,730
Jeyp
ur (M
)84
,830
Barg
arh
(M)
80,6
25
Braj
araj
naga
r (M
)80
403
Raya
gada
(M)
71,2
08
Bhaw
anip
atna
(M)
69,0
45
Para
dip
(M)
68,5
85
Tow
n N
ame
Popu
latio
nD
henk
anal
(M)
67,4
14
Barb
il (M
)66
,540
Kend
ujha
r (M
)60
,590
Jata
ni T
own
(M)
55,9
25
Raja
gang
apur
(M)
51,3
62
Byas
anag
ar T
own
(M)
48,9
11
Kend
rapa
ra (M
)47
,006
Joda
(M )
46,6
31
Khor
dha
(M)
46,2
05
Sund
arga
rh (M
)45
,036
Para
lkhe
mun
di (M
)44
,469
Anu
gul (
M)
43,7
95
Chou
dwar
(M)
42,7
84
Talc
her
(M)
40,8
41
Ana
ndpu
r (M
)39
,585
Belp
ahar
(M)
38,9
93
Jaja
pur
(M)
37,4
58
Phul
aban
i (M
)37
,371
Jaga
tsin
ghap
ur (M
)33
,631
Bira
mitr
apur
(M)
33,4
42
Nab
aran
gapu
r (M
)29
,960
Deb
agar
h (M
)22
,390
Sona
pur
(M)
20,7
70
Bala
ngir
(M)
98,2
38
Suna
beda
(NAC
)50
,394
Kora
put (
NAC
)47
,468
Burl
a To
wn
(NAC
)42
,638
Patt
amun
dai (
NA
C)36
,528
Basu
debp
ur (N
AC)
33,6
90

Annexure-1: Directory of Urban Centers in the Country with Population (2011)
243
Tow
n N
ame
Popu
latio
nRe
mun
a To
wn
(NAC
)33
,378
Soro
(NAC
)32
,531
Titla
garh
Tow
n (N
AC)
31,2
58
Mal
kang
iri (
NAC
)31
,007
Hira
kud
Tow
n (N
AC)
30,2
07
Um
arko
te (N
AC)
28,9
93
Jale
shw
ar (N
AC)
25,7
47
Raira
ngap
ur (N
AC)
25,5
16
Hin
jilic
ut (N
AC)
24,6
71
Gun
upur
Tow
n (N
AC)
24,1
62
Pola
sara
(NAC
)23
,119
Dha
man
agar
(NAC
)22
,920
Kara
njia
(NAC
)22
,865
Bhub
an (N
AC)
22,2
00
Chha
trap
ur (N
AC)
22,0
27
Kant
aban
ji (N
AC)
21,8
19
Asi
ka (N
AC)
21,4
28
Patn
agar
h (N
AC)
21,0
24
Bara
pali
(NAC
)20
,850
Bhan
jana
gar
(NAC
)20
,482
Baud
hgar
h (N
AC)
20,4
24
Juna
garh
(NAC
)19
,656
Nim
apad
a (N
AC)
19,2
89
Kesi
nga
(NAC
)19
,239
Khar
iar
Road
(NAC
)18
,967
Balu
gaon
(NAC
)17
,645
Padm
apur
(NAC
)17
,625
Pipi
li (N
AC)
17,6
23
Bank
i (N
AC)
17,5
21
Tow
n N
ame
Popu
latio
nKa
bisu
rjya
naga
r (N
AC)
17,4
30
Atha
gad
(NAC
)17
,304
Bana
pur
(NAC
)17
,278
Nila
giri
(NAC
)17
,264
Nay
agar
h (N
AC)
17,0
30
Kam
aksh
yana
gar
(NAC
)16
,810
Kona
rk (N
AC)
16,7
79
Kotp
ad (N
AC)
16,3
26
Bini
ka (N
AC)
15,7
65
Koch
inda
(NAC
)15
,576
Redh
akho
l (N
AC)
15,3
79
Puru
sott
ampu
r (N
AC)
15,3
66
Bugu
da (N
AC)
15,1
76
Khar
iar
(NAC
)15
,087
Sura
da (N
AC)
14,8
67
Koda
la (N
AC)
13,9
65
Dig
apah
andi
(NA
C)13
,190
Uda
la (N
AC)
13,1
52
Khal
ikot
e (N
AC)
13,0
22
Athm
allik
(NAC
)12
,298
Ram
bha
(NAC
)12
,111
Balim
ela
(NAC
)11
,796
Gan
jam
(NAC
)11
,747
Chik
iti (N
AC)
11,6
45
G. U
daya
giri
(NAC
)11
,302
Bella
gunt
ha (N
AC)
11,2
97
Kash
inag
ar (N
AC)
9,68
4
Khan
dapa
da (N
AC)
9,03
8
Tarb
ha (N
AC)
8,33
4

Handbook of Urban Statistics
244
Tow
n N
ame
Popu
latio
nG
opal
pur
(NA
C)7,
221
Gud
ari (
NAC
)6,
931
Raur
kela
Indu
stri
al T
owns
hip
(IT)
210,
317
O.C
.L. (
ITS)
2,39
7
Nal
co (C
T)19
,644
Chan
dili
(CT)
18,5
52
Balig
uda
(CT)
16
,611
Loch
apad
a (C
T)
16,3
77
Jald
a To
wn
(CT)
15,7
89
Der
a Co
llier
y To
wns
hip
(CT)
15,7
87
Gha
ntap
ada
(CT)
15,1
69
Prat
apsa
san
(CT)
12,8
30
Bala
goda
(Bol
ani)
(CT)
11,7
08
Reng
ali (
CT)
10
,867
Brah
mab
arad
a (C
T)
10,7
21
Bhab
inip
ur (C
T)
10,4
11
Cham
pua
(CT)
10,3
94
Itam
ati (C
T)
10,3
17
Rana
purg
ada
(CT)
10
001
Panp
osh
(CT)
9,92
3
Bori
gum
a (C
T)
9,78
5
Band
hbah
al (C
T)
9,73
5
Papa
daha
ndi (
CT)
9,39
0
Kanti
lo (C
T)9,
181
Kuan
rmun
da (C
T)
9,04
3
Krus
hnan
anda
pur
(CT)
8,
974
Hati
band
ha (C
T)8,
938
Dam
anjo
di (C
T)8,
862
Saya
dpur
(CT)
8,
798
Tow
n N
ame
Popu
latio
nKu
rum
uli (
CT)
8,50
4
Bish
amak
atak
(CT)
8,39
9
Tika
rpad
a (C
T)
8,34
6
Sura
la (C
T)
8,25
8
Nua
patn
a (C
T)8,
057
Arj
yapa
lli (C
T)
8,00
1
Suva
ni (C
T)
7,99
3
Mad
anpu
r Ra
mpu
r (C
T)
7,89
2
Erei
Tow
n (C
T)7,
890
Jaja
nga
(CT)
7,
482
Got
amar
a (C
T)
7,42
0
Lath
ikat
a (C
T)7,
405
Kuku
dakh
andi
(CT)
7,
361
Bhak
arsa
hi (C
T)
7,11
0
Bana
igar
h (C
T)
7,08
0
Lals
ingi
(CT)
7,
078
Dar
ingb
adi (
CT)
6,99
5
Bada
gada
(CT)
6,
982
Bije
pur
(CT)
6,
922
Sohe
la (C
T)
6,91
7
Kunj
aban
garh
(CT)
6,90
6
Balip
atap
ur (C
T)
6,89
8
Khal
iapa
li (C
T)6,
865
Koid
a (C
T)
6,76
3
Chitr
akon
da (C
T)
6,72
5
Kand
asar
(CT)
(Par
t)
6,66
8
Sher
agad
a (C
T)
6,65
3
Anj
ira (C
T)
6,56
1
Bhap
ur (C
T)
6,43
8

Annexure-1: Directory of Urban Centers in the Country with Population (2011)
245
Tow
n N
ame
Popu
latio
nSa
rang
a (C
T)
6,42
6
Aga
stinu
agan
(CT)
6,
411
Khati
guda
(CT)
6,36
1
Reng
ali D
ampr
ojec
t Tow
nshi
p (C
T)6,
345
Raja
suna
khal
a (C
T)
6,29
9
Bada
mba
(Niz
igar
h) (C
T)
6,28
4
Dun
gam
al (C
T)6,
271
Gol
aban
dha
(CT)
6,
232
Lois
inga
(CT)
6,
220
Muk
higu
da (C
T)6,
155
Budh
apan
ka (C
T)
6,12
9
Path
ar (C
T)
6,07
2
Jhum
pura
(CT)
6,06
4
Patr
apur
(CT)
6,
059
God
iput
amati
apar
a (C
T)
5,96
7
Raig
har
(CT)
5,
936
Nua
hata
(CT)
5,
920
Bang
omun
da (C
T)
5,75
9
Pala
laha
da (C
T)
5,74
9
Kulla
da (C
T)
5,64
5
Maj
hiha
ra (C
T)
5,59
8
Chan
dapu
r (C
T)5,
565
Bela
gach
hia
(CT)
5,51
6
Kala
rang
iata
(CT)
5,
505
Bard
ol (C
T)
5,44
1
Badm
al (C
T)
5,43
1
Oda
gaon
(CT)
5,
401
Moh
ana
(CT)
5,
197
Bada
koda
nda
(CT)
5,
137
Tow
n N
ame
Popu
latio
nJa
ship
ur (C
T)
5,10
1
Suba
laya
(CT)
5,
072
Kalia
pani
(CT)
5,
028
Palu
rgad
a (C
T)
5,01
9
Dad
hapa
tna
(CT)
5,00
5
Mak
unda
pur
(CT)
4,98
3
Bhat
li (C
T)
4,86
5
Bori
gam
(CT)
4,
855
R. U
daya
giri
(CT)
4,
851
Tush
ura
(CT)
4,
823
Para
dipg
arh
(CT)
4,
790
Bira
prat
appu
r (C
T)
4,70
8
Raya
gada
(CT)
4,
662
Kaly
anas
ingp
ur (C
T)
4,66
0
Indi
pur
(CT)
4,
656
Kanh
eipu
r (C
T)
4,61
1
Ram
garh
(CT)
4,
545
Kaip
adar
(CT)
4,
512
Tang
i (CT
)
4,47
1
Tens
a (C
T)4,
469
Pita
la (C
T)
4,45
8
Jora
da (B
ada)
(CT)
4,
428
Venk
atra
ipur
(CT)
4,
401
Bund
ia (C
T)
4,30
4
Kula
d (C
T) (P
art)
4,
256
Mun
dam
arai
(CT)
4,
253
Dan
ara
(CT)
4,
144
Kaba
taba
ndha
(CT)
4,
080
Dai
tari
(CT)
4,06
5

Handbook of Urban Statistics
246
Tow
n N
ame
Popu
latio
nCh
arib
atia
(CT)
4,01
6
T.T.P
.S. T
owns
hip
(CT)
3,61
3
Tipo
(CT)
2,
981
F.C.
I. To
wns
hip
(CT)
1,35
9
Chha
ttisg
arh
Raip
ur (M
Cor
p.)
1,01
0,43
3
Bhila
i Nag
ar (M
Cor
p.)
625,
700
Korb
a (M
Cor
p.)
363,
390
Bila
spur
(M C
orp.
)33
1,03
0
Dur
g (M
Cor
p.)
268,
806
Rajn
andg
aon
(M C
orp.
)16
3,11
4
Raig
arh
(M C
orp.
)13
7,12
6
Jagd
alpu
r (M
Cor
p.)
125,
463
Am
bika
pur
(M C
orp.
)11
2,44
9
Chir
mir
i (M
Cor
p.)
85,3
17
Bhila
i Cha
roda
(M)
98,0
08
Birg
aon
(M)
96,2
94
Dha
mta
ri (M
)89
,860
Bhat
apar
a (M
)57
,537
Mah
asam
und
(M)
53,7
83
Cham
pa (M
)45
,256
Dal
li-Ra
jhar
a (M
)44
,363
Kaw
ardh
a (M
)44
,205
Nai
la-J
anjg
ir (M
)40
,561
Don
garg
arh
(M)
37,3
72
Kum
hari
(M)
35,0
44
Man
endr
agar
h (M
)33
,071
Tild
a N
ewra
(M)
32,3
31
Mun
geli
(M)
31,2
50
Tow
n N
ame
Popu
latio
nKo
ndag
aon
(M)
30,9
21
Gob
ra N
awap
ara
(M)
29,3
15
Bem
etar
a (M
)28
,536
Baik
unth
pur
(M)
28,4
31
Kank
er (M
)27
,541
Dip
ka (M
)27
,158
Balo
da B
azar
(M)
26,6
32
Jam
ul (M
)25
,878
Jash
pur
Nag
ar (M
)25
,422
Balo
d (M
)23
,648
Shiv
pur
Char
cha
(M)
23,5
14
Aka
ltara
(M)
22,7
12
Khai
raga
rh (M
)22
,564
Sakti
(M)
21,9
55
Bade
Bac
heli
(M)
21,4
35
Sura
jpur
(M)
20,1
89
Khar
sia
(M)
18,9
39
Tifr
a (N
P)30
,465
Rata
npur
(NP)
24,6
36
Katg
hora
(NP)
22,6
90
Nar
ayan
pur
(NP)
22,1
06
Ahi
war
a (N
P)20
,384
Sara
ipal
i (N
P)20
,043
Takh
atpu
r (N
P)19
,968
Bagb
ahar
a (N
P)19
,529
Ara
ng (
NP)
19,0
91
Kira
ndul
(M)
18,8
87
Sirg
itti (N
P)18
,428
Kota
(NP)
18,4
05

Annexure-1: Directory of Urban Centers in the Country with Population (2011)
247
Tow
n N
ame
Popu
latio
nG
aure
lla (N
P)18
,165
Bodr
i (N
P)17
,481
Khon
gapa
ni (N
P)17
,400
Path
alga
on (N
P)16
,613
Pand
ariy
a (N
P)16
,165
Bija
pur
(NP)
16,1
29
Sim
ga (N
P)16
,027
Lorm
i (N
P)15
,156
Sara
ngar
h (N
P)14
,954
Don
garg
aon
(NP)
14,6
93
Abh
anpu
r (N
P)14
,432
Dha
ram
jaig
arh
(NP)
14,3
54
Pend
ra (N
P)14
,120
Rajim
(NP)
14,0
90
Kasd
ol (N
P)14
,071
Sukm
a (N
P)13
,926
Kuru
d (N
P)13
,783
Dan
tew
ada
(NP)
13,6
33
Balo
da (N
P)13
,630
Nag
ari (
NP)
13,3
08
Gan
dai (
NP)
13,2
78
Kiro
dim
alna
gar
(NP)
13,1
02
Saka
ri (N
P)12
,861
Man
a-Ca
mp
(NP)
11,9
53
Ram
anuj
ganj
(NP)
11,8
93
Bish
ram
pur
(NP)
11,3
67
Bhat
gaon
(NP)
11,2
04
Kesk
al (N
P)11
,115
Bilh
a (N
P)11
,048
Tow
n N
ame
Popu
latio
nN
awag
arh
(NP)
10,5
41
Gar
iyab
and
(NP)
10,5
17
Bagi
cha
(NP)
10,4
27
Bhat
gaon
(NP)
10,3
71
Basn
a (N
P)10
,345
Pakh
anju
r (N
P)10
,201
Khar
od (N
P)10
,193
Pata
n (N
P)10
,133
Bast
ar (N
P)10
,048
Dha
mdh
a (N
P)9,
961
Am
baga
rh C
how
ki (N
P)9,
889
Fing
eshw
ar (N
P)9,
752
Char
ama
(NP)
9,70
7
Shiv
rina
raya
n (N
P)9,
707
Visr
ampu
ree
(NP)
9,64
1
Gha
rgho
da (N
P)9,
455
Sita
pur
(NP)
9,36
1
Khar
ora
(NP)
9,23
6
Bhai
ram
garh
(NP)
9,02
6
Law
an (N
P)8,
984
Koor
a (N
P)8,
857
Nay
a Ba
radw
ar (N
P)8,
793
Uta
i (N
P)8,
752
Gun
derd
ehi (
NP)
8,61
4
Pala
ri (N
P)8,
567
Mal
har
(NP)
8,50
5
Pith
ora
(NP)
8,42
8
Than
-Kha
mha
ria
(NP)
8,37
3
Chhu
rika
la (N
P)8,
239

Handbook of Urban Statistics
248
Tow
n N
ame
Popu
latio
nTu
ndra
(NP)
8,21
1
Lailu
nga
(NP)
8,20
8
Bhan
upra
tapp
ur (N
P)8,
125
Naw
agar
h (N
P)8,
118
Dou
ndi (
NP)
8,04
2
Jaije
pur
(NP)
7,94
6
Dab
hra
(NP)
7,85
4
Chan
drap
ur (N
P)7,
688
Jhag
rakh
and
(NP)
7,68
0
Bhak
hara
(NP)
7,54
7
Sarg
aon
(NP)
7,48
4
Kusm
i (N
P)7,
448
Gee
dam
(NP)
7,44
0
Tum
gaon
(NP)
7,39
4
Adb
har
(NP)
7,27
2
Dor
napa
l (N
P)7,
238
Jarh
i (N
P)7,
228
Sara
gaon
(NP)
7,21
6
Chhu
ikha
dan
(NP)
7,09
3
Kont
a (N
P)7,
038
Saha
spur
-Loh
ara
(NP)
7,01
7
Pand
atar
ai (N
P)7,
008
Sari
ya (N
P)6,
927
Kotb
a (N
P)6,
805
Ant
agar
h (N
P)6,
777
Bars
ur (N
P)6,
636
Aam
adi (
NP)
6,60
0
Mar
o (N
P)6,
596
Dev
kar
(NP)
6,35
8
Tow
n N
ame
Popu
latio
nPa
thar
iya
(NP)
6,34
9
Fara
sgao
n (N
P)6,
306
Mag
arlo
d (N
P)6,
280
Lakh
anpu
r (N
P)6,
270
Chik
hala
kasa
(NP)
6,16
0
Raha
ud (N
P)6,
160
Chhu
ra (N
P)6,
095
Wad
rafn
agar
(NP)
6,04
8
Dau
ndi L
ohar
a (N
P)6,
045
Bodl
a (N
P)5,
689
Prat
appu
r (N
P)5,
635
Bara
mke
la (N
P)5,
600
Bila
igar
h (N
P)5,
544
Pali
(NP)
5,51
4
Nai
-Led
ri (N
P)5,
334
Saja
(NP)
5,25
7
Berl
a (N
P)5,
165
Prem
naga
r (N
P)4,
954
Pipa
riya
(NP)
4,85
9
Arj
unda
(NP)
4,85
1
Rajp
ur (N
P)4,
838
Pusa
ur (N
P)4,
744
Chhu
riya
(NP)
4,50
9
Nar
harp
ur (N
P)4,
509
Balra
mpu
r (N
P)4,
456
Bhop
alpa
ttan
am (N
P)4,
445
Gur
ur (N
P)3,
775
Parp
ondi
(NP)
3,74
1
Ling
iyad
ih (C
T)22
,209

Annexure-1: Directory of Urban Centers in the Country with Population (2011)
249
Tow
n N
ame
Popu
latio
nD
eori
(CT)
17,2
65
Kunk
uri (
CT)
13,8
46
Man
dir
Has
aud
(CT)
12,8
07
Rajg
amar
(CT)
11,5
44
Silta
ra (C
T)10
,721
Meh
man
d (C
T)8,
231
Koni
(CT)
7,06
5
Shiv
nand
anpu
r A
lias
Om
karb
ahar
a (C
T)6,
567
Dur
ena
(CT)
5,89
2
Hir
mi (
CT)
5,13
9
Raw
an (C
T)5,
100
Katk
ona
(CT)
4,55
2
Gov
indp
ur (C
T)4,
392
Mad
hya
Prad
esh
Indo
re (M
Cor
p.)
1,96
4,08
6
Bhop
al (M
Cor
p.)
1,79
8,21
8
Jaba
lpur
(M C
orp.
)1,
055,
525
Gw
alio
r (M
Cor
p.)
1,05
4,42
0
Ujja
in (M
Cor
p.)
515,
215
Dew
as (M
Cor
p.)
289,
550
Satn
a (M
Cor
p.)
280,
222
Saga
r (M
Cor
p.)
273,
296
Ratla
m (M
Cor
p.)
264,
914
Rew
a (M
Cor
p.)
235,
654
Mur
war
a (K
atni
) (M
Cor
p.)
221,
883
Sing
raul
i (M
Cor
p.)
220,
257
Burh
anpu
r (M
Cor
p.)
210,
886
Khan
dwa
(M C
orp.
)20
0,73
8
Mor
ena
(M)
200,
482
Tow
n N
ame
Popu
latio
nBh
ind
(M)
197,
585
Gun
a (M
)18
0,93
5
Shiv
puri
(M)
179,
977
Vidi
sha
(M)
155,
951
Man
dsau
r (M
)14
1,66
7
Chhi
ndw
ara
(M)
138,
291
Chha
tarp
ur (M
)13
3,46
4
Nee
muc
h (M
)12
8,09
5
Pith
ampu
r (M
)12
6,20
0
Dam
oh (M
)12
5,10
1
Hos
hang
abad
(M)
117,
988
Seho
re (M
)10
8,90
9
Khar
gone
(M)
106,
454
Betu
l (M
)10
3,33
0
Seon
i (M
)10
2,34
3
Dati
a (M
)10
0,28
4
Nag
da (M
)10
0,03
9
Itar
si (M
)99
,329
Dha
r (M
)93
,917
Kola
r (M
)87
,882
Shah
dol (
M)
86,6
81
Sarn
i (M
)86
,141
Bala
ghat
(M)
84,2
61
Ash
okna
gar
(M)
81,8
28
Tika
mga
rh (M
)79
,106
Jaor
a (M
)72
,847
Baso
da (M
)71
,353
Shaj
apur
(M)
69,2
63
Sheo
pur
(M)
68,8
20

Handbook of Urban Statistics
250
Tow
n N
ame
Popu
latio
nH
arda
(M)
68,1
62
Bina
-Eta
wa
(M)
64,5
29
Ragh
ogar
h -V
ijayp
ur (M
)62
,163
Dab
ra (M
)61
,277
Man
dide
ep (M
)59
,654
Goh
ad (M
)58
,939
Nar
sim
hapu
r (M
)58
,665
Send
hwa
(M)
56,4
85
Barw
ani (
M)
55,5
04
Sidh
i (M
)54
,331
Siro
nj (M
)52
,460
Ash
ta (M
)51
,824
Shuj
alpu
r (M
)51
,225
Khur
ai (M
)51
,108
Pann
a (M
)50
,820
Man
dla
(M)
49,4
63
Pipa
riya
(M)
48,8
26
Biao
ra (M
)47
,663
Am
bah
(M)
47,1
77
Pand
hurn
a (M
)45
,479
Gad
arw
ara
(M)
45,3
44
Dha
npur
i (N
arga
da H
ari D
afai
) (M
)45
,156
Rais
en (M
)44
,162
Siho
ra (M
)44
,048
Now
gong
(M)
40,5
80
Saba
lgar
h (M
)40
,333
Mai
har
(M)
40,1
92
Pors
a (M
)39
,669
Don
gar
Para
sia
(M)
39,3
74
Tow
n N
ame
Popu
latio
nSa
naw
ad (M
)38
,740
Aga
r (M
)37
,917
Sara
ngpu
r (M
)37
,435
Jhab
ua (M
)35
,753
Khac
haro
d (M
)34
,191
Mal
ajkh
and
(M)
34,1
76
Bega
mga
nj (M
)34
,031
Um
aria
(M)
33,1
14
Chan
deri
(M)
33,0
81
Biju
ri (M
)32
,682
Hatt
a (M
)32
,465
Badn
agar
(M)
32,4
18
Nar
sing
hgar
h (M
)32
329
Mah
idpu
r (M
)31
,650
Bera
sia
(M)
30,9
51
Gar
hako
ta (M
)30
,796
Man
awar
(M)
30,3
93
Rehl
i (M
)30
,329
Am
la (M
)30
,215
Seon
i-Mal
wa
(M)
30,1
00
Mul
tai (
M)
29,9
76
Kare
li (M
)29
,929
Kotm
a (M
)29
,704
Nep
anag
ar (M
)29
,682
Alir
ajpu
r (M
)28
,498
Pasa
n (M
)28
,447
Pana
gar
(M)
27,9
32
Saus
ar (M
)27
,459
Barw
aha
(M)
26,4
59

Annexure-1: Directory of Urban Centers in the Country with Population (2011)
251
Tow
n N
ame
Popu
latio
nD
eori
(M)
25,6
32
War
aseo
ni (M
)25
,103
Dam
ua (M
)24
,663
Nai
npur
(M)
22,6
07
Jam
ai (M
)22
,583
Anu
ppur
(M)
19,8
99
Am
arw
ara
(M)
14,1
41
Chau
rai K
has
(M)
12,9
56
Jour
a (N
P)42
,153
Rau
(NP)
36,0
55
Laha
r (N
P)35
,674
Bam
or (N
P)32
,838
Dha
mno
d (N
P)32
,093
Bara
ily (N
P)31
,579
Raha
tgar
h (N
P)31
,537
Band
a (N
P)30
,923
Mho
wga
on (N
P)30
,012
Rajg
arh
(NP)
29,7
26
Kare
ra (N
P)28
,705
Kuks
hi (N
P)28
,331
Aro
n (N
P)28
,010
Pach
ore
(NP)
27,3
96
Got
egao
n (N
P)27
,068
Prith
vipu
r (N
P)26
,883
Man
asa
(NP)
26,5
51
Mau
ganj
(NP)
26,4
20
Anj
ad (N
P)26
,289
Kaila
ras
(NP)
25,9
20
Khat
egao
n (N
P)25
,413
Tow
n N
ame
Popu
latio
nBh
ande
r (N
P)25
,204
Soha
gpur
(NP)
25,0
40
Tara
na (N
P)24
,908
Sham
garh
(NP)
24,6
37
Beoh
ari (
NP)
24,5
45
Khaj
urah
o (N
P)24
,481
Mah
eshw
ar (N
P)24
,411
Alo
t (N
P)24
,115
Nas
rulla
ganj
(NP)
23,7
88
Niw
ari (
NP)
23,7
24
Mah
araj
pur
(NP)
23,3
28
Chitr
akoo
t (N
P)23
,316
Seon
dha
(NP)
23,1
40
Inde
rgar
h (N
P)23
,045
Obe
dulla
ganj
(NP)
22,8
45
Kasr
awad
(NP)
22,7
50
Khir
kiya
(NP)
22,7
37
Nag
od (N
P)22
,568
Tim
arni
(NP)
22,3
59
Pali
(NP)
22,3
24
Chha
nera
(NP)
22,0
52
Laun
di (N
P)22
,002
Now
roza
bad
(Kho
darg
ama)
(NP)
21,8
83
Chac
haur
a-Bi
naga
nj (N
P)21
,860
Jirap
ur (N
P)21
,724
Meh
gaon
(NP)
21,3
35
Din
dori
(NP)
21,3
23
Path
aria
(NP)
21,0
26
Bhan
pura
(NP)
2101
3

Handbook of Urban Statistics
252
Tow
n N
ame
Popu
latio
nRa
jpur
(NP)
20,9
47
Badn
awar
(NP)
20,9
17
Gor
mi (
NP)
20,8
41
Mun
gaol
i (N
P)20
,689
Rajg
arh
(NP)
20,6
68
Bija
war
(NP)
20,5
13
Mau
(NP)
20,1
47
Mak
si (N
P)20
,088
Kola
ras
(NP)
19,7
81
Shah
pur
(NP)
19,7
19
Kum
bhra
j (N
P)19
,707
Badi
(NP)
19,6
03
Am
arpa
tan
(NP)
19,4
09
Nar
war
(NP)
19,3
85
Kym
ore
(NP)
19,3
43
Burh
ar (N
P)19
,289
Bhita
rwar
(NP)
19,0
96
Kata
ngi (
NP)
19,0
40
Khilc
hipu
r (N
P)18
,928
Late
ri (N
P)18
,844
Silw
ani (
NP)
18,6
23
Har
palp
ur (N
P)18
,529
Unc
haha
ra (N
P)18
,442
Bado
da (N
P)18
,437
Ram
pura
(NP)
18,3
64
Bada
Mal
hera
(NP)
18,3
35
Uda
ipur
a (N
P)18
,236
Gai
ratg
anj (
NP)
18,1
84
Pich
hore
(NP)
18,1
27
Tow
n N
ame
Popu
latio
nD
aboh
(NP)
18,0
97
Kann
od (N
P)17
,744
Jata
ra (N
P)17
,499
Pale
ra (N
P)17
,493
Dep
alpu
r (N
P)17
,474
Hat
pipl
ya (N
P)17
,419
Lakh
nado
n (N
P)17
,302
Jaw
ad (N
P)17
,129
Teon
thar
(NP)
17,0
39
Vija
ypur
(NP)
16,9
64
Mih
ona
(NP)
16,9
35
Budn
i (N
P)16
,808
Han
uman
a (N
P)16
,771
Baba
i (N
P)16
,741
Nal
khed
a (N
P)16
,690
Aja
igar
h (N
P)16
,656
Baih
ar (N
P)16
,650
Sonk
atch
(NP)
16,5
45
Chan
dam
eta
-But
aria
(NP)
16,4
97
Susn
er (N
P)16
,432
Dha
ram
puri
(NP)
16,3
63
Shah
garh
(NP)
16,3
00
Bhik
anga
on (N
P)16
,217
Saw
er (N
P)16
,150
Kata
ngi (
NP)
16,1
46
Hin
dori
a (N
P)16
,001
Betm
a (N
P)15
,999
Chan
dia
(NP)
15,8
91
Khan
iyad
hana
(NP)
15,8
77

Annexure-1: Directory of Urban Centers in the Country with Population (2011)
253
Tow
n N
ame
Popu
latio
nTh
andl
a (N
P)15
,756
Kheti
a (N
P)15
,744
Kurw
ai (N
P)15
,487
Ichh
awar
(NP)
15,2
21
Petla
wad
(NP)
15,1
74
Gar
oth
(NP)
15,1
22
Pipl
ya M
andi
(NP)
15,0
70
Chur
hat (
NP)
14,9
62
Tal (
NP)
14,9
13
Khar
gapu
r (N
P)14
,813
Soya
tkal
an (N
P)14
,781
Unh
el (N
P)14
,774
Pata
n (N
P)14
,624
Gur
h (N
P)14
,608
Runj
i-Gau
tam
pura
(NP)
14,5
84
Paw
ai (N
P)14
,465
Tend
ukhe
da (N
P)14
,399
Birs
ingh
pur
(NP)
14,3
39
Rajn
agar
(NP)
14,2
53
Satw
as (N
P)14
,108
Sita
mau
(NP)
14,0
56
Barh
i (N
P)13
,946
Am
anga
nj (N
P)13
,886
Bado
d (N
P)13
,834
Man
gaw
an (N
P)13
,700
Pand
hana
(NP)
13,6
94
Shah
pur
(NP)
13,6
68
Ram
pur
Bagh
elan
(NP)
13,6
38
Gar
hi -
Mal
hera
(NP)
13,6
25
Tow
n N
ame
Popu
latio
nSh
ahpu
ra (N
P)13
,601
Bada
rwas
(NP)
13,5
71
Lanj
i (N
P)13
,558
Sem
aria
(NP)
13,4
46
Suw
asar
a (N
P)13
,304
Ghu
war
a (N
P)13
,301
Maj
holi
(NP)
13,2
10
Tend
ukhe
da (N
P)13
,077
Lidh
ora
Khas
(NP)
12,9
74
Bila
ua (N
P)12
,893
Mun
di (N
P)12
,889
Chan
dla
(NP)
12,8
38
Dev
endr
anag
ar (N
P)12
,785
Phup
hkal
an (N
P)12
,657
Bare
la (N
P)12
,620
Isag
arh
(NP)
12,5
83
Ako
da (N
P)12
,534
Pich
hore
(NP)
12,4
25
Rana
pur
(NP)
12,3
71
Man
dles
hwar
(NP)
12,3
43
Pola
ykal
an (N
P)12
,268
Bhau
rasa
(NP)
12,1
66
Pans
emal
(NP)
12,1
66
Barg
hat (
NP)
12,1
00
Saila
na (N
P)11
,989
Joba
t (N
P)11
,976
Bhai
nsde
hi (N
P)11
,961
Kukd
eshw
ar (N
P)11
,956
Ram
pur
Nai
kin
(NP)
11,9
36
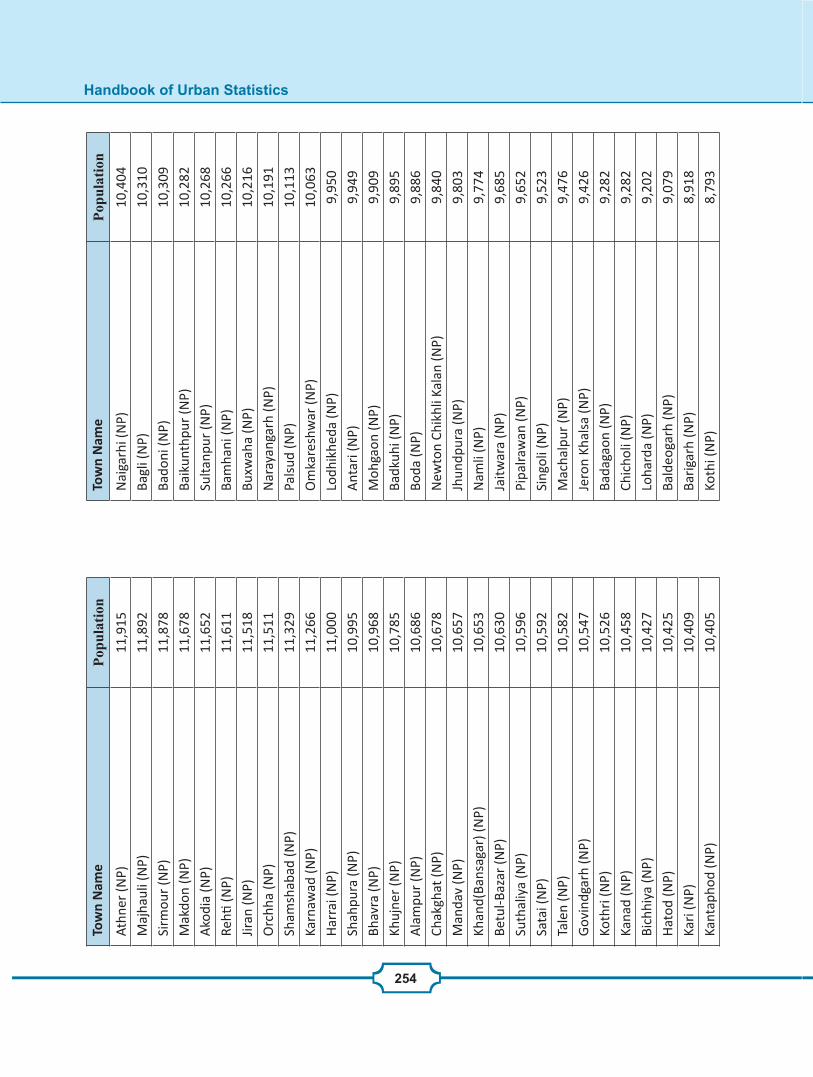
Handbook of Urban Statistics
254
Tow
n N
ame
Popu
latio
nAt
hner
(NP)
11,9
15
Maj
haul
i (N
P)11
,892
Sirm
our
(NP)
11,8
78
Mak
don
(NP)
11,6
78
Ako
dia
(NP)
11,6
52
Rehti
(NP)
11,6
11
Jiran
(NP)
11,5
18
Orc
hha
(NP)
11,5
11
Sham
shab
ad (N
P)11
,329
Karn
awad
(NP)
11,2
66
Har
rai (
NP)
11,0
00
Shah
pura
(NP)
10,9
95
Bhav
ra (N
P)10
,968
Khuj
ner
(NP)
10,7
85
Ala
mpu
r (N
P)10
,686
Chak
ghat
(NP)
10,6
78
Man
dav
(NP)
10,6
57
Khan
d(Ba
nsag
ar) (
NP)
10,6
53
Betu
l-Baz
ar (N
P)10
,630
Suth
aliy
a (N
P)10
,596
Sata
i (N
P)10
,592
Tale
n (N
P)10
,582
Gov
indg
arh
(NP)
10,5
47
Koth
ri (N
P)10
,526
Kana
d (N
P)10
,458
Bich
hiya
(NP)
10,4
27
Hat
od (N
P)10
,425
Kari
(NP)
10,4
09
Kant
apho
d (N
P)10
,405
Tow
n N
ame
Popu
latio
nN
aiga
rhi (
NP)
10,4
04
Bagl
i (N
P)10
,310
Bado
ni (N
P)10
,309
Baik
unth
pur
(NP)
10,2
82
Sulta
npur
(NP)
10,2
68
Bam
hani
(NP)
10,2
66
Buxw
aha
(NP)
10,2
16
Nar
ayan
garh
(NP)
10,1
91
Pals
ud (N
P)10
,113
Om
kare
shw
ar (N
P)10
,063
Lodh
ikhe
da (N
P)9,
950
Ant
ari (
NP)
9,94
9
Moh
gaon
(NP)
9,90
9
Badk
uhi (
NP)
9,89
5
Boda
(NP)
9,88
6
New
ton
Chik
hli K
alan
(NP)
9,84
0
Jhun
dpur
a (N
P)9,
803
Nam
li (N
P)9,
774
Jaitw
ara
(NP)
9,68
5
Pipa
lraw
an (N
P)9,
652
Sing
oli (
NP)
9,52
3
Mac
halp
ur (N
P)9,
476
Jero
n Kh
alsa
(NP)
9,42
6
Bada
gaon
(NP)
9,28
2
Chic
holi
(NP)
9,28
2
Loha
rda
(NP)
9,20
2
Bald
eoga
rh (N
P)9,
079
Bari
garh
(NP)
8,91
8
Koth
i (N
P)8,
793

Annexure-1: Directory of Urban Centers in the Country with Population (2011)
255
Tow
n N
ame
Popu
latio
nBa
daw
ada
(NP)
8,70
0
Pipl
anar
ayan
war
(NP)
8,59
5
Dah
i (N
P)8,
509
Chha
pihe
da (N
P)8,
501
Kaka
rhati
(NP)
8,45
2
Am
arka
ntak
(NP)
8,41
6
Sanc
hi (N
P)8,
401
Jaith
ari (
NP)
8,39
6
Vija
yrag
havg
arh
(NP)
8,37
1
Dha
mno
d (N
P)8,
341
Mal
harg
arh
(NP)
8,33
2
Pipl
oda
(NP)
8,29
4
Niw
as (N
P)8,
248
Jais
ingh
naga
r (N
P)8,
233
Jaw
ar (N
P)8,
206
Rata
ngar
h (N
P)7,
994
Tonk
Khu
rd (N
P)7,
979
Dik
en (N
P)7,
951
Tari
char
Kal
an (N
P)7,
674
Man
pur
(NP)
7,62
1
Kota
r (N
P)7,
520
Sard
arpu
r (N
P)7,
293
Bada
gaon
(NP)
7,21
7
Nag
ri (N
P)7,
034
Bhed
agha
t (N
P)6,
657
Mho
w C
antt
(CB)
81,7
02
Jaba
lpur
Can
tt. (
CB)
72,2
61
Mor
ar C
antt
. (CB
)48
,464
Saga
r Ca
ntt (C
B)40
,513
Tow
n N
ame
Popu
latio
nPa
chm
arhi
Can
tt (C
B)12
,062
Bang
arda
Chh
ota
(CT)
64,2
13
Jaur
a Kh
urd
(CT)
32,0
87
Am
lai (
CT)
30,3
54
Raja
khed
i (CT
)24
,232
Mak
roni
a Bu
zurg
(CT)
23,8
61
Bang
awan
(CT)
20,8
73
Dab
ra (C
T)20
,629
Pald
a (C
T)18
,697
Bank
(CT)
18,5
34
Bang
arda
Bad
a (C
T)15
,761
Dun
gari
ya C
hhap
ara
(CT)
15,3
71
Loni
a Ka
rbal
(CT)
14,9
89
Suha
gi (C
T)14
,787
Satla
pur
(CT)
14,7
55
Karm
eta
(CT)
14,4
52
Bilp
ura
(CT)
14,3
49
Buzu
rg (C
T)13
,868
Barw
aha
Kasb
a (C
T)13
,514
Meg
hnag
ar (C
T)12
,929
Man
egoa
n (C
T)12
,599
Teka
npur
(CT)
12,3
48
Hat
was
(CT)
12,2
95
Jaitp
ur (C
T)11
,835
Pank
hedi
(CT)
11,7
23
Gog
aon
(CT)
11,0
54
Mah
araj
pur
(CT)
10,7
28
Pipa
lya
Kum
ar (C
T)10
,684
Karr
apur
(CT)
10,6
47
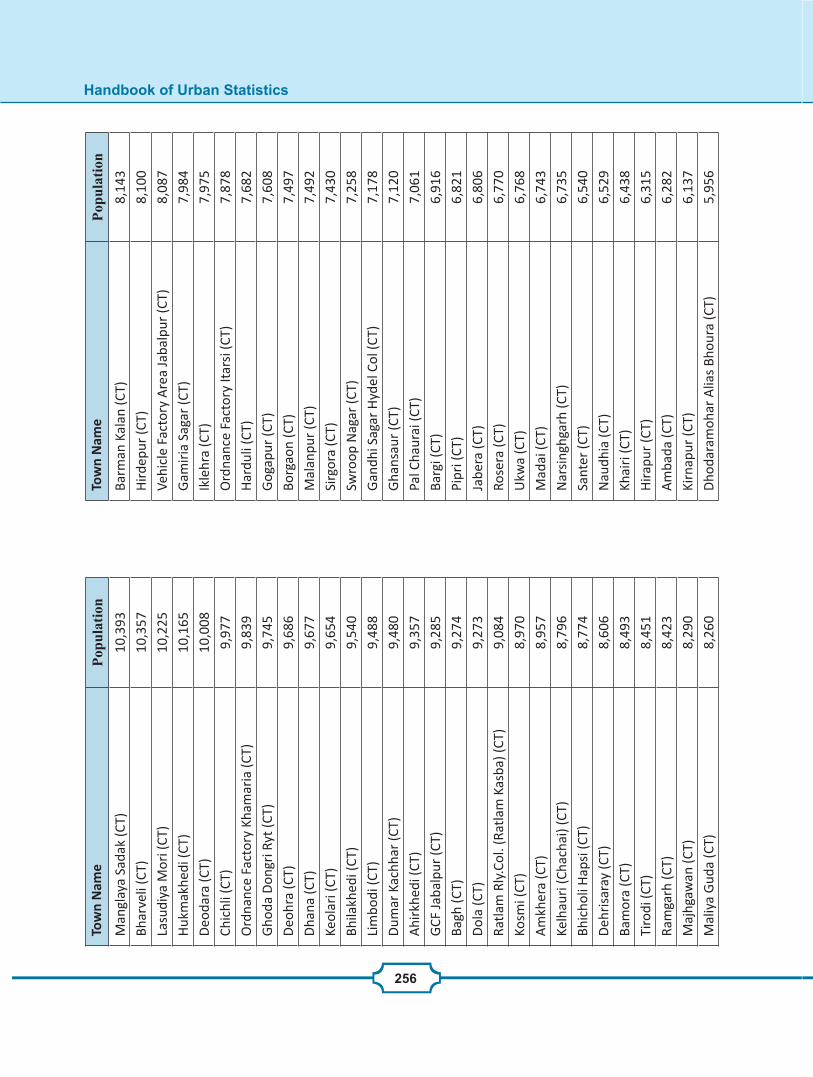
Handbook of Urban Statistics
256
Tow
n N
ame
Popu
latio
nM
angl
aya
Sada
k (C
T)10
,393
Bhar
veli
(CT)
10,3
57
Lasu
diya
Mor
i (CT
)10
,225
Huk
mak
hedi
(CT)
10,1
65
Deo
dara
(CT)
10,0
08
Chic
hli (
CT)
9,97
7
Ord
nanc
e Fa
ctor
y Kh
amar
ia (C
T)9,
839
Gho
da D
ongr
i Ryt
(CT)
9,74
5
Deo
hra
(CT)
9,68
6
Dha
na (C
T)9,
677
Keol
ari (
CT)
9,65
4
Bhila
khed
i (CT
)9,
540
Lim
bodi
(CT)
9,48
8
Dum
ar K
achh
ar (C
T)9,
480
Ahi
rkhe
di (C
T)9,
357
GCF
Jaba
lpur
(CT)
9,28
5
Bagh
(CT)
9,27
4
Dol
a (C
T)9,
273
Ratla
m R
ly.C
ol. (
Ratla
m K
asba
) (CT
)9,
084
Kosm
i (CT
)8,
970
Am
kher
a (C
T)8,
957
Kelh
auri
(Cha
chai
) (CT
)8,
796
Bhic
holi
Hap
si (C
T)8,
774
Deh
risa
ray
(CT)
8,60
6
Bam
ora
(CT)
8,49
3
Tiro
di (C
T)8,
451
Ram
garh
(CT)
8,42
3
Maj
hgaw
an (C
T)8,
290
Mal
iya
Gud
a (C
T)8,
260
Tow
n N
ame
Popu
latio
nBa
rman
Kal
an (C
T)8,
143
Hird
epur
(CT)
8,10
0
Vehi
cle
Fact
ory
Are
a Ja
balp
ur (C
T)8,
087
Gam
iria
Sag
ar (C
T)7,
984
Ikle
hra
(CT)
7,97
5
Ord
nanc
e Fa
ctor
y It
arsi
(CT)
7,87
8
Har
duli
(CT)
7,68
2
Gog
apur
(CT)
7,60
8
Borg
aon
(CT)
7,49
7
Mal
anpu
r (C
T)7,
492
Sirg
ora
(CT)
7,43
0
Swro
op N
agar
(CT)
7,25
8
Gan
dhi S
agar
Hyd
el C
ol (C
T)7,
178
Gha
nsau
r (C
T)7,
120
Pal C
haur
ai (C
T)7,
061
Barg
i (CT
)6,
916
Pipr
i (CT
)6,
821
Jabe
ra (C
T)6,
806
Rose
ra (C
T)6,
770
Ukw
a (C
T)6,
768
Mad
ai (C
T)6,
743
Nar
sing
hgar
h (C
T)6,
735
Sant
er (C
T)6,
540
Nau
dhia
(CT)
6,52
9
Khai
ri (C
T)6,
438
Hira
pur
(CT)
6,31
5
Am
bada
(CT)
6,28
2
Kirn
apur
(CT)
6,13
7
Dho
dara
moh
ar A
lias
Bhou
ra (C
T)5,
956

Annexure-1: Directory of Urban Centers in the Country with Population (2011)
257
Tow
n N
ame
Popu
latio
nD
igha
wan
i (CT
)5,
953
Khor
(CT)
5,68
3
Nan
pur
(CT)
5,63
2
Meh
arag
oan
(CT)
5,62
5
Gar
ra (C
T)5,
533
Bans
atar
Khe
da (C
T)5,
458
Guj
arkh
eda
(CT)
5,40
9
Sang
vi (C
T)5,
383
Am
anga
nj (C
T)5,
377
Mad
haw
gdha
(CT)
5,24
9
Bhai
nsa
(CT)
5,14
4
Deo
ri (C
T)5,
127
Pipa
riya
(CT)
5,08
4
Sinh
asa
(CT)
5,05
0
Bina
Rly
Col
ony
(CT)
5,03
5
Kund
am (C
T)4,
856
Badr
a (C
T)4,
785
Pind
rai (
CT)
4,75
5
Mah
ura
(CT)
4,66
4
Rani
pur
(Tav
anag
ar) (
CT)
4,56
1
Gor
aiya
(CT)
4,40
8
Sabo
(CT)
4,36
6
Now
basa
ta (C
T)4,
358
Pana
ra (C
T)4,
078
Seth
iya
(CT)
3,11
3
Kapu
ria
(CT)
1,90
2
Guj
arat
Ahm
adab
ad (M
Cor
p.)
5,57
7,94
0
Sura
t (M
Cor
p.)
4,46
7,79
7
Tow
n N
ame
Popu
latio
nVa
doda
ra (M
Cor
p.)
1,67
0,80
6
Rajk
ot (M
Cor
p.)
1,28
6,67
8
Bhav
naga
r (M
Cor
p.)
5,93
,368
Jam
naga
r (M
Cor
p.)
4,79
,920
Juna
gadh
(M C
orp.
)3,
19,4
62
Gan
dhid
ham
(M)
2,47
,992
Nad
iad
(M)
2,18
,095
Ana
nd (M
)1,
98,2
82
Mor
vi (M
)1,
94,9
47
Mah
esan
a (M
)1,
84,9
91
Sure
ndra
naga
r D
udhr
ej (M
)1,
77,8
51
Bhar
uch
(M)
1,69
,007
Vapi
(M)
1,63
,630
Nav
sari
(M)
160,
941
Vera
val (
M)
154,
636
Porb
anda
r (M
)15
1,77
0
God
hra
(M)
143,
644
Bhuj
(M)
143,
286
Bota
d (M
)13
0,32
7
Pata
n (M
)12
5,49
7
Pala
npur
(M)
122,
344
Jetp
ur N
avag
adh
(M)
118,
302
Vals
ad (M
)11
4,63
6
Kal
ol (M
)11
3,15
3
Gon
dal (
M)
112,
197
Dee
sa (M
)11
1,16
0
Am
reli
(M)
105,
573
Doh
ad (M
)94
,578
Anj
ar (M
)87
,183

Handbook of Urban Statistics
258
Tow
n N
ame
Popu
latio
nD
hora
ji (M
)84
,545
Kham
bhat
(M)
83,7
15
Mah
uva
(M)
82,7
72
Vija
lpor
(M)
81,2
45
Him
atna
gar
(M)
81,1
37
Dho
lka
(M)
79,5
31
Sava
rkun
dla
(M)
78,3
54
Kesh
od (M
)76
,193
Wad
hwan
(M)
75,7
55
Dhr
anga
dhra
(M)
75,1
33
Ank
lesv
ar (M
)73
,928
Kadi
(M)
73,2
28
Mod
asa
(M)
67,6
48
Palit
ana
(M)
64,4
97
Man
grol
(M)
63,7
94
Bors
ad (M
)63
,377
Visn
agar
(M)
63,0
73
Okh
a (M
)62
,052
Bard
oli (
M)
60,8
21
Hal
ol (M
)59
,605
Upl
eta
(M)
58,7
75
Una
(M)
58,5
28
Unj
ha (M
)57
,108
Sidh
pur
(M)
56,4
02
Vira
mga
m (M
)55
,821
Petla
d (M
)55
,330
Siho
r (M
)54
,547
Bilim
ora
(M)
53,1
87
Man
dvi (
M)
51,3
76
Tow
n N
ame
Popu
latio
nD
abho
i (M
)51
,240
Kapa
dvan
j (M
)49
,308
Jasd
an (M
)48
,483
Chha
ya (M
)47
,699
Rana
vav
(M)
46,0
18
Wan
kane
r (M
)43
,881
Padr
a (M
)43
,366
Jam
busa
r (M
)43
,344
Lim
bdi (
M)
42,7
69
Deh
gam
(M)
42,6
32
Than
gadh
(M)
42,3
51
Kham
bhal
ia (M
)41
,734
Sana
nd (M
)41
,530
Kodi
nar
(M)
41,4
92
Vyar
a (M
)39
,789
Chak
lasi
(M)
39,5
81
Radh
anpu
r (M
)39
,558
Bhac
hau
(M)
39,5
32
Bala
sino
r (M
)39
,330
Dw
arka
(M)
38,8
73
Raju
la (M
)38
,489
Luna
wad
a (M
)36
,954
Bavl
a (M
)36
,206
Meh
med
abad
(M)
35,3
68
Kara
msa
d (M
)35
,285
Rajp
ipla
(M)
34,8
45
Baga
sara
(M)
34,5
21
Gar
iadh
ar (M
)33
,949
Um
reth
(M)
33,7
62

Annexure-1: Directory of Urban Centers in the Country with Population (2011)
259
Tow
n N
ame
Popu
latio
nSa
laya
(M)
33,2
46
Dha
ndhu
ka (M
)32
,475
Hal
vad
(M)
32,0
24
Idar
(M)
31,1
76
Man
avad
ar (M
)30
,850
Karj
an (M
)30
,405
Man
sa (M
)30
,347
Gad
hada
(M)
29,8
72
Dha
nera
(M)
29,5
78
Tars
adi (
M)
29,3
05
Sikk
a (M
)28
,814
Kalo
l (M
)28
,777
Jhal
od (M
)28
,720
Pard
i (M
)28
,495
Rapa
r (M
)28
,407
Kana
kpur
- Ka
nsad
(M)
28,3
27
Kala
vad
(M)
28,3
14
Thar
ad (M
)27
,954
Um
berg
aon
(M)
27,8
59
Tala
ja (M
)27
,822
Vadn
agar
(M)
27,7
90
Jafr
abad
(M)
27,1
67
Song
adh
(M)
26,5
15
Sutr
apad
a (M
)26
,132
Jam
jodh
pur
(M)
2589
2
Dhr
ol (M
)25
,883
Chho
ta U
daip
ur (M
)25
,787
Khed
a (M
)25
,575
Vija
pur
(M)
25,5
58
Tow
n N
ame
Popu
latio
nBa
bra
(M)
25,2
70
Khed
brah
ma
(M)
25,0
01
Dak
or (M
)24
,396
Dha
ram
pur
(M)
24,1
78
Valla
bh V
idya
naga
r (M
)23
,783
Pran
tij (M
)23
,596
Peth
apur
(M)
23,4
97
Ode
(M)
23,2
50
Chor
vad
(M)
22,7
20
Bhan
vad
(M)
22,1
42
Kath
lal (
M)
22,0
71
Bhab
har
(M)
21,8
94
Kher
alu
(M)
21,8
43
Choti
la (M
)21
,364
Lath
i (M
)21
,173
Tala
la (M
)21
,060
Dev
gadb
aria
(M)
21,0
30
Ank
lav
(M)
21,0
03
Vada
li (M
)20
,646
Har
ij (M
)20
,253
Bori
avi (
M)
19,8
65
Rava
l (M
)19
,777
Bare
ja (M
)19
,690
Visa
vada
r (M
)19
,515
Sant
ram
pur
(M)
19,4
65
Bhay
avad
ar (M
)19
,404
Sheh
era
(M)
19,1
75
Savl
i (M
)18
,467
Talo
d (M
)18
,298

Handbook of Urban Statistics
260
Tow
n N
ame
Popu
latio
nM
andv
i (M
)18
,214
Thar
a (M
)18
,060
Barw
ala
(M)
17,9
51
Baya
d (M
)17
,886
Kanj
ari (
M)
17,8
81
Patd
i (M
)17
,725
Mah
udha
(M)
17,7
22
Gan
devi
(M)
16,8
27
Chal
ala
(M)
16,7
21
Sojit
ra (M
)16
,713
Dam
naga
r (M
)16
,614
Kutiy
ana
(M)
16,5
81
Mal
iya
(M)
15,9
64
Chan
asm
a (M
)15
,932
Valla
bhip
ur (M
)15
,852
Thas
ra (M
)15
,806
Bant
wa
(M)
15,2
91
Am
od (M
)15
,237
Vant
hali
(M)
14,5
54
Vapi
(IN
A)
34,1
62
Ank
lesv
ar IN
A (I
NA
)24
,789
Ala
ng-S
osiy
a (IN
A)
18,4
80
Relia
nce
Com
plex
(IN
A)
12,7
96
Um
berg
aon
(INA
)6,
976
Haj
ira IN
A (I
NA
)5,
562
Vith
al U
dyog
naga
r IN
A (I
NA
)5,
035
Nan
desa
ri IN
A (I
NA
)3,
679
Bhar
uch
(INA
)3,
332
Sach
in IN
A (I
NA
)2,
680
Tow
n N
ame
Popu
latio
nCh
hatr
al IN
A (I
NA
)2,
660
GSF
C Co
mpl
ex IN
A (I
NA
)2,
242
Petr
o-Ch
emic
al C
ompl
ex IN
A (I
NA
)1,
951
Vals
ad (I
NA
)1,
162
Valia
- Jh
agad
ia (G
NFC
Sco
oter
Pro
ject
A
rea)
(IN
A)
1,08
4
Sari
gam
(IN
A)
925
Pano
li (IN
A)
836
Lodh
ika
(INA
)67
1
Kalo
l IN
A (I
NA
)53
5
GSF
C (M
otikh
avdi
Sik
ka) (
INA
)46
7
Kalo
l IN
A (I
NA
)44
8
Por-
Ram
anga
mdi
(IN
A)
311
Vagh
odia
(IN
A)
248
Vasn
a Bo
rsad
(IN
A)
166
Mag
dalla
INA
(IN
A)
18
Valia
(Nal
dhar
i) (IN
A)
5
Gan
dhin
agar
NA
202,
776
Sapu
tara
(NA
)2,
968
Ahm
adab
ad C
anto
nmen
t (CB
)7,
588
Koth
aria
(CT)
53,7
94
Bopa
l (CT
)37
,635
Mad
hapa
r (C
T)32
,293
Jhad
eshw
ar (C
T)28
,148
Sach
in (C
T)28
,102
Kado
dara
(CT)
27,3
36
Gad
khol
(CT)
25,3
32
Bhol
av (C
T)24
,605
Chal
than
(CT)
21,7
95

Annexure-1: Directory of Urban Centers in the Country with Population (2011)
261
Tow
n N
ame
Popu
latio
nM
undr
a (C
T)20
,338
Sari
gam
(CT)
19,9
03
Vera
val (
CT)
19,1
52
Chhi
ri (C
T)18
,829
Sols
umba
(CT)
18,7
96
Chan
od (C
T)18
,776
Kim
(CT)
18,6
38
Am
baji
(CT)
17,7
53
Ranp
ur (C
T)16
,944
Und
era
(CT)
16,9
02
Khap
at (C
T)16
,744
And
ada
(CT)
16,7
30
Sara
ngpo
re (C
T)16
,671
Traj
par
(CT)
16,6
37
Vagh
odia
(CT)
16,6
04
Kosa
mba
(CT)
16,1
51
Bhilo
da (C
T)16
,074
Kand
la (C
T)15
,782
Kabi
lpor
(CT)
15,6
99
Babe
n (C
T)15
,610
Sanj
an (C
T)15
,544
Saya
n (C
T)15
,324
Ahw
a (C
T)15
,004
Deo
dar
(CT)
14,9
12
Bhal
para
(CT)
14,6
76
Gam
di (C
T)14
,582
Dha
sa V
ishi
(CT)
14,4
48
Had
good
(CT)
14,2
62
Bans
da (C
T)14
,072
Tow
n N
ame
Popu
latio
nM
ora
(CT)
13,9
24
Saij
(CT)
13,8
82
Savg
adh
(CT)
13,8
41
Nan
dela
v (C
T)13
,583
Ana
ndpa
r (C
T)13
,483
Shak
tinag
ar (C
T)13
,463
Sukh
par
(CT)
13,3
03
Bhad
koda
ra (C
T)13
,233
Gal
pada
r (C
T)13
,155
Vavo
l (CT
)12
,628
Bech
ar A
lias
Bech
araj
i (CT
)12
,574
Mah
endr
anag
ar (C
T)12
,565
Sing
arva
(CT)
12,5
47
Kano
dar
(CT)
12,3
89
Balit
ha (C
T)12
,380
Pale
j (CT
)12
,334
Parn
era
(CT)
12,2
96
Bhag
daw
ada
(CT)
12,2
91
Gho
gha
(CT)
12,2
08
Rava
para
(CT)
12,2
06
Bode
li (C
T)12
,184
Ichc
hhap
or (C
T)12
,097
Man
kuva
(CT)
11,9
75
Ada
laj (
CT)
11,9
57
Khar
agho
da (C
T)11
,944
Sids
ar (C
T)11
,795
Rano
li (C
T)11
,726
Free
land
gunj
(CT)
11,6
57
Meg
hraj
(CT)
11,3
63

Handbook of Urban Statistics
262
Tow
n N
ame
Popu
latio
nVa
rtej
(CT)
11,3
54
Ant
arja
l (CT
)11
,256
Mah
uvar
(CT)
10,7
49
Mak
tam
pur
(CT)
10,7
04
Padd
hari
(CT)
10,5
47
Mith
apur
(CT)
10,5
08
Dah
eli (
CT)
10,4
75
Lilia
(CT)
10,3
59
Dev
sar
(CT)
10,3
46
Virp
ur (C
T)10
,238
Chha
tral
(CT)
10,2
15
Nan
akw
ada
(CT)
10,1
72
Chha
pra
(CT)
10,1
47
Jeta
lsar
(CT)
9,81
5
Chilo
da (N
arod
a) (C
T)9,
735
Kako
shi (
CT)
9,73
4
Jafr
abad
(CT)
9,68
5
Bajw
a (C
T)9,
611
Kava
nt (C
T)9,
553
Nar
i (CT
)9,
467
Shap
ur (C
T)9,
249
Nan
dej (
CT)
9,17
6
Pard
i Kan
de (C
T)9,
167
Vavd
i Buj
arg
(CT)
9,10
7
Vare
li (C
T)9,
033
Ded
iapa
da (C
T)9,
026
Bhila
d (C
T)9,
022
Alik
herv
a (C
T)8,
951
Chan
drap
ur (C
T)8,
906
Tow
n N
ame
Popu
latio
nKa
tpar
(CT)
8,67
7
Lava
chha
(CT)
8,54
9
Chha
pi (C
T)8,
379
Ala
ng (C
T)8,
309
Nan
desa
ri (C
T)8,
290
Nas
vadi
(CT)
8,07
6
Um
rala
(CT)
8,04
4
Deh
ari (
CT)
7,89
2
Jetp
ur (C
T)7,
864
Pard
i Son
dhpu
r (C
T)7,
833
Dho
la (C
T)7,
560
Uka
i (CT
)7,
453
Sanj
eli (
CT)
7,44
8
Sath
amba
(CT)
7,21
3
Bilim
ora
(Tal
odh)
(CT)
7,20
4
Jaro
d (C
T)7,
200
Mir
jhap
ar (C
T)7,
109
Kara
chiy
a (C
T)7,
103
Am
baliy
asan
(CT)
7,07
2
Chik
hli (
CT)
7,02
5
Ant
aliy
a (C
T)6,
936
Bhat
(CT)
6,82
3
Keva
diya
(CT)
6,78
8
Sela
mba
(CT)
6,71
7
Wag
hai (
CT)
6,71
5
Mal
pur
(CT)
6,37
8
Para
bada
(CT)
6,25
5
Bhag
al (J
agan
a) (C
T)6,
250
Dig
vija
ygra
m (C
T)6,
161

Annexure-1: Directory of Urban Centers in the Country with Population (2011)
263
Tow
n N
ame
Popu
latio
nA
mbo
li (C
T)6,
137
Vija
ynag
ar (C
T)6,
078
Song
adh
(CT)
6,02
7
Gha
ntes
hvar
(CT)
5,87
4
Am
arda
d (C
T)5,
872
Ars
odiy
a (C
T)5,
859
Sakt
asan
ala
(CT)
5,78
6
Sher
pura
(CT)
5,74
8
Karv
ad (C
T)5,
746
Bhur
ivel
(CT)
5,73
0
Bhar
than
a Ko
sad
(CT)
5,67
9
Salv
av (C
T)5,
486
Pard
i Par
nera
(CT)
5,45
4
Khar
ach
(CT)
5,43
6
Orv
ad (C
T)5,
420
Sanj
ali (
CT)
5,34
4
Dun
garp
ur (C
T)5,
039
Nav
a Bh
ildi (
CT)
4,99
4
Tars
ali (
CT)
4,92
9
Mal
anka
(CT)
4,76
5
Kalia
wad
i (CT
)4,
591
Sagb
ara
(CT)
4,49
6
Lim
khed
a (C
T)3,
924
Baliy
asan
(CT)
3,91
5
Lim
la (C
T)3,
683
Atul
(CT)
3,48
6
Jaw
ahar
naga
r (G
ujar
at R
efine
ry) (
CT)
3,41
7
Pala
j (CT
)2,
634
Tow
n N
ame
Popu
latio
nD
aman
and
Diu
Dam
an (M
CI)
44,2
82
Diu
(M C
I)23
,991
Dad
hel (
CT)
52,5
78
Kach
igam
(CT)
18,4
34
Kada
iya
(CT)
12,7
17
Dun
etha
(CT)
12,4
70
Bhim
pore
(CT)
10,9
36
Mar
wad
(CT)
7,44
3
Dad
ar &
Nag
ar H
avel
i
Silv
assa
(M C
I)98
,265
Nar
oli (
CT)
16,2
60
Dad
ra (C
T)13
,039
Sam
arva
rni (
CT)
12,5
53
Mas
at (C
T)12
,139
Rakh
oli (
CT)
8,33
9
Mah
aras
htra
Gre
ater
Mum
bai (
M C
orp.
)12
,442
,373
Pune
(M C
orp.
)3,
124,
458
Nag
pur
(M C
orp.
)2,
405,
665
Than
e (M
Cor
p.)
1,84
1,48
8
Pim
pri C
hinc
hwad
(M C
orp.
)1,
727,
692
Nas
hik
(M C
orp.
)1,
486,
053
Kaly
an D
ombi
vali
(M C
orp.
)1,
247,
327
Vasa
i-Vira
r Ci
ty (M
Cor
p.)
1,22
2,39
0
Aur
anga
bad
(M C
orp.
)1,
175,
116
Nav
i Mum
bai (
M C
orp.
)1,
120,
547
Sola
pur
(M C
orp.
) 95
1,55
8
Mira
Bha
yand
ar (M
cor
p.)
809,
378

Handbook of Urban Statistics
264
Tow
n N
ame
Popu
latio
nBh
iwan
di (M
Cor
p.)
709,
665
Am
rava
ti (M
Cor
p.)
647,
057
Nan
ded
Wag
hala
(M C
orp.
)55
0,43
9
Kolh
apur
(M C
orp.
)54
9,23
6
Ulh
asna
gar
(M C
orp.
)50
6,09
8
Sang
li-M
iraj K
upw
ad (M
Cor
p.)
502,
793
Mal
egao
n (M
Cor
p.)
471,
312
Jalg
aon
(M C
orp.
)46
0,22
8
Ako
la (M
Cor
p.)
425,
817
Dhu
le (M
Cor
p.)
375,
559
Ahm
adna
gar
(M C
orp.
)35
0,85
9
Latu
r (M
Cl)
382,
940
Chan
drap
ur (M
Cl)
320,
379
Parb
hani
(M C
l)30
7,17
0
Icha
lkar
anji
(MCl
)28
7,35
3
Jaln
a (M
Cl)
285,
577
Am
barn
ath
(MCl
)25
3,47
5
Bhus
awal
(MCl
)18
7,42
1
Panv
el (M
Cl)
180,
020
Badl
apur
(MCl
)17
4,22
6
Bid
(M C
l)14
6,70
9
Gon
diya
(M C
l)13
2,81
3
Sata
ra (M
Cl)
120,
195
Bars
hi (M
Cl)
118,
722
Yava
tmal
(MCl
)11
6,55
1
Ach
alpu
r (M
Cl)
112,
311
Osm
anab
ad (M
Cl)
111,
825
Nan
durb
ar (M
Cl)
111,
037
War
dha
(M C
l)10
6,44
4
Tow
n N
ame
Popu
latio
nU
dgir
(M C
l)10
3,55
0
Hin
gang
hat (
M C
l)10
1,80
5
Pand
harp
ur (M
Cl)
98,9
23
Chal
isga
on(M
Cl)
97,5
51
Am
alne
r (M
Cl)
95,9
94
Kham
gaon
(M C
l)94
,191
Ako
t (M
Cl)
92,6
37
Bhan
dara
(M C
l)91
,845
Parl
i (M
Cl)
90,9
75
Balla
rpur
(M C
l)89
,452
Shri
ram
pur
(M C
l)89
,282
Kam
ptee
(MCl
)86
,793
Hin
goli
(M C
l)85
,103
Man
mad
(M C
l)80
,058
Was
him
(M C
l)78
,387
Shir
pur-
War
wad
e (M
Cl)
76,9
05
Ratn
agir
i (M
Cl)
76,2
29
Am
bejo
gai (
M C
l)73
,975
Pusa
d (M
Cl)
73,0
46
Chop
da (M
Cl)
72,7
83
Khop
oli (
M C
l)71
,141
Palg
har
(M C
l)68
,930
Basm
ath
(M C
l)68
,846
Kara
nja
(M C
l)67
,907
Mal
kapu
r (M
Cl)
67,7
40
Buld
ana
(M C
l)67
,431
Ura
n Is
lam
pur
(M C
l)67
,391
Sang
amne
r (M
Cl)
65,8
04
Sinn
ar (M
Cl)
65,2
99

Annexure-1: Directory of Urban Centers in the Country with Population (2011)
265
Tow
n N
ame
Popu
latio
nKo
parg
aon
(M C
l)65
,273
Shah
ade
(M C
l)61
,376
Bhad
rava
ti (M
Cl)
60,5
65
Sheg
aon
(M C
l)59
,672
Pach
ora
(M C
l) 59
,609
Wan
i (M
Cl)
58,8
40
Sillo
d (M
Cl)
58,2
30
Chik
hli (
M C
l)57
,889
Lona
vala
(M C
l)57
,698
Tale
gaon
Dab
hade
(M C
l)56
,435
Anj
anga
on (M
Cl)
56,3
80
Chip
lun
(M C
l)55
,139
Deg
lur
(M C
l)54
,493
Bara
mati
(M C
l)54
,415
Gad
chiro
li (M
Cl)
54,1
52
Um
red
(M C
l)53
,971
Kara
d (M
Cl)
53,8
79
Phal
tan
(M C
l)52
,118
Dah
anu
(M C
l)50
,287
Gan
gakh
ed (M
Cl)
49,8
91
Yevl
a (M
Cl)
49,8
26
Man
jlega
on (M
Cl)
49,4
53
Dau
nd (M
Cl)
49,4
50
Jays
ingp
ur (M
Cl)
48,5
10
Vita
(M C
l)48
,289
Um
arkh
ed (M
Cl)
47,4
58
Sailu
(M C
l)46
,915
Don
daic
ha-W
arw
ade(
M C
l) 46
,767
Jam
ner
(M C
l) 46
,762
Tow
n N
ame
Popu
latio
nW
aror
a (M
Cl)
46,5
32
War
ud (M
Cl)
45,4
82
Meh
kar
(M C
l)45
,248
Tum
sar
(M C
l)44
,869
Dig
ras
(M C
l)44
,767
Bala
pur
(M C
l)44
,594
Jintu
r (M
Cl)
44,2
91
Ahm
adpu
r (M
Cl)
43,9
36
Kato
l (M
Cl)
43,2
67
Arv
i (M
Cl)
42,8
22
Nan
dura
(M C
l)42
,167
Vaija
pur
(M C
l)41
,296
Kann
ad (M
Cl)
40,7
59
Mur
tijap
ur (M
Cl)
40,2
95
Akk
alko
t (M
Cl)
40,1
03
Rahu
ri (M
Cl)
38,8
13
Tasg
aon
(M C
l)37
,945
Pen
(M C
l)37
,852
Sata
na (M
Cl)
37,7
01
Paro
la (M
Cl)
37,6
66
Mor
shi (
M C
l)37
,333
Bhad
gaon
(M C
l)37
,214
Shir
ur (M
Cl)
37,1
11
Ash
ta (M
Cl)
37,1
05
Path
ri (M
Cl)
36,8
53
Yaw
al (M
Cl)
36,7
06
Dar
yapu
r Ba
nosa
(M C
l) 36
,463
Purn
a (M
Cl)
36,4
33
Nila
nga
(M C
l)36
,172

Handbook of Urban Statistics
266
Tow
n N
ame
Popu
latio
nA
usa
(M C
l)36
,118
Brah
map
uri (
M C
l)36
,025
Wai
(M C
l)36
,025
Part
ur (M
Cl)
35,8
83
Um
arga
(M C
l)35
,477
Dha
rang
aon
(M C
l) 35
,375
Sang
ole
(M C
l)34
,321
Naw
apur
(M C
l)34
,207
Riso
d (M
Cl)
34,1
36
Kaga
l (M
Cl)
34,1
06
Tulja
pur
(M C
l)34
,011
Pulg
aon
(M C
l)33
,925
Dha
rmab
ad (M
Cl)
33,7
41
Geo
rai (
M C
l)33
,562
Bhok
ar (M
Cl)
32,8
99
Savn
er (M
Cl)
32,4
98
Man
wat
h (M
Cl)
32,4
88
Sasv
ad (M
Cl)
31,8
21
Am
bad
(M C
l)31
,553
Shri
gond
a (M
Cl)
31,1
34
Pand
hark
aoda
(M C
l)31
,094
Eran
dol (
M C
l)31
,071
Deo
lali
Prav
ara
(M C
l)30
,997
Igat
puri
(M C
l)30
,989
Man
grul
pir
(M C
l)30
,983
Deu
lgao
n Ra
ja (M
Cl)
30,8
27
Ura
n (M
Cl)
30,4
39
Raju
ra (M
Cl)
29,6
68
Karj
at (M
Cl)
29,6
63
Tow
n N
ame
Popu
latio
nN
er (M
Cl)
29,3
02
Des
aiga
nj (M
Cl)
28,7
81
Ala
ndi (
M C
l)28
,645
Kinw
at (M
Cl)
28,4
54
Jalg
aon
(Jam
od) (
M C
l)28
,276
Gan
gapu
r (M
Cl)
27,7
45
Muk
hed
(M C
l)27
,650
Mah
ad (M
Cl)
27,5
36
Had
gaon
(M C
l)27
,433
Path
ardi
(M C
l)27
,211
Gad
hing
laj (
M C
l)27
,185
Rave
r (M
Cl)
27,0
39
Faiz
pur
(M C
l)26
,602
Talo
de (M
Cl)
26,3
63
Dar
wha
(M C
l)25
,791
Kala
mb
(M C
l)25
,713
Vadg
aon
Kasb
a (M
Cl)
25,6
51
Inda
pur
(M C
l)25
,515
Mul
(M C
l)25
,449
Junn
ar (M
Cl)
25,3
15
Tiro
ra (M
Cl)
25,1
81
Kand
har
(M C
l)24
,843
Kala
mnu
ri (M
Cl)
24,7
84
Bhok
arda
n (M
Cl)
24,4
16
Loha
(M C
l)24
,125
Mha
swad
(M C
l)24
,120
Saw
antw
adi (
M C
l)23
,851
Nan
dgao
n (M
Cl)
23,6
04
Mud
khed
(M C
l)23
,517

Annexure-1: Directory of Urban Centers in the Country with Population (2011)
267
Tow
n N
ame
Popu
latio
nLo
nar
(M C
l)23
,416
Karm
ala
(M C
l)23
,199
Paun
i (M
Cl)
22,8
21
Kurd
uvad
i (M
Cl)
22,4
63
Kuru
ndva
d (M
Cl)
22,3
72
Raht
a Pi
mpl
as (M
Cl)
22,3
35
Ram
tek
(M C
l)22
,310
Man
galv
edhe
(M C
l)21
,824
Shen
durj
ana
(M C
l)21
,748
Gha
tanj
i (M
Cl)
21,2
93
Nar
khed
(M C
l)21
,127
Patu
r (M
Cl)
21,0
95
Datt
apur
Dha
man
gaon
(M C
l)21
,059
Telh
ara
(M C
l)20
,986
Roha
Ash
tam
i (M
Cl)
20,8
49
Alib
ag (M
Cl)
20,7
43
Savd
a (M
Cl)
20,5
84
Dha
rur
(M C
l)20
,417
Chan
dur
Railw
ay (M
Cl)
19,7
76
Kala
mes
hwar
(M C
l) 19
,578
Deo
li (M
Cl)
19,2
88
Chan
durb
azar
(M C
l)18
,759
Para
nda
(M C
l)18
,758
Mal
wan
(M C
l)18
,648
Bhum
(M C
l) 18
,561
Bhor
(M C
l)18
,453
Mur
um (M
Cl)
18,3
71
Nal
durg
(M C
l)18
,341
Rahi
mat
pur
(M C
l)17
,633
Tow
n N
ame
Popu
latio
nKh
ed (M
Cl)
16,8
92
Sind
khed
Raj
a (M
Cl)
16,4
34
Sonp
eth
(M C
l)15
,765
Khul
daba
d (M
Cl)
15,7
49
Shri
vard
han
(M C
l)15
,123
Bilo
li (M
Cl)
14,9
23
Panc
hgan
i (M
Cl)
14,8
94
Kund
alw
adi (
M C
l)14
,760
Khap
a (M
Cl)
14,6
59
Jeju
ri (M
Cl)
14,5
15
Peth
Um
ri (M
Cl)
13,5
01
Mah
abal
eshw
ar (M
Cl)
13,3
93
Sind
i (M
Cl)
12,8
58
Veng
urla
(M C
l)12
,392
Mai
ndar
gi (M
Cl)
12,3
63
Bhag
ur (M
Cl)
12,3
53
Mur
ud Ja
njira
(M C
l)12
,216
Trim
bak
(M C
l)12
,056
Jaw
har
(M C
l)12
,040
Dud
hani
(M C
l)11
,214
Mur
gud
(M C
l)11
,194
Raja
pur
(M C
l)9,
753
Mow
ad (M
Cl)
8,77
7
Moh
pa (M
Cl)
6,98
7
Mal
kapu
r (M
Cl)
5,33
9
Chik
hald
ara
(M C
l) 5,
158
Mat
hera
n (M
Cl)
4,39
3
Panh
ala
(M C
l)3,
121
Shird
i (N
P)36
,004

Handbook of Urban Statistics
268
Tow
n N
ame
Popu
latio
nM
alka
pur
(NP)
31,6
71
Kaij
(NP)
30,7
04
Kank
avli
(NP)
16,3
98
Dap
oli C
amp
(NP)
15
,713
Kirk
ee C
antt
. (CB
)78
,684
Pune
Can
tt. (
CB)
71,7
81
Deo
lali
Cantt
. (CB
)54
,027
Deh
u Ro
ad C
antt
. (CB
)48
,961
Ahm
adna
gar
Cantt
. (CB
)28
,986
Aur
anga
bad
Cantt
. (CB
)18
,051
Kam
ptee
Can
tt. (
CB)
12,4
57
Nav
i Mum
bai P
anve
l Rai
garh
(CT)
1,95
,373
Khar
ghar
(CT)
80,6
12
Wad
gaon
Kol
hati
(CT)
65,6
20
Bid
(Rur
al) (
CT)
56,5
31
Wad
i (CT
)54
,048
Oza
r (C
T)51
,297
Dhy
ane
(CT)
49,1
92
Ranj
anga
on (s
) (CT
)42
,877
Paith
an (M
Cl)
41,5
36
Chak
an (C
T)41
,113
Wad
gaon
Roa
d (C
T)40
,884
Sata
ra (C
T)39
,973
Akl
uj (C
T)39
,972
Dig
doh
(CT)
38,1
57
Kabn
ur (C
T)38
,146
Wan
adon
gri (
CT)
37,6
67
Bois
ar (C
T)36
,151
Vara
ngao
n (C
T)35
,411
Tow
n N
ame
Popu
latio
nSo
yaga
on (C
T)34
,341
Jam
khed
(CT)
34,0
17
Wag
holi
(CT)
33,4
79
Ghu
gus
(CT)
32,6
54
Khai
ra (C
T)31
,699
Uch
gaon
(CT)
31,2
38
Wal
wad
i (CT
)29
,636
Mha
ral B
k (C
T)29
,462
Kara
nje
tarf
Sat
ara
(CT)
29,1
40
Hup
ari (
CT)
28,9
53
Chan
dur
(CT)
26,7
55
Kodo
li (C
T)26
,106
Khon
i (CT
)26
,016
Chan
dvad
(CT)
25,3
41
Rajg
urun
agar
(Khe
d) (C
T)25
,146
Gho
ti Bk
. (CT
)24
,838
Kore
gaon
(CT)
24,6
90
Hud
kesh
war
bk.
(CT)
24,4
99
Kon
(CT)
24,2
95
Pipr
i (CT
)23
,661
Kanh
an (P
ipri
) (CT
)22
,945
Loha
ra (C
T)22
,664
God
oli (
CT)
22,5
17
Pach
gaon
(CT)
22,3
53
Ghu
lew
adi (
CT)
21,8
60
Sakr
i (CT
)21
,764
Um
arsa
ra (C
T)21
,752
Mah
adul
a (C
T)21
,481
Sind
i Tur
f Hin
dnag
ar (C
T)20
,956

Annexure-1: Directory of Urban Centers in the Country with Population (2011)
269
Tow
n N
ame
Popu
latio
nN
ildoh
(CT)
20,8
88
Vash
ind
(CT)
20,5
61
Kara
d (R
ural
) (CT
)20
,476
Koro
chi (
CT)
20,4
20
Um
ri P
raga
ne B
alap
ur (C
T)20
,262
Wal
uj B
k. (C
T)20
,220
Borg
aon
(Meg
he) (
CT)
19,7
59
Jalo
chi (
CT)
19,3
46
Man
char
(CT)
18,8
76
Nag
arde
ole
(CT)
18,8
02
Mur
bad
(CT)
18,7
25
Lona
nd (C
T)18
,723
Chic
holi
(CT)
18,4
69
Ner
al (C
T)18
,429
Past
hal (
CT)
18,1
94
Nat
eput
e (C
T)17
,930
Akk
alku
wa
(CT)
17,8
40
Dur
gapu
r (C
T)17
,693
Lasa
lgao
n (C
T)17
,360
Nar
sala
(CT)
17,3
30
Ajra
(CT)
17,2
57
Vada
(CT)
16,7
50
Chan
je (C
T)16
,714
Kand
ari (
CT)
16,3
53
Kuda
l (CT
)16
,015
Dha
rni (
CT)
15,7
61
Yerk
heda
(CT)
15,7
27
Kusg
aon
Bk. (
CT)
15,6
12
Kasa
ra B
k. (C
T)15
,611
Tow
n N
ame
Popu
latio
nKa
lher
(CT)
15,5
73
Mal
kapu
r (C
T)15
,420
Shel
ar (C
T)14
,899
Yava
tmal
(R) (
CT)
14,7
66
Budh
gaon
(CT)
14,6
66
Sako
li (C
T)14
,636
Ahe
ri (C
T)14
,609
Mou
da (C
T)14
,606
Wad
agao
n (C
T)14
,595
Deo
ri (C
T)14
,579
Dav
lam
eti (C
T)14
,545
Saw
angi
(Meg
he) (
CT)
14,3
94
Lanj
a (C
T)14
,377
Talo
de P
anch
nad
(CT)
14,3
18
Khed
(CT)
14,2
66
Pira
ngut
(CT)
14,1
74
Arv
i (CT
)14
,015
Said
apur
(CT)
13,9
13
Shiv
aji N
agar
(CT)
13,8
77
Pata
n (C
T)13
,779
Teka
di (C
T)13
,741
Shiv
ani (
CT)
13,6
99
Chin
chan
i (CT
)13
,646
Sana
swad
i (CT
)13
,543
Khad
kale
(CT)
13,4
35
Sund
arkh
ed (C
T)13
,317
Bork
hedi
(CT)
13,2
94
Kore
gaon
Bhi
ma
(CT)
13,1
16
Asa
ngao
n (C
T)13
,104

Handbook of Urban Statistics
270
Tow
n N
ame
Popu
latio
nW
arth
i (CT
)13
,058
Kari
vali
(CT)
12,9
07
Kata
i (CT
)12
,898
Dev
rukh
(CT)
12,6
89
Wag
hapu
r (C
T)12
,684
Nan
ekar
wad
i (CT
)12
,654
Vang
ani (
CT)
12,6
28
Gan
dhin
agar
(CT)
12,6
01
Med
anka
rwad
i (CT
)12
,576
Nag
otha
ne (C
T)12
,549
Kher
di (C
T)12
,397
Khad
ki B
k (C
T)12
,133
Nal
wad
i (CT
)12
,119
Chan
dkap
ur (C
T)12
,077
Bori
(CT)
12,0
72
Ash
ti (C
T)11
,972
Balir
ampu
r (C
T)11
,939
Mal
de (C
T)11
,881
Nag
apur
(CT)
11,7
90
Nac
hane
(CT)
11,6
88
Karj
at (C
T)11
,659
Shah
apur
(CT)
11,6
23
Gok
unda
(CT)
11,6
00
Kudw
a (C
T)11
,549
Chite
gaon
(CT)
11,5
07
Hin
java
di (C
T)11
,459
Katk
ar (C
T)11
,398
Ute
khol
(CT)
11,3
80
Taka
lgha
t (CT
)11
,363
Tow
n N
ame
Popu
latio
nSh
ivat
kar
(Nira
) (CT
)11
,228
Mad
havn
agar
(CT)
11,1
68
Chen
dhar
e (C
T)11
,039
Am
gaon
bk.
(CT)
10,9
72
Raha
nal (
CT)
10,9
28
Dar
ewad
i (CT
)10
,860
Sang
ames
hwar
(CT)
10,8
15
Raju
r (C
T)10
,692
Taka
li Pr
. Cha
lisga
on (C
T)10
,630
Kand
ri (C
T)10
,624
Kond
umal
(CT)
10,4
97
Man
or (C
T)10
,421
Salw
ad (C
T)10
,397
Pand
harp
ur (C
T)10
,346
Bam
hni (
CT)
10,3
41
Kala
mbe
T. T
hane
(CT)
10,1
38
Raju
r (C
T)10
,046
Shri
ram
pur
(CT)
9,94
9
Dha
nega
on (C
T)9,
809
Waj
egao
n (C
T)9,
772
Moh
pada
Alia
s W
asam
be (C
T)9,
694
Mha
sla
(CT)
9,67
9
Visa
pur
(CT)
9,39
8
Wal
ani (
CT)
9,39
3
Sone
gaon
(Nip
ani)
(CT)
9,38
7
Nan
da (C
T)9,
378
Ekla
hare
(CT)
9,37
6
Haj
arm
achi
(CT)
9,31
7
Khar
abw
adi (
CT)
9,20
0

Annexure-1: Directory of Urban Centers in the Country with Population (2011)
271
Tow
n N
ame
Popu
latio
nPa
lidev
ad (C
T)9,
194
Gan
eshp
ur (C
T)9,
192
Pali
(CT)
9,17
6
Uja
laiw
adi (
CT)
9,07
5
Dan
di (C
T)8,
942
Mas
ala
(CT)
8,88
3
Bhuw
anes
hwar
(CT)
8,87
1
Birw
adi (
CT)
8,82
9
Saw
ari J
awha
rnag
ar (C
T)8,
770
Sara
vali
(CT)
8,71
0
Rees
(CT)
8,63
2
Gok
ul S
hirg
aon
(CT)
8,62
3
Bhok
ara
(CT)
8,60
2
Gon
dpip
ri (C
T)8,
474
Pim
palg
aon
(CT)
8,31
7
Deo
giri
(CT)
8,30
3
Nid
eban
(CT)
8,24
9
Jasa
i (CT
)8,
234
Kolk
i (CT
)8,
054
Kalm
ath
(CT)
8,01
1
Mah
inda
le (C
T)7,
977
Zadg
aon
(CT)
7,80
3
Chan
drap
ada
(CT)
7,75
0
Nija
mpu
r (C
T)7,
696
Yew
alew
adi (
CT)
7,68
5
Wag
hoda
(CT)
7,62
8
Um
bar
Pada
Nan
dade
(CT)
7,60
5
Mur
mad
i (CT
)7,
576
Nim
bhor
e Bu
druk
(CT)
7,50
1
Tow
n N
ame
Popu
latio
nKe
gaon
(CT)
7,48
5
Kurk
heda
(CT)
7,43
0
Siro
ncha
Ry.
(CT)
7,42
7
Vadg
har
(CT)
7,34
1
Sille
wad
a (C
T)7,
290
Khap
ar (C
T)7,
235
Mor
ewad
i (CT
)7,
222
Kudu
s (C
T)7,
204
Gor
egao
n (C
T)7,
155
Dab
hol (
CT)
7,03
8
Tara
pur
(CT)
6,96
2
Borl
i Pan
chta
n (C
T)6,
952
Risa
ma
(CT)
6,92
5
Burh
anag
ar (C
T)6,
885
Dau
nd (C
T)6,
863
Vilh
oli (
CT)
6,79
8
Kham
ari (
CT)
6,79
4
Um
ari P
r. A
kola
(CT)
6,75
6
Kam
be (C
T)6,
642
Pada
gha
(CT)
6,63
3
Kalu
ndre
(CT)
6,62
6
Band
a (C
T)6,
611
Nav
ghar
(CT)
6,60
3
Purn
e (C
T)6,
588
Khan
dbar
a (C
T)6,
511
Sang
ram
naga
r (C
T)6,
499
Am
biva
li T.
Wan
khal
(CT)
6,49
7
Kuw
arba
v (C
T)6,
497
Jalg
aon
(CT)
6,48
0

Handbook of Urban Statistics
272
Tow
n N
ame
Popu
latio
nKa
tang
i Kal
a (C
T)6,
440
War
ud (C
T)6,
386
Than
a (C
T)6,
339
Kora
di (C
T)6,
321
Surg
ana
(CT)
6,26
3
Ana
ntpu
r (C
T)6,
166
Wad
dham
ana
(CT)
6,14
8
Deh
u (C
T)6,
133
Vadf
alya
(CT)
6,09
3
Shiv
ar (C
T)6,
047
Vikr
amga
d (C
T)5,
991
Shirg
aon
(CT)
5,97
1
Pola
dpur
(CT)
5,94
4
Bela
(CT)
5,91
4
Bori
vali
Tarf
Rah
ur (C
T)5,
780
Sans
ari (
CT)
5,78
0
Pim
palg
aon
Naj
ik (C
T)5,
741
Mah
apol
i (CT
)5,
666
Ash
ti (C
T)5,
634
Nak
oda
(CT)
5,63
4
Khar
di (C
T)5,
579
Fulc
hur
(CT)
5,48
0
Kam
be (C
T)5,
436
Dad
ar (C
T)5,
389
Pado
li (C
T)5,
275
Khar
bav
(CT)
5,25
0
Tam
gaon
(CT)
5,22
3
Am
gaon
kh.
(CT)
5,19
7
Sam
anga
on (C
T)5,
156
Tow
n N
ame
Popu
latio
nKa
ndri
(CT)
5,09
9
Maj
gaon
(CT)
5,08
0
Dha
tau
(CT)
5,06
6
Am
bepu
r (C
T)5,
035
Gim
hava
ne (C
T)5,
025
Har
sul (
CT)
4,97
9
Dho
pata
la (C
T)4,
945
Tada
li (C
T)4,
942
Aw
alpu
r (C
T)4,
882
Nad
gaon
Tar
f Bir
wad
i (CT
)4,
871
Kuru
l (CT
)4,
869
Mak
rani
fali
(CT)
4,81
2
Urj
anag
ar (C
T)4,
748
Aw
adha
n (C
T)4,
732
Wad
i Rat
nagi
ri (C
T)4,
693
Med
ha (C
T)4,
678
Shah
apur
(CT)
4,45
9
Karl
e (C
T)4,
382
Isas
ani (
CT)
4,36
6
Chik
hala
(CT)
4,35
2
Sasti
(CT)
4,32
0
Ow
le (C
T)4,
275
Got
hegh
ar (C
T)4,
232
Nan
dgao
n Po
de (C
T)3,
836
Zotir
pada
(CT)
3,38
9
Nag
alw
adi (
CT)
2,56
2
Mou
je A
njan
vel (
CT)
1,62
1
Song
irw
adi (
Rura
l) (C
T)79
1
Pach
ora
(Rur
al) (
CT)
211

Annexure-1: Directory of Urban Centers in the Country with Population (2011)
273
Tow
n N
ame
Popu
latio
nA
ndhr
a Pr
ades
h
GH
MC
(M C
orp.
)6,
731,
790
GVM
C1,
728,
128
Vija
yaw
ada
(M C
orp.
)1,
034,
358
Gun
tur
(M C
orp.
)64
7,50
8
War
anga
l (M
Cor
p.)
615,
998
Nel
lore
(M C
orp.
)49
9,57
5
Kurn
ool (
M C
orp.
)43
0,21
4
Kada
pa (M
Cor
p.)
343,
054
Raja
hmun
dry
(M C
orp.
)34
1,83
1
Kaki
nada
(M C
orp.
)31
2,53
8
Niz
amab
ad (M
Cor
p.)
311,
152
Tiru
pati
(M C
orp.
)28
7,48
2
Kari
mna
gar
(M C
orp.
)26
1,18
5
Ana
ntap
ur (M
Cor
p.)
261,
004
Elur
u (M
Cor
p.)
203,
780
Ram
agun
dam
(M)
229,
644
Vizi
anag
aram
(M)
228,
025
Ong
ole
(M)
204,
746
Nan
dyal
(M)
200,
516
Kham
mam
(M)
184,
210
Mac
hilip
atna
m (M
)16
9,89
2
Ado
ni (M
)16
6,34
4
Tena
li (M
)16
4,93
7
Prod
datu
r (M
)16
2,71
7
Mah
bubn
agar
(M)
157,
733
Chitt
oor
(M)
153,
756
Hin
dupu
r (M
)15
1,67
7
Bhim
avar
am (M
)14
2,18
4
Tow
n N
ame
Popu
latio
nM
adan
apal
le (M
)13
6,41
4
Nal
gond
a (M
)13
5,74
4
Gun
taka
l (M
)12
6,27
0
Srik
akul
am (M
)12
5,93
9
Dha
rmav
aram
(M)
121,
874
Gud
ivad
a (M
)11
8,16
7
Adi
laba
d (M
)11
7,16
7
Nar
asar
aope
t (M
)11
6,25
0
Tadp
atri
(M)
108,
171
Sury
apet
(M)
105,
531
Tade
palli
gude
m (M
)10
3,90
6
Mir
yala
guda
(M)
103,
817
Chila
kalu
ripe
t (M
)10
1,39
8
Jagti
al (M
)96
,460
Yem
mig
anur
(M)
95,1
49
Raya
choti
(M)
91,2
34
Kadi
ri (M
)89
,429
Nir
mal
(M)
88,4
33
Chira
la (M
)87
,200
Man
cher
ial (
M)
86,9
11
Ana
kapa
lle (M
)86
,519
Kava
li (M
)82
,336
Kam
ared
dy (M
)80
,315
Palw
anch
a (M
)80
,199
Srik
alah
asti
(M)
80,0
56
Koth
agud
em (M
)79
,819
Bodh
an (M
)77
,573
Sirc
illa
(M)
75,5
50
Man
gala
giri
(M)
73,6
13

Handbook of Urban Statistics
274
Tow
n N
ame
Popu
latio
nTa
nuku
(M)
72,3
48
Sang
ared
dy (M
)71
,376
Mar
kapu
r (M
)71
,092
Bapa
tla (M
)70
,777
Badv
el (M
)70
,626
Kora
tla (M
)66
,504
Puliv
endl
a (M
)65
,706
Sidd
ipet
(M)
65,1
58
Tand
ur (M
)65
,115
Nag
ari (
M)
62,2
53
Raya
durg
(M)
61,7
49
Pala
cole
(M)
61,2
84
Wan
apar
thy
(M)
60,9
49
Gud
ur (M
)60
,625
Ponn
ur (M
)59
,913
Vinu
kond
a (M
)59
,725
Nar
asap
ur (M
)58
,770
Nuz
vid
(M)
58,5
90
Kaga
znag
ar (M
)57
,583
Gad
wal
(M)
57,5
69
Pala
sa K
asib
ugga
(M)
57,5
07
Mac
herl
a (M
)57
,290
Kand
ukur
(M)
57,2
46
Sam
alko
t (M
)56
,864
Bobb
ili (M
)56
,819
Satt
enap
alle
(M)
56,7
21
Bella
mpa
lle (M
)55
,841
Pung
anur
(M)
54,7
46
Tade
palle
(M)
54,4
06
Tow
n N
ame
Popu
latio
nPu
ttur
(M)
54,0
92
Parv
athi
pura
m (M
)53
,844
Man
dape
ta (M
)53
,633
Jagg
aiah
pet (
M)
53,5
30
Tuni
(M)
53,4
25
Bhon
gir
(M)
53,3
39
Am
alap
uram
(M)
53,2
31
Vica
raba
d (M
)53
,143
Jang
aon
(M)
52,3
94
Pith
apur
am (M
)52
,360
Man
dam
arri
(M)
52,3
52
Bhee
mun
ipat
nam
(M)
52,1
10
Venk
atag
iri (
M)
51,7
08
Palm
aner
(M)
51,1
63
Met
palle
(M)
50,9
02
Repa
lle (M
)50
,866
Zahi
raba
d (M
)50
,532
Bhai
nsa
(M)
49,7
64
Salu
r (M
)49
,500
Pedd
apur
am (M
)49
,477
Med
ak (M
)44
,255
Arm
ur (M
)43
,903
Nid
adav
ole
(M)
43,8
09
Ram
acha
ndra
pura
m (M
)43
,657
Sada
sivp
et (M
)42
,950
Am
adal
aval
asa
(M)
39,7
99
Kovv
ur (M
)39
,667
Ichc
hapu
ram
(M)
36,4
93
Yella
ndu
(M)
33,7
32

Annexure-1: Directory of Urban Centers in the Country with Population (2011)
275
Tow
n N
ame
Popu
latio
nM
anug
ur (M
)32
,091
Peda
na (M
)30
,721
Pidu
gura
lla (N
P)63
,103
Dho
ne (N
P)59
,272
Raja
mpe
t (N
P)47
,220
Jam
mal
amad
ugu
(NP)
46,0
69
Raja
m (N
P)42
,197
Nar
ayan
pet (
NP)
41,7
52
Sath
upal
le (N
P)31
,857
Sris
aila
m P
roje
ct(R
FC)
Tow
nshi
p (C
T)21
,452
Secu
nder
abad
(CB)
217,
910
Koda
d (C
T)64
,234
Khan
apur
am H
avel
i (CT
)53
,442
Bhad
rach
alam
(CT)
50,0
87
Kanu
ru (C
T)49
,006
Goo
ty (C
T)48
,658
Faro
oqna
gar
(CT)
45,6
75
Dow
lesw
aram
(CT)
44,6
37
Jaw
ahar
naga
r (C
T)44
,562
Akk
aram
palle
(CT)
44,2
19
Bodu
ppal
(CT)
43,6
92
Mah
abub
abad
(CT)
42,8
51
Bhup
alpa
lle (C
T)42
,387
Pile
ru (C
T)41
,489
Pedd
apal
le (C
T)41
,171
Sidd
ipet
(CT)
40,7
07
Beth
amch
erla
(CT)
38,9
94
Veta
pale
m (C
T)38
,671
Tow
n N
ame
Popu
latio
nTi
rupa
ti (N
MA
) (CT
)37
,968
Kani
giri
(U) (
CT)
37,4
20
Am
men
apur
(CT)
36,4
52
Med
chal
(CT)
35,6
11
Ura
vako
nda
(CT)
35,5
65
Gid
dalu
ru (C
T)35
,150
Bolla
ram
(CT)
34,6
67
Yena
mal
akud
uru
(CT)
34,1
77
Nar
sipa
tnam
(CT)
33,7
57
Vem
ulaw
ada
(R) (
CT)
33,7
06
Kond
apal
le (C
T)33
,373
Bade
palle
(CT)
32,5
98
Peer
zadg
uda
(CT)
32,5
86
Sham
shab
ad (C
T)32
,583
Yerr
agun
tla (C
T)32
,574
Kyth
ampa
lle (C
T)32
,385
Kaly
andu
rg (C
T)32
,328
Mee
rpet
(CT)
32,0
13
Nas
pur
(CT)
31,2
44
Podi
li (C
T)31
,145
Nar
sam
pet (
CT)
30,9
63
Chira
la (C
T)30
,858
Nag
aram
(CT)
30,5
02
Kakk
alap
alle
(CT)
30,1
28
Dev
arak
onda
(CT)
29,7
31
Ibra
him
patn
am (C
T)29
,432
Nak
reka
l (CT
)29
,126
Tekk
ali (
CT)
28,6
31
Bans
wad
a (C
T)28
,384
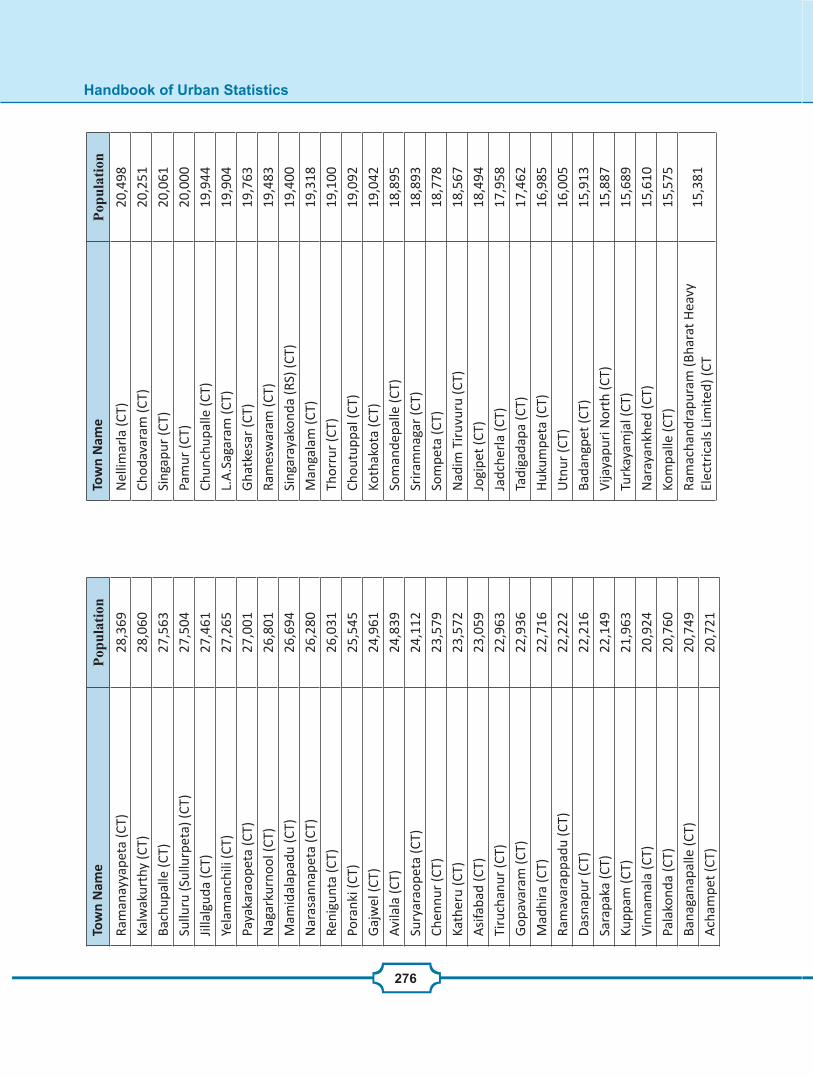
Handbook of Urban Statistics
276
Tow
n N
ame
Popu
latio
nRa
man
ayya
peta
(CT)
28,3
69
Kalw
akur
thy
(CT)
28,0
60
Bach
upal
le (C
T)27
,563
Sullu
ru (S
ullu
rpet
a) (C
T)27
,504
Jilla
lgud
a (C
T)27
,461
Yela
man
chili
(CT)
27,2
65
Paya
kara
opet
a (C
T)27
,001
Nag
arku
rnoo
l (CT
)26
,801
Mam
idal
apad
u (C
T)26
,694
Nar
asan
nape
ta (C
T)26
,280
Reni
gunt
a (C
T)26
,031
Pora
nki (
CT)
25,5
45
Gaj
wel
(CT)
24,9
61
Avila
la (C
T)24
,839
Sury
arao
peta
(CT)
24,1
12
Chen
nur
(CT)
23,5
79
Kath
eru
(CT)
23,5
72
Asi
faba
d (C
T)23
,059
Tiru
chan
ur (C
T)22
,963
Gop
avar
am (C
T)22
,936
Mad
hira
(CT)
22,7
16
Ram
avar
appa
du (C
T)22
,222
Das
napu
r (C
T)22
,216
Sara
paka
(CT)
22,1
49
Kupp
am (C
T)21
,963
Vinn
amal
a (C
T)20
,924
Pala
kond
a (C
T)20
,760
Bana
gana
palle
(CT)
20,7
49
Ach
ampe
t (CT
)20
,721
Tow
n N
ame
Popu
latio
nN
ellim
arla
(CT)
20,4
98
Chod
avar
am (C
T)20
,251
Sing
apur
(CT)
20,0
61
Pam
ur (C
T)20
,000
Chun
chup
alle
(CT)
19,9
44
L.A
.Sag
aram
(CT)
19,9
04
Gha
tkes
ar (C
T)19
,763
Ram
esw
aram
(CT)
19,4
83
Sing
aray
akon
da (R
S) (C
T)19
,400
Man
gala
m (C
T)19
,318
Thor
rur
(CT)
19,1
00
Chou
tupp
al (C
T)19
,092
Koth
akot
a (C
T)19
,042
Som
ande
palle
(CT)
18,8
95
Srira
mna
gar
(CT)
18,8
93
Som
peta
(CT)
18,7
78
Nad
im T
iruv
uru
(CT)
18,5
67
Jogi
pet (
CT)
18,4
94
Jadc
herl
a (C
T)17
,958
Tadi
gada
pa (C
T)17
,462
Huk
umpe
ta (C
T)16
,985
Utn
ur (C
T)16
,005
Bada
ngpe
t (CT
)15
,913
Vija
yapu
ri N
orth
(CT)
15,8
87
Turk
ayam
jal (
CT)
15,6
89
Nar
ayan
khed
(CT)
15,6
10
Kom
palle
(CT)
15,5
75
Ram
acha
ndra
pura
m (B
hara
t Hea
vy
Elec
tric
als
Lim
ited)
(CT
15,3
81

Annexure-1: Directory of Urban Centers in the Country with Population (2011)
277
Tow
n N
ame
Popu
latio
nM
oram
pudi
(CT)
15,3
46
Ana
ntap
ur (C
T)15
,247
Yada
giri
gutt
a (C
T)15
,232
Cum
bum
(CT)
15,1
69
Yella
redd
y (C
T)14
,923
Chee
puru
palle
(CT)
14,8
47
Kank
ipad
u (C
T)14
,616
Dor
naka
l (CT
)14
,425
Koth
aval
asa
(CT)
14,3
21
Banu
muk
kala
(CT)
14,3
07
Nar
ayan
apur
am (C
T)14
,227
Pras
adam
padu
(CT)
13,9
41
Papa
mpe
ta (C
T)13
,850
Bhim
aram
(CT)
13,8
41
Chity
ala
(CT)
13,7
52
Thim
map
ur (C
T)13
,485
Dun
diga
l (CT
)13
,465
Laxm
idev
ipal
le (C
T)13
,442
Enum
amul
a (C
T)13
,183
Gor
reku
nta
(CT)
13,1
59
Poch
ampa
lle (C
T)12
,972
Peda
Bod
depa
lle (C
T)12
,781
Koth
apet
(CT)
12,7
40
Band
lagu
da (J
agir
) (CT
)12
,734
Gha
npur
(Sta
tion)
(CT)
12,7
21
Teeg
alpa
had
(CT)
12,6
56
Pond
uru
(CT)
12,6
40
Balle
palle
(CT)
12,5
30
Thum
mal
amen
ta (C
T)12
,373
Tow
n N
ame
Popu
latio
nIc
hoda
(CT)
12,3
58
Ibra
him
patn
am (B
agat
h) (C
T)12
,349
Nag
iredd
ipal
le (C
T)12
,318
Atm
akur
(CT)
12,2
97
Eddu
mai
lara
m (C
T)11
,759
Dha
rmar
am (P
.B) (
CT)
11,5
37
Poth
redd
ipal
le (C
T)11
,514
Kam
alap
uram
(CT)
11,4
93
Band
arul
anka
(CT)
11,4
70
Mod
amee
dipa
lle (C
T)11
,397
Luxe
ttipe
t (CT
)11
,322
Alli
pur
(CT)
11,2
76
Nar
ayan
avan
am (C
T)11
,253
Gun
tupa
lle (C
T)11
,187
Peru
r (C
T)11
,127
Buja
Buj
a N
ello
re (C
T)10
,927
Chan
dur
(CT)
10,8
80
Med
ipal
le (C
T)10
,787
Yenu
gond
a (C
T)10
,611
Koth
ur (C
T)10
,519
Yenu
mal
apal
le (C
T)10
,482
Ram
anna
peta
(CT)
10,2
02
Gav
arav
aram
(CT)
10,0
29
Ram
pach
odav
aram
(CT)
9,95
2
Mud
danu
r (C
T)9,
775
Dev
apur
(CT)
9,68
3
Kond
amal
lapa
lle (C
T)9,
683
Thal
lapa
lle (C
T)9,
656
Nar
sing
i (CT
)9,
449

Handbook of Urban Statistics
278
Tow
n N
ame
Popu
latio
nJa
llara
m (C
T)9,
329
Boy
apal
le (C
T)9,
247
Bhan
ur (C
T)9,
203
Bala
ga (C
T)9,
071
Gud
ivad
a (C
T)8,
787
Mut
hang
i (CT
)8,
777
Kadi
piko
nda
(CT)
8,68
5
Dom
mar
anan
dyal
(CT)
8,33
7
Bibi
naga
r (C
T)8,
320
Isna
pur
(CT)
8,27
6
Tang
ella
mud
i CT)
8,25
0
Sani
vara
pupe
ta (C
T)8,
142
Man
gasa
mud
ram
(CT)
8,11
3
Chin
tapa
lle (C
T)7,
888
Yerr
abal
em (C
T)7,
803
Tiru
mal
a (C
T)7,
741
Tang
apur
(CT)
7,70
4
Reku
rthy
(CT)
7,62
6
Nak
kapa
lle (C
T)7,
603
Pala
kurt
hy (C
T)7,
380
Kism
atpu
r (C
T)7,
288
Mul
agun
tapa
du (C
T)7,
145
Che
nnam
ukka
palle
(CT)
7,06
5
Ann
aram
(CT)
6,84
0
Soan
pet (
CT)
6,82
0
Mor
agud
i (CT
)6,
812
Mur
akam
batt
u (C
T)6,
812
Osm
ania
Uni
vers
ity (C
T)6,
762
Kant
abam
sugu
da (C
T)6,
714
Tow
n N
ame
Popu
latio
nVe
para
la (C
T)6,
712
Nav
andg
i (CT
)6,
711
Nar
sapu
r (C
T)6,
647
Ram
apur
am (C
T)6,
614
Bont
hapa
lle (C
T)6,
608
Hira
man
dala
m (C
T)6,
603
Satr
ampa
du (C
T)6,
393
Chid
iga
(CT)
6,36
5
Jain
oor
(CT)
6,34
2
Mam
noor
(CT)
6,31
9
Gar
imel
lapa
du (C
T)6,
296
Vadd
esw
aram
(CT)
6,27
5
Shiv
unip
alle
(CT)
6,24
2
Shan
kara
mpe
t (A
) (CT
)6,
227
Cher
lopa
lle (C
T)6,
143
Tada
Kha
ndri
ka (C
T)6,
123
Kana
paka
(CT)
5,96
0
Chin
tala
vala
sa (C
T)5,
921
Jarj
apup
eta
(CT)
5,76
1
Cheg
unta
(CT)
5,74
7
Gaj
apat
hina
gara
m (C
T)5,
687
Chin
nach
inta
kunt
a (C
T)5,
637
Chitk
ul (C
T)5,
596
Dw
arak
atiru
mal
a (C
T)5,
543
Om
erkh
an D
aira
(CT)
5,34
9
Mal
iche
rla
(CT)
5,22
9
Gha
npur
(CT)
5,18
2
Man
gam
peta
(CT)
5,17
5
Kasi
pet (
CT)
5,13
3

Annexure-1: Directory of Urban Centers in the Country with Population (2011)
279
Tow
n N
ame
Popu
latio
nA
rem
pudi
(CT)
5,07
3
Bow
luva
da (C
T)5,
001
Tum
mik
apal
le (C
T)4,
911
Upp
er S
ileru
Pro
ject
Si
te C
amp
(CT)
4,63
2
Vatw
arla
palle
(CT)
4,54
4
Mul
akud
du (C
T)4,
513
Ragh
unat
hpur
(CT)
4,00
8
Ratn
apur
(CT)
3,15
4
Karn
atak
a
BBM
P (M
. Cor
p.)
8,44
3,67
5
Hub
li-D
harw
ad (M
Cor
p.)
943,
788
Mys
ore
(M C
orp.
)89
3,06
2
Gul
barg
a (M
Cor
p.)
533,
587
Man
galo
re (M
Cor
p.)
488,
968
Belg
aum
(M C
orp.
)48
8,15
7
Dav
anag
ere
(M C
orp.
)43
4,97
1
Bella
ry (M
Cor
p.)
410,
445
Hatti
Gol
d M
ines
(NA
C)13
,536
Gok
ak F
alls
(NAC
)8,
080
Bhim
aray
anag
udi (
NAC
)8,
029
Shah
abad
ACC
(NAC
)5,
027
Kudr
emuk
h (N
AC)
2,24
1
Gan
gaw
ati (C
MC)
105,
529
Mul
baga
l (TM
C)57
,276
Hos
akot
e (T
MC)
56,9
80
Hir
iyur
(TM
C)56
,416
Chal
lake
re (T
MC)
55,1
94
Kana
kapu
ra (T
MC)
54,0
14
Tow
n N
ame
Popu
latio
nU
llal (
TMC)
53,7
73
Shah
pur
(TM
C)53
,366
Putt
ur (T
MC)
53,0
61
Siru
gupp
a (T
MC)
52,4
92
Mud
hol (
TMC)
52,1
99
Shor
apur
(TM
C)51
,398
Ars
iker
e (T
MC)
51,3
36
Sidl
agha
tta
(TM
C)51
,159
Hun
sur
(TM
C)50
,865
Nan
jang
ud (T
MC)
50,5
98
Bail
Hon
gal (
TMC)
49,1
82
Har
apan
ahal
li (T
MC)
47,0
39
Man
vi (T
MC)
46,4
65
Athn
i (TM
C)45
,858
Bang
arap
et (T
MC)
44,8
49
Hom
naba
d (T
MC)
44,4
83
Ane
kal (
TMC)
44,2
60
Ala
nd (T
MC)
42,3
71
Saun
datti
-Yel
lam
ma
(TM
C)41
,215
Sava
nur
(TM
C)40
,567
Bhal
ki (T
MC)
40,3
33
Bant
val (
TMC)
40,1
55
Mal
ur (T
MC)
40,0
50
Seda
m (T
MC)
39,3
41
Kam
pli (
TMC)
39,3
07
Chan
nara
yapa
tna
(TM
C)38
,792
Chik
odi (
TMC)
38,3
07
Indi
(TM
C)38
,217
Wad
i (TM
C)37
,988
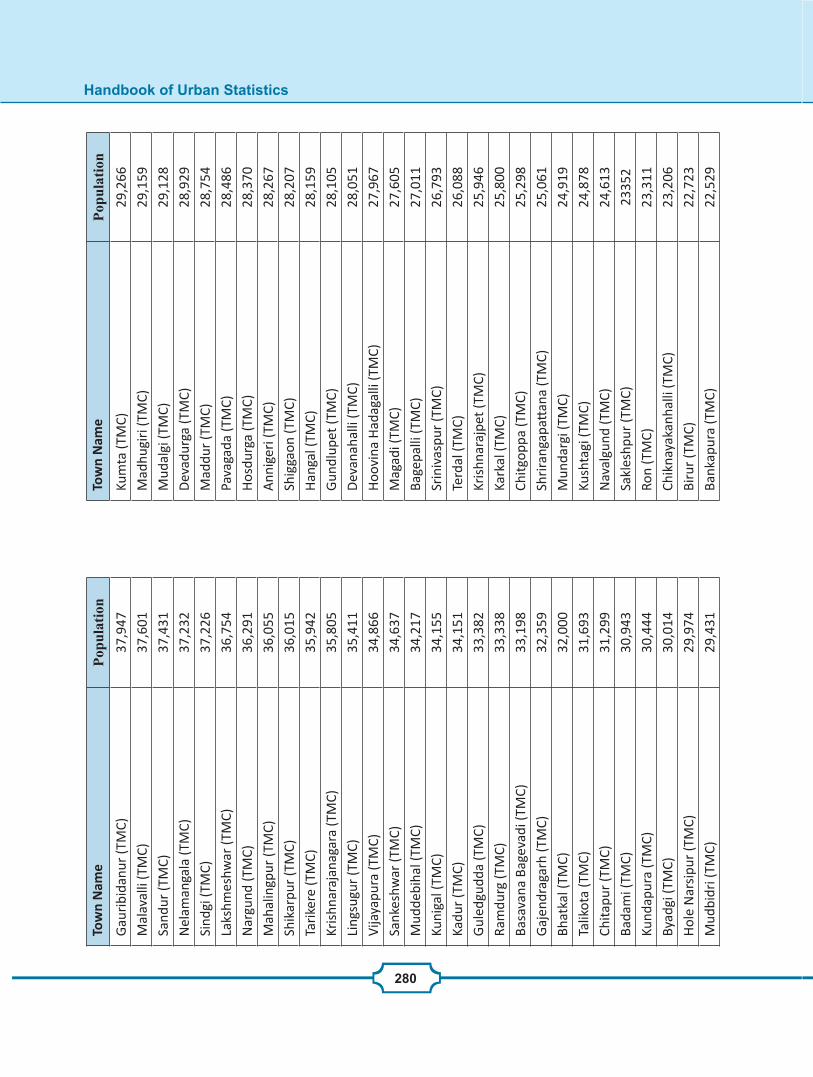
Handbook of Urban Statistics
280
Tow
n N
ame
Popu
latio
nG
auri
bida
nur
(TM
C)37
,947
Mal
aval
li (T
MC)
37,6
01
Sand
ur (T
MC)
37,4
31
Nel
aman
gala
(TM
C)37
,232
Sind
gi (T
MC)
37,2
26
Laks
hmes
hwar
(TM
C)36
,754
Nar
gund
(TM
C)36
,291
Mah
alin
gpur
(TM
C)36
,055
Shik
arpu
r (T
MC)
36,0
15
Tari
kere
(TM
C)35
,942
Kris
hnar
ajan
agar
a (T
MC)
35,8
05
Ling
sugu
r (T
MC)
35,4
11
Vija
yapu
ra (T
MC)
34,8
66
Sank
eshw
ar (T
MC)
34,6
37
Mud
debi
hal (
TMC)
34,2
17
Kuni
gal (
TMC)
34,1
55
Kadu
r (T
MC)
34,1
51
Gul
edgu
dda
(TM
C)33
,382
Ram
durg
(TM
C)33
,338
Basa
vana
Bag
evad
i (TM
C)33
,198
Gaj
endr
agar
h (T
MC)
32,3
59
Bhat
kal (
TMC)
32,0
00
Talik
ota
(TM
C)31
,693
Chita
pur
(TM
C)31
,299
Bada
mi (
TMC)
30,9
43
Kund
apur
a (T
MC)
30,4
44
Byad
gi (T
MC)
30,0
14
Hol
e N
arsi
pur
(TM
C)29
,974
Mud
bidr
i (TM
C)29
,431
Tow
n N
ame
Popu
latio
nKu
mta
(TM
C)29
,266
Mad
hugi
ri (T
MC)
29,1
59
Mud
algi
(TM
C)29
,128
Dev
adur
ga (T
MC)
28,9
29
Mad
dur
(TM
C)28
,754
Pava
gada
(TM
C)28
,486
Hos
durg
a (T
MC)
28,3
70
Ann
iger
i (TM
C)28
,267
Shig
gaon
(TM
C)28
,207
Han
gal (
TMC)
28,1
59
Gun
dlup
et (T
MC)
28,1
05
Dev
anah
alli
(TM
C)28
,051
Hoo
vina
Had
agal
li (T
MC)
27,9
67
Mag
adi (
TMC)
27,6
05
Bage
palli
(TM
C)27
,011
Srin
ivas
pur
(TM
C)26
,793
Terd
al (T
MC)
26,0
88
Kris
hnar
ajpe
t (TM
C)25
,946
Kark
al (T
MC)
25,8
00
Chitg
oppa
(TM
C)25
,298
Shri
rang
apatt
ana
(TM
C)25
,061
Mun
darg
i (TM
C)24
,919
Kush
tagi
(TM
C)24
,878
Nav
algu
nd (T
MC)
24,6
13
Sakl
eshp
ur (T
MC)
2335
2
Ron
(TM
C)23
,311
Chik
naya
kanh
alli
(TM
C)23
,206
Biru
r (T
MC)
22,7
23
Bank
apur
a (T
MC)
22,5
29

Annexure-1: Directory of Urban Centers in the Country with Population (2011)
281
Tow
n N
ame
Popu
latio
nBe
lur
(TM
C)22
,484
Bann
ur (T
MC)
21,8
96
Afz
alpu
r (T
P)27
,088
Kudl
igi (
TP)
26,6
80
Kott
uru
(TP)
26,2
89
Tekk
alak
ote
(TP)
26,2
24
Jeva
rgi (
TP)
25,6
86
Kam
alap
uram
(TP)
25,5
52
Hal
iyal
(TP)
24,2
38
Sada
lgi (
TP)
23,7
90
Kudc
hi (T
P)23
,154
Huk
eri (
TP)
22,9
88
Mud
gal (
TP)
22,7
31
Chan
nagi
ri (T
P)21
,313
Chin
chol
i (TP
)20
,897
Hun
gund
(TP)
20,8
77
Gur
mat
kal (
TP)
20,6
14
Yella
pur
(TP)
20,4
52
Pand
avap
ura
(TP)
20,3
99
Suly
a (T
P)19
,958
Aur
ad (T
P)19
,849
Keru
r (T
P)19
,731
Konn
ur (T
P)19
,386
Khan
apur
(TP)
19,3
09
Hire
keru
r (T
P)19
,191
Hon
avar
(TP)
19,1
09
Mun
dgod
(TP)
18,8
66
Mul
gund
(TP)
18,7
63
Rayb
ag (T
P)18
,736
Tow
n N
ame
Popu
latio
nKu
ndgo
l (TP
)18
,726
Gub
bi (T
P)18
,446
Hon
nali
(TP)
17,9
28
Bilg
i (TP
)17
,792
Nag
aman
gala
(TP)
17,7
76
Shir
hatti
(TP)
17,6
10
Mul
ki (T
P)17
,274
Jaga
lur
(TP)
17,2
57
Vira
jpet
(TP)
17,2
46
Aln
avar
(TP)
17,2
28
Kalg
hatg
i (TP
)16
,917
Sira
lkop
pa (T
P)16
,864
Ark
algu
d (T
P)16
,810
Nar
egal
(TP)
16,6
90
Piri
yapa
tna
(TP)
16,6
85
Mol
akal
mur
u (T
P)15
,797
Hol
alke
re (T
P)15
,783
Kush
alna
gar
(TP)
15,3
26
Ank
ola
(TP)
15,3
09
Kora
tage
re (T
P)15
,265
Salig
ram
(TP)
15,1
23
Yelb
arga
(TP)
14,8
14
Tirt
haha
lli (T
P)14
,528
Heg
gada
deva
nkot
e (T
P)14
,313
Sidd
apur
(TP)
14,2
04
Turu
veke
re (T
P)14
,194
Sara
gur
(TP)
11,4
25
Sora
b (T
P)11
,332
Han
ur (T
P)11
,066

Handbook of Urban Statistics
282
Tow
n N
ame
Popu
latio
nJo
g Ka
rgal
(TP)
10,8
47
Tiru
mak
udal
Nar
sipu
r (T
P)9,
980
Mud
iger
e (T
P)9,
677
Gud
iban
da (T
P)9,
441
Yela
ndur
(TP)
8,77
9
Belta
ngad
i (TP
)7,
746
Nar
asim
hara
japu
ra (T
P)7,
458
Som
varp
et (T
P)6,
729
Alu
r (T
P)6,
541
Hos
anag
ara
(TP)
5,83
9
Kopp
a (T
P)4,
993
Srin
geri
(TP)
3,92
2
Bija
pur
(CM
C)32
7,42
7
Shim
oga
(CM
C)32
2,65
0
Tum
kur
(CM
C)30
2,14
3
Raic
hur
(CM
C)23
4,07
3
Bida
r (C
MC)
214,
373
Hos
pet (
CMC)
206,
167
Gad
ag-B
etige
ri (C
MC)
172,
612
Bhad
rava
ti (C
MC)
151,
102
Robe
rtso
n Pe
t (CM
C)14
3,23
3
Chitr
adur
ga (C
MC)
140,
206
Kola
r (C
MC)
138,
462
Man
dya
(CM
C)13
7,35
8
Has
san
(CM
C)13
3,43
6
Udu
pi (C
MC)
125,
306
Chik
mag
alur
(CM
C)11
8,40
1
Baga
lkot
(CM
C)11
1,93
3
Rani
benn
ur (C
MC)
106,
406
Tow
n N
ame
Popu
latio
nRa
man
agar
a (C
MC)
95,1
67
Dod
Bal
lapu
r (C
MC)
84,6
42
Gok
ak (C
MC)
79,1
21
Har
ihar
(CM
C)77
,447
Rabk
avi B
anha
tti (C
MC)
77,0
04
Chin
tam
ani (
CMC)
76,0
68
Sind
hnur
(CM
C)75
,837
Yadg
ir (C
MC)
74,2
94
Chan
napa
tna
(CM
C)71
,942
Kopp
al (C
MC)
70,6
98
Cham
araj
anag
ar (C
MC)
69,8
75
Basa
vaka
lyan
(CM
C)69
,717
Jam
khan
di (C
MC)
68,9
38
Hav
eri (
CMC)
67,1
02
Karw
ar (C
MC)
63,7
55
Chik
kaba
llapu
ra (C
MC)
63,6
52
Sirs
i (CM
C)62
,882
Nip
ani
(CM
C)62
,865
Ilkal
(CM
C)60
,242
Tipt
ur (C
MC)
59,5
43
Sira
(CM
C)57
,554
Kolle
gal (
CMC)
57,1
49
Saga
r (C
MC)
54,5
50
Dan
deli
(CM
C)52
,069
Shah
abad
(CM
C)47
,582
Mad
iker
i (CM
C)33
,381
Belg
aum
Can
tonm
ent (
CB)
19,4
11
Heb
bago
di (C
T)34
,827
Som
eshw
ar (C
T)24
,066

Annexure-1: Directory of Urban Centers in the Country with Population (2011)
283
Tow
n N
ame
Popu
latio
nH
inka
l (CT
)23
,162
Kure
kupp
a (C
T)22
,560
Kona
ppan
a A
grah
ara
(CT)
20,6
22
Attibe
le (C
T)20
,532
Hut
agal
li (C
T)18
,308
Mac
hche
(CT)
18,0
73
Saty
aman
gala
(CT)
18,0
02
Peer
anw
adi (
CT)
17,8
74
Vitt
al (C
T)17
,618
Shak
tinag
ar (C
T)17
,088
Jigan
i (CT
)17
,036
Kote
kara
(CT)
16,5
05
Hatti
(CT)
16,2
78
Kam
atgi
(CT)
15,6
20
Bom
mas
andr
a (C
T)15
,254
Am
inag
ad (C
T)15
,073
Chik
kaba
nava
ra (C
T)14
,409
Hul
iyar
(CT)
14,3
04
Byra
pura
(CT)
14,2
76
Kaka
ti (C
T)13
,946
Hin
dalg
i (CT
)13
,741
Pudu
(CT)
13,5
33
Hun
sam
aran
ahal
li (C
T)13
,389
Sam
bra
(CT)
13,1
59
Dom
mas
andr
a (C
T)12
,610
Mad
anai
yaka
naha
lli (C
T)12
,563
Vadd
u (C
T)12
,453
Gud
ur (C
T)11
,969
Udy
avar
a (C
T)11
,854
Tow
n N
ame
Popu
latio
nYe
llur
(CT)
11,8
50
Sarj
apur
a (C
T)11
,807
Nad
sal (
CT)
11,6
11
Chik
kabi
dara
kallu
(CT)
11,5
54
Kona
je (C
T)11
,368
Srira
mpu
ra (C
T)11
,234
Bena
kana
halli
(CT)
10,9
99
Jali
(CT)
10,8
02
Ara
sina
kunt
e (C
T)10
,567
Kang
rali
(BK)
(CT)
10,4
96
Beth
aman
gala
(CT)
10,4
13
Man
jana
dy (C
T)10
,401
Kam
alna
gar
(CT)
10,2
52
Kote
shw
ar (C
T)10
,229
Kum
bala
godu
(CT)
10,1
78
Alli
pura
(CT)
9,93
0
Bida
di (C
T)9,
917
Elw
ala
(CT)
9,82
6
Bajp
e (C
T)9,
701
Tala
pady
(CT)
9,53
2
Bada
gabe
ttu
No.
80 (C
T)9,
309
Kudu
r (C
T)9,
114
Hon
galli
(CT)
9,07
4
Bhog
adi (
CT)
9,04
1
Mun
nur
(CT)
8,91
9
Mun
nuru
(CT)
8,86
4
Mou
je N
andg
ad (C
T)8,
837
Mar
agon
daha
lli (C
T)8,
824
Mun
iraba
d Pr
ojec
t Are
a (C
T)8,
672

Handbook of Urban Statistics
284
Tow
n N
ame
Popu
latio
nBe
lvat
a (C
T)8,
605
Sule
bhav
i (CT
)8,
503
Gon
ikop
pal (
CT)
8,30
6
Kang
rali
(KH
) (CT
)8,
204
Mud
ushe
dde
(CT)
8,15
5
Bada
(CT)
8,11
7
Base
ttiha
lli (C
T)7,
943
Tons
e Ea
st (C
T)7,
911
Upp
inan
gady
(CT)
7,81
3
Nar
ikom
bu (C
T)7,
800
Mal
lar
(CT)
7,76
5
Mut
ga (C
T)7,
561
Gog
ipet
h (C
T)7,
544
Thok
ur-6
2 (C
T)7,
433
Talip
ady
(CT)
7,23
7
Koor
galli
(CT)
7,06
5
Bada
gaul
ipad
y (C
T)7,
062
Kodi
yal (
CT)
7,06
1
Kuve
ttu
(CT)
7,04
1
Ady
ar (C
T)7,
034
Venk
atap
ura
(CT)
6,92
8
Sano
or (C
T)6,
881
Har
ekal
a (C
T)6,
814
Vara
mba
lli (C
T)6,
809
Don
imal
ai T
owns
hip
(CT)
6,67
2
Kadi
gena
halli
(CT)
6,58
7
Shra
vana
belg
ola
(CT)
6,48
5
Kurg
unta
(CT)
6,47
2
Belm
a (C
T)6,
452
Tow
n N
ame
Popu
latio
nKa
dako
la (C
T)6,
436
Mel
laha
lli (C
T)6,
393
Ale
voor
(CT)
6,30
2
Kaw
alett
u (C
T)6,
265
Chik
kaja
jur
(CT)
6,23
6
Thum
be (C
T)6,
230
Tenk
anid
yoor
(CT)
6,18
8
Lond
a (C
T)5,
956
Chel
ur (C
T)5,
911
Mat
adak
urub
arah
atti (C
T)5,
884
Bond
athi
la (C
T)5,
858
Sajip
anad
u (C
T)5,
847
Kaira
ngal
a (C
T)5,
788
Mud
uper
ar (C
T)5,
686
Kola
mbe
(CT)
5,59
2
Nee
rmar
ga (C
T)5,
503
Mul
ur (C
T)5,
445
Said
apur
(CT)
5,43
2
Add
ur (C
T)5,
426
Bobr
uwad
a (C
T)5,
409
Nav
oor
(CT)
5,36
5
Gar
gesw
ari (
CT)
5,34
3
Kenj
ar (C
T)5,
338
Ark
ula
(CT)
5,07
7
Moo
dabe
ttu
(CT)
5,01
8
Yena
gudd
e (C
T)5,
017
Man
ipur
a (C
T)5,
001
Kora
ngra
pady
(CT)
4,94
4
52 H
eroo
r (C
T)4,
778

Annexure-1: Directory of Urban Centers in the Country with Population (2011)
285
Tow
n N
ame
Popu
latio
nKa
riya
ngal
a (C
T)4,
698
Har
alap
ura
(CT)
4,65
5
Har
alah
alli
(CT)
4,47
6
Kadw
ad (C
T)4,
403
Aver
sa (C
T)4,
286
Tatti
lli (M
undg
od) (
CT)
3,67
0
Am
bika
naga
ra (C
T)3,
556
Am
arav
athi
(CT)
2,62
8
Adi
tyap
atna
(CT)
2,62
3
Goa
Pana
ji (M
Cor
p.)
40,0
17
Mor
mug
ao (M
Cl)
94,3
93
Mar
gao
(M C
l)87
,650
Map
usa
(M C
l)39
,989
Curc
hore
m-C
acor
a (M
Cl)
22,7
30
Pond
a (M
Cl)
22,6
64
Bich
olim
(M C
l)16
,986
Cunc
olim
(M C
l)16
,623
Sanq
uelim
(M C
l)13
,651
Cana
cona
(M C
l)12
,434
Valp
oi (M
Cl)
8,53
2
Sang
uem
(M C
l)6,
444
Pern
em (M
Cl)
5,02
1
Sanc
oale
(CT)
21,9
23
Curti
(CT)
16,3
85
Dav
orlim
(CT)
15,3
50
Penh
a-de
-Fra
nca
(CT)
15,3
42
Chim
bel (
CT)
15,2
89
Que
pem
(M C
l)14
,795
Tow
n N
ame
Popu
latio
nCa
lapo
r (C
T)14
,077
Cala
ngut
e (C
T)13
,810
Soco
rro
(CT)
12,9
08
Curt
orim
(CT)
12,8
86
Band
ora
(CT)
12,7
22
Usg
ao (C
T)12
,436
Nav
elim
(CT)
12,3
23
Bena
ulim
(CT)
11,9
19
Siol
im (C
T)10
,936
Raia
(CT)
10,7
06
Sao
Jose
de
Are
al (C
T)10
,229
Anj
una
(CT)
9,63
6
Nuv
em (C
T)9,
288
Cort
alim
(CT)
9,08
0
Cand
olim
(CT)
8,50
0
Man
drem
(CT)
8,33
6
Bori
m (C
T)8,
257
Prio
l (CT
)8,
164
Reis
Mag
os (C
T)8,
053
Mur
da (C
T)7,
517
Xeld
em (C
T)7,
434
Chic
alim
(CT)
6,93
3
Chin
chin
im (C
T)6,
908
Bam
bolim
(CT)
6,88
5
Que
la (C
T)6,
852
Mor
jim (C
T)6,
760
Vern
a (C
T)6,
632
Corl
im (C
T)6,
568
Aqu
em (C
T)6,
511

Handbook of Urban Statistics
286
Tow
n N
ame
Popu
latio
nSa
lvad
or d
o M
undo
(CT)
6,37
3
Salig
ao (C
T)6,
280
Ald
ona
(CT)
6,27
0
Mar
caim
(CT)
6,21
5
Pale
(CT)
6,04
3
Ond
a (C
T)5,
863
Pile
rne
(CT)
5,82
7
Cara
pur
(CT)
5,50
0
Varc
a (C
T)5,
439
Cand
ola
(CT)
5,35
4
Ara
mbo
l (CT
)5,
322
Sanv
orde
m (C
T)5,
103
Ner
ul (C
T)5,
042
Gui
rim
(CT)
5,03
6
Mer
curi
m (C
T)4,
970
Cum
barj
ua (C
T)4,
917
Colv
ale
(CT)
4,81
8
Parc
em (C
T)4,
627
Org
ao (C
T)4,
602
Goa
Vel
ha (C
T)4,
322
Moi
ra (C
T)4,
299
Jua
(CT)
4,13
4
Laks
hadw
eep
Kava
ratti
(CT)
11,2
10
And
rott
(CT)
11,1
91
Min
icoy
(CT)
10,4
47
Am
ini (
CT)
7,66
1
Kadm
at (C
T)5,
404
Kalp
eni (
CT)
4,41
9
Tow
n N
ame
Popu
latio
nKe
rala
Thir
uvan
anth
apur
am (M
Cor
p.)
743,
691
Koch
i (M
Cor
p.)
602,
046
Kozh
ikod
e (M
Cor
p.)
431,
560
Kolla
m (M
Cor
p.)
348,
657
Thri
ssur
(M C
orp.
)31
5,95
7
Chal
akud
y (M
)49
,525
Ala
ppuz
ha (M
)17
4,17
6
Pala
kkad
(M)
130,
955
Man
jeri
(M)
97,1
02
Thal
asse
ry (M
)92
,558
Ponn
ani (
M)
90,4
91
Vada
kara
(M)
75,2
95
Kanh
anga
d (M
)73
,342
Talip
aram
ba (M
)72
,465
Payy
annu
r (M
)72
,111
Qui
land
y (M
)71
,873
Kala
mas
sery
(M)
71,0
38
Ney
yatti
nkar
a (M
)70
,850
Thri
ppun
ithur
a (M
)69
,390
Kaya
mku
lam
(M)
68,6
34
Mal
appu
ram
(M)
68,1
27
Ned
uman
gad
(M)
60,1
61
Kann
ur (M
)56
,823
Tiru
r (M
)56
,058
Kott
ayam
(M)
55,3
74
Kasa
rago
d (M
)54
,172
Kunn
amku
lam
(M)
54,0
71
Ott
appa
lam
(M)
53,7
92

Annexure-1: Directory of Urban Centers in the Country with Population (2011)
287
Tow
n N
ame
Popu
latio
nTh
iruv
alla
(M)
52,8
83
Thod
upuz
ha (M
)52
,045
Peri
ntha
lman
na (M
)49
,723
Chan
gana
sser
y (M
)47
,685
Matt
annu
r (M
)47
,078
Puna
lur
(M)
46,7
02
Cher
thal
a (M
)45
,827
Shor
anur
(M)
43,5
33
Vark
ala
(M)
40,0
48
Chav
akka
d (M
)39
,098
Koth
aman
gala
m (M
)38
,837
Path
anam
thitt
a (M
)37
,538
Atting
al (M
)37
,346
Para
voor
(M)
37,2
45
Kodu
ngal
lur
(M)
33,9
35
Ang
amal
y (M
)33
,465
Chitt
ur-T
hath
aman
gala
m (M
)32
,298
Kalp
etta
(M)
31,5
80
Para
vur
(M)
31,5
03
Muv
attup
uzha
(M)
30,3
97
Koot
hupa
ram
ba (M
)29
,619
Ado
or (M
)29
,171
Irin
jala
kuda
(M)
28,7
41
Peru
mba
voor
(M)
28,1
10
Mav
elik
kara
(M)
26,4
21
Chen
gann
ur (M
)23
,466
Vaik
om (M
)23
,234
Pala
i (M
)22
,056
Gur
uvay
oor
(M)
20,5
10
Tow
n N
ame
Popu
latio
nKa
nnur
Can
tonm
ent (
CB)
4,79
8
Edat
hala
(CT)
77,8
11
Beyp
ore
(CT)
69,7
52
Cher
uvan
nur
(CT)
61,6
14
Tiru
rang
adi (
CT)
56,6
32
Then
nala
(CT)
56,5
46
Moo
nniy
ur (C
T)55
,535
Palli
chal
(CT)
53,8
61
Vazh
akka
la (C
T)51
,242
Veng
ara
(CT)
48,6
00
Tana
lur
(CT)
47,9
76
Kunn
aman
gala
m (C
T)47
,396
Ala
ngad
(CT)
47,3
29
Vatti
yoor
kavu
(CT)
47,1
87
Kom
alap
uram
(CT)
47,1
26
Pal
likka
l (CT
)46
,962
Nila
mbu
r (C
T)46
,366
Chi
rakk
al (C
T)45
,601
Kodu
r (C
T)45
,459
Mar
adu
(CT)
44,7
04
Kott
amka
ra (C
T)44
,402
Kott
akka
l (CT
)44
,382
Ola
vann
a (C
T)43
,895
Pana
chik
kad
(CT)
43,5
95
Choo
rnik
kara
(CT)
43,2
07
Kott
uval
ly (C
T)42
,922
Kakk
odi (
CT)
42,8
66
Peru
mba
ikad
(CT)
42,8
39
Chav
ara
(CT)
42,6
55

Handbook of Urban Statistics
288
Tow
n N
ame
Popu
latio
nKu
mba
lang
y (C
T)42
,367
Abd
u Ra
him
an N
agar
(CT)
41,9
93
Thri
kkov
ilvatt
om (C
T)41
,609
Kuda
ppan
akku
nnu
(CT)
41,5
83
Pira
yiri
(CT)
41,3
59
Kann
aman
gala
m (C
T)41
,260
Trip
rang
ode
(CT)
41,1
67
Thott
ada
(CT)
40,8
18
Kalli
yoor
(CT)
40,8
16
Athi
yann
ur (C
T)40
,712
Chel
annu
r (C
T)40
,697
Nan
nam
bra
(CT)
40,5
43
Kula
thum
mal
(CT)
40,4
48
Athi
ram
puzh
a (C
T)40
,438
Katti
ppar
uthi
(CT)
40,3
18
Peri
ngat
hur
(CT)
40,2
92
Nad
apur
am (C
T)40
,230
May
yana
d (C
T)40
,039
Kadu
ngal
loor
(CT)
39,6
66
Man
akun
nam
(CT)
39,5
38
Thri
kkad
avoo
r (C
T)39
,285
Aro
or (C
T)39
,214
Oth
ukku
ngal
(CT)
39,1
39
Natt
akam
(CT)
38,5
99
Chor
ode
(CT)
38,2
45
Thaz
huth
ala
(CT)
37,5
17
Met
hala
(CT)
37,5
05
Mal
ayin
keez
hu (C
T)37
,350
Vazh
ayur
(CT)
36,9
09
Tow
n N
ame
Popu
latio
nKo
ottila
ngad
i (CT
)36
,602
Para
ppur
(CT)
36,2
70
Vila
ppil
(CT)
36,2
12
Ned
uva
(CT)
35,9
96
Veng
anoo
r (C
T)35
,963
Ram
anatt
ukar
a (C
T)35
,937
Mad
ayi (
CT)
35,8
88
Tala
kkad
(CT)
35,8
20
Kaip
aman
gala
m (C
T)35
,626
Peru
man
na (C
T)35
,460
Puzh
athi
(CT)
35,2
12
Peri
nad
(CT)
35,1
73
Papp
inis
seri
(CT)
35,1
34
Mar
anch
eri (
CT)
35,0
11
Peru
vallu
r (C
T)34
,941
Man
nark
ad-I
(CT)
34,8
39
Chem
anch
eri (
CT)
34,8
19
Eratt
upett
a (C
T)34
,814
Eram
ala
(CT)
34,6
58
Villi
appa
lly (C
T)34
,502
Aim
anam
(CT)
34,4
70
Kuru
vatt
ur (C
T)34
,241
Chel
ambr
a (C
T)34
,149
Para
ssal
a (C
T)34
,096
Elam
pallo
or (C
T)33
,959
Ala
mco
de (C
T)33
,918
Elay
avoo
r (C
T)33
,853
Eram
allo
or (C
T)33
,829
Thri
kkod
ithan
am (C
T)33
,819

Annexure-1: Directory of Urban Centers in the Country with Population (2011)
289
Tow
n N
ame
Popu
latio
nCh
ockl
i (CT
)33
,732
Puth
enve
likka
ra (C
T)33
,372
Aja
nur
(CT)
33,0
79
Veng
ola
(CT)
32,6
97
Edap
pal (
CT)
32,5
50
Ulli
yeri
(CT)
32,5
09
Man
nanc
hery
(CT)
32,1
39
Fero
ke (C
T)32
,122
Then
hipp
alam
(CT)
32,0
45
Vila
voor
kkal
(CT)
31,7
61
Than
neer
muk
kam
(CT)
31,5
25
Eloo
r (C
T)31
,468
Cher
iyam
unda
m (C
T)31
,212
Kalli
asse
ri (C
T)31
,122
Kadi
rur
(CT)
31,0
87
Puth
uppa
riya
ram
(CT)
30,8
95
Dha
rmad
om (C
T)30
,804
Kizh
uval
am-K
oont
hallo
r (C
T)30
,770
Vada
napp
ally
(CT)
30,6
57
Irim
biliy
am (C
T)30
,635
Cher
anal
lur
(CT)
30,5
94
Cher
ukav
u (C
T)30
,126
Azh
iyur
(CT)
30,0
23
Pool
acod
e (C
T)29
,872
Karu
mal
loor
(CT)
29,8
05
Kott
arak
kara
(CT)
29,7
88
Mav
oor
(CT)
29,7
81
Mee
nad
(CT)
29,7
16
Ned
umba
sser
y (C
T)29
,706
Tow
n N
ame
Popu
latio
nPu
thup
pally
(CT)
29,6
35
Kara
kula
m (C
T)29
,624
Chen
gam
anad
(CT)
29,5
76
Ned
umpa
na (C
T)29
,454
Poot
hakk
ulam
(CT)
29,4
47
Thal
akku
lath
ur (C
T)29
,388
Cher
utha
zham
(CT)
29,3
48
Am
ballu
r (C
T)29
,341
Koo
vapp
ady
(CT)
29,3
39
Che
ndam
anga
lam
(CT)
29,3
26
Vija
yapu
ram
(CT)
29,2
48
Kum
bala
m (C
T)29
,193
Ura
kam
(CT)
29,1
57
Pan
man
a (C
T)29
,008
Kon
dott
y (C
T)28
,794
Patt
ambi
(CT)
28,6
32
Hem
ambi
kana
gar
(CT)
28,5
92
Oac
hira
(CT)
28,4
12
Pal
lippu
ram
(CT)
28,2
76
Uliy
azha
thur
a (C
T)28
,230
Ath
oli (
CT)
28,2
13
Pal
likku
nnu
(CT)
27,8
20
Thr
ithal
a (C
T)27
,796
Per
uvay
al (C
T)27
,598
Ezh
upun
na (C
T)27
,528
Moo
thak
unna
m (C
T)27
,458
Pat
hira
ppal
ly (C
T)27
,445
Azh
oor
(CT)
27,3
90
Bal
usse
ri (C
T)27
,363
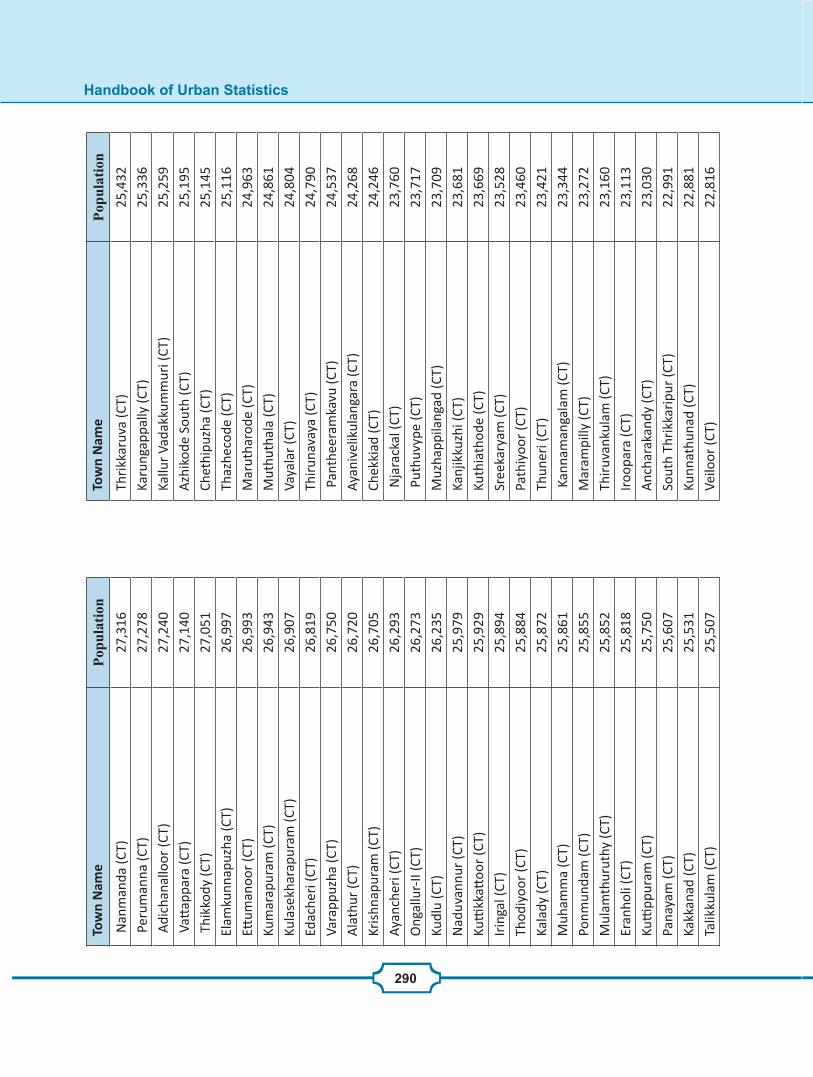
Handbook of Urban Statistics
290
Tow
n N
ame
Popu
latio
n N
anm
anda
(CT)
27,3
16
Per
uman
na (C
T)27
,278
Adi
chan
allo
or (C
T)27
,240
Vatt
appa
ra (C
T)27
,140
Thi
kkod
y (C
T)27
,051
Elam
kunn
apuz
ha (C
T)26
,997
Ettum
anoo
r (C
T)26
,993
Kum
arap
uram
(CT)
26,9
43
Kula
sekh
arap
uram
(CT)
26,9
07
Edac
heri
(CT)
26,8
19
Vara
ppuz
ha (C
T)26
,750
Ala
thur
(CT)
26,7
20
Kris
hnap
uram
(CT)
26,7
05
Ayan
cher
i (CT
)26
,293
Ong
allu
r-II
(CT)
26,2
73
Kudl
u (C
T)26
,235
Nad
uvan
nur
(CT)
25,9
79
Kutti
kkatt
oor
(CT)
25,9
29
Irin
gal (
CT)
25,8
94
Thod
iyoo
r (C
T)25
,884
Kala
dy (C
T)25
,872
Muh
amm
a (C
T)25
,861
Ponm
unda
m (C
T)25
,855
Mul
amth
urut
hy (C
T)25
,852
Eran
holi
(CT)
25,8
18
Kutti
ppur
am (C
T)25
,750
Pana
yam
(CT)
25,6
07
Kakk
anad
(CT)
25,5
31
Talik
kula
m (C
T)25
,507
Tow
n N
ame
Popu
latio
nTh
rikk
aruv
a (C
T)25
,432
Karu
ngap
pally
(CT)
25,3
36
Kallu
r Va
dakk
umm
uri (
CT)
25,2
59
Azh
ikod
e So
uth
(CT)
25,1
95
Chet
hipu
zha
(CT)
25,1
45
Thaz
heco
de (C
T)25
,116
Mar
utha
rode
(CT)
24,9
63
Mut
huth
ala
(CT)
24,8
61
Vaya
lar
(CT)
24,8
04
Thir
unav
aya
(CT)
24,7
90
Pan
thee
ram
kavu
(CT)
24,5
37
Ayan
ivel
ikul
anga
ra (C
T)24
,268
Chek
kiad
(CT)
24,2
46
Nja
rack
al (C
T)23
,760
Put
huvy
pe (C
T)23
,717
Muz
happ
ilang
ad (C
T)23
,709
Kanj
ikku
zhi (
CT)
23,6
81
Kuth
iath
ode
(CT)
23,6
69
Sree
kary
am (C
T)23
,528
Path
iyoo
r (C
T)23
,460
Thun
eri (
CT)
23,4
21
Kan
nam
anga
lam
(CT)
23,3
44
Mar
ampi
lly (C
T)23
,272
Thir
uvan
kula
m (C
T)23
,160
Iroo
para
(CT)
23,1
13
Anc
hara
kand
y (C
T)23
,030
Sout
h Th
rikk
arip
ur (C
T)22
,991
Kunn
athu
nad
(CT)
22,8
81
Veilo
or (C
T)22
,816

Annexure-1: Directory of Urban Centers in the Country with Population (2011)
291
Tow
n N
ame
Popu
latio
nA
riya
llur
(CT)
22,5
58
Palli
ppur
am (C
T)22
,512
Alu
va (M
)22
,428
Puth
encr
uz (C
T)22
,378
Pann
iyan
nur
(CT)
22,3
08
Adi
nad
(CT)
22,2
50
Azh
ikod
e N
orth
(CT)
22,1
28
Kizh
upar
amba
(CT)
22,0
62
Karu
vant
huru
thy
(CT)
21,9
52
Mul
avuk
ad (C
T)21
,833
Man
iyur
(CT)
21,8
20
Kalle
libha
gom
(CT)
21,7
23
Mun
deri
(CT)
21,6
76
Paip
pad
(CT)
21,3
38
Koda
mth
urut
h (C
T)21
,295
Nad
uvatt
om (C
T)21
,273
Kott
appa
lly (C
T)21
,169
Peri
njan
am (C
T)21
,012
Vada
kkum
thal
a (C
T)20
,993
Chel
ora
(CT)
20,9
52
Thai
katt
usse
ry (C
T)20
,874
Mut
huku
lam
(CT)
20,7
40
Kodu
vayu
r (C
T)20
,703
Padu
vila
yi (C
T)20
,598
Vada
kkek
ara
(CT)
20,5
71
Keez
hallu
r (C
T)20
,440
Pari
yara
m (C
T)20
,405
Puth
uppa
lly (C
T)20
,390
Kala
dy (C
T)20
,380
Tow
n N
ame
Popu
latio
nEd
avila
ngu
(CT)
20,3
63
Killa
nnur
(CT)
20,3
39
Patti
om (C
T)20
,161
Pudu
sser
y W
est (
CT)
20,1
40
Chep
pad
(CT)
20,0
52
Kand
allo
or (C
T)19
,925
Kanj
iram
kula
m (C
T)19
,902
Kola
vello
or (C
T)19
,817
Mok
eri (
CT)
19,6
84
Katt
anam
(CT)
19,5
04
Aro
okutt
y (C
T)19
,411
Punn
ayur
(CT)
19,3
87
Vakk
om (C
T)19
,267
Ezho
me
(CT)
19,2
61
Kott
ayam
- M
alab
ar (C
T)19
,176
Kadi
kkad
(CT)
19,1
47
Kart
hika
ppal
ly (C
T)19
,021
Kada
chira
(CT)
18,9
79
Kunh
iman
gala
m (C
T)18
,965
Matt
oor
(CT)
18,8
90
Kuru
mat
hur
(CT)
18,6
41
Man
gatti
dam
(CT)
18,6
27
Kann
apur
am (C
T)18
,459
Vazh
akul
am (C
T)18
,358
Nor
th T
hrik
kari
pur
(CT)
18,2
10
Pala
yad
(CT)
18,1
41
Koip
ady
(CT)
18,1
21
Nen
men
ikka
ra (C
T)18
,067
Kunn
umm
al (C
T)18
,031

Handbook of Urban Statistics
292
Tow
n N
ame
Popu
latio
nKa
ttur
(CT)
18,0
17
Path
iriy
ad (C
T)18
,008
Puth
unag
aram
(CT)
17,8
92
Man
alur
(CT)
17,7
57
Para
suva
ikka
l (CT
)17
,698
Kora
tty
(CT)
17,6
18
Kallu
r Th
ekku
mm
uri (
CT)
17,4
80
Pano
or (C
T)17
,438
Puth
ur (C
T)17
,430
Edak
kazh
iyur
(CT)
17,3
35
Iriv
eri (
CT)
17,2
31
Kola
cher
ry (C
T)17
,095
Chal
a (C
T)17
,088
Man
nar
(CT)
17,0
67
Kokk
otha
man
gala
m (C
T)17
,047
Erav
attur
(CT)
17,0
16
Vara
m (C
T)17
,008
Ong
allu
r-I (
CT)
16,9
98
Eruv
atti (C
T)16
,905
Chel
amatt
om (C
T)16
,844
Pera
lass
ery
(CT)
16,8
21
Pina
rayi
(CT)
16,8
01
Pora
this
sery
(CT)
16,7
68
Pudu
sser
y Ce
ntra
l (CT
)16
,629
Chen
drap
pini
(CT)
16,4
04
Kada
mak
kudy
(CT)
16,2
95
Chen
gala
m S
outh
(CT)
16,1
11
Cher
ukun
nu (C
T)16
,111
Chev
voor
(CT)
16,0
86
Tow
n N
ame
Popu
latio
nVa
niya
mku
llam
-II (C
T)16
,085
Kand
amku
nnu
(CT)
16,0
25
Bhar
anik
kavu
(CT)
15,9
22
Mar
atha
kkar
a (C
T)15
,817
Vada
kkek
ad (C
T)15
,811
Men
hani
am (C
T)15
,768
Wad
akka
nche
ry (C
T)15
,674
Pana
ngad
(CT)
15,6
30
Har
ipad
(CT)
15,5
88
Chen
gala
(CT)
15,5
88
Kanh
irode
(CT)
15,3
53
Papp
iniv
attom
(CT)
15,3
36
Thek
kum
kara
(CT)
15,2
58
Kood
ali (
CT)
15,2
36
Keez
hatti
ngal
(CT)
15,1
85
Kara
muc
k (C
T)15
,129
Keez
hari
yur
(CT)
15,1
16
Chin
goli
(CT)
14,9
81
Pero
le (C
T)14
,965
Chow
war
a (C
T)14
,933
Ala
mco
de (C
T)14
,762
Man
anth
eri (
CT)
14,6
67
Kand
anas
sery
(CT)
14,6
45
Thaz
haka
ra (C
T)14
,596
Brah
mak
ulam
(CT)
14,3
90
Pana
ngad
(CT)
14,3
47
Palli
kkar
a (C
T)14
,334
Kuru
mpi
lavu
(CT)
14,3
29
Vala
yam
(CT)
14,3
28

Annexure-1: Directory of Urban Centers in the Country with Population (2011)
293
Tow
n N
ame
Popu
latio
nCh
emna
d (C
T)14
,323
Puth
ur (C
T)14
,271
Punn
ayur
kula
m (C
T)14
,221
Thur
ayur
(CT)
14,1
76
Mad
ayik
onam
(CT)
14,1
55
Pazh
anji
(CT)
14,0
67
Oru
man
ayur
(CT)
14,0
64
Kozh
ukka
llur
(CT)
14,0
07
Avin
isse
ry (C
T)13
,983
Velu
r (C
T)13
,928
Mep
payy
ur (C
T)13
,922
Cher
uthu
ruth
i (CT
)13
,828
Irik
kur
(CT)
13,8
20
Kann
adip
aram
ba (C
T)13
,677
Kari
kkad
(CT)
13,6
56
Kunj
athu
r (C
T)13
,633
Kari
vellu
r (C
T)13
,498
Kure
ekka
d (C
T)13
,348
Pera
man
gala
m (C
T)13
,260
Kutti
attoo
r (C
T)13
,244
Kani
yark
ode
(CT)
13,2
36
Oor
akam
(CT)
13,1
49
Trik
kur
(CT)
13,0
93
Nar
ath
(CT)
13,0
92
Edak
kode
(CT)
12,9
94
Valla
chira
(CT)
12,9
70
Edat
hiru
thy
(CT)
12,9
21
Kada
vallu
r (C
T)12
,912
Thir
umitt
acod
e -II
(CT)
12,8
55
Tow
n N
ame
Popu
latio
nEl
aval
ly (C
T)12
,819
Bare
(CT)
12,8
04
Man
galp
ady
(CT)
12,7
90
Mad
hur
(CT)
12,6
85
Man
iyoo
r (C
T)12
,681
Pullu
r (C
T)12
,656
Puth
ukka
d (C
T)12
,615
Choo
ndal
(CT)
12,5
02
May
yil (
CT)
12,4
90
Ned
umpu
ra (C
T)12
,399
Chen
nith
ala
(CT)
12,3
60
Irin
gapr
om (C
T)12
,343
Pava
ratt
y (C
T)12
,299
Mav
ilayi
(CT)
12,2
86
Kutt
oor
(CT)
12,1
79
Mul
lass
ery
(CT)
12,1
65
Pera
kam
(CT)
12,0
72
Kozh
ench
ery
(CT)
12,0
21
Nad
atha
ra (C
T)11
,969
Para
ppuk
kara
(CT)
11,8
93
Kura
ttiss
ery
(CT)
11,8
49
Katt
akam
pal (
CT)
11,8
36
Vada
kkum
bhag
om (C
T)11
,727
Padi
yam
(CT)
11,6
23
Velu
thur
(CT)
11,6
02
Vallo
orku
nnam
(CT)
11,5
76
Vada
ma
(CT)
11,5
73
Upp
ala
(CT)
11,5
42
Kola
zhy
(CT)
11,5
40

Handbook of Urban Statistics
294
Tow
n N
ame
Popu
latio
nKo
otha
li (C
T)11
,389
Am
ballu
r (C
T)11
,358
Venk
itang
u (C
T)11
,335
Poom
anga
lam
(CT)
11,1
41
Chira
man
anga
d (C
T)11
,060
New
- M
ahe
(CT)
10,9
86
Anj
ur (C
T)10
,860
Chel
eri (
CT)
10,8
48
Thek
kum
bhag
om (C
T)10
,798
Kizh
akki
mbh
agom
(CT)
10,7
91
Pura
natt
ukar
a (C
T)10
,655
Ala
(CT)
10,4
93
Poyy
a (C
T)10
,478
Keer
ikka
d (C
T)10
,465
Kada
nnap
palli
(CT)
10,4
30
Vada
kkum
kara
(CT)
10,4
07
Vyla
thur
(CT)
10,2
98
Eran
ellu
r (C
T)10
,145
Kozh
ukku
lly (C
T)9,
918
Edat
hiri
nji (
CT)
9,84
9
Ant
hica
d (C
T)9,
826
Alu
r (C
T)9,
807
Chira
nellu
r (C
T)9,
789
Than
niya
m (C
T)9,
743
Keek
an (C
T)9,
735
Pilic
ode
(CT)
9,67
6
Vada
kkum
mur
i (CT
)9,
585
Enka
kkad
(CT)
9,58
4
Pook
ode
(CT)
9,36
6
Tow
n N
ame
Popu
latio
nKa
naya
nnur
(CT)
9,30
8
Para
lam
(CT)
9,18
7
Peru
mba
voor
(CT)
9,18
5
Palu
vai (
CT)
9,12
7
Para
kkad
(CT)
9,09
3
Mog
ral (
CT)
8,91
2
Padi
yur
(CT)
8,82
3
Man
jesh
war
(CT)
8,74
2
Puzh
akka
l (CT
)8,
609
Venm
anad
(CT)
8,37
7
Des
aman
gala
m (C
T)8,
355
Vello
okka
ra (C
T)8,
146
Udm
a (C
T)8,
115
Edak
kala
thur
(CT)
8,03
9
Vala
patt
anam
(CT)
7,95
5
Avan
ur (C
T)7,
879
Cher
pu (C
T)7,
864
Pott
ore
(CT)
7,84
8
Palis
sery
(CT)
7,72
4
Palli
ppur
am (C
T)7,
718
Mun
dath
ikod
e (C
T)7,
672
Koda
nnur
(CT)
7,65
5
Shir
ibag
ilu (C
T)7,
630
Kum
aran
ellu
r (C
T)7,
553
Chel
akka
ra (C
T)7,
528
Thol
ur (C
T)7,
454
Man
aval
asse
ry (C
T)7,
364
Kain
oor
(CT)
7,34
4
Kaip
aram
ba (C
T)7,
179

Annexure-1: Directory of Urban Centers in the Country with Population (2011)
295
Tow
n N
ame
Popu
latio
nM
anak
kody
(CT)
7,15
0
Kalle
ttum
kara
(CT)
7,09
7
Chitti
lapp
illy
(CT)
6,98
8
Eyya
l (CT
)6,
727
Kott
appu
ram
(CT)
6,72
7
Thai
kkad
(CT)
6,59
4
Pork
ulam
(CT)
6,50
3
Kari
yann
ur (C
T)6,
363
Vella
nikk
ara
(CT)
6,16
7
Min
alur
(CT)
6,12
0
Nel
luw
aya
(CT)
5,99
4
Chitt
anda
(CT)
5,93
6
Aka
thiy
oor
(CT)
5,84
7
Bang
ra M
anje
shw
ar (C
T)5,
791
Ada
t (CT
)5,
721
Peri
ngan
door
(CT)
5,57
7
Veng
inis
sery
(CT)
5,53
3
Choo
lisse
ry (C
T)5,
441
Shir
iya
(CT)
5,27
7
Kizh
uppi
llikk
ara
(CT)
5,27
5
Hos
abett
u (C
T)5,
179
Mur
ingu
r Va
dakk
umm
uri (
CT)
4,98
1
Man
iyat
(CT)
4,68
3
Kizh
kkum
mur
i (CT
)4,
635
Than
galu
r (C
T)4,
587
Erav
u (C
T)4,
447
Mad
athu
mpa
dy (C
T)4,
294
Kuri
chik
kara
(CT)
4,08
1
Tow
n N
ame
Popu
latio
nTa
mil
Nad
u
Chen
nai (
M C
orp.
)4,
646,
732
Coim
bato
re (M
Cor
p.)
1,05
0,72
1
Mad
urai
(M C
orp.
)1,
017,
865
Tiru
chira
ppal
li (M
Cor
p.)
847,
387
Sale
m (M
Cor
p.)
829,
267
Tiru
nelv
eli (
M C
orp.
)47
3,63
7
Tiru
ppur
(M C
orp.
)44
4,35
2
Thoo
thuk
kudi
(M C
orp.
)23
7,83
0
Vello
re (M
Cor
p.)
185,
803
Erod
e (M
Cor
p.)
157,
101
Am
batt
ur (M
)46
6,20
5
Avad
i (M
)34
5,99
6
Tiru
votti
yur
(M)
249,
446
Nag
erco
il (M
)22
4,84
9
Than
javu
r (M
)22
2,94
3
Palla
vara
m (M
)21
5,41
7
Din
digu
l (M
)20
7,32
7
Tam
bara
m (M
)17
4,78
7
Cudd
alor
e (M
)17
3,63
6
Ala
ndur
(M)
164,
430
Kanc
heep
uram
(M)
164,
384
Tiru
vann
amal
ai (M
)14
5,27
8
Kum
bako
nam
(M)
140,
156
Raja
pala
yam
(M)
130,
442
Kuri
chi (
M)
123,
667
Mad
avar
am (M
)11
9,10
5
Pudu
kkott
ai (M
)11
7,63
0
Hos
ur (M
)11
6,82
1

Handbook of Urban Statistics
296
Tow
n N
ame
Popu
latio
nA
mbu
r (M
)11
4,60
8
Kara
ikku
di (M
)10
6,71
4
Nag
apatti
nam
(M)
102,
905
Vilu
ppur
am (M
)96
,253
Kuni
yam
uthu
r (M
)95
,924
Para
mak
udi (
M)
95,5
79
Tiru
chen
gode
(M)
95,3
35
Vani
yam
badi
(M)
95,0
61
Kovi
lpatti
(M)
95,0
57
Then
i Alli
naga
ram
(M)
94,4
53
Gud
iyat
ham
(M)
91,5
58
Kada
yana
llur
(M)
90,3
64
Polla
chi (
M)
90,1
80
Avan
iapu
ram
(M)
89,6
35
Udh
agam
anda
lam
(M)
88,4
30
Aru
ppuk
kott
ai (M
)87
,722
Vela
mpa
laya
m (M
)87
,427
Mad
urav
oyal
(M)
86,1
95
May
iladu
thur
ai (M
)85
,632
Veer
appa
ncha
tiram
(M)
84,4
53
Gou
ndam
pala
yam
(M)
83,9
08
Mar
aim
alai
naga
r (M
)81
,872
Ara
kona
m (M
)78
,395
Pam
mal
(M)
75,8
70
Bodi
naya
kanu
r (M
)75
,675
Sriv
illip
uthu
r (M
)75
,396
Viru
dhac
hala
m (M
)73
,585
Kasi
pala
yam
(E) (
M)
73,4
25
Patt
ukko
ttai
(M)
73,1
35
Tow
n N
ame
Popu
latio
nTi
ndiv
anam
(M)
72,7
96
Viru
dhun
agar
(M)
72,2
96
Kum
arap
alay
am (M
)71
,594
Kris
hnag
iri (
M)
71,3
23
Siva
kasi
(M)
71,0
40
Karu
r (M
)70
,980
Valp
arai
(M)
70,8
59
Tenk
asi (
M)
70,5
45
Pala
ni (M
)70
,467
S.N
allu
r (M
)70
,115
Mett
upal
ayam
(M)
69,2
13
Dha
rmap
uri (
M)
68,6
19
Kam
bam
(M)
68,0
90
Inam
Kar
ur (M
)67
,131
Man
narg
udi (
M)
66,9
99
Pulia
nkud
i (M
)66
,034
Tiru
path
ur (M
)64
,125
Ana
iyur
(M)
63,9
17
Ara
ni (M
)63
,671
Tiru
verk
adu
(M)
62,8
24
Chen
galp
attu
(M)
62,5
79
Chid
amba
ram
(M)
62,1
53
Attur
(M)
61,7
93
Ram
anat
hapu
ram
(M)
61,4
40
Udu
mal
aipe
ttai
(M
)61
,133
Panr
uti (M
)60
,323
Gob
iche
ttipa
laya
m (M
)59
,523
Thir
uvar
ur (M
)58
,301
Sank
aran
koil
(M)
57,2
77

Annexure-1: Directory of Urban Centers in the Country with Population (2011)
297
Tow
n N
ame
Popu
latio
nPo
onam
alle
e (M
)57
,224
Sath
uvac
hari
(M)
56,9
51
Thir
uval
lur
(M)
56,0
74
Dha
rapu
ram
(M)
56,0
07
Arc
ot (M
)55
,955
Thir
utha
ngal
(M)
55,3
62
Peri
yase
mur
(M)
55,2
82
Nam
akka
l (M
)55
,145
Edap
padi
(M)
54,8
23
Than
thon
i (M
)53
,854
Puzh
ithiv
akka
m (U
llaga
ram
) (M
)53
,322
Mett
ur (M
)52
,813
Kalla
kkur
ichi
(M)
52,5
07
Dev
akott
ai (M
)51
,865
Pern
ampa
ttu
(M)
51,2
71
Thir
uman
gala
m (M
)51
,194
Rani
pett
ai (M
)50
,764
Rasi
pura
m (M
)50
,244
Pera
mba
lur
(M)
49,6
48
Gud
alur
(M)
49,5
35
Thir
upar
anku
ndra
m (M
)48
,810
Ana
kapu
thur
(M)
48,0
50
Vala
sara
vakk
am (M
)47
,378
Vikr
amas
inga
pura
m (M
)47
,241
Nel
likup
pam
(M)
46,6
78
Coon
oor
(M)
45,4
94
Ram
esw
aram
(M)
44,8
56
Mel
vish
aram
(M)
44,7
86
Tiru
ttan
i (M
)44
,781
Tow
n N
ame
Popu
latio
nN
elliy
alam
(M)
44,5
90
Peri
yaku
lam
(M)
42,9
76
Chin
nam
anur
(M)
42,3
05
Palla
dam
(M)
42,2
25
Gud
alur
(M)
41,9
15
Sura
mpa
tti (M
)41
,782
Ara
ntha
ngi (
M)
40,8
14
Kaya
lpatti
nam
(M)
40,5
88
Man
appa
rai (
M)
40,5
10
Siva
gang
a (M
)40
,403
Vella
koil
(M)
40,3
59
Palli
pala
yam
(M)
40,1
40
Mel
ur (M
)40
,017
Bhav
ani (
M)
39,2
25
Thuv
akud
i (M
)38
,887
Dha
rapa
dave
du (M
)38
,833
Keel
akar
ai (M
)38
,355
Sath
yam
anga
lam
(M)
37,8
16
Tiru
veth
ipur
am (M
)37
,802
Katti
vakk
am (M
)36
,617
Koda
ikan
al (M
)36
,501
Am
basa
mud
ram
(M)
35,6
45
Man
ali (
M)
35,2
48
Usi
lam
patti
(M)
35,2
19
Sirk
ali (
M)
34,9
27
Veda
rany
am (M
)34
,266
Jaya
nkon
dam
(M)
33,9
45
Thur
aiyu
r (M
)32
,439
Wal
ajap
et (M
)32
,397

Handbook of Urban Statistics
298
Tow
n N
ame
Popu
latio
nVa
ndav
asi (
M)
31,3
20
Mad
uran
thak
am (M
)30
,796
Jola
rpet
(M)
29,6
62
Satt
ur (M
)29
,398
Ari
yalu
r (M
)28
,902
Kulit
hala
i (M
)27
,910
Shen
kott
ai (M
)26
,823
Kuth
anal
lur
(M)
25,4
23
Thir
uthu
raip
oond
i (M
)24
,404
Cola
chel
(M)
23,2
27
Nar
asin
gapu
ram
(M)
23,0
84
Padm
anab
hapu
ram
(M)
21,3
42
Kuzh
ithur
ai (M
)21
,307
Punj
aipu
liam
patti
(M)
18,9
67
Poru
r (T
P)46
,690
Sem
bakk
am (T
P)45
,356
Nan
diva
ram
-Gud
uvan
cher
i (TP
)44
,098
Palli
kara
nai (
TP)
43,4
93
Peru
ngud
i (TP
)43
,111
Kund
rath
ur (T
P)42
,126
Vada
valli
(TP)
39,8
73
Kala
patti
(TP)
39,5
86
Vada
lur
(TP)
39,5
14
Gud
alur
(TP)
38,8
59
Kolla
ncod
e (T
P)38
,385
Man
gadu
(TP)
38,1
88
Chitl
apak
kam
(TP)
37,9
06
Peru
ngal
athu
r (T
P)37
,342
Thir
unin
drav
ur (T
P)37
,095
Tow
n N
ame
Popu
latio
nSu
rand
ai (T
P)35
,272
Kara
mad
ai (T
P)35
,166
Kaur
mat
ham
patti
(TP)
35,0
62
Thud
iyal
ur (T
P)33
,924
Edag
anas
alai
(TP)
33,2
45
Sara
vana
mpa
tti (T
P)32
,920
Man
amad
urai
(TP)
32,2
57
Tiru
chen
dur
(TP)
32,1
71
Kang
eyam
(TP)
32,1
47
Kott
akup
pam
(TP)
31,7
26
Mad
amba
kkam
(TP)
31,6
81
Puzh
al (T
P)31
,665
Thir
umur
ugan
poon
di (T
P)31
,528
Alla
pura
m (T
P)31
,211
Adi
ram
apatti
nam
(TP)
31,0
66
Ponn
eri (
TP)
31,0
25
Kala
kad
(TP)
30,9
21
Vila
ngud
i (TP
)30
,884
Shol
ingu
r (T
P)30
,856
Thir
unee
rmal
ai (T
P)30
,702
Palla
patti
(TP)
30,6
24
Mad
ukka
rai (
TP)
30,3
57
Thar
aman
gala
m (T
P)30
,222
Tiru
kkoy
ilur
(TP)
30,2
12
Odd
anch
atra
m (T
P)30
,064
Pana
gudi
(TP)
29,8
95
Sank
ari (
TP)
29,4
67
Vada
kkuv
alliy
ur (T
P)29
,417
Tiru
kalu
kund
ram
(TP)
29,3
91

Annexure-1: Directory of Urban Centers in the Country with Population (2011)
299
Tow
n N
ame
Popu
latio
nU
tham
apal
ayam
(TP)
29,0
50
Avan
ashi
(TP)
28,8
68
Katp
adi (
TP)
28,7
97
Mus
iri (
TP)
28,7
27
Suri
yam
pala
yam
(TP)
28,5
85
Min
jur
(TP)
28,3
37
Kota
giri
(TP)
2820
7
Edak
alin
adu
(TP)
28,1
72
Polu
r (T
P)28
,123
Sulu
r (T
P)27
,909
Kuri
njip
adi (
TP)
27,4
71
Katt
uman
nark
oil (
TP)
27,2
94
And
ipatti
Jakk
ampa
tti (T
P)27
,287
Aru
mug
aner
i (TP
)27
,266
Ayak
udi (
TP)
27,1
56
Gin
gee
(TP)
27,0
45
Chen
gam
(TP)
26,9
80
Vadi
patti
(TP)
26,8
30
Shol
inga
nallu
r (T
P)26
,644
Kott
ur (T
P)26
,627
Kalla
daik
uric
hi (T
P)26
,398
Chin
nala
patti
(TP)
26,2
85
Tiru
path
ur (T
P)25
,980
Man
acha
nallu
r (T
P)25
,931
Peri
yana
icke
n-pa
laya
m (T
P)25
,930
Peer
kank
aran
ai (T
P)25
,871
Irug
ur (T
P)25
,691
Mec
heri
(TP)
25,6
76
Para
ngip
ettai
(TP)
25,5
41
Tow
n N
ame
Popu
latio
nH
arur
(TP)
25,4
69
Edai
code
(TP)
25,3
78
Uth
iram
erur
(TP)
25,1
94
P.N
.Patti
(TP)
25,1
33
Chin
nasa
lem
(TP)
25,1
06
Velu
r (T
P)25
,012
Dev
arsh
ola
(TP)
24,9
54
Peru
ndur
ai (T
P)24
,930
Vella
lur
(TP)
24,8
72
Srip
erum
budu
r (T
P)24
,864
Brah
man
a Pe
riya
Agr
ahar
am (T
P)24
,798
Ilaya
ngud
i (TP
)24
,767
Ezhu
desa
m (T
P)24
,657
Thir
upuv
anam
(TP)
24,5
54
Den
kani
kott
ai (T
P)24
,252
Paco
de (T
P)24
,050
Karu
man
di C
helli
pala
yam
(TP)
23,8
68
Veer
aker
alam
(TP)
23,8
41
Lalg
udi (
TP)
23,7
40
Ulu
ndur
pett
ai (T
P)23
,734
This
ayan
vila
i (TP
)23
,702
Nat
ham
(TP)
23,6
60
Unn
amal
aika
dai (
TP)
23,6
56
Sevi
limed
u (T
P)23
,454
Punj
aipu
galu
r (T
P)23
,408
Keth
i (TP
)23
,229
Thar
anga
mba
di (T
P)23
,191
Thir
uver
umbu
r (T
P)23
,156
Mat
higi
ri (T
P)23
,129

Handbook of Urban Statistics
300
Tow
n N
ame
Popu
latio
nPa
lliko
nda
(TP)
23,0
67
Siva
giri
(TP)
23,0
40
Vada
kkan
anda
l (TP
)23
,034
Batla
gund
u (T
P)22
,928
Titt
akud
i (TP
)22
,894
Ara
lvai
moz
hi (T
P)22
,846
Shol
avan
dan
(TP)
22,5
78
Kann
iyak
umar
i (TP
)22
,453
Thir
para
ppu
(TP)
22,4
01
Kila
pavo
or (T
P)22
,231
Nila
kkott
ai (T
P)22
,197
Pera
vura
ni (T
P)22
,084
Poth
attur
pett
ai (T
P)22
,040
Mar
akka
nam
(TP)
22,0
34
Bhuv
anag
iri (
TP)
21,9
56
O’ V
alle
y (T
P)21
,943
Mut
hupe
t (TP
)21
,722
Kada
yal (
TP)
21,6
65
Tham
mam
patti
(TP)
21,5
03
Vasu
deva
nallu
r (T
P)21
,361
Nam
agir
ipett
ai (T
P)21
,250
Reet
hapu
ram
(TP)
21,1
77
Ant
hiyu
r (T
P)21
,086
Pala
kkod
u (T
P)20
,959
Ala
ngul
am (T
P)20
,948
Nar
avar
ikup
pam
(TP)
20,9
46
Killi
yoor
(TP)
20,9
38
Vada
kara
i Kee
zhpa
duga
i (TP
)20
,821
Sam
alap
uram
(TP)
20,6
91
Tow
n N
ame
Popu
latio
nM
adat
huku
lam
(TP)
20,6
20
Ala
mpa
laya
m (T
P)20
,286
Seith
ur (T
P)20
,228
Chin
nave
dam
patti
(TP)
20,1
22
Sule
esw
aran
patti
(TP)
20,1
04
Ann
ur (T
P)20
,079
Para
vai (
TP)
20,0
42
Kalin
jur
(TP)
19,8
28
Chet
pet (
TP)
19,8
27
Kann
anku
rich
i (TP
)19
,765
Sent
ham
anga
lam
(TP)
19,7
50
Uda
ngud
i (TP
)19
,738
Thir
umaz
hisa
i (TP
)19
,733
Verk
ilam
bi (T
P)19
,730
Veer
avan
allu
r (T
P)19
,585
Mul
agum
udu
(TP)
19,5
38
Penn
adam
(TP)
19,4
94
Dev
adan
apatti
(TP)
19,2
85
Am
mai
naic
kanu
r (T
P)19
,257
Kallu
kutt
am (T
P)19
,093
Thir
uvatt
ar (T
P)18
,985
Gum
mid
ipoo
ndi (
TP)
18,8
91
Thad
ikom
bu (T
P)18
,838
Thir
uvith
anco
de (T
P)18
,723
Mam
sapu
ram
(TP)
18,6
35
Thia
gadu
rgam
(TP)
18,6
05
Pala
ppal
lam
(TP)
18,5
89
Uth
anga
rai (
TP)
18,4
70
Thon
di (T
P)18
,465

Annexure-1: Directory of Urban Centers in the Country with Population (2011)
301
Tow
n N
ame
Popu
latio
nPo
than
ur (T
P)18
,455
Man
dapa
m (T
P)18
,427
Ala
ngay
am (T
P)18
,327
Cher
anm
adev
i (TP
)18
,327
Palu
gal (
TP)
18,2
76
Siru
mug
ai (T
P)18
,223
Kari
apatti
(TP)
18,1
91
Sing
ampu
neri
(TP)
18,1
43
Eruv
adi (
TP)
18,0
67
Vada
mad
urai
(TP)
18,0
15
Mal
lasa
mud
ram
(TP)
18,0
07
Nal
loor
(TP)
17,9
89
Siva
giri
(TP)
17,9
79
Nar
asim
hana
icke
n-pa
laya
m (T
P)17
,858
Kola
thup
alay
am (T
P)17
,819
Peth
anai
cken
pala
yam
(TP)
17,6
78
Koth
anal
lur
(TP)
17,6
62
Nan
gava
ram
(TP)
17,6
29
Vazh
apad
i (TP
)17
,559
Papa
nasa
m (T
P)17
,548
Chetti
arpa
tti (T
P)17
,520
Penn
agar
am (T
P)17
,480
Vett
aika
ranp
udur
(TP)
17,3
92
Keez
hkul
am (T
P)17
,327
Kula
seka
ram
(TP)
17,2
67
Ana
imal
ai (T
P)17
,208
Shen
bakk
am (T
P)17
,109
Ayya
lur
(TP)
17,1
00
Nar
anam
mal
pura
m (T
P)17
,094
Tow
n N
ame
Popu
latio
nVa
lvai
than
kosh
tam
(TP)
16,9
65
Veer
apan
di (T
P)16
,953
Asa
ripa
llam
(TP)
16,8
22
Vath
irair
uppu
(TP)
16,7
84
Valla
m (T
P)16
,758
Vala
vanu
r (T
P)16
,745
Sam
bava
r Va
daga
rai (
TP)
16,7
09
Thor
apad
i (TP
)16
,700
Karu
ngal
(TP)
16,6
91
Veer
akka
lpud
ur (T
P)16
,665
Path
amad
ai (T
P)16
,625
Thir
unag
ar (T
P)16
,598
Naz
erat
h (T
P)16
,584
Lalp
et (T
P)16
,561
Jam
bai (
TP)
16,5
22
Nam
biyu
r (T
P)16
,379
Barg
ur (T
P)16
,366
Zam
in U
thuk
uli (
TP)
16,3
54
Ann
amal
ai N
agar
(TP)
16,2
89
Aru
man
ai (T
P)16
,283
Om
alur
(TP)
16,2
79
Mad
ukku
r (T
P)16
,266
Ayya
mpe
ttai
(TP)
16,2
63
Tim
iri (
TP)
16,2
46
Jala
kand
apur
am (T
P)16
,184
Thir
uvai
yaru
(TP)
16,1
64
Veer
apan
di (T
P)16
,158
Kam
ayag
ound
anpa
tti (T
P)16
,134
Kuth
alam
(TP)
16,1
25

Handbook of Urban Statistics
302
Tow
n N
ame
Popu
latio
nTh
evar
am (T
P)16
,079
Vella
kina
r (T
P)15
,998
Kapp
iyar
ai (T
P)15
,998
Kom
bai (
TP)
15,9
60
Koot
happ
ar (T
P)15
,943
Boot
hapa
ndi (
TP)
15,9
31
Kann
ampa
laya
m (T
P)15
,868
Sriv
aiku
ntam
(TP)
15,8
47
Elum
alai
(TP)
15,7
46
Ari
yapp
ampa
laya
m (T
P)15
,706
Sank
arap
uram
(TP)
15,6
64
Kaliy
akka
vila
i (TP
)15
,625
Mel
acho
kkan
atha
pura
m (T
P)15
,625
Aga
ram
(TP)
15,6
10
Sala
ngap
alay
am (T
P)15
,609
Ponm
anai
(TP)
15,5
54
Vett
aval
am (T
P)15
,506
Chen
nim
alai
(TP)
15,5
00
Pala
yam
(TP)
15,3
36
Dha
rasu
ram
(TP)
15,3
26
Villu
kuri
(TP)
15,3
04
Vila
thik
ulam
(TP)
15,2
77
Mul
anur
(TP)
15,2
23
Mam
alla
pura
m (T
P)15
,172
Aygu
di (T
P)15
,129
Thir
unag
esw
aram
(TP)
15,0
82
Alu
r (T
P)15
,063
Kave
ripa
ttina
m (T
P)15
,006
Thir
upuv
anam
(TP)
14,9
89
Tow
n N
ame
Popu
latio
nM
ukku
dal (
TP)
14,9
83
Thotti
yam
(TP)
14,9
09
Pala
ni C
hetti
patti
(TP)
14,8
79
Then
kara
i (TP
)14
,838
Ara
sira
man
i (TP
)14
,834
Saya
lgud
i (TP
)14
,801
Mud
ukul
athu
r (T
P)14
,789
Thir
uvid
aim
arud
ur (T
P)14
,786
Kott
aiyu
r (T
P)14
,766
Kam
uthi
(TP)
14,7
54
Kalu
gum
alai
(TP)
14,7
38
Kum
arap
uram
(TP)
14,7
28
Wal
ajab
ad (T
P)14
,684
Koda
vasa
l (TP
)14
,639
Kara
mba
kkud
i (TP
)14
,626
Gan
apat
hipu
ram
(TP)
14,5
98
Kave
ripa
kkam
(TP)
14,5
83
Am
map
ettai
(TP)
14,5
72
Venn
anth
ur (T
P)14
,568
R.S.
Man
gala
m (T
P)14
,565
Then
gam
pudu
r (T
P)14
,538
Mel
agar
am (T
P)14
,535
Jaga
thal
a (T
P)14
,383
Vila
vur
(TP)
14,3
20
Moh
anur
(TP)
14,3
15
Sent
hara
patti
(TP)
14,3
08
Kala
mbu
r (T
P)14
,304
Sath
anku
lam
(TP)
14,1
93
Bala
sam
udra
m (T
P)14
,179

Annexure-1: Directory of Urban Centers in the Country with Population (2011)
303
Tow
n N
ame
Popu
latio
nA
dika
ratti
(TP)
14,1
78
Ilupp
ur (T
P)14
,127
Thak
kola
m (T
P)13
,983
Srim
ushn
am (T
P)13
,971
Karu
ppur
(TP)
13,9
67
Oda
ipatti
(TP)
13,8
92
Attay
ampa
tti (T
P)13
,852
Uth
ayen
dram
(TP)
13,8
37
Kilp
enna
thur
(TP)
13,7
18
Thir
upor
ur (T
P)13
,666
Kom
aral
inga
m (T
P)13
,642
Sith
ayan
kott
ai (T
P)13
,634
Killa
i (TP
)13
,608
Thin
galn
agar
(TP)
13,5
67
Ach
ampu
dur
(TP)
13,5
66
Kari
aman
gala
m (T
P)13
,511
Oda
iyak
ulam
(TP)
13,3
70
Kela
man
gala
m (T
P)13
,321
Man
daik
adu
(TP)
13,3
17
Kodu
mud
i (TP
)13
,225
Mut
hur
(TP)
13,2
12
Vadu
gapa
tti (T
P)13
,204
Such
indr
um (T
P)13
,193
Velli
mal
ai (T
P)13
,182
Puth
alam
(TP)
13,0
73
S. K
anna
nur
(TP)
13,0
73
Mal
lank
inar
u (T
P)12
,986
That
haiy
anga
rpet
(TP)
12,9
80
Thir
ukka
ttup
alli
(TP)
12,9
72
Tow
n N
ame
Popu
latio
nH
ulig
al (T
P)12
,960
Ney
yoor
(TP)
12,9
17
Pool
uvap
atti (T
P)12
,853
Ara
ni (T
P)12
,833
Thal
aina
yar
(TP)
12,7
98
Saya
pura
m (T
P)12
,792
Ettay
apur
am (T
P)12
,772
Kola
thur
(TP)
12,7
48
Uth
ukko
ttai
(TP)
12,7
40
Puliy
ur (T
P)12
,720
S.Ko
diku
lam
(TP)
12,7
13
B.M
alla
pura
m (T
P)12
,705
Uda
yarp
alay
am (T
P)12
,688
Ponn
amar
avat
hi (T
P)12
,676
Nan
nila
m (T
P)12
,618
Am
moo
r (T
P)12
,513
Karu
nguz
hi (T
P)12
,485
Aru
mba
vur
(TP)
12,4
67
Pudu
r (S
) (TP
)12
,457
Mar
anda
halli
(TP)
12,4
51
Kuru
mba
lur
(TP)
12,4
20
Ara
vaku
rich
i (TP
)12
,412
Seer
apal
li (T
P)12
,403
Chin
nase
kkad
u (T
P)12
,396
Tham
arai
kula
m (T
P)12
,372
Ala
ngud
i (TP
)12
,367
Ala
ngan
allu
r (T
P)12
,331
Peri
yako
dive
ri (T
P)12
,330
Oth
akal
man
dapa
m (T
P)12
,207

Handbook of Urban Statistics
304
Tow
n N
ame
Popu
latio
nKa
mba
inal
lur
(TP)
12,1
94
Ayya
mpa
laya
m (T
P)12
,175
Papp
arap
atti (T
P)12
,174
Ponn
ampa
tti (T
P)12
,167
Thi
rum
alay
ampa
laya
m (T
P)12
,164
Erum
aipa
tti (T
P)12
,085
Vani
puth
ur (T
P)12
,044
Ara
chal
ur (T
P)12
,034
Vikr
avan
di (T
P)12
,022
Gan
gava
lli (T
P)12
,015
Para
mat
hi (T
P)11
,986
Gan
guva
rpatti
(TP)
11,9
42
Palla
pala
yam
(TP)
11,9
10
Athu
r (T
P)11
,910
Labb
aiku
dika
du (T
P)11
,891
Then
tham
arai
kula
m (T
P)11
,872
Ilam
pilla
i (TP
)11
,797
Aval
poon
dura
i (TP
)11
,789
Vala
ngai
man
(TP)
11,7
54
Kuha
lur
(TP)
11,7
53
Nei
kkar
apatti
(TP)
11,7
53
Sevu
gam
patti
(TP)
11,7
30
Veda
sand
ur (T
P)11
,730
Lakk
ampa
tti (T
P)11
,716
Adu
thur
ai a
lias
Mar
uthu
vaku
di (T
P)11
,705
Keer
anur
(TP)
11,6
67
Veda
patti
(TP)
11,6
58
Veer
agan
ur ((
TP)
11,6
24
Kalla
kudi
(TP)
11,6
04
Tow
n N
ame
Popu
latio
nCh
inna
kkam
pala
yam
(TP)
11,5
46
Pana
pakk
am (T
P)11
,536
Ayot
hiap
attina
m (T
P)11
,517
Pudu
patti
(TP)
11,5
11
Dha
liyur
(TP)
11,5
00
Thon
dam
uthu
r (T
P)11
,492
Azh
agia
pand
ipur
am (T
P)11
,392
Kada
yam
patti
(TP)
11,3
90
Kada
thur
(TP)
11,3
82
Pudu
pala
yam
(TP)
11,3
82
Man
imut
haru
(TP)
11,3
23
Kanj
ikoi
l (TP
)11
,294
Upp
idam
anga
lam
(TP)
11,2
92
Pudu
vaya
l (TP
)11
,284
Nan
dam
bakk
am (T
P)11
,239
Mar
ungu
r (T
P)11
,236
Raya
giri
(TP)
11,2
23
Pilla
nallu
r (T
P)11
,181
Thir
uppa
nand
al (T
P)11
,169
Moo
laka
raip
atti (T
P)11
,112
Vela
nkan
ni (T
P)11
,108
Kem
bain
aick
enpa
laya
m (T
P)11
,103
Kott
aram
(TP)
11,0
55
Boot
hipu
ram
(TP)
11,0
22
Anj
ugra
mm
am (T
P)10
,982
Nas
iyan
ur (T
P)10
,970
Man
aval
akur
ichi
(TP)
10,9
69
Punj
ai T
hott
akur
ichi
(TP)
10,9
69
Etha
pur
(TP)
10,9
68

Annexure-1: Directory of Urban Centers in the Country with Population (2011)
305
Tow
n N
ame
Popu
latio
nKa
ttup
uthu
r (T
P)10
,933
Mar
udur
(TP)
10,9
25
Mop
peri
pala
yam
(TP)
10,9
23
Kala
ppan
aick
enpa
tti (T
P)10
,831
Nan
gava
lli (T
P)10
,809
Nem
ili (T
P)10
,806
Kris
hnar
ayap
uram
(TP)
10,7
92
T.Ka
llupa
tti (T
P)10
,762
Siru
gam
ani (
TP)
10,7
43
Pool
amba
di (T
P)10
,737
Gop
alas
amud
ram
(TP)
10,6
94
Srira
map
uram
(TP)
10,6
53
Han
uman
tham
patti
(TP)
10,6
19
App
akud
al (T
P)10
,610
Pala
med
u (T
P)10
,493
Pada
ivee
du (T
P)10
,451
Kaya
thar
u (T
P)10
,400
Pera
iyur
(TP)
10,3
94
Nat
ram
palli
(TP)
10,3
90
Eran
iel (
TP)
10,3
75
Kann
ivad
i (TP
)10
,369
Chetti
pala
yam
(TP)
10,3
66
Ach
arap
akka
m (T
P)10
,362
Mal
lur
(TP)
10,3
31
Sarc
arsa
mak
ulam
(TP)
10,2
89
Sank
aram
anal
lur
(TP)
10,2
83
Ilanj
i (TP
)10
,282
Ora
than
adu
(Muk
tham
balp
uram
) (TP
)10
,247
Pulla
mpa
di (T
P)10
,241
Tow
n N
ame
Popu
latio
nKe
erip
atti (T
P)10
,208
Athu
r (T
P)10
,138
Uth
ukul
i (TP
)10
,130
Myl
audy
(TP)
10,0
70
Alw
arku
rich
i (TP
)10
,045
Ola
gada
m (T
P)9,
958
Nag
ojan
ahal
li (T
P)9,
953
Puth
ukka
dai (
TP)
9,90
9
Mod
akur
ichi
(TP)
9,90
7
Atha
nur
(TP)
9,82
7
Kala
vai (
TP)
9,77
3
Shol
ur (T
P)9,
745
Aga
sthe
esw
aram
(TP)
9,71
7
Am
map
ettai
(TP)
9,67
7
Vadu
gapa
tti (T
P)9,
657
Ala
gapp
apur
am (T
P)9,
626
Thir
uven
nain
allu
r (T
P)9,
623
Kola
ppal
ur (T
P)9,
607
Palla
thur
(TP)
9,58
0
Eral
(TP)
9,47
8
Pool
ampa
tti (T
P)9,
477
Penn
athu
r (T
P)9,
425
Papp
iredd
ipatti
(TP)
9,36
9
Pana
imar
athu
patti
(TP)
9,36
8
Keer
aman
gala
m (T
P)9,
357
Ettim
adai
(TP)
9,35
2
Thir
ukar
ungu
di (T
P)9,
342
Nee
dam
anga
lam
(TP)
9,33
6
Venk
arai
(TP)
9,33
0

Handbook of Urban Statistics
306
Tow
n N
ame
Popu
latio
nPa
nnai
pura
m (T
P)9,
323
Panp
oli (
TP)
9,31
3
Alw
arth
irun
agir
i (TP
)9,
289
Kong
anap
uram
(TP)
9,28
6
Man
gala
mpe
t (TP
)9,
278
Titt
ache
ri (T
P)9,
245
Kolla
nkoi
l (TP
)9,
196
Thir
uval
am (T
P)9,
153
Gan
dhin
agar
(TP)
9,11
4
P.M
ettup
alay
am (T
P)9,
109
Kasi
pala
yam
(G) (
TP)
9,09
3
Mel
athi
rupp
anth
urut
hi (T
P)9,
074
Man
alm
edu
(TP)
9,01
7
Har
veyp
atti (T
P)9,
016
Odu
gath
ur (T
P)8,
998
Thaz
haku
dy (T
P)8,
992
Sund
arap
andi
apur
am (T
P)8,
987
Ari
mal
am (T
P)8,
948
Patti
nam
(TP)
8,91
2
Ann
avas
al (T
P)8,
906
V. P
udur
(TP)
8,89
1
Erio
du (T
P)8,
890
Kilk
unda
(TP)
8,88
6
Seth
iath
oppu
(TP)
8,82
4
Kunn
athu
r (T
P)8,
774
Belu
r (T
P)8,
736
Pann
aika
du (T
P)8,
731
Palli
patt
u (T
P)8,
721
Idik
arai
(TP)
8,68
6
Tow
n N
ame
Popu
latio
nKi
nath
ukad
avu
(TP)
8,65
3
Bala
kris
hnam
patti
(TP)
8,63
5
Patti
veer
anpa
tti (T
P)8,
602
Chith
ode
(TP)
8,55
0
Thev
ur (T
P)8,
548
Man
alur
pet (
TP)
8,52
3
Sund
arap
andi
am (T
P)8,
513
Nad
uvatt
am (T
P)8,
505
Mel
ache
val (
TP)
8,43
5
Atha
ni (T
P)8,
430
Thir
uven
kada
m (T
P)8,
337
A.V
ella
lapa
tti (T
P)8,
325
V.Pu
dupa
tti (T
P)8,
316
Kilv
elur
(TP)
8,27
2
Vara
dara
janp
ettai
(TP)
8,25
9
Thed
avur
(TP)
8,23
0
Vila
pakk
am (T
P)8,
174
Abi
ram
am (T
P)8,
144
Mel
attur
(TP)
8,13
1
Chen
nasa
mud
ram
(TP)
8,11
1
Peru
r (T
P)8,
004
Vepp
athu
r (T
P)7,
949
Puva
lur
(TP)
7,90
5
B. M
eena
kshi
pura
m (T
P)7,
846
Elat
hur
(TP)
7,82
7
Bhav
anis
agar
(TP)
7,71
0
Upp
iliap
uram
(TP)
7,70
5
Kand
anur
(TP)
7,69
6
Mett
upal
ayam
(TP)
7,68
1

Annexure-1: Directory of Urban Centers in the Country with Population (2011)
307
Tow
n N
ame
Popu
latio
nVa
ithee
swar
anko
il (T
P)7,
676
Thor
apad
i (TP
)7,
659
Vello
ttam
para
ppu
(TP)
7,62
1
Ther
ur (T
P)7,
615
P.J.
Chol
apur
am (T
P)7,
484
R.Pu
dupa
tti (T
P)7,
478
Veng
ampu
dur
(TP)
7,44
3
Kann
aman
gala
m (T
P)7,
399
Then
kara
i (TP
)7,
349
Swam
imal
ai (T
P)7,
289
Palla
pala
yam
(TP)
7,26
3
Pand
aman
gala
m (T
P)7,
259
Ala
nthu
rai (
TP)
7,22
1
Peru
ngul
am (T
P)7,
203
Keer
anur
(TP)
7,20
0
Ner
kupp
ai (T
P)7,
165
Peth
ampa
laya
m (T
P)7,
152
Vana
vasi
(TP)
7,13
0
Peri
ya N
egam
am (T
P)7,
098
Sank
arna
gar
(TP)
7,09
5
Kuch
anur
(TP)
7,02
4
Ana
ntha
pura
m (T
P)6,
892
Mel
patt
ampa
kkam
(TP)
6,88
7
Rudr
avat
hi (T
P)6,
807
Chol
apur
am (T
P)6,
803
Ner
unjip
ettai
(TP)
6,79
1
Nan
gune
ri (T
P)6,
640
Kora
dach
eri (
TP)
6,45
0
Gan
gaik
onda
n (T
P)6,
434
Tow
n N
ame
Popu
latio
nKi
lam
padi
(TP)
6,42
2
Kani
yur
(TP)
6,18
0
Pera
lam
(TP)
6,14
9
Mar
kaya
nkott
ai (T
P)6,
135
Dha
li (T
P)5,
874
Bikk
etti (T
P)5,
864
Natt
aras
anko
ttai
(TP)
5,86
0
Pera
nam
allu
r (T
P)5,
801
Sam
athu
r (T
P)5,
762
Ara
kand
anal
lur
(TP)
5,71
3
Peru
mag
alur
(TP)
5,60
4
TNPL
Pug
alur
(TP)
5,55
6
Kana
duka
than
(TP)
5,27
5
Then
thir
uper
ai (T
P)4,
934
Hig
hway
s (T
P)4,
882
Des
ur (T
P)4,
597
Kann
ivad
i (TP
)4,
385
Mee
nam
bakk
am (T
P)4,
286
Kada
mbu
r (T
P)4,
155
Nal
lam
patti
(TP)
3,87
4
Pasu
r (T
P)3,
670
Kana
m (T
P)3,
134
Unj
alur
(TP)
2,48
2
Cour
tala
m (T
P)2,
089
St.T
hom
as M
ount
-cum
-Pal
lava
ram
(CB)
43,7
95
Wel
lingt
on (C
B)19
,462
Ney
veli
(TS)
(CT)
105,
731
Ogg
iyam
dura
ipak
kam
(CT)
76,6
00
Ner
kunr
am (C
T)59
,790

Handbook of Urban Statistics
308
Tow
n N
ame
Popu
latio
nN
erip
peri
chal
(CT)
53,5
79
Ram
apur
am (C
T)52
,295
Veer
apan
di (C
T)50
,301
Mila
vitt
an (C
T)45
,863
Mel
amad
ai (C
T)43
,797
Thotti
pala
yam
(CT)
40,5
03
Map
pila
iura
ni (C
T)40
,035
Lakk
iam
patti
(CT)
39,6
97
Moo
kond
apal
li (C
T)39
,245
Chetti
pala
yam
(CT)
37,6
20
Mad
ippa
kkam
(CT)
35,7
52
Nan
jikott
ai (C
T)32
,689
Mutt
yyap
uram
(CT)
32,4
94
Zuzu
vadi
(CT)
32,4
74
Kann
anen
dal (
CT)
31,0
95
Med
avak
kam
(CT)
29,7
10
Ayap
pakk
am (C
T)29
,511
Ura
pakk
am (C
T)29
,122
Vand
iyur
(CT)
28,6
46
Kara
ipud
ur (C
T)28
,602
Nee
lank
arai
(CT)
28,4
58
Palla
patti
(CT)
27,9
25
Mat
hur
(CT)
27,6
74
Koila
mba
kkam
(CT)
27,3
74
Pala
vakk
am (C
T)26
,766
Sank
arap
uram
(CT)
26,5
36
Mur
ugan
pala
yam
(CT)
26,3
49
Chin
na A
nupp
anad
i (CT
)26
,158
Pudu
kkott
ai (C
T)26
,116
Tow
n N
ame
Popu
latio
nM
utha
nam
pala
yam
(CT)
26,0
14
Bala
kris
hnap
uram
(CT)
25,6
27
Visw
anat
ham
(CT)
25,5
55
And
ipal
ayam
(CT)
25,5
39
Mug
aliv
akka
m (C
T)25
,117
That
hank
uttai
(CT)
24,7
08
Ana
iyur
(CT)
24,4
36
Vila
nkur
ichi
(CT)
24,2
35
Papp
anku
rich
i (CT
)24
,023
Katt
upak
kam
(CT)
23,9
10
Padi
anal
lur
(CT)
23,8
19
Ayya
ppan
than
gal (
CT)
23,8
08
Pain
kula
m (
CT)
23,6
30
Veng
athu
r (C
T)23
,292
Nag
avak
ulam
(CT)
23,2
84
Katti
gana
palli
(CT)
22,7
14
Rosa
lpatti
(CT)
22,5
24
Sena
pira
tti (C
T)22
,447
Koor
aiku
ndu
(CT)
22,3
61
Athi
mar
apatti
(CT)
22,2
18
Pala
vans
athu
(CT)
22,1
76
Nol
ambu
r (C
T)21
,973
Polic
halu
r (C
T)21
,906
Kara
mba
kkam
(CT)
21,3
76
Kond
asam
udra
m (C
T)21
,335
Inja
mba
kkam
(CT)
21,1
58
Pudu
patti
nam
(CT)
21,1
51
Sala
med
u (C
T)20
,854
Kond
alam
patti
(CT)
20,3
18

Annexure-1: Directory of Urban Centers in the Country with Population (2011)
309
Tow
n N
ame
Popu
latio
nKo
ttiva
kkam
(CT)
20,2
17
Nav
lock
(CT)
20,1
71
Natt
apett
ai (C
T)19
,883
Sank
arap
eri (
CT)
19,8
44
And
anko
li Ea
st (C
T)19
,779
Vila
thur
ai (C
T)19
,758
Nal
lur
(CT)
19,5
95
Tiru
patt
ur (C
T)19
,487
Met
huku
mm
al (C
T)19
,417
Thir
uppa
lai (
CT)
19,3
05
Vana
gara
m (C
T)19
,208
Jalla
diam
pet (
CT)
19,1
00
Kuru
dam
pala
yam
(CT)
18,7
49
Padi
riku
ppam
(CT)
18,7
45
Pala
yam
patti
(CT)
18,5
76
Inam
Man
iyac
hi (C
T)18
,258
Veng
ikka
l (CT
)18
,244
Ilupp
aiyu
rani
(CT)
18
,032
Aval
apal
li (C
T)17
,859
Adi
yanu
thu
(CT)
17,8
51
Sila
padi
(CT)
17,8
24
Peru
r Ch
ettipa
laya
m (C
T)17
,809
Chetti
naic
kenp
atti (C
T)17
,701
Man
gala
m (C
T)17
,699
Patti
nam
katt
an (C
T)
17,6
01
Dha
ram
apur
am (
CT)
17,4
76
Peri
akott
ai (C
T)17
,356
Siva
giri
patti
(CT)
17,3
06
Katt
athu
rai (
CT)
17,2
71
Tow
n N
ame
Popu
latio
nM
anna
rai (
CT)
17,2
61
Pich
anda
rkov
il (C
T)17
,257
Pala
ngar
ai (C
T)17
,248
Mett
unas
uvan
pala
yam
(CT)
17,2
40
Sith
uraj
apur
am (C
T)16
,860
Vand
alur
(CT)
16,8
52
Pach
chal
(CT)
16,7
89
Nav
alpa
ttu
(CT)
16,7
88
Palli
pala
yam
Agr
ahar
am (C
T)16
,479
Kana
kkam
pala
yam
(CT)
16,4
59
Ella
kkud
y (C
T)16
,244
Senn
eerk
uppa
m (C
T)16
,237
Nee
lagi
ri (C
T)16
,197
Ella
ndai
kutt
ai (C
T)16
,160
Nul
livila
i (CT
)16
,138
Nag
amal
aipu
duko
ttai
(CT)
15,7
69
Peri
yapa
tti (C
T)15
,690
Thin
dal (
CT)
15,4
40
Sakk
arak
ottai
(CT)
15,3
55
Para
nipu
thur
(CT)
15,2
25
Kang
eyan
allu
r (C
T)15
,177
Oth
akad
ai (C
T)15
,152
Pand
avar
man
gala
m (C
T)14
,954
Som
ayam
pala
yam
(CT)
14,7
87
Viru
paks
hipu
ram
(CT)
14,7
79
Nila
iyur
I Bi
t (CT
)14
,684
Sam
usig
apur
am (C
T)
14,6
01
Kakk
alur
(CT)
14,5
28
Ned
ungu
ndra
m (C
T)14
,390

Handbook of Urban Statistics
310
Tow
n N
ame
Popu
latio
nTh
anak
kank
ulam
(CT)
14,3
28
Siva
nthi
pura
m (C
T)14
,281
Muk
asip
idar
iyur
(CT)
14,1
43
Tiru
sula
m (C
T)14
,086
Thik
kana
mco
de (C
T)14
,086
Pada
ppai
(CT)
14,0
63
Then
amba
kkam
(CT)
13,9
94
Seng
amal
anac
hiar
patti
(CT)
13,8
11
Veng
avas
al (C
T)13
,671
Sing
aper
umal
koil
(CT)
13,5
66
Anu
ppan
kula
m (C
T)13
,526
Pala
gana
ngud
y (C
T)13
,469
Kum
arag
iri (
CT)
13,3
44
Man
apak
kam
(CT)
13,3
44
Kris
hnas
amud
ram
(CT)
13,1
46
Ash
okap
uram
(CT)
12,9
93
Mal
umic
ham
patti
(CT)
12,9
36
Vella
mco
de (C
T)12
,715
Laks
hmin
aray
anap
uram
(CT)
12,6
48
Ori
kkai
(CT)
12,6
38
Sem
bedu
(CT)
12,5
48
Kond
ur (C
T)12
,506
Mar
aman
gala
thup
atti (C
T)12
,448
Kana
kkam
pala
yam
(CT)
12,1
60
Eday
anch
avad
i (CT
)12
,119
Ney
kkar
appa
tti (C
T)12
,090
Karu
kkal
vadi
(CT)
12,0
52
Kani
yur
(CT)
12,0
11
Ullu
r (C
T)11
,673
Tow
n N
ame
Popu
latio
nM
adam
bakk
am (C
T)11
,673
Nar
anap
uram
(CT)
11,6
65
Dev
ipatti
nam
(CT
)11
,599
Yerc
aud
(CT)
11,5
82
Ger
ugam
bakk
am (C
T)11
,551
Ara
sur
(CT)
11,5
10
Kona
vatt
am (C
T)11
,472
Nar
asin
gapu
ram
(CT)
11,4
54
Kone
riku
ppam
(CT)
11,4
06
Seev
ur (C
T)11
,356
Kada
mba
thur
(CT)
11,2
35
Puth
ur A
grah
aram
(CT)
11,1
73
Ann
alag
raha
ram
(CT)
11,1
29
Kula
thur
(CT)
11,0
83
Athi
patt
u (C
T)11
,034
Kovu
r (C
T)10
,961
Vira
limal
ai (C
T)10
,883
Sakk
iman
gala
m (C
T)10
,854
Hub
bath
ala
(CT)
10,8
52
Am
mav
arik
uppa
m (C
T)10
,750
Soor
apatt
u (C
T)10
,444
Kosa
vam
patti
(CT)
10,3
56
Kond
iche
ttipa
tti (C
T)10
,300
Sevu
r (C
T)10
,299
Puth
agar
am (C
T)10
,263
Mut
hugu
ndun
Pud
ur (C
T)10
,259
Erum
apal
ayam
(CT)
10,2
20
Pudu
patti
nam
(CT)
10,2
10
Mal
lam
oopp
ampa
tti (C
T)10
,199

Annexure-1: Directory of Urban Centers in the Country with Population (2011)
311
Tow
n N
ame
Popu
latio
nSi
kkar
ayap
uram
(CT)
10,1
87
Siva
gnan
apur
am (C
T)10
,107
Vala
yam
batt
u (C
T)10
,076
Avad
attur
(CT)
9,86
9
Ach
ipatti
(CT)
9,84
9
Dev
ikap
uram
(CT)
9,80
0
Peri
apatti
nam
(CT
)9,
730
Moo
vara
sam
pett
ai (C
T)9,
672
Kani
yam
badi
(CT)
9,59
7
Papp
arap
atti (C
T)9,
592
Kada
para
i (CT
)9,
574
Venk
atac
hala
pura
m (C
T)9,
540
Padi
kkas
u va
ithan
patti
(CT)
9,53
8
Ott
appa
rai (
CT)
9,49
3
Kaila
sagi
ri (C
T)9,
421
Ala
pakk
am (C
T)9,
404
Nad
ukut
haga
i (CT
)9,
251
Sam
ayan
allu
r (C
T)9,
227
Vadd
akka
nkul
am (C
T)9,
220
Vala
vand
anko
ttai
(CT)
9,20
2
Patt
anam
(CT)
9,19
6
Vela
yuda
mpa
laya
m (C
T)9,
192
Thut
hipa
ttu
(CT)
9,14
3
Titt
angu
lam
(CT)
9,11
5
Mas
inai
cken
patt
y (C
T)9,
098
Senu
r (C
T)9,
078
Min
ampa
lli-P
acha
mad
evi (
CT)
9,03
1
Vila
r (C
T)9,
028
Kodi
vala
sa (C
T)9,
024
Tow
n N
ame
Popu
latio
nCh
inna
mud
alai
patti
(CT)
8,92
8
Nat
ham
pann
ai (C
T)8,
915
Ada
ikka
kuzh
i (CT
)8,
888
Mol
achu
r (C
T)8,
887
Ayac
ode
(CT)
8,87
4
Eran
apur
am (C
T)8,
871
Nad
aika
vu (C
T)8,
727
Chin
nam
pala
yam
(CT)
8,69
5
Naz
arat
hpett
ai (C
T)8,
660
Sath
kar
(CT)
8,63
2
Mid
alam
(CT)
8,
625
Peru
man
di (C
T)8,
620
Katti
man
code
(CT)
8,54
1
Nad
uvan
eri (
CT)
8,48
5
Pada
ndal
(CT)
8,42
9
Sem
mip
alay
am (C
T)8,
429
Chin
nath
adag
am (C
T)8,
407
Athi
patti
(CT)
8,38
4
Nee
lam
bur
(CT)
8,38
2
Vava
rai (
CT)
8,36
2
Mar
utha
ncod
e (C
T)8,
277
Chin
niam
pal
ayam
(CT)
8,23
2
Mel
apar
thib
anur
(CT)
8,23
2
Usu
ppur
(CT)
8,22
1
Mak
kina
mpa
tti (C
T)8,
134
Kova
lam
(CT)
8,12
4
Jaff
raba
d (C
T)8,
121
Tajp
ura
(CT)
8,07
5
Pedd
ikup
pam
(CT)
8,04
4

Handbook of Urban Statistics
312
Tow
n N
ame
Popu
latio
nSi
ruka
veri
pakk
am (C
T)8,
032
Pudi
yam
puth
ur (C
T)
8,01
2
Iduv
ai (C
T)8,
006
Muz
huco
de (C
T)8,
000
Ala
mel
uman
gapu
ram
(CT)
7,90
0
Kott
agou
ndam
patt
y (C
T)7,
891
Nal
lur
(CT)
7,82
8
Sann
iyas
igun
du (C
T)7,
823
Mal
ayad
i (CT
)7,
812
Peru
mag
ound
ampa
tti (C
T)7,
796
Vila
cher
i (CT
)7,
787
Chetti
than
gal (
CT)
7,78
0
Kann
anoo
r (C
T)7,
747
Valla
m (C
T)7,
745
Dal
avai
patti
(CT)
7,73
2
Am
man
ur (C
T)7,
731
Viri
nchi
pura
m (C
T)7,
699
Kula
ppur
am (
CT)
7,67
7
Natt
alam
(CT
)7,
674
Viru
dam
patt
u (C
T)7,
662
Pava
li (C
T)7,
622
Mut
huka
du (C
T)7,
610
Peri
yaku
rich
i (CT
)7,
599
Sem
bian
allu
r (C
T)7,
586
Kadh
irve
du (C
T)7,
580
Paiy
ur (C
T)7,
555
Nat
chia
rkoi
l (CT
)7,
505
Kuru
ppan
aick
enpa
laya
m (C
T)7,
484
Venk
atap
uram
(CT)
7,43
0
Tow
n N
ame
Popu
latio
nAt
amat
hi (C
T)7,
424
Irav
adan
allu
r (C
T)7,
423
Athi
vila
i (CT
)7,
401
Peru
man
allu
r (C
T)7,
356
Vem
badi
thal
am (C
T)7,
331
Kara
dipa
tti (C
T)7,
289
Gun
duup
pala
vadi
(CT)
7,28
1
Ari
yur
(CT)
7,25
1
Vija
yapu
ri (C
T)7,
222
Vira
ganu
r (C
T)7,
121
Thap
paku
ttai
(CT)
6,98
6
Chat
rapa
tti (C
T)6,
948
Kilp
udup
akka
m (C
T)6,
912
Kond
appa
naic
kenp
atti (C
T)6,
892
Sum
aith
eert
hapu
ram
(CT)
6,87
9
Peri
yam
anal
i (CT
)6,
878
Man
jalu
moo
du (C
T)6,
840
Palo
or (C
T)6,
818
Elay
iram
pann
ai (C
T)6,
814
Choo
zhal
(CT)
6,80
7
Vila
vanc
ode
(CT)
6,
731
Sela
tham
patti
(CT)
6,65
9
Am
map
attina
m (C
T)6,
652
Ayya
mpe
ttai
(CT)
6,61
0
Chen
gapp
alli
(CT)
6,58
7
Vang
anur
(CT)
6,58
4
Mat
hico
de (C
T)6,
532
Pera
mba
kkam
(CT)
6,46
2
Sila
iman
(CT)
6,43
6

Annexure-1: Directory of Urban Centers in the Country with Population (2011)
313
Tow
n N
ame
Popu
latio
nKa
llang
udy
(CT)
6,39
6
Palli
ppad
ai (C
T)6,
369
Puliy
oors
alai
(CT)
6,36
1
Karu
gam
patt
ur (C
T)6,
343
Keel
aman
jaku
di (C
T)6,
274
Thad
ikar
anko
nam
(CT)
6,24
1
Kila
Am
bur
(CT)
6,23
3
Chak
kara
palli
(CT)
6,22
7
Man
icka
pura
m (C
T)6,
215
Kuru
mba
patti
(CT)
6,18
2
Aru
mba
nur
(CT)
6,14
8
Man
thith
oppu
(CT)
6,14
3
Siru
kala
thur
(CT)
6,11
7
Gan
dipu
ram
(CT)
6,10
6
Peru
vila
i (CT
)6,
090
Chid
amba
ram
(N
m) (
CT)
6,03
9
Veer
apan
dian
patti
nam
(Tow
n) (C
T)6,
015
Sirc
ar P
eria
pala
yam
(CT)
5,98
6
Terk
ukal
likul
am (C
T)5,
980
Nar
asin
gam
(CT)
5,97
1
Sath
iyav
ijaya
naga
ram
(CT)
5,89
4
Das
anai
cken
patti
(CT)
5,85
7
Raja
pala
yam
(CT)
5,80
7
Mor
attup
alay
am (C
T)5,
798
Nag
aman
gala
m (C
T)5,
785
Nem
ilich
eri (
CT)
5,74
3
Thal
akud
i (CT
)5,
740
Pudu
pala
yam
Agr
ahar
am (C
T)5,
704
Thoz
hur
(CT)
5,69
8
Tow
n N
ame
Popu
latio
nO
veri
(CT)
5,69
4
K.M
adap
ur (C
T)5,
626
Dus
i (CT
)5,
577
Puth
eri (
CT)
5,57
6
Vala
thur
(CT)
5,52
9
Vella
kkal
patt
y (C
T)5,
475
Dha
lavo
ipur
am (C
T)5,
474
Kada
yam
(CT)
5,
430
Thee
rtha
giri
yam
patt
u (C
T)5,
412
Palla
nthu
rai (
CT)
5,38
6
Kullu
rsan
dai (
CT)
5,38
3
Chat
hira
redd
ipatti
(CT)
5,36
0
Chen
nagi
ri (C
T)5,
338
Vana
padi
(CT)
5,33
4
Dor
aman
gala
m (C
T)5,
322
Kilv
aith
inan
kupp
am (C
T)5,
321
Dam
aler
imut
hur
(CT)
5,25
0
Mett
amal
ai (C
T)5,
175
Chin
naka
laya
mpu
thur
(CT)
5,16
2
Kilm
anav
ur (C
T)5,
145
Kuth
anku
zhi (
CT)
5,11
8
Nal
lipal
ayam
(CT)
5,07
8
Vella
rava
lli (C
T)5,
070
Kalp
arap
atti (C
T)5,
046
Srik
alik
apur
am (C
T)5,
044
Man
jako
llai (
CT)
5,04
0
Kuru
kkup
atti (C
T)5,
037
Chen
baga
ram
anpu
thur
(CT
)5,
028
Koil
pala
yam
(CT)
5,02
5

Handbook of Urban Statistics
314
Tow
n N
ame
Popu
latio
nSu
Palli
patt
u (C
T)4,
998
Sool
akka
rai (
CT)
4,99
0
Dev
asth
anam
(CT)
4,96
3
Mul
lipatt
u (C
T)4,
956
Vadi
(CT)
4,93
7
Ala
ngul
am (C
T)4,
930
Peri
agar
am (C
T)4,
916
Hal
e-D
harm
apur
i (CT
)4,
902
Man
cad
(CT)
4,88
9
Pool
anki
nar
(CT)
4,84
9
Thir
umal
pur
(CT)
4,80
3
Kasi
naya
gam
patti
(CT
)4,
779
Maj
arag
olla
ppatti
(CT)
4,72
7
Am
athu
r (C
T)47
08
Kann
apal
ayam
(CT)
4,70
4
Ram
alin
gapu
ram
(CT)
4,50
5
Sam
anat
ham
(CT)
4,47
7
Ara
vank
ad (T
S) (C
T)4,
438
Pora
vach
eri (
CT)
4,42
2
Vann
iyoo
r (C
T)4,
319
Mad
ahar
pakk
am (C
T)4,
250
Tiru
mal
aigi
ri (C
T)4,
107
Man
akud
i (CT
)4,
083
Sund
arap
andi
anpa
ttina
m (C
T)4,
007
Mev
alur
kupp
am (C
T)3,
805
Pudu
cher
ry
Ozh
ukar
ai (M
)30
0,10
4
Pudu
cher
ry (M
)24
4,37
7
Kara
ikal
(M)
86,8
38
Tow
n N
ame
Popu
latio
nYa
nam
(M)
55,6
26
Mah
e (M
)41
,816
Kuru
mba
pet (
GP)
19,5
06
Villi
anur
(CT)
34,3
83
Ari
anku
ppam
(CT)
29,8
08
Man
avel
y (C
T)15
,666
Thir
umal
aira
yanp
attina
m (C
T)11
,264
And
aman
& N
icob
ar Is
land
s
Port
Bla
ir (M
Cl)
108,
058
Gar
acha
rma
(CT)
14,4
19
Prot
hrap
ur (C
T)10
,308
Bam
boofl
at (C
T)7,
962
Baku
ltala
(CT)
2,74
1CB
: Can
tonm
ent B
oard
CMC
: C
ity M
unic
ipal
Cou
ncil
CT
: C
ensu
s To
wn
I.N.A
. : I
ndus
tria
l Noti
fied
Are
aIT
S : I
ndus
tria
l Tow
nshi
pM
: M
unic
ipal
ityM
.B
: M
unic
ipal
Boa
rdM
C
: M
unic
ipal
Com
mitt
eeM
Cl
: M
unic
ipal
Cou
ncil
M.C
orp.
: M
unic
ipal
Cor
pora
tion
N.A
.C
: Noti
fied
Are
a Co
mm
ittee
/Noti
fied
Are
a Co
unci
lN
P
: N
agar
Pan
chay
at/
Nag
ar P
aris
had
NPP
: Nag
ar P
alik
a Pa
rish
adN
T
: N
otifie
d To
wn
NTA
: Noti
fied
Tow
n A
rea
TC
: Tow
n Co
mm
ittee
/Tow
n A
rea
Com
mitt
eeTM
C
: Tow
n M
unic
ipal
Cou
ncil
TS
: Tow
nshi
pTP
: T
own
Panc
haya
tSo
urce
: Ce
nsus
of I
ndia
201
1

Performance of Cities under Urban reforms Indicators
2Annexure


Annexure-2: Performance of Cities under Urban reforms Indicators
317
Annexure 2. Performance of Cities under Urban reforms Indicators
2.1: JnNURM Reforms Implementation
In Jawaharlal Nehru National Urban Renewal Mission (JnNURM), there were set of 23 reforms. These were divided in three groups, namely State level (6), ULB level (7) and Optional (10). All 23 reforms were mandatory in terms of implementation and these need to be completed within the Mission period by the States and ULBs/Parastatals.Optional reforms were only optional in terms of the implementation agency (ULB/State).
S.No. State Level Reforms
1 Implementation of 74th Constitution Amendment Act (CAA)
2 Integration of City Planning & Delivery Functions
3 Reform in Rent Control
4 Stamp duty rationalization to 5%
5 Repeal of Urban Land Ceiling & Regulation Act (ULCRA)
6 Enactment of Community Participation Law
7 Enactment of Public Disclosure Law
Urban local Body (ULB) Level Reforms
1 e-Governance
2 Shift to Accrual based Double Entry Accounting
3 Property Tax (85% Coverage & 90% Collection Efficiency)
4 100% cost recovery (Water Supply & SWM)
5 Internal Earmarking of Funds for Services to Urban Poor
6 Provision of Basic Services to Urban Poor
Optional Reforms
1 Introduction of Property Title Certification System in municipalities
2 Revision of Building Bye laws – streamlining the Approval Process
3 Revision of Building Bye laws – To make rain water harvesting mandatory
4 Earmarking 25% developed land in all housing projects for EWS/LIG
5Simplification of Legal and Procedural framework for conversion of agricultural land for non-agricultural purposes
6 Introduction of computerized process of Registration of Land and Property
7 Byelaws on Reuse of Recycled Water
8 Administrative Reforms
9 Structural Reforms
10 Encouraging Public Private Partnership

Handbook of Urban Statistics
318
The overall JnNURM Reforms implementation was 84% (As on 31st March, 2014). As per the Reform Performance Index, the States like Andhra Pradesh, Gujarat, Himachal Pradesh, Karnataka, Kerala, Maharashtra and Tamil Nadu have achieved more than 90% reform implementation. The ULB level reform achievement was 80%, State level was 87% and optional reform was 86% (Figure 1).
Figure 1: Reforms Implementation Status
Source: Ministry of Urban Development, Government of India.

Annexure-2: Performance of Cities under Urban reforms Indicators
319
2.2: City wise JnNURM Reform Status
S. No. States/UTs Name of UIG CityReform achievement in
percentage
1 Andhra Pradesh
Hyderabad 94.35Vijayawada 90.65
Vishakhapatnam 94.35Tirupati 93.70
2 Arunachal Pradesh Itanagar 70.333 Assam Guwahati 81.63
4 Bihar Patna 73.04Bodhgaya 70.98
5 Chandigarh Chandigarh 87.286 Chhattisgarh Raipur 89.897 Delhi Delhi 86.308 Goa Panaji 83.26
9 Gujarat
Ahmedabad 96.96Surat 97.39
Vadodara 96.41Rajkot 94.78
Porbander 81.8510 Haryana Faridabad 74.0211 Himachal Pradesh Shimla 91.74
12 Jammu & KashmirJammu 88.91Srinagar 89.78
13 JharkhandRanchi 76.74
Jamshedpur (UA) 63.15Dhanbad 65.65
14 KarnatakaBangalore 95.87
Mysore 96.30
15 KeralaKochi 93.26
Thiruvananthapuram 93.26
16 Madhya Pradesh
Bhopal 87.17Indore 88.48
Jabalpur 86.52Ujjain 81.52
17 Maharashtra
Nagpur 99.78Nanded 99.35Nashik 100.00Pune 100.00
Greater Mumbai 100.0018 Manipur Imphal 49.7819 Meghalaya Shillong 68.5920 Mizoram Aizwal 75.2221 Nagaland Kohima 44.35
22 OdishaBhubaneswar 78.80
Puri 76.85

Handbook of Urban Statistics
320
S. No. Name of States Name of CityReform achievement in
percentage23 Puducherry Puducherry 82.83
24 Punjab Amritsar 88.48Ludhiana 89.13
25 Rajasthan Jaipur 86.96Ajmer-Pushkar 86.09
26 Sikkim Gangtok 57.61
27 Tamil NaduChennai 99.35Madurai 99.78
Coimbatore 99.7828 Tripura Agartala 73.48
29 UttarakhandDehradun 78.80Haridwar 78.15Nainital 79.02
30 Uttar Pradesh
Lucknow 88.26Kanpur 88.70
Allahabad 87.93Varanasi 87.39
Agra 87.93Mathura 87.93Meerut 87.50
31 West BengalKolkata 89.24Asansol 87.28
UIG: Urban Infrastructure and Governance
Source: Ministry of Urban development, Government of India.

Annexure-2: Performance of Cities under Urban reforms Indicators
321
2.3: Summary sheet of reform implementation (State wise)
Andhra Pradesh - Reforms Calibrated Milestones & ScoresS.
No Reform Milestone Max. Score Achieved Score
ULB LEVEL REFORMS Hyderabad Vijayawada Visakhapatnam Tirupati
1 e-Governance 10.0 10.0 7.5 10.0 10.0
2 Shift to Accrual based Double Entry Accounting 10.0 10.0 8.5 10.0 10.0
3 Property Tax (85% coverage & 90% collection efficiency) 10.0 9.5 10.0 10.0 9.0
4 100% O&M cost recovery in Water Supply & SWM 10.0 10.0 8.0 9.5 9.0
5 Internal Earmarking of Funds for Services to Urban Poor 10.0 10.0 10.0 10.0 10.0
6 Provision of Basic Services to Urban Poor 10.0 10.0 7.0 10.0 10.0
Total ULB Level Score 60.0 59.5 51.0 59.5 58.0
STATE LEVEL REFORMS
1 Implementation of 74th CAA 15.0 12.5 12.5 12.5 12.5
2 Integration of City Planning & Delivery Functions 5.0 5.0 5.0 5.0 5.0
3 Reform in Rent Control 10.0 10.0 10.0 10.0 10.0
4 Stamp Duty Rationalization to 5% 10.0 10.0 10.0 10.0 10.0
5 Repeal of ULCRA 10.0 10.0 10.0 10.0 10.0
6 Enactment of Community Participation Law 10.0 10.0 10.0 10.0 10.0
7 Enactment of Public Disclosure Law 10.0 10.0 10.0 10.0 10.0
Total State Level Score 70.0 67.5 67.5 67.5 67.5
OPTIONAL REFORMS (State Level/ULB Level)
1 Introduction of Property Title Certification System in ULBs 10.0 2.5 2.5 2.5 2.5
2 Revision of Building Bye laws – streamlining the Approval Process 10.0 10.0 10.0 10.0 10.0
3 Revision of Building Bye laws – To make rain water harvesting mandatory 10.0 10.0 10.0 10.0 10.0
4 Earmarking 25% developed land in all housing projects for EWS/LIG 10.0 7.5 7.5 7.5 7.5
5 Simplification of Legal and Procedural framework for conversion of agricultural land for non-agricultural purposes 10.0 10.0 10.0 10.0 10.0
6 Introduction of computerized process of Registration of Land and Property 10.0 10.0 10.0 10.0 10.0
7 Byelaws on Reuse of Recycled Water 10.0 10.0 10.0 10.0 10.0
8 Administrative Reforms 10.0 10.0 10.0 10.0 10.0
9 Structural Reforms 10.0 10.0 10.0 10.0 10.0
10 Encouraging Public Private Participation 10.0 10.0 10.0 10.0 10.0
Total Optional Reforms Score 100.0 90.0 90.0 90.0 90.0
Total Score (23 Reforms) 230.0 217.0 208.5 217.0 215.5
% of Reforms Achievement 94.35% 90.65% 94.35% 93.70%
Calibrated Score
ULB LEVEL REFORMS 60.0 59.50 51.00 59.50 58.00
STATE LEVEL REFORMS 70.0 67.5 67.5 67.5 67.5
OPTIONAL REFORMS (State Level/ULB Level) 100.0 90.0 90.0 90.0 90.0
230.0 217.0 208.5 217.0 215.5
STATE LEVEL REFORMS % 96% 96% 96% 96%
OPTIONAL REFORMS (State Level/ULB Level) % 90% 90% 90% 90%
94.35% 90.65% 94.35% 93.70%
Overall State Performance (Calibrated) 93.26%

Handbook of Urban Statistics
322
Arunachal Pradesh - Reforms Calibrated Milestones & Scores
S.No Reform Milestone Max. Score Achieved Score
ULB LEVEL REFORMS Itanagar
1 e-Governance 10.0 1.3
2 Shift to Accrual based Double Entry Accounting 10.0 7.5
3 Property Tax (85% coverage & 90% collection efficiency) 10.0 1.0
4 100% O&M cost recovery in Water Supply & SWM 10.0 6.5
5 Internal Earmarking of Funds for Services to Urban Poor 10.0 2.5
6 Provision of Basic Services to Urban Poor 10.0 1.5
Total ULB Level Score 60.0 20.3
STATE LEVEL REFORMS
1 Implementation of 74th CAA 15.0 12.5
2 Integration of City Planning & Delivery Functions 5.0 5.0
3 Reform in Rent Control 10.0 10.0
4 Stamp Duty Rationalization to 5% 10.0 7.5
5 Repeal of ULCRA 10.0 10.0
6 Enactment of Community Participation Law 10.0 7.5
7 Enactment of Public Disclosure Law 10.0 7.5
Total State Level Score 70.0 60.0
OPTIONAL REFORMS (State Level/ULB Level)
1 Introduction of Property Title Certification System in ULBs 10.0 10.0
2 Revision of Building Bye laws – streamlining the Approval Process 10.0 10.0
3 Revision of Building Bye laws – To make rain water harvesting mandatory 10.0 10.0
4 Earmarking 25% developed land in all housing projects for EWS/LIG 10.0 7.5
5Simplification of Legal and Procedural framework for conversion of agricultural land for non-agricultural purposes
10.0 10.0
6 Introduction of computerized process of Registration of land and Property 10.0 2.0
7 Byelaws on Reuse of Recycled Water 10.0 10.0
8 Administrative Reforms 10.0 8.0
9 Structural Reforms 10.0 4.0
10 Encouraging Public Private Participation 10.0 10.0
Total Optional Reforms Score 100.0 81.5
Total Score (23 Reforms) 230.0 161.8
% of Reforms Achievement 70.33%
Calibrated Score
ULB LEVEL REFORMS 60.0 20.3
STATE LEVEL REFORMS 70.0 60.0
OPTIONAL REFORMS (State Level/ULB Level) 100.0 81.5
230.0 161.8
ULB LEVEL REFORMS % 34%
STATE LEVEL REFORMS % 86%
OPTIONAL REFORMS (State Level/ULB Level) % 82%
Overall State Performance (Calibrated) 70.33%

Annexure-2: Performance of Cities under Urban reforms Indicators
323
Assam - Reforms Calibrated Milestones & Scores
S.No Reform Milestone Max. Score Achieved Score
ULB LEVEL REFORMS Guwahati
1 e-Governance 10.0 1.3
2 Shift to Accrual based Double Entry Accounting 10.0 8.5
3 Property Tax (85% coverage & 90% collection efficiency) 10.0 8.5
4 100% O&M cost recovery in Water Supply & SWM 10.0 1.5
5 Internal Earmarking of Funds for Services to Urban Poor 10.0 7.5
6 Provision of Basic Services to Urban Poor 10.0 10.0
Total ULB Level Score 60.0 37.3STATE LEVEL REFORMS
1 Implementation of 74th CAA 15.0 14.0
2 Integration of City Planning & Delivery Functions 5.0 3.0
3 Reform in Rent Control 10.0 8.0
4 Stamp Duty Rationalization to 5% 10.0 10.0
5 Repeal of ULCRA 10.0 10.0
6 Enactment of Community Participation Law 10.0 10.0
7 Enactment of Public Disclosure Law 10.0 10.0
Total State Level Score 70.0 65.0
OPTIONAL REFORMS (State Level/ULB Level)
1 Introduction of Property Title Certification System in ULBs 10.0 10.0
2 Revision of Building Bye laws – streamlining the Approval Process 10.0 10.0
3 Revision of Building Bye laws – To make rain water harvesting mandatory 10.0 10.0
4 Earmarking 25% developed land in all housing projects for EWS/LIG 10.0 2.5
5Simplification of Legal and Procedural framework for conversion of agricultural land for non-agricultural purposes
10.0 10.0
6 Introduction of computerized process of Registration of land and Property 10.0 10.0
7 Byelaws on Reuse of Recycled Water 10.0 10.0
8 Administrative Reforms 10.0 8.0
9 Structural Reforms 10.0 5.0
10 Encouraging Public Private Participation 10.0 10.0
Total Optional Reforms Score 100.0 85.5
Total Score (23 Reforms) 230.0 187.8
% of Reforms Achievement 81.63%
Calibrated Score
ULB LEVEL REFORMS 60.0 37.3
STATE LEVEL REFORMS 70.0 65.0
OPTIONAL REFORMS (State Level/ULB Level) 100.0 85.5
230.0 187.8
ULB LEVEL REFORMS % 62%
STATE LEVEL REFORMS % 93%
OPTIONAL REFORMS (State Level/ULB Level) % 86%
Overall State Performance (Calibrated) 81.63%

Handbook of Urban Statistics
324
Bihar- Reforms Calibrated Milestones & Scores
S.No Reform Milestone Max. Score Achieved Score
ULB LEVEL REFORMS Patna Bodhgaya
1 e-Governance 10.0 5.00 6.25
2 Shift to Accrual based Double Entry Accounting 10.0 10.0 10.0
3 Property Tax (85% coverage & 90% collection efficiency) 10.0 8.5 7.0
4 100% O&M cost recovery in Water Supply & SWM 10.0 2.0 2.0
5 Internal Earmarking of Funds for Services to Urban Poor 10.0 7.5 5.0
6 Provision of Basic Services to Urban Poor 10.0 10.0 10.0
Total ULB Level Score 60.0 43.0 40.3
STATE LEVEL REFORMS
1 Implementation of 74th CAA 15.0 12.0 12.0
2 Integration of City Planning & Delivery Functions 5.0 3.0 3.0
3 Reform in Rent Control 10.0 6.0 6.0
4 Stamp Duty Rationalization to 5% 10.0 2.5 2.5
5 Repeal of ULCRA 10.0 10.0 10.0
6 Enactment of Community Participation Law 10.0 7.5 7.5
7 Enactment of Public Disclosure Law 10.0 10.0 10.0
Total State Level Score 70.0 51.0 51.0
OPTIONAL REFORMS (State Level/ULB Level)
1 Introduction of Property Title Certification System in ULBs 10.0 0.0 0.0
2 Revision of Building Bye laws – streamlining the Approval Process 10.0 10.0 10.0
3 Revision of Building Bye laws – To make rain water harvesting mandatory 10.0 10.0 10.0
4 Earmarking 25% developed land in all housing projects for EWS/LIG 10.0 0.0 0.0
5 Simplification of Legal and Procedural framework for conversion of agricultural land for non-agricultural purposes
10.0 10.0 10.0
6 Introduction of computerized process of Registration of land and Property 10.0 10.0 10.0
7 Byelaws on Reuse of Recycled Water 10.0 10.0 10.0
8 Administrative Reforms 10.0 10.0 8.0
9 Structural Reforms 10.0 4.0 4.0
10 Encouraging Public Private Participation 10.0 10.0 10.0
Total Optional Reforms Score 100.0 74.0 72.0
Total Score (23 Reforms) 230.0 168.0 163.3
% of Reforms Achievement 73.04% 70.98%
ULB Level Reforms 60.0 43.0 40.3
State Level Reforms 70.0 51.0 51.0
Optional Reforms 100.0 74.0 72.0
230.0 168.0 163.3
%
ULB Level Reforms 72% 67%
State Level Reforms 73% 73%Optional Reforms 74% 72%
Overall State Performance (Calibrated) 72.01%

Annexure-2: Performance of Cities under Urban reforms Indicators
325
Chandigarh- Reforms Calibrated Milestones & Scores
S.No Reform Milestone Max. Score Achieved Score
ULB LEVEL REFORMS Chandigarh
1 e-Governance 10.0 3.75
2 Shift to Accrual based Double Entry Accounting 10.0 4.0
3 Property Tax (85% coverage & 90% collection efficiency) 10.0 10.0
4 100% O&M cost recovery in Water Supply & SWM 10.0 5.5
5 Internal Earmarking of Funds for Services to Urban Poor 10.0 10.0
6 Provision of Basic Services to Urban Poor 10.0 10.0
Total ULB Level Score 60.0 43.3
STATE LEVEL REFORMS
1 Implementation of 74th CAA 15.0 14.0
2 Integration of City Planning & Delivery Functions 5.0 5.0
3 Reform in Rent Control 10.0 10.0
4 Stamp Duty Rationalization to 5% 10.0 10.0
5 Repeal of ULCRA 10.0 10.0
6 Enactment of Community Participation Law 10.0 7.5
7 Enactment of Public Disclosure Law 10.0 10.0
Total State Level Score 70.0 66.5
OPTIONAL REFORMS (State Level/ULB Level)
1 Introduction of Property Title Certification System in ULBs 10.0 5.0
2 Revision of Building Bye laws – streamlining the Approval Process 10.0 10.0
3 Revision of Building Bye laws – To make rain water harvesting mandatory 10.0 10.0
4 Earmarking 25% developed land in all housing projects for EWS/LIG 10.0 10.0
5Simplification of Legal and Procedural framework for conversion of agricultural land for non-agricultural purposes
10.0 10.0
6 Introduction of computerized process of Registration of land and Property 10.0 10.0
7 Byelaws on Reuse of Recycled Water 10.0 10.0
8 Administrative Reforms 10.0 10.0
9 Structural Reforms 10.0 10.0
10 Encouraging Public Private Participation 10.0 6.0
Total Optional Reforms Score 100.0 91.0
Total Score (23 Reforms) 230.0 200.8
% of Reforms Achievement 87.28%
ULB Level Reforms 60.0 43.3
State Level Reforms 70.0 66.5
Optional Reforms 100.0 91.0
230.0 200.8
ULB Level Reforms 72.1%
State Level Reforms 95.0%
Optional Reforms 91.0%
Overall State Performance (Calibrated) 87.28%

Handbook of Urban Statistics
326
Chhattisgarh - Reforms Calibrated Milestones & Scores
S.No Reform Milestone Max. Score Achieved Score
ULB LEVEL REFORMS Raipur
1 e-Governance 10.0 6.25
2 Shift to Accrual based Double Entry Accounting 10.0 8.5
3 Property Tax (85% coverage & 90% collection efficiency) 10.0 10.0
4 100% O&M cost recovery in Water Supply & SWM 10.0 8.5
5 Internal Earmarking of Funds for Services to Urban Poor 10.0 10.0
6 Provision of Basic Services to Urban Poor 10.0 10.0
Total ULB Level Score 60.0 53.3
STATE LEVEL REFORMS
1 Implementation of 74th CAA 15.0 15.0
2 Integration of City Planning & Delivery Functions 5.0 3.0
3 Reform in Rent Control 10.0 10.0
4 Stamp Duty Rationalization to 5% 10.0 10.0
5 Repeal of ULCRA 10.0 10.0
6 Enactment of Community Participation Law 10.0 7.5
7 Enactment of Public Disclosure Law 10.0 10.0
Total State Level Score 70.0 65.5
OPTIONAL REFORMS (State Level/ULB Level)
1 Introduction of Property Title Certification System in ULBs 10.0 10.0
2 Revision of Building Bye laws – streamlining the Approval Process 10.0 10.0
3 Revision of Building Bye laws – To make rain water harvesting mandatory 10.0 10.0
4 Earmarking 25% developed land in all housing projects for EWS/LIG 10.0 10.0
5Simplification of Legal and Procedural framework for conversion of agricultural land for non-agricultural purposes
10.0 10.0
6 Introduction of computerized process of Registration of land and Property 10.0 0.0
7 Byelaws on Reuse of Recycled Water 10.0 10.0
8 Administrative Reforms 10.0 8.0
9 Structural Reforms 10.0 10.0
10 Encouraging Public Private Participation 10.0 10.0
Total Optional Reforms Score 100.0 88.0
Total Score (23 Reforms) 230.0 206.8
% of Reforms Achievement 89.89%
ULB Level Reforms 60.0 53.3
State Level Reforms 70.0 65.5
Optional Reforms 100.0 88.0
230.0 206.8
%
ULB Level Reforms 89%
State Level Reforms 94%
Optional Reforms 88%
Overall State Performance (Calibrated) 89.89%
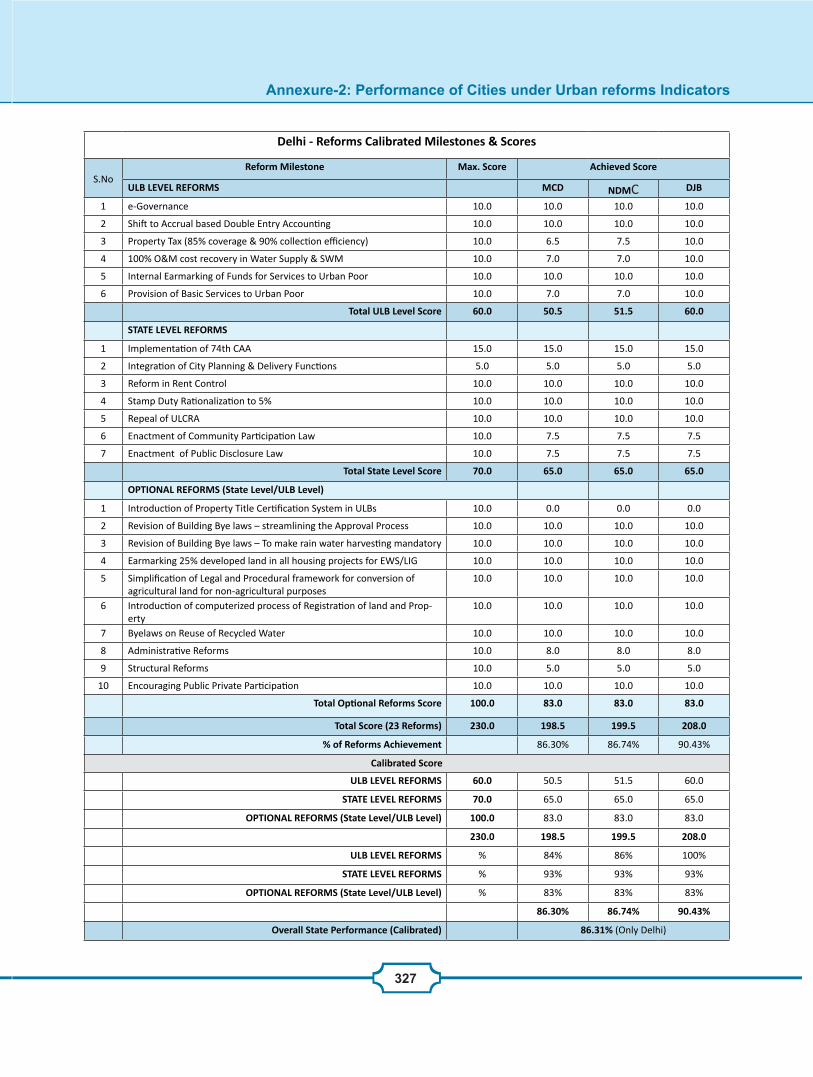
Annexure-2: Performance of Cities under Urban reforms Indicators
327
Delhi - Reforms Calibrated Milestones & Scores
S.NoReform Milestone Max. Score Achieved Score
ULB LEVEL REFORMS MCD NDMC DJB
1 e-Governance 10.0 10.0 10.0 10.0
2 Shift to Accrual based Double Entry Accounting 10.0 10.0 10.0 10.0
3 Property Tax (85% coverage & 90% collection efficiency) 10.0 6.5 7.5 10.0
4 100% O&M cost recovery in Water Supply & SWM 10.0 7.0 7.0 10.0
5 Internal Earmarking of Funds for Services to Urban Poor 10.0 10.0 10.0 10.0
6 Provision of Basic Services to Urban Poor 10.0 7.0 7.0 10.0
Total ULB Level Score 60.0 50.5 51.5 60.0
STATE LEVEL REFORMS
1 Implementation of 74th CAA 15.0 15.0 15.0 15.0
2 Integration of City Planning & Delivery Functions 5.0 5.0 5.0 5.0
3 Reform in Rent Control 10.0 10.0 10.0 10.0
4 Stamp Duty Rationalization to 5% 10.0 10.0 10.0 10.0
5 Repeal of ULCRA 10.0 10.0 10.0 10.0
6 Enactment of Community Participation Law 10.0 7.5 7.5 7.5
7 Enactment of Public Disclosure Law 10.0 7.5 7.5 7.5
Total State Level Score 70.0 65.0 65.0 65.0
OPTIONAL REFORMS (State Level/ULB Level)
1 Introduction of Property Title Certification System in ULBs 10.0 0.0 0.0 0.0
2 Revision of Building Bye laws – streamlining the Approval Process 10.0 10.0 10.0 10.0
3 Revision of Building Bye laws – To make rain water harvesting mandatory 10.0 10.0 10.0 10.0
4 Earmarking 25% developed land in all housing projects for EWS/LIG 10.0 10.0 10.0 10.0
5 Simplification of Legal and Procedural framework for conversion of agricultural land for non-agricultural purposes
10.0 10.0 10.0 10.0
6 Introduction of computerized process of Registration of land and Prop-erty
10.0 10.0 10.0 10.0
7 Byelaws on Reuse of Recycled Water 10.0 10.0 10.0 10.0
8 Administrative Reforms 10.0 8.0 8.0 8.0
9 Structural Reforms 10.0 5.0 5.0 5.0
10 Encouraging Public Private Participation 10.0 10.0 10.0 10.0
Total Optional Reforms Score 100.0 83.0 83.0 83.0
Total Score (23 Reforms) 230.0 198.5 199.5 208.0
% of Reforms Achievement 86.30% 86.74% 90.43%
Calibrated Score
ULB LEVEL REFORMS 60.0 50.5 51.5 60.0
STATE LEVEL REFORMS 70.0 65.0 65.0 65.0
OPTIONAL REFORMS (State Level/ULB Level) 100.0 83.0 83.0 83.0
230.0 198.5 199.5 208.0
ULB LEVEL REFORMS % 84% 86% 100%
STATE LEVEL REFORMS % 93% 93% 93%
OPTIONAL REFORMS (State Level/ULB Level) % 83% 83% 83%
86.30% 86.74% 90.43%
Overall State Performance (Calibrated) 86.31% (Only Delhi)

Handbook of Urban Statistics
328
Goa- Reforms Calibrated Milestones & Scores
S.No Reform Milestone Max. Score Achieved Score
ULB LEVEL REFORMS Panaji
1 e-Governance 10.0 5.00
2 Shift to Accrual based Double Entry Accounting 10.0 9.0
3 Property Tax (85% coverage & 90% collection efficiency) 10.0 7.5
4 100% O&M cost recovery in Water Supply & SWM 10.0 8.5
5 Internal Earmarking of Funds for Services to Urban Poor 10.0 0.0
6 Provision of Basic Services to Urban Poor 10.0 10.0
Total ULB Level Score 60.0 40.0
STATE LEVEL REFORMS
1 Implementation of 74th CAA 15.0 11.5
2 Integration of City Planning & Delivery Functions 5.0 4.0
3 Reform in Rent Control 10.0 6.0
4 Stamp Duty Rationalization to 5% 10.0 10.0
5 Repeal of ULCRA 10.0 10.0
6 Enactment of Community Participation Law 10.0 7.5
7 Enactment of Public Disclosure Law 10.0 10.0
Total State Level Score 70.0 59.0
OPTIONAL REFORMS (State Level/ULB Level)
1 Introduction of Property Title Certification System in ULBs 10.0 10.0
2 Revision of Building Bye laws – streamlining the Approval Process 10.0 10.0
3 Revision of Building Bye laws – To make rain water harvesting mandatory 10.0 10.0
4 Earmarking 25% developed land in all housing projects for EWS/LIG 10.0 2.5
5Simplification of Legal and Procedural framework for conversion of agricultural land for non-agricultural purposes
10.0 10.0
6 Introduction of computerized process of Registration of land and Property 10.0 10.0
7 Byelaws on Reuse of Recycled Water 10.0 10.0
8 Administrative Reforms 10.0 10.0
9 Structural Reforms 10.0 10.0
10 Encouraging Public Private Participation 10.0 10.0
Total Optional Reforms Score 100.0 92.5
Total Score (23 Reforms) 230.0 191.5
% of Reforms Achievement 83.26%
ULB Level Reforms 60.0 40.0
State Level Reforms 70.0 59.0
Optional Reforms 100.0 92.5
230.0 191.5
%
ULB Level Reforms 66.7%
State Level Reforms 84.3%
Optional Reforms 92.5%
Overall State Performance (Calibrated) 83.26%

Annexure-2: Performance of Cities under Urban reforms Indicators
329
Gujarat - Reforms Calibrated Milestones & Scores
S.No Reform MilestoneMax. Score
Achieved Score
ULB LEVEL REFORMS Ahmedabad Surat Vadodara Rajkot Porbandar
1 e-Governance 10.0 10.00 10.00 8.75 10.00 6.25
2 Shift to Accrual based Double Entry Accounting 10.0 10.0 10.0 10.0 9.0 7.0
3 Property Tax (85% coverage & 90% collection efficiency) 10.0 10.0 10.0 10.0 10.0 10.0
4 100% O&M cost recovery in Water Supply & SWM 10.0 9.0 10.0 9.0 5.0 5.0
5 Internal Earmarking of Funds for Services to Urban Poor 10.0 10.0 10.0 10.0 10.0 7.5
6 Provision of Basic Services to Urban Poor 10.0 10.0 10.0 10.0 10.0 10.0
Total ULB Level Score 60.0 59.0 60.0 57.8 54.0 45.8
STATE LEVEL REFORMS
1 Implementation of 74th CAA 15.0 15.0 15.0 15.0 15.0 15.0
2 Integration of City Planning & Delivery Functions 5.0 5.0 5.0 5.0 5.0 5.0
3 Reform in Rent Control 10.0 4.0 4.0 4.0 4.0 4.0
4 Stamp Duty Rationalization to 5% 10.0 10.0 10.0 10.0 10.0 10.0
5 Repeal of ULCRA 10.0 10.0 10.0 10.0 10.0 10.0
6 Enactment of Community Participation Law 10.0 10.0 10.0 10.0 10.0 10.0
7 Enactment of Public Disclosure Law 10.0 10.0 10.0 10.0 10.0 10.0
Total State Level Score 70.0 64.0 64.0 64.0 64.0 64.0
OPTIONAL REFORMS (State Level/ULB Level)
1 Introduction of Property Title Certification System in ULBs 10.0 10.0 10.0 10.0 10.0 10.0
2 Revision of Building Bye laws – streamlining the Approval Process 10.0 10.0 10.0 10.0 10.0 2.5
3Revision of Building Bye laws – To make rain water harvesting mandatory
10.0 10.0 10.0 10.0 10.0 8.0
4 Earmarking 25% developed land in all housing projects for EWS/LIG 10.0 10.0 10.0 10.0 10.0 10.0
5Simplification of Legal and Procedural framework for conversion of agricultural land for non-agricultural purposes
10.0 10.0 10.0 10.0 10.0 10.0
6Introduction of computerized process of Registration of land and Property
10.0 10.0 10.0 10.0 10.0 10.0
7 Byelaws on Reuse of Recycled Water 10.0 10.0 10.0 10.0 10.0 0.0
8 Administrative Reforms 10.0 10.0 10.0 10.0 10.0 8.0
9 Structural Reforms 10.0 10.0 10.0 10.0 10.0 10.0
10 Encouraging Public Private Participation 10.0 10.0 10.0 10.0 10.0 10.0
Total Optional Reforms Score 100.0 100.0 100.0 100.0 100.0 78.5
Total Score (23 Reforms) 230.0 223.0 224.0 221.8 218.0 188.3
% of Reforms Achievement 96.96% 97.39% 96.41% 94.78% 81.85%
ULB Level Reforms 60.0 59.0 60.0 57.8 54.0 45.8
State Level Reforms 70.0 64.0 64.0 64.0 64.0 64.0
Optional Reforms 100.0 100.0 100.0 100.0 100.0 78.5
230.0 223.0 224.0 221.8 218.0 188.3
%
ULB Level Reforms 98% 100% 96% 90% 76%
State Level Reforms 91% 91% 91% 91% 91%
Optional Reforms 100% 100% 100% 100% 79%
96.96% 97.39% 96.41% 94.78% 81.85%
Overall State Performance (Calibrated) 93.48%

Handbook of Urban Statistics
330
Haryana- Reforms Calibrated Milestones & Scores
S.No Reform Milestone Max. Score Achieved Score
ULB LEVEL REFORMS Faridabad
1 e-Governance 10.0 8.75
2 Shift to Accrual based Double Entry Accounting 10.0 7.0
3 Property Tax (85% coverage & 90% collection efficiency) 10.0 8.5
4 100% O&M cost recovery in Water Supply & SWM 10.0 5.0
5 Internal Earmarking of Funds for Services to Urban Poor 10.0 10.0
6 Provision of Basic Services to Urban Poor 10.0 7.0
Total ULB Level Score 60.0 46.3
STATE LEVEL REFORMS
1 Implementation of 74th CAA 15.0 10.5
2 Integration of City Planning & Delivery Functions 5.0 3.0
3 Reform in Rent Control 10.0 4.0
4 Stamp Duty Rationalization to 5% 10.0 5.0
5 Repeal of ULCRA 10.0 10.0
6 Enactment of Community Participation Law 10.0 7.5
7 Enactment of Public Disclosure Law 10.0 10.0
Total State Level Score 70.0 50.0
OPTIONAL REFORMS (State Level/ULB Level)
1 Introduction of Property Title Certification System in ULBs 10.0 0.0
2 Revision of Building Bye laws – streamlining the Approval Process 10.0 7.5
3 Revision of Building Bye laws – To make rain water harvesting mandatory 10.0 10.0
4 Earmarking 25% developed land in all housing projects for EWS/LIG 10.0 10.0
5Simplification of Legal and Procedural framework for conversion of agricultural land for non-agricultural purposes
10.0 7.5
6 Introduction of computerized process of Registration of land and Property 10.0 10.0
7 Byelaws on Reuse of Recycled Water 10.0 8.0
8 Administrative Reforms 10.0 6.0
9 Structural Reforms 10.0 5.0
10 Encouraging Public Private Participation 10.0 10.0
Total Optional Reforms Score 100.0 74.0
Total Score (23 Reforms) 230.0 170.3
% of Reforms Achievement 74.02%
ULB Level Reforms 60.0 46.3
State Level Reforms 70.0 50.0
Optional Reforms 100.0 74.0
230.0 170.3
%
ULB Level Reforms 77.1%
State Level Reforms 71.4%
Optional Reforms 74.0%
Overall State Performance (Calibrated) 74.02%

Annexure-2: Performance of Cities under Urban reforms Indicators
331
Himachal Pradesh- Reforms Calibrated Milestones & Scores
S.No Reform Milestone Max. Score Achieved Score
ULB LEVEL REFORMS Shimla
1 e-Governance 10.0 7.50
2 Shift to Accrual based Double Entry Accounting 10.0 10.0
3 Property Tax (85% coverage & 90% collection efficiency) 10.0 3.5
4 100% O&M cost recovery in Water Supply & SWM 10.0 5.0
5 Internal Earmarking of Funds for Services to Urban Poor 10.0 10.0
6 Provision of Basic Services to Urban Poor 10.0 10.0
Total ULB Level Score 60.0 46.0
STATE LEVEL REFORMS
1 Implementation of 74th CAA 15.0 15.0
2 Integration of City Planning & Delivery Functions 5.0 5.0
3 Reform in Rent Control 10.0 10.0
4 Stamp Duty Rationalization to 5% 10.0 10.0
5 Repeal of ULCRA 10.0 10.0
6 Enactment of Community Participation Law 10.0 10.0
7 Enactment of Public Disclosure Law 10.0 10.0
Total State Level Score 70.0 70.0
OPTIONAL REFORMS (State Level/ULB Level)
1 Introduction of Property Title Certification System in ULBs 10.0 5.0
2 Revision of Building Bye laws – streamlining the Approval Process 10.0 10.0
3 Revision of Building Bye laws – To make rain water harvesting mandatory 10.0 10.0
4 Earmarking 25% developed land in all housing projects for EWS/LIG 10.0 10.0
5 Simplification of Legal and Procedural framework for conversion of agricultural land for non-agricultural purposes 10.0 10.0
6 Introduction of computerized process of Registration of land and Property 10.0 10.0
7 Byelaws on Reuse of Recycled Water 10.0 10.0
8 Administrative Reforms 10.0 10.0
9 Structural Reforms 10.0 10.0
10 Encouraging Public Private Participation 10.0 10.0
Total Optional Reforms Score 100.0 95.0
Total Score (23 Reforms) 230.0 211.0
% of Reforms Achievement 91.74%
ULB Level Reforms 60.0 46.0
State Level Reforms 70.0 70.0
Optional Reforms 100.0 95.0
230.0 211.0
%
ULB Level Reforms 76.7%
State Level Reforms 100.0%
Optional Reforms 95.0%
Overall State Performance (Calibrated) 91.74%

Handbook of Urban Statistics
332
Jammu & Kashmir - Reforms Calibrated Milestones & Scores
S.No Reform Milestone Max. Score Achieved Score
ULB LEVEL REFORMS Jammu Srinagar
1 e-Governance 10.0 7.5 7.5
2 Shift to Accrual based Double Entry Accounting 10.0 10.0 10.0
3 Property Tax (85% coverage & 90% collection efficiency) 10.0 2.0 2.0
4 100% O&M cost recovery in Water Supply & SWM 10.0 5.0 7.0
5 Internal Earmarking of Funds for Services to Urban Poor 10.0 10.0 10.0
6 Provision of Basic Services to Urban Poor 10.0 10.0 10.0
Total ULB Level Score 60.0 44.5 46.5
STATE LEVEL REFORMS
1 Implementation of 74th CAA 15.0 15.0 15.0
2 Integration of City Planning & Delivery Functions 5.0 5.0 5.0
3 Reform in Rent Control 10.0 10.0 10.0
4 Stamp Duty Rationalization to 5% 10.0 5.0 5.0
5 Repeal of ULCRA 10.0 10.0 10.0
6 Enactment of Community Participation Law 10.0 10.0 10.0
7 Enactment of Public Disclosure Law 10.0 10.0 10.0
Total State Level Score 70.0 65.0 65.0
OPTIONAL REFORMS (State Level/ULB Level)
1 Introduction of Property Title Certification System in ULBs 10.0 10.0 10.0
2 Revision of Building Bye laws – streamlining the Approval Process 10.0 10.0 10.0
3 Revision of Building Bye laws – To make rain water harvesting mandatory 10.0 10.0 10.0
4 Earmarking 25% developed land in all housing projects for EWS/LIG 10.0 10.0 10.0
5 Simplification of Legal and Procedural framework for conversion of agricultural land for non-agricultural purposes 10.0 10.0 10.0
6 Introduction of computerized process of Registration of land and Property 10.0 10.0 10.0
7 Byelaws on Reuse of Recycled Water 10.0 10.0 10.0
8 Administrative Reforms 10.0 10.0 10.0
9 Structural Reforms 10.0 5.0 5.0
10 Encouraging Public Private Participation 10.0 10.0 10.0
Total Optional Reforms Score 100.0 95.0 95.0
Total Score (23 Reforms) 230.0 204.5 206.5
% of Reforms Achievement 88.91% 89.78%
Calibrated Score
ULB LEVEL REFORMS 60.0 44.5 46.5
STATE LEVEL REFORMS 70.0 65.0 65.0
OPTIONAL REFORMS (State Level/ULB Level) 100.0 95.0 95.0
230.0 204.5 206.5
ULB LEVEL REFORMS % 74% 78%
STATE LEVEL REFORMS % 93% 93%
OPTIONAL REFORMS (State Level/ULB Level) % 95% 95%
88.91% 89.78%
Overall State Performance (Calibrated) 89.35%

Annexure-2: Performance of Cities under Urban reforms Indicators
333
Jharkhand- Reforms Calibrated Milestones & Scores
S.No Reform Milestone Max. Score Achieved Score
ULB LEVEL REFORMS Ranchi Jamshedpur Dhanbad
1 e-Governance 10.0 7.5 3.8 5.0
2 Shift to Accrual based Double Entry Accounting 10.0 10.0 6.5 5.5
3 Property Tax (85% coverage & 90% collection efficiency) 10.0 6.0 4.0 5.5
4 100% O&M cost recovery in Water Supply & SWM 10.0 4.0 0.5 2.0
5 Internal Earmarking of Funds for Services to Urban Poor 10.0 7.5 2.5 5.0
6 Provision of Basic Services to Urban Poor 10.0 10.0 8.0 8.0
Total ULB Level Score 60.0 45.0 25.3 31.0
STATE LEVEL REFORMS
1 Implementation of 74th CAA 15.0 15.0 15.0 15.0
2 Integration of City Planning & Delivery Functions 5.0 3.0 3.0 3.0
3 Reform in Rent Control 10.0 10.0 10.0 10.0
4 Stamp Duty Rationalization to 5% 10.0 10.0 10.0 10.0
5 Repeal of ULCRA 10.0 10.0 10.0 10.0
6 Enactment of Community Participation Law 10.0 2.5 2.5 2.5
7 Enactment of Public Disclosure Law 10.0 10.0 10.0 10.0
Total State Level Score 70.0 60.5 60.5 60.5
OPTIONAL REFORMS (State Level/ULB Level)
1 Introduction of Property Title Certification System in ULBs 10.0 0.0 0.0 0.0
2 Revision of Building Bye laws – streamlining the Approval Process 10.0 10.0 10.0 7.5
3 Revision of Building Bye laws – To make rain water harvesting mandatory 10.0 10.0 8.0 8.0
4 Earmarking 25% developed land in all housing projects for EWS/LIG 10.0 7.5 7.5 7.5
5 Simplification of Legal and Procedural framework for conversion of agricultural land for non-agricultural purposes 10.0 2.5 2.5 2.5
6 Introduction of computerized process of Registration of land and Property 10.0 10.0 10.0 10.0
7 Byelaws on Reuse of Recycled Water 10.0 10.0 8.0 8.0
8 Administrative Reforms 10.0 8.0 4.0 4.0
9 Structural Reforms 10.0 5.0 1.5 4.0
10 Encouraging Public Private Participation 10.0 8.0 8.0 8.0
Total Optional Reforms Score 100.0 71.0 59.5 59.5
Total Score (23 Reforms) 230.0 176.5 145.3 151.0
% of Reforms Achievement 76.74% 63.15% 65.65%
Calibrated Score
ULB LEVEL REFORMS 60.0 45.0 25.3 31.0
STATE LEVEL REFORMS 70.0 60.5 60.5 60.5
OPTIONAL REFORMS (State Level/ULB Level) 100.0 71.0 59.5 59.5
230.0 176.5 145.3 151.0
ULB LEVEL REFORMS % 75% 42% 52%
STATE LEVEL REFORMS % 86% 86% 86%
OPTIONAL REFORMS (State Level/ULB Level) % 71% 60% 60%
76.74% 63.15% 65.65%
Overall State Performance (Calibrated) 68.51%

Handbook of Urban Statistics
334
Karnataka - Reforms Calibrated Milestones & Scores
S.No Reform Milestone Max. Score Achieved Score
ULB LEVEL REFORMS Bangalore Mysore
1 e-Governance 10.0 10.0 10.0
2 Shift to Accrual based Double Entry Accounting 10.0 10.0 10.0
3 Property Tax (85% coverage & 90% collection efficiency) 10.0 10.0 9.5
4 100% O&M cost recovery in Water Supply & SWM 10.0 7.5 9.0
5 Internal Earmarking of Funds for Services to Urban Poor 10.0 10.0 10.0
6 Provision of Basic Services to Urban Poor 10.0 10.0 10.0
Total ULB Level Score 60.0 57.5 58.5
STATE LEVEL REFORMS
1 Implementation of 74th CAA 15.0 15.0 15.0
2 Integration of City Planning & Delivery Functions 5.0 3.0 3.0
3 Reform in Rent Control 10.0 10.0 10.0
4 Stamp Duty Rationalization to 5% 10.0 10.0 10.0
5 Repeal of ULCRA 10.0 10.0 10.0
6 Enactment of Community Participation Law 10.0 10.0 10.0
7 Enactment of Public Disclosure Law 10.0 10.0 10.0
Total State Level Score 70.0 68.0 68.0
OPTIONAL REFORMS (State Level/ULB Level)
1 Introduction of Property Title Certification System in ULBs 10.0 10.0 10.0
2 Revision of Building Bye laws – streamlining the Approval Process 10.0 10.0 10.0
3 Revision of Building Bye laws – To make rain water harvesting mandatory 10.0 10.0 10.0
4 Earmarking 25% developed land in all housing projects for EWS/LIG 10.0 5.0 5.0
5 Simplification of Legal and Procedural framework for conversion of agricultural land for non-agricultural purposes 10.0 10.0 10.0
6 Introduction of computerized process of Registration of land and Property 10.0 10.0 10.0
7 Byelaws on Reuse of Recycled Water 10.0 10.0 10.0
8 Administrative Reforms 10.0 10.0 10.0
9 Structural Reforms 10.0 10.0 10.0
10 Encouraging Public Private Participation 10.0 10.0 10.0
Total Optional Reforms Score 100.0 95.0 95.0
Total Score (23 Reforms) 230.0 220.5 221.5
% of Reforms Achievement 95.87% 96.30%
Calibrated Score
ULB LEVEL REFORMS 60.0 57.5 58.5
STATE LEVEL REFORMS 70.0 68.0 68.0
OPTIONAL REFORMS (State Level/ULB Level) 100.0 95.0 95.0
230.0 220.5 221.5
ULB LEVEL REFORMS % 96% 98%
STATE LEVEL REFORMS % 97% 97%
OPTIONAL REFORMS (State Level/ULB Level) % 95% 95%
95.87% 96.30%
Overall State Performance (Calibrated) 96.09%

Annexure-2: Performance of Cities under Urban reforms Indicators
335
Kerala - Reforms Calibrated Milestones & Scores
S.No Reform Milestone Max. Score Achieved Score
ULB LEVEL REFORMS Kochi Tiruvananthapuram
1 e-Governance 10.0 10.0 10.0
2 Shift to Accrual based Double Entry Accounting 10.0 10.0 10.0
3 Property Tax (85% coverage & 90% collection efficiency) 10.0 10.0 10.0
4 100% O&M cost recovery in Water Supply & SWM 10.0 9.5 9.5
5 Internal Earmarking of Funds for Services to Urban Poor 10.0 10.0 10.0
6 Provision of Basic Services to Urban Poor 10.0 10.0 10.0
Total ULB Level Score 60.0 59.5 59.5
STATE LEVEL REFORMS
1 Implementation of 74th CAA 15.0 15.0 15.0
2 Integration of City Planning & Delivery Functions 5.0 5.0 5.0
3 Reform in Rent Control 10.0 10.0 10.0
4 Stamp Duty Rationalization to 5% 10.0 5.0 5.0
5 Repeal of ULCRA 10.0 10.0 10.0
6 Enactment of Community Participation Law 10.0 10.0 10.0
7 Enactment of Public Disclosure Law 10.0 10.0 10.0
Total State Level Score 70.0 65.0 65.0
OPTIONAL REFORMS (State Level/ULB Level)
1 Introduction of Property Title Certification System in ULBs 10.0 10.0 10.0
2 Revision of Building Bye laws – streamlining the Approval Process 10.0 10.0 10.0
3 Revision of Building Bye laws – To make rain water harvesting mandatory 10.0 10.0 10.0
4 Earmarking 25% developed land in all housing projects for EWS/LIG 10.0 0.0 0.0
5 Simplification of Legal and Procedural framework for conversion of agricultural land for non-agricultural purposes 10.0 10.0 10.0
6 Introduction of computerized process of Registration of land and Property 10.0 10.0 10.0
7 Byelaws on Reuse of Recycled Water 10.0 10.0 10.0
8 Administrative Reforms 10.0 10.0 10.0
9 Structural Reforms 10.0 10.0 10.0
10 Encouraging Public Private Participation 100.0 10.0 10.0
Total Optional Reforms Score 230.0 90.0 90.0
Total Score (23 Reforms) 214.5 214.5
% of Reforms Achievement 93.26% 93.26%
Calibrated Score
ULB LEVEL REFORMS 60.0 59.5 59.5
STATE LEVEL REFORMS 70.0 65.0 65.0
OPTIONAL REFORMS (State Level/ULB Level) 100.0 90.0 90.0
230.0 214.5 214.5
ULB LEVEL REFORMS % 99% 99%
STATE LEVEL REFORMS % 93% 93%
OPTIONAL REFORMS (State Level/ULB Level) % 90% 90%
93.26% 93.26%
Overall State Performance (Calibrated) 93.26%

Handbook of Urban Statistics
336
Madhya Pradesh – Reforms Calibrated Milestones & Scores
S.No Reform Milestone Max. Score Achieved Score
ULB LEVEL REFORMS Bhopal Indore Jabalpur Ujjain
1 e-Governance 10.0 10.0 10.0 10.0 5.0
2 Shift to Accrual based Double Entry Accounting 10.0 10.0 10.0 10.0 10.0
3 Property Tax (85% coverage & 90% collection efficiency) 10.0 10.0 10.0 8.5 6.0
4 100% O&M cost recovery in Water Supply & SWM 10.0 5.0 8.0 5.0 3.0
5 Internal Earmarking of Funds for Services to Urban Poor 10.0 10.0 10.0 10.0 10.0
6 Provision of Basic Services to Urban Poor 10.0 10.0 10.0 10.0 10.0
Total ULB Level Score 60.0 55.0 58.0 53.5 44.0
STATE LEVEL REFORMS
1 Implementation of 74th CAA 15.0 13.0 13.0 13.0 13.0
2 Integration of City Planning & Delivery Functions 5.0 5.0 5.0 5.0 5.0
3 Reform in Rent Control 10.0 10.0 10.0 10.0 10.0
4 Stamp Duty Rationalization to 5% 10.0 5.0 5.0 5.0 5.0
5 Repeal of ULCRA 10.0 10.0 10.0 10.0 10.0
6 Enactment of Community Participation Law 10.0 7.5 7.5 7.5 7.5
7 Enactment of Public Disclosure Law 10.0 10.0 10.0 10.0 10.0
Total State Level Score 70.0 60.5 60.5 60.5 60.5
OPTIONAL REFORMS (State Level/ULB Level)
1 Introduction of Property Title Certification System in ULBs 10.0 10.0 10.0 10.0 10.0
2 Revision of Building Bye laws – streamlining the Approval Process 10.0 10.0 10.0 10.0 10.0
3 Revision of Building Bye laws – To make rain water harvesting mandatory 10.0 10.0 10.0 10.0 10.0
4 Earmarking 25% developed land in all housing projects for EWS/LIG 10.0 5.0 5.0 5.0 5.0
5 Simplification of Legal and Procedural framework for conversion of agricultural land for non-agricultural purposes 10.0 10.0 10.0 10.0 10.0
6 Introduction of computerized process of Registration of land and Property 10.0 0.0 0.0 0.0 0.0
7 Byelaws on Reuse of Recycled Water 10.0 10.0 10.0 10.0 10.0
8 Administrative Reforms 10.0 10.0 10.0 10.0 8.0
9 Structural Reforms 10.0 10.0 10.0 10.0 10.0
10 Encouraging Public Private Participation 10.0 10.0 10.0 10.0 10.0
Total Optional Reforms Score 100.0 85.0 85.0 85.0 83.0
Total Score (23 Reforms) 230.0 200.5 203.5 199.0 187.5
% of Reforms Achievement 87.17% 88.48% 86.52% 81.52%
Calibrated Score
ULB LEVEL REFORMS 60.0 55.0 58.0 53.5 44.0
STATE LEVEL REFORMS 70.0 60.5 60.5 60.5 60.5
OPTIONAL REFORMS (State Level/ULB Level) 100.0 85.0 85.0 85.0 83.0
230.0 200.5 203.5 199.0 187.5
ULB LEVEL REFORMS % 92% 97% 89% 73%
STATE LEVEL REFORMS % 86% 86% 86% 86%
OPTIONAL REFORMS (State Level/ULB Level) % 85% 85% 85% 83%
87.17% 88.48% 86.52% 81.52%
Overall State Performance (Calibrated) 85.92%

Annexure-2: Performance of Cities under Urban reforms Indicators
337
Maharashtra – Reforms Calibrated Milestones & Scores
S.No Reform Milestone Max. Score Achieved Score
ULB LEVEL REFORMS Nagpur Nanded Nashik Pune Greater Mumbai
1 e-Governance 10.0 10.00 10.00 10.00 10.00 10.00
2 Shift to Accrual based Double Entry Accounting 10.0 10.0 8.5 10.0 10.0 10.0
3 Property Tax (85% coverage & 90% collection efficiency) 10.0 10.0 10.0 10.0 10.0 10.0
4 100% O&M cost recovery in Water Supply & SWM 10.0 9.5 10.0 10.0 10.0 10.0
5 Internal Earmarking of Funds for Services to Urban Poor 10.0 10.0 10.0 10.0 10.0 10.0
6 Provision of Basic Services to Urban Poor 10.0 10.0 10.0 10.0 10.0 10.0
Total ULB Level Score 60.0 59.5 58.5 60.0 60.0 60.0
STATE LEVEL REFORMS
1 Implementation of 74th CAA 15.0 15.0 15.0 15.0 15.0 15.0
2 Integration of City Planning & Delivery Functions 5.0 5.0 5.0 5.0 5.0 5.0
3 Reform in Rent Control 10.0 10.0 10.0 10.0 10.0 10.0
4 Stamp Duty Rationalization to 5% 10.0 10.0 10.0 10.0 10.0 10.0
5 Repeal of ULCRA 10.0 10.0 10.0 10.0 10.0 10.0
6 Enactment of Community Participation Law 10.0 10.0 10.0 10.0 10.0 10.0
7 Enactment of Public Disclosure Law 10.0 10.0 10.0 10.0 10.0 10.0
Total State Level Score 70.0 70.0 70.0 70.0 70.0 70.0
OPTIONAL REFORMS (State Level/ULB Level)
1 Introduction of Property Title Certification System in ULBs 10.0 10.0 10.0 10.0 10.0 10.0
2 Revision of Building Bye laws – streamlining the Approval Process 10.0 10.0 10.0 10.0 10.0 10.0
3 Revision of Building Bye laws – To make rain water harvesting mandatory 10.0 10.0 10.0 10.0 10.0 10.0
4 Earmarking 25% developed land in all housing projects for EWS/LIG 10.0 10.0 10.0 10.0 10.0 10.0
5 Simplification of Legal and Procedural framework for conversion of agricultural land for non-agricultural purposes 10.0 10.0 10.0 10.0 10.0 10.0
6 Introduction of computerized process of Registration of land and Property 10.0 10.0 10.0 10.0 10.0 10.0
7 Byelaws on Reuse of Recycled Water 10.0 10.0 10.0 10.0 10.0 10.0
8 Administrative Reforms 10.0 10.0 10.0 10.0 10.0 10.0
9 Structural Reforms 10.0 10.0 10.0 10.0 10.0 10.0
10 Encouraging Public Private Participation 10.0 10.0 10.0 10.0 10.0 10.0
Total Optional Reforms Score 100.0 100.0 100.0 100.0 100.0 100.0
Total Score (23 Reforms) 230.0 229.5 228.5 230.0 230.0 230.0
% of Reforms Achievement 99.78% 99.35% 100.00% 100.00% 100.00%
ULB Level Reforms 60.0 59.5 58.5 60.0 60.0 60.0
State Level Reforms 70.0 70.0 70.0 70.0 70.0 70.0
Optional Reforms 100.0 100.0 100.0 100.0 100.0 100.0
230.0 229.5 228.5 230.0 230.0 230.0
%
ULB Level Reforms 99% 98% 100% 100% 100%
State Level Reforms 100% 100% 100% 100% 100%
Optional Reforms 100% 100% 100% 100% 100%
99.78% 99.35% 100.00% 100.00% 100.00%
Overall State Performance (Calibrated) 99.83%

Handbook of Urban Statistics
338
Manipur - Reforms Calibrated Milestones & Scores
S.No Reform Milestone Max. Score Achieved Score
ULB LEVEL REFORMS Imphal
1 e-Governance 10.0 0.0
2 Shift to Accrual based Double Entry Accounting 10.0 3.0
3 Property Tax (85% coverage & 90% collection efficiency) 10.0 1.0
4 100% O&M cost recovery in Water Supply & SWM 10.0 0.0
5 Internal Earmarking of Funds for Services to Urban Poor 10.0 7.5
6 Provision of Basic Services to Urban Poor 10.0 1.5
Total ULB Level Score 60.0 13.0
STATE LEVEL REFORMS
1 Implementation of 74th CAA 15.0 9.5
2 Integration of City Planning & Delivery Functions 5.0 2.0
3 Reform in Rent Control 10.0 0.0
4 Stamp Duty Rationalization to 5% 10.0 7.5
5 Repeal of ULCRA 10.0 10.0
6 Enactment of Community Participation Law 10.0 5.0
7 Enactment of Public Disclosure Law 10.0 7.5
Total State Level Score 70.0 41.5
OPTIONAL REFORMS (State Level/ULB Level)
1 Introduction of Property Title Certification System in ULBs 10.0 0.0
2 Revision of Building Bye laws – streamlining the Approval Process 10.0 10.0
3 Revision of Building Bye laws – To make rain water harvesting mandatory 10.0 10.0
4 Earmarking 25% developed land in all housing projects for EWS/LIG 10.0 5.0
5 Simplification of Legal and Procedural framework for conversion of agricultural land for non-agricultural purposes 10.0 5.0
6 Introduction of computerized process of Registration of land and Property 10.0 10.0
7 Byelaws on Reuse of Recycled Water 10.0 10.0
8 Administrative Reforms 10.0 4.0
9 Structural Reforms 10.0 4.0
10 Encouraging Public Private Participation 10.0 2.0
Total Optional Reforms Score 100.0 60.0
Total Score (23 Reforms) 230.0 114.5
% of Reforms Achievement 49.78%
Calibrated Score
ULB LEVEL REFORMS 60.0 13.0
STATE LEVEL REFORMS 70.0 41.5
OPTIONAL REFORMS (State Level/ULB Level) 100.0 60.0
230.0 114.5
ULB LEVEL REFORMS % 22%
STATE LEVEL REFORMS % 59%
OPTIONAL REFORMS (State Level/ULB Level) % 60%
49.78%
Overall State Performance (Calibrated) 49.78%

Annexure-2: Performance of Cities under Urban reforms Indicators
339
Meghalaya- Reforms Calibrated Milestones & Scores
S.No Reform Milestone Max. Score Achieved Score
ULB LEVEL REFORMS Shillong
1 e-Governance 10.0 3.8
2 Shift to Accrual based Double Entry Accounting 10.0 7.5
3 Property Tax (85% coverage & 90% collection efficiency) 10.0 9.0
4 100% O&M cost recovery in Water Supply & SWM 10.0 8.0
5 Internal Earmarking of Funds for Services to Urban Poor 10.0 10.0
6 Provision of Basic Services to Urban Poor 10.0 9.0
Total ULB Level Score 60.0 47.3
STATE LEVEL REFORMS
1 Implementation of 74th CAA 15.0 14.0
2 Integration of City Planning & Delivery Functions 5.0 3.0
3 Reform in Rent Control 10.0 6.0
4 Stamp Duty Rationalization to 5% 10.0 7.5
5 Repeal of ULCRA 10.0 10.0
6 Enactment of Community Participation Law 10.0 2.5
7 Enactment of Public Disclosure Law 10.0 10.0
Total State Level Score 70.0 53.0
OPTIONAL REFORMS (State Level/ULB Level)
1 Introduction of Property Title Certification System in ULBs 10.0 0.0
2 Revision of Building Bye laws – streamlining the Approval Process 10.0 10.0
3 Revision of Building Bye laws – To make rain water harvesting mandatory 10.0 10.0
4 Earmarking 25% developed land in all housing projects for EWS/LIG 10.0 7.5
5 Simplification of Legal and Procedural framework for conversion of agricultural land for non-agricultural purposes 10.0 0.0
6 Introduction of computerized process of Registration of land and Property 10.0 10.0
7 Byelaws on Reuse of Recycled Water 10.0 10.0
8 Administrative Reforms 10.0 4.0
9 Structural Reforms 10.0 0.0
10 Encouraging Public Private Participation 10.0 6.0
Total Optional Reforms Score 100.0 57.5
Total Score (23 Reforms) 230.0 157.8
% of Reforms Achievement 68.59%
Calibrated Score
ULB LEVEL REFORMS 60.0 47.3
STATE LEVEL REFORMS 70.0 53.0
OPTIONAL REFORMS (State Level/ULB Level) 100.0 57.5
230.0 157.8
ULB LEVEL REFORMS % 79%
STATE LEVEL REFORMS % 76%
OPTIONAL REFORMS (State Level/ULB Level) % 58%
68.59%
Overall State Performance (Calibrated) 68.59%

Handbook of Urban Statistics
340
Mizoram - Reforms Calibrated Milestones & Scores
S.No Reform Milestone Max. Score Achieved Score
ULB LEVEL REFORMS Aizwal
1 e-Governance 10.0 2.5
2 Shift to Accrual based Double Entry Accounting 10.0 7.5
3 Property Tax (85% coverage & 90% collection efficiency) 10.0 2.0
4 100% O&M cost recovery in Water Supply & SWM 10.0 2.0
5 Internal Earmarking of Funds for Services to Urban Poor 10.0 7.5
6 Provision of Basic Services to Urban Poor 10.0 9.0
Total ULB Level Score 60.0 30.5
STATE LEVEL REFORMS
1 Implementation of 74th CAA 15.0 12.0
2 Integration of City Planning & Delivery Functions 5.0 3.0
3 Reform in Rent Control 10.0 10.0
4 Stamp Duty Rationalization to 5% 10.0 7.5
5 Repeal of ULCRA 10.0 10.0
6 Enactment of Community Participation Law 10.0 10.0
7 Enactment of Public Disclosure Law 10.0 10.0
Total State Level Score 70.0 62.5
OPTIONAL REFORMS (State Level/ULB Level)
1 Introduction of Property Title Certification System in ULBs 10.0 10.0
2 Revision of Building Bye laws – streamlining the Approval Process 10.0 10.0
3 Revision of Building Bye laws – To make rain water harvesting mandatory 10.0 10.0
4 Earmarking 25% developed land in all housing projects for EWS/LIG 10.0 5.0
5 Simplification of Legal and Procedural framework for conversion of agricultural land for non-agricultural purposes 10.0 10.0
6 Introduction of computerized process of Registration of land and Property 10.0 7.0
7 Byelaws on Reuse of Recycled Water 10.0 10.0
8 Administrative Reforms 10.0 6.0
9 Structural Reforms 10.0 4.0
10 Encouraging Public Private Participation 10.0 8.0
Total Optional Reforms Score 100.0 80.0
Total Score (23 Reforms) 230.0 173.0
% of Reforms Achievement 75.22%
Calibrated Score
ULB LEVEL REFORMS 60.0 30.5
STATE LEVEL REFORMS 70.0 62.5
OPTIONAL REFORMS (State Level/ULB Level) 100.0 80.0
230.0 173.0
ULB LEVEL REFORMS % 51%
STATE LEVEL REFORMS % 89%
OPTIONAL REFORMS (State Level/ULB Level) % 80%
75.22%
Overall State Performance (Calibrated) 75.22%

Annexure-2: Performance of Cities under Urban reforms Indicators
341
Nagaland - Reforms Calibrated Milestones & Scores
S.No Reform Milestone Max. Score Achieved Score
ULB LEVEL REFORMS Kohima
1 e-Governance 10.0 0.0
2 Shift to Accrual based Double Entry Accounting 10.0 0.0
3 Property Tax (85% coverage & 90% collection efficiency) 10.0 0.0
4 100% O&M cost recovery in Water Supply & SWM 10.0 0.0
5 Internal Earmarking of Funds for Services to Urban Poor 10.0 2.5
6 Provision of Basic Services to Urban Poor 10.0 1.5
Total ULB Level Score 60.0 4.0
STATE LEVEL REFORMS
1 Implementation of 74th CAA 15.0 7.5
2 Integration of City Planning & Delivery Functions 5.0 5.0
3 Reform in Rent Control 10.0 10.0
4 Stamp Duty Rationalization to 5% 10.0 5.0
5 Repeal of ULCRA 10.0 10.0
6 Enactment of Community Participation Law 10.0 7.5
7 Enactment of Public Disclosure Law 10.0 10.0
Total State Level Score 70.0 55.0
OPTIONAL REFORMS (State Level/ULB Level)
1 Introduction of Property Title Certification System in ULBs 10.0 0.0
2 Revision of Building Bye laws – streamlining the Approval Process 10.0 10.0
3 Revision of Building Bye laws – To make rain water harvesting mandatory 10.0 7.0
4 Earmarking 25% developed land in all housing projects for EWS/LIG 10.0 0.0
5 Simplification of Legal and Procedural framework for conversion of agricultural land for non-agricultural purposes 10.0 0.0
6 Introduction of computerized process of Registration of land and Property 10.0 0.0
7 Byelaws on Reuse of Recycled Water 10.0 10.0
8 Administrative Reforms 10.0 4.0
9 Structural Reforms 10.0 4.0
10 Encouraging Public Private Participation 10.0 8.0
Total Optional Reforms Score 100.0 43.0
Total Score (23 Reforms) 230.0 102.0
% of Reforms Achievement 44.35%
Calibrated Score
ULB LEVEL REFORMS 60.0 4.0
STATE LEVEL REFORMS 70.0 55.0
OPTIONAL REFORMS (State Level/ULB Level) 100.0 43.0
230.0 102.0
ULB LEVEL REFORMS % 7%
STATE LEVEL REFORMS % 79%
OPTIONAL REFORMS (State Level/ULB Level) % 43%
44.35%
Overall State Performance (Calibrated) 44.35%
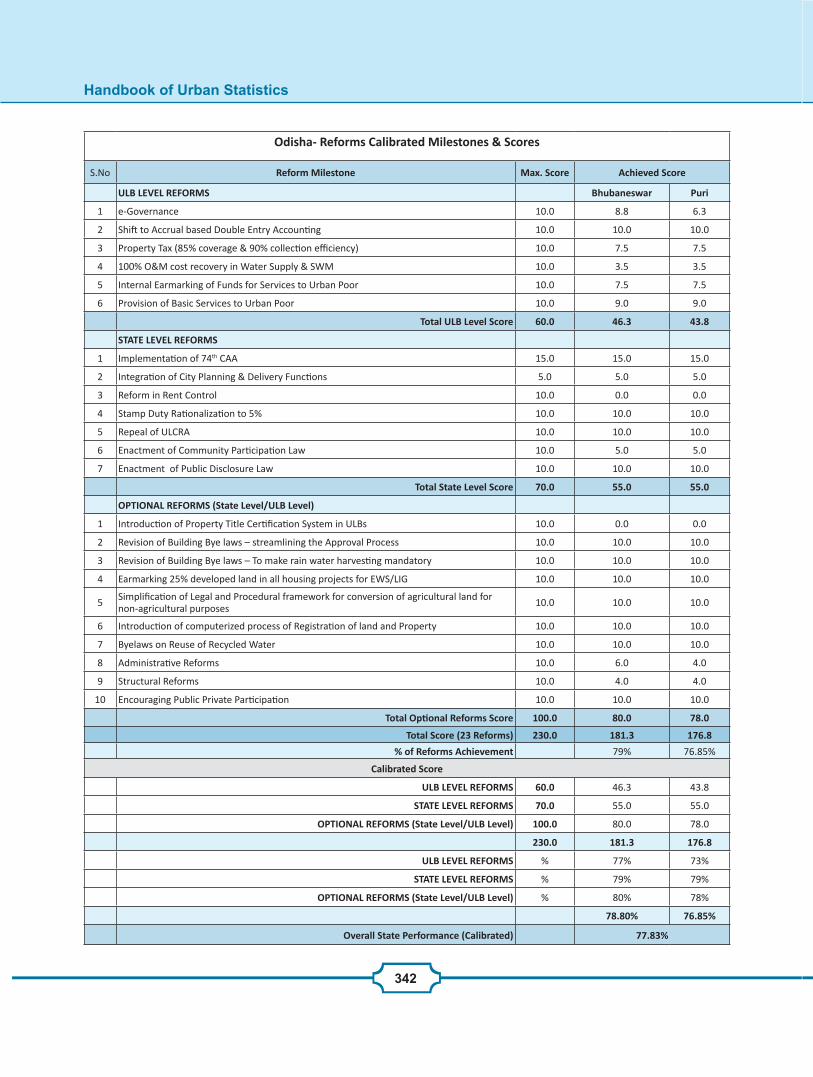
Handbook of Urban Statistics
342
Odisha- Reforms Calibrated Milestones & Scores
S.No Reform Milestone Max. Score Achieved Score
ULB LEVEL REFORMS Bhubaneswar Puri
1 e-Governance 10.0 8.8 6.3
2 Shift to Accrual based Double Entry Accounting 10.0 10.0 10.0
3 Property Tax (85% coverage & 90% collection efficiency) 10.0 7.5 7.5
4 100% O&M cost recovery in Water Supply & SWM 10.0 3.5 3.5
5 Internal Earmarking of Funds for Services to Urban Poor 10.0 7.5 7.5
6 Provision of Basic Services to Urban Poor 10.0 9.0 9.0
Total ULB Level Score 60.0 46.3 43.8
STATE LEVEL REFORMS
1 Implementation of 74th CAA 15.0 15.0 15.0
2 Integration of City Planning & Delivery Functions 5.0 5.0 5.0
3 Reform in Rent Control 10.0 0.0 0.0
4 Stamp Duty Rationalization to 5% 10.0 10.0 10.0
5 Repeal of ULCRA 10.0 10.0 10.0
6 Enactment of Community Participation Law 10.0 5.0 5.0
7 Enactment of Public Disclosure Law 10.0 10.0 10.0
Total State Level Score 70.0 55.0 55.0
OPTIONAL REFORMS (State Level/ULB Level)
1 Introduction of Property Title Certification System in ULBs 10.0 0.0 0.0
2 Revision of Building Bye laws – streamlining the Approval Process 10.0 10.0 10.0
3 Revision of Building Bye laws – To make rain water harvesting mandatory 10.0 10.0 10.0
4 Earmarking 25% developed land in all housing projects for EWS/LIG 10.0 10.0 10.0
5 Simplification of Legal and Procedural framework for conversion of agricultural land for non-agricultural purposes 10.0 10.0 10.0
6 Introduction of computerized process of Registration of land and Property 10.0 10.0 10.0
7 Byelaws on Reuse of Recycled Water 10.0 10.0 10.0
8 Administrative Reforms 10.0 6.0 4.0
9 Structural Reforms 10.0 4.0 4.0
10 Encouraging Public Private Participation 10.0 10.0 10.0
Total Optional Reforms Score 100.0 80.0 78.0
Total Score (23 Reforms) 230.0 181.3 176.8
% of Reforms Achievement 79% 76.85%
Calibrated Score
ULB LEVEL REFORMS 60.0 46.3 43.8
STATE LEVEL REFORMS 70.0 55.0 55.0
OPTIONAL REFORMS (State Level/ULB Level) 100.0 80.0 78.0
230.0 181.3 176.8
ULB LEVEL REFORMS % 77% 73%
STATE LEVEL REFORMS % 79% 79%
OPTIONAL REFORMS (State Level/ULB Level) % 80% 78%
78.80% 76.85%
Overall State Performance (Calibrated) 77.83%

Annexure-2: Performance of Cities under Urban reforms Indicators
343
Puducherry - Reforms Calibrated Milestones & Scores
S.No Reform Milestone Max. Score Achieved Score
ULB LEVEL REFORMS Puducherry
1 e-Governance 10.0 5.0
2 Shift to Accrual based Double Entry Accounting 10.0 0.0
3 Property Tax (85% coverage & 90% collection efficiency) 10.0 8.0
4 100% O&M cost recovery in Water Supply & SWM 10.0 4.5
5 Internal Earmarking of Funds for Services to Urban Poor 10.0 10.0
6 Provision of Basic Services to Urban Poor 10.0 10.0
Total ULB Level Score 60.0 37.5
STATE LEVEL REFORMS
1 Implementation of 74th CAA 15.0 15.0
2 Integration of City Planning & Delivery Functions 5.0 5.0
3 Reform in Rent Control 10.0 10.0
4 Stamp Duty Rationalization to 5% 10.0 10.0
5 Repeal of ULCRA 10.0 10.0
6 Enactment of Community Participation Law 10.0 5.0
7 Enactment of Public Disclosure Law 10.0 10.0
Total State Level Score 70.0 65.0
OPTIONAL REFORMS (State Level/ULB Level)
1 Introduction of Property Title Certification System in ULBs 10.0 10.0
2 Revision of Building Bye laws – streamlining the Approval Process 10.0 10.0
3 Revision of Building Bye laws – To make rain water harvesting mandatory 10.0 10.0
4 Earmarking 25% developed land in all housing projects for EWS/LIG 10.0 2.5
5 Simplification of Legal and Procedural framework for conversion of agricultural land for non-agricultural purposes 10.0 10.0
6 Introduction of computerized process of Registration of land and Property 10.0 10.0
7 Byelaws on Reuse of Recycled Water 10.0 10.0
8 Administrative Reforms 10.0 10.0
9 Structural Reforms 10.0 7.5
10 Encouraging Public Private Participation 10.0 8.0
Total Optional Reforms Score 100.0 88.0
Total Score (23 Reforms) 230.0 190.5
% of Reforms Achievement 82.83%
Calibrated Score
ULB LEVEL REFORMS 60.0 37.5
STATE LEVEL REFORMS 70.0 65.0
OPTIONAL REFORMS (State Level/ULB Level) 100.0 88.0
230.0 190.5
ULB LEVEL REFORMS % 63%
STATE LEVEL REFORMS % 93%
OPTIONAL REFORMS (State Level/ULB Level) % 88%
82.83%
Overall State Performance (Calibrated) 82.83%

Handbook of Urban Statistics
344
Punjab - Reforms Calibrated Milestones & Scores
S.No Reform Milestone Max. Score Achieved Score
ULB LEVEL REFORMS Amritsar Ludhiana
1 e-Governance 10.0 7.5 10.0
2 Shift to Accrual based Double Entry Accounting 10.0 8.5 8.5
3 Property Tax (85% coverage & 90% collection efficiency) 10.0 6.0 7.5
4 100% O&M cost recovery in Water Supply & SWM 10.0 7.5 4.0
5 Internal Earmarking of Funds for Services to Urban Poor 10.0 10.0 10.0
6 Provision of Basic Services to Urban Poor 10.0 9.0 10.0
Total ULB Level Score 60.0 48.5 50.0
STATE LEVEL REFORMS
1 Implementation of 74th CAA 15.0 15.0 15.0
2 Integration of City Planning & Delivery Functions 5.0 5.0 5.0
3 Reform in Rent Control 10.0 10.0 10.0
4 Stamp Duty Rationalization to 5% 10.0 10.0 10.0
5 Repeal of ULCRA 10.0 10.0 10.0
6 Enactment of Community Participation Law 10.0 5.0 5.0
7 Enactment of Public Disclosure Law 10.0 10.0 10.0
Total State Level Score 70.0 65.0 65.0
OPTIONAL REFORMS (State Level/ULB Level)
1 Introduction of Property Title Certification System in ULBs 10.0 5.0 5.0
2 Revision of Building Bye laws – streamlining the Approval Process 10.0 10.0 10.0
3 Revision of Building Bye laws – To make rain water harvesting mandatory 10.0 10.0 10.0
4 Earmarking 25% developed land in all housing projects for EWS/LIG 10.0 10.0 10.0
5 Simplification of Legal and Procedural framework for conversion of agricultural land for non-agricultural purposes 10.0 10.0 10.0
6 Introduction of computerized process of Registration of land and Property 10.0 10.0 10.0
7 Byelaws on Reuse of Recycled Water 10.0 10.0 10.0
8 Administrative Reforms 10.0 10.0 10.0
9 Structural Reforms 10.0 5.0 5.0
10 Encouraging Public Private Participation 10.0 10.0 10.0
Total Optional Reforms Score 100.0 90.0 90.0
Total Score (23 Reforms) 230.0 203.5 205.0
% of Reforms Achievement 88% 89.13%
Calibrated Score
ULB LEVEL REFORMS 60.0 48.5 50.0
STATE LEVEL REFORMS 70.0 65.0 65.0
OPTIONAL REFORMS (State Level/ULB Level) 100.0 90.0 90.0
230.0 203.5 205.0
ULB LEVEL REFORMS % 81% 83%
STATE LEVEL REFORMS % 93% 93%
OPTIONAL REFORMS (State Level/ULB Level) % 90% 90%
88.48% 89.13%
Overall State Performance (Calibrated) 88.80%

Annexure-2: Performance of Cities under Urban reforms Indicators
345
Rajasthan- Reforms Calibrated Milestones & Scores
S.No Reform Milestone Max. Score Achieved Score
ULB LEVEL REFORMS Jaipur Ajmer Pushkar
1 e-Governance 10.0 10.0 10.0 6.3
2 Shift to Accrual based Double Entry Accounting 10.0 10.0 10.0 1.5
3 Property Tax (85% coverage & 90% collection efficiency) 10.0 5.0 5.0 5.0
4 100% O&M cost recovery in Water Supply & SWM 10.0 4.0 4.0 5.0
5 Internal Earmarking of Funds for Services to Urban Poor 10.0 10.0 10.0 10.0
6 Provision of Basic Services to Urban Poor 10.0 9.0 7.0 7.0
Total ULB Level Score 60.0 48.0 46.0 34.8
STATE LEVEL REFORMS
1 Implementation of 74th CAA 15.0 14.5 14.5 14.5
2 Integration of City Planning & Delivery Functions 5.0 3.0 3.0 3.0
3 Reform in Rent Control 10.0 10.0 10.0 10.0
4 Stamp Duty Rationalization to 5% 10.0 10.0 10.0 10.0
5 Repeal of ULCRA 10.0 10.0 10.0 10.0
6 Enactment of Community Participation Law 10.0 7.5 7.5 7.5
7 Enactment of Public Disclosure Law 10.0 10.0 10.0 10.0
Total State Level Score 70.0 65.0 65.0 65.0
OPTIONAL REFORMS (State Level/ULB Level)
1 Introduction of Property Title Certification System in ULBs 10.0 0.0 0.0 0.0
2 Revision of Building Bye laws – streamlining the Approval Process 10.0 10.0 10.0 5.0
3 Revision of Building Bye laws – To make rain water harvesting mandatory 10.0 10.0 10.0 10.0
4 Earmarking 25% developed land in all housing projects for EWS/LIG 10.0 10.0 10.0 10.0
5 Simplification of Legal and Procedural framework for conversion of agricultural land for non-agricultural purposes 10.0 10.0 10.0 10.0
6 Introduction of computerized process of Registration of land and Property 10.0 10.0 10.0 7.0
7 Byelaws on Reuse of Recycled Water 10.0 10.0 10.0 8.0
8 Administrative Reforms 10.0 8.0 8.0 4.0
9 Structural Reforms 10.0 9.0 9.0 9.0
10 Encouraging Public Private Participation 10.0 10.0 10.0 10.0
Total Optional Reforms Score 100.0 87.0 87.0 73.0
Total Score (23 Reforms) 230.0 200.0 198.0 172.8
% of Reforms Achievement 86.96% 86.09% 75.11%
Calibrated Score
ULB LEVEL REFORMS 60.0 48.0 46.0 34.8
STATE LEVEL REFORMS 70.0 65.0 65.0 65.0
OPTIONAL REFORMS (State Level/ULB Level) 100.0 87.0 87.0 73.0
230.0 200.0 198.0 172.8
ULB LEVEL REFORMS % 80% 77% 58%
STATE LEVEL REFORMS % 93% 93% 93%
OPTIONAL REFORMS (State Level/ULB Level) % 87% 87% 73%
86.96% 86.09% 75%
Overall State Performance (Calibrated) 86.52%(Jaipur & Ajmer)

Handbook of Urban Statistics
346
Sikkim - Reforms Calibrated Milestones & Scores
S.No Reform Milestone Max. Score Achieved Score
ULB LEVEL REFORMS Gangtok
1 e-Governance 10.0 0.0
2 Shift to Accrual based Double Entry Accounting 10.0 5.5
3 Property Tax (85% coverage & 90% collection efficiency) 10.0 2.0
4 100% O&M cost recovery in Water Supply & SWM 10.0 7.0
5 Internal Earmarking of Funds for Services to Urban Poor 10.0 7.5
6 Provision of Basic Services to Urban Poor 10.0 4.5
Total ULB Level Score 60.0 26.5
STATE LEVEL REFORMS
1 Implementation of 74th CAA 15.0 7.0
2 Integration of City Planning & Delivery Functions 5.0 4.0
3 Reform in Rent Control 10.0 10.0
4 Stamp Duty Rationalization to 5% 10.0 7.5
5 Repeal of ULCRA 10.0 10.0
6 Enactment of Community Participation Law 10.0 2.5
7 Enactment of Public Disclosure Law 10.0 7.5
Total State Level Score 70.0 48.5
OPTIONAL REFORMS (State Level/ULB Level)
1 Introduction of Property Title Certification System in ULBs 10.0 0.0
2 Revision of Building Bye laws – streamlining the Approval Process 10.0 0.0
3 Revision of Building Bye laws – To make rain water harvesting mandatory 10.0 7.0
4 Earmarking 25% developed land in all housing projects for EWS/LIG 10.0 5.0
5 Simplification of Legal and Procedural framework for conversion of agricultural land for non-agricultural purposes 10.0 10.0
6 Introduction of computerized process of Registration of land and Property 10.0 10.0
7 Byelaws on Reuse of Recycled Water 10.0 10.0
8 Administrative Reforms 10.0 6.0
9 Structural Reforms 10.0 1.5
10 Encouraging Public Private Participation 10.0 8.0
Total Optional Reforms Score 100.0 57.5
Total Score (23 Reforms) 230.0 132.5
% of Reforms Achievement 57.61%
Calibrated Score
ULB LEVEL REFORMS 60.0 26.5
STATE LEVEL REFORMS 70.0 48.5
OPTIONAL REFORMS (State Level/ULB Level) 100.0 57.5
230.0 132.5
ULB LEVEL REFORMS % 44%
STATE LEVEL REFORMS % 69%
OPTIONAL REFORMS (State Level/ULB Level) % 58%
57.61%
Overall State Performance (Calibrated) 57.61%

Annexure-2: Performance of Cities under Urban reforms Indicators
347
Tamil Nadu - Reforms Calibrated Milestones & Scores
S.No Reform Milestone Max. Score Achieved Score
ULB LEVEL REFORMS Chennai Madurai Coimbatore
1 e-Governance 10.0 10.0 10.0 10.0
2 Shift to Accrual based Double Entry Accounting 10.0 10.0 10.0 10.0
3 Property Tax (85% coverage & 90% collection efficiency) 10.0 10.0 10.0 10.0
4 100% O&M cost recovery in Water Supply & SWM 10.0 9.0 10.0 10.0
5 Internal Earmarking of Funds for Services to Urban Poor 10.0 10.0 10.0 10.0
6 Provision of Basic Services to Urban Poor 10.0 10.0 10.0 10.0
Total ULB Level Score 60.0 59.0 60.0 60.0
STATE LEVEL REFORMS
1 Implementation of 74th CAA 15.0 14.5 14.5 14.5
2 Integration of City Planning & Delivery Functions 5.0 5.0 5.0 5.0
3 Reform in Rent Control 10.0 10.0 10.0 10.0
4 Stamp Duty Rationalization to 5% 10.0 10.0 10.0 10.0
5 Repeal of ULCRA 10.0 10.0 10.0 10.0
6 Enactment of Community Participation Law 10.0 10.0 10.0 10.0
7 Enactment of Public Disclosure Law 10.0 10.0 10.0 10.0
Total State Level Score 70.0 69.5 69.5 69.5
OPTIONAL REFORMS (State Level/ULB Level)
1 Introduction of Property Title Certification System in ULBs 10.0 10.0 10.0 10.0
2 Revision of Building Bye laws – streamlining the Approval Process 10.0 10.0 10.0 10.0
3 Revision of Building Bye laws – To make rain water harvesting mandatory 10.0 10.0 10.0 10.0
4 Earmarking 25% developed land in all housing projects for EWS/LIG 10.0 10.0 10.0 10.0
5 Simplification of Legal and Procedural framework for conversion of agricultural land for non-agricultural purposes 10.0 10.0 10.0 10.0
6 Introduction of computerized process of Registration of land and Property 10.0 10.0 10.0 10.0
7 Byelaws on Reuse of Recycled Water 10.0 10.0 10.0 10.0
8 Administrative Reforms 10.0 10.0 10.0 10.0
9 Structural Reforms 10.0 10.0 10.0 10.0
10 Encouraging Public Private Participation 10.0 10.0 10.0 10.0
Total Optional Reforms Score 100.0 100.0 100.0 100.0
Total Score (23 Reforms) 230.0 228.5 229.5 229.5
% of Reforms Achievement 99.35% 99.78% 99.78%
Calibrated Score
ULB LEVEL REFORMS 60.0 59.0 60.0 60.0
STATE LEVEL REFORMS 70.0 69.5 69.5 69.5
OPTIONAL REFORMS (State Level/ULB Level) 100.0 100.0 100.0 100.0
230.0 228.5 229.5 229.5
ULB LEVEL REFORMS % 98% 100% 100%
STATE LEVEL REFORMS % 99% 99% 99%
OPTIONAL REFORMS (State Level/ULB Level) % 100% 100% 100%
99.35% 99.78% 99.78%
Overall State Performance (Calibrated) 99.64%

Handbook of Urban Statistics
348
Tripura - Reforms Calibrated Milestones & Scores
S.No Reform Milestone Max. Score Achieved Score
ULB LEVEL REFORMS Agartala
1 e-Governance 10.0 5.0
2 Shift to Accrual based Double Entry Accounting 10.0 10.0
3 Property Tax (85% coverage & 90% collection efficiency) 10.0 6.0
4 100% O&M cost recovery in Water Supply & SWM 10.0 3.0
5 Internal Earmarking of Funds for Services to Urban Poor 10.0 10.0
6 Provision of Basic Services to Urban Poor 10.0 10.0
Total ULB Level Score 60.0 44.0
STATE LEVEL REFORMS
1 Implementation of 74th CAA 15.0 13.5
2 Integration of City Planning & Delivery Functions 5.0 3.0
3 Reform in Rent Control 10.0 10.0
4 Stamp Duty Rationalization to 5% 10.0 5.0
5 Repeal of ULCRA 10.0 10.0
6 Enactment of Community Participation Law 10.0 10.0
7 Enactment of Public Disclosure Law 10.0 10.0
Total State Level Score 70.0 61.5
OPTIONAL REFORMS (State Level/ULB Level)
1 Introduction of Property Title Certification System in ULBs 10.0 0.0
2 Revision of Building Bye laws – streamlining the Approval Process 10.0 7.5
3 Revision of Building Bye laws – To make rain water harvesting mandatory 10.0 10.0
4 Earmarking 25% developed land in all housing projects for EWS/LIG 10.0 5.0
5 Simplification of Legal and Procedural framework for conversion of agricultural land for non-agricultural purposes 10.0 5.0
6 Introduction of computerized process of Registration of land and Property 10.0 10.0
7 Byelaws on Reuse of Recycled Water 10.0 10.0
8 Administrative Reforms 10.0 6.0
9 Structural Reforms 10.0 4.0
10 Encouraging Public Private Participation 10.0 6.0
Total Optional Reforms Score 100.0 63.5
Total Score (23 Reforms) 230.0 169.0
% of Reforms Achievement 73.48%
Calibrated Score
ULB LEVEL REFORMS 60.0 44.0
STATE LEVEL REFORMS 70.0 61.5
OPTIONAL REFORMS (State Level/ULB Level) 100.0 63.5
230.0 169.0
ULB LEVEL REFORMS % 73%
STATE LEVEL REFORMS % 88%
OPTIONAL REFORMS (State Level/ULB Level) % 64%
73.48%
Overall State Performance (Calibrated) 73.48%

Annexure-2: Performance of Cities under Urban reforms Indicators
349
Uttar Pradesh - Reforms Calibrated Milestones & Scores
S.No Reform Milestone Max. Score Achieved Score
ULB LEVEL REFORMS Lucknow Kanpur Allahabad Varanasi Agra Mathura Meerut
1 e-Governance 10.0 10.00 10.00 8.75 7.50 8.75 8.75 8.75
2 Shift to Accrual based Double Entry Accounting 10.0 8.5 8.5 8.5 8.5 8.5 8.5 8.5
3 Property Tax (85% coverage & 90% collection efficiency) 10.0 7.5 9.0 9.0 9.0 9.0 9.0 9.0
4 100% O&M cost recovery in Water Supply & SWM 10.0 6.0 5.5 5.0 5.0 5.0 5.0 4.0
5 Internal Earmarking of Funds for Services to Urban Poor 10.0 10.0 10.0 10.0 10.0 10.0 10.0 10.0
6 Provision of Basic Services to Urban Poor 10.0 10.0 10.0 10.0 10.0 10.0 10.0 10.0
Total ULB Level Score 60.0 52.0 53.0 51.3 50.0 51.3 51.3 50.3
STATE LEVEL REFORMS
1 Implementation of 74th CAA 15.0 11.0 11.0 11.0 11.0 11.0 11.0 11.0
2 Integration of City Planning & Delivery Functions 5.0 2.0 2.0 2.0 2.0 2.0 2.0 2.0
3 Reform in Rent Control 10.0 10.0 10.0 10.0 10.0 10.0 10.0 10.0
4 Stamp Duty Rationalization to 5% 10.0 10.0 10.0 10.0 10.0 10.0 10.0 10.0
5 Repeal of ULCRA 10.0 10.0 10.0 10.0 10.0 10.0 10.0 10.0
6 Enactment of Community Participation Law 10.0 10.0 10.0 10.0 10.0 10.0 10.0 10.0
7 Enactment of Public Disclosure Law 10.0 10.0 10.0 10.0 10.0 10.0 10.0 10.0
Total State Level Score 70.0 63.0 63.0 63.0 63.0 63.0 63.0 63.0
OPTIONAL REFORMS (State Level/ULB Level)
1 Introduction of Property Title Certification System in ULBs 10.0 0.0 0.0 0.0 0.0 0.0 0.0 0.0
2 Revision of Building Bye laws – streamlining the Approval Process 10.0 10.0 10.0 10.0 10.0 10.0 10.0 10.0
3 Revision of Building Bye laws – To make rain water harvesting mandatory 10.0 10.0 10.0 10.0 10.0 10.0 10.0 10.0
4 Earmarking 25% developed land in all housing projects for EWS/LIG 10.0 10.0 10.0 10.0 10.0 10.0 10.0 10.0
5Simplification of Legal and Procedural framework for conversion of agricultural land for non-agricultural purposes
10.0 10.0 10.0 10.0 10.0 10.0 10.0 10.0
6 Introduction of computerized process of Registration of land and Property 10.0 10.0 10.0 10.0 10.0 10.0 10.0 10.0
7 Byelaws on Reuse of Recycled Water 10.0 10.0 10.0 10.0 10.0 10.0 10.0 10.0
8 Administrative Reforms 10.0 10.0 10.0 10.0 10.0 10.0 10.0 10.0
9 Structural Reforms 10.0 10.0 10.0 10.0 10.0 10.0 10.0 10.0
10 Encouraging Public Private Participation 10.0 8.0 8.0 8.0 8.0 8.0 8.0 8.0
Total Optional Reforms Score 100.0 88.0 88.0 88.0 88.0 88.0 88.0 88.0
Total Score (23 Reforms) 230.0 203.0 204.0 202.3 201.0 202.3 202.3 201.3
% of Reforms Achievement 88.26% 88.70% 87.93% 87.39% 87.93% 87.93% 87.50%
ULB Level Reforms 60.0 52.0 53.0 51.3 50.0 51.3 51.3 50.3
State Level Reforms 70.0 63.0 63.0 63.0 63.0 63.0 63.0 63.0
Optional Reforms 100.0 88.0 88.0 88.0 88.0 88.0 88.0 88.0
230.0 203.0 204.0 202.3 201.0 202.3 202.3 201.3
%
ULB Level Reforms 87% 88% 85% 83% 85% 85% 84%
State Level Reforms 90% 90% 90% 90% 90% 90% 90%
Optional Reforms 88% 88% 88% 88% 88% 88% 88%
88.26% 88.70% 87.93% 87.39% 87.93% 87.93% 87.50%
Overall State Performance (Calibrated) 87.95%

Handbook of Urban Statistics
350
Uttarakhand - Reforms Calibrated Milestones & Scores
S.No Reform Milestone Max. Score Achieved Score
ULB LEVEL REFORMS Dehradun Haridwar Nainital
1 e-Governance 10.0 8.8 8.8 8.8
2 Shift to Accrual based Double Entry Accounting 10.0 10.0 8.5 8.5
3 Property Tax (85% coverage & 90% collection efficiency) 10.0 4.5 4.5 6.5
4 100% O&M cost recovery in Water Supply & SWM 10.0 5.0 5.0 5.0
5 Internal Earmarking of Funds for Services to Urban Poor 10.0 7.5 7.5 7.5
6 Provision of Basic Services to Urban Poor 10.0 7.0 7.0 7.0
Total ULB Level Score 60.0 42.8 41.3 43.3
STATE LEVEL REFORMS
1 Implementation of 74th CAA 15.0 13.0 13.0 13.0
2 Integration of City Planning & Delivery Functions 5.0 2.0 2.0 2.0
3 Reform in Rent Control 10.0 10.0 10.0 10.0
4 Stamp Duty Rationalization to 5% 10.0 10.0 10.0 10.0
5 Repeal of ULCRA 10.0 10.0 10.0 10.0
6 Enactment of Community Participation Law 10.0 5.0 5.0 5.0
7 Enactment of Public Disclosure Law 10.0 10.0 10.0 10.0
Total State Level Score 70.0 60.0 60.0 60.0
OPTIONAL REFORMS (State Level/ULB Level)
1 Introduction of Property Title Certification System in ULBs 10.0 0.0 0.0 0.0
2 Revision of Building Bye laws – streamlining the Approval Process 10.0 7.5 7.5 7.5
3 Revision of Building Bye laws – To make rain water harvesting mandatory 10.0 10.0 10.0 10.0
4 Earmarking 25% developed land in all housing projects for EWS/LIG 10.0 10.0 10.0 10.0
5 Simplification of Legal and Procedural framework for conversion of agricultural land for non-agricultural purposes 10.0 10.0 10.0 10.0
6 Introduction of computerized process of Registration of land and Property 10.0 10.0 10.0 10.0
7 Byelaws on Reuse of Recycled Water 10.0 10.0 10.0 10.0
8 Administrative Reforms 10.0 6.0 6.0 6.0
9 Structural Reforms 10.0 5.0 5.0 5.0
10 Encouraging Public Private Participation 10.0 10.0 10.0 10.0
Total Optional Reforms Score 100.0 78.5 78.5 78.5
Total Score (23 Reforms) 230.0 181.3 179.8 181.8
% of Reforms Achievement 78.80% 78.15% 79.02%
Calibrated Score
ULB LEVEL REFORMS 60.0 42.8 41.3 43.3
STATE LEVEL REFORMS 70.0 60.0 60.0 60.0
OPTIONAL REFORMS (State Level/ULB Level) 100.0 78.5 78.5 78.5
230.0 181.3 179.8 181.8
ULB LEVEL REFORMS % 71% 69% 72%
STATE LEVEL REFORMS % 86% 86% 86%
OPTIONAL REFORMS (State Level/ULB Level) % 79% 79% 79%
78.80% 78.15% 79.02%
Overall State Performance (Calibrated) 78.66%

Annexure-2: Performance of Cities under Urban reforms Indicators
351
West Bengal - Reforms Calibrated Milestones & Scores
S.No Reform Milestone Max. Score Achieved Score
ULB LEVEL REFORMS Kolkata Asansol
1 e-Governance 10.0 8.75 6.3
2 Shift to Accrual based Double Entry Accounting 10.0 10.0 10.0
3 Property Tax (85% coverage & 90% collection efficiency) 10.0 6.5 5.5
4 100% O&M cost recovery in Water Supply & SWM 10.0 6.0 5.0
5 Internal Earmarking of Funds for Services to Urban Poor 10.0 10.0 10.0
6 Provision of Basic Services to Urban Poor 10.0 10.0 10.0
Total ULB Level Score 60.0 51.3 46.8
STATE LEVEL REFORMS
1 Implementation of 74th CAA 15.0 14.0 14.0
2 Integration of City Planning & Delivery Functions 5.0 5.0 5.0
3 Reform in Rent Control 10.0 10.0 10.0
4 Stamp Duty Rationalization to 5% 10.0 5.0 5.0
5 Repeal of ULCRA 10.0 0.0 0.0
6 Enactment of Community Participation Law 10.0 10.0 10.0
7 Enactment of Public Disclosure Law 10.0 10.0 10.0
Total State Level Score 70.0 54.0 54.0
OPTIONAL REFORMS (State Level/ULB Level)
1 Introduction of Property Title Certification System in ULBs 10.0 10.0 10.0
2 Revision of Building Bye laws – streamlining the Approval Process 10.0 10.0 10.0
3 Revision of Building Bye laws – To make rain water harvesting mandatory 10.0 10.0 10.0
4 Earmarking 25% developed land in all housing projects for EWS/LIG 10.0 10.0 10.0
5 Simplification of Legal and Procedural framework for conversion of agricultural land for non-agricultural purposes 10.0 10.0 10.0
6 Introduction of computerized process of Registration of land and Property 10.0 10.0 10.0
7 Byelaws on Reuse of Recycled Water 10.0 10.0 10.0
8 Administrative Reforms 10.0 10.0 10.0
9 Structural Reforms 10.0 10.0 10.0
10 Encouraging Public Private Participation 10.0 10.0 10.0
Total Optional Reforms Score 100.0 100.0 100.0
Total Score (23 Reforms) 230.0 205.3 200.8
% of Reforms Achievement 89.24% 87.28%
Calibrated Score
ULB LEVEL REFORMS 60.0 51.3 46.8
STATE LEVEL REFORMS 70.0 54.0 54.0
OPTIONAL REFORMS (State Level/ULB Level) 100.0 100.0 100.0
230.0 205.3 200.8
ULB LEVEL REFORMS % 85% 78%
STATE LEVEL REFORMS % 77% 77%
OPTIONAL REFORMS (State Level/ULB Level) % 100% 100%
89.24% 87.28%
Overall State Performance (Calibrated) 88.26%


Flagship Schemes of Urban Development
3Annexure


Annexure-3: Flagship Schemes of Urban Development
355
Annexure 3. Flagship Schemes of Urban Development
3.1: SWACHH BHARAT MISSION (URBAN)
The Government of India has launched the Swachh Bharat Mission (SBM) on 2nd October, 2014,
with a target to make the country clean by 2nd October, 2019. All 4,041 statutory towns as per
census 2011 have been considered under SBM. The admissible components under SBM with broad
funding pattern are (i) Household toilets including conversion of insanitary latrines into pour-flush
latrines (Rs.4000 per toilet as an incentive from the central government), (ii) Community toilets
(maximum 40% Viability Gap Funding), (iii) Public toilets (100% Private Investment) , (iv) Solid Waste
Management (maximum 20% Viability Gap Funding) (v) Information, Education & Communication
(IEC) and Public Awareness (15%) and (vi) Capacity Building and Administrative & Office Expenditure
(A&OE) (5%).
Mission Objectives: - The objectives of the Mission are:
a) Eliminate open defecation.
b) Conversion of insanitary toilets to pour flush toilets
c) Eradication of manual scavenging.
d) 100% collection and scientific processing/ disposal/ reuse/ recycle of Municipal Solid
Waste.
e) To bring about a behavioural change in people regarding healthy sanitation practices.
f) Generate awareness among the citizens about sanitation and its linkages with public
health.
g) Strengthening of urban local bodies to design, execute and operate systems.
h) To create enabling environment for private sector participation in Capital expenditure
and Operation and Maintenance expenditure (O&M).
Mission Outlay:-The estimated cost of implementation of SBM (Urban) based on unit and per capita
costs for its various components is Rs. 62,009 Crore. The Government of India (GoI) share as per
approved funding pattern amounts to Rs. 14,623 Crore. In addition, a minimum additional amount
equivalent to 25% of GoI funding, amounting to Rs. 4,874 Crore shall be contributed by the States as

Handbook of Urban Statistics
356
State/ULBs. The balance funds are proposed to be generated through various other sources which
are, but not limited to:
a. Private Sector Participation
b. Additional Resources from State Government/ULB
c. Beneficiary Share
d. User Charges
e. Land Leveraging
f. Innovative revenue streams
g. Swachh Bharat Kosh
h. Corporate Social Responsibility
i. Market Borrowing
j. External Assistance
Mission Target – to be met by 2nd October, 2019
(i) Individual Household Toilets – 1.04 crore toilets
(ii) Community and Public Toilets – 5.08 lakh seats
(iii) Solid Waste Management – (a) achievement of 100% collection and transportation in 4,041 cities (b) achievement of 100% processing and disposal in 4,041 cities.

Annexure-3: Flagship Schemes of Urban Development
357
3.2: Smart City Mission (SCM)
The Hon’ble Prime Minister launched the Smart City Mission on 25th June, 2015. Objective is to
promote cities that provide core infrastructure and give a decent quality of life to its citizens, a clean
and sustainable environment and application of ‘Smart’ Solutions. Focus will be on sustainable and
inclusive development and the idea is to look at compact areas, create a replicable model which will
act like a lighthouse to other aspiring cities.
The core infrastructure elements in a smart city would include adequate water supply, assured
electricity supply, sanitation, including solid waste management, efficient urban mobility and public
transport, affordable housing, especially for the poor, robust Information Technology (IT) connectivity
and digitalization, good governance, especially e-Governance and citizen participation, sustainable
environment, safety and security of citizens, particularly women, children and the elderly and health
and education. Additionally, some Smart Solutions will be applied to infrastructure and services in
area-based development in order to make them better.
The Mission will cover 100 cities and its duration will be five years (FY 2015-16 to FY 2019-20). The
Mission may be continued thereafter in the light of any evaluation to be done by the MoUD and after
incorporating the learnings into the Mission.
The strategic components of the Smart City Mission are city improvement (retrofitting), city renewal
(redevelopment) and city extension (Greenfield development) plus a Pan-city initiative in which
Smart Solutions are applied covering larger parts of the city.
The selection process of Smart City is based on the idea of Competitive and Co-operative Federalism
and follows a Challenge process to select cities in two stages. In Stage 1, all States/ UTs except Jammu
& Kashmir have conveyed the names of potential Smart City pertaining to their State. Those names
have been reviewed by the Apex Committee in Ministry of Urban Development (MoUD) on 06.08.2015
and list of 98 cities based on the recommendations of States/UTs have been shortlisted to participate
in Stage 2 of the competition.
In the Stage 2 of the competition, each of the potential Smart City has to prepare proposals for
participation in the “City Challenge”. All Chief Secretaries/Administrator of States/UTs have already
been requested to start City Challenge and submit the Smart City Proposals (SCPs) before 15th
December 2015, so that those SCPs could be evaluated by a committee involving a panel of national
and international experts, organizations and institutions in MoUD and the result of first round of
Smart City could be announced by January 2016.

Handbook of Urban Statistics
358
The elements that must form part of SCP are assured electricity supply with at least 10% of the
Smart City’s energy requirement coming from solar, adequate water supply including waste
water recycling and storm water reuse, sanitation including solid waste management, rain water
harvesting, smart metering, robust IT connectivity and digitalization, pedestrian friendly pathways,
encouragement to non-motorized transport, intelligent traffic management, non-vehicle streets/
zones, smart parking, energy efficient street lighting, innovative use of open spaces and visible
improvement in the Area.
The Smart City Proposal (SCP) of each shortlisted city is expected to encapsulate either a retrofitting or
redevelopment or greenfield development model, or a mix thereof and a Pan-city feature with Smart
Solution(s). Pan-city is an additional feature to be provided. Since smart city is taking a compact area
approach, it is necessary that all the city residents feel there is something in it for them also which is
being ensured through the Pan- City feature. Therefore, the additional requirement of some (at least
one) city-wide smart solution has been put in the scheme to make it inclusive in nature.
The Smart City Mission will be operated as a Centrally Sponsored Scheme (CSS) and the Central
Government proposes to give financial support to the Mission to the extent of Rs.48,000 crores over
five years i.e. on an average Rs.100 crore per city per year. Rs. 2 crore per potential smart city, has
already been released to States/UTs as an advance for preparation of SCP. Regional Workshops in
Delhi, Hyderabad and Kolkata have been organized in the month of September, 2015 to disseminate
and educate Administrators of shortlisted potential Smart Cities and State Governments for
preparing SCPs.
The implementation of the Mission at the City level will be done by a Special Purpose Vehicle (SPV)
created for the purpose in the form of a company under the Companies Act and will be promoted by
State/UT and ULB jointly having 50:50 equity shareholding. The prime reason for the creation of the
SPV for Smart City Mission is to ensure operational independence and autonomy in decision making
and Mission implementation. The funds provided by the GoI to SPV will be in the form of tied grants
and kept in a separate grant fund. The SPV will also access/mobilize funds from other sources such
as loans, user charges, taxes, surcharges etc.
Under SCM guidelines, following two types of support have been envisaged:
(i) Technical assistance support for preparation of Smart City Proposal by hiring consulting
firms or engaging with handholding agencies such as World Bank, ADB, GEF, USTDA,
JICA, DFID, AFD, KfW and UN Habitat etc.

Annexure-3: Flagship Schemes of Urban Development
359
(ii) Infusion of funds in the SPV for implementation of projects because GoI funds and the matching contribution by the States/ULB will meet only a part of the project cost. Balance funds are expected to be mobilized from various sources including borrowings from financial institutions, bilateral and multilateral institutions, both domestic and external.

Handbook of Urban Statistics
360
3.3: The Atal Mission for Rejuvenation and Urban Transformation (AMRUT)
The Atal Mission for Rejuvenation and Urban Transformation (AMRUT) has been launched by the
Hon’ble Prime Minister of India on 25th June 2015 for development of basic infrastructure in 500
cities. The objective of Mission is to (i) ensure that every household has access to a tap with assured
supply of water and a sewerage connection; (ii) increase the amenity value of cities by developing
greenery and well maintained open spaces; and (iii) reduce pollution by switching to public transport
or constructing facilities for non-motorized transport. The Mission also aims at capacity building in
the Urban Local Bodies and to carry out reforms with a view to improve service delivery to citizens.
The AMRUT mission has the following components: capacity building, reform implementation, water
supply, sewerage and septage management, storm water drainage, urban transport and development
of green spaces and parks.
The main criteria, inter-alia, for coverage of Cities/towns under the Mission are “All Cities and Towns
with a population of over one lakh with notified Municipalities, including Cantonment Boards (Civilian
areas) according to Census 2011”.
Mission Cities/Urban Local Bodies (ULBs) have to prepare the State Level Improvement Plans (SLIPs)
with the objective of universal coverage of water and sewerage on priority. These SLIPs will be
aggregated into State Annual Action Plan (SAAP). State Government will prepare State Annual Action
Plan (SAAP) to be undertaken by them during the year. After approval by State High Powered Steering
Committee (SHPSC), the SAAP will be forwarded to the Ministry of Urban Development. SAAP would
be considered and approved by the Apex Committee under the Chairmanship of Secretary, Ministry
of Urban Development. States have to give project sanctions and approval at their end. The Mission
makes States equal partners in planning and implementation of projects in the spirit of cooperative
federalism.
A District Level Review and Monitoring Committee (DLRMC) will be constituted and Member(s) of
Parliament will be the Co-chairperson with the District Collector. The DLRMC will monitor and review
the implementation of the AMRUT projects.
The total outlay for AMRUT is Rs. 50,000 crore for five years from FY2015-16 to FY2019-20 and the
Mission will be operated as a Centrally Sponsored Scheme. The Mission funds will consist of the
following four parts:
i. Project fund - 80% of the annual budgetary allocation.
ii. Incentive for Reforms - 10% of the annual budgetary allocation.

Annexure-3: Flagship Schemes of Urban Development
361
iii. State funds for Administrative & Office Expenses (A&OE) - 8% of the annual budgetary allocation.
iv. MoUD funds for Administrative & Office Expenses (A&OE) - 2% of the annual budgetary allocation.
However, for FY 2015-16 the project fund would be 90% of the annual budgetary allocation as
incentive for Reforms will be given only from FY 2016-17 onwards.
Under the Mission, the Central Assistance to the level of one-third of the project cost as grant from
Government of India for cities with a population of above 10 lakh and half of the project cost for
cities/towns with population up to 10 lakh will be provided. Balance funding is to be arranged by
State Governments/Urban Local Bodies or through private investment.
The funds will be released in three instalments of 20:40:40. The first instalment will be released
immediately after approval of the SAAP by the Apex Committee. The second and third instalments
will be released on receipt of (i) score card, (ii) Utilization Certificates, and (iii) Project Funds Request.
These documents should show, (i) utilisation of 75% of the amount already released by the Centre
and State according to the funding pattern (ii) utilization of the State/ULB/Private Sector shares, and
(iii) meeting the service level milestones as assured in the roadmap contained in SAAP and certified
in the report of the Independent Review and Monitoring Agency (IRMA).
The AMRUT Mission shifts from penalisation to incentivization. 10% of the annual budget allocation
shall be kept apart and given to the State/UTs every year as incentive for achievement of Reforms.
The National Mission Directorate shall announce the award of incentive on receipt of self-assessment
of reforms for the previous year from the States/UTs.

Handbook of Urban Statistics
362
3.4: National Heritage City Development and Augmentation Yojana (HRIDAY)
The National Heritage City Development and Augmentation Yojana (HRIDAY) Scheme, aims at preserving and revitalizing the soul of and unique character of the heritage cities in India.
In the first phase, following twelve cities have been identified for development under the scheme: Ajmer, Amritsar, Amaravati, Badami, Dwarka, Gaya, Kanchipuram, Mathura, Puri, Varanasi, Velankanni and Warangal.
The first phase of the HRIDAY Scheme was launched in January, 2015 for a period of 27 months with a total outlay of Rs. 500 crore, fully funded by the Central Government. The Scheme aims at restoring, reviving and strengthening the soul and heritage of the City and the projects under HRIDAY would fall under the following two categories:
Core Infrastructure Projects
l Revitalization and façade improvement of heritage/ historical surroundings
l Rejuvenation of heritage core areas (river front development, etc.)
l Reviving intangible assets (local art and craft, dance forms, literature)
l Tourist Information Systems and Kiosks
Linked Infrastructure Projects
l Sanitation, drinking water, roads, public parking
l Underground Wiring
l Pedestrian friendly streets
l Tourist facilities
The funding allocation to the Cities is as under:-
City Fund Allocation
(In crore)City
Fund Allocation(In crore)
Ajmer 40.04 Kanchipuram 23.04
Amaravati 22.26 Mathura 40.04
Amritsar 69.31 Puri 22.54
Badami 22.26 Varanasi 89.31
Dwarka 22.26 Velankanni 22.26
Gaya 40.04 Warangal 40.54

Annexure-3: Flagship Schemes of Urban Development
363
Implementation and Governance Framework
The HRIDAY scheme will be planned, developed and implemented under the aegis of the Ministry of Urban Development with National Institute of Urban Affairs (NIUA) playing the role of National Project Management Unit (NPMU). The Scheme is structured for planning and implementation through the following institutional structures:
************


GOVERNMENT OF INDIA
MINISTRY OF URBAN DEVELOPMENT
(moud.gov.in)
Price : ` 400/-