handbook hazard mapping for mass movements
TRANSCRIPT
Seite
1
Alpine Mass Movements: Implications for hazard assessment and mapping
Seite
2
Seite
3
Inhalt
Wolfram Bitterlich:Wildbachverbauung und Ökologie Widerspruch oder sinnvolle Ergänzung?
Florian Rudolf-Miklau, Richard Bäk, Franz Schmid, Christoph Skolaut:Hazard Mapping for Mass Movements: Strategic Importance and Transnational Development of Standards in the ASP-Project ADAPTALP
Michael Mölk, Thomas Sausgruber, Richard Bäk, Arben Kociu:Standards and Methods of Hazard Assessment for Rapid Mass Movements (Rock Fall and Landslide) in Austria
Florian Rudolf-Miklau:Principles of Hazard Assessment and Mapping
Richard Bäk, Hugo Raetzo, Karl Mayer, Andreas von Poschinger, Gerlinde Posch-Trözmüller: Mapping of Geological Hazards: Methods, Standards and Procedures (State of Development) - Overview
Hugo Raetzo, Bernard Loup:Geological Hazard Assessment in Switzerland
Mateja Jemec & Marko Komac:An Overview of Approaches for Hazard Assessment of Slope Mass Movements
Seite
12
Seite
12
Seite
6Se
ite 1
4Se
ite 2
4Se
ite 4
8Se
ite 6
4Se
ite 7
0Se
ite 8
2Se
ite 9
4
Roland Norer:Legal Framework for Assessment and Mapping of Geological Hazards on the International, European and National Levels
Karl Mayer, Bernhard Lochner:Internationally Harmonized Terminology for Geological Risk: Glossary (Overview)BL
OCK
1: K
ey-n
ote
pape
rsBL
OCK
2 Stefano Campus: Landslide Mapping in Piemonte (Italy): Danger, Hazard & Risk Se
ite 1
02
Imprint / Disclosure
Federal Ministry of Agriculture, Forestry, Environment and Water Management, Marxergasse 2, 1030 Vienna, Austria.Verein der Diplomingenieure der Wildbach- und Lawinenverbauung, Bergheimerstrasse 57, 5021 Salzburg, Austria
Editorial Team:Florian Rudolf-Miklau, Richard Bäk, Christoph Skolaut and Franz Schmid
Coordination:Barbara Kogelnig-Mayer
Layout: Studio Kopfsache, Mondsee
Cite as:BMLFUW (2011): Alpine Mass Movements: Implications for hazard assessment and mapping, Special Edition of Journal of Torrent, Avalanche, Landslide and Rock Fall Engineering No. 166.
This publication was implemented within the framework of EU-project AdaptAlp, Workpackage 5, and is co-financed by the European RegionalDevelopment Fund (ERDF)
Cover picture: Großhangbewegung Rindberg, Gde. Sibratsgfäll, VorarlbergSource: die.wildbach
Seite
4
Seite
5
Inhalt
Seite
118
Seite
130
Seite
142
Karl Mayer, Andreas von Poschinger:Standards and Methods of Hazard Assessment for Geological Dangers (Mass Movements) in Bavaria
Didier Richard:Standards and Methods of Hazard Assessment for Rapid Mass Movements in France
Pere Oller, Marta González, Jordi Pinyol, Jordi Marturià, Pere Martínez:Goeohazards Mapping in Catalonia
Marko Komac, Mateja Jemec:Standards and Methods of Hazard Assessment for Rapid Mass Movements in Slovenia
Karl Mayer, Bernhard Lochner:International Comparison: Summary of the Expert Hearing in Bolzano on 17 March 2010
Seite
108
Seite
158
Claire Foster, Matthew Harrison & Helen J. Reeves: Standards and Methods of Hazard Assessment for Mass Movements in Great Britain Se
ite 1
50
BLOC
K 2:
Haz
ard
asse
ssm
ent a
nd m
appi
ng o
f mas
s-m
ovem
ents
in th
e EU
Seite
6
Seite
7
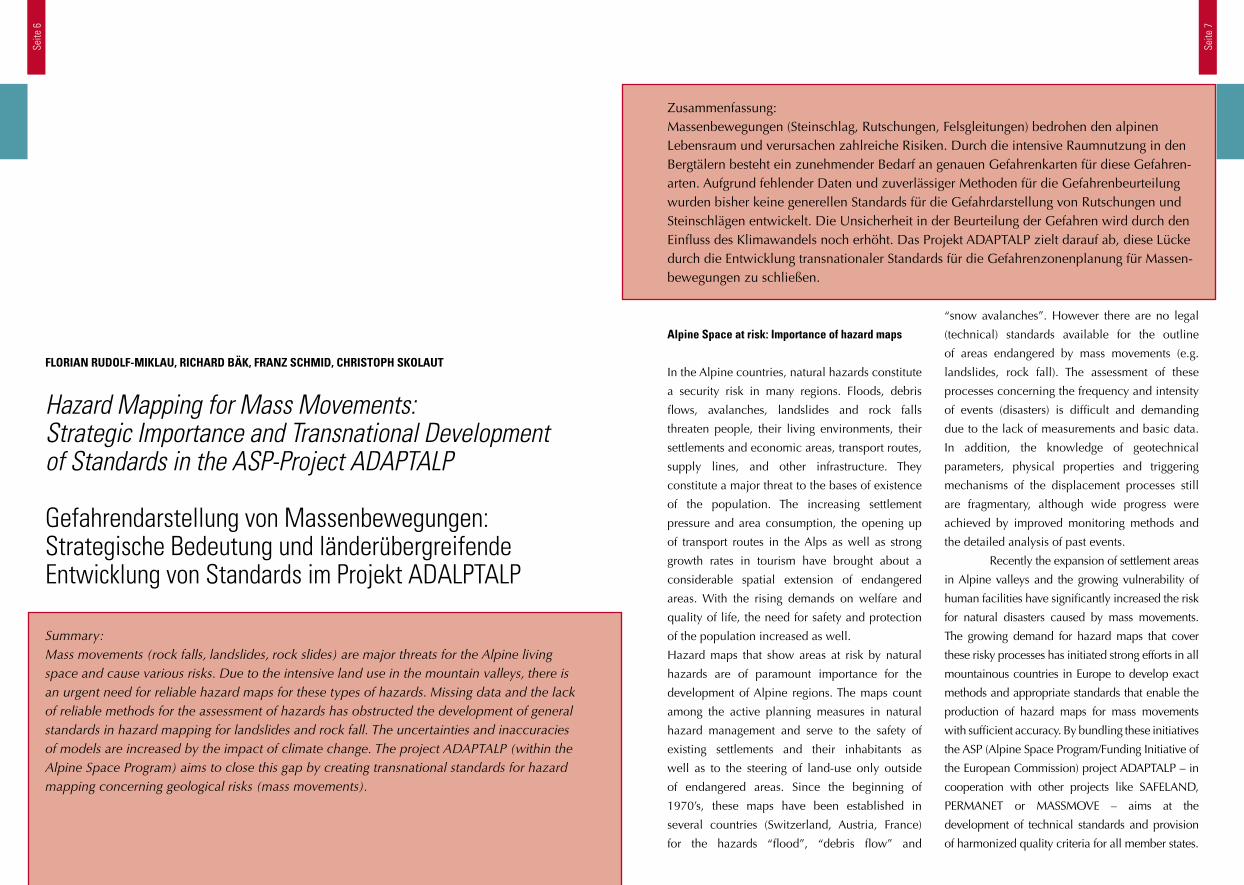
Zusammenfassung:Massenbewegungen (Steinschlag, Rutschungen, Felsgleitungen) bedrohen den alpinen Lebensraum und verursachen zahlreiche Risiken. Durch die intensive Raumnutzung in den Bergtälern besteht ein zunehmender Bedarf an genauen Gefahrenkarten für diese Gefahren-arten. Aufgrund fehlender Daten und zuverlässiger Methoden für die Gefahrenbeurteilung wurden bisher keine generellen Standards für die Gefahrdarstellung von Rutschungen und Steinschlägen entwickelt. Die Unsicherheit in der Beurteilung der Gefahren wird durch den Einfluss des Klimawandels noch erhöht. Das Projekt ADAPTALP zielt darauf ab, diese Lücke durch die Entwicklung transnationaler Standards für die Gefahrenzonenplanung für Massen-bewegungen zu schließen.
“snow avalanches”. However there are no legal
(technical) standards available for the outline
of areas endangered by mass movements (e.g.
landslides, rock fall). The assessment of these
processes concerning the frequency and intensity
of events (disasters) is difficult and demanding
due to the lack of measurements and basic data.
In addition, the knowledge of geotechnical
parameters, physical properties and triggering
mechanisms of the displacement processes still
are fragmentary, although wide progress were
achieved by improved monitoring methods and
the detailed analysis of past events.
Recently the expansion of settlement areas
in Alpine valleys and the growing vulnerability of
human facilities have significantly increased the risk
for natural disasters caused by mass movements.
The growing demand for hazard maps that cover
these risky processes has initiated strong efforts in all
mountainous countries in Europe to develop exact
methods and appropriate standards that enable the
production of hazard maps for mass movements
with sufficient accuracy. By bundling these initiatives
the ASP (Alpine Space Program/Funding Initiative of
the European Commission) project ADAPTALP – in
cooperation with other projects like SAFELAND,
PERMANET or MASSMOVE – aims at the
development of technical standards and provision
of harmonized quality criteria for all member states.
Alpine Space at risk: Importance of hazard maps
In the Alpine countries, natural hazards constitute
a security risk in many regions. Floods, debris
flows, avalanches, landslides and rock falls
threaten people, their living environments, their
settlements and economic areas, transport routes,
supply lines, and other infrastructure. They
constitute a major threat to the bases of existence
of the population. The increasing settlement
pressure and area consumption, the opening up
of transport routes in the Alps as well as strong
growth rates in tourism have brought about a
considerable spatial extension of endangered
areas. With the rising demands on welfare and
quality of life, the need for safety and protection
of the population increased as well.
Hazard maps that show areas at risk by natural
hazards are of paramount importance for the
development of Alpine regions. The maps count
among the active planning measures in natural
hazard management and serve to the safety of
existing settlements and their inhabitants as
well as to the steering of land-use only outside
of endangered areas. Since the beginning of
1970’s, these maps have been established in
several countries (Switzerland, Austria, France)
for the hazards “flood”, “debris flow” and
Hazard Mapping for Mass Movements: Strategic Importance and Transnational Development of Standards in the ASP-Project ADAPTALP
Gefahrendarstellung von Massenbewegungen: Strategische Bedeutung und länderübergreifende Entwicklung von Standards im Projekt ADALPTALP
Summary:Mass movements (rock falls, landslides, rock slides) are major threats for the Alpine living space and cause various risks. Due to the intensive land use in the mountain valleys, there is an urgent need for reliable hazard maps for these types of hazards. Missing data and the lack of reliable methods for the assessment of hazards has obstructed the development of general standards in hazard mapping for landslides and rock fall. The uncertainties and inaccuracies of models are increased by the impact of climate change. The project ADAPTALP (within the Alpine Space Program) aims to close this gap by creating transnational standards for hazard mapping concerning geological risks (mass movements).
FLORIAN RUDOLF-MIKLAU, RICHARD BÄK, FRANZ SCHMID, CHRISTOPH SKOLAUT
Seite
8
Seite
9
of the particles. Slopes consisting of silt and clay
particles obtain it from particle cohesion, which is
controlled by the availability of moisture in the soil.
Rock slopes generally have the greatest internal
strength due to the crystalline structures.
Instability is not always caused by an
increase in stress. In some cases, the internal
strength of the materials can be reduced resulting
in the triggering of a mass movement. Failure of
the slope material can occur over a range of time
scales. Some types of mass movement involve
rather rapid, spontaneous events. Sudden failures
tend to occur when the stresses exerted on the
slope materials greatly exceed their strength for
short periods of time. Mass movement can also
be a less continuous process that occurs over long
periods of time. Slow failures often occur when
the applied stresses only just exceed the internal
strength of the slope system.
Many factors can act as triggers for slope
failure. One of the most common is prolonged
or heavy rainfall. Rainfall can lead to mass
movement through three different mechanisms.
Often these mechanisms do not act alone. The
saturation of soil materials with water increases
the weight of slope materials which then leads
to greater gravitational force. Saturation of soil
materials can also reduce the cohesive bonds
between individual soil particles resulting in the
reduction of the internal strength of the slope.
Lastly, the presence of bedding planes in the slope
material can cause material above a particular
plane below ground level to slide along a surface
lubricated by percolating moisture.
Additionally, a large variety of other
trigger mechanism for mass movement other than
the gravitational are known, such as:
• Earthquake shocks cause sections of
mountains and hills to break off and slide
down.
• Human modification of the land or
weathering and erosion help loosen large
chunks of earth and start them sliding
downhill.
• Vibrations from machinery, traffic, weight
loading from accumulation of snow,
stockpiling of rock, from waste piles and
from buildings and other structures.
In the Alps, mass movements occur in a wide
range of processes consisting of bedrock and soil
or a mixture of both.
Mass movement on hard rock slopes
is often dramatic and quick. They involve the
downward movement of small rock fragments
pried loose by gravitational stress, the enlargement
of joints during weathering and/or freeze-thaw
processes (rock fall). Larger scale, down slope
movement of rock can also occur along well-
defined joints or bedding planes. This type of
movement is called rock slide. Rock slides often
occur when a fracture plane develops causing
overlying materials to slide down slope.
Slopes formed from clays and silt
sediments display somewhat unique mass
movement processes. Two common types of
mass movements in these cohesive materials are
rotational slips (slumps) and mudflows. Both of
these processes occur over very short time periods.
Rotational slips or slumps occur along clearly
defined planes of weakness which generally have
a concave form beneath the earth's surface. These
processes can be caused by a variety of factors.
The most common mechanical reason for them
to occur is erosion at the base of the slope which
reduces the support for overlying sediments.
Mudflows occur when slope materials become
so saturated that the cohesive bonds between
particles is lost. In a mudflow there is enough
water to allow the mixture to flow easily, as a
viscous stream. Mudflows can occur on very low
slope angles because internal particle frictional
resistance and cohesion is negligible.
damming up bodies of water. Expenses related to
landslides include actual damages to structures
or property, as well as loss of tax revenues on
devalued properties, reduced real estate values
in landslide prone areas, loss of productivity of
agricultural lands affected by landslides, and loss
of industrial productivity because of interruption
of transportation systems by landslides. Not only
rapid types of mass movements are harmful.
Slow movement of creep does more long term
economic damage to roads, railroads, building
structure and underground pipes.
The operation of mass movement
processes relies upon the development of
instability in the slope system. The predominant
source of stress is the gravitational force. Other
factors that affect mass movements are the
steepness of slopes, the lithological property of
the slope materials, and the amount of water in
the material. The two most important parameters
in mass movement is the angle of friction and the
cohesion.
The magnitude of the gravitational
force is related to the angle of the slope and the
weight of slope sediments and rock. The following
equation models this relationship:
The stability of a slope depends on the
relationship between the stresses applied to the
materials that make up the slope and their internal
strength. Mass movement occurs when the stresses
exceed the internal strength. Slopes composed of
loose materials, such as sand and gravel, derive
their internal strength from frictional resistance,
which depends on the size, shape, and arrangement
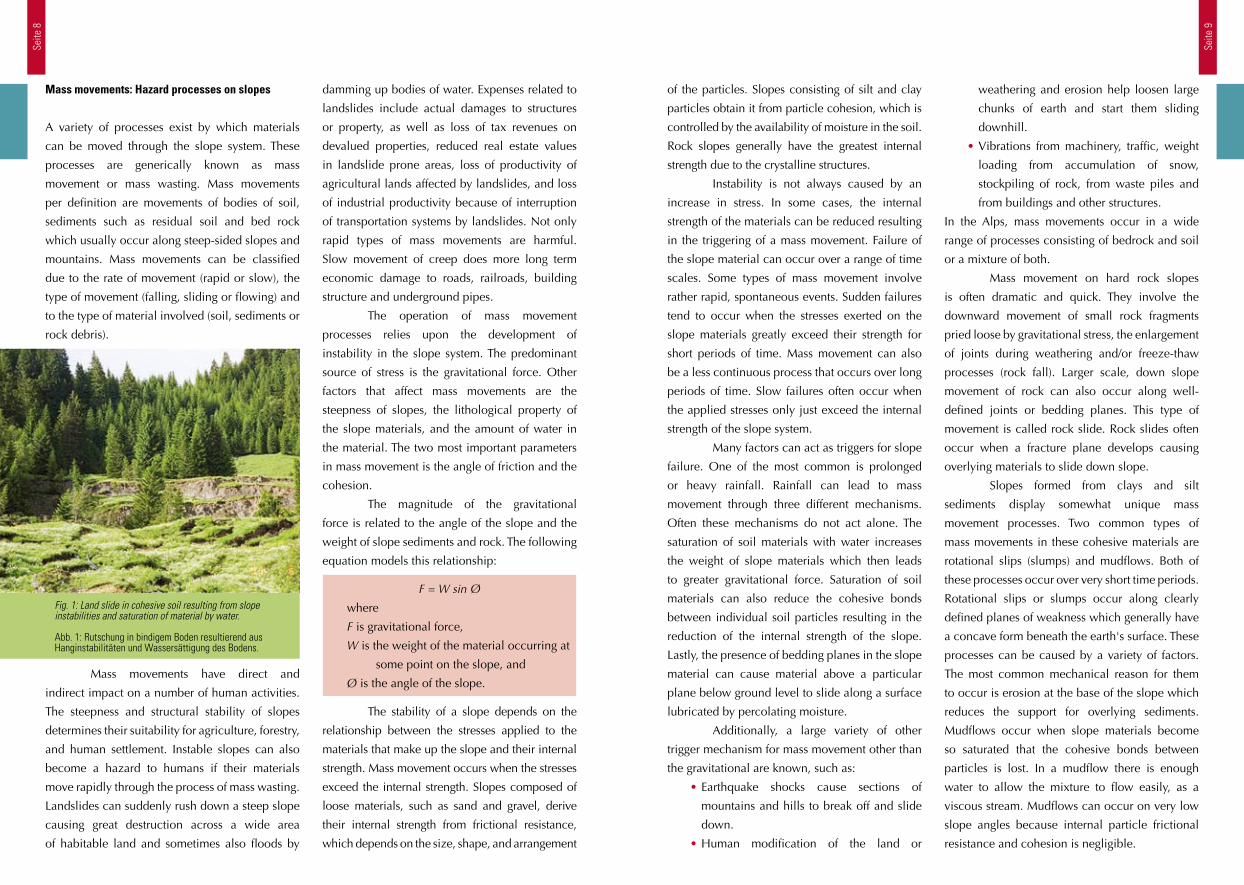
Mass movements: Hazard processes on slopes
A variety of processes exist by which materials
can be moved through the slope system. These
processes are generically known as mass
movement or mass wasting. Mass movements
per definition are movements of bodies of soil,
sediments such as residual soil and bed rock
which usually occur along steep-sided slopes and
mountains. Mass movements can be classified
due to the rate of movement (rapid or slow), the
type of movement (falling, sliding or flowing) and
to the type of material involved (soil, sediments or
rock debris).
Mass movements have direct and
indirect impact on a number of human activities.
The steepness and structural stability of slopes
determines their suitability for agriculture, forestry,
and human settlement. Instable slopes can also
become a hazard to humans if their materials
move rapidly through the process of mass wasting.
Landslides can suddenly rush down a steep slope
causing great destruction across a wide area
of habitable land and sometimes also floods by
Fig. 1: Land slide in cohesive soil resulting from slope instabilities and saturation of material by water.
Abb. 1: Rutschung in bindigem Boden resultierend aus Hanginstabilitäten und Wassersättigung des Bodens.
F = W sin Ø
where
F is gravitational force,
W is the weight of the material occurring at
some point on the slope, and
Ø is the angle of the slope.
Seite
10
Seite
11
Hazard maps for mass movements
Hazard zones are designated areas threatened
by natural risks such as avalanches, landslides or
flooding. The formulation of these hazard zones is
an important aspect of spatial planning. The basis
for hazard maps is a comprehensive assessment
of geological and hydro(geo)logical framework
conditions, slope instabilities, relevant triggering
mechanisms, properties of displacement
processes, potential risks and the vulnerability
of endangered areas (objects). Consequently it is
essential to distinguish the three aspects of mass
movement assessment and mapping:
• Dangers (susceptibilities): Assessment
and characterization of threat (typology,
morphology, inventory of mass movements).
• Hazards: Spatial and temporal probability,
intensity and forecasting of evolution
(scenarios) are needed.
• Risks: Interaction between a threat having
particular hazard and human activities.
In principle, these theoretical concepts are well
known by experts but
may cause problems in
practice when applied
in a legal framework.
It is not unusual for
unsuitable types of
hazard maps to be
applied for the wrong
purposes. For example
it is often to find
landslide inventory
maps used as hazard
or risk maps.
When mapping
geological hazards
(mass movements) in
principle we have to
distinguish between two situations:
1. Scientific studies on mass movements with no
legal implications (e.g. on land use planning):
Typical cases are studies carried out by
universities (research institutes). The aim of
these studies is to understand the mechanical
features of instability or to study different ways of
evolution of the phenomenon (scenarios) in order
to assess the susceptibility of investigated areas.
Landslide inventories can be made by means of
a historical or morphological approach.
2. Susceptibility/Hazard index/Hazard maps that
have direct (obligatory) consequences for land
use planning and building trade at different
scale: The scale used to present the results of
the hazard assessment depends on the desired
product (susceptibility map, hazard index map,
hazard zone map) and must be balanced with
the precision requirements according to the
spatial level of application (supra-regional,
regional, local). The legal significance of these
maps requires technical standards and a “state-
of-the-art” concerning formal requirements
(e.g. investigation methods, documentation),
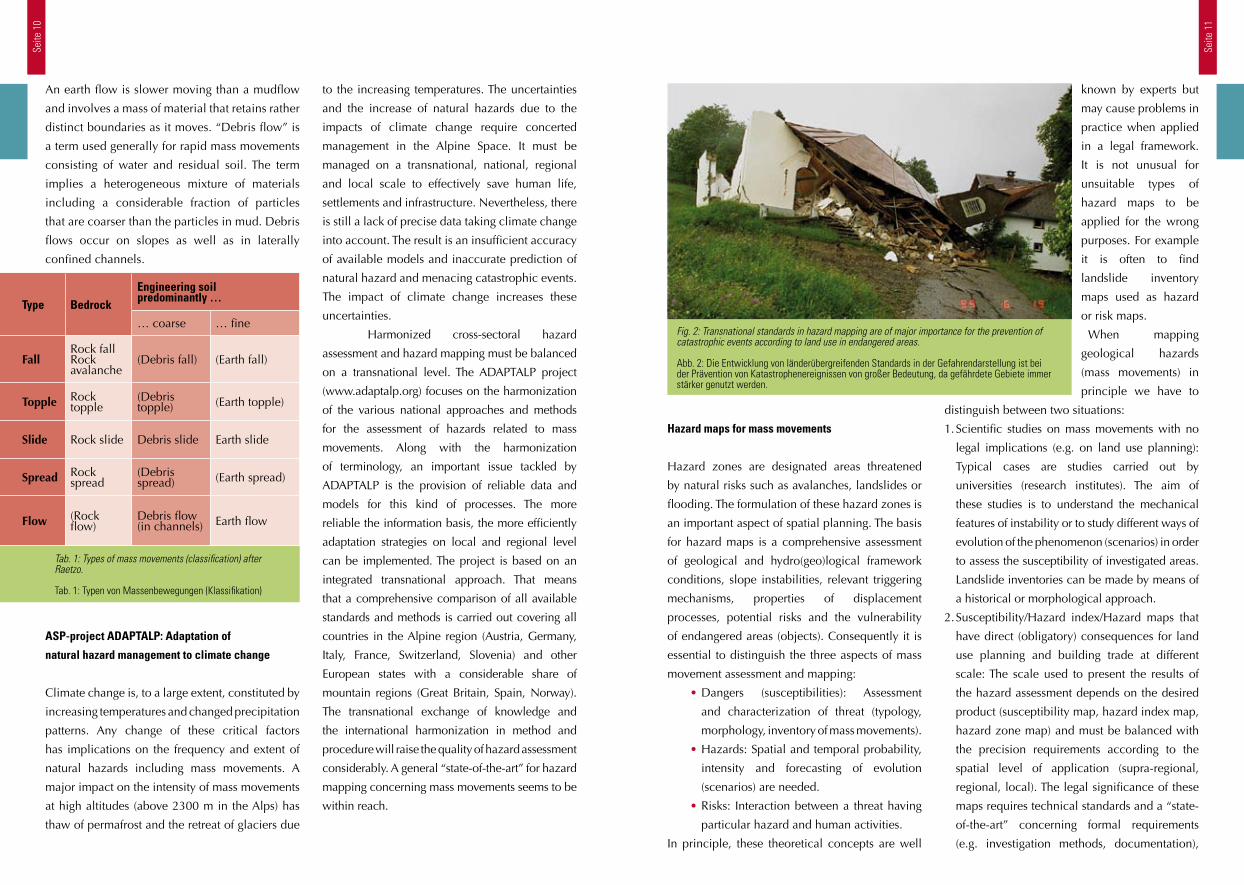
Fig. 2: Transnational standards in hazard mapping are of major importance for the prevention of catastrophic events according to land use in endangered areas.
Abb. 2: Die Entwicklung von länderübergreifenden Standards in der Gefahrendarstellung ist bei der Prävention von Katastrophenereignissen von großer Bedeutung, da gefährdete Gebiete immer stärker genutzt werden.
to the increasing temperatures. The uncertainties
and the increase of natural hazards due to the
impacts of climate change require concerted
management in the Alpine Space. It must be
managed on a transnational, national, regional
and local scale to effectively save human life,
settlements and infrastructure. Nevertheless, there
is still a lack of precise data taking climate change
into account. The result is an insufficient accuracy
of available models and inaccurate prediction of
natural hazard and menacing catastrophic events.
The impact of climate change increases these
uncertainties.
Harmonized cross-sectoral hazard
assessment and hazard mapping must be balanced
on a transnational level. The ADAPTALP project
(www.adaptalp.org) focuses on the harmonization
of the various national approaches and methods
for the assessment of hazards related to mass
movements. Along with the harmonization
of terminology, an important issue tackled by
ADAPTALP is the provision of reliable data and
models for this kind of processes. The more
reliable the information basis, the more efficiently
adaptation strategies on local and regional level
can be implemented. The project is based on an
integrated transnational approach. That means
that a comprehensive comparison of all available
standards and methods is carried out covering all
countries in the Alpine region (Austria, Germany,
Italy, France, Switzerland, Slovenia) and other
European states with a considerable share of
mountain regions (Great Britain, Spain, Norway).
The transnational exchange of knowledge and
the international harmonization in method and
procedure will raise the quality of hazard assessment
considerably. A general “state-of-the-art” for hazard
mapping concerning mass movements seems to be
within reach.
An earth flow is slower moving than a mudflow
and involves a mass of material that retains rather
distinct boundaries as it moves. “Debris flow” is
a term used generally for rapid mass movements
consisting of water and residual soil. The term
implies a heterogeneous mixture of materials
including a considerable fraction of particles
that are coarser than the particles in mud. Debris
flows occur on slopes as well as in laterally
confined channels.
ASP-project ADAPTALP: Adaptation of
natural hazard management to climate change
Climate change is, to a large extent, constituted by
increasing temperatures and changed precipitation
patterns. Any change of these critical factors
has implications on the frequency and extent of
natural hazards including mass movements. A
major impact on the intensity of mass movements
at high altitudes (above 2300 m in the Alps) has
thaw of permafrost and the retreat of glaciers due
Tab. 1: Types of mass movements (classification) after Raetzo.
Tab. 1: Typen von Massenbewegungen (Klassifikation)
Type BedrockEngineering soil predominantly …
… coarse … fine
FallRock fallRock avalanche
(Debris fall) (Earth fall)
Topple Rock topple
(Debris topple) (Earth topple)
Slide Rock slide Debris slide Earth slide
Spread Rock spread
(Debris spread) (Earth spread)
Flow (Rock flow)
Debris flow (in channels) Earth flow
Seite
12
Seite
13
Anschrift der Verfasser / Authors’ addresses:
DI Dr. Florian Rudolf-Miklau
Bundesministerium für Land- und Forstwirtschaft,
Umwelt und Wasserwirtschaft,
Abteilung IV/5, Wildbach- und Lawinenverbauung
Federal Ministry for Agriculture, Forestry,
Enviroment and Water Management,
Department IV/5, Torrent and Avalanche Control
1030 Wien, Marxergasse 2
Tel.: (+43 1) 71 100 - 7333
FAX: (+43 1) 71 100- 7399
Mail: [email protected]
Homepage: http://www.lebensministerium.at/forst
Dr. Richard Bäk
Amt der Kärntner Landesregierung, Abt. 15 Umwelt
Unterabteilung Geologie und Bodenschutz,
A – 9020 Klagenfurt, Flatschacher Straße 70
Tel: +43 - (0) 50536 - 31510
Fax: +43 - (0) 50536 - 41500
Mob. +43 - (0) 664 - 8053631510
Mail: [email protected]
DI Franz Schmid
Bundesministerium für Land- und Forstwirtschaft,
Umwelt und Wasserwirtschaft,
Abteilung IV/5, Wildbach- und Lawinenverbauung
Federal Ministry for Agriculture, Forestry,
Enviroment and Water Management, Department
IV/5, Torrent and Avalanche Control
1030 Wien, Marxergasse 2
Tel.: (+43 1) 71 100 - 7338
FAX: (+43 1) 71 100- 7399
Mail: [email protected]
Homepage: http://www.lebensministerium.at/forst
DI Christoph Skolaut
Wildbach- und Lawinenverbauung,
Sektion Salzburg
Torrent and Avalanche Control, District Salzburg
5020 Salzburg, Bergheimerstraße 57
Tel.: (+43 662) 871853 – 303
FAX: (+43 662) 870215
Mail: [email protected]
Homepage: http://www.lebensministerium.at/forst
Literatur / References:
BATES A. L., JACKSON J. A.: Glossary of Geology. American Geological Institute, 3rd Edition, 1987.
CAMPUS S., BABERO S., BOVO S., FORLATI F. (EDS.): Evaluation and prevention of natural risks. Taylor and Francis/Balkema, 2007.
GLADE T., ANDERSON M., CROZIER M. J. (HRG.): Landslide Hazards and Risk. John Wiley & Sons, Chichester, 2005.
GRUNER U., WYSS R.: Anleitung zur Analyse von Rutschungen. Swiss Bull. angew. Geol., Vol. 14/1+2, 2009.
RAETZO, H. , RICKLI, C.: Rutschungen. In: Bezzola G.R, & Hegg, C. (Hrsg.) 2007: Ereignisanalyse Hochwasser 2005, Teil 1 – Prozesse, Schäden und erste Einordnung. Bundesamt für Umwelt BAFU, Eidgenössische Forschungsanstalt WSL. Umwelt-Wissen Nr. 0707, 2007.
RUFF, M.: GIS-gestützte Risikonanalyse für Rutschungen und Felsstürze in den Ostalpen (Vorarlberg, Österreich). Georisikokarte Vorarlberg. Diss. Univ. Karlsruhe, 2005.
SIDLE R. C., OCHIAI H.: Landslides processes, prediction and land use. American Geographical Union, water resources monograph 18, Springer Verlag, 2006.
a climate change adaptation strategy. The results
will be summarized in a synthesis report.
These fields of research within the
project contain the topics to work out the
“minimum standards” (minimal requirements) for
the creation of danger (susceptibility) and hazard
maps for landslides. The first step is the evaluation
of the “state of the art” in hazard mapping in each
involved country. Two main questions will be
answered by the project:
• What kinds of danger (susceptibility),
hazard and risk maps are officially applied
in each country?
• Which standards are these maps based on?
The second step will be the “harmonization” of
the different methods, which are used in several
countries. Therefore similarities should be worked
out and the “least common denominator” in the
methods of hazard mapping should be found.
The final step will be the creation of guidelines
and recommendation, which include the results
of this “harmonization”. They will include
“minimum requirements for the creation of danger
(susceptibility), hazard and risk maps”.
Other important results – developed in cooperation
with other projects as MASSMOVE – will be:
• Definition of minimal requirements for the
collection of the relevant data of endangered
areas and cartographic representation of
slides and rock falls.
• Specification of minimal requirements for
the spatial description of the dangers.
• Development of minimal requirements for
the determination of the hazard potential of
slides and rock falls.
• Development of tools for the reduction of
the risk potential by consideration of the
hazards during land use planning by the
local administrations and during the land
use as well as for the planning of preventive
measures.
hazard assessment and procedures of the check
and approval of the maps.
ADAPTALP (in Work Package 5) will
evaluate, harmonize and improve different
methods of hazard mapping applied in the Alpine
area. A main emphasis will be on a comparison
of methods for mapping geological hazards in
the individual countries. A glossary will facilitate
interdisciplinary and multilingual cooperation as
well as support the harmonization of the various
methods. In selected model regions methods
to adapt risk analysis to the impact of climate
change will be tested. This should support the
development of hazard zone planning towards
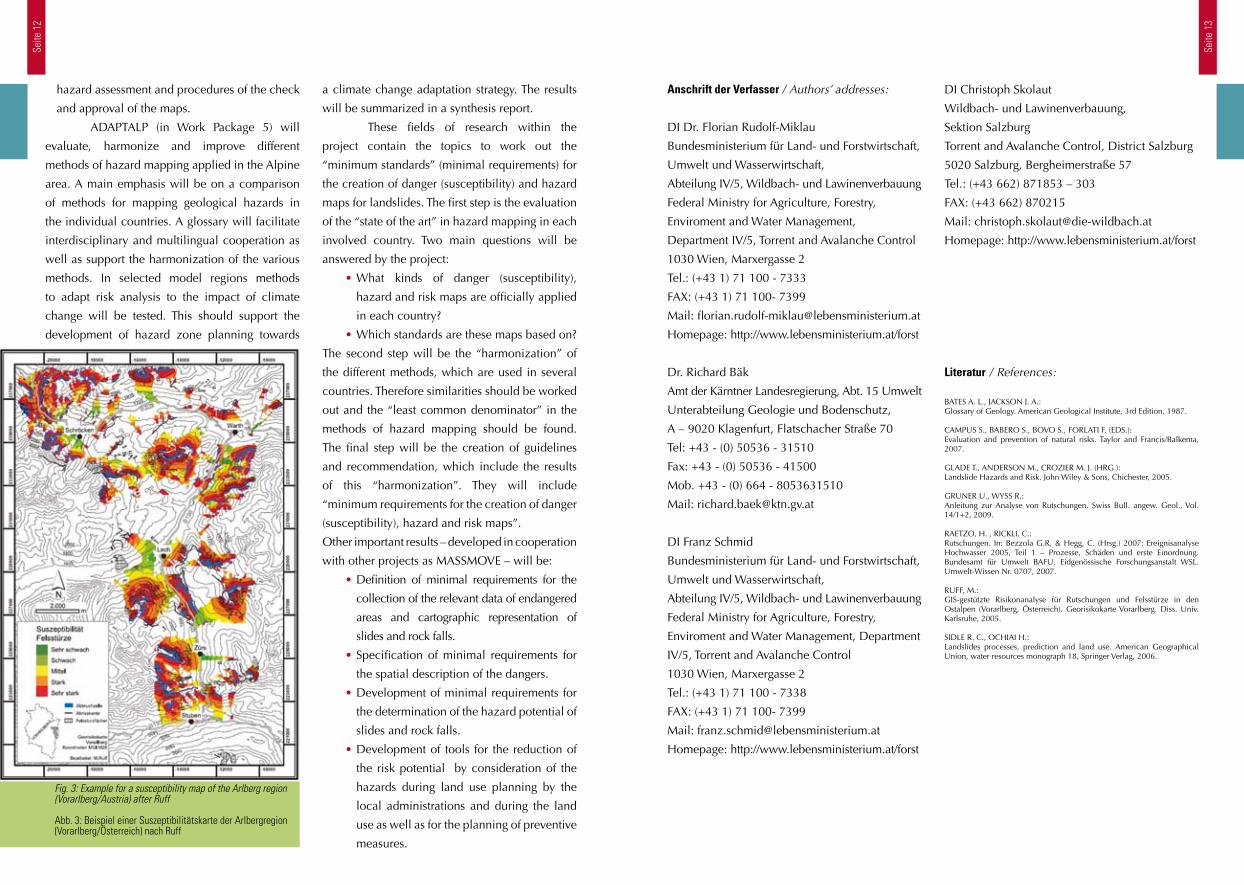
Fig. 3: Example for a susceptibility map of the Arlberg region (Vorarlberg/Austria) after Ruff
Abb. 3: Beispiel einer Suszeptibilitätskarte der Arlbergregion (Vorarlberg/Österreich) nach Ruff
Seite
14
Seite
15
According to the well-established basic concept of
hazard assessment, the procedure can be divided
in three distinct steps (HÜBL ET AL., 2007 [9.]:
• The survey of basic information (data)
• The analysis of hazards (and risks)
• The valuation of hazards (and risks)
As a rule, the survey of information related to
natural hazards focuses on the acquisition of
basic data on relevant factors in nature. The survey
includes “geo-data” (topography, geology, and
soil), “meteo-data” (climate, weather), “hydro-
data” (precipitation, run-off, and groundwater)
and “eco-data” (environmental parameters). In
addition, data on past (historic) events represent a
major source of information. (RUDOLF-MIKLAU,
2009 [14.]) For the purpose of risk assessment,
data for natural processes must be combined with
data related to human activities. These sources of
information include demographic and economic
statistics, data on land use and agriculture,
and records of damages caused by past events
(BRÜNDL ET AL., 2009 [5.]).
Basic concept of hazard assessment
Effective prevention against natural hazards
requires a better understanding of the processes
occurring in nature. The primary aim of hazard
assessment is to gain a deep and comprehensive
knowledge of these processes in order to provide
accurate prognosis of the expected magnitude
of hazardous events and the corresponding
damaging effects. (RUDOLF-MIKLAU in SUDA
ET. AL., 2011 [18.]) Another important demand
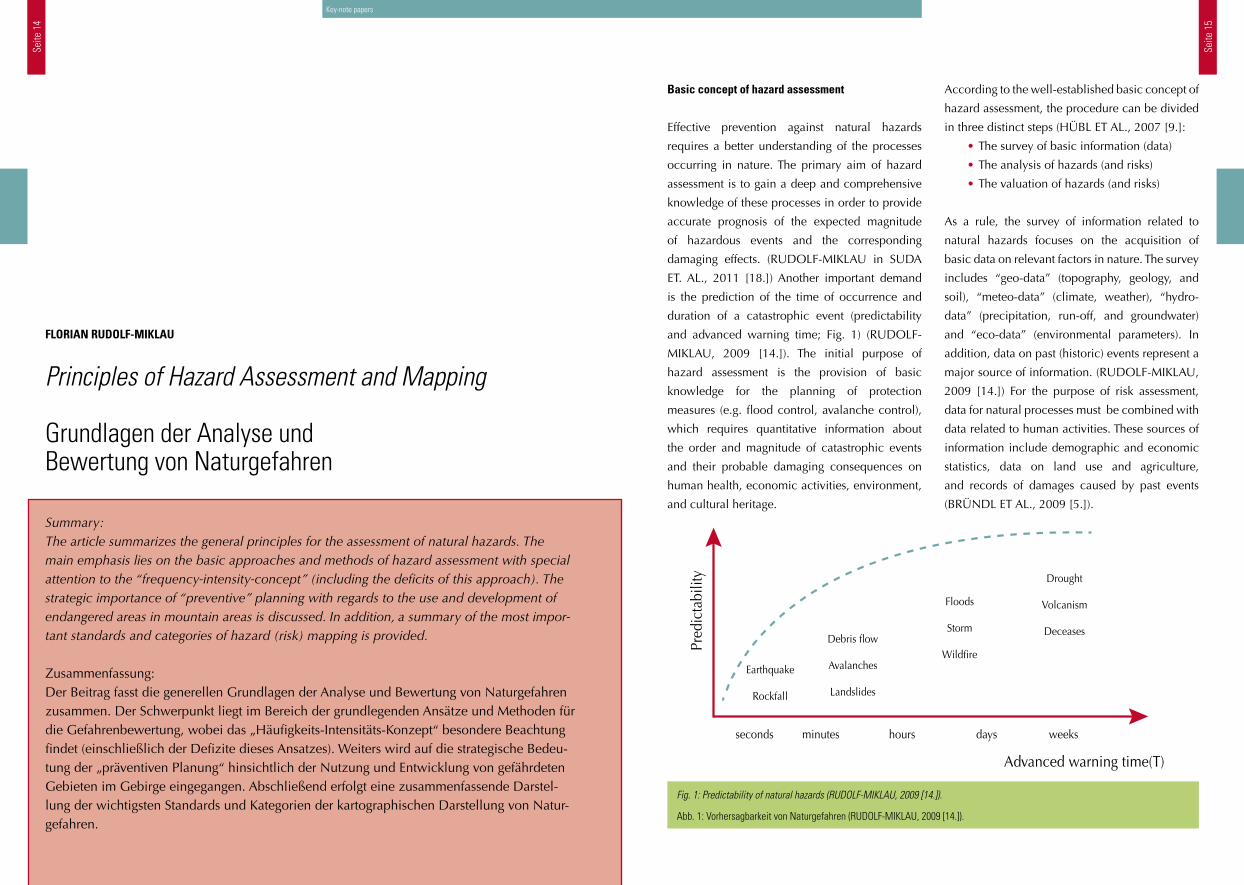
is the prediction of the time of occurrence and
duration of a catastrophic event (predictability
and advanced warning time; Fig. 1) (RUDOLF-
MIKLAU, 2009 [14.]). The initial purpose of
hazard assessment is the provision of basic
knowledge for the planning of protection
measures (e.g. flood control, avalanche control),
which requires quantitative information about
the order and magnitude of catastrophic events
and their probable damaging consequences on
human health, economic activities, environment,
and cultural heritage.
seconds
Earthquake
Rockfall
Debris flow
Avalanches
Landslides
Floods
Storm
Wildfire
Drought
Volcanism
Deceases
Advanced warning time(T)
Pred
icta
bilit
y
minutes hours days weeks
Fig. 1: Predictability of natural hazards (RUDOLF-MIKLAU, 2009 [14.]).
Abb. 1: Vorhersagbarkeit von Naturgefahren (RUDOLF-MIKLAU, 2009 [14.]).
Principles of Hazard Assessment and Mapping
Grundlagen der Analyse und Bewertung von Naturgefahren
Summary:The article summarizes the general principles for the assessment of natural hazards. The main emphasis lies on the basic approaches and methods of hazard assessment with special attention to the “frequency-intensity-concept” (including the deficits of this approach). The strategic importance of “preventive” planning with regards to the use and development of endangered areas in mountain areas is discussed. In addition, a summary of the most impor-tant standards and categories of hazard (risk) mapping is provided.
Zusammenfassung:Der Beitrag fasst die generellen Grundlagen der Analyse und Bewertung von Naturgefahren zusammen. Der Schwerpunkt liegt im Bereich der grundlegenden Ansätze und Methoden für die Gefahrenbewertung, wobei das „Häufigkeits-Intensitäts-Konzept“ besondere Beachtung findet (einschließlich der Defizite dieses Ansatzes). Weiters wird auf die strategische Bedeu-tung der „präventiven Planung“ hinsichtlich der Nutzung und Entwicklung von gefährdeten Gebieten im Gebirge eingegangen. Abschließend erfolgt eine zusammenfassende Darstel-lung der wichtigsten Standards und Kategorien der kartographischen Darstellung von Natur-gefahren.
FLORIAN RUDOLF-MIKLAU
Key-note papers
Seite
16
Seite
17
regionally measurements and data from
documented events ahead of application.
• The application of physical models is not
only performed for one single data set but
for a frequency range of the input values.
• Scenarios are checked concerning their
plausibility.
Approaches to hazard assessment: The “frequency-
magnitude-concept” for design events (DE)
According to ONR 24800:2008 [13.] an event
represents the entirety of all processes occurring
in a temporal, areal and causal relationship and
corresponds to a specific probability of recurrence
and intensity. The extreme event represents the
maximum magnitude observed in the concerning
catchment or risk area. The design event (DE)
is applied as reference value (criteria) for the
planning of protection measures and hazard
maps and represents the striven level of safety
(acceptable risk). (RUDOLF-MIKLAU, 2009 [14.])
The underlying concept of intensity and
frequency was originally established by WOLMAN
& MILLER (1960) [19.]. Intensity in colloquial use
refers to strength or magnitude of a process or
event. Intensity of natural events (hazards) can be
expressed by physical criteria like discharge, flow
depth, pressure (process energy) or area (mass)
of deposited debris. (GEBÄUDEVERSICHERUNG
GRAUBÜNDEN, 2004 [7.]) In general the
frequency represents the period of recurrence
between two events with comparable magnitude.
Frequency is often expressed as return period,
which is equal to the reciprocal of the exceedance
probability of extreme precipitation or discharge
values. As a rule the DE is determined according
to a defined return period (e.g. flood with return
period of 100 years). Frequency and intensity are
functionally correlated. (RUDOLF-MIKLAU in
BOLLSCHWEILER ET AL., 2011 [3.])
The frequency-intensity-concept is based
on extreme value statistics and is appropriate for
answering two basic questions:
• How often does an extreme event of
defined intensity occur statistically?
• What is the expected extreme value for a
defined time period?
The two established methods to analyse extreme
events are the “block-maxima-method” and
the “peak-over-threshold-method” (KLEEMAYR
in RUDOLF-MIKLAU & SAUERMOSER, 2011
[16.]). For the statistic analysis, random and
representative samples (data sets) are needed
(e.g. time series of extreme precipitation). By
means of statistical methods, it is attempted to
conclude from properties of the sample to the
rules of the “total population”. In technical terms,
an unknown stochastic distribution function (e.g.
Gumbel, Fréchet, Weibull) is derived from an
empirical distribution of measured values. The
most common field of application of the extreme
value statistics is the prediction of weather
extremes, extreme discharge in rivers and torrents
of the extreme run-out distance of falls, slides or
falls (mass movements or avalanches). The key
problem of the method is the limited availability of
measurements (data sets) that cover a sufficiently
long period of time. In most cases the available
data represents
• either a too short observation (measuring)
period,
• or is fragmentary
or both. Besides this major disadvantage, the
method of extreme value statistics shows other
considerable short comings.
Especially for torrential processes, the frequency-
intensity-function shows an “emergent” behavior
implying a limited predictability of discharge
from extrapolations of measurement data when
a certain threshold value is exceeded. The event
disposition of a catchment or risk area, defined
Key-note papers
method for most natural hazards in order to value
their effects (see below). (HÜBL, 2010 [8.])
Natural hazards in the Alpine
environment are a complex system consisting
of process chains with multiple interactions
and dependencies. Thus the assessment of a
hazard is not a mono-causal procedure but
must take into account a large variety of more
or less probable courses. (RUDOLF-MIKLAU
in BOLLSCHWEILER ET AL., 2011 [3.]) The
“scenario analysis” was established in risk
management as an appropriate method to
solve the complexity of comprehensive hazard
assessment. Scenarios implicate that not only a
single process but all relevant developments of
an event within a defined period of recurrence
are taken into account. (MAZZORANA ET AL.,
2009 [12.]) In practice this means:
• Several assessment methods (e.g.
morphologic, historic, stochastic) are
applied.
• Models have to be calibrated with
The analysis of hazards is subdivided into several
tasks: the survey and localization of hazard
sources, the identification of triggering factors,
the description of the triggering and displacement
process and the potential effects (impact) on
objects. The results of the hazard analysis are
usually mapped in specific types of hazard maps
(e.g. susceptibility maps, intensity maps).
The analysis of natural hazards provides a
comprehensive image of the processes, their causes
and effects, but requires additional information
concerning the order of magnitude of the relevant
event. (RUDOLF-MIKLAU in BOLLSCHWEILER
ET AL., 2011 [3.]) Consequently, the valuation of
hazards aims at the description of magnitude in a
graded manner. Hazards scales, physical intensity
criteria or intensity classifications count among
the established methods to present the magnitude
of events. Usually the intensity of a hazardous
process is functionally related to the frequency
of its occurrence. In practice this “frequency-
intensity-concept” is the preferentially applied
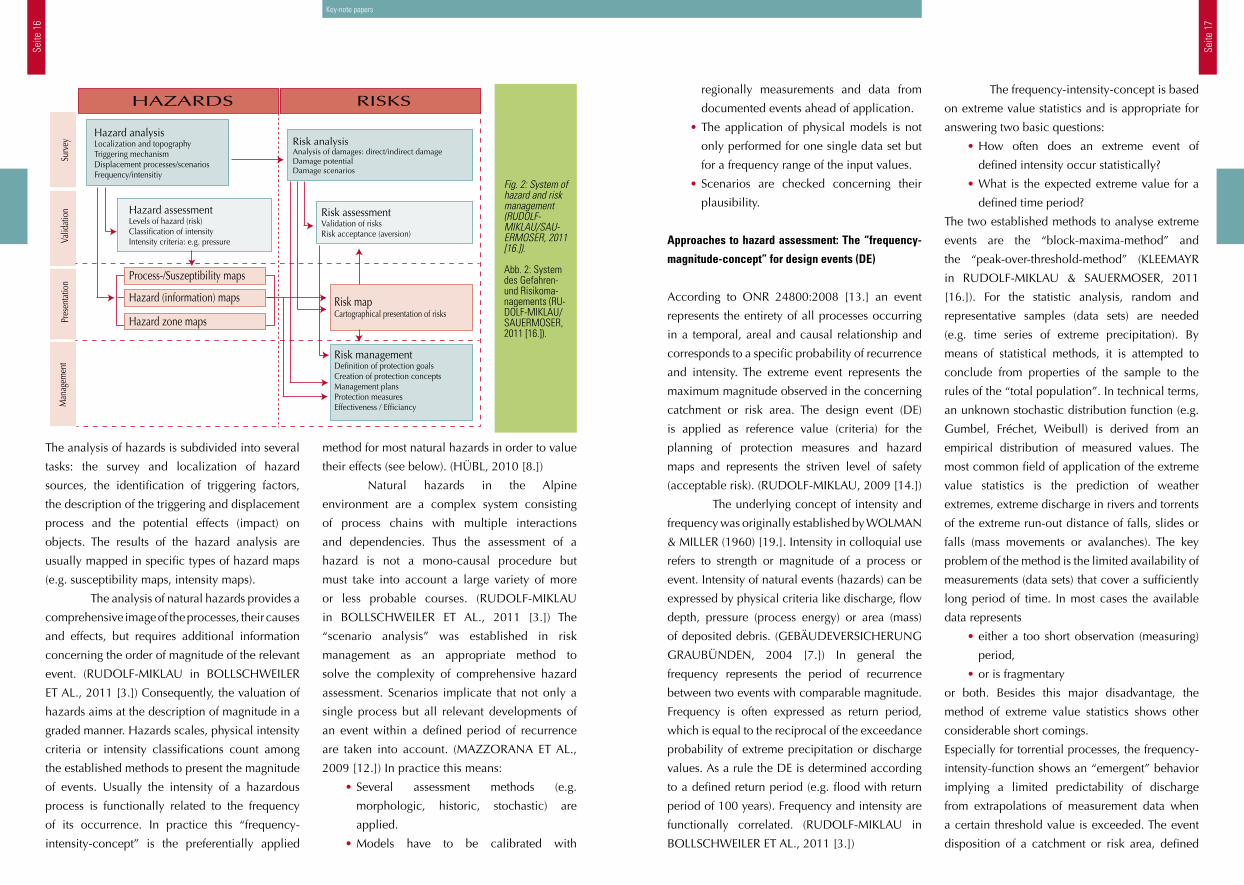
RISKSHAZARDS
Risk analysisAnalysis of damages: direct/indirect damageDamage potentialDamage scenarios
Hazard analysisLocalization and topographyTriggering mechanismDisplacement processes/scenariosFrequency/intensitiy
Risk managementDefinition of protection goalsCreation of protection conceptsManagement plansProtection measuresEffectiveness / Efficiancy
Hazard assessmentLevels of hazard (risk)Classification of intensityIntensity criteria: e.g. pressure
Risk assessmentValidation of risksRisk acceptance (aversion)
Risk mapCartographical presentation of risks
Process-/Suszeptibility maps
Hazard (information) maps
Hazard zone maps
Man
agem
ent
Pres
enta
tion
Valid
atio
nSu
rvey
Fig. 2: System of hazard and risk management (RUDOLF-MIKLAU/SAU-ERMOSER, 2011 [16.]).
Abb. 2: System des Gefahren- und Risikoma-nagements (RU-DOLF-MIKLAU/SAUERMOSER, 2011 [16.]).
Seite
18
Seite
19
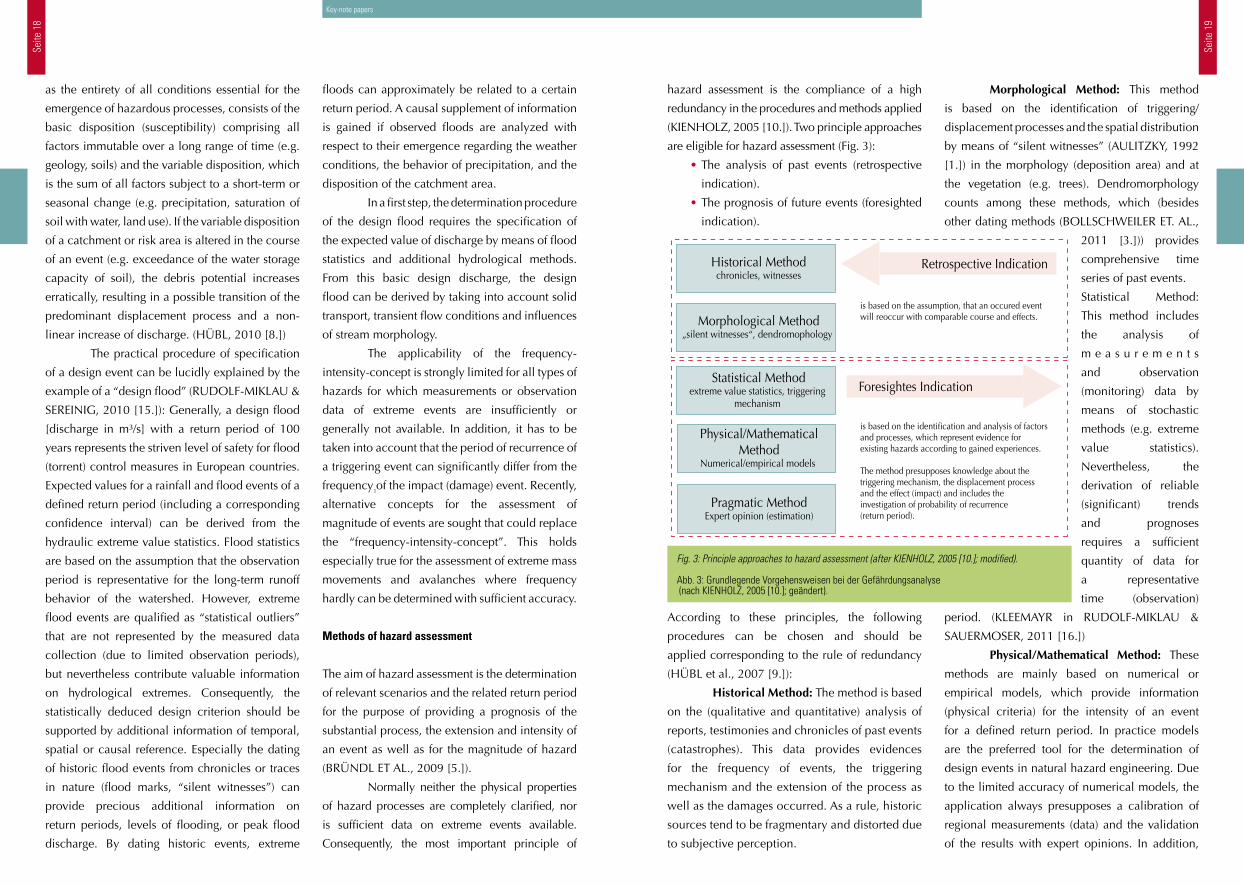
hazard assessment is the compliance of a high
redundancy in the procedures and methods applied
(KIENHOLZ, 2005 [10.]). Two principle approaches
are eligible for hazard assessment (Fig. 3):
• The analysis of past events (retrospective
indication).
• The prognosis of future events (foresighted
indication).
According to these principles, the following
procedures can be chosen and should be
applied corresponding to the rule of redundancy
(HÜBL et al., 2007 [9.]):
Historical Method: The method is based
on the (qualitative and quantitative) analysis of
reports, testimonies and chronicles of past events
(catastrophes). This data provides evidences
for the frequency of events, the triggering
mechanism and the extension of the process as
well as the damages occurred. As a rule, historic
sources tend to be fragmentary and distorted due
to subjective perception.
Morphological Method: This method
is based on the identification of triggering/
displacement processes and the spatial distribution
by means of “silent witnesses” (AULITZKY, 1992
[1.]) in the morphology (deposition area) and at
the vegetation (e.g. trees). Dendromorphology
counts among these methods, which (besides
other dating methods (BOLLSCHWEILER ET. AL.,
2011 [3.])) provides
comprehensive time
series of past events.
Statistical Method:
This method includes
the analysis of
m e a s u r e m e n t s
and observation
(monitoring) data by
means of stochastic
methods (e.g. extreme
value statistics).
Nevertheless, the
derivation of reliable
(significant) trends
and prognoses
requires a sufficient
quantity of data for
a representative
time (observation)
period. (KLEEMAYR in RUDOLF-MIKLAU &
SAUERMOSER, 2011 [16.])
Physical/Mathematical Method: These
methods are mainly based on numerical or
empirical models, which provide information
(physical criteria) for the intensity of an event
for a defined return period. In practice models
are the preferred tool for the determination of
design events in natural hazard engineering. Due
to the limited accuracy of numerical models, the
application always presupposes a calibration of
regional measurements (data) and the validation
of the results with expert opinions. In addition,
Key-note papers
Historical Methodchronicles, witnesses
Morphological Method„silent witnesses“, dendromophology
is based on the assumption, that an occured eventwill reoccur with comparable course and effects.
is based on the identification and analysis of factorsand processes, which represent evidence for existing hazards according to gained experiences.
The method presupposes knowledge about the triggering mechanism, the displacement processand the effect (impact) and includes theinvestigation of probability of recurrence(return period).
Statistical Methodextreme value statistics, triggering
mechanism
Pragmatic MethodExpert opinion (estimation)
Physical/MathematicalMethod
Numerical/empirical models
Retrospective Indication
Foresightes Indication
Fig. 3: Principle approaches to hazard assessment (after KIENHOLZ, 2005 [10.]; modified).
Abb. 3: Grundlegende Vorgehensweisen bei der Gefährdungsanalyse (nach KIENHOLZ, 2005 [10.]; geändert).
floods can approximately be related to a certain
return period. A causal supplement of information
is gained if observed floods are analyzed with
respect to their emergence regarding the weather
conditions, the behavior of precipitation, and the
disposition of the catchment area.
In a first step, the determination procedure
of the design flood requires the specification of
the expected value of discharge by means of flood
statistics and additional hydrological methods.
From this basic design discharge, the design
flood can be derived by taking into account solid
transport, transient flow conditions and influences
of stream morphology.
The applicability of the frequency-
intensity-concept is strongly limited for all types of
hazards for which measurements or observation
data of extreme events are insufficiently or
generally not available. In addition, it has to be
taken into account that the period of recurrence of
a triggering event can significantly differ from the
frequency of the impact (damage) event. Recently,
alternative concepts for the assessment of
magnitude of events are sought that could replace
the “frequency-intensity-concept”. This holds
especially true for the assessment of extreme mass
movements and avalanches where frequency
hardly can be determined with sufficient accuracy.
Methods of hazard assessment
The aim of hazard assessment is the determination
of relevant scenarios and the related return period
for the purpose of providing a prognosis of the
substantial process, the extension and intensity of
an event as well as for the magnitude of hazard
(BRÜNDL ET AL., 2009 [5.]).
Normally neither the physical properties
of hazard processes are completely clarified, nor
is sufficient data on extreme events available.
Consequently, the most important principle of
as the entirety of all conditions essential for the
emergence of hazardous processes, consists of the
basic disposition (susceptibility) comprising all
factors immutable over a long range of time (e.g.
geology, soils) and the variable disposition, which
is the sum of all factors subject to a short-term or
seasonal change (e.g. precipitation, saturation of
soil with water, land use). If the variable disposition
of a catchment or risk area is altered in the course
of an event (e.g. exceedance of the water storage
capacity of soil), the debris potential increases
erratically, resulting in a possible transition of the
predominant displacement process and a non-
linear increase of discharge. (HÜBL, 2010 [8.])
The practical procedure of specification
of a design event can be lucidly explained by the
example of a “design flood” (RUDOLF-MIKLAU &
SEREINIG, 2010 [15.]): Generally, a design flood
[discharge in m³/s] with a return period of 100
years represents the striven level of safety for flood
(torrent) control measures in European countries.
Expected values for a rainfall and flood events of a
defined return period (including a corresponding
confidence interval) can be derived from the
hydraulic extreme value statistics. Flood statistics
are based on the assumption that the observation
period is representative for the long-term runoff
behavior of the watershed. However, extreme
flood events are qualified as “statistical outliers”
that are not represented by the measured data
collection (due to limited observation periods),
but nevertheless contribute valuable information
on hydrological extremes. Consequently, the
statistically deduced design criterion should be
supported by additional information of temporal,
spatial or causal reference. Especially the dating
of historic flood events from chronicles or traces
in nature (flood marks, “silent witnesses”) can
provide precious additional information on
return periods, levels of flooding, or peak flood
discharge. By dating historic events, extreme
Seite
20
Seite
21
storm, forest fire, snow load), preventive planning
is limited to rough-scale maps showing a general
gradation of risks. (RUDOLF-MIKLAU, 2009 [14.])
The environmental planning is of major
importance for the application of hazard maps.
Consequently, preventive planning can be
understood as a part of development planning.
In order to regulate the use and development of
endangered areas, the intervention of the state
is essential. The primary goal of development
planning concerning natural hazards is to keep
the endangered areas free from buildings (passive
protection function). The active protection function
of preventive planning lies in the reservation
(provision) of areas for the spreading of hazardous
processes (e.g. inundation areas) or in the provision
of standards (limits) for the use of endangered areas
in order to reduce the risk potential.
Mapping hazards in Alpine environment
The cartographic outline of endangered areas
according to KIENHOLZ (2005) [10.] includes the
elaboration of scientific and technical bases and
the depiction in hazard (indication) maps. In a
second step, the geographic information provided
on triggering disposition and impact intensity of
hazardous processes is used for the provision
of hazard zone maps and their implementation
in the process of development planning. As a
rule, hazard maps have no legal liability but are
defined as “spatial expert opinions with prognosis
character”, while the hazard zones become
legally binding only by incorporating them into
development planning documents (land use
maps). Thus legal liability of hazard zones may
arise on the local level depending on the national
legal framework.
Consequently, it is essential to adapt the
standards of hazard mapping to the requirements
and goal of development planning on the regional
and local level. In the Alpine countries in general
the following categories of maps for the outline of
hazards and risks can be distinguished:
• Process maps (susceptibility, intensity)
• Hazard (indication) maps
• Hazard zone maps
• Risk maps
The following definitions are valid only with
restrictions since terminology of hazard mapping
substantially differs between countries and
scientific branches.
A hazard (indication) map roughly
indicates in which areas natural hazard have to be
taken into account in land use and development
activities. The character of the map is only
demonstrative, while no concrete information
about the magnitude of the danger is provided.
In many countries hazard zone maps are not
available, leaving hazard indication maps as the
only source of spatial information.
Process maps show hazards by the
spatial distribution of physical parameters
(criteria) describing the triggering, displacement
and impact processes. These maps are most often
the result of numerical or empirical modeling. In
some countries, process maps are transformed
into intensity maps showing the process criteria
graded according to the levels of impact intensity
(e.g. Switzerland: frequency-intensity-matrix;
LOAT, 2005 [11.]). Susceptibility is defined as the
extent to which an area suffers from the risk of
emergence of a hazardous process if exposed to a
triggering factor, without regard to the likelihood
of exposure. Analogously, susceptibility maps
show the disposition of an area for these events,
but does not provide information about the
frequency and expected intensity.
Hazard zone maps show the impact of
processes according to its magnitude (intensity,
frequency) on the scale of the local cadastre
(1.2000 – 1.5000). Consequently, these
Key-note papers
Preventive planning: principles and function
“Prevention by planning” today is qualified as
the most effective measure in natural hazard
management. Planning in relation to natural
hazards and risks can also unfold active as
passive protection effects. Planning procedures
concerning natural hazards are not limited to the
cartographic outline of endangered areas (areas
at risk), but also provide the passivity to reduce
hazards/risk by keeping endangered areas free
from buildings or limiting the use of these zones
(e.g. inundation areas). Thus preventive planning
is the basis for the protection strategy “prevention
by area”. (RUDOLF-MIKLAU, 2009 [14.])
In addition, the cartographic depiction of
hazard zones provides the essential information
(process intensity, magnitude of impact forces)
for the technical protection of existing buildings.
Also the suitability of planned building sites
concerning the risk by natural hazards can be
efficiently judged on the basis of hazard maps.
In development planning, the localization of new
settlements can be steered away from impending
hazards. (BUWAL/BRP/BWW, 1997 [6.])
In principle, in the Alpine environment
the usability of land for building purposes is
limited according to the expansion of hazards.
In mountainous regions, the total avoidance
of hazard zones for spatial development is not
possible. Consequently, preventive planning
defines limits (border lines) for areas that are
appropriate for building. Within these limits,
hazard maps provide bases for standards and
regulations for a hazard-adapted construction
practice.
Logically, the main emphasis of preventive
planning lies in the sector of hazards spatially
“delimited” in action, such as floods, avalanches,
mass movements. For natural hazards that do not
allow an “exact” delimitation (e.g. earthquake,
models should not only be applied for a single
data set but for a range of scenarios as well as for a
distribution of input parameters. A comprehensive
summary of available models for torrential
processes is given in BERGMEISTER ET AL. (2009)
[2.], for avalanches in RUDOLF-MIKLAU &
SAUERMOSER (2011) [16.].
Pragmatic Method: This method is
based on the “expert opinion” of experiences
practitioners and local experts. The pragmatic
method is applied if other methods are not
applicable or do not meet the goal of satisfying
hazard (risk) assessment. In addition, this
method serves as a redundancy and is used for
the validation of results of “exact” assessment
methods (mentioned above).
Hazard assessment methods always
suffer from major restrictions concerning their
meaningfulness and accuracy. For the interpretation
and validation of results, it is essential to know
the sources of uncertainties and methodical
short-comings. Some of these deficiencies are
summarized below (KIENHOLZ, 2005 [10.]):
• Limited availability of data
• Limited observation (measuring) period
• Lack of “direct” measurements (e.g.
velocity of mass propagation during events;
impact pressure)
• Incomplete or false documentation of past
events
• Inconsistent quality of information and data
due to variable measuring (observation,
monitoring, documentation) standards
• Uncertainties in the selection of relevant
scenarios
• Misjudgement of the effeminacy and
condition (usability) of existing protection
measures
• Misjudgement concerning the “residual risk”
Seite
22
Seite
23
Overlaying this information makes feasible a
comprehensive assessment of risks for human
health, economic acidities, environment and
cultural heritage.
As shown in this article, the methods
for the assessment of natural hazards still suffer
from major short-comings and significant sources
of inaccuracy. In addition, a comprehensive
understanding of the triggering and displacement
processes of Alpine natural hazards is still
missing due to the limited availability of “direct”
measurements and observation.
Although hazard maps have gained a
key role in the process of preventive planning,
the information provided by these maps should
still be treated with care and only be interpreted
by experts. This reservation especially holds true
for hazard maps devoted to mass movements.
As the standards of hazard mapping in this field
are still under development, preventive planning
concerning rock fall and landslides (unlike flood
and avalanche hazards) is still “in situ nascendi”.
This delay justifies the strong efforts within the
Alpine space to establish and harmonize general
standards for the assessment and mapping of
hazards caused by mass movements.
Anschrift des Verfassers / Author’s address:
DI Dr. Florian Rudolf-Miklau
Bundesministerium für Land- und Forstwirtschaft,
Umwelt und Wasserwirtschaft, Abteilung IV/5,
Wildbach- und Lawinenverbauung
Federal Ministry for Agriculture, Forestry,
Enviroment and Water Management, Department
IV/5, Torrent and Avalanche Control
1030 Wien, Marxergasse 2
Tel.: (+43 1) 71 100 - 7333
FAX: (+43 1) 71 100- 7399
Mail: [email protected]
Homepage: http://www.lebensministerium.at/forst
Literatur / References:
[1.] AULITZKY H. (1992): Die Sprache der "Stummen Zeugen". Tagungsband der Internationalen Konferenz Interpraevent 1992, S. 139-174.
[2.] BERGMEISTER K., SUDA J., HÜBL J., RUDOLF-MIKLAU F. (2009): Schutzbauwerke der Wildbachverbauung. Verlag Ernst und Sohn Berlin (Wiley VCH).
[3.] BOLLSCHWEILER M., STOFFEL M., RUDOLF-MIKLAU F. (2011): Tracking torrential processes on fans and cones. Springer Dortrecht (in preparation).
[4.] BORTER P. (1999): Risikoanalyse bei gravitativen Naturgefahren. Bern: Bundesamt für Umwelt, Wald und Landschaft BUWAL. Umwelt-Materialien 107/I+II.
[5.] BRÜNDL M., ROMANG H., HOLTHAUSEN N., MERZ H., BISCHOF N. (2009):Risikokonzept für Naturgefahren – Leitfaden; Teil A: Allgemeine Darstellung des Risikokonzepts. Bern: Nationale Plattform Naturgefahren PLANAT (vorläufige Fassung).
[6.] BUNDESAMT FÜR UMWELT, WALD UND LANDSCHAFT BUWAL, BUNDESAMT FÜR RAUMPLANUNG BRP, BUNDESAMT FÜR WASSERWIRTSCHAFT BWW (1997): Berücksichtigung von Hochwassergefahren bei der raumwirksamen Tätigkeit, Biel.
[7.] GEBÄUDEVERSICHERUNG GRAUBÜNDEN (2004): Vorschriften für bauliche Maßnahmen an Bauten in der blauen Lawinenzone.
[8.] HÜBL J. (2010):Hochwässer in Wildbacheinzugsgebieten. Wiener Mitteilungen (in press).
[9.] HÜBL J., FUCHS S., AGNER P. (2007): Optimierung der Gefahrenzonenplanung. Weiterentwicklung der Methoden der Gefahrenzonenplanung. IAN-Report 90. Wien: Universität für Bodenkultur (unveröffentlicht).
[10.] KIENHOLZ H. (2005): Gefahrenzonenplanung im Alpenraum – Ansprüche und Grenzen, Imst: Imst: Wildbach- und Lawinenverbau (Zeitschrift für Wildbach-, Erosions- und Steinschlagschutz), Nr. 152, 135-151.
[11.] LOAT R. (2005): Die Gefahrenzonenplanung in der Schweiz. Imst: Wildbach- und Lawinenverbau (Zeitschrift für Wildbach-, Erosions- und Steinschlagschutz), Nr. 152, 77-92.
[12.] MAZZORANA B., FUCHS S., HÜBL J. (2009): Improving risk assessment by defining consistent and reliable system scenarios, Nat. Hazards Earth Syst. Sci., 9: 145–159.
[13.] ONR 24800:2008, Schutzbauwerke der Wildbachverbauung – Begriffe und ihre Definition sowie Klassifizierung. Austrian Standards Institute, Vienna.
[14.] RUDOLF-MIKLAU F. (2009): Naturgefahren-Management in Österreich. Verlag Lexis-Nexis Orac .
[15.] RUDOLF-MIKLAU F., SEREINIG N. (2009): Festlegung des Bemessungshochwassers: Prozessorientierte Harmonisierung für Flüsse und Wildbäche, ÖWAW 7-8: 29 – 32.
[16.] RUDOLF-MIKLAU F., SAUERMOSER S. (Hrsg.) (2011): Technischer Lawinenschutz. Verlag Ernst und Sohn/Wiley Berlin (in preparation).
[17.] SCHROTT L., GLADE T. (2008):Frequenz und Magnitude natürlicher Prozesse; in Flegentreff, Glade (Eds.): Naturrisiken und Sozialkatastrophen. Spektrum Akademischer Verlag Springer: 134 – 150.
[18.] SUDA J., RUDOLF-MIKLAU F., HÜBL J., KANONIER A. (Hrsg.) (2011): Gebäudeschutz vor Naturgefahren. Verlag Spring Wien (in preparation).
[19.] WOLMAN M. G., MILLER J. P. (1960): Magnitude and frequency of forces on geomorphic processes. Journal of Geology 68 (1): 54 – 74.
Key-note papers
event (period of recurrence) for the assessment of
the relevant hazards. (HÜBL ET AL., 2007 [9.])
The elaboration of risk maps is based on the
depiction of objects at risk (risk potentials) within
endangered areas. In principle there are two types
of risk maps available (BORTER ET AL., 1999 [4.]):
•Risk maps only showing risk potential
without assessing (value) them.
• Risk maps based on a graded, qualitative
or quantitative assessment of risks (levels
of risk; e.g. low – medium - high). These
maps are elaborated by combining the
impact intensity with the damage potential
(value), the vulnerability and the exposition
of objects/persons in the endangered area.
Closing remarks
Hazard (risk) assessment and mapping count
among the most important tasks (measures) in
natural hazard management. The maps provide
the key information for most of the other mitigation
measures in order to reduce risk to an acceptable
level. GIS technology provides a powerful tool to
combine spatial information on natural hazards
with other cartographic information concerning
human activities and development actions.
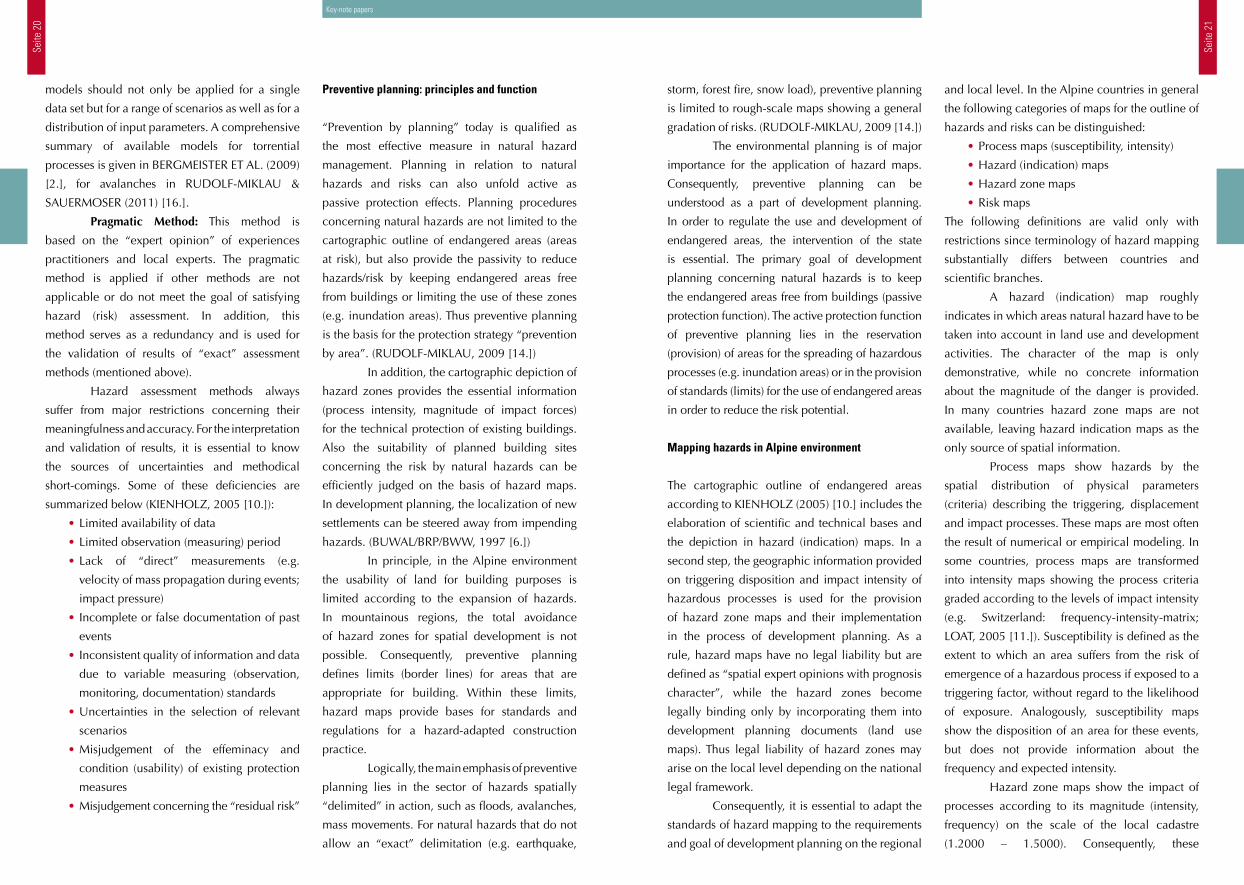
maps provide specific information about the
usability of certain plots for building or other
development purposes. Hazard zone maps are
regularly produced for the hazard types floods,
avalanches and debris flow, and only in few
countries (Switzerland, France, and Italy) for
mass movements as well. In most countries,
hazard zone maps are regulated by legal and
technical standards concerning their content,
formal requirements, approval procedure and
implementation in the development planning.
Some countries have also defined a specific design
Fig. 4: Hazard indication map for mass movements (Bavaria, Germany).
Abb. 4: Gefahrenhinweiskarte für Massenbewegungen (Bayern, Deutschland).
Fig. 5: Hazard map for falls (rock fall) (Switzerland).
Abb. 5: Gefahrenzonenplan Felssturz (Steinschlag) (Schweiz).
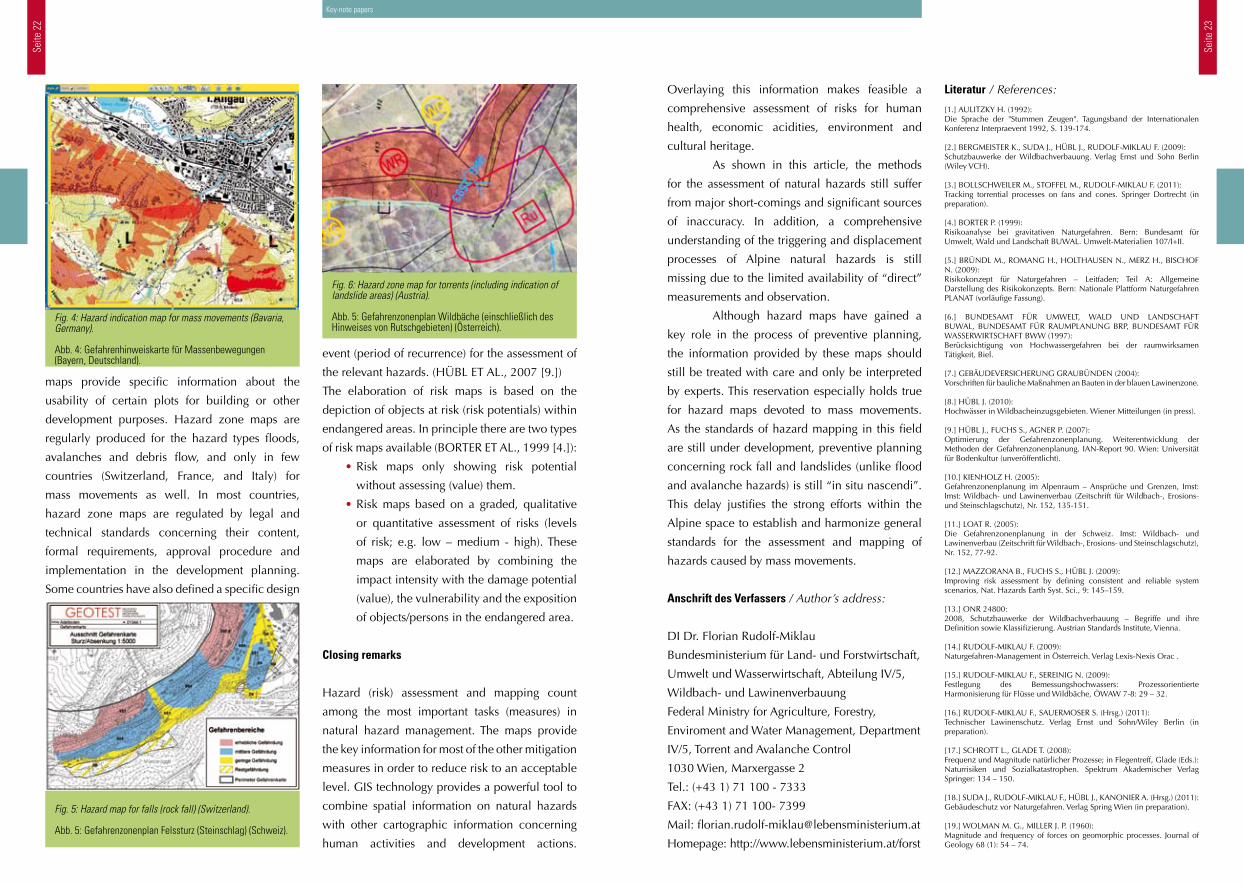
Fig. 6: Hazard zone map for torrents (including indication of landslide areas) (Austria).
Abb. 5: Gefahrenzonenplan Wildbäche (einschließlich des Hinweises von Rutschgebieten) (Österreich).
Seite
24
Seite
25
Zusammenfassung:Die geologische Gefahrenkartierung ist in Europa trotz unterschiedlicher Methoden eine anerkannte Notwendigkeit für die Prävention. Die wissenschaftliche Charakterisierung der Massenbewegungen basiert oft auf ähnlichen Methoden und ist deshalb eher vergleichbar. Hingegen ist die Umsetzung in die Raumplanung und in das Risikomanagement auf eu-ropäischer Ebene sehr unterschiedlich. Der Grund liegt primär in unterschiedlichen Ge-setzen, Verordnungen und Verantwortlichkeiten, bzw. in sozio-ökonomischen Eigenheiten der Länder. Während in Italien und in der Schweiz technische Richtlinien bzw. gesetzli-che Regelungen zur Erstellung von Gefahrenkarten bestehen, gibt es in Österreich nur für Hochwasser bzw. Lawinen Regelungen zur Ausweisung von Gefahrenzonen. In Deutschland wurde eine Empfehlung für die Erstellung von Gefahrenhinweiskarten publiziert. Aufgrund fehlender Regelungen in den alpinen Staaten Europas werden Ereigniskarten, Indexkarten, Gefahrenhinweiskarten und Gefahrenkarten als Grundlagen für die Gefahrenbeurteilung in verschiedenen Maßstäben mit unterschiedlichem Inhalt erarbeitet. Dies und unterschied-liche Definitionen erschweren den Vergleich. Ein multilinguales Glossar, die Einrichtung von Ereigniskatastern bei der Verwaltung und die Festlegung von Mindestanforderungen zur Erstellung von Grundlagen und Gefahrenkarten (Anforderungen hinsichtlich Eingangsdaten und Zweck) sollten daher ein primäres Ziel sein. Im Projekt AdaptAlp (Interreg IV B, Alpine Space) arbeiten die Alpenländer an gemeinsamen Grundsätzen.
countries varies in its quality and quantity: In
some regions, detailed landslide inventories exist
and are the basis for susceptibility and hazard
assessment. Different approaches to hazard
mapping are in practice. This fact and dissimilar
meanings for terms like susceptibility, danger
and hazard make a comparison of the regional
approaches difficult. Using various input data also
handicaps the comparison of hazard assessment.
Within the INTERREG IV B project
“Adaptation to Climate Change in the Alpine
Space “ (acronym AdaptAlp), work package
5.1 Hazard Mapping - Geological Hazards is
focusing on the transnational harmonization of
standards (minimal requirements in the field of
hazard assessment and mapping) by exchanging
experiences in the partner regions. This issue
provides an overview of methods, standards and
procedures without a pretense of completeness.
The definitions of terms used regarding
Introduction
In Alpine regions, slopes of different
morphological and geological conditions are
prone to landslides. Taking into consideration
one of the geological principles for landslide
hazard assessment – the past is the key to the
future – future slope failures will probably occur
in areas with similar geological, morphological
and hydrological situations that have led to past
failures. Some triggering mechanisms happen
sporadically and are not readily obvious. Because
of the lack of memories of past landslide events,
the susceptibility to mass movements is not
considered accurate in land use. But the effects
of mass movements (damages) necessitate new
strategies on how to manage the future potential
of natural (geological) hazards in alpine regions.
Information about landslides in alpine
Mapping of Geological Hazards: Methods, Standards and Procedures (State of Development) - Overview
Geologische Gefahrenkartierung: Methoden, Standards und Verfahren (derzeitiger Status) – ein Überblick
Summary:In spite of different methods used, geological hazard mapping is accepted as a tool for hazard prevention in Europe. Scientific characterization of mass movements is based on similar methods with mostly comparable results. However, the implementation in spatial planning and risk management differs considerably due to different regional legal acts, ordinances, responsibilities and pecularities. Whereas in Italy and Switzerland there are technical guidelines and legal acts regarding landslides and rock fall, in Austria only hazard mapping concerning floods and avalanches is regulated. In Germany a recommendation on how to create a susceptibility map was published. Because of a lack of regulations in European Alpine states’ inventory maps, susceptibility and hazard maps are created in different scales with different contents and quality. This, as well as different defintions of terms such as susceptibility, danger and hazard, makes comparison of hazard assessment products difficult. Consequently a multilingual glossary, landslide inventories at regional authorities and minimal requirements as to how to create hazard maps (requirements concerning input data and purpose of assessment) are necessary. In the AdaptAlp project (Interreg IV B, Alpine Space) the Alpine regions elaborate the common principles.
RICHARD BÄK, HUGO RAETZO, KARL MAYER,
ANDREAS VON POSCHINGER, GERLINDE POSCH-TRÖZMÜLLER
Key-note papers
Seite
26
Seite
27
give evidence, if e.g. information on the activity,
geometry and slope position of a landslide is
recorded. Recorded geological information
(fourth section) is sometimes specified in detail,
sometimes only the information is given that
geological information is being stored.
In many cases additional information
such as data on vegetation (land cover),
hydrogeological or hydrological conditions, as
well as specific data such as the shadow angle are
stored in the databases.
Most inventories provide information on
the causes or triggers of landslides. In some cases
the damages due to landslides are listed in the
inventory, sometimes even the monetary value of
the damage and the costs of remediation measures.
Most inventory forms also provide information
about how the listed data was gathered (e.g. field
survey), some provide a rating about the reliability
of the degree of precision of the information. In
most databases additional reports, documentation
and bibliography are included or mentioned.
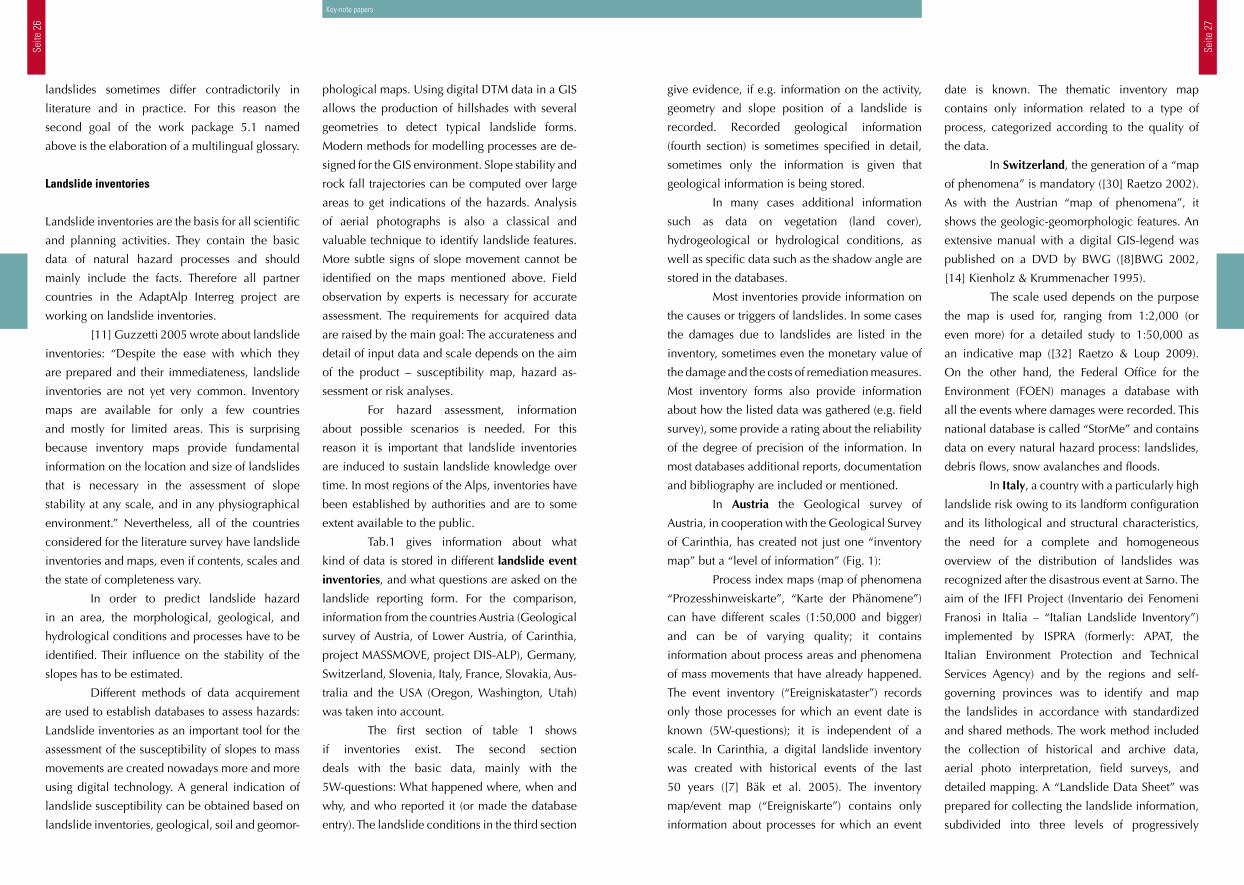
In Austria the Geological survey of
Austria, in cooperation with the Geological Survey
of Carinthia, has created not just one “inventory
map” but a “level of information” (Fig. 1):
Process index maps (map of phenomena
“Prozesshinweiskarte”, “Karte der Phänomene”)
can have different scales (1:50,000 and bigger)
and can be of varying quality; it contains
information about process areas and phenomena
of mass movements that have already happened.
The event inventory (“Ereigniskataster”) records
only those processes for which an event date is
known (5W-questions); it is independent of a
scale. In Carinthia, a digital landslide inventory
was created with historical events of the last
50 years ([7] Bäk et al. 2005). The inventory
map/event map (“Ereigniskarte”) contains only
information about processes for which an event
date is known. The thematic inventory map
contains only information related to a type of
process, categorized according to the quality of
the data.
In Switzerland, the generation of a “map
of phenomena” is mandatory ([30] Raetzo 2002).
As with the Austrian “map of phenomena”, it
shows the geologic-geomorphologic features. An
extensive manual with a digital GIS-legend was
published on a DVD by BWG ([8]BWG 2002,
[14] Kienholz & Krummenacher 1995).
The scale used depends on the purpose
the map is used for, ranging from 1:2,000 (or
even more) for a detailed study to 1:50,000 as
an indicative map ([32] Raetzo & Loup 2009).
On the other hand, the Federal Office for the
Environment (FOEN) manages a database with
all the events where damages were recorded. This
national database is called “StorMe” and contains
data on every natural hazard process: landslides,
debris flows, snow avalanches and floods.
In Italy, a country with a particularly high
landslide risk owing to its landform configuration
and its lithological and structural characteristics,
the need for a complete and homogeneous
overview of the distribution of landslides was
recognized after the disastrous event at Sarno. The
aim of the IFFI Project (Inventario dei Fenomeni
Franosi in Italia – “Italian Landslide Inventory”)
implemented by ISPRA (formerly: APAT, the
Italian Environment Protection and Technical
Services Agency) and by the regions and self-
governing provinces was to identify and map
the landslides in accordance with standardized
and shared methods. The work method included
the collection of historical and archive data,
aerial photo interpretation, field surveys, and
detailed mapping. A “Landslide Data Sheet” was
prepared for collecting the landslide information,
subdivided into three levels of progressively
Key-note papers
phological maps. Using digital DTM data in a GIS
allows the production of hillshades with several
geometries to detect typical landslide forms.
Modern methods for modelling processes are de-
signed for the GIS environment. Slope stability and
rock fall trajectories can be computed over large
areas to get indications of the hazards. Analysis
of aerial photographs is also a classical and
valuable technique to identify landslide features.
More subtle signs of slope movement cannot be
identified on the maps mentioned above. Field
observation by experts is necessary for accurate
assessment. The requirements for acquired data
are raised by the main goal: The accurateness and
detail of input data and scale depends on the aim
of the product – susceptibility map, hazard as-
sessment or risk analyses.
For hazard assessment, information
about possible scenarios is needed. For this
reason it is important that landslide inventories
are induced to sustain landslide knowledge over
time. In most regions of the Alps, inventories have
been established by authorities and are to some
extent available to the public.
Tab.1 gives information about what
kind of data is stored in different landslide event
inventories, and what questions are asked on the
landslide reporting form. For the comparison,
information from the countries Austria (Geological
survey of Austria, of Lower Austria, of Carinthia,
project MASSMOVE, project DIS-ALP), Germany,
Switzerland, Slovenia, Italy, France, Slovakia, Aus-
tralia and the USA (Oregon, Washington, Utah)
was taken into account.
The first section of table 1 shows
if inventories exist. The second section
deals with the basic data, mainly with the
5W-questions: What happened where, when and
why, and who reported it (or made the database
entry). The landslide conditions in the third section
landslides sometimes differ contradictorily in
literature and in practice. For this reason the
second goal of the work package 5.1 named
above is the elaboration of a multilingual glossary.
Landslide inventories
Landslide inventories are the basis for all scientific
and planning activities. They contain the basic
data of natural hazard processes and should
mainly include the facts. Therefore all partner
countries in the AdaptAlp Interreg project are
working on landslide inventories.
[11] Guzzetti 2005 wrote about landslide
inventories: “Despite the ease with which they
are prepared and their immediateness, landslide
inventories are not yet very common. Inventory
maps are available for only a few countries
and mostly for limited areas. This is surprising
because inventory maps provide fundamental
information on the location and size of landslides
that is necessary in the assessment of slope
stability at any scale, and in any physiographical
environment.” Nevertheless, all of the countries
considered for the literature survey have landslide
inventories and maps, even if contents, scales and
the state of completeness vary.
In order to predict landslide hazard
in an area, the morphological, geological, and
hydrological conditions and processes have to be
identified. Their influence on the stability of the
slopes has to be estimated.
Different methods of data acquirement
are used to establish databases to assess hazards:
Landslide inventories as an important tool for the
assessment of the susceptibility of slopes to mass
movements are created nowadays more and more
using digital technology. A general indication of
landslide susceptibility can be obtained based on
landslide inventories, geological, soil and geomor-
Seite
28
Seite
29
of the geohazards and their causal factors. This
understanding can be used to assess susceptibility.
In the USA the Landslide Inventory
Steering Committee, composed of members of
USGS and State Geological Surveys and other
state agencies, are working on the Landslide
Inventory Pilot Project. The purpose of this project
is to provide a framework and tools for displaying
and analyzing landslide inventory data collected
in a spatially aware digital format from individual
states. To get information about further landslides,
the Oregon Department of Geology and Mineral
Industries, among others, has prepared an
inventory form. Besides information about the
exact location (coordinates) of a landslide, the
following specifications should be listed: date of
slide, activity, estimated dimension (length, width,
depth, volume, estimated dimensions from: aerial
photos, field evaluation), predominant type of
material (rock, debris, earth, fill), predominant
type of movement (fall/topple, flow, translational
slide, rotational slide, spread), approximate
original slope (e.g.: 30° +/- 5°, estimated from
e.g. 1:24K USGS topo map), land use where
slide occurred (forested area, harvested area,
rural area, urban area, agriculture), cause of slide
(road construction, road cut, road fill, earthquake,
preexisting slide, steep natural slope, natural
drainage, human built drainage, other), damage
caused by slide and additional comments.
In California the landslide inventory
maps are available at a scale of 1:24,000.
The inventory was prepared primarily by
geomorphological analysis, interpretation of aerial
photographs and also by field reconnaissance,
interpretation of topographic map contours, and
review of geological and landslide mapping.
Also, each landslide was classified according to
its activity: active or historic, dormant-young,
dormant-mature, dormant-old. The landslide
material (rock, soil, earth, debris) and type of
movement (slide, flow, fall, topple, spread) are
also classified. Furthermore, each landslide is
classified according to a “confidence” (definite,
probable, questionable) assigned by the geological
interpreter. It can be regarded as a measure of
likelihood that the landslide actually exists.
Susceptibility/hazard assessment in Alpine regions
A literature study regarding susceptibility/hazard
mapping ([29] Posch-Trözmüller 2010) shows
the different approaches to hazard assessment in
alpine regions.
For the assessment of natural hazards
(hazard maps) mainly heuristic methods are in
practice. In this case scientific reports, geological
and morphological mapping are the basis for
weighting methods. Statistical analysis (bivariante
or multivariate) are used for the weighting. The
weight of evidence method is based on a statistical
Bayesian bivariate approach. Originally developed
for ore exploration, this probabilistic method is
now commonly used for the statistical assessment
of landslides. It is based on the assumption that
future landslides would be triggered or influenced
by the same or similar controlling factors as
previously registered landslides ([15] Klingseisen
& Leopold 2006, [16] Klingseisen et al. 2006).
In Germany a recommendation on how
to create a susceptibility map is given by the
“Geohazards” team of engineering geologists
of German federal governmental departments
of geology ([37] SGD 2007). Basic minimal
requirements for inventory records are defined,
such as spatial positioning and technical data of
mass movements. Digital modelling (rock fall,
shallow landslides) can be used to identify the
susceptibility of areas to mass movements, verified
by landslide inventories or evaluation through
Key-note papers
that, since the sources for the inventory map of
Slovenia are quite different from each other, the
scales vary but landslides were always mapped at
a quite detailed scale.
In France a database for mass movements
is accessible on the internet. The processes taken
into account are landslides, rock fall, debris flows,
subsidence and bank erosion. For each mass
movement, the following detailed information
can be retrieved: type of movement, detailed
geographical data, information about the quality,
the precision and the origin of the data, detailed
information about the mass movement (size,
activity), the damage caused, the causes for the
movement and geological information as well as
information about the survey of the phenomenon.
A prototype landslide database has
been established by Geoscience Australia in
collaboration with the University of Wollongong
and Mineral Resources Tasmania, displaying the
location of the landslides on a map and providing
information regarding the type of landslide, date
of occurrence (if known), a brief summary of the
event, its cause and damage.
In England after the Aberfan disaster the
UK government funded a number of research
projects to look at the UK’s geohazards ([33]
Reeves 2010). Now in the UK the BGS investigates
geohazards by looking at primary geohazards such
as earthquakes, volcanic eruptions and secondary
geohazards such as landslides, swelling/shrinking
etc. Topics of consideration are the cause of
events, return periods determined by analysis of
past events, affected regions, influence of regional
geology. An inventory is the first step in building an
understanding of the occurrence of geohazards.
Currently BGS maintains two main shallow
geohazard databases: the National Landslide and
the Karst Database. These inventories provide
the basis for analysing the spatial distribution
increasing detail (from: [13] ISPRA, 2008):
• First level: contains the basic information
(location, type of movement, state of
activity) and is mandatory for every
landslide.
• Second level: contains the geometrical,
geological, and lithological parameters,
land use, causes and activation date.
• Third level: provides detailed information
on the damage, investigations and remedial
measures.
A scale of 1:10,000 is used for surveying and
mapping the landslides throughout most of Italy,
only in high mountainous areas or in lower
populated areas is a scale of 1:25,000 used. As
with many regions, the region of South Tyrol
(Autonome Provinz Bozen Südtirol, [27] Nössing
2009) also has a landslide database that resulted
from the IFFI Project. The type of movement, the
litho-logical unit, the volume of the moving masses,
the internal cause and the external trigger, as well
as the induced damage are noted for each event.
The extensive landslide database,
GEORISK of Bavaria, is an essential step to
creating susceptibility maps. Until now 2,800
landslides have been documented in the
database, with information about the type of
movement, the extension, age and status of the
landslides. The following landslide processes are
recorded: flow ("Hangkriechen", "Schuttströme"),
slide ("Rutschungen", "Hanganbrüche"), fall/rock
fall ("Steinschläge", "Felsstürze", "Bergstürze"),
Karst, subsidence ("Erdfälle", "Dolinen", "Senken",
"Schwinden",..). Based on the inventory, maps
were created, showing existing landslides and
their activity (“Karten der Aktivitätsbereiche”).
The Slovenian landslide inventory map
is shown as a small inlet on the susceptibility
map of Slovenia at a scale of 1:250,000. Personal
information from M. Komac (Geo ZS) revealed
Seite
30
Seite
31
statistics (landslides) and cost analysis (rock falls),
working with a 25x25m grid. The inventory map is
included in the susceptibility map. Also, the local
department of the Austrian Service for Torrent
and Avalanche Control (WLV) creates “hazard
maps” within the “hazard zonation plan”. In
Upper Austria, Lower Austria and Burgenland,
different approaches have been chosen to develop
susceptibility maps (different scales, processes)
derived from existing data sets and maps ([29]
Posch-Trözmüller 2010): The main focus in
Burgenland is concentrated on shallow landslides
with an annual movement rate of 1-2cm. For
the prediction of landslide susceptibility based
on morphological and geological factors, the
method called Weights of Evidence was chosen
([16] Klingseisen et al. 2006). In Lower Austria
susceptibility maps have been created until now
using a heuristic approach based on geological
expertise, historical data and interpretation of DTM
and aerial photos ([36] Schweigl & Hervas 2009).
To provide the municipalities with assistance in
spatial planning, landslide susceptibility maps
were generated for the main settled areas in Upper
Austria (OÖ). The priority, which is a susceptibility
class, was evaluated on the basis of the in-tensity
and the probability of an event for each type of
mass movement ([19] Kolmer 2009). As these
maps include the intensity and the frequency of
mass movements, they can be called “hazard
maps” by definition. Nevertheless it has to be
taken into account that the method of generating
these maps did not include either field work or
remote sensing techniques. The method of assess-
ment is based solely on geological expertise.
The national project of Italy, IFFI, also
represents an important tool for landslide risk
assessment, land use planning and mitigation
measures. By using the information contained in
the database of the IFFI Project and the Corine
Land Cover Project 2000, it was possible to carry
out an initial evaluation of the “level of attention”
on a municipal basis. The level of attention was
for example rated “very high”, when the landslide
points, polygons and lines intersected with urban,
industrial or commercial areas ([13] ISPRA 2008).
The regions in Italy also have programs
in cooperation with the IFFI Project (IFFI started
as a national project and is continued by the
separate regions), as well as with the PAI Project.
For example, the region of Friuli Venezia Giulia
has a landslide inventory that originated within
these two studies, collecting data from several
different regional offices (in particular: Protezione
Civile della Regione and the Direzione Centrale
Risorse Agricole, Naturali, Forestali e Montagna)
as well as from other public subjects that work
on the territory. It homogenizes the information
according to national standards and surveys new
data. The program is used for the evaluation of the
hydrogeological hazard and risk and also to give a
clear and updated view of the interventions made
in the region to preserve vulnerable areas. The
data is recorded in an official GIS structure called
Sitgeo (Geological Service Information System).
The main focus lies on hazard assessment at the
scale of a slope.
Slovenia generated a susceptibility map
of the whole country at a scale of 1:250,000 using
statistical analyses ([20] Komac & Ribicic 2008).
In 2002, BGS (England) developed a nationwide
susceptibility assessment of deterministic
geohazards such as landslides, skrink-swell,
etc. called GeoSure ([33] Reeves 2010). It
was developed from the 50K digital geology
polygons (DiGMap50), published information,
expert judgement knowledge, national landslide
database, national geotechnical information
database and modified DTM. Probabilistic
methods are used for hazard management by
primary geohazards, deterministic methods by
secondary geohazards.
Key-note papers
indicative map is not obligatory in Switzerland,
since the law refers to the standardized hazard
map ([32] Raetzo & Loup 2009). Detailed
information on hazard maps in Switzerland is
given by Raetzo & Loup in this issue [31].
Because of the lack of a regulatory
framework or technical norm concerning
landslides and rock fall in Austria - only the
course of actions concerning floods, avalanches
and debris flows are regulated by law (ordinance
of hazard zone mapping, [34] Rudolf-Miklau &
Schmidt 2004) - the federal states all follow a
different course of action.
At the Geological Survey of Austria,
a database-system for documenting mass
movements in Austria (GEORIOS) containing
information about the different types of
processes, geological, hydrological, geometric
and geographical data, information on studies or
tests carried out as well as mitigation measures
and the source of information (archives, field
work) is in use. Susceptibility maps in different
scales and with different methods (heuristic
approach, neural network analysis) have already
been generated. Using the digital geological
map (1:50,000), the inventory map, map of
phenomena and a lithological map, susceptibility
maps for Carinthia were generated in col-
laboration with the Geological Survey of Austria
(GBA) and the Geological Survey of Carinthia at a
scale of 1:200,000 ([17] Kociu et al., 2006). These
are, of course, still lacking information about
intensity and recurrence period or probability
of occurrence. For a small study area in Styria,
the Geological Survey of Austria generated a
susceptibility map at a scale of 1:50,000 using
neural network analysis ([38] Tilch 2009).
In Vorarlberg risk maps (susceptibility
map, vulnerability map, risk map) were produced
in the course of a university dissertation ([35]
Ruff 2005). For modelling, he used bivariate
field work. Indications of active/inactive landslides
can be found by using registers, mapping and/or
remote sensing (DTM) methods. Potential landslide
areas (where landslides have not yet taken place)
are determined by empirical methods in account
of geological and morphological situation and
land use. Alternatively areas prone to landsliding
can be derived semi-automatically by a cross-over
between DTM and a geological entity. Regarding
rock fall processes, source areas of rock fall are
derived in a first step from landslide inventories
and/or remote sensing (DTM). Usually Alpine
areas with an inclination > 45° are potential rock
fall escarpments. In the second step, the runout
zone is depicted by empiric angle methods
(shadow angle, geometric slope angle) or physical
deterministic methods. The guidelines also include
flow processes, subrosion, subsidence and uplift.
For the whole Bavarian Alps (about
4.300 km²) ([23] Mayer 2007), an “extended
danger map” at a scale of 1:25,000 has already
been presented or is being completed. That
means that, in contrast to the susceptibility map
(without information on intensity and probability),
it includes a qualitative statement about the
probability through a predefined “design event”.
The legend for the rock fall danger map discerns
between “indication of danger”, yes or no, the
legend for the danger map of superficial landslides
discerns 3 entries (source area, accumulation
zone, none), the deep-seated landslides danger
map also discerns 3 entries (indication, indication
in extreme case, none).
The Swiss indicative map (“Gefahren-
hinweiskarte”) is generated at a scale of
1:10,000 to 1:50,000. The legend gives only the
information “indication of hazard” - yes or no,
without specification of classes. It indicates the
potential process areas of rock falls, landslides
and debris flows. It doesn’t include information
about intensity or probability. The creation of an
Seite
32
Seite
33
Australian method of hazard assessment, which
is quite different from the first ones, as well as
the method applied in the state of Washington
(USA), is also looked into (Tab. 2). Tab. 3 gives
an overview about hazard maps generated in the
considered countries.
Comparison of hazard assessment methods in Switzerland
and Friuli Venezia Giulia (Italy)
The hazard maps in Switzerland are compared
especially to Friuli Venezia Giulia. More detailed
information on the Swiss method is given by
Raetzo & Loup in this issue [31]. The Swiss
method ([30] Raetzo 2002) and the method used
in Italy ([21] Kranitz & Bensi 2009) are based on
an intensity-probability matrix. They differ from
each other in determining the intensity and the
probability of a landslide event.
In Switzerland, 5 degrees of hazard are
used. In Italy the hazard is rated in 4 classes (from
very high [P4] to moderate [P1]).
Concepts of hazard assessment in Switzerland
In Switzerland the method to establish the hazard
map was simplified as much as possible due to
the objective of facilitating its integration into
land use (planning). In order to have simple con-
struction regulations, only 5 degrees of hazard
were defined: high, medium, low, residual and
neglectable hazard. The degree of hazard is
defined in a hazard matrix based on intensity and
probability criteria ([32] Raetzo & Loup 2009).
For the planning of protection measures, more
detailed investigations and calculations are done
(e.g. all energy classes). In general the methods
used are related to the product, scales and the risk
in order to respect economic criteria. Applying
this concept, low efforts were used for the swiss
indicative map (level 1). Important efforts are taken
when a hazard map is established or reviewed
(level 2). Hazard maps are an accurate delineation
of zones on scales from 1:2,000 to 1:10,000.
Detailed analyses and engineering calculations
are foreseen for the planning of countermeasures
or for expertises (level 3). It is planned to apply
this concept of increased efforts for geological
investigations when the assessment takes place
on the second or third level. These investigations
include geologic mapping, geomorphologic
analyses, monitoring, geophysics, numerical
modelling and other methods.
Assessment of the intensity
(Switzerland/ Friuli Venezia Giulia)
Intensities are assessed through a classification
that is represented in table 2.
The assessment of intensities in Switzerland
is different for each process, also for floods
and snow avalanches ([30] Raetzo 2002). For
continuous landslide processes, the only criterion
is the intensity. For spontaneous processes the
intensity and the probability both ranging from
high to low in three classes (high – medium – low)
are needed:
• For rock falls, the intensity is defined by
the energy. High intensity is defined as
e≥300kJ, which is approximately the limit
of resistance of massive armored walls.
• For slides, the mean long-term velocity,
the variation of the velocity (dv, or
acceleration), the differential movement
(D), and the depth of the slide (T) are used
to determine the intensity ([32] Raetzo &
Loup 2009).
• For flowing processes like earth flows, the
potential thickness and the possible depth
of the depo-sition determine the intensity.
Key-note papers
mapping (1:25,000), geomorphological mapping
and analysis (1:5,000), landslide and engineering
data compilation, construction of digital elevation
models (10x10m).
For example, a threshold slope value of
42° was chosen for modelling rock fall source
areas. It does not imply that rock fall will not
occur on lower slopes, but it becomes steadily
less likely with reduced slope angles. A simple
modelling approach was developed for modelling
the rock fall runout area using the direction of
maximum downhill slope defined by an aspect
raster and calculating with a travel angle of 30°.
In southwestern California, soil-slip
susceptibility maps have been produced. These
show the relative susceptibility of hill slopes to
the initiation of rainfall triggered soil slip-debris
flows. They do not attempt to show the extent
of runout of the resultant debris flows. The
susceptibility maps were created in an iterative
process from two kinds of information: locations
of sites of past soil slips and aerial photographs
taken during six rainy seasons that produced
abundant soil slips. These were used as the basis
for a soil slip-debris flow inventory. Also, digital
elevation models (DTM) of the areas were used
to analyze the spatial characteristics of soil slip
locations. Slope and aspect values used in the
susceptibility analysis were 10 metre DTM cells at
a scale of 1:24,000. For convenience, the soil-slip
susceptibility values are assembled on 1:100,000
scale bases ([26] Morton et al. 2003).
Comparison of hazard assessment methods
Methods of hazard assessment used in Switzerland,
Italy (Friuli Venezia Giulia), Australia, France and
USA are considered in this section. First the Swiss
and the Italian methods are compared, as these
define intensity and probability parameters. The
A number of guidelines have been published in
Australia by the Australian Geomechanics Society
concerning mass movements and landslide risk
management, as well as slope management and
maintenance. These guidelines are tools that
were made to be introduced into the legislative
framework of Australian governments at national,
state and local levels, and they are also useful for
land use planning.
Regional susceptibility mapping of
areas prone to landsliding is not yet commonly
undertaken in Australia: Because of a lack of
good inventory maps and validated inventory
databases, landslide hazard mapping is very
limited. Determining temporal probability is often
not possible because of the lack of historical
information ([25] Middleman 2007). Landslide
mapping is generally done on a site-specific scale
and is performed by geotechnical consultants for
the purpose of zoning, building infrastructure
and applying for development approvals ([25]
Middleman 2007). Mineral Resources Tasmania
(MRT, Department of Infrastructure, Energy and
Resources, State Government of Tasmania) is
the only state government agency in Australia
to undertake several activities with respect
to landslides, including regional mapping,
administration of declared landslide areas and
monitoring of a small number of problematic
landslides. Mazengarb ([24], 2005) describes in
detail the methodology of creating the “Tasmanian
landslide hazard map series” that started with a
pilot area coinciding with the Hobart municipality.
The following basic information was used to
create the individual landslide hazard maps
(note: In the report the maps are called “hazard
maps”, but on the homepage, where the maps are
accessible via the internet, the individual maps
are called “susceptibility maps”, but, nonetheless,
giving “hazard zones” in the legends.): geological
Seite
34
Seite
35
for the statistical evaluation of the return period,
the values will be assigned by a typological
approach based on bibliographical data inherent
to the characteristics of temporal return of the
various typologies of landslides. This will be
calibrated on geomorphologic observations,
analyses of historical photos, and aerial pictures
(which is also the case in the Swiss method) from
the year 1954 up to now, and historical data from
local sources. The probability is then classified in
4 classes:
• high: 1-30 years (active landslides,
continuous and/or intermittent landslides,
quiescent – episodic with high frequency)
• medium: 30-100 years (quiescent – episodic
landslides with medium frequency)
• low: 100-300 years (quiescent – episodic
landslides with low frequency)
• >300 years (ancient landslides or
palaeolandslides).
Other approaches to hazard assessment
France
Malet et al. ([22] 2007) describes the French
methodology for landslide risk zoning (Plan
de Prévention des Risques), where 3 classes of
risk (R1, R2, R3) with specific rules for land use
regulations and urbanism can be represented
in a matrix depicting hazards and potential
consequences. This qualitative method is based
on the expert opinion of the scientist. No
specific investigation is necessary, available data
and reports are sufficient. The scale of work is
specified as 1:10,000. The hazard map is an
interpretation of the type of processes, activity,
age and magnitude of the processes; the hazard
map is an interpretation of the type of processes,
activity, magnitude and frequency. The risk map is
the crossing of the hazard map and the inventory
map of major stakes ([22] Malet et al. 2007).
Australia
In the Australian guidelines for landslide
susceptibility, hazard and risk zoning for land
use planning, the number of events per length
of source area per year (rock fall) or per square
kilometer of source area per year (slides) is used
for describing the hazard of small landslides. For
large landslides, the annual probability of active
sliding or the annual probability that movement
will exceed a defined distance or the annual
probability that cracking within a slide exceeds
a defined length is used to describe the hazard.
The description of the hazard should include the
classification and the volume or the area of the
landslides.
Whether landslide intensity is required
for hazard zoning is to be determined on a case-
by-case basis. For rock fall hazard zoning, it is
likely to be required. Therefore the frequency
assessment is much more important for hazard
zonation than the intensity according to AGS.
Intensity assessment in Australia:
The landslide intensity is assessed as a spatial
distribution of:
• the velocity of sliding coupled with slide
volume or
• the kinetic energy (e.g. rock falls, rock
avalanches), or
• the total displacement or
• the differential displacement or
• the peak discharge per unit width (m3/m/
sec., e.g. debris flows)
For basic and intermediate level assessments of
intensity, only the velocity and volume might be
assessed. But for the advanced assessments of
rock fall or debris flow hazard, the energy should
be determined. In AGS ([3] 2007b) it is noted that
“there is no unique definition for intensity. Those
carrying out the zoning will have to decide which
definition is most appropriate for the study”.
Assessment of the probability
(Switzerland/ Friuli Venezia Giulia)
Swiss method ([32] Raetzo & Loup 2009):
The probability assessment of the Swiss method
defines the probability in analogy to the recur-
rence periods used in flood and avalanche
protection (30, 100, 300 years return period),
which corresponds to yearly probabilities of 0.03,
0.01 and 0.003. An event with a return period
higher than 300 years is normally also considered
for the assessment (risk analysis, residual risk,…).
It corresponds mainly to the flood prevention
strategy.
The probability of an event has to be calculated
or estimated:
• Big events (“Bergsturz”, >1mio m3) do not
recur. For smaller events the probability is
defined by the elements at risk.
• For continuous slides the probability is 1 (or
100%), meaning that the event is happening
already. Scenarios are defined when sudden
landslide failure or acceleration can take
place. When fast moving landslides (debris
or earth slides according to Varnes) have
long run-out distances, the process is
moving into a flow. In this case the Swiss
method takes into account the change from
the first to the second move and criteria of
the flow processes are applied (see below).
• The probability for debris and earth flows is
determined through field work and based
on inventory data. Numerical modelling
of flow processes is also used and the
importance of these results is rising.
Method of Friuli Venezia Giulia ([21] Kranitz &
Bensi 2009):
The possible frequency or occurrence probability
is determined through the records of historical
events. If there is a lack of sufficient historical data
For landslides and rock falls the Swiss evaluation
is normally based on intensity maps where 3 or
more classes can be chosen. (e.g. 10-20,000 kJ
for rock falls).
In Italy, different methods of assessment
are used. For example, the regional method
of Friuli Venezia Giulia ([21] Kranitz & Bensi
2009) for rock fall: The intensities are classified
by different methods using several tables. For fall
processes, a table with definition of classes of the
geometry is determined (after [12] Heinimann et
al. 1998). The classification takes into account the
block size of the rocks ([21] Kranitz & Bensi 2009).
Another table determines the velocity factor (v),
also ranging from 1- 3, using the definitions from
Cruden & Varnes ([9], 1996). The intensity class,
ranging from 1- 9, is then determined with the
geometry-velocity matrix.
Comparison between the Swiss and the Italian
intensity classification:
The differences in determining the intensity
between the Swiss ([32] Raetzo & Loup 2009)
and the Friuli method ([21] Kranitz & Bensi
2009) are:
• For fall processes in the Italian method,
the energy does not need to be calculated,
only the block sizes and the velocity need
to be determined, while in Switzerland the
energy is calculated.
• The Italian method does not differentiate
for continuous processes. Switzerland
uses the mean long-term velocity for these
continuous landslides.
• The Swiss method determines 3 intensity
classes to apply within the hazard matrix
for the land use planning. If protection
measures are planned in Switzerland, all
the energy values are taken into account.
The Italian method determines 9 intensity
classes.
Key-note papers
Seite
36
Seite
37
is regulated by a decree (“Verordnung des
Bundesministeriums für Land- und Forstwirtschaft,
1976“, BGBl. Nr. 436/1976). The scale usually
ranges between 1:2,000 and 1:5,000, it must not be
smaller than 1:50,000. The map gives information
about the determined effects in the relevant area
of catchment areas (torrent buffer areas) in red
and yellow hazard zones. The design event is
determined by a return period of 150 years.
In the red hazard zone, infrastructures
cannot be maintained or can only be maintained
with a very high effort due to the high intensity
or a high recurrence of avalanches or torrential
events.
The yellow hazard zone includes all
other areas affected by avalanches and torrents.
The constant use of these areas by infrastructures
is affected due to these hazards. The hazard
zone map also delineates blue areas (for the
implementation of technical or forestal measures
as well as protective measures), as well as brown
and violet reference areas.
The brown reference areas are areas
presumably affected by other hazards than
torrents or avalanches, like rock fall or landslides.
The violet reference areas are areas, where soil
and terrain have to be protected in order to keep
up their protective function.
In Switzerland, the Federal Office for
the Environment FOEN (Bundesamt für Umwelt,
BAFU) is responsible for creating guidelines
concerning protection against natural hazards
(floods, mass movements, snow avalanches). The
concepts are similar for these processes to reach
a certain level of protection. Protection against
natural hazards takes place on the principle of
integral risk management, taking into account:
• Prevention of an event
• Conflict management during an event
• Regeneration and reconstruction after
an event.
The Swiss regulations are described in more detail
by Raetzo in this issue [31].
In some regions of Italy the hazard is
assessed using the Swiss method ([30] Raetzo
2002). This method is similar to the method planned
by the Italian legislative body for hydrogeological
risk assessment. Appropriate changes have been
introduced in order to standardize these aspects
and contextualize the method for territorial
jurisdiction ([21] Kranitz & Bensi 2009). Four
classes of hazards are distinguished, ranging
from very high (P4 “molto elevata”), high (P3
“elevata”), medium (P2 “media”), to moderate (P1
“moderata”).
The French hazard map, PPR, Plan
de prevention des risques, is made by the local
authorities (mayors), but with support by national
agencies like CEMAGREF or agencies of the
departments. It was introduced in 1995. Made
by the municipalities at a scale of 1:10,000
-1:25,000, the plans need to be authorized
by the prefects in collaboration with the local
authorities and the civil society, such as insurance
companies. The PPR gives information about the
identification of danger zones; 3 classes of risk
with specific rules for land use regulations and
urbanism can be represented. The method is a
qualitative method based on the expert judgment
of the scientist. There are PPRs for floods, mass
movements, avalanches and wood fires. Non-
observance of the PPR has legal consequences.
In Spain the Geological Institute of
Catalonia (IGC) is responsible to “study and
assess geological hazards, including avalanches,
to propose measures to develop hazard forecast,
prevention and mitigation and to give support
to other agencies competent in land and urban
planning, and in emergency management” ([28]
Oller et al. 2010). Therefore, the IGC is charged
with making official hazard maps with such
finality. These maps comply with the Catalan
Key-note papers
of this uncertainty, it has been common practice
to report the likelihood of landsliding using
qualitative terms such as “likely”, “possible” or
“unlikely”.”
Procedures of hazard mapping
in the considered regions
Tab. 3 gives an overview of hazard maps generated
in the considered countries.
In Germany a recommendation on how to create
a susceptibility map is given by the “Geohazards”
team of engineering geologists of German federal
governmental departments of geology ([37] SGD
2007). In 2007, the LfU completed the Landslide
susceptibility map of Oberallgäu (Bavaria). For
this map, the processes of rock falls, superficial
landslides and deep seated landslides were
treated separately. The susceptibility maps for rock
falls and superficial landslides were created using
modelling, whereas the susceptibility map for
deep seated landslides was created empirically,
assuming that deep seated landslides tend to occur
in areas already affected by landslides in the past,
but taking into consideration that process areas
can expand during reactivation of a landslide. The
basic data used for the investigations contained
the following: topographic map 1:25,000, raster
format; geological map 1:25,000 or 1:50,000 and
also maps in smaller scales where the detailed
maps were not available, vector format; DTM,
10m raster data; aerial photographs 1:18,000 and
orthophotos; data on forests; GEORISK data (BIS-
BY); data on catchment areas; historical data.
In Austria only the Austrian Service for
Torrent and Avalanche Control (WLV) generates
hazard maps, called “Gefahrenzonenkarte” or
“hazard zone maps” for floods, avalanches and
debris flows within the “Hazard zonation plan”
(“Gefahrenzonenplan”). This is regulated by law
(Forest Act BGBL. 440/1975). The implementation
Frequency assessment in Australia:
In AGS ([3], 2007b), the assessment of the
frequency of a landslide event for the generation
of hazard maps is usually determined from the
assessment of the recurrence intervals (the average
time between events of the same magnitude) of
the landslides. If the variation of recurrence inter-
val is plotted against magnitude of the event, a
magnitude-frequency curve is obtained.
The methods listed for determining the
frequency include: historical records; sequences
of aerial photographs and/or satellite images;
silent witnesses; correlation with landslide
triggering events (rain storms, earthquakes); proxy
data (e.g. pollen deposition, lichen colonization,
fauna assemblages in ponds generated by a
landslide,…); geomorphologic features (ground
cracks, fresh scarps,…); subjective assessment.
It is further noted that “landslides of
different types and sizes do not normally have
the same frequency (annual probability) of
occurrence. Small landslide events often occur
more frequently than large ones. Different
landslide types and mechanics of sliding have
different triggers (e.g. rainfalls of different
intensity, duration and antecedent conditions;
earthquakes of different magnitude and peak
ground acceleration) with different recurrence
periods. Because of this, to quantify hazard, an
appropriate magnitude-frequency relationship
should in principle be established for every
landslide type in the study area. In practice, the
data available is often limited and this can only be
done approximately.” A row of useful references
on frequency assessment are listed in AGS ([3],
2007b).
In AGS ([1], 2000) it is noted that “even
if extensive investigation is carried out, assessing
the probability of landsliding (particularly for an
unfailed natural slope) is difficult and involves
much uncertainty and judgement. In recognition
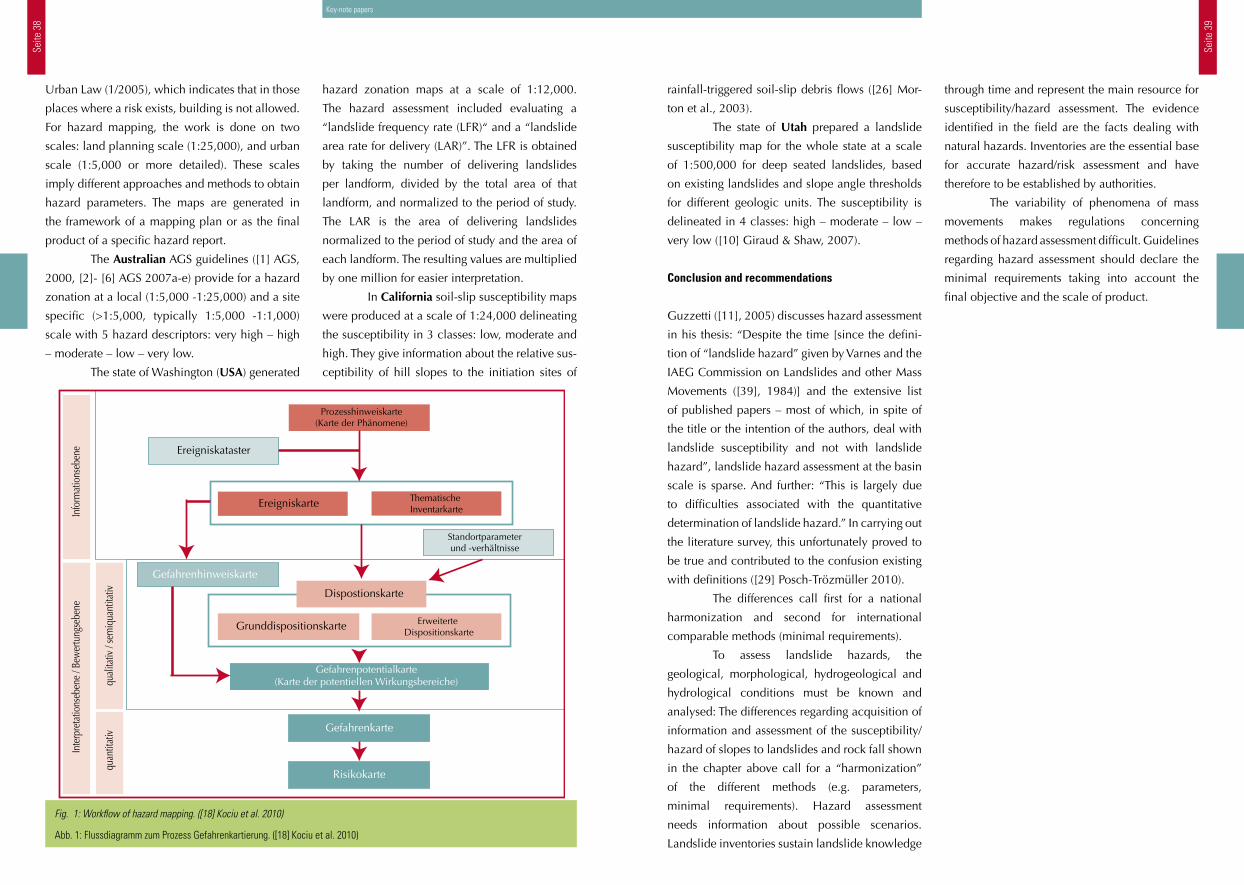
Seite
38
Seite
39
rainfall-triggered soil-slip debris flows ([26] Mor-
ton et al., 2003).
The state of Utah prepared a landslide
susceptibility map for the whole state at a scale
of 1:500,000 for deep seated landslides, based
on existing landslides and slope angle thresholds
for different geologic units. The susceptibility is
delineated in 4 classes: high – moderate – low –
very low ([10] Giraud & Shaw, 2007).
Conclusion and recommendations
Guzzetti ([11], 2005) discusses hazard assessment
in his thesis: “Despite the time [since the defini-
tion of “landslide hazard” given by Varnes and the
IAEG Commission on Landslides and other Mass
Movements ([39], 1984)] and the extensive list
of published papers – most of which, in spite of
the title or the intention of the authors, deal with
landslide susceptibility and not with landslide
hazard”, landslide hazard assessment at the basin
scale is sparse. And further: “This is largely due
to difficulties associated with the quantitative
determination of landslide hazard.” In carrying out
the literature survey, this unfortunately proved to
be true and contributed to the confusion existing
with definitions ([29] Posch-Trözmüller 2010).
The differences call first for a national
harmonization and second for international
comparable methods (minimal requirements).
To assess landslide hazards, the
geological, morphological, hydrogeological and
hydrological conditions must be known and
analysed: The differences regarding acquisition of
information and assessment of the susceptibility/
hazard of slopes to landslides and rock fall shown
in the chapter above call for a “harmonization”
of the different methods (e.g. parameters,
minimal requirements). Hazard assessment
needs information about possible scenarios.
Landslide inventories sustain landslide knowledge
through time and represent the main resource for
susceptibility/hazard assessment. The evidence
identified in the field are the facts dealing with
natural hazards. Inventories are the essential base
for accurate hazard/risk assessment and have
therefore to be established by authorities.
The variability of phenomena of mass
movements makes regulations concerning
methods of hazard assessment difficult. Guidelines
regarding hazard assessment should declare the
minimal requirements taking into account the
final objective and the scale of product.
Key-note papers
hazard zonation maps at a scale of 1:12,000.
The hazard assessment included evaluating a
“landslide frequency rate (LFR)“ and a “landslide
area rate for delivery (LAR)”. The LFR is obtained
by taking the number of delivering landslides
per landform, divided by the total area of that
landform, and normalized to the period of study.
The LAR is the area of delivering landslides
normalized to the period of study and the area of
each landform. The resulting values are multiplied
by one million for easier interpretation.
In California soil-slip susceptibility maps
were produced at a scale of 1:24,000 delineating
the susceptibility in 3 classes: low, moderate and
high. They give information about the relative sus-
ceptibility of hill slopes to the initiation sites of
Urban Law (1/2005), which indicates that in those
places where a risk exists, building is not allowed.
For hazard mapping, the work is done on two
scales: land planning scale (1:25,000), and urban
scale (1:5,000 or more detailed). These scales
imply different approaches and methods to obtain
hazard parameters. The maps are generated in
the framework of a mapping plan or as the final
product of a specific hazard report.
The Australian AGS guidelines ([1] AGS,
2000, [2]- [6] AGS 2007a-e) provide for a hazard
zonation at a local (1:5,000 -1:25,000) and a site
specific (>1:5,000, typically 1:5,000 -1:1,000)
scale with 5 hazard descriptors: very high – high
– moderate – low – very low.
The state of Washington (USA) generated
Fig. 1: Workflow of hazard mapping. ([18] Kociu et al. 2010)
Abb. 1: Flussdiagramm zum Prozess Gefahrenkartierung. ([18] Kociu et al. 2010)
Prozesshinweiskarte(Karte der Phänomene)
Ereigniskataster
Ereigniskarte
Gefahrenpotentialkarte(Karte der potentiellen Wirkungsbereiche)
Gefahrenhinweiskarte
Gefahrenkarte
Risikokarte
Inte
rpre
tatio
nseb
ene
/ Bew
ertu
ngse
bene
Grunddispositionskarte
Thematische Inventarkarte
Standortparameterund -verhältnisse
Erweiterte Dispositionskarte
quan
titat
ivqu
alita
tiv /
sem
iqua
ntita
tiv
Info
rmat
ions
eben
e
Dispostionskarte
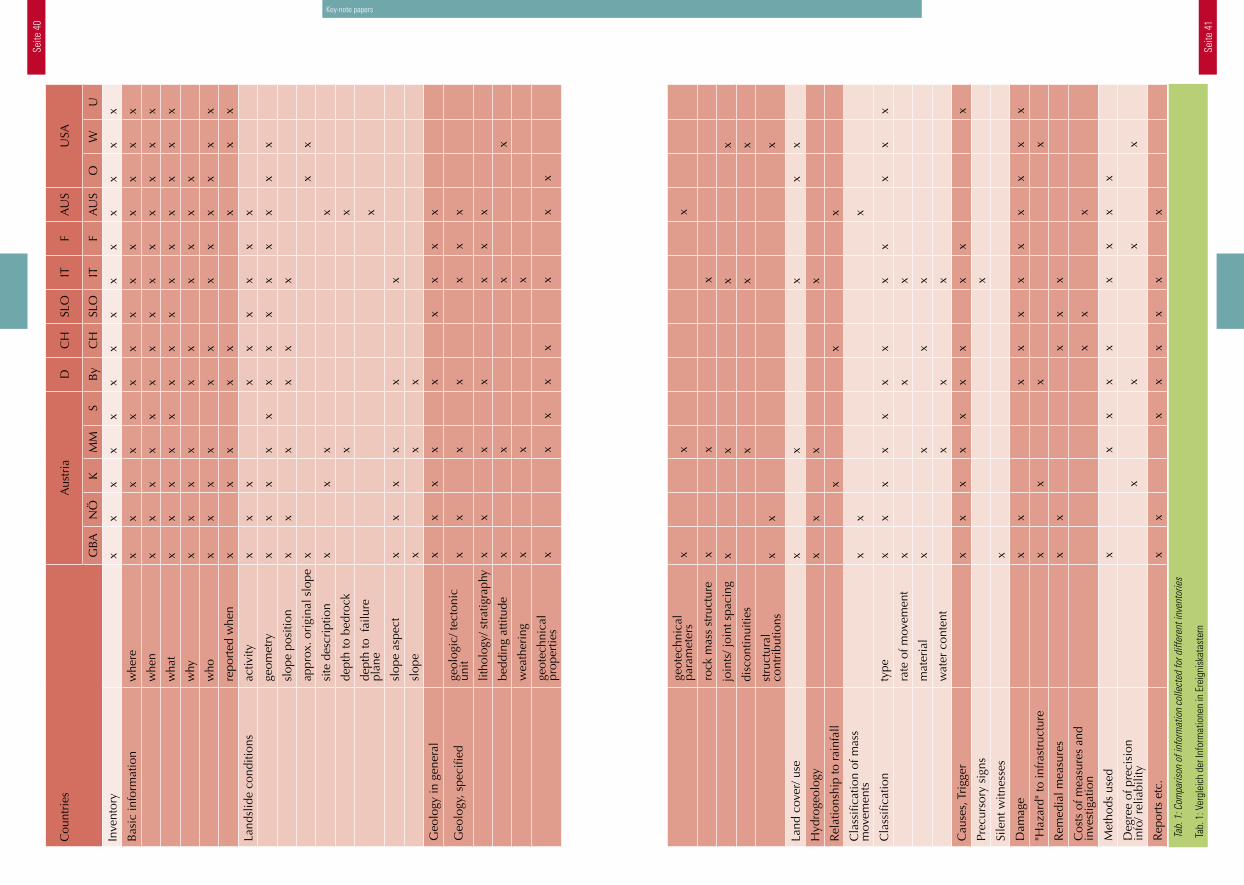
Seite
40
Seite
41
Key-note papers
Tab.
1: C
ompa
rison
of i
nfor
mat
ion
colle
cted
for d
iffer
ent i
nven
torie
s
Tab.
1: V
ergl
eich
der
Info
rmat
ione
n in
Ere
igni
skat
aste
rn
Cou
ntri
es
Aus
tria
DC
HSL
OIT
FA
US
USA
GBA
NÖ
KM
MS
By
CH
SLO
ITF
AU
SO
WU
Inve
ntor
yx
xx
xx
xx
xx
xx
xx
x
Bas
ic in
form
atio
nw
here
xx
xx
xx
xx
xx
xx
xx
whe
nx
xx
xx
xx
xx
xx
xx
x
wha
tx
xx
xx
xx
xx
xx
xx
x
why
xx
xx
x
x
xx
xx
who
xx
xx
x
x
xx
xx
xx
repo
rted
whe
nx
x
x
xx
x
x
x
Land
slid
e co
nditi
ons
activ
ity
xx
x
x
xx
xx
x
geom
etry
x
xx
xx
xx
xx
xx
xx
slop
e po
sitio
nx
x
x
xx
x
appr
ox. o
rigi
nal s
lope
x
x
x
site
des
crip
tion
x
xx
x
dept
h to
bed
rock
x
x
dept
h to
fai
lure
pl
ane
x
slop
e as
pect
xx
xx
x
x
slop
ex
x
x
Geo
logy
in g
ener
al
xx
xx
x
x
xx
x
Geo
logy
, spe
cifie
dge
olog
ic/ t
ecto
nic
unit
xx
x
x
xx
x
lit
holo
gy/ s
trat
igra
phy
xx
x
x
xx
x
be
ddin
g at
titud
ex
x
x
x
w
eath
erin
gx
x
x
ge
otec
hnic
al
prop
ertie
sx
xx
xx
x
x
x
ge
otec
hnic
alpa
ram
eter
s x
x
x
ro
ck m
ass
stru
ctur
ex
x
x
jo
ints
/ joi
nt s
paci
ngx
x
x
x
di
scon
tinui
ties
x
x
x
st
ruct
ural
co
ntri
butio
ns
xx
x
Land
cov
er/ u
se
x
x
x
x
x
Hyd
roge
olog
y
xx
x
x
Rel
atio
nshi
p to
rai
nfal
l
x
x
x
Cla
ssifi
catio
n of
mas
s m
ovem
ents
x
x
x
Cla
ssifi
catio
nty
pex
xx
xx
xx
x
x
xx
x
ra
te o
f mov
emen
tx
x
x
m
ater
ial
x
x
x
x
w
ater
con
tent
x
x
x
Cau
ses,
Tri
gger
x
xx
xx
xx
x
x
x
Prec
urso
ry s
igns
x
Sile
nt w
itnes
ses
x
Dam
age
x
x
xx
xx
xx
xx
x
"Haz
ard"
to in
fras
truc
ture
x
x
x
x
Rem
edia
l mea
sure
s
xx
xx
x
Cos
ts o
f mea
sure
s an
d in
vest
igat
ion
x
x
x
Met
hods
use
d
x
x
xx
x
xx
xx
Deg
ree
of p
reci
sion
in
fo/ r
elia
bilit
y
x
x
x
x
Rep
orts
etc
.
xx
xx
xx
x
x
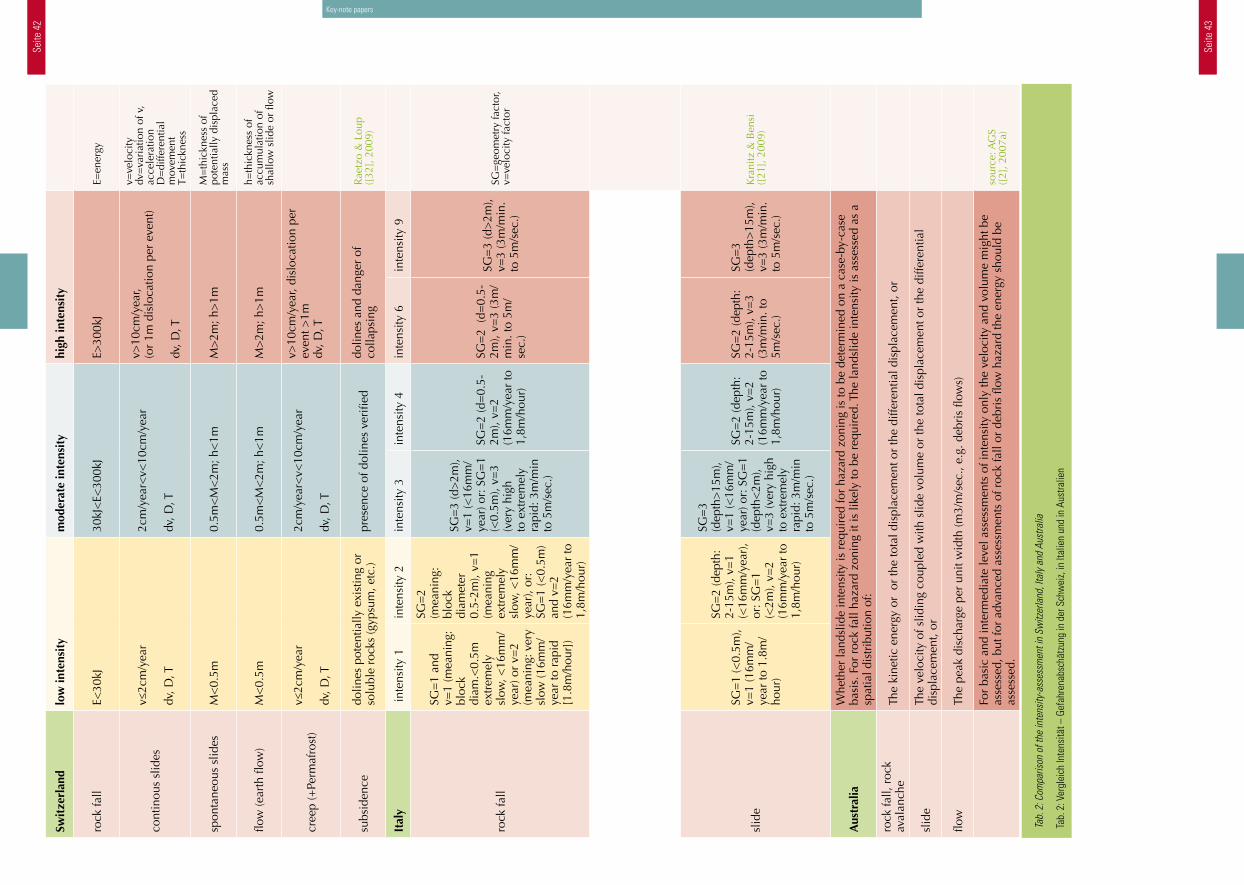
Seite
42
Seite
43
Key-note papers
Tab.
2: C
ompa
rison
of t
he in
tens
ity-a
sses
smen
t in
Switz
erla
nd, I
taly
and
Aus
tralia
Tab.
2: V
ergl
eich
Inte
nsitä
t – G
efah
rena
bsch
ätzu
ng in
der
Sch
wei
z, in
Ital
ien
und
in A
ustra
lien
Swit
zerl
and
low
inte
nsit
ym
oder
ate
inte
nsit
yhi
gh in
tens
ity
rock
fall
E<30
kJ30
kJ<
E<30
0kJ
E>30
0kJ
E=en
ergy
cont
inou
s sl
ides
v≤2c
m/y
ear
dv, D
, T
2cm
/yea
r<v<
10cm
/yea
r
dv, D
, T
v>10
cm/y
ear,
(or
1m d
islo
catio
n pe
r ev
ent)
dv, D
, T
v=ve
loci
tydv
=va
riat
ion
of v
, ac
cele
ratio
nD
=di
ffere
ntia
l m
ovem
ent
T=th
ickn
ess
spon
tane
ous
slid
es
M<
0.5m
0.5m
<M
<2m
; h<
1mM
>2m
; h>
1mM
=th
ickn
ess
of
pote
ntia
lly d
ispl
aced
m
ass
flow
(ear
th fl
ow)
M<
0.5m
0.5m
<M
<2m
; h<
1mM
>2m
; h>
1mh=
thic
knes
s of
ac
cum
ulat
ion
of
shal
low
slid
e or
flow
cree
p (+
Perm
afro
st)
v≤2c
m/y
ear
dv, D
, T
2cm
/yea
r<v<
10cm
/yea
r
dv, D
, T
v>10
cm/y
ear,
disl
ocat
ion
per
even
t >1m
dv, D
, T
subs
iden
cedo
lines
pot
entia
lly e
xist
ing
or
solu
ble
rock
s (g
ypsu
m, e
tc.)
pres
ence
of d
olin
es v
erifi
eddo
lines
and
dan
ger
of
colla
psin
g R
aetz
o &
Lou
p ([
32],
200
9)
Ital
y in
tens
ity 1
inte
nsity
2in
tens
ity 3
inte
nsity
4in
tens
ity 6
inte
nsity
9
rock
fall
SG=
1 an
d v=
1 (m
eani
ng:
bloc
k di
am.<
0.5m
ex
trem
ely
slow
, <16
mm
/ye
ar) o
r v=
2 (m
eani
ng: v
ery
slow
(16m
m/
year
to r
apid
[1
.8m
/hou
r])
SG=
2 (m
eani
ng:
bloc
k di
amet
er
0.5-
2m),
v=1
(mea
ning
ex
trem
ely
slow
, <16
mm
/ye
ar),
or:
SG=
1 (<
0.5m
) an
d v=
2 (1
6mm
/yea
r to
1,
8m/h
our)
SG=
3 (d
>2m
), v=
1 (<
16m
m/
year
) or:
SG
=1
(<0.
5m),
v=3
(ver
y hi
gh
to e
xtre
mel
y ra
pid:
3m
/min
to
5m
/sec
.)
SG=
2 (d
=0.
5-2m
), v=
2 (1
6mm
/yea
r to
1,
8m/h
our)
SG=
2 (d
=0.
5-2m
), v=
3 (3
m/
min
. to
5m/
sec.
)
SG=
3 (d
>2m
), v=
3 (3
m/m
in.
to 5
m/s
ec.)
SG=
geom
etry
fact
or,
v=ve
loci
ty fa
ctor
slid
e
SG=
1 (<
0.5m
), v=
1 (1
6mm
/ye
ar to
1.8
m/
hour
)
SG=
2 (d
epth
: 2-
15m
), v=
1 (<
16m
m/y
ear)
, or
: SG
=1
(<2m
), v=
2 (1
6mm
/yea
r to
1,
8m/h
our)
SG=
3 (d
epth
>15
m),
v=1
(<16
mm
/ye
ar) o
r: S
G=
1 (d
epth
<2m
), v=
3 (v
ery
high
to
ext
rem
ely
rapi
d: 3
m/m
in
to 5
m/s
ec.)
SG=
2 (d
epth
: 2-
15m
), v=
2 (1
6mm
/yea
r to
1,
8m/h
our)
SG=
2 (d
epth
: 2-
15m
), v=
3 (3
m/m
in. t
o 5m
/sec
.)
SG=
3 (d
epth
>15
m),
v=3
(3m
/min
. to
5m
/sec
.)
Kra
nitz
& B
ensi
([21
], 2
009)
Aus
tral
iaW
heth
er la
ndsl
ide
inte
nsity
is r
equi
red
for
haza
rd z
onin
g is
to b
e de
term
ined
on
a ca
se-b
y-ca
se
basi
s. F
or r
ock
fall
haza
rd z
onin
g it
is li
kely
to b
e re
quir
ed. T
he la
ndsl
ide
inte
nsity
is a
sses
sed
as a
sp
atia
l dis
trib
utio
n of
:
rock
fall,
roc
k av
alan
che
The
kine
tic e
nerg
y or
or
the
tota
l dis
plac
emen
t or
the
diffe
rent
ial d
ispl
acem
ent,
or
slid
eTh
e ve
loci
ty o
f slid
ing
coup
led
with
slid
e vo
lum
e or
the
tota
l dis
plac
emen
t or
the
diffe
rent
ial
disp
lace
men
t, or
flow
The
peak
dis
char
ge p
er u
nit w
idth
(m3/
m/s
ec.,
e.g.
deb
ris
flow
s)
For
basi
c an
d in
term
edia
te le
vel a
sses
smen
ts o
f int
ensi
ty o
nly
the
velo
city
and
vol
ume
mig
ht b
e as
sess
ed, b
ut fo
r ad
vanc
ed a
sses
smen
ts o
f roc
k fa
ll or
deb
ris
flow
haz
ard
the
ener
gy s
houl
d be
as
sess
ed.
sour
ce: A
GS
([2]
, 200
7a)
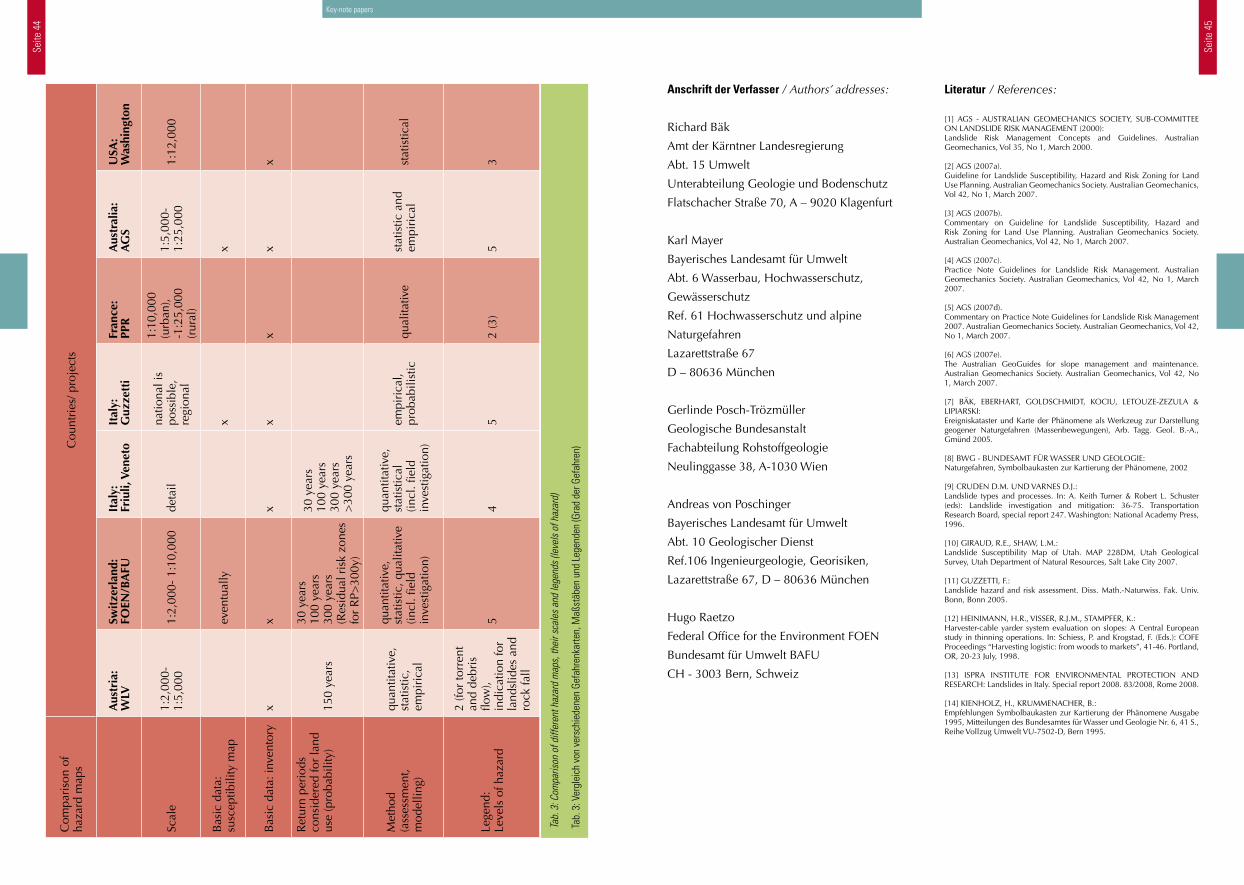
Seite
44
Seite
45
Key-note papers
Anschrift der Verfasser / Authors’ addresses:
Richard Bäk
Amt der Kärntner Landesregierung
Abt. 15 Umwelt
Unterabteilung Geologie und Bodenschutz
Flatschacher Straße 70, A – 9020 Klagenfurt
Karl Mayer
Bayerisches Landesamt für Umwelt
Abt. 6 Wasserbau, Hochwasserschutz,
Gewässerschutz
Ref. 61 Hochwasserschutz und alpine
Naturgefahren
Lazarettstraße 67
D – 80636 München
Gerlinde Posch-Trözmüller
Geologische Bundesanstalt
Fachabteilung Rohstoffgeologie
Neulinggasse 38, A-1030 Wien
Andreas von Poschinger
Bayerisches Landesamt für Umwelt
Abt. 10 Geologischer Dienst
Ref.106 Ingenieurgeologie, Georisiken,
Lazarettstraße 67, D – 80636 München
Hugo Raetzo
Federal Office for the Environment FOEN
Bundesamt für Umwelt BAFU
CH - 3003 Bern, Schweiz
Literatur / References:
[1] AGS - AUSTRALIAN GEOMECHANICS SOCIETY, SUB-COMMITTEE ON LANDSLIDE RISK MANAGEMENT (2000): Landslide Risk Management Concepts and Guidelines. Australian Geomechanics, Vol 35, No 1, March 2000.
[2] AGS (2007a). Guideline for Landslide Susceptibility, Hazard and Risk Zoning for Land Use Planning. Australian Geomechanics Society. Australian Geomechanics, Vol 42, No 1, March 2007.
[3] AGS (2007b). Commentary on Guideline for Landslide Susceptibility, Hazard and Risk Zoning for Land Use Planning. Australian Geomechanics Society. Australian Geomechanics, Vol 42, No 1, March 2007.
[4] AGS (2007c). Practice Note Guidelines for Landslide Risk Management. Australian Geomechanics Society. Australian Geomechanics, Vol 42, No 1, March 2007.
[5] AGS (2007d). Commentary on Practice Note Guidelines for Landslide Risk Management 2007. Australian Geomechanics Society. Australian Geomechanics, Vol 42, No 1, March 2007.
[6] AGS (2007e). The Australian GeoGuides for slope management and maintenance. Australian Geomechanics Society. Australian Geomechanics, Vol 42, No 1, March 2007.
[7] BÄK, EBERHART, GOLDSCHMIDT, KOCIU, LETOUZE-ZEZULA & LIPIARSKI: Ereigniskataster und Karte der Phänomene als Werkzeug zur Darstellung geogener Naturgefahren (Massenbewegungen), Arb. Tagg. Geol. B.-A., Gmünd 2005.
[8] BWG - BUNDESAMT FÜR WASSER UND GEOLOGIE: Naturgefahren, Symbolbaukasten zur Kartierung der Phänomene, 2002
[9] CRUDEN D.M. UND VARNES D.J.: Landslide types and processes. In: A. Keith Turner & Robert L. Schuster (eds): Landslide investigation and mitigation: 36-75. Transportation Research Board, special report 247. Washington: National Academy Press, 1996.
[10] GIRAUD, R.E., SHAW, L.M.: Landslide Susceptibility Map of Utah. MAP 228DM, Utah Geological Survey, Utah Department of Natural Resources, Salt Lake City 2007.
[11] GUZZETTI, F.: Landslide hazard and risk assessment. Diss. Math.-Naturwiss. Fak. Univ. Bonn, Bonn 2005.
[12] HEINIMANN, H.R., VISSER, R.J.M., STAMPFER, K.: Harvester-cable yarder system evaluation on slopes: A Central European study in thinning operations. In: Schiess, P. and Krogstad, F. (Eds.): COFE Proceedings “Harvesting logistic: from woods to markets”, 41-46. Portland, OR, 20-23 July, 1998.
[13] ISPRA INSTITUTE FOR ENVIRONMENTAL PROTECTION AND RESEARCH: Landslides in Italy. Special report 2008. 83/2008, Rome 2008.
[14] KIENHOLZ, H., KRUMMENACHER, B.:Empfehlungen Symbolbaukasten zur Kartierung der Phänomene Ausgabe 1995, Mitteilungen des Bundesamtes für Wasser und Geologie Nr. 6, 41 S., Reihe Vollzug Umwelt VU-7502-D, Bern 1995.
Com
pari
son
of
haza
rd m
aps
Cou
ntri
es/ p
roje
cts
Aus
tria
: W
LVSw
itze
rlan
d:
FOEN
/BA
FUIt
aly:
Friu
li, V
enet
oIt
aly:
G
uzze
tti
Fran
ce:
PPR
Aus
tral
ia:
AG
SU
SA:
Was
hing
ton
Scal
e1:
2,00
0-1:
5,00
01:
2,00
0- 1
:10,
000
deta
ilna
tiona
l is
poss
ible
, re
gion
al
1:10
,000
(u
rban
), -1
:25,
000
(rur
al)
1:5,
000-
1:25
,000
1:
12,0
00
Bas
ic d
ata:
su
scep
tibili
ty m
apev
entu
ally
x
x
Bas
ic d
ata:
inve
ntor
yx
xx
xx
xx
Ret
urn
peri
ods
cons
ider
ed fo
r la
nd
use
(pro
babi
lity)
150
year
s
30 y
ears
100
year
s30
0 ye
ars
(Res
idua
l ris
k zo
nes
for
RP>
300y
)
30 y
ears
100
year
s30
0 ye
ars
>30
0 ye
ars
Met
hod
(ass
essm
ent,
mod
ellin
g)
quan
titat
ive,
st
atis
tic,
empi
rica
l
quan
titat
ive,
st
atis
tic, q
ualit
ativ
e (in
cl. fi
eld
inve
stig
atio
n)
quan
titat
ive,
st
atis
tical
(in
cl. fi
eld
inve
stig
atio
n)
empi
rica
l, pr
obab
ilist
icqu
alita
tive
stat
istic
and
em
piri
cal
stat
istic
al
Lege
nd:
Leve
ls o
f haz
ard
2 (fo
r to
rren
t an
d de
bris
flo
w),
indi
catio
n fo
r la
ndsl
ides
and
ro
ck fa
ll
54
52
(3)
53
Tab.
3: C
ompa
rison
of d
iffer
ent h
azar
d m
aps,
thei
r sca
les
and
lege
nds
(leve
ls o
f haz
ard)
Tab.
3: V
ergl
eich
von
ver
schi
eden
en G
efah
renk
arte
n, M
aßst
äben
und
Leg
ende
n (G
rad
der G
efah
ren)
Seite
46
Seite
47
[15] KLINGSEISEN, B., LEOPOLD, PH.: Landslide Hazard Mapping in Austria.-GIM International 20 (12): 41-43, 2006.
[16] KLINGSEISEN, B., LEOPOLD, PH., TSCHACH, M.: Mapping Landslide Hazards in Austria: GIS Aids Regional Planning in Non-Alpine Regions. ArcNews 28 (3): 16, 2006.
[17] KOCIU, A., LETOUZE-ZEZULA, G., TILCH, N., GRÖSEL, K.: Georisiko-Potenzial Kärnten; Entwicklung einer GIS-basierten Gefahrenhinweiskarte betreffend Massenbewegungen auf Grundlage einer digitalen geologischen Karte (1:50,000) und eines georeferenzierten Ereigniskatasters. Endbericht, Gefährdungskarte, Ausweisung von Bereichen unterschiedlicher Suszeptibilität für verschiedene Typengruppen der Massenbewegung. Bund/Bundesländerkooperation KC-29, Bibl. Geol. B.-A., Wiss. Archiv, Wien, 2006
[18] KOCIU, A., TILCH N., SCHWARZ L,. HABERLER A., MELZNER S.: GEORIOS - Jahresbericht 2009; Geol.B.-A. Wien 2010.
[19] KOLMER, CH.: Geogenes Baugrundrisiko Öberösterreich. Vortrag im Rahmen des Landesgeologentages 2009, 26.2.2009, St. Pölten, 2009.
[20] KOMAC, M.; RIBICIC, M.: Landslide Susceptibility Map of Slovenia 1:250,000. Geological Survey of Slovenia, Ljubljana 2008.
[21] KRANITZ, F., BENSI, S.: The BUWAL method. In: Posch-Trözmüller, G. (Ed.): Second Scientific Report to the INTERREG IV A project MASSMOVE - Minimal standards for compilation of danger maps like landslides and rock fall as a tool for disaster prevention. Attachment 4 to the second progress report, Geological Survey of Austria, Wien, 2009.
[22] Malet, J.-P.; Thiery, Y.; Maquaire, O.; Sterlacchini, S.; van Beek, L.P.H.; van Asch, Th.W.J.; Puissant, A.; Remaitre, A.: Landslide risk zoning: What can be expected from model simulations? JRC Expert Meetings on Guidelines for Mapping Areas at Risk of Landslides in Europe 23-24 October 2007, JRC, Ispra EU, 2007.
[23] MAYER, K.: Maßnahme 3.2a „Schaffung geologischer und hydrologischer Informationsgrundlagen“. Vorhaben „Gefahrenhinweiskarte Oberallgäu“. Bayerisches Landesamt für Umwelt, München 2007.
[24] MAZENGARB, C.: The Tasmanian Landslide Hazard Map Series: Methodology. Tasmanian Geological Survey Record 2005/04, Mineral Resources Tasmania, 2005.
[25] MIDDELMANN, M. H. (ED.): Natural Hazards in Australia: Identifying Risk Analysis Requirements. Geoscience Australia, Canberra 2007.
[26] MORTON, D.M., ALVAREZ, R.M., CAMPBELL, R.H.: Preliminary soil-slip susceptibility maps, southwestern California. USGS Open-File Report OF 03-17, Riverside, 2003.
[27] NÖSSING, L.: Gefahrenzonenplanung in Südtirol. Vortrag im Rahmen des Landesgeologentages 2009, 26.2.2009, St. Pölten 2009.
[28] OLLER, P., GONZALEZ, M., PINYOL, J., MARTINEZ, P.: Hazard mapping in Catalonia. Vortrag Workshop AdaptAlp, 17.3.2010, Bozen 2010.
[29] POSCH-TRÖZMÜLLER, G.: AdaptAlp WP 5.1 Hazard Mapping - Geological Hazards. Literature Survey regarding methods of hazard mapping and evaluation of danger by landslides and rock fall. Final Report, Geologische Bundesanstalt, Wien, 2010
[30] RAETZO, H.: Hazard assessment in Switzerland – codes of practice for mass movements, International Association of Engineering Geology IAEG Bulletin, 2002.
[31] REATZO, H. & LOUP, B.: Geological hazard assessment in Switzerland (this issue)
[32] RAETZO, H. & LOUP, B. ET AL.; BAFU: Schutz vor Massenbewegungen. Technische Richtlinie als Vollzugshilfe. Entwurf 9. Sept. 2009.
[33] REEVES, H.: Geohazards: The UK perspective. Vortrag Workshop AdaptAlp, 17.3.2010, Bozen 2010.
[34] RUDOLF-MIKLAU F. & SCHMIDT F.: Implementation, application and enforcement of hazard zone maps for torrent and avalanches control in Austria, Forstliche Schriftenreihe, Universität für Bodenkultur Wien, Bd. 18, p. 83-107, 2004.
[35] RUFF, M.: GIS-gestützte Risikonanalyse für Rutschungen und Felsstürze in den Ostalpen (Vorarlberg, Österreich). Georisikokarte Vorarlberg. Diss. Univ. Karlsruhe, 2005.
[36] SCHWEIGL, J.; HERVAS, J.: Landslide Mapping in Austria. JRC Scientific and Technical Report EUR 23785 EN, Office for Official Publications of the European Communities, 61 pp. ISBN 978-92-79-11776-3, Luxembourg, 2009.
[37] SGD, PERSONENKREIS GEOGEFAHREN: Geogene Naturgefahren in Deutschland- Empfehlungen der Staatlichen Geologischen Dienste (SGD) zur Erstellung von Gefahrenhinweiskarten., 2007.
[38] TILCH, N.: Datenmanagementsystem GEORIOS (Geogene Risiken Österreich). Vortrag im Rahmen des Landesgeologentages 2009, 26.2.2009, St. Pölten 2009.
[39] VARNES, D.J. AND IAEG COMMISSION ON LANDSLIDES AND OTHER MASS-MOVEMENTS:Landslide hazard zonation: a review of principles and practice. The UNESCO Press, Paris, 1984.
Seite
48
Seite
49
Zusammenfassung:In den Bergregionen treten an Steilhängen verschiedene Arten von Massenbewegungen auf, die Wasser und Sedimente mit sich führen: Muren, Bergsturz und Steinschlag. Das Ziel dieser Abhandlung ist es, einen kurzen Überblick über die vergangenen Analysen der Gefahren von Hangmassenbewegungen zu geben. Obwohl der Schwerpunkt auf Berg-stürzen liegt, können die präsentierten Ansätze auch zur Gefahrenbeurteilung von Muren und Steinschlag verwendet werden. Insbesondere Bergstürze und Muren sind sehr häufig miteinander verflochten. Im Folgenden wird „Bergsturz“ im weiteren Sinn als ein Begriff verwendet, der nicht nur auf einen Erdrutsch zu beziehen ist, sondern auch auf andere Hangmassenbewegungen.Schlüsselwörter: Bergstürze, Muren, Felssturz, numerische Ansätze, Bergsturzgefahrenanalyse
movements on slopes, including rock-fall, topples
and debris flow, that involve little or no true
sliding”. Cruden (1991) moderated the accepted
definition as “the movement of a mass of rock,
earth or debris down a slope”. Later different
working groups were established to support a
specific level of standardisation in fields related
to landslides (UNESCO, IUGS, ISSMGE, ISRM
and IAEG) and created the JTC (Joint Technical
Committee on Landslides and Engineered Slopes),
which continues to work for the standardisation
and promotion of research on landslides among
the different disciplines. A large set of definitions
was later presented by ISSMGE TC32 (Technical
Committee on Risk Assessment and Management,
2004) where international terms recognized for
hazard, vulnerability, risk and disaster can also
be found. Since these definitions were published,
many approaches have been implemented
(Einstein, 1988; Fell, 1994; Soeters and van Westen,
1996; Wu et al., 1996; Cruden and Fell, 1997; van
Westen et al., 2003; Lee and Jones, 2004; Glade et
al., 2005) allowing one to conclude that nowadays
definitions regarding landslides risk assessment
are generally accepted. The latest information of
guidelines for landslide susceptibility, hazard and
risk zoning are published by JTC-1 (2008) and van
Westen et al. (2008).
1. The “Early Ages”
The first extensive papers on the use of spatial
information in a digital context for landslide
susceptibility mapping date back to the late
seventies and early eighties of the last century.
Among the pioneers in this field were Carrara
et al. (1977) in Italy and Brabb et al. (1978) in
California. Nowadays, practically all research
on landslide susceptibility and hazard mapping
makes use of digital tools for handling spatial data
such as GIS, GPS and Remote Sensing. These tools
also have defined, to a large extent, the type of
analysis that can be carried out. It can be stated
that to a certain degree the capability of GIS
tools and the accuracy of the in-situ and remote
sensing data have determined the current state of
the art in landslide hazard and risk assessment.
Many publications about landslides and some
worldwide landslide research problems can be
found in the literature of Einstein (1988), Fell
(1994), Dai et al. (2002) and Glade et al. (2005).
2. Terminology
The term landslide was defined by Varnes and
IAEG (1984) as “almost all varieties of mass
An Overview of Approaches for Hazard Assessment of Slope Mass Movements
Ein Überblick über die Ansätze zur Gefahrenbeurteilung von Massenbewegung
Summary:In mountainous areas, various types of mass movements occur on steep slopes involving water and sediment: debris flows, landslides and rockfalls. The aim of this paper is to gather a short overview of the past analyses that dealt with the hazard assessment of slope mass movements. Although the main focus is on landslides, the approaches presented can be used to assess debris flows and rockfall hazards. In particular, landslides and debris flow are very often interlaced between each other. In the following text, the term “landslide” will be used as a term that might not always be strictly connected to only landslides but also to other slope mass movements. In a way it has a broader meaning.Keywords: landslides, debris-flows, rockfall, numerical approaches, landslide hazard assessment
MATEJA JEMEC, MARKO KOMAC
Key-note papers
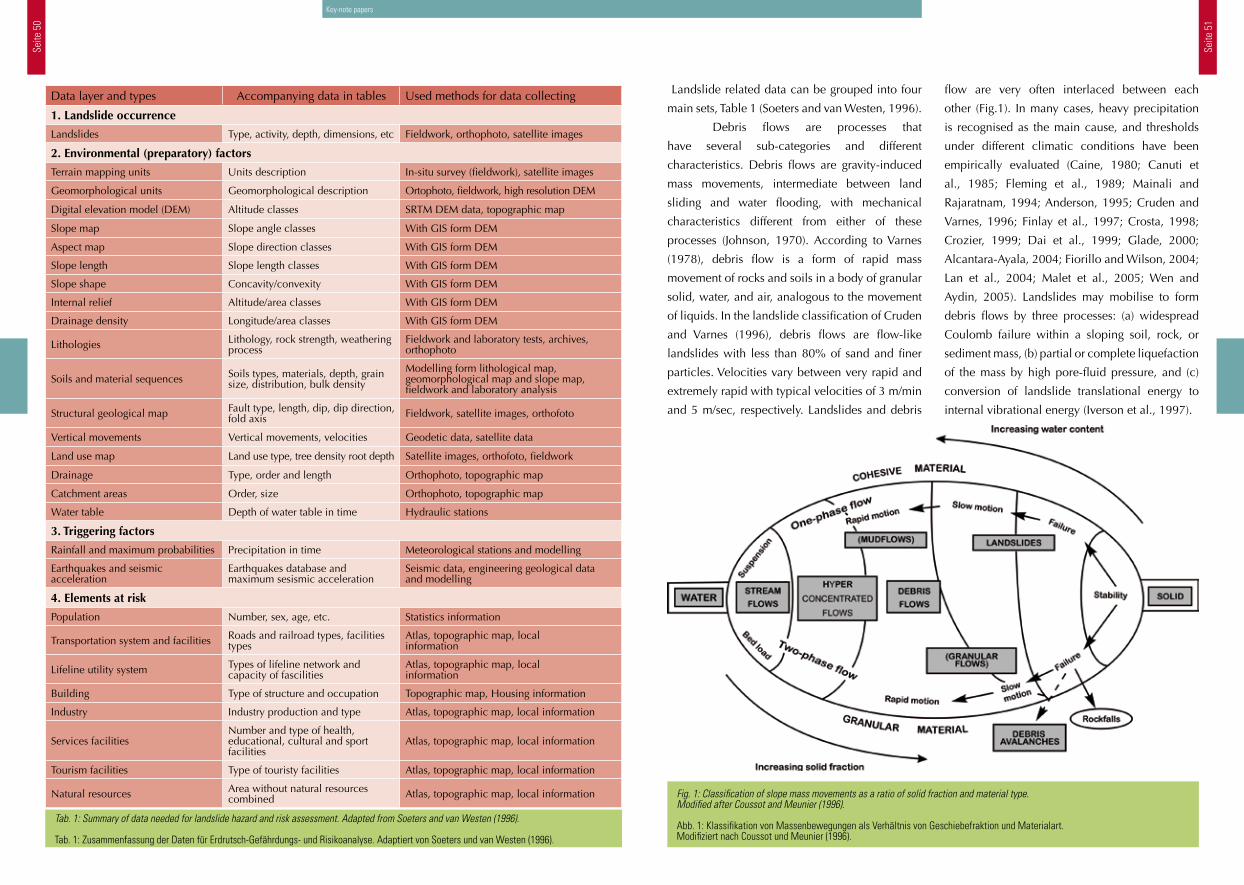
Seite
50
Seite
51
Landslide related data can be grouped into four
main sets, Table 1 (Soeters and van Westen, 1996).
Debris flows are processes that
have several sub-categories and different
characteristics. Debris flows are gravity-induced
mass movements, intermediate between land
sliding and water flooding, with mechanical
characteristics different from either of these
processes (Johnson, 1970). According to Varnes
(1978), debris flow is a form of rapid mass
movement of rocks and soils in a body of granular
solid, water, and air, analogous to the movement
of liquids. In the landslide classification of Cruden
and Varnes (1996), debris flows are flow-like
landslides with less than 80% of sand and finer
particles. Velocities vary between very rapid and
extremely rapid with typical velocities of 3 m/min
and 5 m/sec, respectively. Landslides and debris
flow are very often interlaced between each
other (Fig.1). In many cases, heavy precipitation
is recognised as the main cause, and thresholds
under different climatic conditions have been
empirically evaluated (Caine, 1980; Canuti et
al., 1985; Fleming et al., 1989; Mainali and
Rajaratnam, 1994; Anderson, 1995; Cruden and
Varnes, 1996; Finlay et al., 1997; Crosta, 1998;
Crozier, 1999; Dai et al., 1999; Glade, 2000;
Alcantara-Ayala, 2004; Fiorillo and Wilson, 2004;
Lan et al., 2004; Malet et al., 2005; Wen and
Aydin, 2005). Landslides may mobilise to form
debris flows by three processes: (a) widespread
Coulomb failure within a sloping soil, rock, or
sediment mass, (b) partial or complete liquefaction
of the mass by high pore-fluid pressure, and (c)
conversion of landslide translational energy to
internal vibrational energy (Iverson et al., 1997).
Key-note papers
Fig. 1: Classification of slope mass movements as a ratio of solid fraction and material type. Modified after Coussot and Meunier (1996).
Abb. 1: Klassifikation von Massenbewegungen als Verhältnis von Geschiebefraktion und Materialart. Modifiziert nach Coussot und Meunier (1996).
Data layer and types Accompanying data in tables Used methods for data collecting
1. Landslide occurrence
Landslides Type, activity, depth, dimensions, etc Fieldwork, orthophoto, satellite images
2. Environmental (preparatory) factors
Terrain mapping units Units description In-situ survey (fieldwork), satellite images
Geomorphological units Geomorphological description Ortophoto, fieldwork, high resolution DEM
Digital elevation model (DEM) Altitude classes SRTM DEM data, topographic map
Slope map Slope angle classes With GIS form DEM
Aspect map Slope direction classes With GIS form DEM
Slope length Slope length classes With GIS form DEM
Slope shape Concavity/convexity With GIS form DEM
Internal relief Altitude/area classes With GIS form DEM
Drainage density Longitude/area classes With GIS form DEM
Lithologies Lithology, rock strength, weathering process
Fieldwork and laboratory tests, archives, orthophoto
Soils and material sequences Soils types, materials, depth, grain size, distribution, bulk density
Modelling form lithological map, geomorphological map and slope map, fieldwork and laboratory analysis
Structural geological map Fault type, length, dip, dip direction, fold axis Fieldwork, satellite images, orthofoto
Vertical movements Vertical movements, velocities Geodetic data, satellite data
Land use map Land use type, tree density root depth Satellite images, orthofoto, fieldwork
Drainage Type, order and length Orthophoto, topographic map
Catchment areas Order, size Orthophoto, topographic map
Water table Depth of water table in time Hydraulic stations
3. Triggering factors
Rainfall and maximum probabilities Precipitation in time Meteorological stations and modelling
Earthquakes and seismic acceleration
Earthquakes database and maximum sesismic acceleration
Seismic data, engineering geological data and modelling
4. Elements at risk
Population Number, sex, age, etc. Statistics information
Transportation system and facilities Roads and railroad types, facilities types
Atlas, topographic map, local information
Lifeline utility system Types of lifeline network and capacity of fascilities
Atlas, topographic map, local information
Building Type of structure and occupation Topographic map, Housing information
Industry Industry production and type Atlas, topographic map, local information
Services facilitiesNumber and type of health, educational, cultural and sport facilities
Atlas, topographic map, local information
Tourism facilities Type of touristy facilities Atlas, topographic map, local information
Natural resources Area without natural resources combined Atlas, topographic map, local information
Tab. 1: Summary of data needed for landslide hazard and risk assessment. Adapted from Soeters and van Westen (1996).
Tab. 1: Zusammenfassung der Daten für Erdrutsch-Gefährdungs- und Risikoanalyse. Adaptiert von Soeters und van Westen (1996).
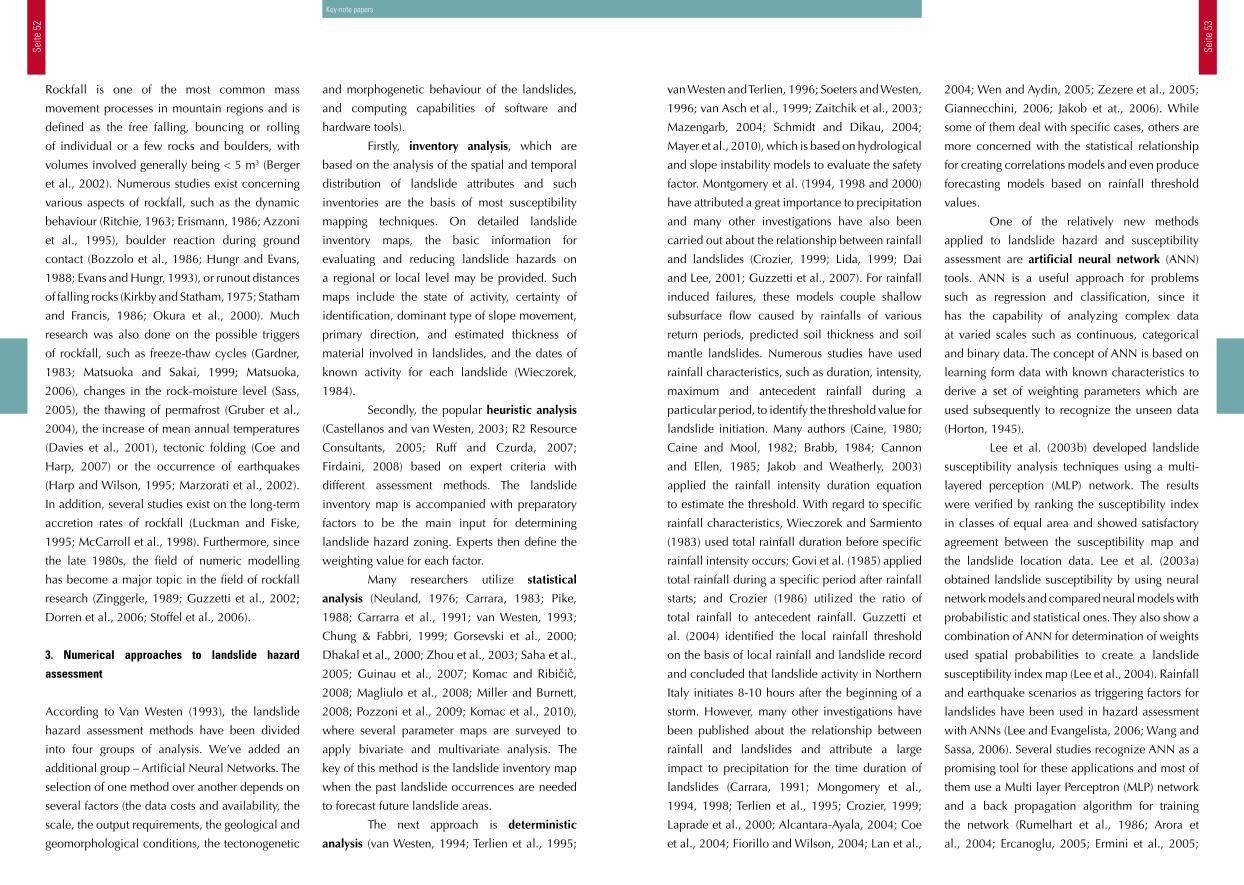
Seite
52
Seite
53
van Westen and Terlien, 1996; Soeters and Westen,
1996; van Asch et al., 1999; Zaitchik et al., 2003;
Mazengarb, 2004; Schmidt and Dikau, 2004;
Mayer et al., 2010), which is based on hydrological
and slope instability models to evaluate the safety
factor. Montgomery et al. (1994, 1998 and 2000)
have attributed a great importance to precipitation
and many other investigations have also been
carried out about the relationship between rainfall
and landslides (Crozier, 1999; Lida, 1999; Dai
and Lee, 2001; Guzzetti et al., 2007). For rainfall
induced failures, these models couple shallow
subsurface flow caused by rainfalls of various
return periods, predicted soil thickness and soil
mantle landslides. Numerous studies have used
rainfall characteristics, such as duration, intensity,
maximum and antecedent rainfall during a
particular period, to identify the threshold value for
landslide initiation. Many authors (Caine, 1980;
Caine and Mool, 1982; Brabb, 1984; Cannon
and Ellen, 1985; Jakob and Weatherly, 2003)
applied the rainfall intensity duration equation
to estimate the threshold. With regard to specific
rainfall characteristics, Wieczorek and Sarmiento
(1983) used total rainfall duration before specific
rainfall intensity occurs; Govi et al. (1985) applied
total rainfall during a specific period after rainfall
starts; and Crozier (1986) utilized the ratio of
total rainfall to antecedent rainfall. Guzzetti et
al. (2004) identified the local rainfall threshold
on the basis of local rainfall and landslide record
and concluded that landslide activity in Northern
Italy initiates 8-10 hours after the beginning of a
storm. However, many other investigations have
been published about the relationship between
rainfall and landslides and attribute a large
impact to precipitation for the time duration of
landslides (Carrara, 1991; Mongomery et al.,
1994, 1998; Terlien et al., 1995; Crozier, 1999;
Laprade et al., 2000; Alcantara-Ayala, 2004; Coe
et al., 2004; Fiorillo and Wilson, 2004; Lan et al.,
2004; Wen and Aydin, 2005; Zezere et al., 2005;
Giannecchini, 2006; Jakob et at., 2006). While
some of them deal with specific cases, others are
more concerned with the statistical relationship
for creating correlations models and even produce
forecasting models based on rainfall threshold
values.
One of the relatively new methods
applied to landslide hazard and susceptibility
assessment are artificial neural network (ANN)
tools. ANN is a useful approach for problems
such as regression and classification, since it
has the capability of analyzing complex data
at varied scales such as continuous, categorical
and binary data. The concept of ANN is based on
learning form data with known characteristics to
derive a set of weighting parameters which are
used subsequently to recognize the unseen data
(Horton, 1945).
Lee et al. (2003b) developed landslide
susceptibility analysis techniques using a multi-
layered perception (MLP) network. The results
were verified by ranking the susceptibility index
in classes of equal area and showed satisfactory
agreement between the susceptibility map and
the landslide location data. Lee et al. (2003a)
obtained landslide susceptibility by using neural
network models and compared neural models with
probabilistic and statistical ones. They also show a
combination of ANN for determination of weights
used spatial probabilities to create a landslide
susceptibility index map (Lee et al., 2004). Rainfall
and earthquake scenarios as triggering factors for
landslides have been used in hazard assessment
with ANNs (Lee and Evangelista, 2006; Wang and
Sassa, 2006). Several studies recognize ANN as a
promising tool for these applications and most of
them use a Multi layer Perceptron (MLP) network
and a back propagation algorithm for training
the network (Rumelhart et al., 1986; Arora et
al., 2004; Ercanoglu, 2005; Ermini et al., 2005;
Key-note papers
and morphogenetic behaviour of the landslides,
and computing capabilities of software and
hardware tools).
Firstly, inventory analysis, which are
based on the analysis of the spatial and temporal
distribution of landslide attributes and such
inventories are the basis of most susceptibility
mapping techniques. On detailed landslide
inventory maps, the basic information for
evaluating and reducing landslide hazards on
a regional or local level may be provided. Such
maps include the state of activity, certainty of
identification, dominant type of slope movement,
primary direction, and estimated thickness of
material involved in landslides, and the dates of
known activity for each landslide (Wieczorek,
1984).
Secondly, the popular heuristic analysis
(Castellanos and van Westen, 2003; R2 Resource
Consultants, 2005; Ruff and Czurda, 2007;
Firdaini, 2008) based on expert criteria with
different assessment methods. The landslide
inventory map is accompanied with preparatory
factors to be the main input for determining
landslide hazard zoning. Experts then define the
weighting value for each factor.
Many researchers utilize statistical
analysis (Neuland, 1976; Carrara, 1983; Pike,
1988; Carrarra et al., 1991; van Westen, 1993;
Chung & Fabbri, 1999; Gorsevski et al., 2000;
Dhakal et al., 2000; Zhou et al., 2003; Saha et al.,
2005; Guinau et al., 2007; Komac and Ribičič,
2008; Magliulo et al., 2008; Miller and Burnett,
2008; Pozzoni et al., 2009; Komac et al., 2010),
where several parameter maps are surveyed to
apply bivariate and multivariate analysis. The
key of this method is the landslide inventory map
when the past landslide occurrences are needed
to forecast future landslide areas.
The next approach is deterministic
analysis (van Westen, 1994; Terlien et al., 1995;
Rockfall is one of the most common mass
movement processes in mountain regions and is
defined as the free falling, bouncing or rolling
of individual or a few rocks and boulders, with
volumes involved generally being < 5 m3 (Berger
et al., 2002). Numerous studies exist concerning
various aspects of rockfall, such as the dynamic
behaviour (Ritchie, 1963; Erismann, 1986; Azzoni
et al., 1995), boulder reaction during ground
contact (Bozzolo et al., 1986; Hungr and Evans,
1988; Evans and Hungr, 1993), or runout distances
of falling rocks (Kirkby and Statham, 1975; Statham
and Francis, 1986; Okura et al., 2000). Much
research was also done on the possible triggers
of rockfall, such as freeze-thaw cycles (Gardner,
1983; Matsuoka and Sakai, 1999; Matsuoka,
2006), changes in the rock-moisture level (Sass,
2005), the thawing of permafrost (Gruber et al.,
2004), the increase of mean annual temperatures
(Davies et al., 2001), tectonic folding (Coe and
Harp, 2007) or the occurrence of earthquakes
(Harp and Wilson, 1995; Marzorati et al., 2002).
In addition, several studies exist on the long-term
accretion rates of rockfall (Luckman and Fiske,
1995; McCarroll et al., 1998). Furthermore, since
the late 1980s, the field of numeric modelling
has become a major topic in the field of rockfall
research (Zinggerle, 1989; Guzzetti et al., 2002;
Dorren et al., 2006; Stoffel et al., 2006).
3. Numerical approaches to landslide hazard
assessment
According to Van Westen (1993), the landslide
hazard assessment methods have been divided
into four groups of analysis. We’ve added an
additional group – Artificial Neural Networks. The
selection of one method over another depends on
several factors (the data costs and availability, the
scale, the output requirements, the geological and
geomorphological conditions, the tectonogenetic
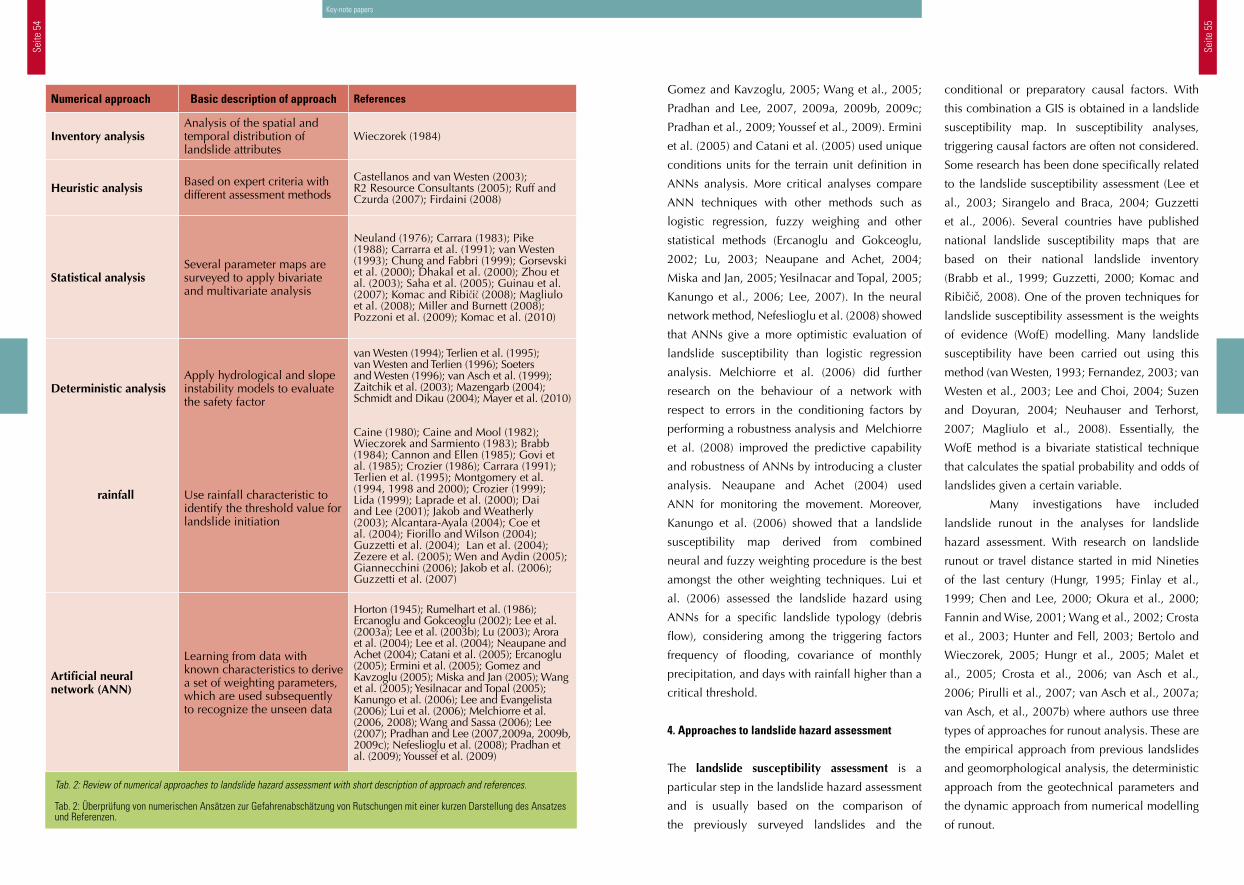
Seite
54
Seite
55
Gomez and Kavzoglu, 2005; Wang et al., 2005;
Pradhan and Lee, 2007, 2009a, 2009b, 2009c;
Pradhan et al., 2009; Youssef et al., 2009). Ermini
et al. (2005) and Catani et al. (2005) used unique
conditions units for the terrain unit definition in
ANNs analysis. More critical analyses compare
ANN techniques with other methods such as
logistic regression, fuzzy weighing and other
statistical methods (Ercanoglu and Gokceoglu,
2002; Lu, 2003; Neaupane and Achet, 2004;
Miska and Jan, 2005; Yesilnacar and Topal, 2005;
Kanungo et al., 2006; Lee, 2007). In the neural
network method, Nefeslioglu et al. (2008) showed
that ANNs give a more optimistic evaluation of
landslide susceptibility than logistic regression
analysis. Melchiorre et al. (2006) did further
research on the behaviour of a network with
respect to errors in the conditioning factors by
performing a robustness analysis and Melchiorre
et al. (2008) improved the predictive capability
and robustness of ANNs by introducing a cluster
analysis. Neaupane and Achet (2004) used
ANN for monitoring the movement. Moreover,
Kanungo et al. (2006) showed that a landslide
susceptibility map derived from combined
neural and fuzzy weighting procedure is the best
amongst the other weighting techniques. Lui et
al. (2006) assessed the landslide hazard using
ANNs for a specific landslide typology (debris
flow), considering among the triggering factors
frequency of flooding, covariance of monthly
precipitation, and days with rainfall higher than a
critical threshold.
4. Approaches to landslide hazard assessment
The landslide susceptibility assessment is a
particular step in the landslide hazard assessment
and is usually based on the comparison of
the previously surveyed landslides and the
conditional or preparatory causal factors. With
this combination a GIS is obtained in a landslide
susceptibility map. In susceptibility analyses,
triggering causal factors are often not considered.
Some research has been done specifically related
to the landslide susceptibility assessment (Lee et
al., 2003; Sirangelo and Braca, 2004; Guzzetti
et al., 2006). Several countries have published
national landslide susceptibility maps that are
based on their national landslide inventory
(Brabb et al., 1999; Guzzetti, 2000; Komac and
Ribičič, 2008). One of the proven techniques for
landslide susceptibility assessment is the weights
of evidence (WofE) modelling. Many landslide
susceptibility have been carried out using this
method (van Westen, 1993; Fernandez, 2003; van
Westen et al., 2003; Lee and Choi, 2004; Suzen
and Doyuran, 2004; Neuhauser and Terhorst,
2007; Magliulo et al., 2008). Essentially, the
WofE method is a bivariate statistical technique
that calculates the spatial probability and odds of
landslides given a certain variable.
Many investigations have included
landslide runout in the analyses for landslide
hazard assessment. With research on landslide
runout or travel distance started in mid Nineties
of the last century (Hungr, 1995; Finlay et al.,
1999; Chen and Lee, 2000; Okura et al., 2000;
Fannin and Wise, 2001; Wang et al., 2002; Crosta
et al., 2003; Hunter and Fell, 2003; Bertolo and
Wieczorek, 2005; Hungr et al., 2005; Malet et
al., 2005; Crosta et al., 2006; van Asch et al.,
2006; Pirulli et al., 2007; van Asch et al., 2007a;
van Asch, et al., 2007b) where authors use three
types of approaches for runout analysis. These are
the empirical approach from previous landslides
and geomorphological analysis, the deterministic
approach from the geotechnical parameters and
the dynamic approach from numerical modelling
of runout.
Key-note papers
Numerical approach Basic description of approach References
Inventory analysisAnalysis of the spatial and temporal distribution of landslide attributes
Wieczorek (1984)
Heuristic analysis Based on expert criteria with different assessment methods
Castellanos and van Westen (2003);R2 Resource Consultants (2005); Ruff and Czurda (2007); Firdaini (2008)
Statistical analysisSeveral parameter maps are surveyed to apply bivariate and multivariate analysis
Neuland (1976); Carrara (1983); Pike (1988); Carrarra et al. (1991); van Westen (1993); Chung and Fabbri (1999); Gorsevski et al. (2000); Dhakal et al. (2000); Zhou et al. (2003); Saha et al. (2005); Guinau et al. (2007); Komac and Ribičič (2008); Magliulo et al. (2008); Miller and Burnett (2008); Pozzoni et al. (2009); Komac et al. (2010)
Deterministic analysis
rainfall
Apply hydrological and slope instability models to evaluate the safety factor
Use rainfall characteristic to identify the threshold value for landslide initiation
van Westen (1994); Terlien et al. (1995); van Westen and Terlien (1996); Soeters and Westen (1996); van Asch et al. (1999); Zaitchik et al. (2003); Mazengarb (2004); Schmidt and Dikau (2004); Mayer et al. (2010)
Caine (1980); Caine and Mool (1982); Wieczorek and Sarmiento (1983); Brabb (1984); Cannon and Ellen (1985); Govi et al. (1985); Crozier (1986); Carrara (1991); Terlien et al. (1995); Montgomery et al. (1994, 1998 and 2000); Crozier (1999); Lida (1999); Laprade et al. (2000); Dai and Lee (2001); Jakob and Weatherly (2003); Alcantara-Ayala (2004); Coe et al. (2004); Fiorillo and Wilson (2004); Guzzetti et al. (2004); Lan et al. (2004); Zezere et al. (2005); Wen and Aydin (2005); Giannecchini (2006); Jakob et al. (2006); Guzzetti et al. (2007)
Artificial neural network (ANN)
Learning from data with known characteristics to derive a set of weighting parameters, which are used subsequently to recognize the unseen data
Horton (1945); Rumelhart et al. (1986); Ercanoglu and Gokceoglu (2002); Lee et al. (2003a); Lee et al. (2003b); Lu (2003); Arora et al. (2004); Lee et al. (2004); Neaupane and Achet (2004); Catani et al. (2005); Ercanoglu (2005); Ermini et al. (2005); Gomez and Kavzoglu (2005); Miska and Jan (2005); Wang et al. (2005); Yesilnacar and Topal (2005); Kanungo et al. (2006); Lee and Evangelista (2006); Lui et al. (2006); Melchiorre et al. (2006, 2008); Wang and Sassa (2006); Lee (2007); Pradhan and Lee (2007,2009a, 2009b, 2009c); Nefeslioglu et al. (2008); Pradhan et al. (2009); Youssef et al. (2009)
Tab. 2: Review of numerical approaches to landslide hazard assessment with short description of approach and references.
Tab. 2: Überprüfung von numerischen Ansätzen zur Gefahrenabschätzung von Rutschungen mit einer kurzen Darstellung des Ansatzes und Referenzen.
Seite
56
Seite
57
Komac (2006) designed multivariate statistical
processing techniques in order to obtain several
landslide susceptibility models with data at scale
1:50,000 and 1:100,000. Based on the statistical
results, several landslides susceptibility maps
were created.
Quantitative landslide risk assessment
has been used for specific slopes or very small
areas using probabilistic methods or percentage
of losses expected (Whitman, 1984; Chowdhury,
1988). Probabilistic values (0-1) are obtained
at the expense of a certain amount of monetary
or human loss. Quantitative risk analysis and
consequent assessment uses information about
hazard probability, values of elements at risk
and their vulnerability. Among the quantitative
approaches found in literature there are some
basic similarities but also some differences
between the approaches. They include either
estimation of hazard or estimation of vulnerability
and consequences (Morgan, 1992; Einstein, 1988,
1997; Fell, 1994; Fell et al., 2005; Anderson et al.,
1996; Ragozin, 1996; Ragozin and Tikhvinsky,
2000; Lee and Jones, 2004; AGS, 2000).
5. Landslide risk management
At the end of the assessment process when
landslide susceptibility and risk assessment
have been identified, results and measures
obtained should or may be included into the
landslide risk management process governed
by decision makers to mitigate landslide risk of
the community or, at this level, several further
approaches are possible. The strategies may
be grouped into planning control, engineering
solution, acceptance, and monitoring or warning
systems. The risk assessed can be compared
with the acceptance criteria to decide upon the
landslide mitigation measures required.
Landslide (or any natural hazard for that matter)
assessment process is just one of several steps in
the (Landslide) Risk Management Cycle (RMC),
which doesn’t end at the stage where results of
assessment process are included in the RMC. RMC
is a live system where each measure/provision
results in a consequence(s) that influence(s)
further development in and steps of this cycle. In
a way we could define it as a spiral rather than as
a circular process since the same position is never
reached again.
6. Conclusion
In this paper, different approaches for the evaluation
of slope mass processes are reviewed. In general,
all analyses are based on the assumption that
historical landslides and their causal relationships
can be used to predict future ones (“past is a key
to the future”). However, we can see that many
researchers use different approaches to evaluate
landslides, debris flow or rockfall hazard risk
assessment, which mainly depend on data
availability. In developing countries, usually the
lack of financial support to produce risk assessment
maps for dangerous areas results in emphasis
on remediation measures. Whereas in countries
with high standards, the approach to the topic is
focused into prevention and into remediation if
disasters occur. In any event the obstacles related
to the availability of data are smaller each day
due to low-cost satellite information, the use of
SRTM, ASTER and Google Earth, which ease the
creation of landslide inventory databases, a basis
for any further hazard assessments. The landslide
inventory map is probably the most important data
set to work on for producing a reliable prediction
map of spatial and temporal probability for
landslides or other slope mass movements and a
necessity for any type of analyses.
Key-note papers
and the risk areas are categorized generally in
three or five classes as very high, high, moderate,
low and very low. This method is applicable for
spatial analysis using GIS and usually applied at
national or regional levels. This approach were
found in literature from Lateltin (1997), AGS
(2000), Budetta (2004), Cascini (2004), Ko Ko et
al. (2004), IADB (2005), Nadim et al. (2006).
With the semi-qualitative landslide
risk assessment approach, weights are assigned
under certain criteria, which provide numbers
as outcome, instead of qualitative classes
(0-1, 0-10 or 0-100). It could be applicable to
any scale, but more reasonably used at medium
scale. Semi-quantitative approach efficiently uses
spatial multi-criteria techniques implemented in
GIS that facilitate standardization, weighting and
data integration in a single set of tools. More
details about the weighting system are published
by Brand (1988), Koirala and Watkins (1988),
Chowdhury and Flentje (2003), Blochl and
Braun (2005), Castellanos Abella and van Westen
(2005) and Saldivar-Sail and Einstein (2007).
When implementing the semi-quantitative
model, usually the multi-criteria evaluation is
used (see references below). The input is a set
of maps that are the spatial representation on
the criteria, which are grouped, standardised
and weighted in a criteria tree. Meanwhile the
output is one or more composite index maps
indicating the completion of the model used.
The theoretical background for the multi-
criteria evaluation is based on the Analytical
Hierarchical Process (AHP) developed by Saaty
(1977). The AHP has been extensively applied
on decision making problems (Saaty and Vargas,
2001). Recently some research has been carried
out to apply AHP to landslide susceptibility
assessment (Barredo et al., 2000; Mwasi,
2001; Nie et al., 2001, Wu and Chen, 2009).
Landslide vulnerability assessment is a
fundamental component in the evaluation
of landslide risk (Leone et al., 1996). Most
publications about vulnerability are related to
hazard and risk assessment (Mejia-Navarro et al.,
1994; Leone et al., 1996; Ragozin and Tikhvinsky,
2000; van Westen, 2002; Hollenstein, 2005). The
main object of these investigations determined
the elements of risk which have impact on
structures on its surface and estimate the cost.
The vulnerability maps are expressed with values
between 0 and 1, where 0 means no damage and
1 means total loss. Generally, the vulnerability
to landslides may depend on runout distance;
volume and velocity of sliding; elements at risk
(buildings and other structures), their nature and
their proximity to the slide; and the elements
at risk (person), their proximity to the slide, the
nature of the building/road that they are in, and
where they are in the building, on the road, etc
(Finlay, 1996).
The aim of landslide hazard and risk
assessment studies is to protect the population,
the economy and environment against potential
damage caused by landslides (Crozier and Glade,
2005). Risk in this context, is seen as a disaster
that could happen in the future. The total risk
map could be obtained by combining hazard and
vulnerability and made directly or specific risk or
consequence maps can be created and analyzed
in order to achieve some preliminary conclusions.
The classification of the landslide risk assessment
is still in progress. At the moment the classification
is based on the level of quantification dividing the
landslide risk assessment methods in qualitative,
semi-qualitative and quantitative (AGS, 2000;
Powell, 2000; Walker 2000; Chowdhury and
Flentje, 2003).
The qualitative landslide risk assessment
approach is based on the experience of the experts
Seite
58
Seite
59
CHEN, H. AND LEE, C. F., 2000. Numerical simulation of debris flows, Canadian Geotechnical Journal 37, 146–160.
CHOWDHURY, R.N., 1988. Special lecture: Analysis methods of assessing landslide risk - recent developments. In: C. Bonnard (Editor), Proceedings of the 5th International Symposium on Landslides, Rotterdam, 515-524.
CHOWDHURY, R. AND FLENTJE, P., 2003. Role of slope reliability analysis in landslide risk management, Bull. Eng. Geol. Env. 62, 41–46.
CHUNG, C–J. F. AND FABBRI, A. G., 1999. Probabilistic Prediction Models for Landslide Hazard Mapping.- Photogrammetric engineering and remote sensing, Vol. 65(12), American Society of Photogrammetry and Remote Sensing, p. 1389–1399, Falls Church.
COE, J.A., HARP, E.L., 2007. Influence of tectonic folding on rockfall susceptibility. American Fork Canyon, Utah, USA. Natural Hazards and Earth System Sci. 7, 1–14.
COE, J.A., MICHAEL, J.A., CROVELLI, R.A., SAVAGE, W.Z., LAPRADE, W.T. AND NASHEM, W.D., 2004. Probabilistic assessment of precipitation triggered landslide using historical records of landslide occurence, Seattle, Whashington. Environmental & Engineering Geoscience X (2), 103-122.
COUSSOT, P., MEUNIER, M., 1996. Recognition, classification and mechanical description of debris flows. Earth-Sci. Rev. 40. 209-227.
CROSTA, G., 1998. Regionalization of rainfall thresholds: an aid to landslide hazard evaluation. Environmental Geology, 35, 131-145.
CROSTA, G.B., CUCCHIARO, S. AND FRATTINI, P., 2003.Validation of semi-empirical relationships for the definition of debris-flow behaviour in granular materials. In: D. Rickenmann and C. Chen, Editors, Proc. 3rd International Conference on Debris Flows Hazards Mitigation: Mechanics, Prediction and Assessment, Davos, Switzerland, Millpress, Rotterda. 821–831.
CROSTA, G., Imposimato, S. and Roddeman, D., 2006.In: S.G. Evans, G. Scarascia Mugnozza, A. Strom and R.L. Hermanns, Editors, Proceedings of the NATO Advanced Research Workshop on Massive Rock Slope Failure: New Models for Hazard Assessment, Celano, Italy, 16–21 June 2002, NATO Science Series. Series IV, Earth and Environmental Sciences vol. 49.
CROZIER, M., 1986. Landslides: causes, consequences and environment, Croom Helm, London, 252.
CROZIER, M.J., 1999. Prediction of rainfall triggered landslides: a test of the antecedent water status model. Earth Surf. Proces. Landf. 24 (9), 825– 833.
CROZIER, M.J. and GLADE, T., 2005. Landslide hazard and risk: Issues, Concepts and Approach. In: Glade T, Anderson M, Crozier M (Eds) Landslide hazard and risk. Wiley, Chichester, 1-40.
CRUDEN, D.M., 1991. A simple definition of a landslide. Bulletin of the International Association of Engineering Geology, 43: 27-29.
CRUDEN D.M. AND VARNES, D.J., 1996.Landslide types and processes. In: Turner A.K.; Shuster R.L. (Editors), Landslides: Investigation and Mitigation. Transportation Research Board, Special Report No. 247, pp. 36-75.
CRUDEN, D. AND FELL, R., 1997. Landslide risk assessment. A.A.Balkema, Rotterdam, 371 pp.
DAI, F.C., LEE, C.F. AND NGAI, Y.Y., 2002. Landslide risk assessment and management an overview. Engineering Geology, 64(1): 65-87.
DAI, F.C. AND LEE, C.F., 2001. Frequency-volume relation and prediction of rainfall induced landslides. Engineering Geology 59 (3-4), 253-266.
DAVIES, M.C.R., HAMZA, O., HARRIS, C., 2001. The effect of rise in mean annual temperature on the stability of rock slopes containing ice-filled discontinuities. Permafrost and Periglacial Processes 12 (1), 137–144.
DHAKAL, A. S., AMADA, T. AND ANIYA, M., 2000.Landslide hazard mapping and its evaluation using GIS: An investigation of sampling schemes for a grid-cell based quantitative method.- Photogrammetric engineering and remote sensing, Vol. 66(8), American Society of Photogrammetry and Remote Sensing, p. 981–989, Falls Church.
DORREN, L.K.A., BERGER, F., PUTTERS, U.S., 2006. Real size experiments and 3D simulation of rockfall on forested and non-forested slopes. Natural Hazards and Earth System Sci. 6, 145–153.
EINSTEIN, H.H., 1988. Special lecture: Landslide risk assessment procedure. In: C. Bonnard (Editor), Proc 5th International Symposium on Landslides. Publ Rotterdam: A A Balkema, Lausanne, pp. 1075-1090.
EINSTEIN, H.H., 1997. Landslide Risk – Systematic approaches to assessment and management in Landslide Risk Assessment. In: Cruden, D., Fell, R. (eds). Landslide Risk Assessment, 25-50.
ERCANOGLU, M., 2005. Landslide susceptibility assessment of SE Bartin (West Black Sea region, Turkey) by artificial neural networks, Natural Hazards and Earth System Sciences 5, 979–992.
ERCANOGLU, M. AND GOKCEOGLU, C., 2002. Assessment of landslide susceptibility for a landslide-prone area (north of Yenice, NW Turkye) by fuzzy approach. Environmental Geology 41, 720–730.
ERISMANN, T.H., 1986. Flowing, rolling, bouncing, sliding, synopsis of basic mechanisms. Acta Mechanica 64, 101–110.Ermini, L., Catani, F. and Casagli, N., 2005. Artificial neural networks applied to landslide susceptibility assessment, Geomorphology 66 (1–4), 327–343.
EVANS, S.G. AND HUNGR, O.,1993. The assessment of rockfall hazard at the base of talus slopes. Canadian Geotechnical Journal 30, 620–636.
FANNIN, R.J. AND WISE, M.P., 2001.An empirical–statistical model for debris flow travel distance, Canadian Geotechnical Journal 38, 982–994.
FELL, R., 1994. Landslide risk assessment and acceptable risk. Canadian Geotechnical Journal, 31(2): 261-272.
FELL, R., HO, K. K. S., LACASSE, S., AND LEROI, E., 2005. A framework for landslide risk assessment and management, in: Landslides Risk Management, edited by: Hungr, O., Fell, R., Couture, R., and Eberhardt, E., Taylor and Francis, London, 3–26.
FERNANDEZ, T., 2003. Methodology for Landslide Susceptibility Mapping by Means of a GIS. Application to the Contraviesa Area (Granada, Spain). Natural Hazards, 30 (3), 297 – 308.
FIORILLO, F., WILSON, R.C., 2004. Rainfall induced debris flows in pyroclastic deposits, Campania (Southern Italy). Engineering Geology, 75, 263- 289.
FIRDAINI, 2008. Land capability and landslide hazard assessment for landuse priority in Gintung watershed. Purworejo Regency, Central Java, Indonesia. Jogjakarta – Enschede, Gadjah Mada- ITC. Master.
FINLAY, P.J.,1996. The risk assessment of slopes. School of Civil Engineering, University of New South Wales, Australia, PhD thesis.
Key-note papers
BOZZOLO, D., PAMINI, R. AND HUTTER, K.,1986. Rockfall analysis —a mathematical model and its test with field data. Proceedings of the 5th International Symposium on Landslides in Lausanne. Balkema, Rotterdam, The Netherlands, pp. 555–560.
BRABB, E.E., PAMPEYAN, E.H., BONILLA, M.G., 1978. Landslide susceptibility in San Mateo County, California. US Geological Survey Miscellaneous Field Studies Map, MF-360, Map at 1: 62,500 scale.
BRABB, E.E., 1984. Inovative approaches to landslide hazard and risk mapping. Canadian Geotechnical Society I, 403-324.
BRABB, E., COLGAN, J.P. AND BEST, T.C., 1999. Map showing inventory and regional susceptibility for Holocene Debris Flows and related fast-moving landslides in the conterminous United States. MAP MF-2329. USGS.
BRAND, E. W., 1988. Landslide risk assessment in Hong Kong. In: Proceedings of the 5th International Symposium on Landslides (Lausanne, Switzerland), vol. 2, 1059-1074.
BUDETTA P., 2004. Assessment of rockfall risk along roads. Department of Geotechnical Engineering, Section of Applied Geology, University of Naples “Federico II” piazzale Tecchio, 80, Italy.
CAINE, N., 1980. The rainfall intensity duration control of shallow landslides and debris flow. Geografiska Annaler Series A Physical Geography, 62: 23-27.
CAINE, N.AND MOOL, P.K. 1982. Landslide in the Kolpu Khola drainage, middle mountains, Nepal. Mountain Research and Development 2 (2), 157-173.
CANNON, S. H. AND ELLEN, S. 1985: Rainfall conditions for abundant debris avalanches, San Francisco Bay Region, California,- California Geology, Vol. December 1985, Depatrment of Conservation, Division of Mines and Geology, p. 267–272, Sacramento.
CANUTI, P., FOCARDI, P., GARZONIO, C.A., 1985. Correlation between rainfall and landslides. Bull. Int. Assoc. Eng. Geol. 32, 49– 54.
CARRARA, A., CARRATELLI, E.P., MERENDA, L., 1977. Computer-based data bank and statistical analysis of slope instability phenomena. Zeitschrift für Geomorphologie 21, 187–222.
CARRARA, A. 1983: Multivariate models for landslide hazard evaluation. - Mathematical Geology, Vol. 15, Kluwer Academic Publishers, p. 403–426, Dordrecht.
CARRARA, A., CARDINALI, M., GUZZETTI, F., PASQUUI, V. AND REICHENBACH, P., 1991. GIS techniques and statistical models in evaluating landslide hazard. Journal Earth Surface Processes and Landform 16 (5), 427-445.
CARRARA, A., 1991. GIS techniques and statistical models in evaluating landslide hazard, Earth Surface Processes and Landforms, v. 16, p. 427-445.
CASTELLANOS, E. AND VAN WESTEN, C.J., 2003. Landslide Hazard Assessment Using The Heuristic Models. ITC, Enschede, The Netherland.
CASTELLANOS ABELLA, E.A. AND VAN WESTEN, C.J., 2005. Development of a system for landslide risk assessment for Cuba. In: Proceedings of the international conference on landslide risk management, 31 May - 3 June, 2005 Vancouver. / ed. by O. Hungr, R. Fell, R. Couture and E. Eberhardt. London, 1-10.
CASCINI, L., 2004. Risk assessment of fast landslide- from theory to practice. Department of Civil Engineering, University of Salerno, Italy.
CATANI, F., CASAGLI, N., ERMINI, L., RIGHINI, G. AND MENDUNI, G., 2005. Landslide hazard and risk mapping at catchment scale in the Arno River Basin, Landslides 2 (4), 329–343.
Anschrift der Verfasser / Authors’ addresses:
Mateja Jemec
Dimičeva ulica 14
SI – 1000 Ljubljana, Slovenia
Marko Komac
Dimičeva ulica 14
SI – 1000 Ljubljana, Slovenia
Literatur / References:
AGS, 2000.Landslide risk management concept and guidelines. Australian Geomechanics Society sub- committee on landslide risk management, Australian Geomechanics 35 (1), 44–92.
ALCANTARA-AYALA, I., 2004. Hazard assessment of rainfall-induced landsliding in Mexico. Geomorphology 61, 19– 40.
ANDERSON, L.R., BOWLES, D.S., PACK, R.T. AND KEATON, J.R., 1996. A risk based method for landslide mitigation. In: K. Senneset (Editor), VII International Symposium on Landslide. A.A.Balkema, Trondheim, Norway, 135-140.
ARORA, M.K., GUPTA, A.S.D. AND GUPTA, R.P., 2004. An artificial neural network approach for landslide hazard zonation in the Bhagirathi (Ganga) Valley, Himalayas, International Journal of Remote Sensing 25 (3), 559–572.
AZZONI, A., BARBERA, G.L., ZANINETTI, A., 1995.Analysis and prediction of rockfalls using a mathematical model. International J. Rock Mechanics and Mining Sci. 32, 709–724.
BARREDO, J.I., BENAVIDES, A., HERVAS, J., VAN WESTEN, C.J., 2000. Comparing heuristic landslide hazard assessment techniques using GIS in the Tirajana basin, Gran Canaria Island, Spain. International Journal of Applied Earth Observation and Geoinformation 2, 9 – 23.
BERGER, F., COROMINAS, J., LOPEZ-CARRERAS, C., BRAUNER, M., KIENHOLZ, H., GRASSL, H., 2002. ROCKFOR, Rockfall–Forest Interrelation, Efficiency of the Protective Function of Mountain Forest against Rockfall. Second Annual Report (CD); financed 84 M. Brauner et al. / Forest Ecology and Management 207 (2005) 75–85 by the European Commission (Quality of Life and Management of Living Resources, FP5).
BERTOLO, P. AND WIECZOREK, G.F., 2005. Calibration of numerical models for small debris flows in Yosemite Valley, California, USA. Natural Hazards and Earth System Sciences 5, 993–1001.
BLÖCHL, A. AND BRAUN, B. 2005. Economic assessment of landslide risks in the Swabian Alb, Germany—research framework and first results of homeowners’ and experts’ surveys. Nat Hazards Earth Syst Sci 5, 389–396.
BOMMER, J.J. AND RODRIGUEZ, C.E., 2002. Earthquake-induced landslides in Central America. Engineering Geology 63, 189– 220.
Seite
60
Seite
61
KOMAC, M., KUMELJ, Š. AND RIBIČIČ, M., 2010. Debris-flow susceptibility map of Slovenia 1:250,000. Ljubljana: Geological survey of Slovenia.
KO KO, C., FLENTJE, P. AND CHOWDHURY, R., 2004. Landslides qualitative hazard and risk assessment: method and its reliability, Bull. Eng. Geol. Env. 63 (2), 149–165.LAN, H. X., ZHOU, C. H., WANG, L. J., ZHANG, H. Y., LI, R. H., 2004. Landslide hazard spatial analysis and prediction using GIS in the Xiaojiang watershed, Yunnan, China, Engineering Geology, 76: 109–128.
LAPRADE, W.T., KIRKLAND, T.E., NASHEM, W.D., ROBERTSON, C.A., 2000. Seattle landslide study. Shannon & Wilson, Inc. Internal Report W-7992–01.
LATELTIN, O., 1997. Berücksichtigung der Massenbewegungsgefahren bei raumwirksamen Tätigkeiten. Empfehlungen 1997. Swiss Federal Office for Water and Geology (FOWG).http://www.bwg.admin.ch/themen/natur/e/index.htm
LEE, E.M. AND JONES, D.K.C., 2004. Landslide risk assessment. Thomas Telford, London, 454 pp.
LEE, S. AND J. CHOI, 2004. Slide susceptibility mapping using GIS and Weight of evidence model. Geogr. Inform. Sci., 188: 789-814.
LEE, S., 2007. Application and verification of fuzzy algebraic operators to landslide susceptibility mapping, Environmental Geology 52, 615–623.
LEE, S. AND EVANGELISTA, D.G., 2006. Earthquake-induced landslide-susceptibility mapping using an artificial neural network, Natural Hazards and Earth System Sciences 6, 687–695.
LEE, S., RYU, J.H., LEE, M.J. AND WON, J.S., 2003a. Use of artificial neural network for analysis of the susceptibility to landslides at Boun, Korea. Environmental Geology 44, 820-833.
LEE, S., RYU, J.H., MIN, K. AND WON, J.S., 2003b. Landslide susceptibility analysis using GIS and artificial neural network. Earth surface processes and landforms 28, 1361-1376.
LEE, S., RYU, J.H., WON, J.S. AND PARK, H.J., 2004. Determination and application of the weights for landslide susceptibility mapping using artificial network. Engineering Geology, 71(3-4), 289-302.
LEONE, F., AST´E, J. P., AND LEROI, E., 1996. Vulnerability assessment of elements exposed to mass movements: working toward a better risk perception, in: Landslides, Glissements de terrain, Proceed. VII Int. Sym. Landslides, Trondheim, edited by: Senneset, K., Rotterdam, 263–270.
LIDA, T., 1999. A stochastic hydro-geomorphological model for shallow landsliding due to rainstorm. Catena 34 (3-4), 293-313.
LU, P. R., 2003. Artificial neural networks and grey systems for the prediction of slope instability. Natural Hazards 30(3),383–398.
LUCKMAN, B.H., FISKE, C.J., 1995. Estimating long-term rockfall accretion rates by lichenometry. In: Slaymaker, O. (Ed.), Steepland Geomorphology. Wiley, Chichester, UK, pp. 233–255.
LUI, Y., GUO, H.C., ZOU, R. AND WANG, L.J., 2006. Neural network modelling for regional hazard assessment of debris flow in Lake Qionghai Watershed, China, Environmental Geology 49, 968–976.
MCCARROLL, D., SHAKESBY, R.A., MATTHEWS, J.S., 1998. Spatial and temporal patterns of Late Holocene rockfall activity on a Norwegian talus slope: lichenometry and simulation-modelling approach. Arctic and Alpine Res. 30, 51–60.
MALET, J.-P., LAIGLE, D., REMAITRE, A., MAQUAIRE, O., 2005. Triggering conditions and mobility of debris flows associated to complex earth flows. Geomorphology 66, 215–235.
MAGLIULO, P., DI LISIO, A., RUSSO, F. AND ZELANO, A., 2008. Geomorphology and landslide susceptibility assessment using GIS and bivariate statistics: a case study in southern Italy. Springer Science. Natural Hazard 47, 411-435.
MARZORATI, S., LUZI, L., DE AMICIS, M., 2002. Rock falls induced by earthquakes: a statistical approach. Soil Dynamics and Earthquake Engineering 22 (7), 565–577.
MATSUOKA, N., SAKAI, H., 1999. Rockfall activity from an alpine cliff during thawing periods. Geomorphology 28, 309–328.
MATSUOKA, N., 2006. Frost wedging and rockfalls on high mountain rock slopes: 11 years of observations in the Swiss Alps. Geophysical Res. Abstracts 8, 05344.
MAZENGARB, C., 2004. Map 3, Hobart - Potential Debris- Flow Hazard. Tasmanian Landslide Hazard Series. Mineral Resources Tasmania, Department of Infrastructure Energy and Resources, Hobart.
MEJÍA-NAVARRO, M., WOHL, E.E. AND OAKS, S.D., 1994. Geological hazard, vulnerability, and risk assessment using GIS: model for Glenwood Springs, Colorado, Geomorphology 10, 331–354.
MELCHIORRE, C., MATTEUCCI, M. AND REMONDO, J., 2006. Artificial neural network and robustness analysis in landslide susceptibility zonation. International Joint Conference on Neural Networks, July 16-21, Vancouver, BC, Canada, 8808-8814.
MELCHIORRE, C., MATTEUCCI, M., AZZONI, A. AND ZANCHI, A., 2008. Artificial neural networks and cluster analysis in landslide susceptibility zonation, Geomorphology 94, 379–400.
MILLER, D. J. AND BURNETT, K. M., 2008. A probabilistic model of debris-flow delivery to stream channels, demonstrated for the Coast Range of Oregon, USA, Geomorphology, 94:184-205.
MISKA, L. AND JAN, H., 2005. Evaluation of current statistical approaches for predictive geomorphological mapping. Geomorphology 67 (3-4), 299-315.
MONTGOMERY, D. R. AND DIETRICH, W. E., 1994. A physically based model for the topografic control on shallow landsliding.- Water resources research, Vol. 30/4, American Geophysical Union, p. 1153–1171, Washington.
MONTGOMERY, D. R., SCHMIDT, K. M., GREENBERG, H. M. AND DIETRICH, W. E., 2000. Forest clearing and regional sliding. Geology, Vol. 28/4, The Geologic Society of America, p. 311–314, Boulder.
MONTGOMERY, D. R., SULLIVAN, K. AND GREENBERG, H. M., 1998. Reginal test of a model for shallow landsliding. Hydrological Processes, Vol 12, John Wiley & Sons, Ltd., p. 943–955, New York.
MORGAN, G.C., 1992. Quantification of risks from slope hazards. Open file report No 1992-15, Geological Survey of Canada, Canada.
MWASI, B., 2001. Land use conflicts resolution in a fragile ecosystem using Multi-Criteria Evaluation (MCE) and a GIS-based Decision Support System (DSS). Int. Conf. on Spatial Information for Sustainable Development, Nairobi, Kenya, FIG — International Federation of Surveyors. 11 pp.
NaDIM, F., KJEKSTAD, O., DOMAAS, U., RAFAT, R. AND PEDUZZI, P. 2006. Global landslide risk case study. In: Arnold M, Chen R.S., Deichemann U, Dilley M (eds) Natural disaster hotspots. Case studies. The World Bank, Washington, DC, p 204
NEAUPANE, K.M. AND ACHET, S.H., 2004. Use of backpropagation neural network for landslide monitoring: a case study in the higher Himalaya, Engineering Geology 74 (3–4), 213–226.
Key-note papers
HORTON, R.E., 1945. Erosional development of streams and their drainage basins: hydro physical approach to quantitative morphology, Bull. Geol. Soc. Am. 56 (1945), pp. 275–370.
HUNGR, O. AND EVANS, S.G., 1988. Engineering evaluation of fragmental rockfall hazards. Proceedings of the 5th International Symposium on Landslides in Lausanne. The Netherlands, Balkema, Rotterdam, pp. 685–690.
HUNGR, O., 1995. A model for the runout analysis of rapid flow slides, debris flows and mavalanches, Canadian Geotechnical Journal 32, 610–623.
HUNGR, O., COROMINAS, J., EBERHARDT, E., 2005. Estimating landslide motion mechanism, travel distance and velocity. In: Hungr, O., Fell, R., Couture, R., Eberhardt, E. (Eds.), Landslide Risk Management. Taylor & Francis Group, Vancouver, pp. 99–128.
HUNTER, G. AND FELL, R., 2003. Travel distance angle for "rapid" landslides in constructed and natural soil slopes, Canadian Geotechnical Journal 40, 1123–1141.
IADB, 2005. Indicators of disaster risk and risk management. Summary report for WCDR, Inter-American Development Bank (IADB), Manizales, Colombia.
ISSMGE TC32- TECGNICAL COMMITTEE ON RISK ASSESSMENT AND MANAGEMENT, 2004. Glossary of Risk Assessment Terms- Version 1, July 2004, pp.7.
IVERSON, R.M., REID, M.E., LAHUSEN, R.G., 1997. Debris-flow mobilization from landslides. Annu. Rev. Planet Sci. 25, 85– 138.
JAKOB, M. AND WEATHERLY, H. 2003. A hydroclimatic threshold for landslide initiation on the North Shore Mountains of Vancouver, British Columbia. Geomorphology, 54, 137-156.
JAKOB, M., HOLM, K., LANGE,O. AND SCHWAB, J.W., 2006. Hydrometeorological thresholds for landslide initiation and forest operation shutdowns on the north coast of British Columbia. Landslides 3, 228-238.
JOHNSON, A.M., 1970. Physical Processes in Geology. W.H. Freeman, 557 p.
JTC-1 JOINT TECHNICAL COMMITTEE ON LANDSLIDES AND ENGINEERED SLOPES, 2008. Guidelines for landslide susceptibility, hazard and risk zoning, for land use planning. Engineering Geology 103, 85–98.
KANUNGO, D.P., ARORA, M.K., SARKAR, S. AND GUPTA, R.P., 2006. A comparative study of conventional, ANN black box, fuzzy and combined neural and fuzzy weighting procedures for landslide susceptibility zonation in Darjeeling Himalayas. Engineering Geology 85, 347– 366.
KEEFER, DK, 2000. Statistical analysis of an earthquake-induced landslide distribution — the 1989 Loma Prieta, California event. Engineering Geology 58:231-249.
KHAZAI, B., SITAR, N., 2004. Evaluation of factors controlling earthquake-induced landslides caused by Chi-Chi earthquake and comparison with the Northridge and Loma Prieta events. Engineering Geology 71, 79–95.
KIRKBY, M.J. AND STATHAM, I., 1975. Surface stone movement and scree formation. Journal of Geology 83, 349– 362.
KOIRALA, N.P. AND WATKINS, A.T., 1988. Bulk appraisal of slopes in Hong Kong. In Landslides, Proc. Of the Fifth Int. Symp. on Landslide, (Ed. C. Bonnard), Lausanne, Switzerland. A.A. Balkema, Rotterdam, The Netherlands, 2, 1181-1186.
KOMAC, M., 2006. A landslide susceptibility model using the analytical hierarchy process method and multivariate statistics in perialpine Slovenia. Geomorphology 74, 17-28.
KOMAC, M., AND RIBIČIČ, M., 2008. Landslide susceptibility map of Slovenia 1:250.000. Geological Survey of Slovenia, Ljubljana.
FINLAY, P.J., FELL, R., MAGUIRE, P.K., 1997. The relationship between the probability of landslide occurrence and rainfall. Can. Geotech. J. 34, 811– 824.
FINLAY, P.J., MOSTYN, G.R. AND FELL, R., 1999. Landslide Risk Assessment: prediction of travel distance. Canadian Geotechnical Journal, 36: 556-562.
GARDNER, J.S., 1983. Rockfall frequency and distribution in the Highwood Pass area, Canadian Rocky Mountains. Zeitschrift für Geomorphologie N.F. 27, 311–324.
GIANNECCHINI, R., 2006. Relationship between rainfall and shallow landslides in the southern Apuan Alps (Italy). Natural Hazards Earth System Science 6, 357–364.
GLADE, T., 2000. Modelling landslides: triggering rainfall thresholds at a range of complexities. Proceedings of the 8th int. symp. On landslides held in Cardiff on 26–30 June, Landslides in Research, Theory and Practice, vol. 2, pp. 633– 640.
GLADE, T., ANDERSON, M. AND CROZIER, M.J., 2005. Landslide Hazard and Risk. JohnWiley & Sons, Ltd., Chichester, Eangland, 802 pp.
GOMEZ, H.T. AND KAVZOGLU, T., 2005. Assessment of shallow landslide susceptibility using artificial neural networks in Jabonosa River Basin, Venezuela, Engineering Geology 78 (1-2), 11–27.
GOVI, M., MORTARA, G., AND SORZANA, P. F., 1985.Eventi idrologici e frane, Geol. Appl. e Idrog., 20(2), 359–375.
GORSEVSKI, P. V., GESSLER, P. AND FOLTZ, R. B., 2000. Spatial prediction of Landslide hazard using logistic regression and GIS.- 4th International Conference on Integrating GIS and Environmental Modeling (GIS/EM4): Problems, Prospect and Research Needs, Banff, Alberta.
GRUBER, S., HOELZLE, M., HAEBERLI, W., 2004. Permafrost thaw and destabilization of Alpine rock walls in the hot summer of 2003. Geophyiscal Res. Lett. 31, L13504.
GUINAU, M., VILAJOSANA, I., VILAPLANA, J. M., 2007. Gis-based debris flow source and runout susceptibility assessment from DEM data – a case study in NW Nicaragua, Natural Hazards and Earth System Sciences, 7: 703-716.
GUZZETTI, F., 2000.Landslide fatalities and the evaluation of landslide risk in Italy. Engineering Geology 58(2), 89–107.
GUZZETTI, F., PERUCCACI, S., ROSSI, M. AND STARK, C.P., 2007. Rainfall thresholds for the initiation of landslides in central and southern Europe. Meteorol. Atmos. Phys. 98, 239-267.
GUZZETTI, F., CROSTA, G., DETTI, R., AGLIARDI, F., 2002. STONE: a computer program for the three-dimensional simulation of rock-falls. Computers & Geosciences 28 (9), 1079–1093.
GUZZETTI F., CARDINALI M., REICHENBACH P., CIPOLLA F., SEBASTIANI C., GALLI M., SALVATI P., 2004. Landslides triggered by the 23 November 2000 rainfall event in the Imperia Province, Western Liguria, Italy, Engineering Geology 73, 229–245.
GUZZETTI F., GALLI M., REICHENBACH P., ARDIZZONE F. AND CARDINALI M., 2006. Landslide hazard assessment in the Collazzone area, Umbria, Central Italy. Natural Hazards and Earth System Sciences, 6, 115–131.
HARP, E.L., WILSON, R.C., 1995. Shaking intensity thresholds for rock falls and slides: Evidence from 1987 Whittier Narrows and Superstition Hills earthquake strongmotion records. Bulletin of the Seismological Soci. of America 85 (6), 1739–1757.
HOLLENSTEIN, K., 2005.Reconsidering the risk assessment concept: Standardizing the impact description as a building block for vulnerability assessment, Nat. Hazards Earth Syst. Sci., 5, 301–307. http://www.nat-hazards-earth-syst-sci.net/5/301/2005/.
Seite
62
Seite
63
VAN ASCH, T. W. J., VAN BEEK, L.P.H. AND BOGAARD, T.A., 2007b. problems in predicting the mobility of slow mowing landslides. Engineering Geology, 91 (1), 55-46.
VAN WESTEN, C.J., 1993. Remote Sensing and Geographic Information System for Geological Hazard Mitigation. ITC-Journal, 4: 393-399.
VAN WESTEN, C.J. AND TERLIEN, M.T.J., 1996. An approach towards deterministic landslide hazard analaysis in GIS. A case study form manizales (Colombia). Earth surface processes and landforms 21, 853-868.
VAN WESTEN, C.J., 2002. Hazard, vulnerability and risk analysis. ITC.
VAN WESTEN, C.J., RENGERS, N. AND SOETERS, R., 2003. Use of geomorphological information in indirect landslide susceptibility assessment. Natural Hazards, 30(3): 399-419.
VAN WESTEN, C.J., 2004. Geo-infromation tools for landslide risk assessment: an overwiev of development. In: W.A. Lacerda, M. Ehrlich, S. Fontoura and A. Sayao (Editors), Proc 9th International Symposium on Landslides. Landslides: Evaluation and Stabilization. ISL 04. Balkema, Taylor & Francis Group, Rio de Janeiro, pp. 39-56.
VAN WESTEN, C.J., CASTELLANOS ABELLA, E.A. AND SEKHAR, L.K., 2008. Spatial data for landslide susceptibility, hazards and vulnerability assessment : an overview. In: Engineering geology, 102 (3-4), 112-131.
VARNES, D.J., 1978. Slope movement types and processes. In: Schuster R.L., Krizek R. J. (Editors), Landslides, analysis and control. Transportation Research Board, Special Report No. 176, National Academy of Sciences, pp. 11-33.
VARNES, D.J. AND IAEG, 1984. Landslide Hazard Zonation: a rewiev of principles and practise. UNESCO, Darantiere, Paris, 61 pp.
WALKER, B.F., 2002.Response to discussin by G. Powell. Australian Geomechanics 35 (3), 111-113.
WANG, F.W., SASSA, K. AND WANG, G., 2002. Mechanism of a long runout landslide triggered by the August 1998 heavy rainfall in Fukushima Prefecture, Japan. Engineering Geology, 63 (1-2), 169- 185.
WANG, H.B. AND SASSA, K., 2006. Rainfall-induced landslide hazard assessment using artificial neural networks. Earth Surface Processes and Landforms, 31(2):235-247.
WANG, H.B., XU, W.Y. AND XU, R.C., 2005, Slope stability evaluation using Back Propagation Neural Networks. Engineering Geology, 80 (3-4), 302-315.
WEN, B. P. AND AYDIN, A., 2005. Mechanism of a rainfall-induced slide-debris flow: constraints from microstructure of its slip zone, Engineering Geology, 78: 69–88.
WHITMAN, R.V., 1984, Evaluating calculated risk in geotechnical engineering. ASCE Journal of Geotechnical Engineering, 110(2), 145-188.
WIECZOREK, G.F., 1984.Preparing a detailed landslide inventory map for hazard evaluation and reduction. Bulletin of the Association of Engineering Geologists, XXI (3): 337-342.
WIECZOREK, G. F. AND SARMIENTO, J., 1983. Significance of storm intensity-duration for triggering of debris flows near La Honda, California.- Geological Society of America, Abstracts with Programs, Vol. 15, No. 5, Geological Society of America, p. 289, Boulder.
WU, T.H., TANG, W.H. AND EINSTEIN, H.H., 1996. Landslide hazard and risk assessment. In: A.K. Turner and R.L. Schuster (Editors), Landslide Investigation and Mitigation, Transportation Research Board, National Research Council, pp. 106-128.
WU, C.H. AND CHEN, S.C.,2009. Determining landslide susceptibility in Central Taiwan from rainfall and six site factors using the analytical hierarchy process method. Geomorphology 112, 190-204.
YESILNACAR, E. AND TOPAL, T., 2005. Landslide susceptibility mapping: a comparison of logistic regression and neural networks method in a medium scale study, Hendek region (Turkey). Engineering Geology 79, 251–266.
YOUSSEF, A.M., PRADHAN, B., GABER, A.F.D. AND BUCHROITHNER, M.F., 2009. Geomorphological hazard analysis along the Egyptian red sea coast between Safaga and Quseir, Natural Hazards and Earth System Sciences 9, 751–766.
ZAITCHIK, B.F., ES, H.M. AND SULLIVAN, P.J., 2003. Modelling Slope Stability in Honduras: Parameter sensitivity and Scale of Aggregation. Soil Science Society of American Journal 67, 268 -278.
ZEZERE, J. L., TRIGO, R. M., AND TRIGO, I. F., 2005. Shallow and deep landslides induced by rainfall in the Lisbon region (Portugal): assessment of relationships with the North Atlantic Oscillation, Natural Hazards Earth Syst. Sci., 5, 331–344.
ZHOU, G., ESAKI, T., MITANI, Y., XIE, M., MORI, J., 2003. Spatial probabilistic modeling of slope failure using an integrated GIS Monte Carlo simulation approach, Engineering Geology, 68: 373–386.
ZINGGERLE, A., 1989. Steinschlagsimulation in Gebirgswa¨ldern: Modellierung der relevanten Teilprozesse. Diploma Thesis, Department of Geography, University of Berne.
Key-note papers
RITCHIE, A.M., 1963. Evaluation of rockfall and its control. Washington, DC: Highway Research Board, National Research Council, Highway Research Record 17, pp.13–28.
RUFF, M. AND CZURDA, K., 2007. Landslide susceptibility analysis with a heuristic approach in the Eastern Alps, Vorarlberg, Austria. Geomorphology 94, 314-324.
RUMELHART, D.E., HINTON, G.E. AND WILLIAMS, R.J., 1986. Learning representations by back-propagating errors, Nature 323, 533–536.
SAATY, T.L., 1977. A scaling method for priorities in hierarchical structures. Journal of Mathematical Psychology 15, 234– 281.
SAATY, T.L. AND VARGAS, L.G., 2001. Models, methods, concepts and applications of the analytic hierarchy process. Kluwer Academic Publishers, 333 pp.
SAHA, A.K., GUPTA, R.P., SARKAR, I., ARORA, M.K. AND CSAPLOVICS, E., 2005.An approach for GIS based statistical landslide susceptibility zonation-with a case study in the Himalayas. Springer-Verlag.
SALDIVAR-SALI, A. AND EINSTEIN, H.H., 2007. A landslide risk rating system for Baguio. Philippines. Engineering Geology 91 (2-4), 85-99.
SASS, O., 2005. Temporal variability of rockfall in the Bavarian Alps, Germany. Arctic, Antarctic, and Alpine Res. 37 (4), 564–573.
SCHMIDT, J. AND DIKAU, R., 2004. Modelling historical climate variability and slope stability. Geomorphology 60 (3-4), 433-447.
SIRANGELO, B. AND BRACA, G., 2004. Identification of hazard conditions for mudflow occurrence by hydrological model. Application of FLaIR model to Sarno warning system, Engineering Geology 73, 267–276.
SOETERS, R. AND VAN WESTEN, C.J., 1996. Slope Instability. Recognition, analysis and zonation. In: A.K. Turner and R.L. Schuster (Editors), Landslide: Investigations and Mitigation. Special Report 247. Transportation Research Board. National Research Council. National Academy Press., Washington, D.C, pp. 129-177.
STATHAM, I. AND FRANCIS, S.C., 1986. Influence of scree accumulation and weathering on the development of steep mountain slopes. In: Abrahams, A.D. (Ed.), Hillslope Processes. Allen and Unwin, Winchester, pp. 245– 267.
STOFFEL, M., WEHRLI, A., KÜHNE, R., DORREN, L.K.A., PERRET, S., KIENHOLZ, H., 2006. Assessing the protective effect of mountain forests against rockfall using a 3D simulation model. Forest Ecol. Management 225, 113–122.
SUZEN, M.L. AND DOYURAN, V., 2004. A comparison of the GIS based landslide susceptibility assessment methods: multivariate versus bivariate, Environmental Geology, 45, 665-679.TERLIEN, M.T.J., VAN WESTEN, C.J. AND ASCH, T.W.J., 1995. Deterministic modelling in GIS based landslide hazard assessment. In: A. Carrara and F. Guzzetti (Editors), Geographical Information Systems in Assessing Natural Hazards. Kluwer Academic Publishers, Netherlands, pp. 57-77.
VAN ASCH, T.W.J., BUMA, J. AND VAN BEEK, L.P.H., 1999. A view on some hydrological triggering system in landslides. Geomorphology, 30(1-2), 25-32.
VAN ASCH, T. W. J., MALET, J.-P., AND VAN BEEK, L. P. H., 2006.Influence of landslide geometry and kinematic deformation to describe the liquefaction of landslides: some theoretical considerations, Engineering Geology 88 (1–2), 59–69.
VAN ASCH, T. W. J., MALET, J.P., VAN BEEK, L.P.H. AND AMITRANO, D., 2007a.Techniques, issues and advances in numerical modelling of landslide hazard. Bulletin de la Societe Geologique de France, 178 (2), 65-88.
NEFESLIOGLU, H.A., GOKCEOGLU, C. AND SONMEZ, H., 2008. An assessment on the use of logistic regression and artificial neural networks with different sampling strategies for the preparation of landslide susceptibility maps. Engineering Geology 97, 171–191.
NEUHÄUSER, B. AND TERHORST, G., 2007. Landslide susceptibility assessment using “weights-ofevidence” applied to a study area at the Jurassic escarpment (SW-Germany). Geomorphology 86, 12–24.
NEULAND, H. A., 1976. A prediction model of landslips. Catena, Vol. 3, Elsevier Science B.V., p. 215–230, Amsterdam.
NIE, H.F., DIAO, S.J., LIU, J.X., HUANG, H., 2001.The application of remote sensing technique and AHP-fuzzy method in comprehensive analysis and assessment for regional stability of Chongqing City, China. Proc. of the 22nd Asian Conf. on Remote Sensing, Vol. 1, Centre for Remote Imaging, Sensing and Processing (CRISP), National University of Singapore, Singapore Institute of Sorveyors and Valuers (SISV) and Asian Association on Remote Sensing (AARS), Singapore, pp. 660–665.
OKURA, Y., KITAHARA, H., SAMMORI, T., KAWANAMI, A., 2000. The effects of rockfall volume on runout distance. Engineering Geology 58, 109– 124.
PIKE, R. J., 1988. The geometric signature: Quantifying landslide-terrain types from digital elevation models. - Mathematical Geology, Vol. 20, Kluwer Academic Publishers, p. 491–511, Dordrecht.
PIRULLI, M., BRISTEAU, M. O., MANGENEY, A., AND SCAVIA, C., 2007. The effect of earth pressure coefficient on the runout of granular material, Environ. Modell. Softw., 22(10), 1437–1454.
POWELL, G., 2000. Discussion “Landslide Risk Management Concepts And Guidelines”. Australian Geomechanics, Volume 35, No 1, 49-52.
POZZONI, M., AMBROSI, C., SALVETTI, A., THÜRING, M., GERMANN-CHIARI, C., 2009. Conceptual debris flow modeling for risk assessment at the municipal scale, SUPSI, Manno. (www.ist.supsi.ch/Content/main/uploaded/img/progetti/dfwalk_big.pdf, 12. 1. 2009)
PRADHAN, B. AND LEE, S., 2007. Utilization of optical remote sensing data and GIS tools for regional landslide hazard analysis by using an artificial neural network model, Earth Science Frontier 14 (6), 143–152.
PRADHAN, B. AND LEE, S., 2009a. Delineation of landslide hazard areas on Penang Island, Malaysia, by using frequency ratio, logistic regression, and artificial neural network model, Environmental Earth Sciences.
PRADHAN, B. AND LEE, S., 2009c. Regional landslide susceptibility analysis using back-propagation neural network model at Cameron Highland, Malaysia, Landslides.
PRADHAN, B. AND LEE, S., 2009b. Landslide risk analysis using artificial neural network model focusing on different training sites, International Journal of Physical Sciences 4 (1), 1–15.
PRADHAN, B., LEE, S. AND BUCHROITHNER, M.F., 2009. Use of geospatial data for the development of fuzzy algebraic operators to landslide hazard mapping: a case study in Malaysia, Applied Geomatics 1, 3–15.
R2 RESOURCE CONSULTANTS, 2005. Upper Nehalem Watershed Analysis. Oregon Department of Forestry (Salem) 1–231.
RAGOZIN, A.L., 1996. Modern problems and quantitative methods of landslide risk assessment. Senneset K (Ed.) Landslides - Gliessements de Terrain. Rotterdam, A.A. Balkema. 1:339-44.
RAGOZIN, A.L. AND TIKHVINSKY, I.O., 2000. Landslide hazard, vulnerability and risk assessment, 8th International symposium on landslides. Thomas Telford, Cardiff, Wales.
Seite
64
Seite
65
Both provisions were classified as binding and
directly applicable.5
In addition, the “Mountain Forests
Protocol”6 aims to preserve and, whenever
necessary, to develop or increase mountain forests
as a near-natural habitat (art. 1.1) and imposes the
duty of the Contracting Parties to give priority to the
protective function of mountain forests (art. 6.1).
The “Spatial Planning and Sustainable
Development Protocol“7 establishes the obligation
to determine the areas subject to natural hazards,
where building of structures and installations
should be avoided as much as possible (art.
9.2.e). The spatial planning policies also take
into account the protection of the environment,
in particular with regard to the protection against
natural hazards (art. 3.f).
2.2. Findings
In international law, only certain provisions
established in the protocols to the Alpine
Convention refer to the obligation to map
geological hazards. But farther-reaching,
additional substantive elaborations arising out of
these duties are not revealed before the respective
national implementation measures.
3. European law
3.1. Soil protection law
The communication from the European
Commission in 2002 about a Strategy for Soil
Protection8 aims at the further development of
1. Introduction
A glance at the legal framework on assessment
and mapping of geological hazards1 is difficult.
No coherent legal system on the
management of natural disasters can be found at
either the international or European level. Also, a
legal fragmentation can be detected at a national
level. Therefore, the art is to filter something like
a legal essence out of diverse dispersed norms,
which are often only partly related to this topic
and follow different legal approaches.2 This will
be the attempt in the following sections. Naturally,
the essay will not exceed a more or less abundant
outline of the issue.
2. International law
2.1. Alpine Convention
The Alpine Convention3 and its protocols
are the only source of international law. The
“Soil Conservation Protocol”4 provides for the
obligation to draw up maps of Alpine areas “which
are endangered by geological, hydrogeological
and hydrological risks, in particular by land
movement (mass slides, mudslides, landslides),
avalanches and floods”, and to register those areas
and to designate danger zones when necessary
(art. 10.1).
Likewise, areas damaged by erosion and
land movement shall be rehabilitated in as far
as this is necessary for the protection of human
beings and material goods (art. 11.2).
1 For the “Natural hazards profile“ of landslips, rock fall, ava-lanches and landslides, see RUDOLF-MIKLAU, Naturgefahren-Management in Österreich (2009), p. 21 et seq.2 For an overview regarding norms of prevention, see RUDOLF-MIKLAU (fn. 1), p. 97 et seq.3 BGBl. 1995/477.4 BGBl. III 2002/235.
5 BMLFUW (ed.), Die Alpenkonvention: Handbuch für ihre Umsetzung (2007), p. 112. Implementation analysis by SCHMID, Das Natur- und Bodenschutzrecht der Alpenkon-vention. Anwendungsmöglichkeiten und Beispiele, in: CIPRA Österreich (ed.), Die Alpenkonvention und ihre rechtliche Umsetzung in Österreich – Stand 2009, Tagungsband der Jahrestagung von CIPRA Österreich, 21.-22.Oktober 2009, Salzburg (2010), p. 33 et seq.6 BGBl. III 2002/233.7 BGBl. III 2002/232..
Legal Framework for Assessment and Mapping of Geological Hazards on the International, European and National Levels
Rechtlicher Rahmen für Analyse und Kartierung geologischer Gefahren auf internationaler, europäischer und nationaler Ebene
Summary:Legal standards for the assessment and mapping of geological hazards are rather scarce at the international and European level. Certain protocols to the Alpine Convention provide for the obligation to map geological hazards, but they fail to adopt substantive standards for it. At a European level, standards such as those for priority areas are only provided for in drafts such as the proposal for a Directive establishing a framework for the protection of soil or are mentioned in the Communication on the Community approach to prevent natural disasters. At a national level, there are legal provisions in connection with preventive planning on natural disasters, although the general problem on the coexistence of multiple area-related definitions persists. The extensive exposition of hazards in forestry law remains a central is-sue. The sources and materials encountered to this end are, however, not enough to derivate consistent standards and provisions for the assessment and mapping.
Zusammenfassung:Rechtliche Vorgaben betreffend Analyse und Kartierung geologischer Gefahren sind sowohl auf internationaler als auch europäischer Ebene selten. Bestimmte Protokolle zur Alpenkon-vention sehen Kartierungspflichten für geologische Risiken vor, ohne allerdings materielle Vorgaben zu treffen. Im Europarecht finden sich solche Regeln lediglich in Entwürfen wie bei den prioritären Gebieten im Vorschlag einer EU-Bodenrahmenrichtlinie oder sie werden wie im Gemeinschaftskonzept zur Verhütung von Naturkatastrophen erst in Aussicht gestellt. Auf nationaler Ebene bestehen in der Regel Rechtsvorschriften im Zusammenhang mit präventiven Planungen bei Naturgefahren, wenngleich das allgemeine Problem des Neben-einanders von mehreren gebietsbezogenen Festlegungen besteht. Als zentrale Vorschriften gelten die flächenhaften Gefahrendarstellungen im Forstrecht. Das vorgefundene Material reicht jedenfalls nicht aus, um einheitliche Standards und Vorgaben für Analyse und Kartie-rung ableiten zu können.
ROLAND NORER
Key-note papers
Seite
66
Seite
67
3.4. Spatial planning law
Regarding the quantitative aspects of soil
protection, a separate communication on the
topic of “Planning and Environment – the
Territorial Dimension” has been announced for a
some time now. This communication should deal
with rational land-use planning, as addressed by
the Sixth Environment Action Programme.22 The
announced content, however, does not refer to a
special relevance for the prevention of landslides.
Hence, at present the only object of an integrated
and sustainable management at the EU level is
the flood prevention programme in transnational
river areas included in the European Spatial
Development Perspective (ESDP).23
3.5. Disaster law
The Communication of the European Commission
of February 200924 was another attempt to
establish measures, based on the already existing
instruments, for a Community approach on the
prevention of natural and man-made disasters.
Three key elements were mentioned for
the Community approach: creating the conditions
for the development of knowledge based disaster
prevention policies at all levels of government,
linking the actors and policies throughout the
disaster management cycle and making existing
instruments perform better for disaster prevention.
In particular, the subsection “Developing
guidelines on hazard/risk mapping” (3.1.3) is
of great interest. Here, the Commission tries
to collect and unify information about hazard/
risks by developing Community guidelines for
hazard and risk mapping, building upon existing
Community initiatives. However, these should
focus on disasters with potential cross-border
impact, exceptional events, large-scale disasters,
and disasters for which the cost of recovery
measures appears to be disproportionate when
compared to that of preventive measures. Also, a
more efficient targeting of Community funding25
is dealt with (3.3.1) by establishing an inventory
of existing Community instruments capable
of supporting disaster prevention activities, as
well as by developing a catalogue of prevention
measures (e.g. measures integrating preventive
action in reforestation/afforestation projects).
Furthermore, a Council Decision
establishing a Community Civil Protection
Mechanism25 deals with assistance intervention
in the event of major emergencies, or the
imminent threat thereof. However, a regulation
on geological mass movements similar to the EU
Directive on the assessment and management of
flood risks27, with its flood hazard maps and flood
risk maps, does not currently exist.
3.6. Findings
Some relevant regulations can be found at the
European level. However, only one of them, Cross
Compliance, is in force and affects the topic dealt
with in this essay in a rather marginal way. By
contrast, the Proposal for a Directive establishing
a Framework for the Protection of Soil, which has
been put on hold, contemplates the designation
of landslide risk areas and the establishment of
Key-note papers
22 Towards a Thematic Strategy for Soil Protection (fn. 8), Sec-tion 2.1, 6.1.; REISCHAUER, Bodenschutzrecht, in: Norer (ed.), Handbuch des Agrarrechts (2005), p. 491.23 European Commission (ed.), ESDP European Spatial Development Perspective. Towards Balanced and Sustainable Development of the Territory of the European Union (1999), Section 146.24 Communication from the Commission to the European Parliament, the Council, the European Economic ad Social Committee and the Committee of the Regions. A Community approach on the prevention of natural and man-made disasters, COM(2009) 82 final, 23.02.2009.
25 Especially the European Agricultural Fund for Rural De-velopment, the Civil Protection Financial Instrument, LIFE+, the ICT Policy Support Programme, the Research Framework Programme.26 Council Decision 2007/779/EC of 8 November 2007, OJ 2007 L 314/9.27 Directive 2007/60/EC on the assessment and management of flood risks, OJ 2007 L 288/27.
In particular, the EU Directive establishing a
Framework for the Protection of Soil turned out
to be fiercely disputed.16 Since 2007, after an
attenuated version failed to obtain the majority
in the EU Environment Council, the future of this
proposal remains uncertain.
3.2. Environmental law
In the remaining European environmental laws,
certain provisions about erosion can be found.17
However, there are no further provisions dealing
with the topic of this essay.
3.3. Agricultural law
The situation is rather similar in the area of
European agricultural law. Different standards
are included in the general provisions on direct
payments (cross compliance)18, in which there is
an obligation to maintain all agricultural land in
good agricultural and environmental condition,
such as those regarding soil erosion.19 In contrast,
the regulation on support for rural development20
includes in its Axis 2 some links with supporting
measures, such as afforestation (cf. art. 50.6).21
political commitment to soil protection in order
to achieve a more comprehensive and systematic
protection. As soil formation is an extremely slow
process, soil can essentially be considered as a
non-renewable resource.9 It proceeds to mention
eight main threats to soil in the EU10, including
“erosion” and “floods and landslides”. These are
intimately related to soil and land management.
“Floods and mass movements of soil cause
erosion, pollution with sediments and loss of soil
resources with major impacts for human activities
and human lives, damage to buildings and
infrastructures, and loss of agricultural land”.11
In 2006, the European Commission followed
suit with a Thematic Strategy for Soil Protection12
and with a Proposal for a Directive establishing
a framework for the protection of soil13, the latter
of which provides in its art. 6 for priority areas
(first draft: risk areas) with regard to landslides.
The addendum landslides “brought about by the
down-slope, moderately rapid to rapid movement
of masses of soil and rock material” fell victim to
the changes made by the European Parliament.14
Also, a programme of measures shall be adopted
within five years of the implementation of the
Directive (art. 8). A list of common elements for
the identification of areas at risk of landslides can
be found in the appendix.15 8 Communication from the Commission to the Council, the European Parliament, the Economic and Social Committee and the Committee of the Regions – Towards a Thematic Strategy for Soil Protection, COM(2002) 179 final.9 Communication from the Commission to the Council, the European Parliament, the Economic and Social Committee and the Committee of the Regions – Thematic Strategy for Soil Protection, COM(2006) 231 final, Section 1.10 Towards a Thematic Strategy for Soil Protection (fn. 8), Section 3.11 Towards a Thematic Strategy for Soil Protection (fn. 8), Section 3.8.12 Thematic Strategy for Soil Protection (fn. 9).13 Proposal for a Directive of the European Parliament and of the Council establishing a Framework for the Protection of Soil and amending Directive 2004/35/EC, COM(2006) 232 final.2..14 European Parliament legislative resolution of 14 Novem-ber 2007 on the proposal for a directive of the European Parliament and of the Council establishing a framework for the protection of soil and amending Directive 2004/35/EC, P6_TA(2007)0509.15 Annex I Section 5: soil typological unit (soil type), properties, occurrence and density of landslides, bedrock, topography, land cover, land use (including land management, farming systems and forestry), climate and seismic risk.
16 Cf. in detail NORER, Bodenschutzrecht im Kontext der euro-päischen Bodenschutzstrategie (2009), p. 17 et seq.17 Like the Directive 2000/60/EC establishing a framework for Community action in the field of water policy (“Wasserrahmen-richtlinie“), OJ 2000 L 327/1.18 Art. 4 et seq. Council Regulation (EC) No. 73/2009 estab-lishing common rules for direct support schemes for farmers under the common agricultural policy and establishing certain support schemes for farmers, OJ 2009 L 30/16.19 Art. 6 in conjunction with Annex III Regulation (EC) 73/2009; § 5.1 in conjunction with Annex INVEKOS-CC-V 2010, BGBl. II 2009/492.20 Council Regulation (EC) No. 1698/2005 on support for rural development by the European Agricultural Fund for Rural Deve-lopment (EAFRD), OJ 2005 L 277/1.21 Cf. Recital 32, 38, 41 and 44 Regulation (EC) 1698/2005. For Austrian implementation see Sonderrichtlinie zur Umsetzung der forstlichen und wasserbaulichen Maßnahmen im Rahmen des Österreichischen Programms für die Entwicklung des ländlichen Raums 2007 – 2013 „Wald & Wasser“, BMLFUW-LE.3.2.8/0054-IV/3/2007 idF BMLFUW-LE.3.2.8/0028-IV/3/2009.
Seite
68
Seite
69
4.6. Findings
In the light of the arid gain at the international and
European legal level, at a first glance the respective
national systems seem to constitute the determining
factor, by implementing higher-ranking guidelines
or autonomously. However, norms related to the
assessment and mapping of geological hazards,
such as the law of natural disaster management
at all40, remain fragmentated between the various
regulations (“Querschnittsmaterien”). Relevant
provisions exist, primarily in forestry law with its
extensive hazard descriptions, but also marginally
in spatial planning law. This fact, however, would
not allow the development of uniform standards
and provisions for assessment and mapping of
geological hazards.41
5. Conclusion
Legal provisions regarding the assessment and
mapping of geological hazards are tenuously
sown at the international and European level.
Unlikely enough, at the national level more legal
provisions exist in connection with preventive
planning42 for natural hazards. Here, the existing
instruments partially conduct the assessment of
mass movements, although the general problem
of the coexistence of different area-related
definitions still remains.43
A convincing and coherent overall view cannot
be offered. Whereas the available legal set of tools
remains within the same course of action, no
relevant changes coming from the international
and European level are to be expected in the
near future. Admittedly, the creation of uniform
technical standards by all those involved as a
further step towards self-regulation should be
brought to mind.
Anschrift des Verfassers / Author’s address:
Univ.-Prof. Dr. Roland Norer
University of Lucerne
School of Law
Hofstraße 9
P.O. Box 7464
CH-6000 Luzern 7
Switzerland
Key-note papers
39 In Austria e.g. § 5.1.5 Styria Building Act (Steiermärkisches Baugesetz), LGBl. 1995/59, according to which a plot area is only suitable for building if the risks posed by „flood debris accumulation, rockfall, landslides” are not to be expected. From the perspective of avalanche protection see in detail KHAKZ-ADEH (fn. 37), p. 58 et seq.40 For Austria see e.g. HATTENBERGER, Naturgefahren und öffentliches Recht, in: Fuchs/Khakzadeh/Weber (ed.), Recht im Naturgefahrenmanagement (2006), p. 67 ; RUDOLF-MIKLAU (fn. 1), p. 57 and list 61 et seq., speaking of „Kompetenzlawine“.41 WEBER/OBERMEIER, Verwaltungs- und zivilrechtliche Aspek-te von Steinschlaggefährdung und –schutz, Studie im Auftrag des Bundesministeriums für Land- und Forstwirtschaft, Umwelt und Wasserwirtschaft (2008, unveröffentlicht), p. 29, suggest for Austria f.i. an extension of the competence „Wildbach- und Lawinenverbauung“ towards other natural hazards. The politi-cal feasibility seems little realistic.42 For Austria see in detail RUDOLF-MIKLAU (fn. 1), p. 129 et seq.; HATTENBERGER (fn. 40), p. 73 et seq.43 For Austria see HATTENBERGER (fn. 40), p. 84 et seq.
4.3. Soil protection law
The rules on soil protection can be divided in two
categories with different aims: on the one hand,
qualitative soil damage such as contaminating
activities and structural damages and on the
other hand, quantitative soil loss, such as soil
degradation and erosion.35 The second category
could also be of interest for mass movements.36
4.4. Spatial planning law
As a general rule, rules on areas with a higher
risk of mass movements in connection with the
designation of building sites37 or special use in
grassland can be mainly found in spatial planning
law. Further contents in this regard remain
missing.38
4.5. Building law
A similar situation applies to building law. The
suitability as a building site for areas with a higher
risk of mass movements is not given.39
action programmes. Furthermore, a Community
approach on the prevention of natural disasters
sets out guidelines for the unification of hazard
mapping in large-scale disasters.
4. National law
4.1. Forestry law
Many times, the catchment area of mountain
torrents and avalanches, as well as references to
rock fall and landslip areas, are established within
the national forestal spatial planning.28 It can even
include the layout of forests with a protective
function29 or the extensive hazard description
structured in risk levels.30 The protective effect of
the forest especially implies “the protection against
natural peril and contaminating environmental
influences as well as the conservation of the soil
against torrents and drift, boulders accumulation
and landslides”.31 Thus, forests with a direct
protective function against the above-mentioned
hazards could be signalised by means of an
administrative act (Bannwälder).32
4.2. Water law
Such regulations are limited to measures for flood
prevention33, although geological risks are at
times also included34.
35 Cf. HOLZER/REISCHAUER, Agrarumweltrecht. Kritische Analyse des „Grünen Rechts“ in Österreich (1991), p. 47; REISCHAUER (fn. 22), p. 477.
32 Such as in § 27.2.a Austrian Forestry Act 1975.
36 In Austria e.g. the pertinent national provisions only provide for land-use measures for soil in erosion areas; see § 5 Bur-genland Soil Protection Act (Burgenländisches Bodenschutz-gesetz), LGBl. 1990/87; § 27 Upper Austria Soil Protection Act 1991 (Oberösterreichisches Bodenschutzgesetz), LGBl. 1997/63; § 7 Salzburg Soil Protection Act (Salzburger Bo-denschutzgesetz), LGBl. 2001/80; § 6 Styria Agricultural Soil Protection Act (Steiermärkisches landwirtschaftliches Boden-schutzgesetz), LGBl. 1987/66.
33 In Austria e.g. Section 4 of the Water Law Act 1959, BGBl. 1959/215 (Wv).
37 In Austria e.g. § 37.1.a Tyrol Spatial Planning Act (Tiroler Raumordnungsgesetz), LGBl. 2006/27, according to which certain areas are excluded as building sites when f.i. there is a risk of „rockfall, landslide or other gravitated natural hazards”. From the perspective of avalanche protection see in detail KHAKZADEH, Rechtsfragen des Lawinenschutzes (2004), p. 37 et seq.
34 In Austria e.g. Water Construction Development Act (Was-serbautenförderungsgesetz), BGBl. 1985/148 (Wv), expressly mentions the necessary protection against “rock fall, mudflow and landslides” in the requirements for granting and allocation of federal funds to pursuit the objectives in the Act (§ 1.1.1.b).
38 F.i. the Recommendation Nr. 52 of the Austrian Spatial Pl-anning Conference (ÖROK) about preventive handling with na-tural hazards in Spatial Planning (2005) also puts an emphasis in floods. Cf. for Austria altogether KANONIER, Raumplanungs-rechtliche Regelungen als Teil des Naturgefahrenmanagements, in: Fuchs/Khakzadeh/Weber (ed.), Recht im Naturgefahrenma-nagement (2006), p. 123 et seq.
29 In Austria e.g. Forestry Development Plan (Waldentwick-lungsplan) based on § 9 Austrian Forestry Act 1975.30 In Austria e.g. hazard and risks mapping (Gefahren- und Risikokarten), here geological hazard mapping (no legal basis).31 Such as in § 6.2b Austrian Forestry Act 1975.
28 In Austria e.g. the mapping of risk areas is based on § 11 Aus-trian Forestry Act 1975, BGBl. 1975/440, in conjunction with § 7.a Regulation on the mapping of risk areas, BGBl. 1976/436, including brown areas of reference, which posed other hazards than mountain torrents and avalanches, such as rock fall and landslips. Cf. JÄGER, Raumwirkungen des Forstrechts, in: Hauer/Nußbaumer (ed.), Österreichisches Raum- und Fachplanungsrecht (2006), p. 181 et seq.; STÖTTER/FUCHS, Umgang mit Naturgefahren – Status quo und und zukünftige Anforderungen, in: Fuchs/Khakzadeh/Weber (ed.), Recht im Naturgefahrenmanagement (2006), p. 21 et seq.
Seite
70
Seite
71
combination for one language and one country.
It is particularly relevant for this project, as the
usage of a term varies greatly within a language
depending on the region where it is used, as
it is the case for German (Germany, Austria,
Switzerland).
Easy and intuitive queries are essential
for the usability of the glossary. Although the
user friendliness mostly depends on the graphical
user interface and is hard to control through the
database design, there are still aspects that need
to be considered in conception. It is important to
determine what possible queries will be offered
to the user (e.g. a search by synonyms, case and
special character insensitive searches, etc.) and to
adapt the database design accordingly.
Editing and adding glossary terms after
the initial import should also be possible and
requires saving metadata for each entry, e.g. time
and date of the creation or the last edit of a term.
Using that information, it is easy to reconstruct the
history of an entry at a later point in time.
1. Requirements for the relational database
Before the actual database is deigned, it is essential
to assess the exact requirements for the glossary.
This eases the following conceptional work a lot
and minimizes time-consuming adjustments and
changes to the model later on.
First a list of attributes needed for a single
glossary term as well as a type for those attributes
(e.g. numbers, text, keys etc.) is to be defined.
The type of attribute determines which relations
can be saved in the database and what kind of
information can be queried using them. Every
attribute corresponds at least to one column in the
main glossary table.
The unique language to which a
term is assigned is a fundamental attribute in
a multilingual glossary. Because of the pan-
European character of the glossary, it is necessary
to specify the languages more precisely by linking
them to a specific country, resulting in a unique
Zusammenfassung:Ausgangslage und Motivation für dieses Projekt ist die schon „traditionelle“ Problematik der unterschiedlichen Verwendung und Definition der Begrifflichkeiten in der Fachliteratur zum Themenbereich Massenbewegungsprozesse. Dies hat zur Folge, dass die Arbeitsweisen der Experten in den verschiedenen geologischen Ämtern in den Projektpartnerländern nicht ein-heitlich sind und es daher immer wieder zu Missverständnissen und Schwierigkeiten bei der Abstimmung gemeinsamer Projekte kommt. Aufgrund dieser Komplexität und der Unklarheit, die speziell im deutschsprachigen Raum, aber auch europaweit, besonders im Hinblick auf die Klassifikation der Massenbewegungen existiert, soll ein mehrsprachiges Glossar erstellt werden, in welchem im Sinne der internationalen Harmonisierung in Absprache mit den einzelnen Projektpartnerländern die von den jeweiligen geologischen Ämtern verwendeten administrativen Begriffe eingestellt und in Beziehung gesetzt werden. Das gesamte Projekt gliedert sich grundsätzlich in einen technischen und einen inhaltlichen Teil, wobei die erste Projektphase vom technischen Bereich bestimmt wird. Da die harmonisierten Begrifflichkei-ten und Definitionen für alle beteiligten Länder und auch für eine breitere Öffentlichkeit zu-gänglich gemacht werden soll, wird eine relationale Datenbank erstellt, in welcher die Inhalte logisch verknüpft werden und welche zu Projektende in die LfU-Homepage integriert wird.
Internationally Harmonized Terminology for Geological Risk: Glossary (Overview)
Internationale Harmonisierung der Fachterminologie für geologische Risiken: Glossar (Überblick)
Summary:Purpose and motivation for this project are the difficulties traditionally encountered when using or defining mass movements terms in scientific papers. This results in different methods and concepts being used by geological agencies and finally leads to misunderstandings and problems in cooperative international projects. In order to tackle that complexity and ambiguity, found not only in the German-speaking geology, but generally throughout Europe, a multilingual glossary shall be created. This glossary aims at an international harmonization by providing the user with a selection of official terms used by the geological agencies in a specific country and by setting relations to similar terms employed in other countries. The resulting harmonized terms and definitions should be made available to all partners and to the general public on the internet through the Bavarian Environment Agency homepage. The first step is to design and implement the technical infrastructure required to store and query the terms. For this purpose, a relational database management system will be used as a back-end.
KARL MAYER, BERNHARD LOCHNER
Key-note papers
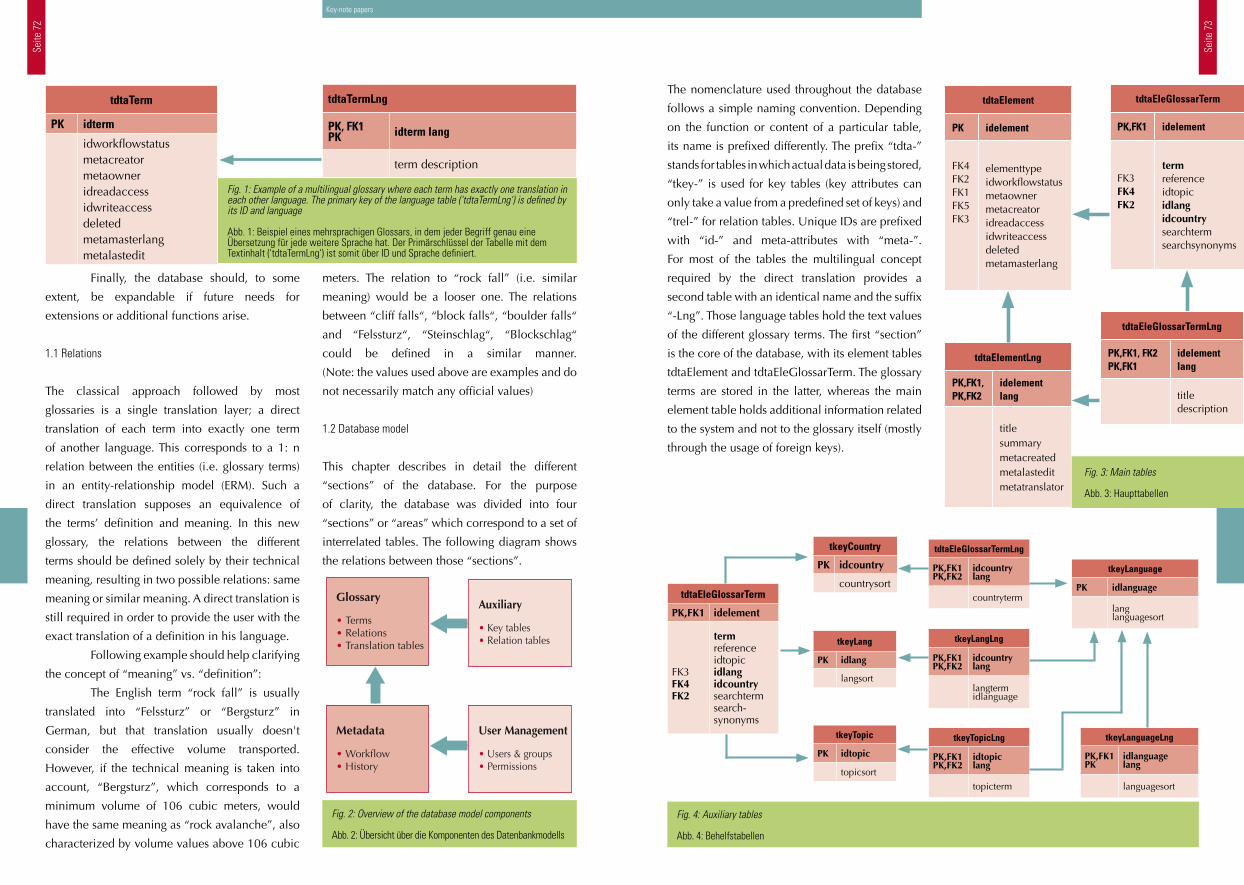
Seite
72
Seite
73
The nomenclature used throughout the database
follows a simple naming convention. Depending
on the function or content of a particular table,
its name is prefixed differently. The prefix “tdta-”
stands for tables in which actual data is being stored,
“tkey-” is used for key tables (key attributes can
only take a value from a predefined set of keys) and
“trel-” for relation tables. Unique IDs are prefixed
with “id-” and meta-attributes with “meta-”.
For most of the tables the multilingual concept
required by the direct translation provides a
second table with an identical name and the suffix
“-Lng”. Those language tables hold the text values
of the different glossary terms. The first “section”
is the core of the database, with its element tables
tdtaElement and tdtaEleGlossarTerm. The glossary
terms are stored in the latter, whereas the main
element table holds additional information related
to the system and not to the glossary itself (mostly
through the usage of foreign keys).
Key-note papers
tdtaElement
PK idelement
FK4FK2FK1FK5FK3
elementtypeidworkflowstatusmetaownermetacreatoridreadaccessidwriteaccessdeletedmetamasterlang
tdtaEleGlossarTerm
PK,FK1 idelement
FK3FK4FK2
termreferenceidtopicidlangidcountrysearchtermsearchsynonyms
tdtaEleGlossarTermLng
PK,FK1, FK2PK,FK1
idelement lang
title description
tdtaElementLng
PK,FK1, PK,FK2
idelement lang
title summarymetacreatedmetalasteditmetatranslator
Fig. 3: Main tables
Abb. 3: Haupttabellen
tdtaEleGlossarTerm
PK,FK1 idelement
FK3FK4FK2
termreferenceidtopicidlangidcountrysearchtermsearch- synonyms
tdtaEleGlossarTermLng
PK,FK1 PK,FK2
idcountry lang
countryterm
tkeyLangLng
PK,FK1 PK,FK2
idcountry lang
langtermidlanguage
tkeyLanguage
PK idlanguage
langlanguagesort
tkeyLanguageLng
PK,FK1PK
idlanguagelang
languagesort
tkeyTopicLng
PK,FK1 PK,FK2
idtopic lang
topicterm
tkeyCountry
PK idcountry
countrysort
tkeyLang
PK idlang
langsort
tkeyTopic
PK idtopic
topicsort
Fig. 4: Auxiliary tables
Abb. 4: Behelfstabellen
meters. The relation to “rock fall” (i.e. similar
meaning) would be a looser one. The relations
between “cliff falls“, “block falls“, “boulder falls“
and “Felssturz“, “Steinschlag“, “Blockschlag“
could be defined in a similar manner.
(Note: the values used above are examples and do
not necessarily match any official values)
1.2 Database model
This chapter describes in detail the different
“sections” of the database. For the purpose
of clarity, the database was divided into four
“sections” or “areas” which correspond to a set of
interrelated tables. The following diagram shows
the relations between those “sections”.
Finally, the database should, to some
extent, be expandable if future needs for
extensions or additional functions arise.
1.1 Relations
The classical approach followed by most
glossaries is a single translation layer; a direct
translation of each term into exactly one term
of another language. This corresponds to a 1: n
relation between the entities (i.e. glossary terms)
in an entity-relationship model (ERM). Such a
direct translation supposes an equivalence of
the terms’ definition and meaning. In this new
glossary, the relations between the different
terms should be defined solely by their technical
meaning, resulting in two possible relations: same
meaning or similar meaning. A direct translation is
still required in order to provide the user with the
exact translation of a definition in his language.
Following example should help clarifying
the concept of “meaning” vs. “definition”:
The English term “rock fall” is usually
translated into “Felssturz” or “Bergsturz” in
German, but that translation usually doesn't
consider the effective volume transported.
However, if the technical meaning is taken into
account, “Bergsturz”, which corresponds to a
minimum volume of 106 cubic meters, would
have the same meaning as “rock avalanche”, also
characterized by volume values above 106 cubic
Fig. 2: Overview of the database model components
Abb. 2: Übersicht über die Komponenten des Datenbankmodells
Glossary
• Terms• Relations• Translation tables
Auxiliary
• Key tables• Relation tables
User Management
• Users & groups• Permissions
Metadata
• Workflow• History
Fig. 1: Example of a multilingual glossary where each term has exactly one translation in each other language. The primary key of the language table ('tdtaTermLng') is defined by its ID and language
Abb. 1: Beispiel eines mehrsprachigen Glossars, in dem jeder Begriff genau eine Übersetzung für jede weitere Sprache hat. Der Primärschlüssel der Tabelle mit dem Textinhalt ('tdtaTermLng') ist somit über ID und Sprache definiert.
tdtaTerm
PK idterm
idworkflowstatusmetacreatormetaowneridreadaccessidwriteaccessdeletedmetamasterlangmetalastedit
tdtaTermLng
PK, FK1 PK idterm lang
term description
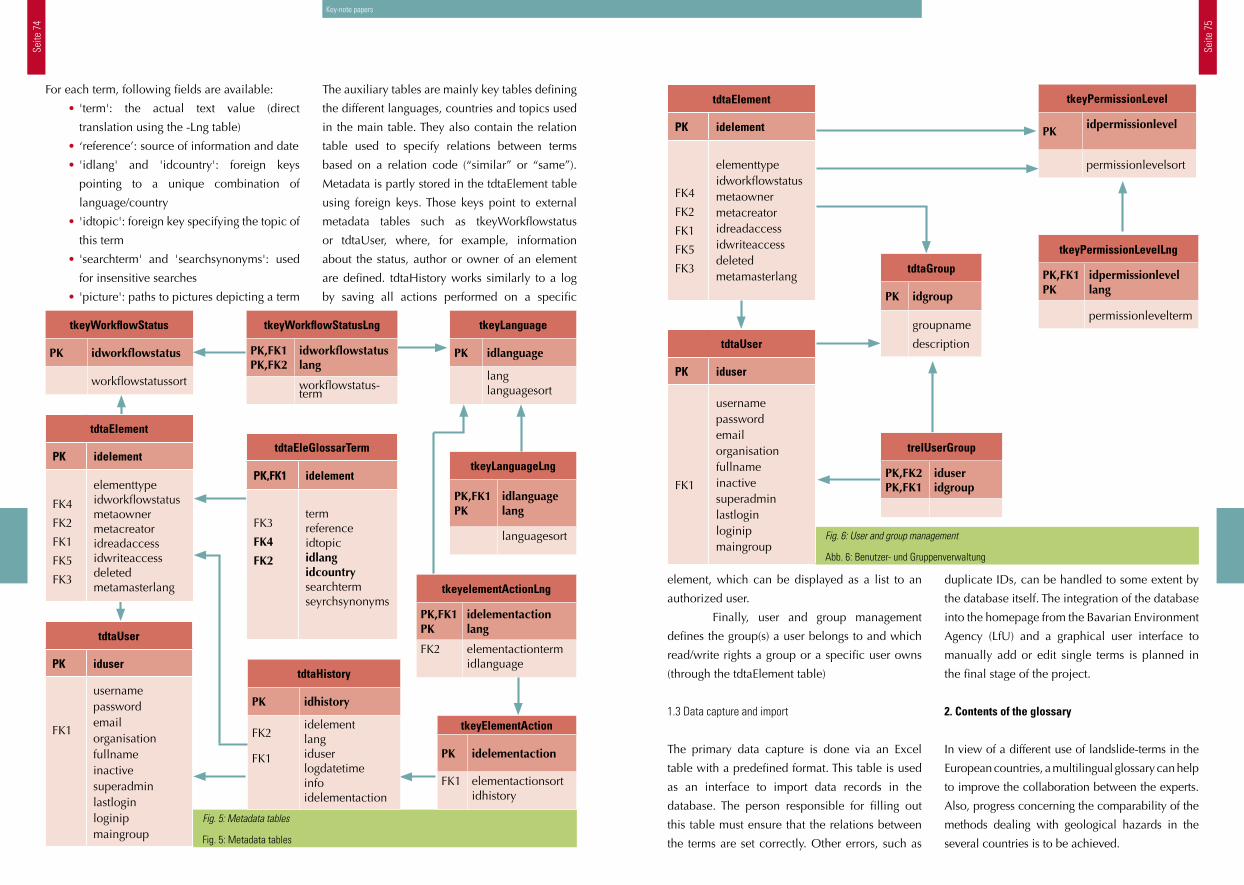
Seite
74
Seite
75
element, which can be displayed as a list to an
authorized user.
Finally, user and group management
defines the group(s) a user belongs to and which
read/write rights a group or a specific user owns
(through the tdtaElement table)
1.3 Data capture and import
The primary data capture is done via an Excel
table with a predefined format. This table is used
as an interface to import data records in the
database. The person responsible for filling out
this table must ensure that the relations between
the terms are set correctly. Other errors, such as
duplicate IDs, can be handled to some extent by
the database itself. The integration of the database
into the homepage from the Bavarian Environment
Agency (LfU) and a graphical user interface to
manually add or edit single terms is planned in
the final stage of the project.
2. Contents of the glossary
In view of a different use of landslide-terms in the
European countries, a multilingual glossary can help
to improve the collaboration between the experts.
Also, progress concerning the comparability of the
methods dealing with geological hazards in the
several countries is to be achieved.
Key-note papers
Fig. 6: User and group management
Abb. 6: Benutzer- und Gruppenverwaltung
trelUserGroup
PK,FK2PK,FK1
iduseridgroup
tdtaGroup
PK idgroup
groupname
description
tkeyPermissionLevelLng
PK,FK1PK
idpermissionlevellang
permissionlevelterm
tkeyPermissionLevel
PKidpermissionlevel
permissionlevelsort
tdtaElement
PK idelement
FK4
FK2
FK1
FK5
FK3
elementtypeidworkflowstatusmetaownermetacreatoridreadaccessidwriteaccessdeletedmetamasterlang
tdtaUser
PK iduser
FK1
usernamepasswordemailorganisationfullnameinactivesuperadminlastloginloginipmaingroup
For each term, following fields are available:
• 'term': the actual text value (direct
translation using the -Lng table)
• ‘reference’: source of information and date
• 'idlang' and 'idcountry': foreign keys
pointing to a unique combination of
language/country
• 'idtopic': foreign key specifying the topic of
this term
• 'searchterm' and 'searchsynonyms': used
for insensitive searches
• 'picture': paths to pictures depicting a term
The auxiliary tables are mainly key tables defining
the different languages, countries and topics used
in the main table. They also contain the relation
table used to specify relations between terms
based on a relation code (“similar” or “same”).
Metadata is partly stored in the tdtaElement table
using foreign keys. Those keys point to external
metadata tables such as tkeyWorkflowstatus
or tdtaUser, where, for example, information
about the status, author or owner of an element
are defined. tdtaHistory works similarly to a log
by saving all actions performed on a specific
Fig. 5: Metadata tables
Fig. 5: Metadata tables
tkeyWorkflowStatus
PK idworkflowstatus
workflowstatussort
tkeyWorkflowStatusLng
PK,FK1PK,FK2
idworkflowstatuslang
workflowstatus-term
tkeyLanguage
PK idlanguage
langlanguagesort
tkeyLanguageLng
PK,FK1PK
idlanguagelang
languagesort
tkeyelementActionLng
PK,FK1PK
idelementactionlang
FK2 elementactiontermidlanguage
tkeyElementAction
PK idelementaction
FK1 elementactionsortidhistory
tdtaHistory
PK idhistory
FK2
FK1
idelementlangiduserlogdatetimeinfoidelementaction
tdtaElement
PK idelement
FK4
FK2
FK1
FK5
FK3
elementtypeidworkflowstatusmetaownermetacreatoridreadaccessidwriteaccessdeletedmetamasterlang
tdtaEleGlossarTerm
PK,FK1 idelement
FK3
FK4
FK2
termreferenceidtopicidlangidcountrysearchtermseyrchsynonyms
tdtaUser
PK iduser
FK1
usernamepasswordemailorganisationfullnameinactivesuperadminlastloginloginipmaingroup
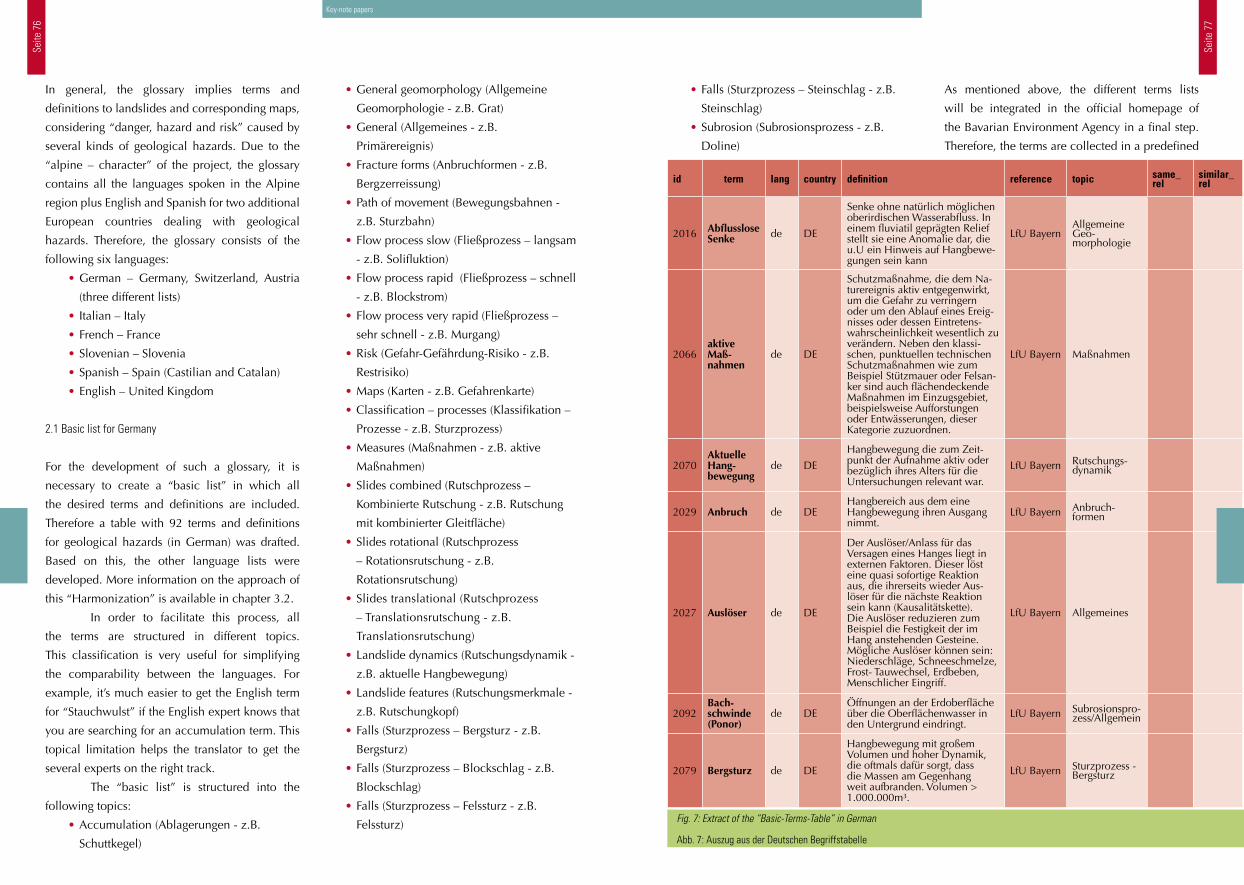
Seite
76
Seite
77
• Falls (Sturzprozess – Steinschlag - z.B.
Steinschlag)
• Subrosion (Subrosionsprozess - z.B.
Doline)
As mentioned above, the different terms lists
will be integrated in the official homepage of
the Bavarian Environment Agency in a final step.
Therefore, the terms are collected in a predefined
Key-note papers
id term lang country definition reference topic same_rel
similar_rel
2016 Abflusslose Senke de DE
Senke ohne natürlich möglichen oberirdischen Wasserabfluss. In einem fluviatil geprägten Relief stellt sie eine Anomalie dar, die u.U ein Hinweis auf Hangbewe-gungen sein kann
LfU BayernAllgemeine Geo-morphologie
2066aktive Maß-nahmen
de DE
Schutzmaßnahme, die dem Na-turereignis aktiv entgegenwirkt, um die Gefahr zu verringern oder um den Ablauf eines Ereig-nisses oder dessen Eintretens-wahrscheinlichkeit wesentlich zu verändern. Neben den klassi-schen, punktuellen technischen Schutzmaßnahmen wie zum Beispiel Stützmauer oder Felsan-ker sind auch flächendeckende Maßnahmen im Einzugsgebiet, beispielsweise Aufforstungen oder Entwässerungen, dieser Kategorie zuzuordnen.
LfU Bayern Maßnahmen
2070Aktuelle Hang-bewegung
de DE
Hangbewegung die zum Zeit-punkt der Aufnahme aktiv oder bezüglich ihres Alters für die Untersuchungen relevant war.
LfU Bayern Rutschungs-dynamik
2029 Anbruch de DEHangbereich aus dem eine Hangbewegung ihren Ausgang nimmt.
LfU Bayern Anbruch-formen
2027 Auslöser de DE
Der Auslöser/Anlass für das Versagen eines Hanges liegt in externen Faktoren. Dieser löst eine quasi sofortige Reaktion aus, die ihrerseits wieder Aus-löser für die nächste Reaktion sein kann (Kausalitätskette). Die Auslöser reduzieren zum Beispiel die Festigkeit der im Hang anstehenden Gesteine. Mögliche Auslöser können sein: Niederschläge, Schneeschmelze, Frost- Tauwechsel, Erdbeben, Menschlicher Eingriff.
LfU Bayern Allgemeines
2092Bach-schwinde (Ponor)
de DEÖffnungen an der Erdoberfläche über die Oberflächenwasser in den Untergrund eindringt.
LfU Bayern Subrosionspro-zess/Allgemein
2079 Bergsturz de DE
Hangbewegung mit großem Volumen und hoher Dynamik, die oftmals dafür sorgt, dass die Massen am Gegenhang weit aufbranden. Volumen > 1.000.000m³.
LfU Bayern Sturzprozess - Bergsturz
Fig. 7: Extract of the “Basic-Terms-Table” in German
Abb. 7: Auszug aus der Deutschen Begriffstabelle
• General geomorphology (Allgemeine
Geomorphologie - z.B. Grat)
• General (Allgemeines - z.B.
Primärereignis)
• Fracture forms (Anbruchformen - z.B.
Bergzerreissung)
• Path of movement (Bewegungsbahnen -
z.B. Sturzbahn)
• Flow process slow (Fließprozess – langsam
- z.B. Solifluktion)
• Flow process rapid (Fließprozess – schnell
- z.B. Blockstrom)
• Flow process very rapid (Fließprozess –
sehr schnell - z.B. Murgang)
• Risk (Gefahr-Gefährdung-Risiko - z.B.
Restrisiko)
• Maps (Karten - z.B. Gefahrenkarte)
• Classification – processes (Klassifikation –
Prozesse - z.B. Sturzprozess)
• Measures (Maßnahmen - z.B. aktive
Maßnahmen)
• Slides combined (Rutschprozess –
Kombinierte Rutschung - z.B. Rutschung
mit kombinierter Gleitfläche)
• Slides rotational (Rutschprozess
– Rotationsrutschung - z.B.
Rotationsrutschung)
• Slides translational (Rutschprozess
– Translationsrutschung - z.B.
Translationsrutschung)
• Landslide dynamics (Rutschungsdynamik -
z.B. aktuelle Hangbewegung)
• Landslide features (Rutschungsmerkmale -
z.B. Rutschungkopf)
• Falls (Sturzprozess – Bergsturz - z.B.
Bergsturz)
• Falls (Sturzprozess – Blockschlag - z.B.
Blockschlag)
• Falls (Sturzprozess – Felssturz - z.B.
Felssturz)
In general, the glossary implies terms and
definitions to landslides and corresponding maps,
considering “danger, hazard and risk” caused by
several kinds of geological hazards. Due to the
“alpine – character” of the project, the glossary
contains all the languages spoken in the Alpine
region plus English and Spanish for two additional
European countries dealing with geological
hazards. Therefore, the glossary consists of the
following six languages:
• German – Germany, Switzerland, Austria
(three different lists)
• Italian – Italy
• French – France
• Slovenian – Slovenia
• Spanish – Spain (Castilian and Catalan)
• English – United Kingdom
2.1 Basic list for Germany
For the development of such a glossary, it is
necessary to create a “basic list” in which all
the desired terms and definitions are included.
Therefore a table with 92 terms and definitions
for geological hazards (in German) was drafted.
Based on this, the other language lists were
developed. More information on the approach of
this “Harmonization” is available in chapter 3.2.
In order to facilitate this process, all
the terms are structured in different topics.
This classification is very useful for simplifying
the comparability between the languages. For
example, it’s much easier to get the English term
for “Stauchwulst” if the English expert knows that
you are searching for an accumulation term. This
topical limitation helps the translator to get the
several experts on the right track.
The “basic list” is structured into the
following topics:
• Accumulation (Ablagerungen - z.B.
Schuttkegel)
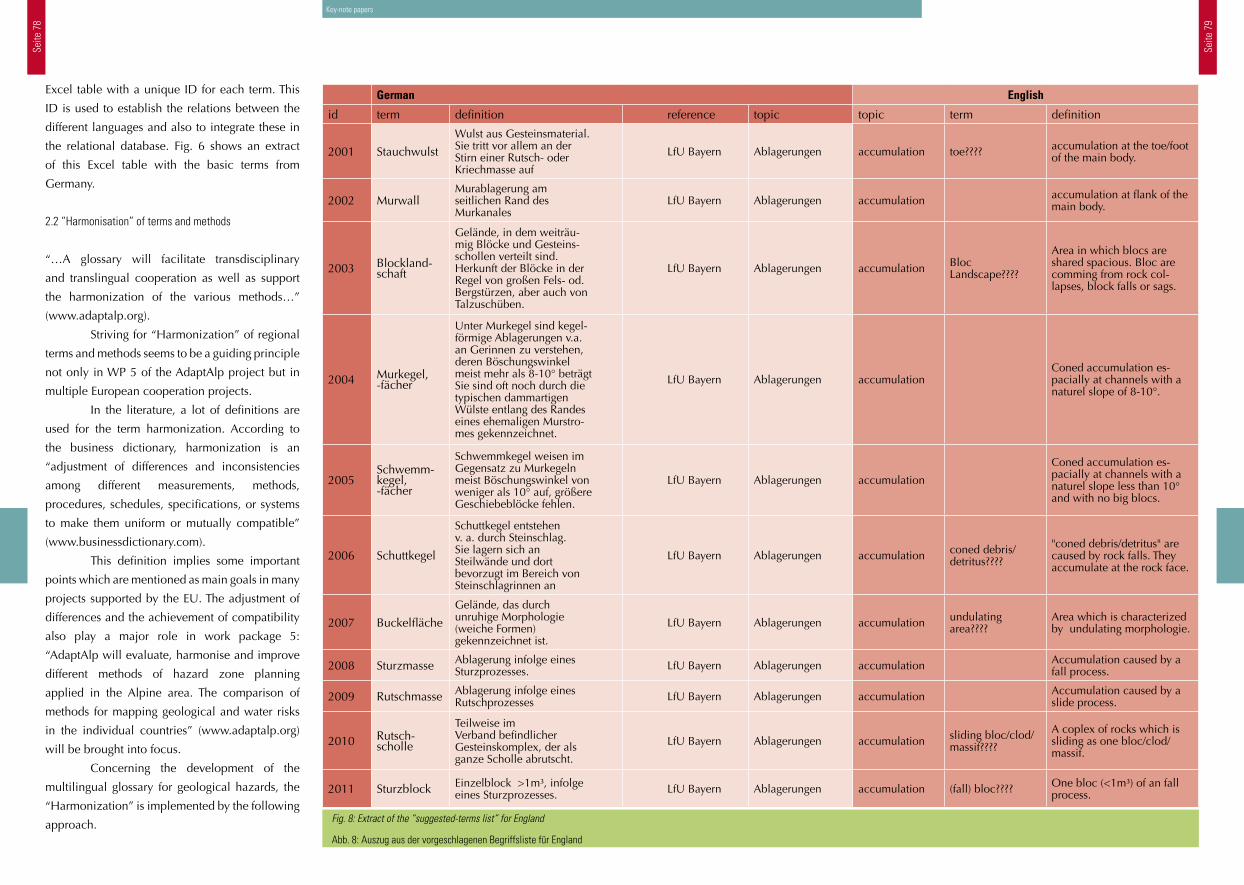
Seite
78
Seite
79
Key-note papers
Fig. 8: Extract of the “suggested-terms list” for England
Abb. 8: Auszug aus der vorgeschlagenen Begriffsliste für England
German English
id term definition reference topic topic term definition
2001 Stauchwulst
Wulst aus Gesteinsmaterial. Sie tritt vor allem an der Stirn einer Rutsch- oder Kriechmasse auf
LfU Bayern Ablagerungen accumulation toe???? accumulation at the toe/foot of the main body.
2002 MurwallMurablagerung am seitlichen Rand des Murkanales
LfU Bayern Ablagerungen accumulation accumulation at flank of the main body.
2003 Blockland-schaft
Gelände, in dem weiträu-mig Blöcke und Gesteins-schollen verteilt sind. Herkunft der Blöcke in der Regel von großen Fels- od. Bergstürzen, aber auch von Talzuschüben.
LfU Bayern Ablagerungen accumulation BlocLandscape????
Area in which blocs are shared spacious. Bloc are comming from rock col-lapses, block falls or sags.
2004 Murkegel, -fächer
Unter Murkegel sind kegel-förmige Ablagerungen v.a. an Gerinnen zu verstehen, deren Böschungswinkel meist mehr als 8-10° beträgt Sie sind oft noch durch die typischen dammartigen Wülste entlang des Randes eines ehemaligen Murstro-mes gekennzeichnet.
LfU Bayern Ablagerungen accumulationConed accumulation es-pacially at channels with a naturel slope of 8-10°.
2005Schwemm-kegel, -fächer
Schwemmkegel weisen im Gegensatz zu Murkegeln meist Böschungswinkel von weniger als 10° auf, größere Geschiebeblöcke fehlen.
LfU Bayern Ablagerungen accumulation
Coned accumulation es-pacially at channels with a naturel slope less than 10° and with no big blocs.
2006 Schuttkegel
Schuttkegel entstehen v. a. durch Steinschlag. Sie lagern sich an Steilwände und dort bevorzugt im Bereich von Steinschlagrinnen an
LfU Bayern Ablagerungen accumulation coned debris/detritus????
"coned debris/detritus" are caused by rock falls. They accumulate at the rock face.
2007 Buckelfläche
Gelände, das durch unruhige Morphologie (weiche Formen) gekennzeichnet ist.
LfU Bayern Ablagerungen accumulation undulating area????
Area which is characterized by undulating morphologie.
2008 Sturzmasse Ablagerung infolge eines Sturzprozesses. LfU Bayern Ablagerungen accumulation Accumulation caused by a
fall process.
2009 Rutschmasse Ablagerung infolge eines Rutschprozesses LfU Bayern Ablagerungen accumulation Accumulation caused by a
slide process.
2010 Rutsch-scholle
Teilweise im Verband befindlicher Gesteinskomplex, der als ganze Scholle abrutscht.
LfU Bayern Ablagerungen accumulation sliding bloc/clod/massif????
A coplex of rocks which is sliding as one bloc/clod/massif.
2011 Sturzblock Einzelblock >1m³, infolge eines Sturzprozesses. LfU Bayern Ablagerungen accumulation (fall) bloc???? One bloc (<1m³) of an fall
process.
Excel table with a unique ID for each term. This
ID is used to establish the relations between the
different languages and also to integrate these in
the relational database. Fig. 6 shows an extract
of this Excel table with the basic terms from
Germany.
2.2 “Harmonisation” of terms and methods
“…A glossary will facilitate transdisciplinary
and translingual cooperation as well as support
the harmonization of the various methods…”
(www.adaptalp.org).
Striving for “Harmonization” of regional
terms and methods seems to be a guiding principle
not only in WP 5 of the AdaptAlp project but in
multiple European cooperation projects.
In the literature, a lot of definitions are
used for the term harmonization. According to
the business dictionary, harmonization is an
“adjustment of differences and inconsistencies
among different measurements, methods,
procedures, schedules, specifications, or systems
to make them uniform or mutually compatible”
(www.businessdictionary.com).
This definition implies some important
points which are mentioned as main goals in many
projects supported by the EU. The adjustment of
differences and the achievement of compatibility
also play a major role in work package 5:
“AdaptAlp will evaluate, harmonise and improve
different methods of hazard zone planning
applied in the Alpine area. The comparison of
methods for mapping geological and water risks
in the individual countries” (www.adaptalp.org)
will be brought into focus.
Concerning the development of the
multilingual glossary for geological hazards, the
“Harmonization” is implemented by the following
approach.
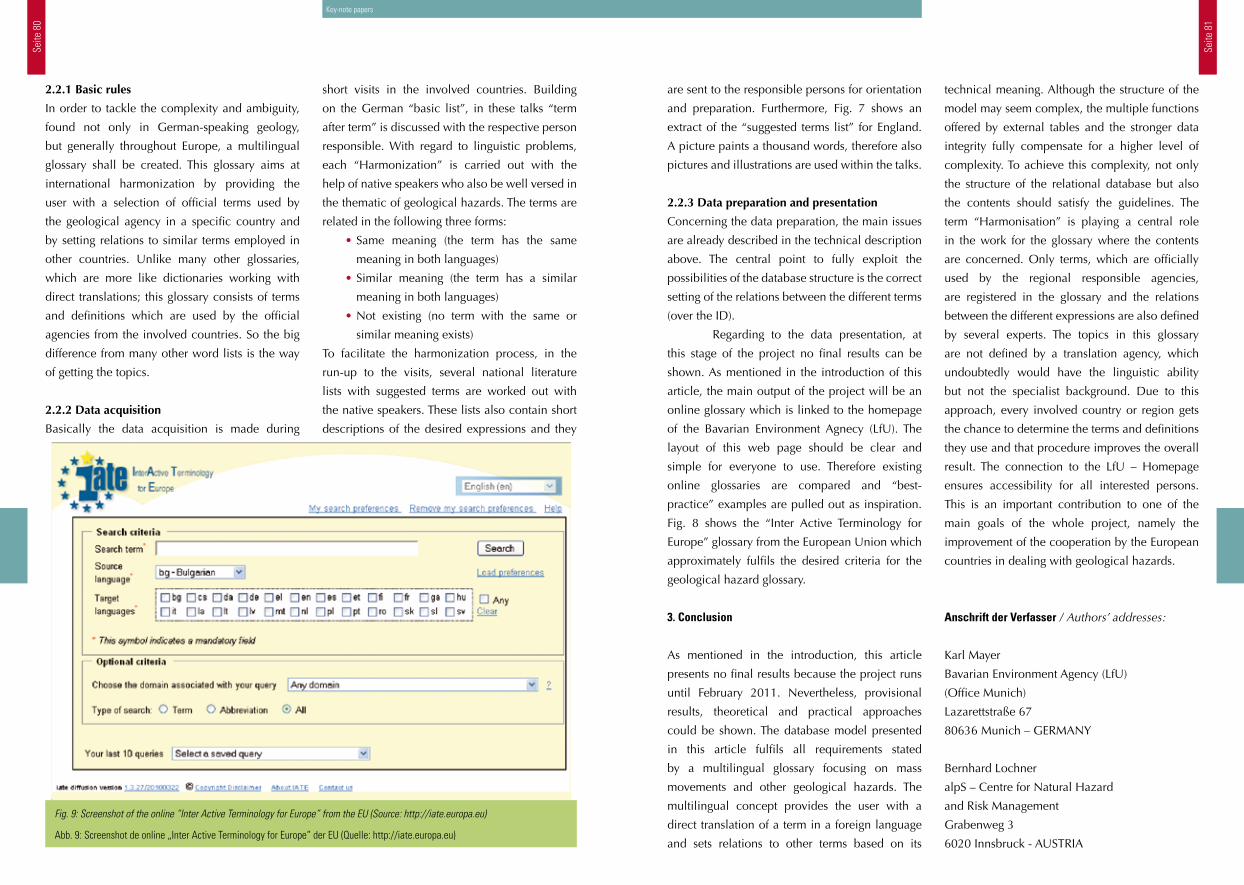
Seite
80
Seite
81
Key-note papers
are sent to the responsible persons for orientation
and preparation. Furthermore, Fig. 7 shows an
extract of the “suggested terms list” for England.
A picture paints a thousand words, therefore also
pictures and illustrations are used within the talks.
2.2.3 Data preparation and presentation
Concerning the data preparation, the main issues
are already described in the technical description
above. The central point to fully exploit the
possibilities of the database structure is the correct
setting of the relations between the different terms
(over the ID).
Regarding to the data presentation, at
this stage of the project no final results can be
shown. As mentioned in the introduction of this
article, the main output of the project will be an
online glossary which is linked to the homepage
of the Bavarian Environment Agnecy (LfU). The
layout of this web page should be clear and
simple for everyone to use. Therefore existing
online glossaries are compared and “best-
practice” examples are pulled out as inspiration.
Fig. 8 shows the “Inter Active Terminology for
Europe” glossary from the European Union which
approximately fulfils the desired criteria for the
geological hazard glossary.
3. Conclusion
As mentioned in the introduction, this article
presents no final results because the project runs
until February 2011. Nevertheless, provisional
results, theoretical and practical approaches
could be shown. The database model presented
in this article fulfils all requirements stated
by a multilingual glossary focusing on mass
movements and other geological hazards. The
multilingual concept provides the user with a
direct translation of a term in a foreign language
and sets relations to other terms based on its
technical meaning. Although the structure of the
model may seem complex, the multiple functions
offered by external tables and the stronger data
integrity fully compensate for a higher level of
complexity. To achieve this complexity, not only
the structure of the relational database but also
the contents should satisfy the guidelines. The
term “Harmonisation” is playing a central role
in the work for the glossary where the contents
are concerned. Only terms, which are officially
used by the regional responsible agencies,
are registered in the glossary and the relations
between the different expressions are also defined
by several experts. The topics in this glossary
are not defined by a translation agency, which
undoubtedly would have the linguistic ability
but not the specialist background. Due to this
approach, every involved country or region gets
the chance to determine the terms and definitions
they use and that procedure improves the overall
result. The connection to the LfU – Homepage
ensures accessibility for all interested persons.
This is an important contribution to one of the
main goals of the whole project, namely the
improvement of the cooperation by the European
countries in dealing with geological hazards.
Anschrift der Verfasser / Authors’ addresses:
Karl Mayer
Bavarian Environment Agency (LfU)
(Office Munich)
Lazarettstraße 67
80636 Munich – GERMANY
Bernhard Lochner
alpS – Centre for Natural Hazard
and Risk Management
Grabenweg 3
6020 Innsbruck - AUSTRIA
2.2.1 Basic rules
In order to tackle the complexity and ambiguity,
found not only in German-speaking geology,
but generally throughout Europe, a multilingual
glossary shall be created. This glossary aims at
international harmonization by providing the
user with a selection of official terms used by
the geological agency in a specific country and
by setting relations to similar terms employed in
other countries. Unlike many other glossaries,
which are more like dictionaries working with
direct translations; this glossary consists of terms
and definitions which are used by the official
agencies from the involved countries. So the big
difference from many other word lists is the way
of getting the topics.
2.2.2 Data acquisition
Basically the data acquisition is made during
short visits in the involved countries. Building
on the German “basic list”, in these talks “term
after term” is discussed with the respective person
responsible. With regard to linguistic problems,
each “Harmonization” is carried out with the
help of native speakers who also be well versed in
the thematic of geological hazards. The terms are
related in the following three forms:
• Same meaning (the term has the same
meaning in both languages)
• Similar meaning (the term has a similar
meaning in both languages)
• Not existing (no term with the same or
similar meaning exists)
To facilitate the harmonization process, in the
run-up to the visits, several national literature
lists with suggested terms are worked out with
the native speakers. These lists also contain short
descriptions of the desired expressions and they
Fig. 9: Screenshot of the online “Inter Active Terminology for Europe” from the EU (Source: http://iate.europa.eu)
Abb. 9: Screenshot de online „Inter Active Terminology for Europe” der EU (Quelle: http://iate.europa.eu)
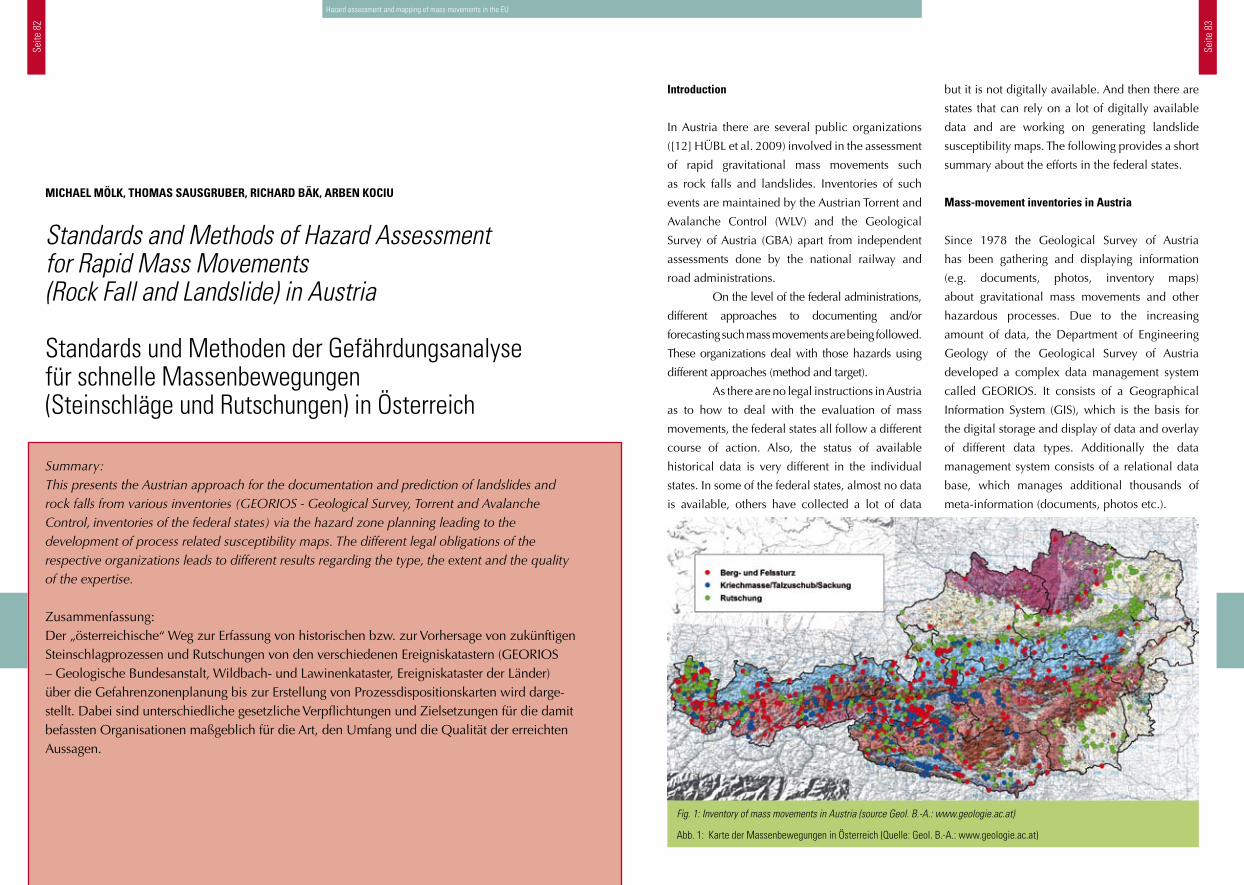
Seite
82
Seite
83
but it is not digitally available. And then there are
states that can rely on a lot of digitally available
data and are working on generating landslide
susceptibility maps. The following provides a short
summary about the efforts in the federal states.
Mass-movement inventories in Austria
Since 1978 the Geological Survey of Austria
has been gathering and displaying information
(e.g. documents, photos, inventory maps)
about gravitational mass movements and other
hazardous processes. Due to the increasing
amount of data, the Department of Engineering
Geology of the Geological Survey of Austria
developed a complex data management system
called GEORIOS. It consists of a Geographical
Information System (GIS), which is the basis for
the digital storage and display of data and overlay
of different data types. Additionally the data
management system consists of a relational data
base, which manages additional thousands of
meta-information (documents, photos etc.).
Introduction
In Austria there are several public organizations
([12] HÜBL et al. 2009) involved in the assessment
of rapid gravitational mass movements such
as rock falls and landslides. Inventories of such
events are maintained by the Austrian Torrent and
Avalanche Control (WLV) and the Geological
Survey of Austria (GBA) apart from independent
assessments done by the national railway and
road administrations.
On the level of the federal administrations,
different approaches to documenting and/or
forecasting such mass movements are being followed.
These organizations deal with those hazards using
different approaches (method and target).
As there are no legal instructions in Austria
as to how to deal with the evaluation of mass
movements, the federal states all follow a different
course of action. Also, the status of available
historical data is very different in the individual
states. In some of the federal states, almost no data
is available, others have collected a lot of data
Fig. 1: Inventory of mass movements in Austria (source Geol. B.-A.: www.geologie.ac.at)
Abb. 1: Karte der Massenbewegungen in Österreich (Quelle: Geol. B.-A.: www.geologie.ac.at)
Standards and Methods of Hazard Assessment for Rapid Mass Movements (Rock Fall and Landslide) in Austria
Standards und Methoden der Gefährdungsanalyse für schnelle Massenbewegungen (Steinschläge und Rutschungen) in Österreich
Summary:This presents the Austrian approach for the documentation and prediction of landslides and rock falls from various inventories (GEORIOS - Geological Survey, Torrent and Avalanche Control, inventories of the federal states) via the hazard zone planning leading to the development of process related susceptibility maps. The different legal obligations of the respective organizations leads to different results regarding the type, the extent and the quality of the expertise.
Zusammenfassung:Der „österreichische“ Weg zur Erfassung von historischen bzw. zur Vorhersage von zukünftigen Steinschlagprozessen und Rutschungen von den verschiedenen Ereigniskatastern (GEORIOS – Geologische Bundesanstalt, Wildbach- und Lawinenkataster, Ereigniskataster der Länder) über die Gefahrenzonenplanung bis zur Erstellung von Prozessdispositionskarten wird darge-stellt. Dabei sind unterschiedliche gesetzliche Verpflichtungen und Zielsetzungen für die damit befassten Organisationen maßgeblich für die Art, den Umfang und die Qualität der erreichten Aussagen.
MICHAEL MÖLK, THOMAS SAUSGRUBER, RICHARD BÄK, ARBEN KOCIU
Hazard assessment and mapping of mass-movements in the EU
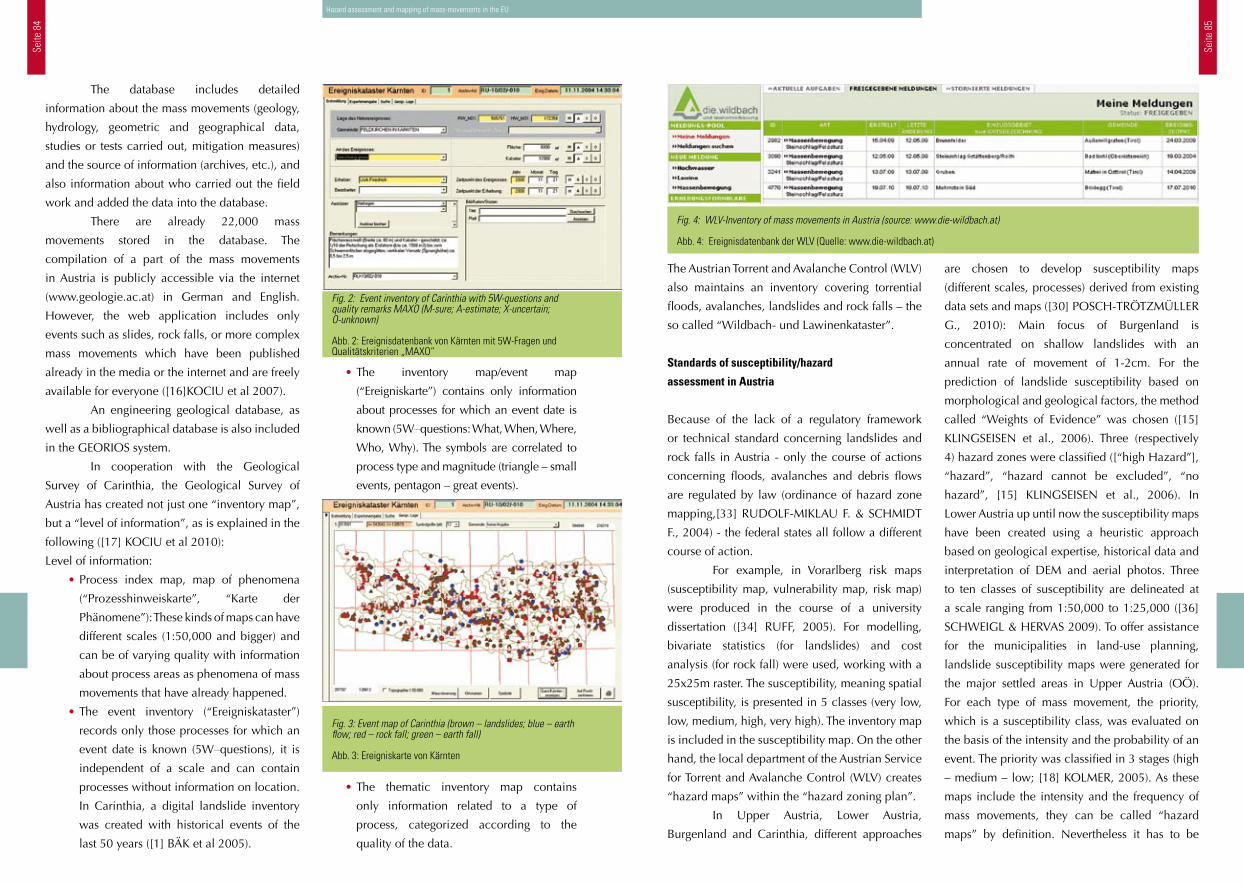
Seite
84
Seite
85
The Austrian Torrent and Avalanche Control (WLV)
also maintains an inventory covering torrential
floods, avalanches, landslides and rock falls – the
so called “Wildbach- und Lawinenkataster”.
Standards of susceptibility/hazard
assessment in Austria
Because of the lack of a regulatory framework
or technical standard concerning landslides and
rock falls in Austria - only the course of actions
concerning floods, avalanches and debris flows
are regulated by law (ordinance of hazard zone
mapping,[33] RUDOLF-MIKLAU F. & SCHMIDT
F., 2004) - the federal states all follow a different
course of action.
For example, in Vorarlberg risk maps
(susceptibility map, vulnerability map, risk map)
were produced in the course of a university
dissertation ([34] RUFF, 2005). For modelling,
bivariate statistics (for landslides) and cost
analysis (for rock fall) were used, working with a
25x25m raster. The susceptibility, meaning spatial
susceptibility, is presented in 5 classes (very low,
low, medium, high, very high). The inventory map
is included in the susceptibility map. On the other
hand, the local department of the Austrian Service
for Torrent and Avalanche Control (WLV) creates
“hazard maps” within the “hazard zoning plan”.
In Upper Austria, Lower Austria,
Burgenland and Carinthia, different approaches
are chosen to develop susceptibility maps
(different scales, processes) derived from existing
data sets and maps ([30] POSCH-TRÖTZMÜLLER
G., 2010): Main focus of Burgenland is
concentrated on shallow landslides with an
annual rate of movement of 1-2cm. For the
prediction of landslide susceptibility based on
morphological and geological factors, the method
called “Weights of Evidence” was chosen ([15]
KLINGSEISEN et al., 2006). Three (respectively
4) hazard zones were classified ([“high Hazard”],
“hazard”, “hazard cannot be excluded”, “no
hazard”, [15] KLINGSEISEN et al., 2006). In
Lower Austria up until now the susceptibility maps
have been created using a heuristic approach
based on geological expertise, historical data and
interpretation of DEM and aerial photos. Three
to ten classes of susceptibility are delineated at
a scale ranging from 1:50,000 to 1:25,000 ([36]
SCHWEIGL & HERVAS 2009). To offer assistance
for the municipalities in land-use planning,
landslide susceptibility maps were generated for
the major settled areas in Upper Austria (OÖ).
For each type of mass movement, the priority,
which is a susceptibility class, was evaluated on
the basis of the intensity and the probability of an
event. The priority was classified in 3 stages (high
– medium – low; [18] KOLMER, 2005). As these
maps include the intensity and the frequency of
mass movements, they can be called “hazard
maps” by definition. Nevertheless it has to be
Fig. 4: WLV-Inventory of mass movements in Austria (source: www.die-wildbach.at)
Abb. 4: Ereignisdatenbank der WLV (Quelle: www.die-wildbach.at)
• The inventory map/event map
(“Ereigniskarte”) contains only information
about processes for which an event date is
known (5W–questions: What, When, Where,
Who, Why). The symbols are correlated to
process type and magnitude (triangle – small
events, pentagon – great events).
• The thematic inventory map contains
only information related to a type of
process, categorized according to the
quality of the data.
The database includes detailed
information about the mass movements (geology,
hydrology, geometric and geographical data,
studies or tests carried out, mitigation measures)
and the source of information (archives, etc.), and
also information about who carried out the field
work and added the data into the database.
There are already 22,000 mass
movements stored in the database. The
compilation of a part of the mass movements
in Austria is publicly accessible via the internet
(www.geologie.ac.at) in German and English.
However, the web application includes only
events such as slides, rock falls, or more complex
mass movements which have been published
already in the media or the internet and are freely
available for everyone ([16]KOCIU et al 2007).
An engineering geological database, as
well as a bibliographical database is also included
in the GEORIOS system.
In cooperation with the Geological
Survey of Carinthia, the Geological Survey of
Austria has created not just one “inventory map”,
but a “level of information”, as is explained in the
following ([17] KOCIU et al 2010):
Level of information:
• Process index map, map of phenomena
(“Prozesshinweiskarte”, “Karte der
Phänomene”): These kinds of maps can have
different scales (1:50,000 and bigger) and
can be of varying quality with information
about process areas as phenomena of mass
movements that have already happened.
• The event inventory (“Ereigniskataster”)
records only those processes for which an
event date is known (5W–questions), it is
independent of a scale and can contain
processes without information on location.
In Carinthia, a digital landslide inventory
was created with historical events of the
last 50 years ([1] BÄK et al 2005).
Hazard assessment and mapping of mass-movements in the EU
Fig. 2: Event inventory of Carinthia with 5W-questions and quality remarks MAXO (M-sure; A-estimate; X-uncertain; O-unknown)
Abb. 2: Ereignisdatenbank von Kärnten mit 5W-Fragen und Qualitätskriterien „MAXO“
Fig. 3: Event map of Carinthia (brown – landslides; blue – earth flow; red – rock fall; green – earth fall)
Abb. 3: Ereigniskarte von Kärnten
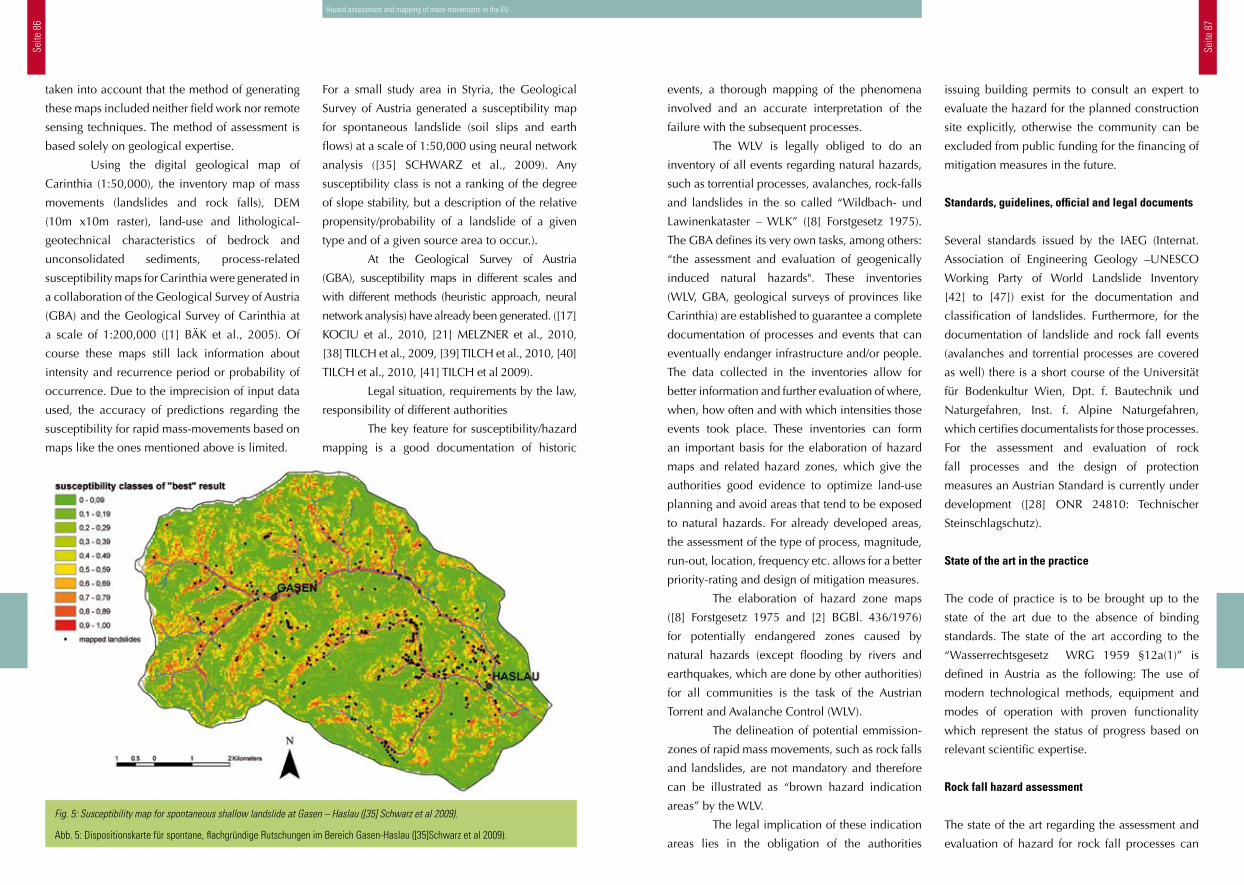
Seite
86
Seite
87
events, a thorough mapping of the phenomena
involved and an accurate interpretation of the
failure with the subsequent processes.
The WLV is legally obliged to do an
inventory of all events regarding natural hazards,
such as torrential processes, avalanches, rock-falls
and landslides in the so called “Wildbach- und
Lawinenkataster – WLK” ([8] Forstgesetz 1975).
The GBA defines its very own tasks, among others:
“the assessment and evaluation of geogenically
induced natural hazards". These inventories
(WLV, GBA, geological surveys of provinces like
Carinthia) are established to guarantee a complete
documentation of processes and events that can
eventually endanger infrastructure and/or people.
The data collected in the inventories allow for
better information and further evaluation of where,
when, how often and with which intensities those
events took place. These inventories can form
an important basis for the elaboration of hazard
maps and related hazard zones, which give the
authorities good evidence to optimize land-use
planning and avoid areas that tend to be exposed
to natural hazards. For already developed areas,
the assessment of the type of process, magnitude,
run-out, location, frequency etc. allows for a better
priority-rating and design of mitigation measures.
The elaboration of hazard zone maps
([8] Forstgesetz 1975 and [2] BGBl. 436/1976)
for potentially endangered zones caused by
natural hazards (except flooding by rivers and
earthquakes, which are done by other authorities)
for all communities is the task of the Austrian
Torrent and Avalanche Control (WLV).
The delineation of potential emmission-
zones of rapid mass movements, such as rock falls
and landslides, are not mandatory and therefore
can be illustrated as “brown hazard indication
areas” by the WLV.
The legal implication of these indication
areas lies in the obligation of the authorities
issuing building permits to consult an expert to
evaluate the hazard for the planned construction
site explicitly, otherwise the community can be
excluded from public funding for the financing of
mitigation measures in the future.
Standards, guidelines, official and legal documents
Several standards issued by the IAEG (Internat.
Association of Engineering Geology –UNESCO
Working Party of World Landslide Inventory
[42] to [47]) exist for the documentation and
classification of landslides. Furthermore, for the
documentation of landslide and rock fall events
(avalanches and torrential processes are covered
as well) there is a short course of the Universität
für Bodenkultur Wien, Dpt. f. Bautechnik und
Naturgefahren, Inst. f. Alpine Naturgefahren,
which certifies documentalists for those processes.
For the assessment and evaluation of rock
fall processes and the design of protection
measures an Austrian Standard is currently under
development ([28] ONR 24810: Technischer
Steinschlagschutz).
State of the art in the practice
The code of practice is to be brought up to the
state of the art due to the absence of binding
standards. The state of the art according to the
“Wasserrechtsgesetz WRG 1959 §12a(1)” is
defined in Austria as the following: The use of
modern technological methods, equipment and
modes of operation with proven functionality
which represent the status of progress based on
relevant scientific expertise.
Rock fall hazard assessment
The state of the art regarding the assessment and
evaluation of hazard for rock fall processes can
Hazard assessment and mapping of mass-movements in the EU
For a small study area in Styria, the Geological
Survey of Austria generated a susceptibility map
for spontaneous landslide (soil slips and earth
flows) at a scale of 1:50,000 using neural network
analysis ([35] SCHWARZ et al., 2009). Any
susceptibility class is not a ranking of the degree
of slope stability, but a description of the relative
propensity/probability of a landslide of a given
type and of a given source area to occur.).
At the Geological Survey of Austria
(GBA), susceptibility maps in different scales and
with different methods (heuristic approach, neural
network analysis) have already been generated. ([17]
KOCIU et al., 2010, [21] MELZNER et al., 2010,
[38] TILCH et al., 2009, [39] TILCH et al., 2010, [40]
TILCH et al., 2010, [41] TILCH et al 2009).
Legal situation, requirements by the law,
responsibility of different authorities
The key feature for susceptibility/hazard
mapping is a good documentation of historic
taken into account that the method of generating
these maps included neither field work nor remote
sensing techniques. The method of assessment is
based solely on geological expertise.
Using the digital geological map of
Carinthia (1:50,000), the inventory map of mass
movements (landslides and rock falls), DEM
(10m x10m raster), land-use and lithological-
geotechnical characteristics of bedrock and
unconsolidated sediments, process-related
susceptibility maps for Carinthia were generated in
a collaboration of the Geological Survey of Austria
(GBA) and the Geological Survey of Carinthia at
a scale of 1:200,000 ([1] BÄK et al., 2005). Of
course these maps still lack information about
intensity and recurrence period or probability of
occurrence. Due to the imprecision of input data
used, the accuracy of predictions regarding the
susceptibility for rapid mass-movements based on
maps like the ones mentioned above is limited.
Fig. 5: Susceptibility map for spontaneous shallow landslide at Gasen – Haslau ([35] Schwarz et al 2009).
Abb. 5: Dispositionskarte für spontane, flachgründige Rutschungen im Bereich Gasen-Haslau ([35]Schwarz et al 2009).
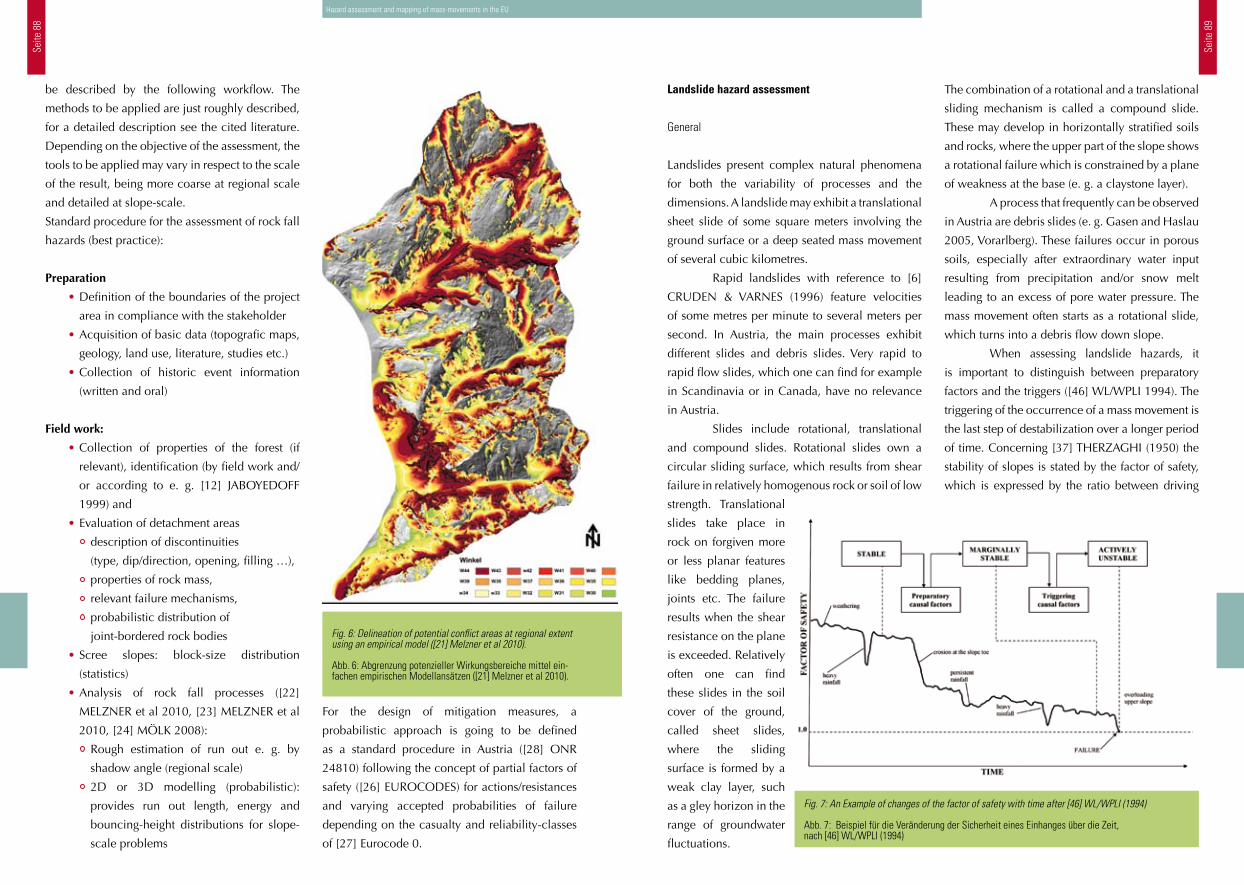
Seite
88
Seite
89
Landslide hazard assessment
General
Landslides present complex natural phenomena
for both the variability of processes and the
dimensions. A landslide may exhibit a translational
sheet slide of some square meters involving the
ground surface or a deep seated mass movement
of several cubic kilometres.
Rapid landslides with reference to [6]
CRUDEN & VARNES (1996) feature velocities
of some metres per minute to several meters per
second. In Austria, the main processes exhibit
different slides and debris slides. Very rapid to
rapid flow slides, which one can find for example
in Scandinavia or in Canada, have no relevance
in Austria.
Slides include rotational, translational
and compound slides. Rotational slides own a
circular sliding surface, which results from shear
failure in relatively homogenous rock or soil of low
strength. Translational
slides take place in
rock on forgiven more
or less planar features
like bedding planes,
joints etc. The failure
results when the shear
resistance on the plane
is exceeded. Relatively
often one can find
these slides in the soil
cover of the ground,
called sheet slides,
where the sliding
surface is formed by a
weak clay layer, such
as a gley horizon in the
range of groundwater
fluctuations.
The combination of a rotational and a translational
sliding mechanism is called a compound slide.
These may develop in horizontally stratified soils
and rocks, where the upper part of the slope shows
a rotational failure which is constrained by a plane
of weakness at the base (e. g. a claystone layer).
A process that frequently can be observed
in Austria are debris slides (e. g. Gasen and Haslau
2005, Vorarlberg). These failures occur in porous
soils, especially after extraordinary water input
resulting from precipitation and/or snow melt
leading to an excess of pore water pressure. The
mass movement often starts as a rotational slide,
which turns into a debris flow down slope.
When assessing landslide hazards, it
is important to distinguish between preparatory
factors and the triggers ([46] WL/WPLI 1994). The
triggering of the occurrence of a mass movement is
the last step of destabilization over a longer period
of time. Concerning [37] THERZAGHI (1950) the
stability of slopes is stated by the factor of safety,
which is expressed by the ratio between driving
Fig. 7: An Example of changes of the factor of safety with time after [46] WL/WPLI (1994)
Abb. 7: Beispiel für die Veränderung der Sicherheit eines Einhanges über die Zeit, nach [46] WL/WPLI (1994)
For the design of mitigation measures, a
probabilistic approach is going to be defined
as a standard procedure in Austria ([28] ONR
24810) following the concept of partial factors of
safety ([26] EUROCODES) for actions/resistances
and varying accepted probabilities of failure
depending on the casualty and reliability-classes
of [27] Eurocode 0.
be described by the following workflow. The
methods to be applied are just roughly described,
for a detailed description see the cited literature.
Depending on the objective of the assessment, the
tools to be applied may vary in respect to the scale
of the result, being more coarse at regional scale
and detailed at slope-scale.
Standard procedure for the assessment of rock fall
hazards (best practice):
Preparation
• Definition of the boundaries of the project
area in compliance with the stakeholder
• Acquisition of basic data (topografic maps,
geology, land use, literature, studies etc.)
• Collection of historic event information
(written and oral)
Field work:
• Collection of properties of the forest (if
relevant), identification (by field work and/
or according to e. g. [12] JABOYEDOFF
1999) and
• Evaluation of detachment areas
description of discontinuities
(type, dip/direction, opening, filling …),
properties of rock mass,
relevant failure mechanisms,
probabilistic distribution of
joint-bordered rock bodies
• Scree slopes: block-size distribution
(statistics)
• Analysis of rock fall processes ([22]
MELZNER et al 2010, [23] MELZNER et al
2010, [24] MÖLK 2008):
Rough estimation of run out e. g. by
shadow angle (regional scale)
2D or 3D modelling (probabilistic):
provides run out length, energy and
bouncing-height distributions for slope-
scale problems
Fig. 6: Delineation of potential conflict areas at regional extent using an empirical model ([21] Melzner et al 2010).
Abb. 6: Abgrenzung potenzieller Wirkungsbereiche mittel ein-fachen empirischen Modellansätzen ([21] Melzner et al 2010).
Hazard assessment and mapping of mass-movements in the EU
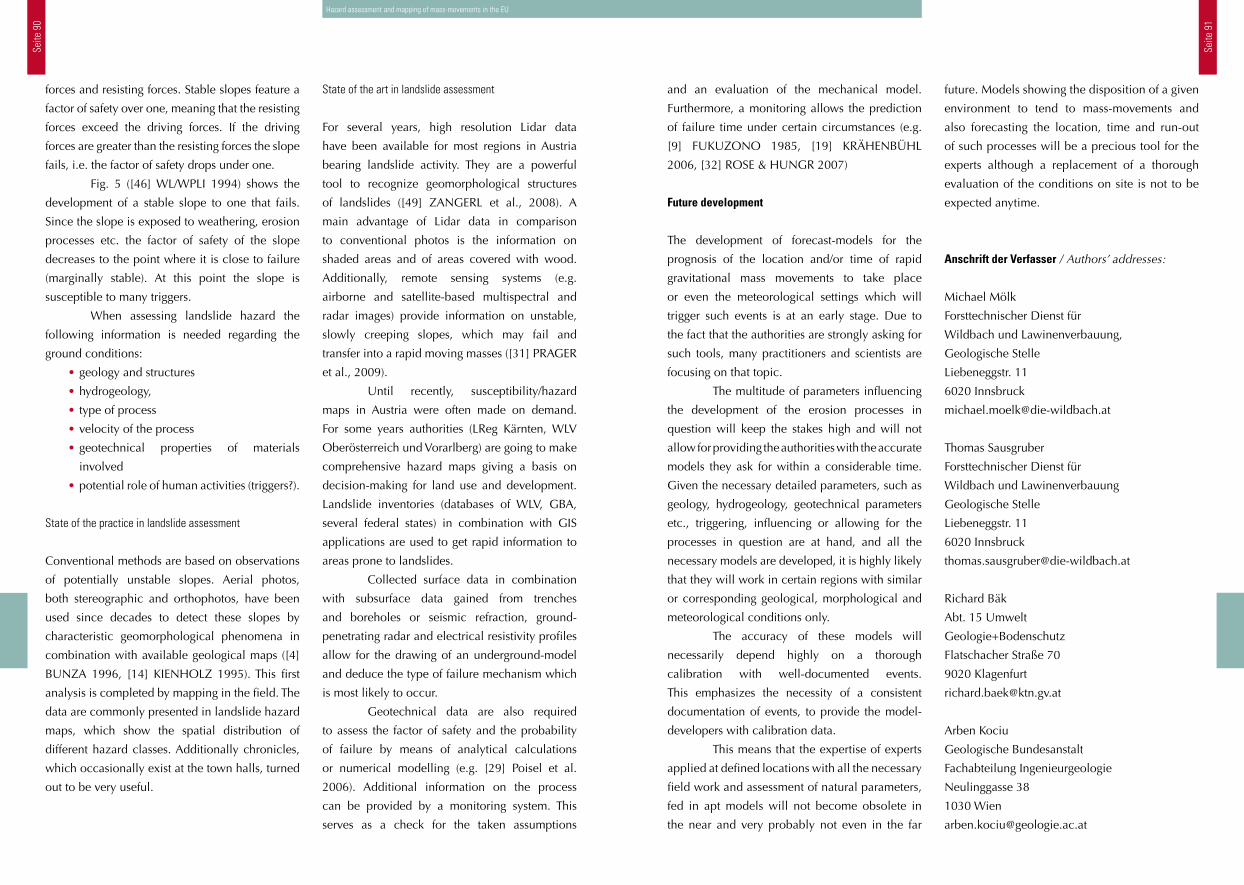
Seite
90
Seite
91
and an evaluation of the mechanical model.
Furthermore, a monitoring allows the prediction
of failure time under certain circumstances (e.g.
[9] FUKUZONO 1985, [19] KRÄHENBÜHL
2006, [32] ROSE & HUNGR 2007)
Future development
The development of forecast-models for the
prognosis of the location and/or time of rapid
gravitational mass movements to take place
or even the meteorological settings which will
trigger such events is at an early stage. Due to
the fact that the authorities are strongly asking for
such tools, many practitioners and scientists are
focusing on that topic.
The multitude of parameters influencing
the development of the erosion processes in
question will keep the stakes high and will not
allow for providing the authorities with the accurate
models they ask for within a considerable time.
Given the necessary detailed parameters, such as
geology, hydrogeology, geotechnical parameters
etc., triggering, influencing or allowing for the
processes in question are at hand, and all the
necessary models are developed, it is highly likely
that they will work in certain regions with similar
or corresponding geological, morphological and
meteorological conditions only.
The accuracy of these models will
necessarily depend highly on a thorough
calibration with well-documented events.
This emphasizes the necessity of a consistent
documentation of events, to provide the model-
developers with calibration data.
This means that the expertise of experts
applied at defined locations with all the necessary
field work and assessment of natural parameters,
fed in apt models will not become obsolete in
the near and very probably not even in the far
future. Models showing the disposition of a given
environment to tend to mass-movements and
also forecasting the location, time and run-out
of such processes will be a precious tool for the
experts although a replacement of a thorough
evaluation of the conditions on site is not to be
expected anytime.
Anschrift der Verfasser / Authors’ addresses:
Michael Mölk
Forsttechnischer Dienst für
Wildbach und Lawinenverbauung,
Geologische Stelle
Liebeneggstr. 11
6020 Innsbruck
Thomas Sausgruber
Forsttechnischer Dienst für
Wildbach und Lawinenverbauung
Geologische Stelle
Liebeneggstr. 11
6020 Innsbruck
Richard Bäk
Abt. 15 Umwelt
Geologie+Bodenschutz
Flatschacher Straße 70
9020 Klagenfurt
Arben Kociu
Geologische Bundesanstalt
Fachabteilung Ingenieurgeologie
Neulinggasse 38
1030 Wien
Hazard assessment and mapping of mass-movements in the EU
State of the art in landslide assessment
For several years, high resolution Lidar data
have been available for most regions in Austria
bearing landslide activity. They are a powerful
tool to recognize geomorphological structures
of landslides ([49] ZANGERL et al., 2008). A
main advantage of Lidar data in comparison
to conventional photos is the information on
shaded areas and of areas covered with wood.
Additionally, remote sensing systems (e.g.
airborne and satellite-based multispectral and
radar images) provide information on unstable,
slowly creeping slopes, which may fail and
transfer into a rapid moving masses ([31] PRAGER
et al., 2009).
Until recently, susceptibility/hazard
maps in Austria were often made on demand.
For some years authorities (LReg Kärnten, WLV
Oberösterreich und Vorarlberg) are going to make
comprehensive hazard maps giving a basis on
decision-making for land use and development.
Landslide inventories (databases of WLV, GBA,
several federal states) in combination with GIS
applications are used to get rapid information to
areas prone to landslides.
Collected surface data in combination
with subsurface data gained from trenches
and boreholes or seismic refraction, ground-
penetrating radar and electrical resistivity profiles
allow for the drawing of an underground-model
and deduce the type of failure mechanism which
is most likely to occur.
Geotechnical data are also required
to assess the factor of safety and the probability
of failure by means of analytical calculations
or numerical modelling (e.g. [29] Poisel et al.
2006). Additional information on the process
can be provided by a monitoring system. This
serves as a check for the taken assumptions
forces and resisting forces. Stable slopes feature a
factor of safety over one, meaning that the resisting
forces exceed the driving forces. If the driving
forces are greater than the resisting forces the slope
fails, i.e. the factor of safety drops under one.
Fig. 5 ([46] WL/WPLI 1994) shows the
development of a stable slope to one that fails.
Since the slope is exposed to weathering, erosion
processes etc. the factor of safety of the slope
decreases to the point where it is close to failure
(marginally stable). At this point the slope is
susceptible to many triggers.
When assessing landslide hazard the
following information is needed regarding the
ground conditions:
• geology and structures
• hydrogeology,
• type of process
• velocity of the process
• geotechnical properties of materials
involved
• potential role of human activities (triggers?).
State of the practice in landslide assessment
Conventional methods are based on observations
of potentially unstable slopes. Aerial photos,
both stereographic and orthophotos, have been
used since decades to detect these slopes by
characteristic geomorphological phenomena in
combination with available geological maps ([4]
BUNZA 1996, [14] KIENHOLZ 1995). This first
analysis is completed by mapping in the field. The
data are commonly presented in landslide hazard
maps, which show the spatial distribution of
different hazard classes. Additionally chronicles,
which occasionally exist at the town halls, turned
out to be very useful.
Seite
92
Seite
93
[36] SCHWEIGL, J.; HERVAS, J. (2009): Landslide Mapping in Austria. JRC Scientific and Technical Report EUR 23785 EN, Office for Official Publications of the European Communities, 61 pp. ISBN 978-92-79-11776-3, Luxembourg, 2009.
[37] TERZAGHI, K. (1950): Mechanism of landslides. Geological Society of America. Berkey Volume 1950, 83-124
[38] TILCH, N. (2009): Datenmanagementsystem GEORIOS (Geogene Risiken Österreich). Vortrag im Rahmen des Landesgeologentages 2009, St. Pölten 2009.
[39] TILCH, N. (2010): Räumliche und skalenabhängige Variabilität der Datenqualität und deren Einfluss auf mittels heuristischer Methode erstellte Dispositionskarten für Massenbewegungen im Lockergestein - eine Fallstudie im Bereich Niederösterreichs –, 12. Geoforum Umhausen 14.-15.10.10, Niederthai, (http://www.geologie.ac.at/pdf/Poster/poster_2010_geoforum_tilch.pdf).
[40] TILCH, N. (2010):Erstellung von Dispositionskarten für Massenbewegungen – Herausforderungen, Methoden, Chancen, Limitierungen.- Vortrag Innsbrucker Hofgespräche 26.05.2010, Innsbruck; (http://bfw.ac.at/050/pdf/IHG_26_05_2010_Tilch_Schwarz.pdf)
[41] TILCH, N., MELZNER, S., JANDA, C. & A. KOCIU (2009): Simple applicable methods for assessing natural hazards caused by landslides and erosion processs in torrent catchments. European Geosciences Union (EGU), General Assembly, 19-24th April 2009, Vienna. (http://www.geologie.ac.at/pdf/Poster/poster_2009_egu_tilch_etal.pdf)
[42] WP/WLI - Working Party on Landslide Inventory (International Geotechnical Societies of UNESCO) (1990): Suggested Nomenclature for Landslides . – Bull. Intern. Ass. Eng. Geology, No. 41, Paris 1990
[43] WP/WLI - Working Party on Landslide Inventory (International Geotechnical Societies of UNESCO) (1990): Suggested Method for Reporting a Landslide . – Bull. Intern. Ass. Eng. Geology, No. 41, Paris 1990
[44] WP/WLI - Working Party on Landslide Inventory (International Geotechnical Societies of UNESCO) (1991): A Suggested Method for a Landslide Summary. – Bull. Intern. Ass. Eng. Geology, No. 43, Paris 1991
[45] WP/WLI - Working Party on Landslide Inventory (International Geotechnical Societies of UNESCO) (1993): A Suggested Method for describing the Activity of a Landslide. – Bull. Intern. Ass. Eng. Geology, No. 47, Paris 1993
[46] WP/WLI - Working Party on Landslide Inventory (International Geotechnical Societies of UNESCO) (1994): A Suggested Method for Reporting Landslide Causes. – Bull. Intern. Ass. Eng. Geology, No. 50, Paris 1994
[47] WP/WLI - Working Party on Landslide Inventory (International Geotechnical Societies of UNESCO) (1995): A Suggested Method for the Rate of Movement of a Landslide. – Bull. Intern. Ass. Eng. Geology, No. 52, Paris 1995
[48] WYLLIE D. C. (2006): Risk management of rock fall hazards. – Sea to Sky Geotechnique, Conference Proceedings, 25-32, Vancouver 2006.
[49] ZANGERL C., PRAGER C., BRANDNER. R., BRÜCKL E., EDER S., FELLIN W., TENTSCHERT E., POSCHER G., & SCHÖNLAUB H. (2008): Methodischer Leitfaden zur prozessorientierten Bearbeitung von Massenbewegungen. Geo.Alp, Vol. 5, S. 1-51, 2008.
[50] ZANGERL C.; PRAGER, Ch. (2008): Influence of geologcial structures on failure initiation, internal derformation and kinematics of rock slides. American Rock Mechanics Association, 08-63, (2008)
Hazard assessment and mapping of mass-movements in the EU
[20] MELZNER, S., LOTTER, M. & A. KOCIU (2009): Development of an efficient methodology for mapping and assessing potential rock fall source areas and runout zones. European Geosciences Union (EGU), General Assembly, 19-24th April 2009, Vienna. (http://www.geologie.ac.at/pdf/Poster/poster_2009_egu_melzner.pdf)
[21] MELZNER, S., DORREN, L. , KOCIU, A. & R. BÄK (2010B): Regionale Ausweisung potentieller Ablöse- und Wirkungsbereichen von Sturzprozessen im Oberen Mölltal/Kärnten. Poster Präsentation beim Geoforum Umhausen 2010, Niederthai, Tirol. (Poster download on GBA homepage www.geologie.ac.at)
[22] MELZNER, S., TILCH, N., LOTTER, M., KOÇIU, A. & BÄK, R. (2010C): Rock fall susceptibility assessment using structural geological indicators for detaching processes such as sliding or toppling. European Geosciences Union (EGU), General Assembly, 02-07 Mai 2010, Wien. (http://www.geologie.ac.at/pdf/Poster/poster_2010_egu_melzner_etal.pdf)
[23] MELZNER, S., MÖLK, M., DORREN, L. & R. BÄK (2010A): Comparing empirical models, 2D and 3D process based models for delineating maximum rockfall runout distances. European Geosciences Union (EGU), General Assembly, 02-07 Mai 2010, Vienna. (http://www.geologie.ac.at/pdf/Poster/poster_2010_egu_melzner_2d_3d.pdf)
[24] MÖLK, M. (2008): Regionalstudie Wipptal Südost: Erfassung und Darstellung von Naturgefahrenpotentialen im Regionalen Maßstab nach EtAlp Standards. Poster Präsentation beim Geoforum Umhausen 2008, Niederthai, Tirol.
[25] MÖLK M. und NEUNER G. (2004): Generelle Legende für Geomorphologische Kartierungen des Forsttechnischen Dienst für Wildbach und Lawinenverbauung, Geologische Stelle, Innsbruck, S.49, 2004
[26] ÖNORM EN 1990: Eurocode: Grundlagen der Tragwerksplanung
[27] ÖNORM EN 1997-1: Eurocode 7: Entwurf, Berechnung und Bemessung in der Geotechnik. Teil 1: Allgemeine Regeln
[28] ONR 24810: Technischer Steinschlagschutz: Begriffe und Definitionen, geologisch-geotechnische Grundlagen, Bemessung und konstruktive Ausgestaltung, Instandhaltung und Wartung. – In preparation, foreseen publication: 2011
[29] POISEL, R., ANGERER, H., PÖLLINGER, M., KALCHER, T., KITTL, H. (2006): Assessment of the Risks Caused by the Landslide Lärchberg ? Galgenwald, Austria. Felsbau 24, No. 3, S. 42-49 (2006)
[30] POSCH-TRÖZMÜLLER, G. (2010): Adapt Alp WP 5.1 Hazard Mapping - Geological Hazards. Literature Survey regarding methods of hazard mapping and evaluation of danger by landslides and rock fall. Final Report, Geologische Bundesanstalt, Wien, 2010 (www.ktn.gv.at/Verwaltung/Abteilungen/Abt.15 Umwelt, Thema Geologie und Bodenschutz)
[31] PRAGER, Ch.; ZANGERL, Ch.; NAGLER, Th. (2009): Geological controls on slope deformations in the Köfels rockslide area (Tyrol, Austria). AJES 102/2 (2009), 4-19
[32] ROSE, N.D. and HUNGR O. (2007): Forecasting potential rock slope failure in open pit mines using the inverse-velocity method. Int. Jour. of Rock Mech. and Min. Science, 44, 308-320, 2007.
[33] RUDOLF-MIKLAU F. & SCHMIDT F. (2004): Implementation, application and enforcement of hazard zone maps for torrent and avalanches control in Austria, Forstliche Schriftenreihe, Universität für Bodenkultur Wien, Bd. 18, p. 83-107, 2004
[34] RUFF, M. (2005): GIS-gestützte Risikonanalyse für Rutschungen und Felsstürze in den Ostalpen (Vorarlberg, Österreich). Georisikokarte Vorarlberg. Diss. Univ. Karlsruhe, 2005.
[35] SCHWARZ, L., TILCH, N. & KOCIU. A. (2009): Landslide sucseptibility mapping by means of artificial Neuronal Networks performed for the region Gasen-Haslau (eastern Styria, Austria) – 6th European Congress on regional Geoscientific Cartography and Information Systems. (http://www.geologie.ac.at/pdf/Poster/poster_2009_euregio.pdf)
Literatur / References:
[1] BÄK, EBERHART, GOLDSCHMIDT, KOCIU, LETOUZE-ZEZULA & LIPIARSKI (2005): Ereigniskataster und Karte der Phänomene als Werkzeug zur Darstellung geogener Naturgefahren (Massenbewegungen), Arb. Tagg. Geol. B.-A., Gmünd 2005
[2] BGBl. Nr. 436/1976: Verordnung des Bundesministers für Land- und Forstwirtschaft vom 30. Juli 1976 über die Gefahrenzonenpläne
[3] BMLFUW (2010): Richtlinie für die Gefahrenzonenplanung-LE.3.3.3/0185-IV/5/2007 vom 12. Jänner 2010[4] BUNZA, G. (1996): Assessment of landslide hazards by means of geological and hydrological risk mapping
[5] BUWAL: Symbolbaukasten zur Kartierung der Phänomene. Mitt. Bundesamt f. Wasser u. Geologie 6, p. 41, 2004
[6] CRUDEN, D.M.; VARNES D. J. (1996): Landslide Types and Processes. In: Turner A.K. and Schuster R.L. (eds.): Landslides: Investigation and mitigation. Special report 247. Washington D.C.: National Academic Press, 36-45,1996.
[7] DORREN, L., JONNSON, M., KRAUTBLATTER, M., MOELK, M. AND STOFFEL, M. (2007): State of the Art in Rock-Fall and Forest Interactions, Schweizerische Zeitschrift für Forstwesen 158 (2007) 6: S 128-141[8] Forstgesetz 1975, § 11
[9] FUKOZONO T. (1985): A new method for predicting the failure time of a slope. Proc. 4th Int. Conf. and field workshop on landslides, Tokyo, 145-150, 1985.
[10] HUNGR, O.; EVANS, S.G. (2004): The occurrence and classification of massive rock slope failure. Felsbau 22, 16-23, 2004.
[11] HUTCHSINSON, J.N. (1988): General Report: Morphological and geotechnical parameters of landslides in the relation to geology and hydrogeology. In: Bonnard (ed.): Proceedings of the 5th International Symposium on Landslides, Vol 1. Rotterdam: Balkema, 3-35, 1988.
[12] HÜBL, J., KOCIU, A., KRISSL, H., LANG, E., LÄNGER, E., RUDOLF-MIKLAU, F., MOSER, A., PICHLER, A., RACHOY, Ch., SCHNETZER, I., SKOLAUT, Ch., TILCH, N. & TOTSCHNIK, R. (2009): Alpine Naturkatastrophen – Lawinen-Muren-Felsstürze-Hochwässer, 120 S..- Leopold Stocker – Verlag, Graz.
[13] JABOYEDOFF Michel, BAILLIFARD Francois, MARRO Christian, PHILIPPOSSIAN Frank & ROUILLER Jean-Daniel (1999): Detection of Rock Instabilities: Matterock Methodology. Joint japa-Swiss
[14] KIENHOLZ, H, KRUMMENACHER, B, LIENER, S. (1995): Erfassung und Modellierung von Hangbewegungen als Beitrag zur Erstellung von Gefahren-Hinweiskarten. Report, Münchner Forum für Massenbewegungen, München
[15] KLINGSEISEN, B., LEOPOLD, Ph., TSCHACH, M. (2006): Mapping Landslide Hazards in Austria: GIS Aids Regional Planning in Non-Alpine Regions. ArcNews 28 (3): 16, 2006.
[16] KOCIU A. et al. (2007): Massenbewegungen in Österreich. – JB der Geol. B.-A. Band 147, Heft 1+2, S 215-220. – Wien 2007
[17] KOCIU, A., TILCH N., SCHWARZ L,. HABERLER A., MELZNER S. (2010): GEORIOS - Jahresbericht 2009; Geol.B.-A. Wien 2010.
[18] KOLMER, Ch. (2009): Geogenes Baugrundrisiko Öberösterreich. Vortrag im Rahmen des Landesgeologentages 2009, St. Pölten 2009.
[19] KRÄHENBÜHL R. (2006): Der Felssturz, der sich auf die Stunde genau ankündigte. Bull. Angew. Geol., 11(1), 49-63, 2006.
Seite
94
Seite
95
step the hazard of landslides is assessed according
to the methods used in the Swiss strategy against
all natural hazards (e.g. floods, avalanches). The
hazard assessment is then integrated into land use
planning and in the risk management (3. step).
First step: Hazard identification
Landslides can be classified according to the
estimated depth of the sliding plane (< 2m: shallow;
2-10 m: intermediate; >10 m: deep) and the long
term mean velocity of the movements (< 2 cm/year:
substabilised; 2-10 cm/year: slow; > 10 cm/year:
active). These depth and velocity parameters are
not always sufficient to estimate the potential
danger of a landslide. Differential movements must
also be taken into account since they can generate
buildings to topple or cracks to open.
Rock falls are characterized by their speed
(< 40 m/s), the size of their elements (Østone < 0.5 m,
Øblock > 0.5 m) and the volumes involved. Rock
avalanches with huge volumes (v > 1million m3)
and high speed (> 40 m/s) can also happen
although these are rare.
Due to heavy rainfall, debris flows and
very shallow landslides are frequent in Switzerland.
These are moderate volume (< 20,000 m3) and
high speed features (1-10 m/s). These phenomena
are very dangerous and annually cause important
traffic disruptions and fatalities.
A map of landslide phenomena and
an associated technical report provide signs
and indications of slope instability as observed
in the field. The map represents phenomena
related to dangerous processes and delineates the
vulnerable areas.
Field interpretation of these phenomena
allows areas vulnerable to landslides to be
mapped. This is based on the observation and
interpretation of landforms, on structural and
geomechanical properties of slope instabilities,
Introduction
Switzerland is a country exposed to many natural
hazards. These hazards include earthquakes, floods,
forest fires, snow avalanches, rock falls and debris
flows. More than 6% of Switzerland is affected by
hazards due to slope instability. These areas occur
mainly in the Prealps and in the Alps. The Randa
rock avalanches of 1991 are a good example of the
potential of such hazards. Thirty million m3 of fallen
debris cut off the valley for two weeks. In another
case, a landslide was reactivated with historically
unprecedented rates of displacement up to 6 m/
day, causing the destruction of the village of Falli-
Hölli in the year 1994.
The legal and technical background
conditions for the protection against landslides
have undergone considerable changes since the
80’s. The flooding of 1987 promoted the federal
authorities to review criteria governing natural
hazard protection. The Federal Flood Protection
Law and the Federal Forest Law came into force in
1991. Their purpose is to protect the environment,
human lives and property from the damage caused
by water, mass movements, snow avalanches and
forest fires. Following the promulgation of these
new regulations, greater emphasis has been
placed on preventive measures. Consequently,
hazard assessment, the identification of protection
objectives, purposeful planning of preventive
measures and the limitation of the residual
risk are of central importance. The cantons are
now required to establish inventories and maps
denoting areas of hazards, and to take them
into account in the land use planning. For the
improvement of the inventories and the hazard
maps, the federal government provides subsides
to the cantonal authorities (50%).
In a first step the landslides are identified
and classified. During this phase inventories and
maps of phenomena are established. In a second
Geological Hazard Assessment in Switzerland
Geologische Gefahrenbeurteilung in der Schweiz
Summary:Geological hazard assessments are based on Swiss laws dealing with natural hazards. Guidelines are published by the Federal Office for the Environment (FOEN/BAFU). According to the integrated risk management, the methods are applied for all natural hazards (landslides, floods, snow avalanches). The hazard maps are dealing with five degrees: high (red), medium (blue), low (yellow), residual (yellow-white), no hazard (white).
Zusammenfassung:Geologische Gefahren werden in der Schweiz gemäß den eidgenössischen Gesetzen über den Wald und den Wasserbau erhoben und beurteilt. Dazu hat das zuständige Bundesamt (heute das Bundesamt für Umwelt BAFU) entsprechende Empfehlungen und Richtlinien veröffentlicht. Im Sinne des integralen Risikomanagements werden für alle Gefahrenprozesse vergleichbare Methoden angewendet und anschließend in der Planung umgesetzt. Das gilt für geologische Massenbewegungen, Hochwasser und Lawinen. Für diese Prozesse werden Gefahrenkarten erstellt, die immer fünf Gefahrenstufen ausscheiden: Hohe, mittlere und geringe Gefahr sowie Restgefährdung und keine Gefährdung. Daraus entstehen die roten, blauen, gelben, gelb-weiß gestreiften und weißen Zonen auf den Gefahrenkarten.
HUGO RAETZO, BERNARD LOUP
Hazard assessment and mapping of mass-movements in the EU
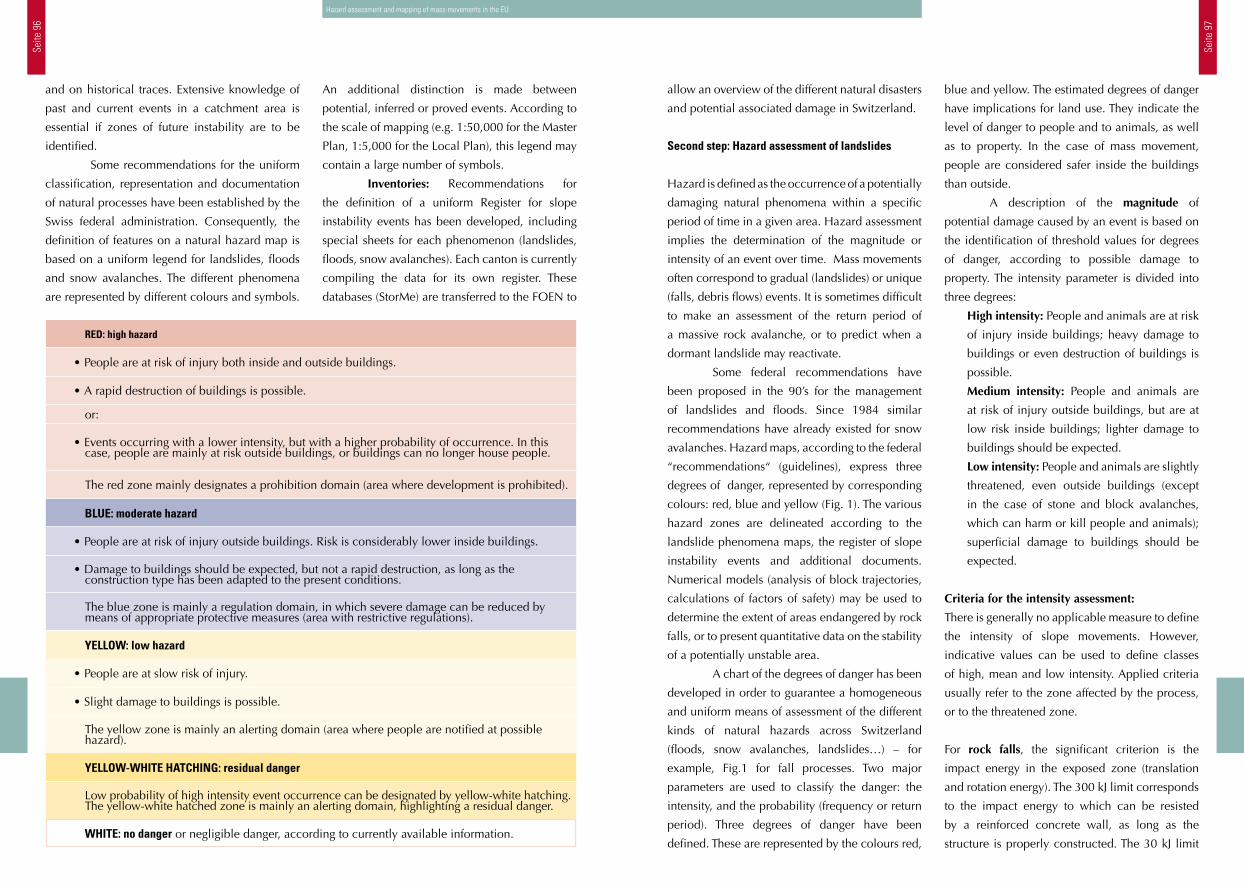
Seite
96
Seite
97
allow an overview of the different natural disasters
and potential associated damage in Switzerland.
Second step: Hazard assessment of landslides
Hazard is defined as the occurrence of a potentially
damaging natural phenomena within a specific
period of time in a given area. Hazard assessment
implies the determination of the magnitude or
intensity of an event over time. Mass movements
often correspond to gradual (landslides) or unique
(falls, debris flows) events. It is sometimes difficult
to make an assessment of the return period of
a massive rock avalanche, or to predict when a
dormant landslide may reactivate.
Some federal recommendations have
been proposed in the 90’s for the management
of landslides and floods. Since 1984 similar
recommendations have already existed for snow
avalanches. Hazard maps, according to the federal
“recommendations“ (guidelines), express three
degrees of danger, represented by corresponding
colours: red, blue and yellow (Fig. 1). The various
hazard zones are delineated according to the
landslide phenomena maps, the register of slope
instability events and additional documents.
Numerical models (analysis of block trajectories,
calculations of factors of safety) may be used to
determine the extent of areas endangered by rock
falls, or to present quantitative data on the stability
of a potentially unstable area.
A chart of the degrees of danger has been
developed in order to guarantee a homogeneous
and uniform means of assessment of the different
kinds of natural hazards across Switzerland
(floods, snow avalanches, landslides…) – for
example, Fig.1 for fall processes. Two major
parameters are used to classify the danger: the
intensity, and the probability (frequency or return
period). Three degrees of danger have been
defined. These are represented by the colours red,
blue and yellow. The estimated degrees of danger
have implications for land use. They indicate the
level of danger to people and to animals, as well
as to property. In the case of mass movement,
people are considered safer inside the buildings
than outside.
A description of the magnitude of
potential damage caused by an event is based on
the identification of threshold values for degrees
of danger, according to possible damage to
property. The intensity parameter is divided into
three degrees:
High intensity: People and animals are at risk
of injury inside buildings; heavy damage to
buildings or even destruction of buildings is
possible.
Medium intensity: People and animals are
at risk of injury outside buildings, but are at
low risk inside buildings; lighter damage to
buildings should be expected.
Low intensity: People and animals are slightly
threatened, even outside buildings (except
in the case of stone and block avalanches,
which can harm or kill people and animals);
superficial damage to buildings should be
expected.
Criteria for the intensity assessment:
There is generally no applicable measure to define
the intensity of slope movements. However,
indicative values can be used to define classes
of high, mean and low intensity. Applied criteria
usually refer to the zone affected by the process,
or to the threatened zone.
For rock falls, the significant criterion is the
impact energy in the exposed zone (translation
and rotation energy). The 300 kJ limit corresponds
to the impact energy to which can be resisted
by a reinforced concrete wall, as long as the
structure is properly constructed. The 30 kJ limit
An additional distinction is made between
potential, inferred or proved events. According to
the scale of mapping (e.g. 1:50,000 for the Master
Plan, 1:5,000 for the Local Plan), this legend may
contain a large number of symbols.
Inventories: Recommendations for
the definition of a uniform Register for slope
instability events has been developed, including
special sheets for each phenomenon (landslides,
floods, snow avalanches). Each canton is currently
compiling the data for its own register. These
databases (StorMe) are transferred to the FOEN to
and on historical traces. Extensive knowledge of
past and current events in a catchment area is
essential if zones of future instability are to be
identified.
Some recommendations for the uniform
classification, representation and documentation
of natural processes have been established by the
Swiss federal administration. Consequently, the
definition of features on a natural hazard map is
based on a uniform legend for landslides, floods
and snow avalanches. The different phenomena
are represented by different colours and symbols.
RED: high hazard
•Peopleareatriskofinjurybothinsideandoutsidebuildings.
•Arapiddestructionofbuildingsispossible.
or:
•Eventsoccurringwithalowerintensity,butwithahigherprobabilityofoccurrence.Inthiscase, people are mainly at risk outside buildings, or buildings can no longer house people.
The red zone mainly designates a prohibition domain (area where development is prohibited).
BLUE: moderate hazard
•Peopleareatriskofinjuryoutsidebuildings.Riskisconsiderablylowerinsidebuildings.
•Damagetobuildingsshouldbeexpected,butnotarapiddestruction,aslongastheconstruction type has been adapted to the present conditions.
The blue zone is mainly a regulation domain, in which severe damage can be reduced by means of appropriate protective measures (area with restrictive regulations).
YELLOW: low hazard
•Peopleareatslowriskofinjury.
•Slightdamagetobuildingsispossible.
The yellow zone is mainly an alerting domain (area where people are notified at possible hazard).
YELLOW-WHITE HATCHING: residual danger
Low probability of high intensity event occurrence can be designated by yellow-white hatching. The yellow-white hatched zone is mainly an alerting domain, highlighting a residual danger.
WHITE: no danger or negligible danger, according to currently available information.
Hazard assessment and mapping of mass-movements in the EU
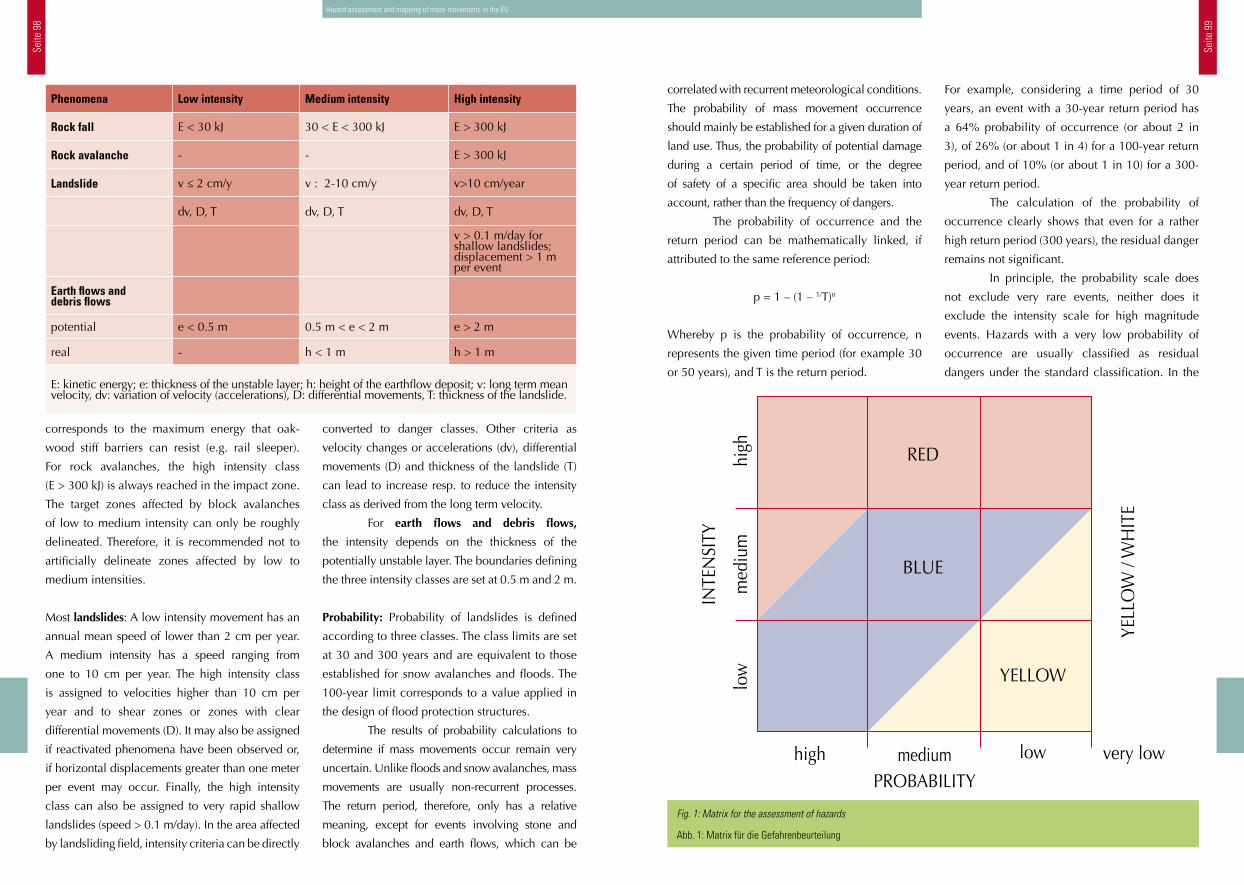
Seite
98
Seite
99
correlated with recurrent meteorological conditions.
The probability of mass movement occurrence
should mainly be established for a given duration of
land use. Thus, the probability of potential damage
during a certain period of time, or the degree
of safety of a specific area should be taken into
account, rather than the frequency of dangers.
The probability of occurrence and the
return period can be mathematically linked, if
attributed to the same reference period:
p = 1 – (1 – 1/T)n
Whereby p is the probability of occurrence, n
represents the given time period (for example 30
or 50 years), and T is the return period.
For example, considering a time period of 30
years, an event with a 30-year return period has
a 64% probability of occurrence (or about 2 in
3), of 26% (or about 1 in 4) for a 100-year return
period, and of 10% (or about 1 in 10) for a 300-
year return period.
The calculation of the probability of
occurrence clearly shows that even for a rather
high return period (300 years), the residual danger
remains not significant.
In principle, the probability scale does
not exclude very rare events, neither does it
exclude the intensity scale for high magnitude
events. Hazards with a very low probability of
occurrence are usually classified as residual
dangers under the standard classification. In the
Fig. 1: Matrix for the assessment of hazards
Abb. 1: Matrix für die Gefahrenbeurteilung
RED
BLUE
YELLOW
YELL
OW
/ W
HIT
E
INTE
NSI
TY
PROBABILITY
low
high
med
ium
low very lowhigh medium
Hazard assessment and mapping of mass-movements in the EU
converted to danger classes. Other criteria as
velocity changes or accelerations (dv), differential
movements (D) and thickness of the landslide (T)
can lead to increase resp. to reduce the intensity
class as derived from the long term velocity.
For earth flows and debris flows,
the intensity depends on the thickness of the
potentially unstable layer. The boundaries defining
the three intensity classes are set at 0.5 m and 2 m.
Probability: Probability of landslides is defined
according to three classes. The class limits are set
at 30 and 300 years and are equivalent to those
established for snow avalanches and floods. The
100-year limit corresponds to a value applied in
the design of flood protection structures.
The results of probability calculations to
determine if mass movements occur remain very
uncertain. Unlike floods and snow avalanches, mass
movements are usually non-recurrent processes.
The return period, therefore, only has a relative
meaning, except for events involving stone and
block avalanches and earth flows, which can be
corresponds to the maximum energy that oak-
wood stiff barriers can resist (e.g. rail sleeper).
For rock avalanches, the high intensity class
(E > 300 kJ) is always reached in the impact zone.
The target zones affected by block avalanches
of low to medium intensity can only be roughly
delineated. Therefore, it is recommended not to
artificially delineate zones affected by low to
medium intensities.
Most landslides: A low intensity movement has an
annual mean speed of lower than 2 cm per year.
A medium intensity has a speed ranging from
one to 10 cm per year. The high intensity class
is assigned to velocities higher than 10 cm per
year and to shear zones or zones with clear
differential movements (D). It may also be assigned
if reactivated phenomena have been observed or,
if horizontal displacements greater than one meter
per event may occur. Finally, the high intensity
class can also be assigned to very rapid shallow
landslides (speed > 0.1 m/day). In the area affected
by landsliding field, intensity criteria can be directly
Phenomena Low intensity Medium intensity High intensity
Rock fall E < 30 kJ 30 < E < 300 kJ E > 300 kJ
Rock avalanche - - E > 300 kJ
Landslide v ≤ 2 cm/y v : 2-10 cm/y v>10 cm/year
dv, D, T dv, D, T dv, D, T
v > 0.1 m/day for shallow landslides; displacement > 1 m per event
Earth flows and debris flows
potential e < 0.5 m 0.5 m < e < 2 m e > 2 m
real - h < 1 m h > 1 m
E: kinetic energy; e: thickness of the unstable layer; h: height of the earthflow deposit; v: long term mean velocity, dv: variation of velocity (accelerations), D: differential movements, T: thickness of the landslide.
Seite
100
Seite
101
The degrees of danger are initially assigned
according to their consequences for construction
activity. They must minimise risks to the safety
of people and animals, as well as minimising
as possible damage to property. In agricultural
zones, buildings affected by different degrees of
danger are constrained by the same conditions as
those in built-up areas.
Conclusions
In Switzerland legal and technical references are
published to clarify which responsibilities the
authorities have and how the assessment has to
be done in order to apply the concept of integral
risk management. The hazard map indicates
which areas are unsuitable for use, according
to existing natural hazard. The integration of
hazard maps into land use planning (including
construction conditions, building licences)
and the development of protective measures to
minimise damage to property are main objectives.
When the hazard map is compared with
existing land use conflicts may occur. Since it is
difficult or impossible to change land use, specific
construction codes are required to reach the
desired protection level. Hazard maps are also
considered in planning protective measures as
well as the installation of warning systems and
emergency plans. The federal recommendations
are on attempt to mitigate natural disasters by
restricting development on unstable areas.
Anschrift der Verfasser / Authors’ addresses:
Hugo Raetzo
Federal Office for the Environment FOEN
Bundesamt für Umwelt BAFU
3003 Bern
Schweiz
Bernard Loup
Federal Office for the Environment FOEN
Bundesamt für Umwelt BAFU
3003 Bern
Schweiz
Literatur / References:
BUNDESAMT FÜR RAUMPLANUNG, BUNDESAMT FÜR WASSERWIRTSCHAFT & BUNDESAMT FÜR UMWELT, WALD UND LANDSCHAFT, (1997). Empfehlungen, Berücksichtigung der Massenbewegungsgefahren bei raumwirksamen Tätigkeiten, EDMZ, 3000 Bern.
CRUDEN D.M. UND VARNES D.J.:Landslide types and processes. In: A. Keith Turner & Robert L. Schuster (eds): Landslide investigation and mitigation: 36-75. Transportation Research Board, special report 247. Washington: National Academy Press, 1996.
KIENHOLZ, H., KRUMMENACHER, B. et al.:Empfehlungen Symbolbaukasten zur Kartierung der Phänomene Ausgabe 1995, Mitteilungen BUWAL Nr. 6, 41 S., Reihe Vollzug Umwelt VU-7502-D, Bern 1995.
RAETZO et al.: Hazard assessment of mass movements – codes of practice in Switzerland, International Association of Engineering Geology IAEG Bulletin, 2002.
RAETZO, H. & LOUP, B.; BAFU: Schutz vor Massenbewegungen. Technische Richtlinie als Vollzugshilfe. Entwurf 9. Sept. 2009.
VARNES, D.J. and IAEG Commission on Landslides and other Mass-Movements: Landslide hazard zonation: a review of principles and practice. The UNESCO Press, Paris, 1984.
Hazard assessment and mapping of mass-movements in the EU
According to Art. 6 of the Federal Law for Land
use Planning, the cantons must identify all areas
that are threatened by natural hazards.
The cantonal Master Plan is a basic
document for land use planning, infrastructural
coordination and accident prevention. It consists
of a map and a technical report, and is based on
studies. The Master Plan allows for deciding the
following:
• It shows how to coordinate activities
associated with different land uses.
• It identifies the goals of planning and
specifies the necessary stages.
• It provides legal constraints to the
authorities in charge of land use planning.
The objectives of the Master Plan with respect to
natural hazards are:
• To early detect conflicts between land use,
development and natural hazards.
• To refine the survey of basic documents
concerning natural hazards.
• To formulate principles that can be applied
by the cantons to the issue of protection
against natural hazard.
• To define necessary requirements and
mandates to be used in subsequent
planning stages.
The constraints on Local Planning already allow
and ensure appropriate management of natural
hazards with respect to land use. The objective
of these constraints is to delineate danger zones
by highlighting restrictions, or to establish legal
frameworks leading to the same ends.
At the same time danger zones can be
delineated on the local plan with areas suitable
for construction as well as additional protection
zones.
domain of dangers related to mass movements,
the limit for a residual danger has been set for an
event with a 300-year return period.
The degree of hazard is defined in a
hazard matrix based on intensity and probability
criteria (Raetzo & Loup 2009). The resulting
hazard map is mainly used for planning (land
use), while the design of protection measures
needs more detailed investigations. In general
the methods used are related to the product,
scales and the risk in order to respect economic
criteria: low efforts are done for the Swiss
indicative map (level 1), important efforts
are done when a hazard map is established
or reviewed (level 2). Detailed analyses and
engineering calculations are foreseen for the
planning of countermeasures (level 3). Applying
this concept rising efforts for geological
investigations are planned when the assessment
on the second or third level takes place.
Third step: Land use planning and risk management
The hazard map is a basic document used in
land use planning. Natural hazards should be
taken into account particularly in the following
situations:
• Elaboration and improvement of cantonal
Master Plan and Communal Local Plans for
land use.
• Planning, construction, transformation of
buildings and infrastructures.
• Granting of concessions and planning
for construction and infrastructural
installations.
• Granting of subsidies for building and
development (road and rail networks,
residences), as well as for slope stabilisation
and protection measures.
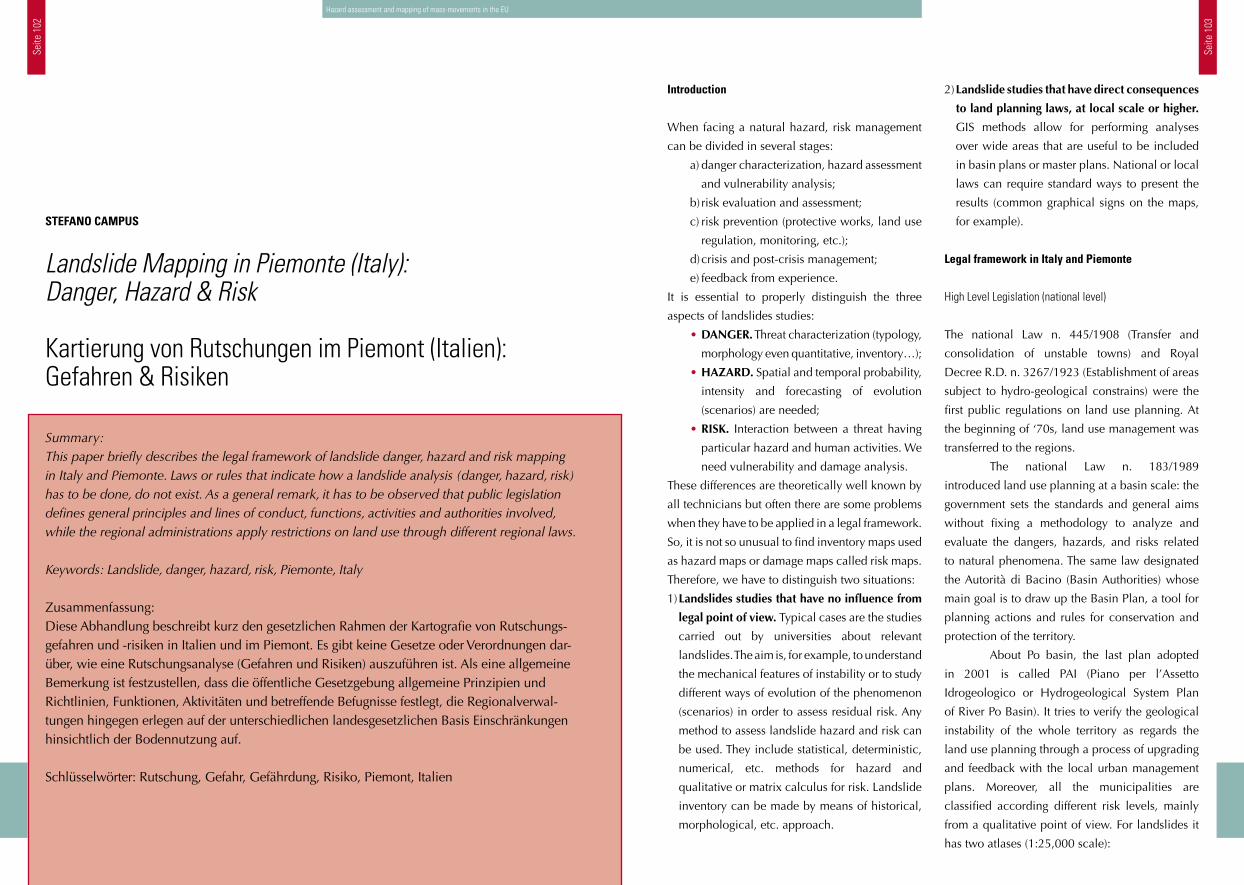
Seite
102
Seite
103
2) Landslide studies that have direct consequences
to land planning laws, at local scale or higher.
GIS methods allow for performing analyses
over wide areas that are useful to be included
in basin plans or master plans. National or local
laws can require standard ways to present the
results (common graphical signs on the maps,
for example).
Legal framework in Italy and Piemonte
High Level Legislation (national level)
The national Law n. 445/1908 (Transfer and
consolidation of unstable towns) and Royal
Decree R.D. n. 3267/1923 (Establishment of areas
subject to hydro-geological constrains) were the
first public regulations on land use planning. At
the beginning of ‘70s, land use management was
transferred to the regions.
The national Law n. 183/1989
introduced land use planning at a basin scale: the
government sets the standards and general aims
without fixing a methodology to analyze and
evaluate the dangers, hazards, and risks related
to natural phenomena. The same law designated
the Autorità di Bacino (Basin Authorities) whose
main goal is to draw up the Basin Plan, a tool for
planning actions and rules for conservation and
protection of the territory.
About Po basin, the last plan adopted
in 2001 is called PAI (Piano per l’Assetto
Idrogeologico or Hydrogeological System Plan
of River Po Basin). It tries to verify the geological
instability of the whole territory as regards the
land use planning through a process of upgrading
and feedback with the local urban management
plans. Moreover, all the municipalities are
classified according different risk levels, mainly
from a qualitative point of view. For landslides it
has two atlases (1:25,000 scale):
Introduction
When facing a natural hazard, risk management
can be divided in several stages:
a) danger characterization, hazard assessment
and vulnerability analysis;
b) risk evaluation and assessment;
c) risk prevention (protective works, land use
regulation, monitoring, etc.);
d) crisis and post-crisis management;
e) feedback from experience.
It is essential to properly distinguish the three
aspects of landslides studies:
• DANGER. Threat characterization (typology,
morphology even quantitative, inventory…);
• HAZARD. Spatial and temporal probability,
intensity and forecasting of evolution
(scenarios) are needed;
• RISK. Interaction between a threat having
particular hazard and human activities. We
need vulnerability and damage analysis.
These differences are theoretically well known by
all technicians but often there are some problems
when they have to be applied in a legal framework.
So, it is not so unusual to find inventory maps used
as hazard maps or damage maps called risk maps.
Therefore, we have to distinguish two situations:
1) Landslides studies that have no influence from
legal point of view. Typical cases are the studies
carried out by universities about relevant
landslides. The aim is, for example, to understand
the mechanical features of instability or to study
different ways of evolution of the phenomenon
(scenarios) in order to assess residual risk. Any
method to assess landslide hazard and risk can
be used. They include statistical, deterministic,
numerical, etc. methods for hazard and
qualitative or matrix calculus for risk. Landslide
inventory can be made by means of historical,
morphological, etc. approach.
Landslide Mapping in Piemonte (Italy): Danger, Hazard & Risk
Kartierung von Rutschungen im Piemont (Italien): Gefahren & Risiken
Summary:This paper briefly describes the legal framework of landslide danger, hazard and risk mapping in Italy and Piemonte. Laws or rules that indicate how a landslide analysis (danger, hazard, risk) has to be done, do not exist. As a general remark, it has to be observed that public legislation defines general principles and lines of conduct, functions, activities and authorities involved, while the regional administrations apply restrictions on land use through different regional laws.
Keywords: Landslide, danger, hazard, risk, Piemonte, Italy
Zusammenfassung:Diese Abhandlung beschreibt kurz den gesetzlichen Rahmen der Kartografie von Rutschungs-gefahren und -risiken in Italien und im Piemont. Es gibt keine Gesetze oder Verordnungen dar-über, wie eine Rutschungsanalyse (Gefahren und Risiken) auszuführen ist. Als eine allgemeine Bemerkung ist festzustellen, dass die öffentliche Gesetzgebung allgemeine Prinzipien und Richtlinien, Funktionen, Aktivitäten und betreffende Befugnisse festlegt, die Regionalverwal-tungen hingegen erlegen auf der unterschiedlichen landesgesetzlichen Basis Einschränkungen hinsichtlich der Bodennutzung auf.
Schlüsselwörter: Rutschung, Gefahr, Gefährdung, Risiko, Piemont, Italien
STEFANO CAMPUS
Hazard assessment and mapping of mass-movements in the EU
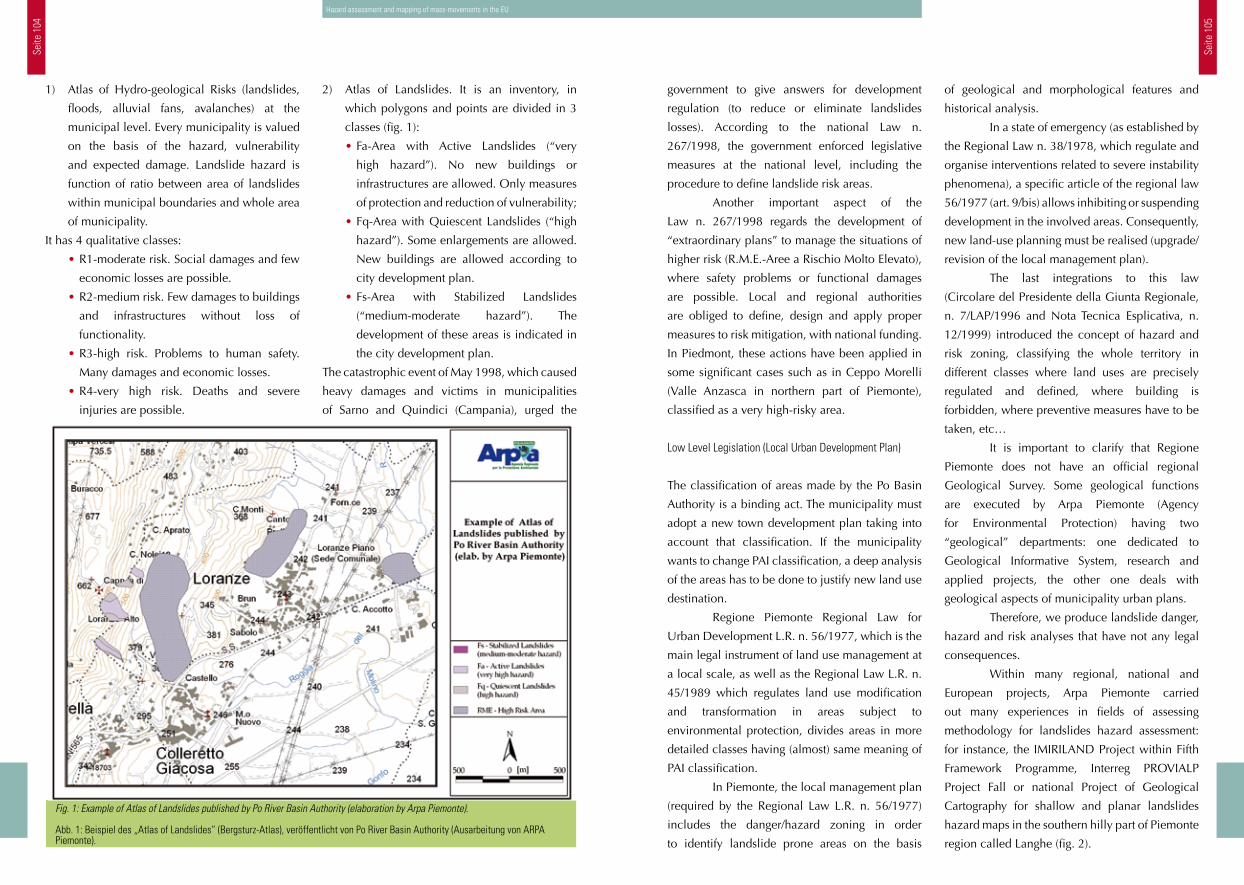
Seite
104
Seite
105
government to give answers for development
regulation (to reduce or eliminate landslides
losses). According to the national Law n.
267/1998, the government enforced legislative
measures at the national level, including the
procedure to define landslide risk areas.
Another important aspect of the
Law n. 267/1998 regards the development of
“extraordinary plans” to manage the situations of
higher risk (R.M.E.-Aree a Rischio Molto Elevato),
where safety problems or functional damages
are possible. Local and regional authorities
are obliged to define, design and apply proper
measures to risk mitigation, with national funding.
In Piedmont, these actions have been applied in
some significant cases such as in Ceppo Morelli
(Valle Anzasca in northern part of Piemonte),
classified as a very high-risky area.
Low Level Legislation (Local Urban Development Plan)
The classification of areas made by the Po Basin
Authority is a binding act. The municipality must
adopt a new town development plan taking into
account that classification. If the municipality
wants to change PAI classification, a deep analysis
of the areas has to be done to justify new land use
destination.
Regione Piemonte Regional Law for
Urban Development L.R. n. 56/1977, which is the
main legal instrument of land use management at
a local scale, as well as the Regional Law L.R. n.
45/1989 which regulates land use modification
and transformation in areas subject to
environmental protection, divides areas in more
detailed classes having (almost) same meaning of
PAI classification.
In Piemonte, the local management plan
(required by the Regional Law L.R. n. 56/1977)
includes the danger/hazard zoning in order
to identify landslide prone areas on the basis
of geological and morphological features and
historical analysis.
In a state of emergency (as established by
the Regional Law n. 38/1978, which regulate and
organise interventions related to severe instability
phenomena), a specific article of the regional law
56/1977 (art. 9/bis) allows inhibiting or suspending
development in the involved areas. Consequently,
new land-use planning must be realised (upgrade/
revision of the local management plan).
The last integrations to this law
(Circolare del Presidente della Giunta Regionale,
n. 7/LAP/1996 and Nota Tecnica Esplicativa, n.
12/1999) introduced the concept of hazard and
risk zoning, classifying the whole territory in
different classes where land uses are precisely
regulated and defined, where building is
forbidden, where preventive measures have to be
taken, etc…
It is important to clarify that Regione
Piemonte does not have an official regional
Geological Survey. Some geological functions
are executed by Arpa Piemonte (Agency
for Environmental Protection) having two
“geological” departments: one dedicated to
Geological Informative System, research and
applied projects, the other one deals with
geological aspects of municipality urban plans.
Therefore, we produce landslide danger,
hazard and risk analyses that have not any legal
consequences.
Within many regional, national and
European projects, Arpa Piemonte carried
out many experiences in fields of assessing
methodology for landslides hazard assessment:
for instance, the IMIRILAND Project within Fifth
Framework Programme, Interreg PROVIALP
Project Fall or national Project of Geological
Cartography for shallow and planar landslides
hazard maps in the southern hilly part of Piemonte
region called Langhe (fig. 2).
2) Atlas of Landslides. It is an inventory, in
which polygons and points are divided in 3
classes (fig. 1):
• Fa-Area with Active Landslides (“very
high hazard”). No new buildings or
infrastructures are allowed. Only measures
of protection and reduction of vulnerability;
• Fq-Area with Quiescent Landslides (“high
hazard”). Some enlargements are allowed.
New buildings are allowed according to
city development plan.
• Fs-Area with Stabilized Landslides
(“medium-moderate hazard”). The
development of these areas is indicated in
the city development plan.
The catastrophic event of May 1998, which caused
heavy damages and victims in municipalities
of Sarno and Quindici (Campania), urged the
1) Atlas of Hydro-geological Risks (landslides,
floods, alluvial fans, avalanches) at the
municipal level. Every municipality is valued
on the basis of the hazard, vulnerability
and expected damage. Landslide hazard is
function of ratio between area of landslides
within municipal boundaries and whole area
of municipality.
It has 4 qualitative classes:
• R1-moderate risk. Social damages and few
economic losses are possible.
• R2-medium risk. Few damages to buildings
and infrastructures without loss of
functionality.
• R3-high risk. Problems to human safety.
Many damages and economic losses.
• R4-very high risk. Deaths and severe
injuries are possible.
Fig. 1: Example of Atlas of Landslides published by Po River Basin Authority (elaboration by Arpa Piemonte).
Abb. 1: Beispiel des „Atlas of Landslides“ (Bergsturz-Atlas), veröffentlicht von Po River Basin Authority (Ausarbeitung von ARPA Piemonte).
Hazard assessment and mapping of mass-movements in the EU
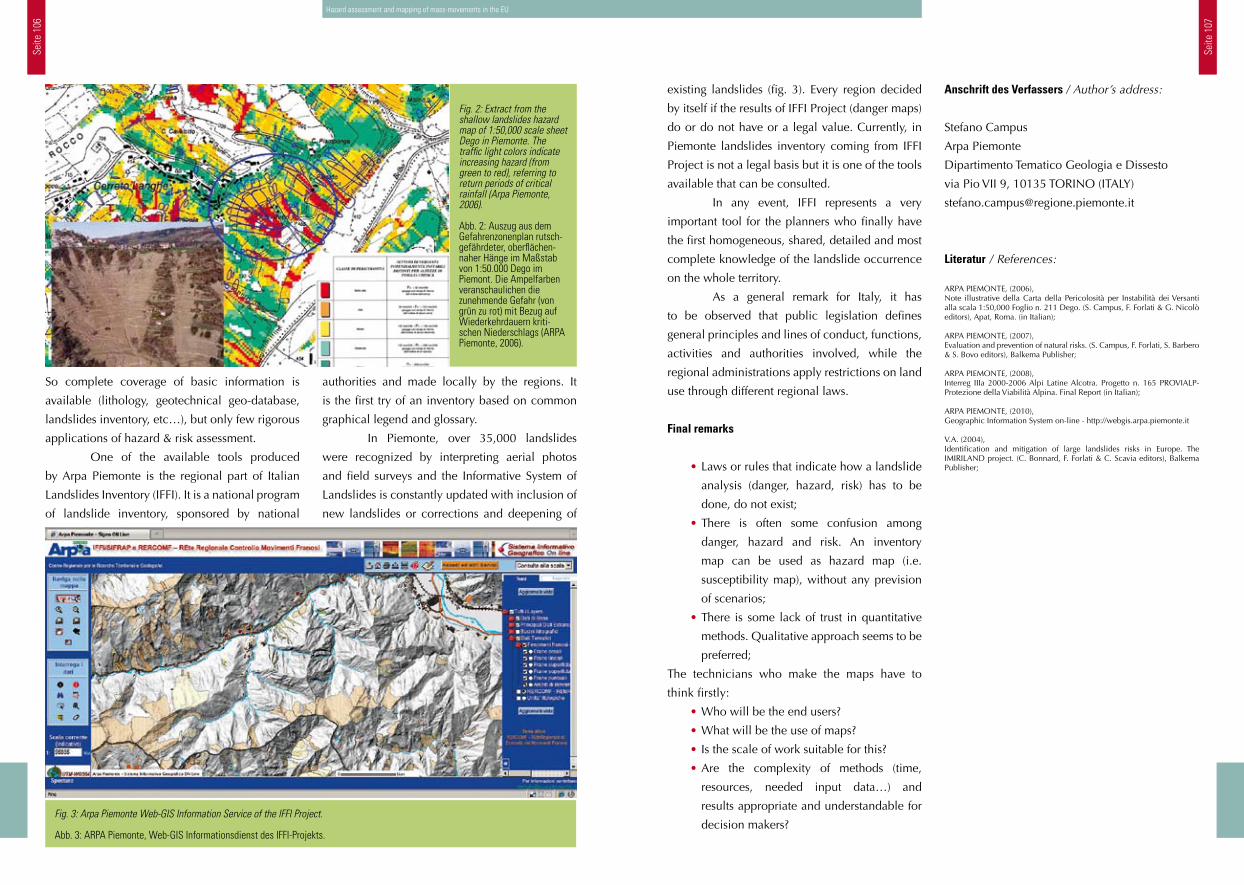
Seite
106
Seite
107
existing landslides (fig. 3). Every region decided
by itself if the results of IFFI Project (danger maps)
do or do not have or a legal value. Currently, in
Piemonte landslides inventory coming from IFFI
Project is not a legal basis but it is one of the tools
available that can be consulted.
In any event, IFFI represents a very
important tool for the planners who finally have
the first homogeneous, shared, detailed and most
complete knowledge of the landslide occurrence
on the whole territory.
As a general remark for Italy, it has
to be observed that public legislation defines
general principles and lines of conduct, functions,
activities and authorities involved, while the
regional administrations apply restrictions on land
use through different regional laws.
Final remarks
• Laws or rules that indicate how a landslide
analysis (danger, hazard, risk) has to be
done, do not exist;
• There is often some confusion among
danger, hazard and risk. An inventory
map can be used as hazard map (i.e.
susceptibility map), without any prevision
of scenarios;
• There is some lack of trust in quantitative
methods. Qualitative approach seems to be
preferred;
The technicians who make the maps have to
think firstly:
• Who will be the end users?
• What will be the use of maps?
• Is the scale of work suitable for this?
• Are the complexity of methods (time,
resources, needed input data…) and
results appropriate and understandable for
decision makers?
Anschrift des Verfassers / Author’s address:
Stefano Campus
Arpa Piemonte
Dipartimento Tematico Geologia e Dissesto
via Pio VII 9, 10135 TORINO (ITALY)
Literatur / References:
ARPA PIEMONTE, (2006),Note illustrative della Carta della Pericolosità per Instabilità dei Versanti alla scala 1:50,000 Foglio n. 211 Dego. (S. Campus, F. Forlati & G. Nicolò editors), Apat, Roma. (in Italian);
ARPA PIEMONTE, (2007), Evaluation and prevention of natural risks. (S. Campus, F. Forlati, S. Barbero & S. Bovo editors), Balkema Publisher;
ARPA PIEMONTE, (2008), Interreg IIIa 2000-2006 Alpi Latine Alcotra. Progetto n. 165 PROVIALP-Protezione della Viabilità Alpina. Final Report (in Italian);
ARPA PIEMONTE, (2010), Geographic Information System on-line - http://webgis.arpa.piemonte.it
V.A. (2004), Identification and mitigation of large landslides risks in Europe. The IMIRILAND project. (C. Bonnard, F. Forlati & C. Scavia editors), Balkema Publisher;
Hazard assessment and mapping of mass-movements in the EU
authorities and made locally by the regions. It
is the first try of an inventory based on common
graphical legend and glossary.
In Piemonte, over 35,000 landslides
were recognized by interpreting aerial photos
and field surveys and the Informative System of
Landslides is constantly updated with inclusion of
new landslides or corrections and deepening of
So complete coverage of basic information is
available (lithology, geotechnical geo-database,
landslides inventory, etc…), but only few rigorous
applications of hazard & risk assessment.
One of the available tools produced
by Arpa Piemonte is the regional part of Italian
Landslides Inventory (IFFI). It is a national program
of landslide inventory, sponsored by national
Fig. 3: Arpa Piemonte Web-GIS Information Service of the IFFI Project.
Abb. 3: ARPA Piemonte, Web-GIS Informationsdienst des IFFI-Projekts.
Fig. 2: Extract from the shallow landslides hazard map of 1:50,000 scale sheet Dego in Piemonte. The traffic light colors indicate increasing hazard (from green to red), referring to return periods of critical rainfall (Arpa Piemonte, 2006).
Abb. 2: Auszug aus dem Gefahrenzonenplan rutsch-gefährdeter, oberflächen-naher Hänge im Maßstab von 1:50.000 Dego im Piemont. Die Ampelfarben veranschaulichen die zunehmende Gefahr (von grün zu rot) mit Bezug auf Wiederkehrdauern kriti-schen Niederschlags (ARPA Piemonte, 2006).
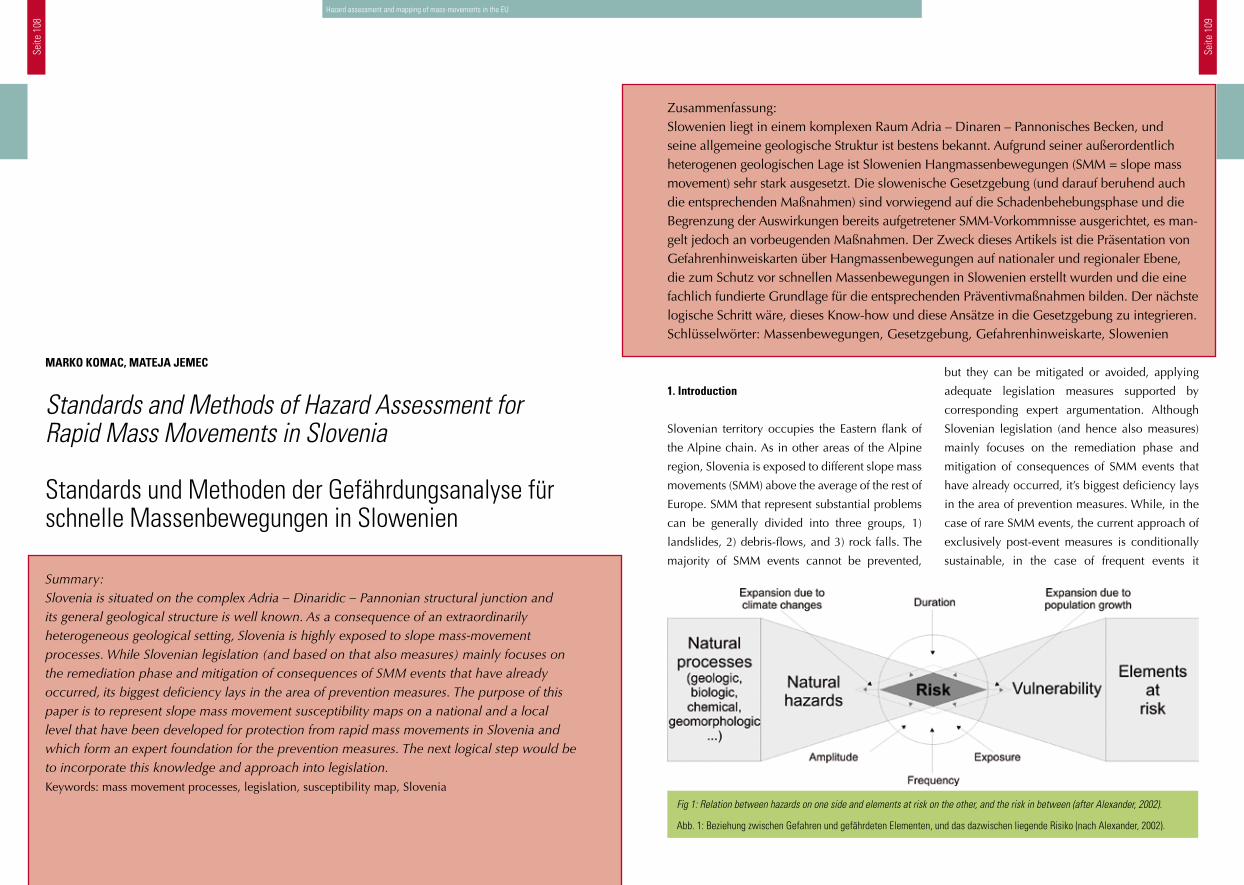
Seite
108
Seite
109
but they can be mitigated or avoided, applying
adequate legislation measures supported by
corresponding expert argumentation. Although
Slovenian legislation (and hence also measures)
mainly focuses on the remediation phase and
mitigation of consequences of SMM events that
have already occurred, it’s biggest deficiency lays
in the area of prevention measures. While, in the
case of rare SMM events, the current approach of
exclusively post-event measures is conditionally
sustainable, in the case of frequent events it
1. Introduction
Slovenian territory occupies the Eastern flank of
the Alpine chain. As in other areas of the Alpine
region, Slovenia is exposed to different slope mass
movements (SMM) above the average of the rest of
Europe. SMM that represent substantial problems
can be generally divided into three groups, 1)
landslides, 2) debris-flows, and 3) rock falls. The
majority of SMM events cannot be prevented,
Fig 1: Relation between hazards on one side and elements at risk on the other, and the risk in between (after Alexander, 2002).
Abb. 1: Beziehung zwischen Gefahren und gefährdeten Elementen, und das dazwischen liegende Risiko (nach Alexander, 2002).
Zusammenfassung:Slowenien liegt in einem komplexen Raum Adria – Dinaren – Pannonisches Becken, und seine allgemeine geologische Struktur ist bestens bekannt. Aufgrund seiner außerordentlich heterogenen geologischen Lage ist Slowenien Hangmassenbewegungen (SMM = slope mass movement) sehr stark ausgesetzt. Die slowenische Gesetzgebung (und darauf beruhend auch die entsprechenden Maßnahmen) sind vorwiegend auf die Schadenbehebungsphase und die Begrenzung der Auswirkungen bereits aufgetretener SMM-Vorkommnisse ausgerichtet, es man-gelt jedoch an vorbeugenden Maßnahmen. Der Zweck dieses Artikels ist die Präsentation von Gefahrenhinweiskarten über Hangmassenbewegungen auf nationaler und regionaler Ebene, die zum Schutz vor schnellen Massenbewegungen in Slowenien erstellt wurden und die eine fachlich fundierte Grundlage für die entsprechenden Präventivmaßnahmen bilden. Der nächste logische Schritt wäre, dieses Know-how und diese Ansätze in die Gesetzgebung zu integrieren.Schlüsselwörter: Massenbewegungen, Gesetzgebung, Gefahrenhinweiskarte, Slowenien
Standards and Methods of Hazard Assessment for Rapid Mass Movements in Slovenia
Standards und Methoden der Gefährdungsanalyse für schnelle Massenbewegungen in Slowenien
MARKO KOMAC, MATEJA JEMEC
Summary:Slovenia is situated on the complex Adria – Dinaridic – Pannonian structural junction and its general geological structure is well known. As a consequence of an extraordinarily heterogeneous geological setting, Slovenia is highly exposed to slope mass-movement processes. While Slovenian legislation (and based on that also measures) mainly focuses on the remediation phase and mitigation of consequences of SMM events that have already occurred, its biggest deficiency lays in the area of prevention measures. The purpose of this paper is to represent slope mass movement susceptibility maps on a national and a local level that have been developed for protection from rapid mass movements in Slovenia and which form an expert foundation for the prevention measures. The next logical step would be to incorporate this knowledge and approach into legislation.Keywords: mass movement processes, legislation, susceptibility map, Slovenia
Hazard assessment and mapping of mass-movements in the EU
Seite
110
Seite
111
Water Act (Official Gazette RS, no. 67/02, 4/09)
Protection against the harmful effects of water
that is among other the issues dealt with this
act also refers to protection against landslides.
Threatened area is defined by Government, which
is responsible for protecting the population,
property and land in dangerous exposed areas.
In order to protect against the harmful effects of
water, land in the threatened area is categorized
into classes based on the risk.
Act on measures to eliminate the consequences of certain
large-scale landslides in 2000 and 2001 (Official Gazette
RS, no. 21/02, 92/03, 98/05)
Act defines the format and the method of
financing and form of allocating state aid for
the implementation of remedial measures, to
prevent the spread of landslide and stabilization
of landslides on the specific area of influence. It
covers several major landslides in Slovenia.
Spatial Development Strategy of Slovenia (Official Gazette
of RS, no. 76/04)
The Spatial Development Strategy of Slovenia is a
public document guiding development in the field
of landslide problematics. It provides a framework
for spatial development throughout the country
and sets guidelines for development in European
space. It provides for the creation of spatial
planning, its use and conservation. The spatial
strategy takes into account social, economic and
environmental factors of spatial development.
Slovenia's Development Strategy
Slovenia's Development Strategy sets out the
vision and objectives of Slovenia and five
development priorities with action plans. The
chapter on protection against natural disasters is
included in the fifth development priority, which
is designed to achieve sustainable development.
Regulation of the spatial order of Slovenia (Official Gazette
of RS, no. 122/04)
Regulation of spatial order in Slovenia provides
the rules for managing the field of landslide
problematic. One of the important articles is
Article 67, in which is mentioned how to plan
according to the limitations which are caused by
natural disasters and water protection.
Resolution of the National Environmental Act (Official
Gazette of RS, no. 2/06)
The National Environmental Action Programme
(NEAP) is the basic strategic document in the
field of environmental protection, aimed at
improving the overall environment and quality
of life and protection of natural resources. NEAP
was prepared under the Environmental Protection
Act and complies with the European Community
Environment Programme, which addresses the
key environmental objectives and priorities
that require leadership from the community.
The objectives and measures are defined in
the four areas, namely: climate change, nature
and biodiversity, quality of life, and waste and
industrial pollution.
3. Methodology
Due to specifics of different slope mass movement
processes, a single approach would be hampered
in its results / prognosis. The following chapter
presents an overview of approaches to slope
mass movements (1 – landslides; 2 – debris-flows;
3 – rock falls) hazard assessment. The presented
approaches are similar to a certain level, they also
differ according to the scale of the assessment. The
Hazard assessment and mapping of mass-movements in the EU
Law on protection against natural and other disasters
(Official Gazette of RS, no. 64/94)
The Act governs the protection against natural
and other disasters and includes the protection of
people, animals, property, cultural heritage and
environment against any hazard or accidents (risk)
that can threaten their safety. The main goal of
the protection against natural and other disasters
system is to reduce the number of disasters, and
to forestall or reduce the number of victims and
other consequences of disaster. The basic tasks
of the system are: prevention, preparedness,
and protection against threats, rescue and help,
providing of basic conditions for life, and recovery.
National program of protection against natural and other
disasters (Official Gazette of RS, no. 44/02)
On the basis of the Resolution, the National
Programme of Protection against Natural and
Other Disasters for the period 2002 – 2007.
The National Programme is oriented towards
the prevention and its basic aim is to reduce the
number of accidents and to prevent or minimise
its consequences.
Law on the Remediation of consequences of natural
disasters (Official Gazette of RS, no. 114/05)
The Act defines a landslide as a natural disaster.
According to the article 11, with some restriction
and at some level of damage, state budget funds
may be used to ease the effects of natural disasters.
Damage assessment is made in accordance
with the Regulation on the methodology for
damage assessment (Official Gazette of RS,
no. 67/03, 79/04), after which the landslide is
considered a landslide, which threats a property
or infrastructure.
becomes unsustainable and brings a huge burden
to the local, regional and state budget. The only
reasonable approach would hence be minimising
interaction between SMM events and elements
at risk. Graphically this interaction would be
presented as a cross-section between the natural
hazard on one side and vulnerability of elements
at risk on other side (Fig 1).
2. Legislation in the field of slope mass movement
domain
In the area of systematic prevention measures
regarding SMM, Slovenia lags behind other Alpine
countries or regions. One of the basic approaches
to solve the problem is to establish potentially
hazardous areas due to natural phenomena and
the inclusion of this information in spatial plans.
Information on geology, upon which the slope
mass movement occurrence heavily depends, it is
not yet an integral part of spatial plans. Legislative
acts deal mostly with remediation issues instead
with the prevention measures.
The protection strategy against landslides
(within legislation the term landslide also other
types of slope mass movements are included)
varies substantially and is tailored according
to different terrain conditions. They are mainly
divided into prevention, emergency protective
measures and permanent measures adopted in the
process for remediation. In the frame of preventive
actions, the emphasis is on creating a national
database of active landslides (and other SMM) and
intentions of government to include hazards doe
to landslides into spatial planning. In the planning
and implementation of emergency protective
measures, the emphasis is on protecting human
lives and property.
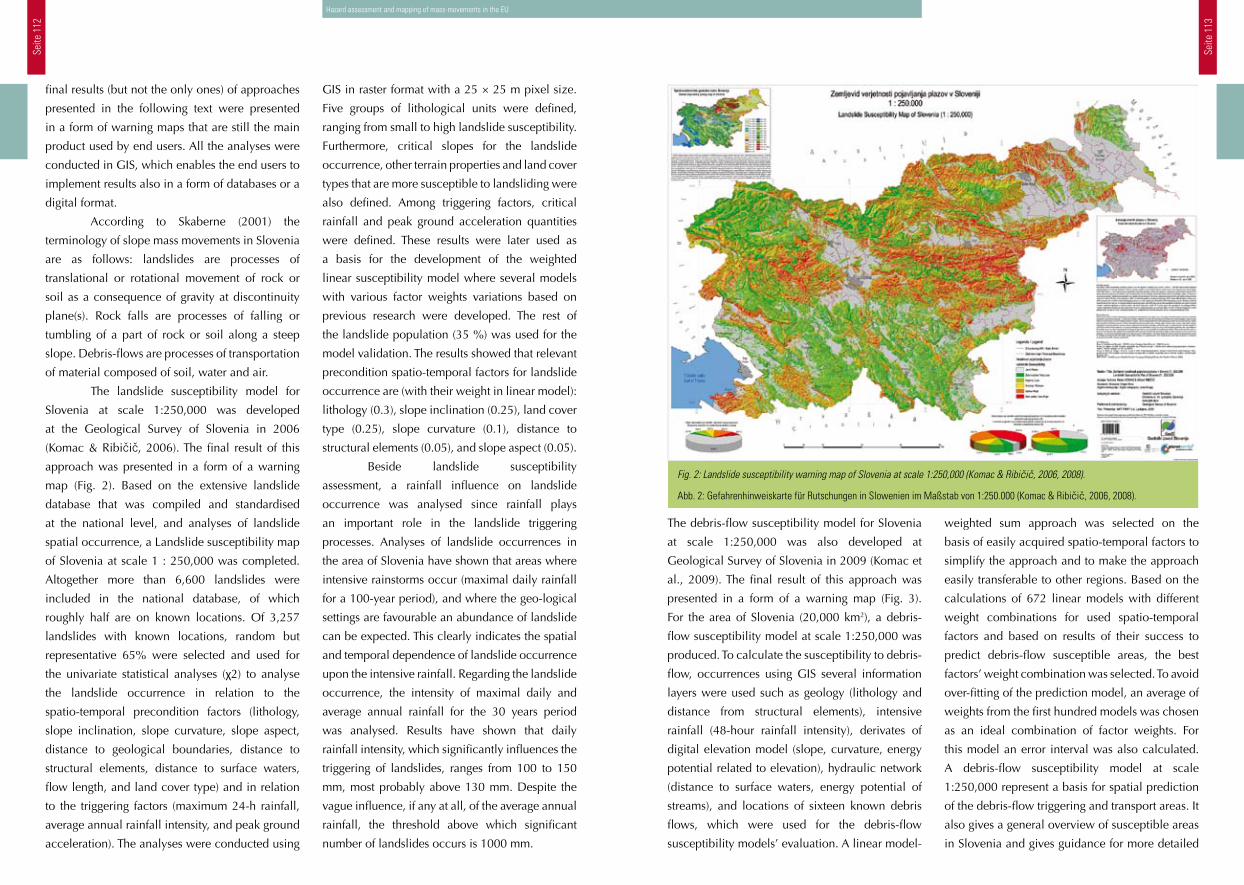
Seite
112
Seite
113
The debris-flow susceptibility model for Slovenia
at scale 1:250,000 was also developed at
Geological Survey of Slovenia in 2009 (Komac et
al., 2009). The final result of this approach was
presented in a form of a warning map (Fig. 3).
For the area of Slovenia (20,000 km2), a debris-
flow susceptibility model at scale 1:250,000 was
produced. To calculate the susceptibility to debris-
flow, occurrences using GIS several information
layers were used such as geology (lithology and
distance from structural elements), intensive
rainfall (48-hour rainfall intensity), derivates of
digital elevation model (slope, curvature, energy
potential related to elevation), hydraulic network
(distance to surface waters, energy potential of
streams), and locations of sixteen known debris
flows, which were used for the debris-flow
susceptibility models’ evaluation. A linear model-
weighted sum approach was selected on the
basis of easily acquired spatio-temporal factors to
simplify the approach and to make the approach
easily transferable to other regions. Based on the
calculations of 672 linear models with different
weight combinations for used spatio-temporal
factors and based on results of their success to
predict debris-flow susceptible areas, the best
factors’ weight combination was selected. To avoid
over-fitting of the prediction model, an average of
weights from the first hundred models was chosen
as an ideal combination of factor weights. For
this model an error interval was also calculated.
A debris-flow susceptibility model at scale
1:250,000 represent a basis for spatial prediction
of the debris-flow triggering and transport areas. It
also gives a general overview of susceptible areas
in Slovenia and gives guidance for more detailed
Fig. 2: Landslide susceptibility warning map of Slovenia at scale 1:250,000 (Komac & Ribičič, 2006, 2008).
Abb. 2: Gefahrenhinweiskarte für Rutschungen in Slowenien im Maßstab von 1:250.000 (Komac & Ribičič, 2006, 2008).
GIS in raster format with a 25 × 25 m pixel size.
Five groups of lithological units were defined,
ranging from small to high landslide susceptibility.
Furthermore, critical slopes for the landslide
occurrence, other terrain properties and land cover
types that are more susceptible to landsliding were
also defined. Among triggering factors, critical
rainfall and peak ground acceleration quantities
were defined. These results were later used as
a basis for the development of the weighted
linear susceptibility model where several models
with various factor weights variations based on
previous research were developed. The rest of
the landslide population (35 %) was used for the
model validation. The results showed that relevant
precondition spatio-temporal factors for landslide
occurrence are (with their weight in linear model):
lithology (0.3), slope inclination (0.25), land cover
type (0.25), slope curvature (0.1), distance to
structural elements (0.05), and slope aspect (0.05).
Beside landslide susceptibility
assessment, a rainfall influence on landslide
occurrence was analysed since rainfall plays
an important role in the landslide triggering
processes. Analyses of landslide occurrences in
the area of Slovenia have shown that areas where
intensive rainstorms occur (maximal daily rainfall
for a 100-year period), and where the geo-logical
settings are favourable an abundance of landslide
can be expected. This clearly indicates the spatial
and temporal dependence of landslide occurrence
upon the intensive rainfall. Regarding the landslide
occurrence, the intensity of maximal daily and
average annual rainfall for the 30 years period
was analysed. Results have shown that daily
rainfall intensity, which significantly influences the
triggering of landslides, ranges from 100 to 150
mm, most probably above 130 mm. Despite the
vague influence, if any at all, of the average annual
rainfall, the threshold above which significant
number of landslides occurs is 1000 mm.
final results (but not the only ones) of approaches
presented in the following text were presented
in a form of warning maps that are still the main
product used by end users. All the analyses were
conducted in GIS, which enables the end users to
implement results also in a form of databases or a
digital format.
According to Skaberne (2001) the
terminology of slope mass movements in Slovenia
are as follows: landslides are processes of
translational or rotational movement of rock or
soil as a consequence of gravity at discontinuity
plane(s). Rock falls are processes of falling or
tumbling of a part of rock or soil along a steep
slope. Debris-flows are processes of transportation
of material composed of soil, water and air.
The landslide susceptibility model for
Slovenia at scale 1:250,000 was developed
at the Geological Survey of Slovenia in 2006
(Komac & Ribičič, 2006). The final result of this
approach was presented in a form of a warning
map (Fig. 2). Based on the extensive landslide
database that was compiled and standardised
at the national level, and analyses of landslide
spatial occurrence, a Landslide susceptibility map
of Slovenia at scale 1 : 250,000 was completed.
Altogether more than 6,600 landslides were
included in the national database, of which
roughly half are on known locations. Of 3,257
landslides with known locations, random but
representative 65% were selected and used for
the univariate statistical analyses (χ2) to analyse
the landslide occurrence in relation to the
spatio-temporal precondition factors (lithology,
slope inclination, slope curvature, slope aspect,
distance to geological boundaries, distance to
structural elements, distance to surface waters,
flow length, and land cover type) and in relation
to the triggering factors (maximum 24-h rainfall,
average annual rainfall intensity, and peak ground
acceleration). The analyses were conducted using
Hazard assessment and mapping of mass-movements in the EU
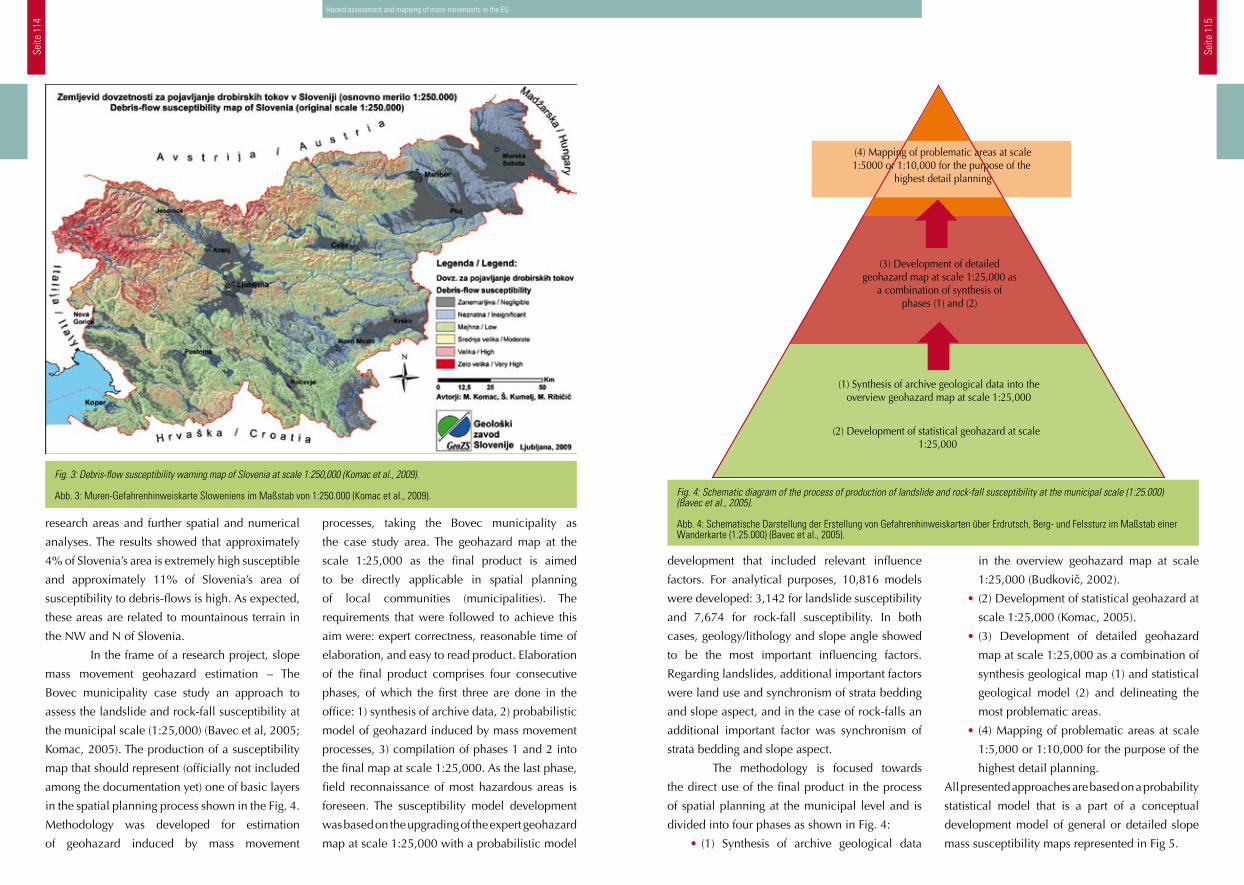
Seite
114
Seite
115
development that included relevant influence
factors. For analytical purposes, 10,816 models
were developed: 3,142 for landslide susceptibility
and 7,674 for rock-fall susceptibility. In both
cases, geology/lithology and slope angle showed
to be the most important influencing factors.
Regarding landslides, additional important factors
were land use and synchronism of strata bedding
and slope aspect, and in the case of rock-falls an
additional important factor was synchronism of
strata bedding and slope aspect.
The methodology is focused towards
the direct use of the final product in the process
of spatial planning at the municipal level and is
divided into four phases as shown in Fig. 4:
• (1) Synthesis of archive geological data
in the overview geohazard map at scale
1:25,000 (Budkovič, 2002).
• (2) Development of statistical geohazard at
scale 1:25,000 (Komac, 2005).
• (3) Development of detailed geohazard
map at scale 1:25,000 as a combination of
synthesis geological map (1) and statistical
geological model (2) and delineating the
most problematic areas.
• (4) Mapping of problematic areas at scale
1:5,000 or 1:10,000 for the purpose of the
highest detail planning.
All presented approaches are based on a probability
statistical model that is a part of a conceptual
development model of general or detailed slope
mass susceptibility maps represented in Fig 5.
Fig. 4: Schematic diagram of the process of production of landslide and rock-fall susceptibility at the municipal scale (1:25.000) (Bavec et al., 2005).
Abb. 4: Schematische Darstellung der Erstellung von Gefahrenhinweiskarten über Erdrutsch, Berg- und Felssturz im Maßstab einer Wanderkarte (1:25.000) (Bavec et al., 2005).
(4) Mapping of problematic areas at scale1:5000 or 1:10,000 for the purpose of the
highest detail planning
(1) Synthesis of archive geological data into theoverview geohazard map at scale 1:25,000
(2) Development of statistical geohazard at scale 1:25,000
(3) Development of detailedgeohazard map at scale 1:25,000 as
a combination of synthesis ofphases (1) and (2)
processes, taking the Bovec municipality as
the case study area. The geohazard map at the
scale 1:25,000 as the final product is aimed
to be directly applicable in spatial planning
of local communities (municipalities). The
requirements that were followed to achieve this
aim were: expert correctness, reasonable time of
elaboration, and easy to read product. Elaboration
of the final product comprises four consecutive
phases, of which the first three are done in the
office: 1) synthesis of archive data, 2) probabilistic
model of geohazard induced by mass movement
processes, 3) compilation of phases 1 and 2 into
the final map at scale 1:25,000. As the last phase,
field reconnaissance of most hazardous areas is
foreseen. The susceptibility model development
was based on the upgrading of the expert geohazard
map at scale 1:25,000 with a probabilistic model
research areas and further spatial and numerical
analyses. The results showed that approximately
4% of Slovenia’s area is extremely high susceptible
and approximately 11% of Slovenia’s area of
susceptibility to debris-flows is high. As expected,
these areas are related to mountainous terrain in
the NW and N of Slovenia.
In the frame of a research project, slope
mass movement geohazard estimation – The
Bovec municipality case study an approach to
assess the landslide and rock-fall susceptibility at
the municipal scale (1:25,000) (Bavec et al, 2005;
Komac, 2005). The production of a susceptibility
map that should represent (officially not included
among the documentation yet) one of basic layers
in the spatial planning process shown in the Fig. 4.
Methodology was developed for estimation
of geohazard induced by mass movement
Fig. 3: Debris-flow susceptibility warning map of Slovenia at scale 1:250,000 (Komac et al., 2009).
Abb. 3: Muren-Gefahrenhinweiskarte Sloweniens im Maßstab von 1:250.000 (Komac et al., 2009).
Hazard assessment and mapping of mass-movements in the EU
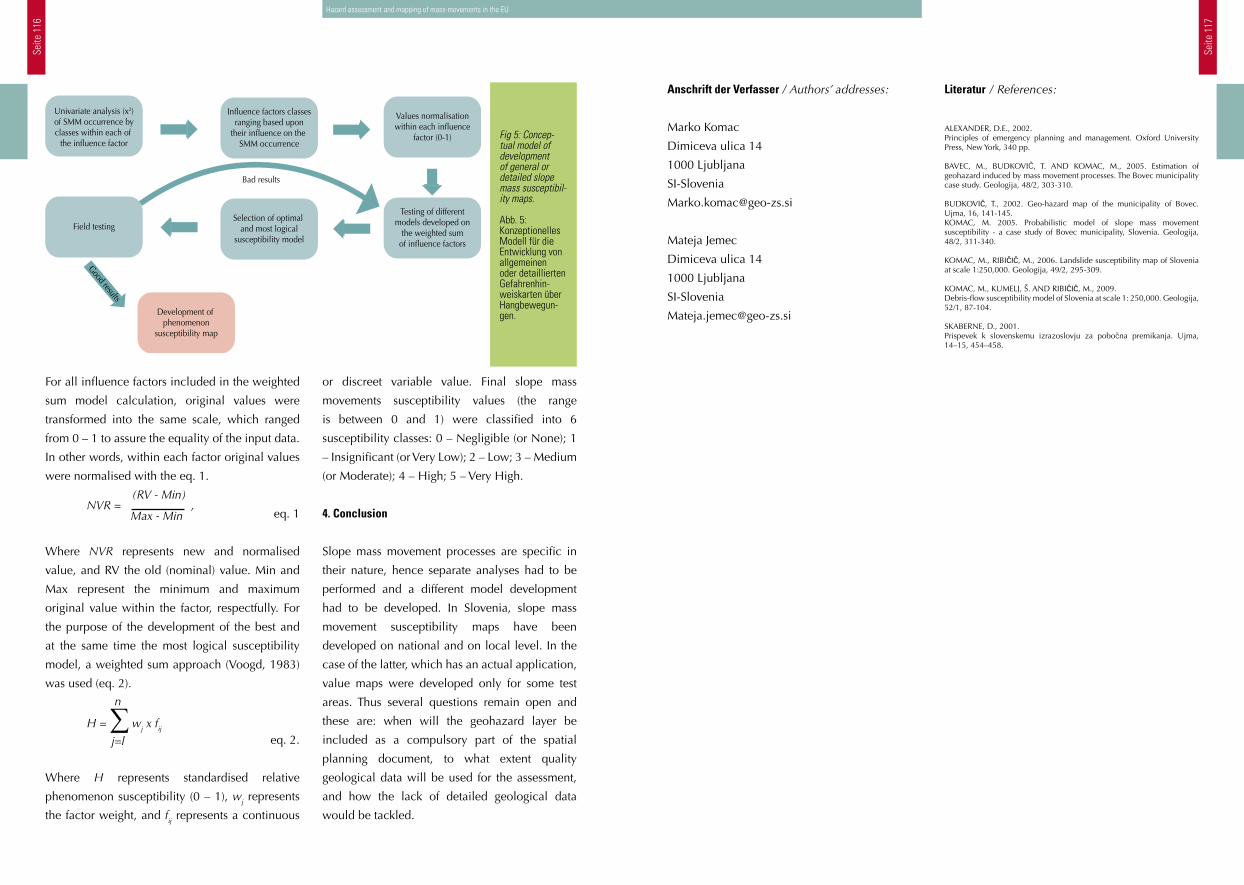
Seite
116
Seite
117
Anschrift der Verfasser / Authors’ addresses:
Marko Komac
Dimiceva ulica 14
1000 Ljubljana
SI-Slovenia
Mateja Jemec
Dimiceva ulica 14
1000 Ljubljana
SI-Slovenia
Literatur / References:
ALEXANDER, D.E., 2002. Principles of emergency planning and management. Oxford University Press, New York, 340 pp.
BAVEC, M., BUDKOVIČ, T. AND KOMAC, M., 2005. Estimation of geohazard induced by mass movement processes. The Bovec municipality case study. Geologija, 48/2, 303-310.
BUDKOVIČ, T., 2002. Geo-hazard map of the municipality of Bovec. Ujma, 16, 141-145.KOMAC, M. 2005. Probabilistic model of slope mass movement susceptibility - a case study of Bovec municipality, Slovenia. Geologija, 48/2, 311-340.
KOMAC, M., RIBIČIČ, M., 2006. Landslide susceptibility map of Slovenia at scale 1:250,000. Geologija, 49/2, 295-309.
KOMAC, M., KUMELJ, Š. AND RIBIČIČ, M., 2009. Debris-flow susceptibility model of Slovenia at scale 1: 250,000. Geologija, 52/1, 87-104.
SKABERNE, D., 2001. Prispevek k slovenskemu izrazoslovju za pobočna premikanja. Ujma, 14–15, 454–458.
Hazard assessment and mapping of mass-movements in the EU
or discreet variable value. Final slope mass
movements susceptibility values (the range
is between 0 and 1) were classified into 6
susceptibility classes: 0 – Negligible (or None); 1
– Insignificant (or Very Low); 2 – Low; 3 – Medium
(or Moderate); 4 – High; 5 – Very High.
4. Conclusion
Slope mass movement processes are specific in
their nature, hence separate analyses had to be
performed and a different model development
had to be developed. In Slovenia, slope mass
movement susceptibility maps have been
developed on national and on local level. In the
case of the latter, which has an actual application,
value maps were developed only for some test
areas. Thus several questions remain open and
these are: when will the geohazard layer be
included as a compulsory part of the spatial
planning document, to what extent quality
geological data will be used for the assessment,
and how the lack of detailed geological data
would be tackled.
For all influence factors included in the weighted
sum model calculation, original values were
transformed into the same scale, which ranged
from 0 – 1 to assure the equality of the input data.
In other words, within each factor original values
were normalised with the eq. 1.
eq. 1
Where NVR represents new and normalised
value, and RV the old (nominal) value. Min and
Max represent the minimum and maximum
original value within the factor, respectfully. For
the purpose of the development of the best and
at the same time the most logical susceptibility
model, a weighted sum approach (Voogd, 1983)
was used (eq. 2).
eq. 2.
Where H represents standardised relative
phenomenon susceptibility (0 – 1), wj represents
the factor weight, and fij represents a continuous
Fig 5: Concep-tual model of development of general or detailed slope mass susceptibil-ity maps.
Abb. 5: Konzeptionelles Modell für die Entwicklung von allgemeinen oder detaillierten Gefahrenhin-weiskarten über Hangbewegun-gen.Development of
phenomenonsusceptibility map
Testing of differentmodels developed on
the weighted sumof influence factors
Selection of optimal and most logical
susceptibility model
Univariate analysis (x2)of SMM occurrence byclasses within each of
the influence factor
Influence factors classesranging based upon
their influence on the SMM occurrence
Values normalisationwithin each influence
factor (0-1)
Field testing
Bad results
Good results
(RV - Min)NVR = , Max - Min
H = ∑ wj x fij j=l
n
Seite
118
Seite
119
• Main data of the topic mass movements and
subrosion / karst with information about the
spatial positioning, about determination of
coordinates, etc.
• Commonly shared technical data of the
subject mass movements and subrosion /
karst with information about the date
of origin, about the land use and about
damage, etc.
• Specific technical data of the subject mass
movement and subrosion / karst
• Data concerning subsidence and uplift
Computerized modelling increasingly allows
the identification of hazard areas that have been
verified using the landslide inventory or through
evaluation of the results of field work. The
current emphasis in Germany is on hydrological
modelling of flood events that are used for
water management issues in flood prevention.
Geotechnical modelling is used increasingly for
rock falls, avalanches and shallow landslides.
1. Introduction
In Germany, geogenic natural hazards, such
as mass movements, karstification, large scale
flooding as well as ground subsidence and uplift
affecting building ground, shall be recorded,
assessed and spatially represented using a common
minimal standard in the future. For this purpose,
the “Geohazards” team of engineering geologists
of the different German federal governmental
departments of geology (SGD) are giving
recommendations on how to create a hazard map.
These recommendations of minimum requirements
are directed at the employees of the SGD. An
important component for developing hazard maps
is the construction and evaluation of landslide
inventories (e.g. landslide or sinkhole inventories).
The recorded data in the inventories
should have a minimal nationwide standard and
are divided into:
Hazard assessment and mapping of mass-movements in the EU
Zusammenfassung:Informationen über geogene Gefährdungen (z.B. Steinschlag, Felsstürze, Rutschungen) sind als GEORISK-Daten über das Bodeninformationssystem Bayern (BIS-BY) im Internet oder Intranet abrufbar (www.bis.bayern.de). Dieses Informationssystem wird bereits von vielen Fachstellen genutzt. Neben den Landkreisen sowie vielen Kommunen sind die Behörden der Wasserwirtschaft, der Straßen- und Forstverwaltung sowie private Planer die Hauptnutzer. Im BIS-BY ist bisher allerdings nur das Herkunftsgebiet von Gefährdungen dargestellt, nicht der planungsrelevante Gefährdungsbereich. Dieser kann nur durch empirische oder numerische Simulationen und Modellierungen abgegrenzt werden. Die Gefahrenhinweiskarte gibt eine Übersicht über die Gefährdungssituation. Sie basiert sowohl auf Modellrechnungen als auch auf empirischen Untersuchungen und wird mit dem GEORISK-Ereigniskataster (BIS-BY) auf Plausibilität geprüft. Bezüglich der räumlichen Ab-grenzung kann sie Ungenauigkeiten enthalten und die Gefährdung nicht in jedem Fall genau wiedergeben. Die Gefahrenhinweiskarte hält für große Gebiete flächendeckend fest, wo mit welchen Gefahren gerechnet werden muss. Daraus lassen sich mit geringem Aufwand mögliche Konfliktstellen zwischen Gefahr und Nutzung ableiten. Die Gefahrenhinweiskarten können einerseits in Flächennutzungspläne mit einfließen und dienen anderseits zur Prioritä-tensetzung beim Erarbeiten weitergehender Maßnahmen.
Standards and Methods of Hazard Assessment for Geological Dangers (Mass Movements) in Bavaria
Standards und Methoden zur Verminderung von geologischen Gefährdungen durch Massenbewegungen in Bayern
KARL MAYER, ANDREAS VON POSCHINGER
Summary:Information about geological hazards in the Bavarian Alps (e.g. rock falls, landslides) is available in the Internet or intranet section Georisk of the Bodeninformationssystem Bayern (BIS-BY) (www.bis.bayern.de). This information system is already used by a number of departments such as district administrations, water and traffic management offices, forest management as well as private users. By now the BIS-BY only shows the sites of origin of geological hazards and not the whole endangered area, which would be relevant for land use planning. This area, the so called process area, can only be defined by empirical or numerical simulations and models.A hazard map gives an overview of the situation. It is based on model calculations and empirical analysis and can be verified by the Georisk-cadastre (BIS-BY). Concerning the spatial extent of the process areas, possible inaccuracies may impair an exact expression of the danger. The hazard map shows large areas where a special type of danger can be assumed. Therefore, will be easier to deduce possible conflicts between hazards and land use. Hazard maps can be included in the land development plan or can be used to assign priorities while taking measures.
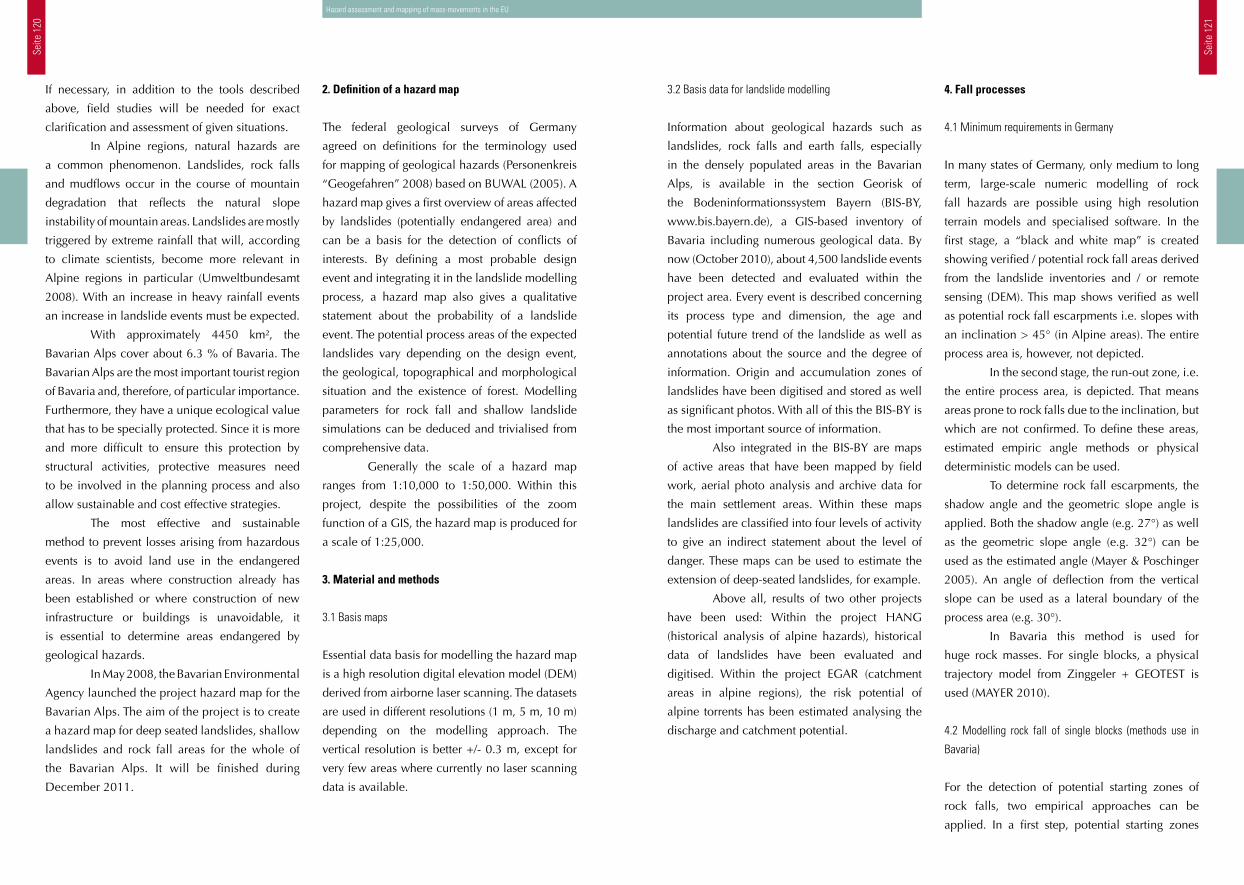
Seite
120
Seite
121
3.2 Basis data for landslide modelling
Information about geological hazards such as
landslides, rock falls and earth falls, especially
in the densely populated areas in the Bavarian
Alps, is available in the section Georisk of
the Bodeninformationssystem Bayern (BIS-BY,
www.bis.bayern.de), a GIS-based inventory of
Bavaria including numerous geological data. By
now (October 2010), about 4,500 landslide events
have been detected and evaluated within the
project area. Every event is described concerning
its process type and dimension, the age and
potential future trend of the landslide as well as
annotations about the source and the degree of
information. Origin and accumulation zones of
landslides have been digitised and stored as well
as significant photos. With all of this the BIS-BY is
the most important source of information.
Also integrated in the BIS-BY are maps
of active areas that have been mapped by field
work, aerial photo analysis and archive data for
the main settlement areas. Within these maps
landslides are classified into four levels of activity
to give an indirect statement about the level of
danger. These maps can be used to estimate the
extension of deep-seated landslides, for example.
Above all, results of two other projects
have been used: Within the project HANG
(historical analysis of alpine hazards), historical
data of landslides have been evaluated and
digitised. Within the project EGAR (catchment
areas in alpine regions), the risk potential of
alpine torrents has been estimated analysing the
discharge and catchment potential.
4. Fall processes
4.1 Minimum requirements in Germany
In many states of Germany, only medium to long
term, large-scale numeric modelling of rock
fall hazards are possible using high resolution
terrain models and specialised software. In the
first stage, a “black and white map” is created
showing verified / potential rock fall areas derived
from the landslide inventories and / or remote
sensing (DEM). This map shows verified as well
as potential rock fall escarpments i.e. slopes with
an inclination > 45° (in Alpine areas). The entire
process area is, however, not depicted.
In the second stage, the run-out zone, i.e.
the entire process area, is depicted. That means
areas prone to rock falls due to the inclination, but
which are not confirmed. To define these areas,
estimated empiric angle methods or physical
deterministic models can be used.
To determine rock fall escarpments, the
shadow angle and the geometric slope angle is
applied. Both the shadow angle (e.g. 27°) as well
as the geometric slope angle (e.g. 32°) can be
used as the estimated angle (Mayer & Poschinger
2005). An angle of deflection from the vertical
slope can be used as a lateral boundary of the
process area (e.g. 30°).
In Bavaria this method is used for
huge rock masses. For single blocks, a physical
trajectory model from Zinggeler + GEOTEST is
used (MAYER 2010).
4.2 Modelling rock fall of single blocks (methods use in
Bavaria)
For the detection of potential starting zones of
rock falls, two empirical approaches can be
applied. In a first step, potential starting zones
2. Definition of a hazard map
The federal geological surveys of Germany
agreed on definitions for the terminology used
for mapping of geological hazards (Personenkreis
“Geogefahren” 2008) based on BUWAL (2005). A
hazard map gives a first overview of areas affected
by landslides (potentially endangered area) and
can be a basis for the detection of conflicts of
interests. By defining a most probable design
event and integrating it in the landslide modelling
process, a hazard map also gives a qualitative
statement about the probability of a landslide
event. The potential process areas of the expected
landslides vary depending on the design event,
the geological, topographical and morphological
situation and the existence of forest. Modelling
parameters for rock fall and shallow landslide
simulations can be deduced and trivialised from
comprehensive data.
Generally the scale of a hazard map
ranges from 1:10,000 to 1:50,000. Within this
project, despite the possibilities of the zoom
function of a GIS, the hazard map is produced for
a scale of 1:25,000.
3. Material and methods
3.1 Basis maps
Essential data basis for modelling the hazard map
is a high resolution digital elevation model (DEM)
derived from airborne laser scanning. The datasets
are used in different resolutions (1 m, 5 m, 10 m)
depending on the modelling approach. The
vertical resolution is better +/- 0.3 m, except for
very few areas where currently no laser scanning
data is available.
If necessary, in addition to the tools described
above, field studies will be needed for exact
clarification and assessment of given situations.
In Alpine regions, natural hazards are
a common phenomenon. Landslides, rock falls
and mudflows occur in the course of mountain
degradation that reflects the natural slope
instability of mountain areas. Landslides are mostly
triggered by extreme rainfall that will, according
to climate scientists, become more relevant in
Alpine regions in particular (Umweltbundesamt
2008). With an increase in heavy rainfall events
an increase in landslide events must be expected.
With approximately 4450 km², the
Bavarian Alps cover about 6.3 % of Bavaria. The
Bavarian Alps are the most important tourist region
of Bavaria and, therefore, of particular importance.
Furthermore, they have a unique ecological value
that has to be specially protected. Since it is more
and more difficult to ensure this protection by
structural activities, protective measures need
to be involved in the planning process and also
allow sustainable and cost effective strategies.
The most effective and sustainable
method to prevent losses arising from hazardous
events is to avoid land use in the endangered
areas. In areas where construction already has
been established or where construction of new
infrastructure or buildings is unavoidable, it
is essential to determine areas endangered by
geological hazards.
In May 2008, the Bavarian Environmental
Agency launched the project hazard map for the
Bavarian Alps. The aim of the project is to create
a hazard map for deep seated landslides, shallow
landslides and rock fall areas for the whole of
the Bavarian Alps. It will be finished during
December 2011.
Hazard assessment and mapping of mass-movements in the EU
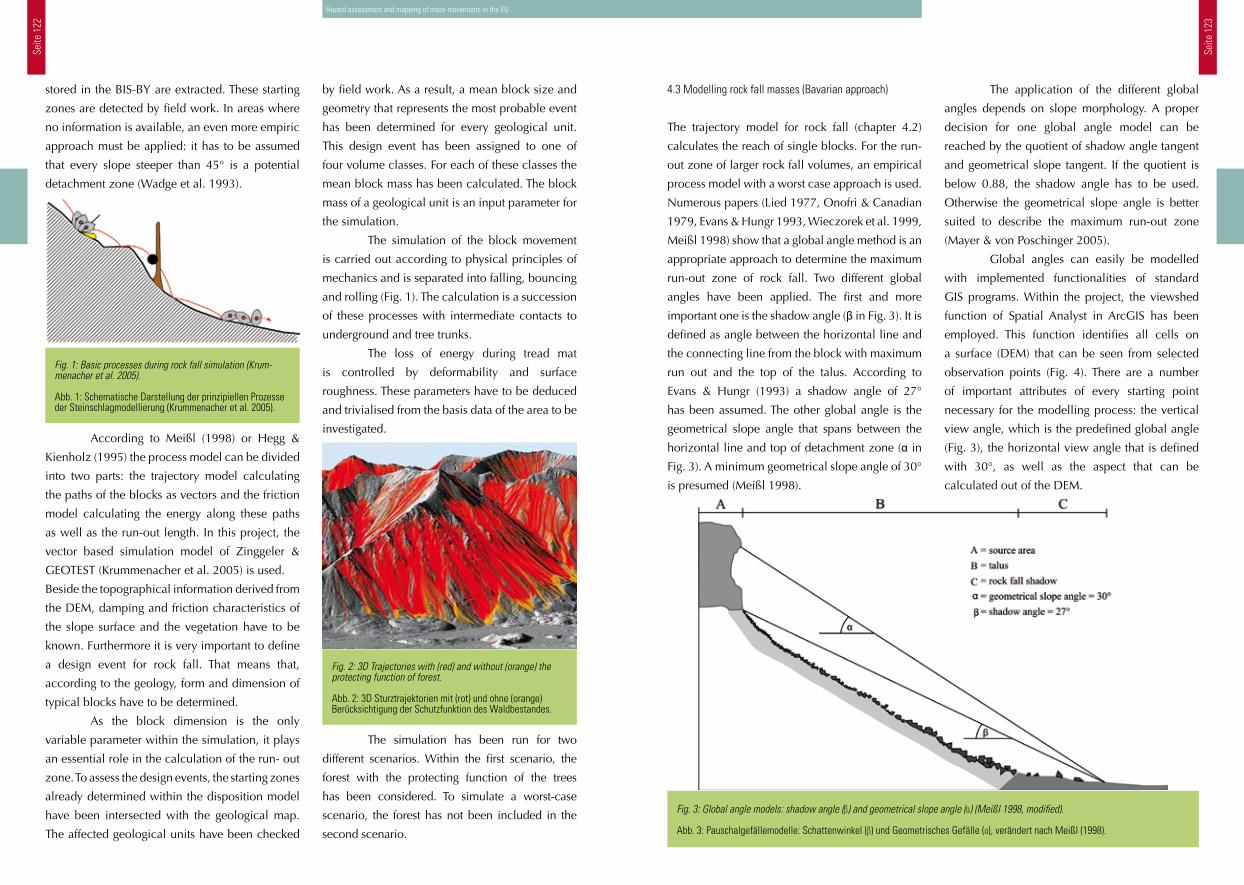
Seite
122
Seite
123
4.3 Modelling rock fall masses (Bavarian approach)
The trajectory model for rock fall (chapter 4.2)
calculates the reach of single blocks. For the run-
out zone of larger rock fall volumes, an empirical
process model with a worst case approach is used.
Numerous papers (Lied 1977, Onofri & Canadian
1979, Evans & Hungr 1993, Wieczorek et al. 1999,
Meißl 1998) show that a global angle method is an
appropriate approach to determine the maximum
run-out zone of rock fall. Two different global
angles have been applied. The first and more
important one is the shadow angle (β in Fig. 3). It is
defined as angle between the horizontal line and
the connecting line from the block with maximum
run out and the top of the talus. According to
Evans & Hungr (1993) a shadow angle of 27°
has been assumed. The other global angle is the
geometrical slope angle that spans between the
horizontal line and top of detachment zone (α in
Fig. 3). A minimum geometrical slope angle of 30°
is presumed (Meißl 1998).
The application of the different global
angles depends on slope morphology. A proper
decision for one global angle model can be
reached by the quotient of shadow angle tangent
and geometrical slope tangent. If the quotient is
below 0.88, the shadow angle has to be used.
Otherwise the geometrical slope angle is better
suited to describe the maximum run-out zone
(Mayer & von Poschinger 2005).
Global angles can easily be modelled
with implemented functionalities of standard
GIS programs. Within the project, the viewshed
function of Spatial Analyst in ArcGIS has been
employed. This function identifies all cells on
a surface (DEM) that can be seen from selected
observation points (Fig. 4). There are a number
of important attributes of every starting point
necessary for the modelling process: the vertical
view angle, which is the predefined global angle
(Fig. 3), the horizontal view angle that is defined
with 30°, as well as the aspect that can be
calculated out of the DEM.
Fig. 3: Global angle models: shadow angle (β) and geometrical slope angle (α) (Meißl 1998, modified).
Abb. 3: Pauschalgefällemodelle: Schattenwinkel (β) und Geometrisches Gefälle (α), verändert nach Meißl (1998).
by field work. As a result, a mean block size and
geometry that represents the most probable event
has been determined for every geological unit.
This design event has been assigned to one of
four volume classes. For each of these classes the
mean block mass has been calculated. The block
mass of a geological unit is an input parameter for
the simulation.
The simulation of the block movement
is carried out according to physical principles of
mechanics and is separated into falling, bouncing
and rolling (Fig. 1). The calculation is a succession
of these processes with intermediate contacts to
underground and tree trunks.
The loss of energy during tread mat
is controlled by deformability and surface
roughness. These parameters have to be deduced
and trivialised from the basis data of the area to be
investigated.
The simulation has been run for two
different scenarios. Within the first scenario, the
forest with the protecting function of the trees
has been considered. To simulate a worst-case
scenario, the forest has not been included in the
second scenario.
stored in the BIS-BY are extracted. These starting
zones are detected by field work. In areas where
no information is available, an even more empiric
approach must be applied: it has to be assumed
that every slope steeper than 45° is a potential
detachment zone (Wadge et al. 1993).
According to Meißl (1998) or Hegg &
Kienholz (1995) the process model can be divided
into two parts: the trajectory model calculating
the paths of the blocks as vectors and the friction
model calculating the energy along these paths
as well as the run-out length. In this project, the
vector based simulation model of Zinggeler &
GEOTEST (Krummenacher et al. 2005) is used.
Beside the topographical information derived from
the DEM, damping and friction characteristics of
the slope surface and the vegetation have to be
known. Furthermore it is very important to define
a design event for rock fall. That means that,
according to the geology, form and dimension of
typical blocks have to be determined.
As the block dimension is the only
variable parameter within the simulation, it plays
an essential role in the calculation of the run- out
zone. To assess the design events, the starting zones
already determined within the disposition model
have been intersected with the geological map.
The affected geological units have been checked
Fig. 1: Basic processes during rock fall simulation (Krum-menacher et al. 2005).
Abb. 1: Schematische Darstellung der prinzipiellen Prozesse der Steinschlagmodellierung (Krummenacher et al. 2005).
Fig. 2: 3D Trajectories with (red) and without (orange) the protecting function of forest.
Abb. 2: 3D Sturztrajektorien mit (rot) und ohne (orange) Berücksichtigung der Schutzfunktion des Waldbestandes.
Hazard assessment and mapping of mass-movements in the EU
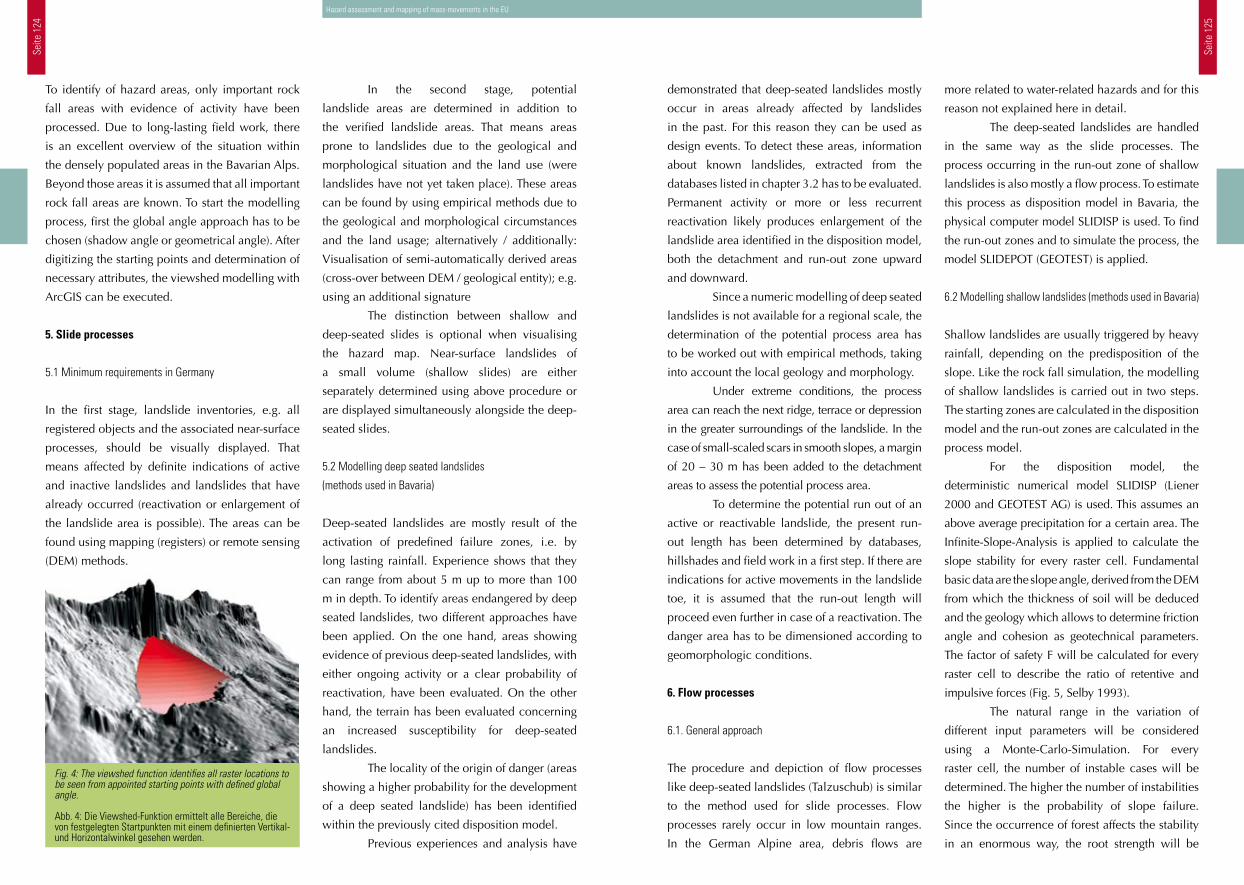
Seite
124
Seite
125
demonstrated that deep-seated landslides mostly
occur in areas already affected by landslides
in the past. For this reason they can be used as
design events. To detect these areas, information
about known landslides, extracted from the
databases listed in chapter 3.2 has to be evaluated.
Permanent activity or more or less recurrent
reactivation likely produces enlargement of the
landslide area identified in the disposition model,
both the detachment and run-out zone upward
and downward.
Since a numeric modelling of deep seated
landslides is not available for a regional scale, the
determination of the potential process area has
to be worked out with empirical methods, taking
into account the local geology and morphology.
Under extreme conditions, the process
area can reach the next ridge, terrace or depression
in the greater surroundings of the landslide. In the
case of small-scaled scars in smooth slopes, a margin
of 20 – 30 m has been added to the detachment
areas to assess the potential process area.
To determine the potential run out of an
active or reactivable landslide, the present run-
out length has been determined by databases,
hillshades and field work in a first step. If there are
indications for active movements in the landslide
toe, it is assumed that the run-out length will
proceed even further in case of a reactivation. The
danger area has to be dimensioned according to
geomorphologic conditions.
6. Flow processes
6.1. General approach
The procedure and depiction of flow processes
like deep-seated landslides (Talzuschub) is similar
to the method used for slide processes. Flow
processes rarely occur in low mountain ranges.
In the German Alpine area, debris flows are
more related to water-related hazards and for this
reason not explained here in detail.
The deep-seated landslides are handled
in the same way as the slide processes. The
process occurring in the run-out zone of shallow
landslides is also mostly a flow process. To estimate
this process as disposition model in Bavaria, the
physical computer model SLIDISP is used. To find
the run-out zones and to simulate the process, the
model SLIDEPOT (GEOTEST) is applied.
6.2 Modelling shallow landslides (methods used in Bavaria)
Shallow landslides are usually triggered by heavy
rainfall, depending on the predisposition of the
slope. Like the rock fall simulation, the modelling
of shallow landslides is carried out in two steps.
The starting zones are calculated in the disposition
model and the run-out zones are calculated in the
process model.
For the disposition model, the
deterministic numerical model SLIDISP (Liener
2000 and GEOTEST AG) is used. This assumes an
above average precipitation for a certain area. The
Infinite-Slope-Analysis is applied to calculate the
slope stability for every raster cell. Fundamental
basic data are the slope angle, derived from the DEM
from which the thickness of soil will be deduced
and the geology which allows to determine friction
angle and cohesion as geotechnical parameters.
The factor of safety F will be calculated for every
raster cell to describe the ratio of retentive and
impulsive forces (Fig. 5, Selby 1993).
The natural range in the variation of
different input parameters will be considered
using a Monte-Carlo-Simulation. For every
raster cell, the number of instable cases will be
determined. The higher the number of instabilities
the higher is the probability of slope failure.
Since the occurrence of forest affects the stability
in an enormous way, the root strength will be
In the second stage, potential
landslide areas are determined in addition to
the verified landslide areas. That means areas
prone to landslides due to the geological and
morphological situation and the land use (were
landslides have not yet taken place). These areas
can be found by using empirical methods due to
the geological and morphological circumstances
and the land usage; alternatively / additionally:
Visualisation of semi-automatically derived areas
(cross-over between DEM / geological entity); e.g.
using an additional signature
The distinction between shallow and
deep-seated slides is optional when visualising
the hazard map. Near-surface landslides of
a small volume (shallow slides) are either
separately determined using above procedure or
are displayed simultaneously alongside the deep-
seated slides.
5.2 Modelling deep seated landslides
(methods used in Bavaria)
Deep-seated landslides are mostly result of the
activation of predefined failure zones, i.e. by
long lasting rainfall. Experience shows that they
can range from about 5 m up to more than 100
m in depth. To identify areas endangered by deep
seated landslides, two different approaches have
been applied. On the one hand, areas showing
evidence of previous deep-seated landslides, with
either ongoing activity or a clear probability of
reactivation, have been evaluated. On the other
hand, the terrain has been evaluated concerning
an increased susceptibility for deep-seated
landslides.
The locality of the origin of danger (areas
showing a higher probability for the development
of a deep seated landslide) has been identified
within the previously cited disposition model.
Previous experiences and analysis have
To identify of hazard areas, only important rock
fall areas with evidence of activity have been
processed. Due to long-lasting field work, there
is an excellent overview of the situation within
the densely populated areas in the Bavarian Alps.
Beyond those areas it is assumed that all important
rock fall areas are known. To start the modelling
process, first the global angle approach has to be
chosen (shadow angle or geometrical angle). After
digitizing the starting points and determination of
necessary attributes, the viewshed modelling with
ArcGIS can be executed.
5. Slide processes
5.1 Minimum requirements in Germany
In the first stage, landslide inventories, e.g. all
registered objects and the associated near-surface
processes, should be visually displayed. That
means affected by definite indications of active
and inactive landslides and landslides that have
already occurred (reactivation or enlargement of
the landslide area is possible). The areas can be
found using mapping (registers) or remote sensing
(DEM) methods.
Fig. 4: The viewshed function identifies all raster locations to be seen from appointed starting points with defined global angle.
Abb. 4: Die Viewshed-Funktion ermittelt alle Bereiche, die von festgelegten Startpunkten mit einem definierten Vertikal- und Horizontalwinkel gesehen werden.
Hazard assessment and mapping of mass-movements in the EU
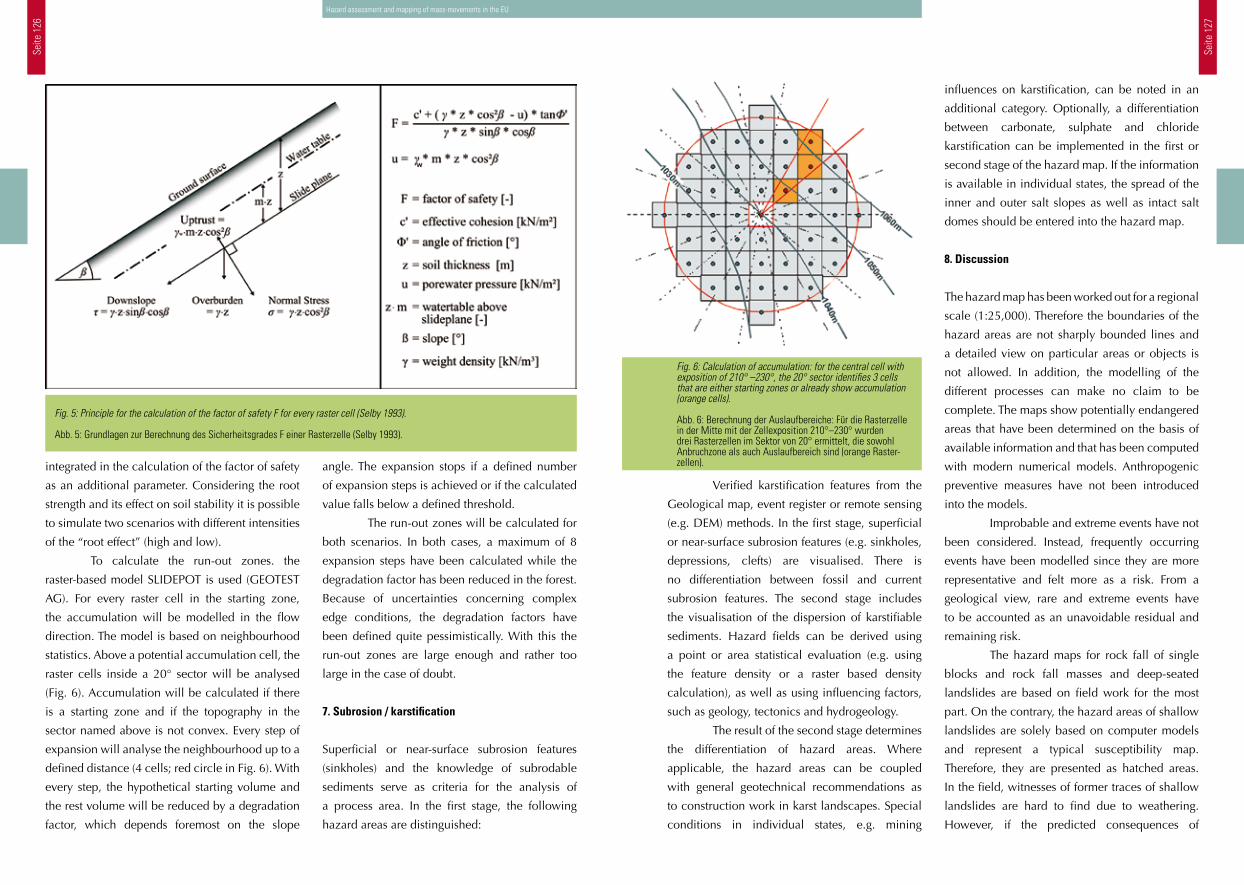
Seite
126
Seite
127
Verified karstification features from the
Geological map, event register or remote sensing
(e.g. DEM) methods. In the first stage, superficial
or near-surface subrosion features (e.g. sinkholes,
depressions, clefts) are visualised. There is
no differentiation between fossil and current
subrosion features. The second stage includes
the visualisation of the dispersion of karstifiable
sediments. Hazard fields can be derived using
a point or area statistical evaluation (e.g. using
the feature density or a raster based density
calculation), as well as using influencing factors,
such as geology, tectonics and hydrogeology.
The result of the second stage determines
the differentiation of hazard areas. Where
applicable, the hazard areas can be coupled
with general geotechnical recommendations as
to construction work in karst landscapes. Special
conditions in individual states, e.g. mining
influences on karstification, can be noted in an
additional category. Optionally, a differentiation
between carbonate, sulphate and chloride
karstification can be implemented in the first or
second stage of the hazard map. If the information
is available in individual states, the spread of the
inner and outer salt slopes as well as intact salt
domes should be entered into the hazard map.
8. Discussion
The hazard map has been worked out for a regional
scale (1:25,000). Therefore the boundaries of the
hazard areas are not sharply bounded lines and
a detailed view on particular areas or objects is
not allowed. In addition, the modelling of the
different processes can make no claim to be
complete. The maps show potentially endangered
areas that have been determined on the basis of
available information and that has been computed
with modern numerical models. Anthropogenic
preventive measures have not been introduced
into the models.
Improbable and extreme events have not
been considered. Instead, frequently occurring
events have been modelled since they are more
representative and felt more as a risk. From a
geological view, rare and extreme events have
to be accounted as an unavoidable residual and
remaining risk.
The hazard maps for rock fall of single
blocks and rock fall masses and deep-seated
landslides are based on field work for the most
part. On the contrary, the hazard areas of shallow
landslides are solely based on computer models
and represent a typical susceptibility map.
Therefore, they are presented as hatched areas.
In the field, witnesses of former traces of shallow
landslides are hard to find due to weathering.
However, if the predicted consequences of
Fig. 6: Calculation of accumulation: for the central cell with exposition of 210° –230°, the 20° sector identifies 3 cells that are either starting zones or already show accumulation (orange cells).
Abb. 6: Berechnung der Auslaufbereiche: Für die Rasterzelle in der Mitte mit der Zellexposition 210°–230° wurden drei Rasterzellen im Sektor von 20° ermittelt, die sowohl Anbruchzone als auch Auslaufbereich sind (orange Raster-zellen).angle. The expansion stops if a defined number
of expansion steps is achieved or if the calculated
value falls below a defined threshold.
The run-out zones will be calculated for
both scenarios. In both cases, a maximum of 8
expansion steps have been calculated while the
degradation factor has been reduced in the forest.
Because of uncertainties concerning complex
edge conditions, the degradation factors have
been defined quite pessimistically. With this the
run-out zones are large enough and rather too
large in the case of doubt.
7. Subrosion / karstification
Superficial or near-surface subrosion features
(sinkholes) and the knowledge of subrodable
sediments serve as criteria for the analysis of
a process area. In the first stage, the following
hazard areas are distinguished:
integrated in the calculation of the factor of safety
as an additional parameter. Considering the root
strength and its effect on soil stability it is possible
to simulate two scenarios with different intensities
of the “root effect” (high and low).
To calculate the run-out zones. the
raster-based model SLIDEPOT is used (GEOTEST
AG). For every raster cell in the starting zone,
the accumulation will be modelled in the flow
direction. The model is based on neighbourhood
statistics. Above a potential accumulation cell, the
raster cells inside a 20° sector will be analysed
(Fig. 6). Accumulation will be calculated if there
is a starting zone and if the topography in the
sector named above is not convex. Every step of
expansion will analyse the neighbourhood up to a
defined distance (4 cells; red circle in Fig. 6). With
every step, the hypothetical starting volume and
the rest volume will be reduced by a degradation
factor, which depends foremost on the slope
Fig. 5: Principle for the calculation of the factor of safety F for every raster cell (Selby 1993).
Abb. 5: Grundlagen zur Berechnung des Sicherheitsgrades F einer Rasterzelle (Selby 1993).
Hazard assessment and mapping of mass-movements in the EU
Seite
128
Seite
129
KIENHOLZ, H., ERISMANN, TH., FIEBIGER, G. & MANI, P. (1993): Naturgefahren: Prozesse, Kartographische Darstellung und Maßnahmen. – In: Tagungsbericht zum 48. Deutschen Geographentag in Basel, 293 – 312, Stuttgart.
KRUMMENACHER, B., PFEIFER, R., TOBLER, D., KEUSEN, H. R., LINIGER, M. & ZINGGELER, A. (2005): Modellierung von Stein- und Blockschlag; Berechnung der Trajektorien auf Profilen und im 3-D Raum unter Berücksichtigung von Waldbestand und Hindernissen. – anlässlich Fan-Forum ETH Zürich am 18.02.2005, 9 p., Zollikofen.
LIED, K. (1977): Rockfall problems in Norway. – In: Istituto Sperimentale Modelli e Strutture (ISMES), 90: 51-53, Bergamo.
LIENER, S., (2000): Zur Feststofflieferung in Wildbächen. Geographisches Institut Universität Bern. Geographica Bernensia G64, Bern.
MAYER, K. & VON POSCHINGER, A. VON (2005): Final Report and Guidelines: Mitigation of Hydro-Geological Risk in Alpine Catchments, “CatchRisk”. Work Package 2: Landslide hazard assessment (Rockfall modelling). Program Interreg IIIb – Alpine Space.
MAYER, K., PATULA, S., KRAPP, M., LEPPIG, B., THOM, P., POSCHINGER, A. VON (2010): Danger Map for the Bavarian Alps. Z. dt. Ges. Geowiss., 161/2, p. 119-128, 10 figs. Stuttgart, June 2010
MEISSL, G. (1998): Modellierung der Reichweite von Felsstürzen. – In: Innsbrucker Geographische Studien, 28: 249 p., Innsbruck (Selbstverl. des Instituts für Geographie der Universität Innsbruck).
ONOFRI, R. & CANDIAN, C. (1979): Indagine sui limiti di massima invasione dei blocchi franati durante il sisma del Friuli del 1976. – Regione Autonoma Friuli-Venezia Giulia e Università degli Studi di Trieste, 41 p., Trieste (Cluet Publisher).
PERSONENKREIS “GEOGEFAHREN“ (2008): Geogene Naturgefahren in Deutschland – Empfehlungen der Staatlichen Geologischen Dienste (SGD) zur Erstellung von Gefahrenhinweiskarten; not published.
SELBY, M.J. (1993): Hillslope Materials and Processes, Oxford University Press, Oxford.
UMWELTBUNDESAMT [eds.] (2008): Klimaauswirkungen und Anpassung in Deutschland – Phase 1: Erstellung regionaler Klimaszenarien für Deutschland. – http://www.umweltdaten.de/publikationen/fpdf-l/3513.pdf
WADGE, G., WISLOCKI, A.P. & PEARSON, E.J. (1993): Spatial analysis in GIS for natural hazard assessment. In: Goodchild, M.F., Parks B.O. & Steyaert, L.T. (Hrsg.) – Environmental modelling with GIS: 332-338, New York, Oxford.
WIECZOREK, F. G., MORRISSEY, M. M., IOVINE, G. & GODT, J. (1999): Rockfall Potential in the Yosemite Valley, California. – In: U.S. Geological Survey Open-File Report 99-0578, http://pubs.usgs.gov/of/1999/ofr-99-0578/.
To help potential users interpret the
hazard map, the results are presented to all
authorities. Furthermore, an intensive cooperation
with the Bavarian Environment Agency is offered.
In addition, a limited version of the hazard map is
published on the Internet (www.bis.bayern.de).
But the Alpine part of Bavaria is not the
only region affected by geological hazards. The
Alpine foothills and the Swabian-Franconian
Jurassic-mountains are affected as well. For the
mid-term, the goal is to develop hazard maps for
the whole of Bavaria.
Anschrift der Verfasser / Authors’ addresses:
Karl Mayer
Bavarian Environment Agency (LfU)
(Office Munich)
Lazarettstraße 67
80636 Munich – GERMANY
Andreas von Poschinger
Bavarian Environment Agency (LfU)
(Office Munich)
Lazarettstraße 67
80636 Munich – GERMANY
Literatur / References:
BUNDESAMT FÜR RAUMENTWICKLUNG, BUNDESAMT FÜR WASSER UND GEOLOGIE, BUNDESAMT FÜR UMWELT, WALD UND LANDSCHAFT (BUWAL) [eds.] (2005): Empfehlungen Raumplanung und Naturgefahren. – 50 p., Bern.
EVANS, S. G. & HUNGR, O. (1993): The assessment of rock fall hazards at the base of talus slopes. – Canadian Geotechnical Journal, 30 (4): 620-636, Ottawa (Nat. Res. Council of Canada).
HEGG, C. & KIENHOLZ, H. (1995): Deterministic paths of gravity-driven slope processes: The „Vector Tree Model“. In: Carrara, A. & Guzzetti, F. (eds.): Geographical Information Systems in Assessing Natural Hazards, 79 – 92, Dordrecht.
climate change with an increase in extreme
rainfalls will come true, an increasing number of
shallow landslides must be taken into account.
Climate change predictions could be
implemented in the model if maps with predicted
precipitation on a local scale were available.
This would allow the identification of hot spots
with heavy rainfall and, therefore, a higher
susceptibility for landslides. The identification of
such hot spots is one target in the Alpine Space
Programme project AdaptAlp that also focuses
on evaluation, harmonizing and improvement of
different methods for hazard mapping.
9. Conclusions
A hazard map is a very helpful tool for planning
authorities to get an overview about land use
conflicts and potentially endangered areas. It is
a general map created under objective scientific
criteria and indicating geological hazards that
have been identified and localized but not
analysed and evaluated in detail. A hazard map
does not contain specifications about the degree
of hazard or the intensity or probability of an
event.
The map will be provided to local and
regional planning authorities for water, traffic,
and forest management. It helps the planner
identify hot spots and make decisions concerning
measures of protection. On the other hand, it also
shows areas not endangered and free for planning.
In critical cases, the hazard map has
to disclose the requirement for further analysis.
In this cases a detailed expertise analysis has
to decide if measures are technically feasible,
economically reasonable and under sustainable
aspects really necessary.
Hazard assessment and mapping of mass-movements in the EU
Seite
130
Seite
131
of territorial coherence at an inter-urban scale and
local urban planning at the community scale.
Typically, urban planning procedures
and decisions, under the jurisdiction of national or
local authorities, must integrate natural hazards.
The plan for prevention of natural hazards (plan de
prévention des risques naturels prévisibles - PPR)
established by the law of February 2, 1995, is now
one of the national authority’s main instruments
for preventing natural hazards. The PPR is a
specific procedure designed to take into account
natural hazards in land-use development.
The PPR is elaborated under the authority
of the department’s prefect, which approves it
after formal consultation with municipalities and
a public inquiry. The PPR involves the local and
regional authorities concerned from the very first
steps of its preparation (Fig. 1). It can cover one
or several types of hazards and one or several
municipalities.
Introduction
Hazard assessment of rapid mass movements
is required for different purposes than for other
natural phenomena. Depending on the objectives,
this must be carried out at different scales. Hazard
assessment can also take different forms, but
most often its final outcome is a hazard map.
Different types of expertise from various experts
and approaches contribute to hazard assessment.
Therefore, establishing standardized approaches,
methods and tools is demanding. The field of land-
use planning, however, integrates standardized
hazard assessment and mapping methods.
Hazards mapping and land-use planning
Natural hazards must be taken into account in land-
use planning documents. These are mainly schemes
Hazard assessment and mapping of mass-movements in the EU
dung im Rahmen der Flächennutzungsplanung standardisiert: Der Plan für die Verhinderung von Naturgefahren (plan de prévention des risques naturels prévisibles, PPR) ist eines der wichtigsten Mittel der französischen nationalen Behörden für die Vermeidung natürlicher Gefahren und findet in der Flächennutzungsplanung Berücksichtigung. Im Rahmen dieses Verfahrens beschreiben allgemeine methodologische Richtlinien und andere, für die verschiedenen Arten von Gefahren spezifische Dokumente die Bedin-gungen und geben Aufschluss über die empfohlenen Methoden und Ansätze zum Erstellen des PPR. Eines dieser Dokumente befasst sich mit den durch Massenbewegungen verur-sachten Gefahren. In diesem Verfahren ist der Gefahrenzonenplan ein Zwischenschritt in der Erstellung des Risikoplans, d.h., die Vorgaben stammen vom PPR (gemeinsam mit den zugehörigen Bestimmungen). Für die Erstellung von Gefährdungsanalysen und die Gefahrenzonenplanung (Ge-fahrenkartierung) stehen – beruhend auf einem Bestand von Phänomenen und einer Analyse aktueller und vergangener Ereignisse – verschiedene Arten von Informationen und Datenban-ken zur Verfügung. Gefährdungsanalysen müssen eine gegebene Gefahr in Bezug auf die Intensität und Häufigkeit des Auftretens beschreiben. Für Massenbewegungen sind spezifische Ansätze empfohlen, welche die spezifischen Merkmale dieser Erscheinungen berücksichtigen.
Standards and Methods of Hazard Assessment for Rapid Mass Movements in France
Standards und Methoden der Gefährdungsanalyse für schnelle Massenbewegungen in Frankreich
DIDIER RICHARD
Summary:Hazard assessment is required for different purposes and is carried out through expertise assessments at different levels, using various approaches. Hazard assessment and mapping methods are standardized at least for their use in the frame of land-use planning in what is called the plan for the prevention of natural hazards (plan de prévention des risques naturels prévisibles, PPR). This is one of the main instruments used by the French national authorities for preventing natural hazards while taking them into account in land use development. Within this procedure, a general methodological guidelines document and other documents specific to the different types of hazards specify the conditions and clarify the method and approach proposed to draw up the PPR. One of these documents is dedicated to mass movement hazards. In this procedure, the hazard map is an intermediate step in elaborating the risk map, i.e. the regulations stemming from the PPR (together with the associated regulations). Various types of information available and databases can be used for hazard assessment and hazard mapping, based on an inventory of phenomena and a back-analysis of current and past events. Hazard assessment must characterize a given hazard in terms of intensity and frequency of occurrence. For mass movements, specific approaches are proposed, given the specific characteristics of these phenomena.
Zusammenfassung:Gefahrenbeurteilungen sind für verschiedene Zwecke erforderlich und werden in Form von fachlichen Gutachten auf unterschiedlichen Ebenen anhand verschiedener Ansätze vorge-nommen. Gefährdungsbeurteilung und Kartierungsmethoden sind zumindest für die Verwen-
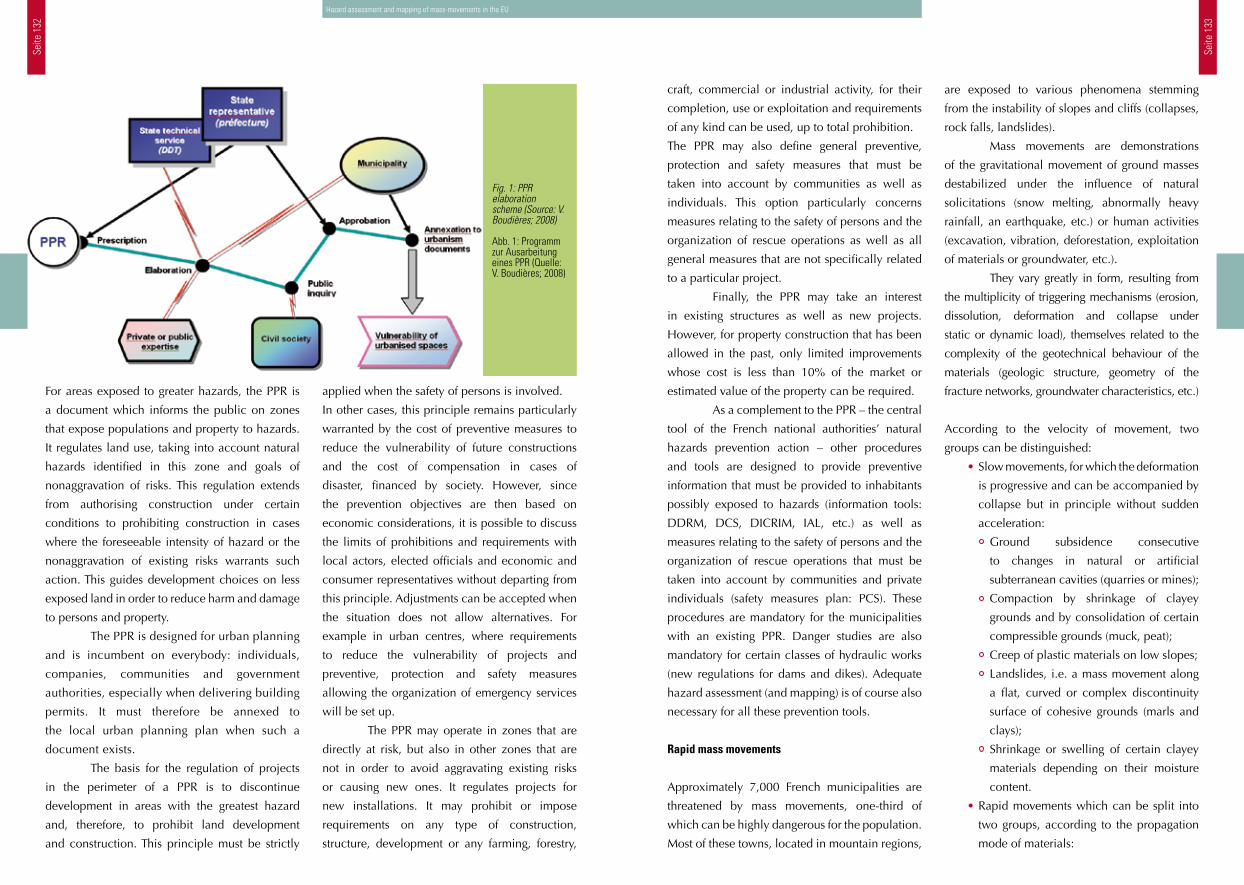
Seite
132
Seite
133
craft, commercial or industrial activity, for their
completion, use or exploitation and requirements
of any kind can be used, up to total prohibition.
The PPR may also define general preventive,
protection and safety measures that must be
taken into account by communities as well as
individuals. This option particularly concerns
measures relating to the safety of persons and the
organization of rescue operations as well as all
general measures that are not specifically related
to a particular project.
Finally, the PPR may take an interest
in existing structures as well as new projects.
However, for property construction that has been
allowed in the past, only limited improvements
whose cost is less than 10% of the market or
estimated value of the property can be required.
As a complement to the PPR – the central
tool of the French national authorities’ natural
hazards prevention action – other procedures
and tools are designed to provide preventive
information that must be provided to inhabitants
possibly exposed to hazards (information tools:
DDRM, DCS, DICRIM, IAL, etc.) as well as
measures relating to the safety of persons and the
organization of rescue operations that must be
taken into account by communities and private
individuals (safety measures plan: PCS). These
procedures are mandatory for the municipalities
with an existing PPR. Danger studies are also
mandatory for certain classes of hydraulic works
(new regulations for dams and dikes). Adequate
hazard assessment (and mapping) is of course also
necessary for all these prevention tools.
Rapid mass movements
Approximately 7,000 French municipalities are
threatened by mass movements, one-third of
which can be highly dangerous for the population.
Most of these towns, located in mountain regions,
are exposed to various phenomena stemming
from the instability of slopes and cliffs (collapses,
rock falls, landslides).
Mass movements are demonstrations
of the gravitational movement of ground masses
destabilized under the influence of natural
solicitations (snow melting, abnormally heavy
rainfall, an earthquake, etc.) or human activities
(excavation, vibration, deforestation, exploitation
of materials or groundwater, etc.).
They vary greatly in form, resulting from
the multiplicity of triggering mechanisms (erosion,
dissolution, deformation and collapse under
static or dynamic load), themselves related to the
complexity of the geotechnical behaviour of the
materials (geologic structure, geometry of the
fracture networks, groundwater characteristics, etc.)
According to the velocity of movement, two
groups can be distinguished:
• Slow movements, for which the deformation
is progressive and can be accompanied by
collapse but in principle without sudden
acceleration:
Ground subsidence consecutive
to changes in natural or artificial
subterranean cavities (quarries or mines);
Compaction by shrinkage of clayey
grounds and by consolidation of certain
compressible grounds (muck, peat);
Creep of plastic materials on low slopes;
Landslides, i.e. a mass movement along
a flat, curved or complex discontinuity
surface of cohesive grounds (marls and
clays);
Shrinkage or swelling of certain clayey
materials depending on their moisture
content.
• Rapid movements which can be split into
two groups, according to the propagation
mode of materials:
applied when the safety of persons is involved.
In other cases, this principle remains particularly
warranted by the cost of preventive measures to
reduce the vulnerability of future constructions
and the cost of compensation in cases of
disaster, financed by society. However, since
the prevention objectives are then based on
economic considerations, it is possible to discuss
the limits of prohibitions and requirements with
local actors, elected officials and economic and
consumer representatives without departing from
this principle. Adjustments can be accepted when
the situation does not allow alternatives. For
example in urban centres, where requirements
to reduce the vulnerability of projects and
preventive, protection and safety measures
allowing the organization of emergency services
will be set up.
The PPR may operate in zones that are
directly at risk, but also in other zones that are
not in order to avoid aggravating existing risks
or causing new ones. It regulates projects for
new installations. It may prohibit or impose
requirements on any type of construction,
structure, development or any farming, forestry,
For areas exposed to greater hazards, the PPR is
a document which informs the public on zones
that expose populations and property to hazards.
It regulates land use, taking into account natural
hazards identified in this zone and goals of
nonaggravation of risks. This regulation extends
from authorising construction under certain
conditions to prohibiting construction in cases
where the foreseeable intensity of hazard or the
nonaggravation of existing risks warrants such
action. This guides development choices on less
exposed land in order to reduce harm and damage
to persons and property.
The PPR is designed for urban planning
and is incumbent on everybody: individuals,
companies, communities and government
authorities, especially when delivering building
permits. It must therefore be annexed to
the local urban planning plan when such a
document exists.
The basis for the regulation of projects
in the perimeter of a PPR is to discontinue
development in areas with the greatest hazard
and, therefore, to prohibit land development
and construction. This principle must be strictly
Fig. 1: PPR elaboration scheme (Source: V. Boudières; 2008)
Abb. 1: Programm zur Ausarbeitung eines PPR (Quelle: V. Boudières; 2008)
Hazard assessment and mapping of mass-movements in the EU
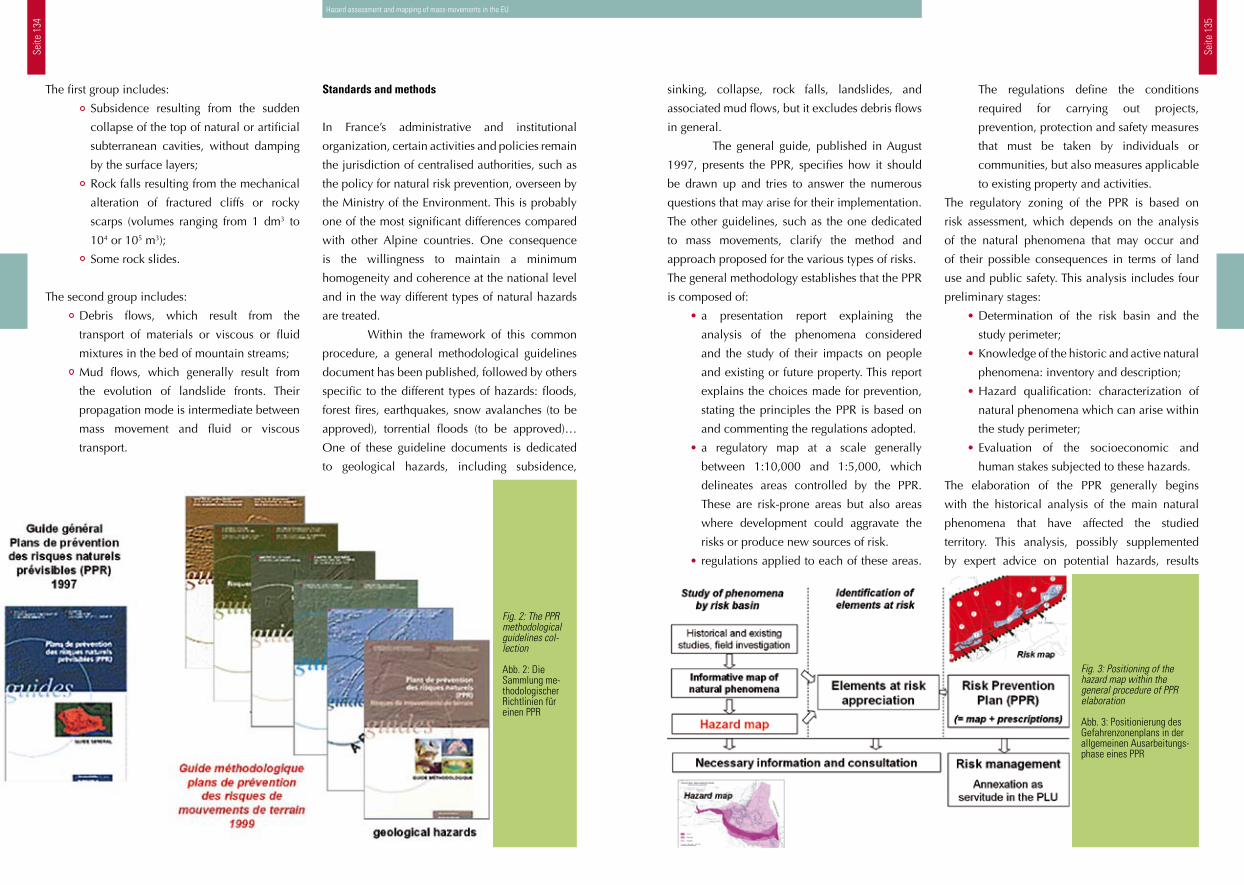
Seite
134
Seite
135
sinking, collapse, rock falls, landslides, and
associated mud flows, but it excludes debris flows
in general.
The general guide, published in August
1997, presents the PPR, specifies how it should
be drawn up and tries to answer the numerous
questions that may arise for their implementation.
The other guidelines, such as the one dedicated
to mass movements, clarify the method and
approach proposed for the various types of risks.
The general methodology establishes that the PPR
is composed of:
• a presentation report explaining the
analysis of the phenomena considered
and the study of their impacts on people
and existing or future property. This report
explains the choices made for prevention,
stating the principles the PPR is based on
and commenting the regulations adopted.
• a regulatory map at a scale generally
between 1:10,000 and 1:5,000, which
delineates areas controlled by the PPR.
These are risk-prone areas but also areas
where development could aggravate the
risks or produce new sources of risk.
• regulations applied to each of these areas.
The regulations define the conditions
required for carrying out projects,
prevention, protection and safety measures
that must be taken by individuals or
communities, but also measures applicable
to existing property and activities.
The regulatory zoning of the PPR is based on
risk assessment, which depends on the analysis
of the natural phenomena that may occur and
of their possible consequences in terms of land
use and public safety. This analysis includes four
preliminary stages:
• Determination of the risk basin and the
study perimeter;
• Knowledge of the historic and active natural
phenomena: inventory and description;
• Hazard qualification: characterization of
natural phenomena which can arise within
the study perimeter;
• Evaluation of the socioeconomic and
human stakes subjected to these hazards.
The elaboration of the PPR generally begins
with the historical analysis of the main natural
phenomena that have affected the studied
territory. This analysis, possibly supplemented
by expert advice on potential hazards, results
Fig. 3: Positioning of the hazard map within the general procedure of PPR elaboration
Abb. 3: Positionierung des Gefahrenzonenplans in der allgemeinen Ausarbeitungs-phase eines PPR
Standards and methods
In France’s administrative and institutional
organization, certain activities and policies remain
the jurisdiction of centralised authorities, such as
the policy for natural risk prevention, overseen by
the Ministry of the Environment. This is probably
one of the most significant differences compared
with other Alpine countries. One consequence
is the willingness to maintain a minimum
homogeneity and coherence at the national level
and in the way different types of natural hazards
are treated.
Within the framework of this common
procedure, a general methodological guidelines
document has been published, followed by others
specific to the different types of hazards: floods,
forest fires, earthquakes, snow avalanches (to be
approved), torrential floods (to be approved)…
One of these guideline documents is dedicated
to geological hazards, including subsidence,
The first group includes:
Subsidence resulting from the sudden
collapse of the top of natural or artificial
subterranean cavities, without damping
by the surface layers;
Rock falls resulting from the mechanical
alteration of fractured cliffs or rocky
scarps (volumes ranging from 1 dm3 to
104 or 105 m3);
Some rock slides.
The second group includes:
Debris flows, which result from the
transport of materials or viscous or fluid
mixtures in the bed of mountain streams;
Mud flows, which generally result from
the evolution of landslide fronts. Their
propagation mode is intermediate between
mass movement and fluid or viscous
transport.
Fig. 2: The PPR methodological guidelines col-lection
Abb. 2: Die Sammlung me-thodologischer Richtlinien für einen PPR
Hazard assessment and mapping of mass-movements in the EU
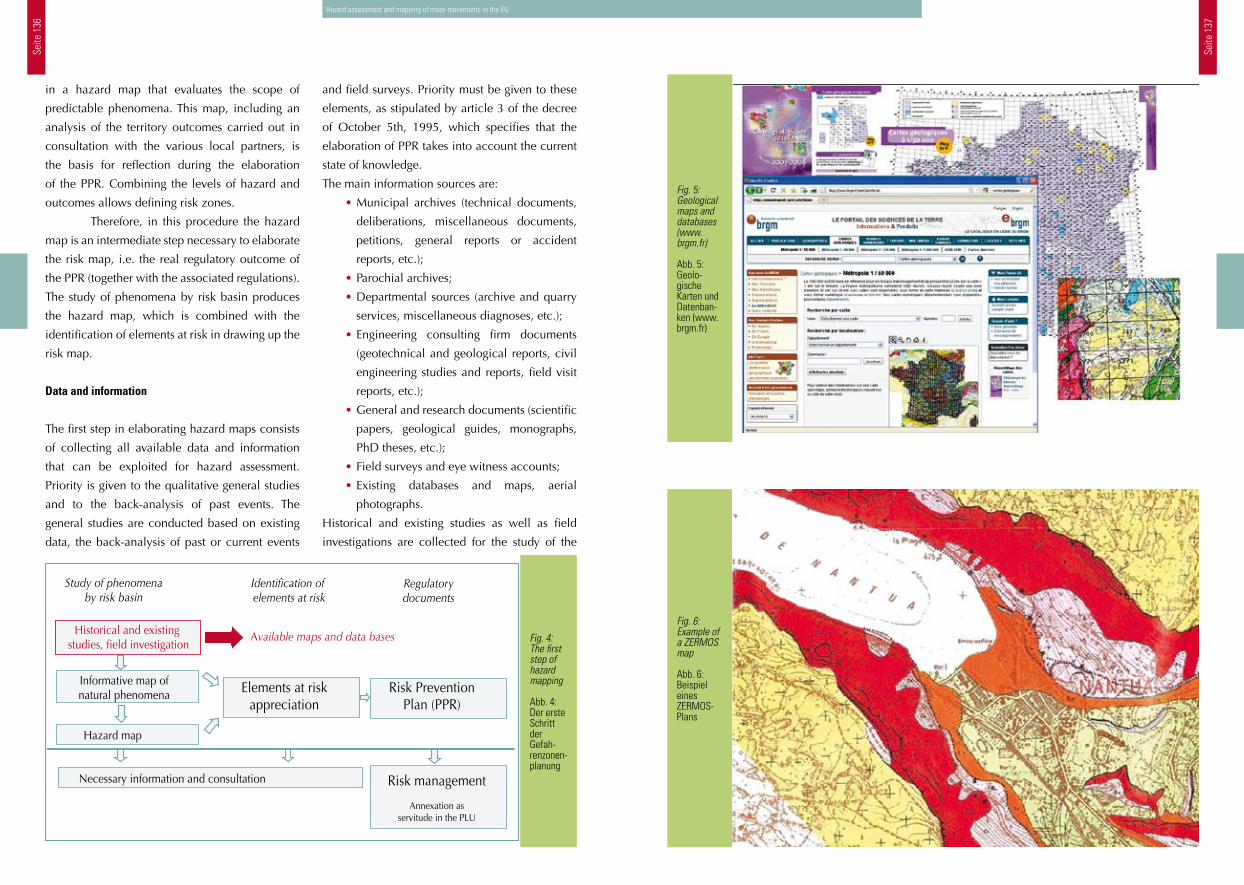
Seite
136
Seite
137
Fig. 5: Geological maps and databases (www.brgm.fr)
Abb. 5: Geolo-gische Karten und Datenban-ken (www.brgm.fr)
Fig. 6: Example of a ZERMOS map
Abb. 6: Beispiel eines ZERMOS-Plans
Hazard assessment and mapping of mass-movements in the EU
and field surveys. Priority must be given to these
elements, as stipulated by article 3 of the decree
of October 5th, 1995, which specifies that the
elaboration of PPR takes into account the current
state of knowledge.
The main information sources are:
• Municipal archives (technical documents,
deliberations, miscellaneous documents,
petitions, general reports or accident
reports, etc.);
• Parochial archives;
• Departmental sources (archive and quarry
services, miscellaneous diagnoses, etc.);
• Engineering consulting firm documents
(geotechnical and geological reports, civil
engineering studies and reports, field visit
reports, etc.);
• General and research documents (scientific
papers, geological guides, monographs,
PhD theses, etc.);
• Field surveys and eye witness accounts;
• Existing databases and maps, aerial
photographs.
Historical and existing studies as well as field
investigations are collected for the study of the
in a hazard map that evaluates the scope of
predictable phenomena. This map, including an
analysis of the territory outcomes carried out in
consultation with the various local partners, is
the basis for reflection during the elaboration
of the PPR. Combining the levels of hazard and
outcomes allows defining risk zones.
Therefore, in this procedure the hazard
map is an intermediate step necessary to elaborate
the risk map, i.e. the real regulatory outcome of
the PPR (together with the associated regulations).
The study of phenomena by risk basin produces
the hazard map, which is combined with the
identification of elements at risk in drawing up the
risk map.
Data and information
The first step in elaborating hazard maps consists
of collecting all available data and information
that can be exploited for hazard assessment.
Priority is given to the qualitative general studies
and to the back-analysis of past events. The
general studies are conducted based on existing
data, the back-analysis of past or current events
Fig. 4: The first step of hazard mapping
Abb. 4: Der erste Schritt der Gefah-renzonen-planung
Available maps and data bases
Study of phenomenaby risk basin
Historical and existing studies, field investigation
Informative map ofnatural phenomena Elements at risk
appreciationRisk Prevention
Plan (PPR)
Risk management
Annexation asservitude in the PLU
Hazard map
Necessary information and consultation
Identification of elements at risk
Regulatorydocuments
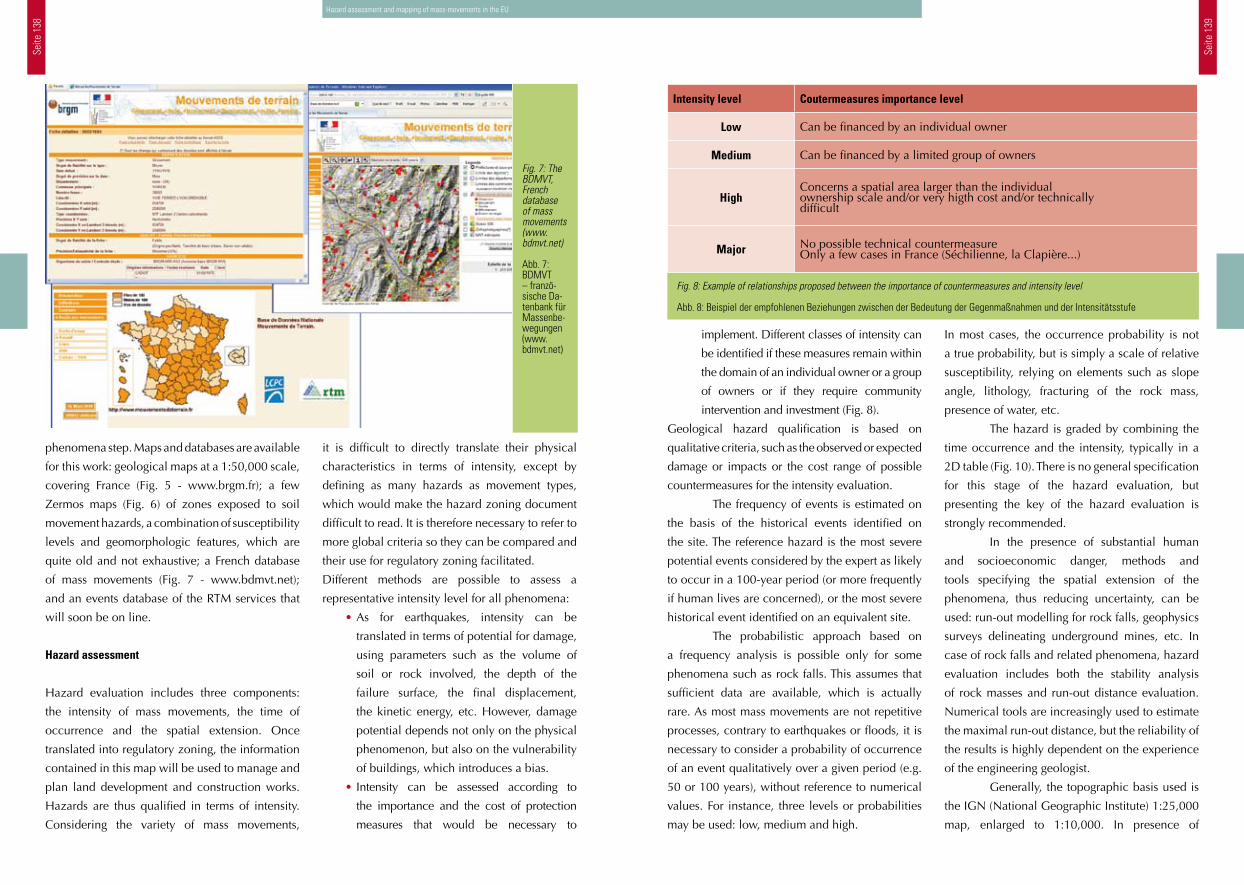
Seite
138
Seite
139
implement. Different classes of intensity can
be identified if these measures remain within
the domain of an individual owner or a group
of owners or if they require community
intervention and investment (Fig. 8).
Geological hazard qualification is based on
qualitative criteria, such as the observed or expected
damage or impacts or the cost range of possible
countermeasures for the intensity evaluation.
The frequency of events is estimated on
the basis of the historical events identified on
the site. The reference hazard is the most severe
potential events considered by the expert as likely
to occur in a 100-year period (or more frequently
if human lives are concerned), or the most severe
historical event identified on an equivalent site.
The probabilistic approach based on
a frequency analysis is possible only for some
phenomena such as rock falls. This assumes that
sufficient data are available, which is actually
rare. As most mass movements are not repetitive
processes, contrary to earthquakes or floods, it is
necessary to consider a probability of occurrence
of an event qualitatively over a given period (e.g.
50 or 100 years), without reference to numerical
values. For instance, three levels or probabilities
may be used: low, medium and high.
In most cases, the occurrence probability is not
a true probability, but is simply a scale of relative
susceptibility, relying on elements such as slope
angle, lithology, fracturing of the rock mass,
presence of water, etc.
The hazard is graded by combining the
time occurrence and the intensity, typically in a
2D table (Fig. 10). There is no general specification
for this stage of the hazard evaluation, but
presenting the key of the hazard evaluation is
strongly recommended.
In the presence of substantial human
and socioeconomic danger, methods and
tools specifying the spatial extension of the
phenomena, thus reducing uncertainty, can be
used: run-out modelling for rock falls, geophysics
surveys delineating underground mines, etc. In
case of rock falls and related phenomena, hazard
evaluation includes both the stability analysis
of rock masses and run-out distance evaluation.
Numerical tools are increasingly used to estimate
the maximal run-out distance, but the reliability of
the results is highly dependent on the experience
of the engineering geologist.
Generally, the topographic basis used is
the IGN (National Geographic Institute) 1:25,000
map, enlarged to 1:10,000. In presence of
Fig. 8: Example of relationships proposed between the importance of countermeasures and intensity level
Abb. 8: Beispiel der empfohlenen Beziehungen zwischen der Bedeutung der Gegenmaßnahmen und der Intensitätsstufe
Intensity level Coutermeasures importance level
Low Can be financed by an individual owner
Medium Can be financed by a limited group of owners
HighConcerns a spatial area larger than the individualownership scale and/or very higth cost and/or technically difficult
Major No possible technical countermeasureOnly a few cases in France (Séchilienne, la Clapière...)
it is difficult to directly translate their physical
characteristics in terms of intensity, except by
defining as many hazards as movement types,
which would make the hazard zoning document
difficult to read. It is therefore necessary to refer to
more global criteria so they can be compared and
their use for regulatory zoning facilitated.
Different methods are possible to assess a
representative intensity level for all phenomena:
• As for earthquakes, intensity can be
translated in terms of potential for damage,
using parameters such as the volume of
soil or rock involved, the depth of the
failure surface, the final displacement,
the kinetic energy, etc. However, damage
potential depends not only on the physical
phenomenon, but also on the vulnerability
of buildings, which introduces a bias.
• Intensity can be assessed according to
the importance and the cost of protection
measures that would be necessary to
phenomena step. Maps and databases are available
for this work: geological maps at a 1:50,000 scale,
covering France (Fig. 5 - www.brgm.fr); a few
Zermos maps (Fig. 6) of zones exposed to soil
movement hazards, a combination of susceptibility
levels and geomorphologic features, which are
quite old and not exhaustive; a French database
of mass movements (Fig. 7 - www.bdmvt.net);
and an events database of the RTM services that
will soon be on line.
Hazard assessment
Hazard evaluation includes three components:
the intensity of mass movements, the time of
occurrence and the spatial extension. Once
translated into regulatory zoning, the information
contained in this map will be used to manage and
plan land development and construction works.
Hazards are thus qualified in terms of intensity.
Considering the variety of mass movements,
Fig. 7: The BDMVT, French database of mass movements (www.bdmvt.net)
Abb. 7: BDMVT – franzö-sische Da-tenbank für Massenbe-wegungen (www.bdmvt.net)
Hazard assessment and mapping of mass-movements in the EU
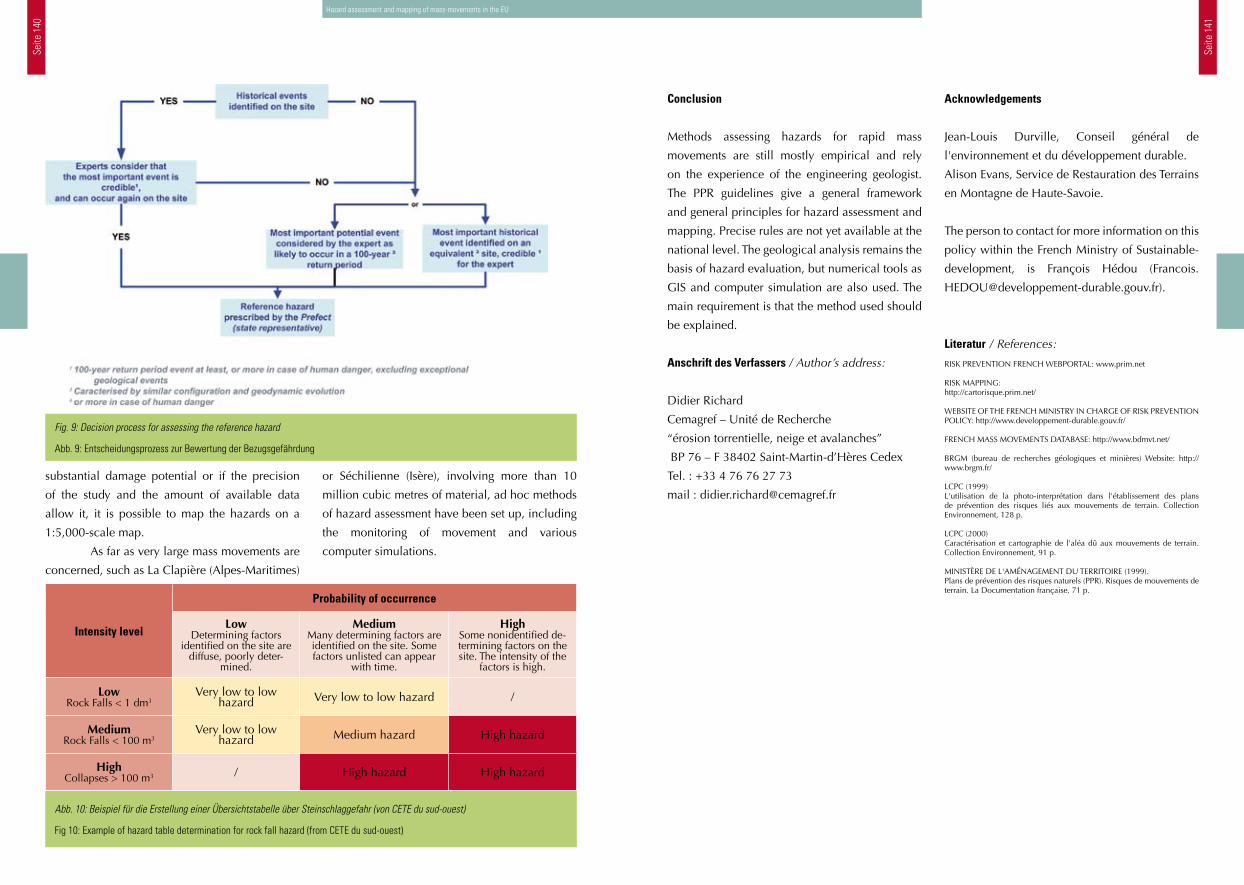
Seite
140
Seite
141
Conclusion
Methods assessing hazards for rapid mass
movements are still mostly empirical and rely
on the experience of the engineering geologist.
The PPR guidelines give a general framework
and general principles for hazard assessment and
mapping. Precise rules are not yet available at the
national level. The geological analysis remains the
basis of hazard evaluation, but numerical tools as
GIS and computer simulation are also used. The
main requirement is that the method used should
be explained.
Anschrift des Verfassers / Author’s address:
Didier Richard
Cemagref – Unité de Recherche
“érosion torrentielle, neige et avalanches”
BP 76 – F 38402 Saint-Martin-d’Hères Cedex
Tel. : +33 4 76 76 27 73
mail : [email protected]
Acknowledgements
Jean-Louis Durville, Conseil général de
l'environnement et du développement durable.
Alison Evans, Service de Restauration des Terrains
en Montagne de Haute-Savoie.
The person to contact for more information on this
policy within the French Ministry of Sustainable-
development, is François Hédou (Francois.
Literatur / References:
RISK PREVENTION FRENCH WEBPORTAL: www.prim.net
RISK MAPPING: http://cartorisque.prim.net/
WEBSITE OF THE FRENCH MINISTRY IN CHARGE OF RISK PREVENTION POLICY: http://www.developpement-durable.gouv.fr/
FRENCH MASS MOVEMENTS DATABASE: http://www.bdmvt.net/
BRGM (bureau de recherches géologiques et minières) Website: http://www.brgm.fr/
LCPC (1999) L'utilisation de la photo-interprétation dans l'établissement des plans de prévention des risques liés aux mouvements de terrain. Collection Environnement, 128 p.
LCPC (2000) Caractérisation et cartographie de l'aléa dû aux mouvements de terrain. Collection Environnement, 91 p.
MINISTÈRE DE L'AMÉNAGEMENT DU TERRITOIRE (1999). Plans de prévention des risques naturels (PPR). Risques de mouvements de terrain. La Documentation française, 71 p.
Hazard assessment and mapping of mass-movements in the EU
or Séchilienne (Isère), involving more than 10
million cubic metres of material, ad hoc methods
of hazard assessment have been set up, including
the monitoring of movement and various
computer simulations.
substantial damage potential or if the precision
of the study and the amount of available data
allow it, it is possible to map the hazards on a
1:5,000-scale map.
As far as very large mass movements are
concerned, such as La Clapière (Alpes-Maritimes)
Fig. 9: Decision process for assessing the reference hazard
Abb. 9: Entscheidungsprozess zur Bewertung der Bezugsgefährdung
Abb. 10: Beispiel für die Erstellung einer Übersichtstabelle über Steinschlaggefahr (von CETE du sud-ouest)
Fig 10: Example of hazard table determination for rock fall hazard (from CETE du sud-ouest)
Intensity level
Probability of occurrence
LowDetermining factors
identified on the site are diffuse, poorly deter-
mined.
MediumMany determining factors are identified on the site. Some factors unlisted can appear
with time.
HighSome nonidentified de-termining factors on the site. The intensity of the
factors is high.
LowRock Falls < 1 dm3
Very low to low hazard Very low to low hazard /
MediumRock Falls < 100 m3
Very low to low hazard Medium hazard High hazard
HighCollapses > 100 m3 / High hazard High hazard
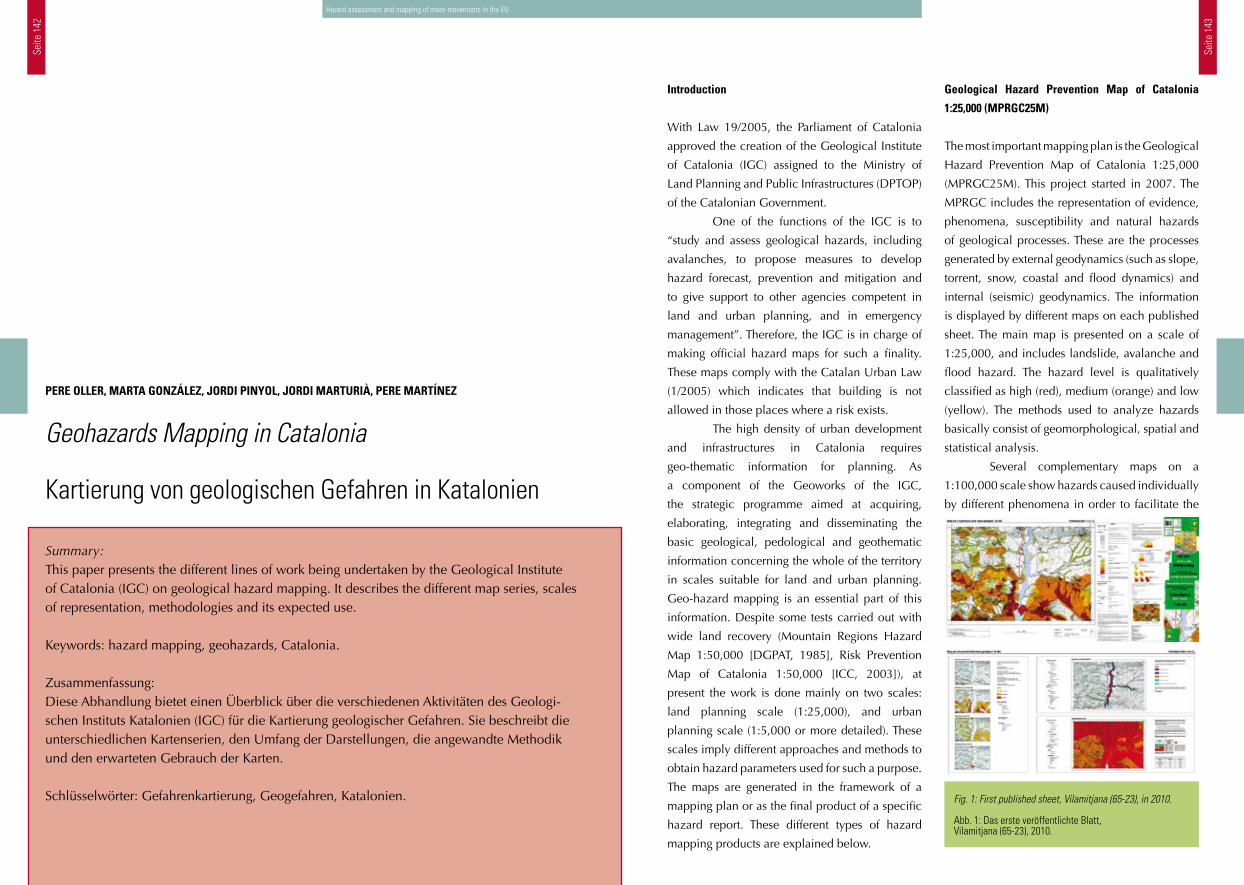
Seite
142
Seite
143
Geological Hazard Prevention Map of Catalonia
1:25,000 (MPRGC25M)
The most important mapping plan is the Geological
Hazard Prevention Map of Catalonia 1:25,000
(MPRGC25M). This project started in 2007. The
MPRGC includes the representation of evidence,
phenomena, susceptibility and natural hazards
of geological processes. These are the processes
generated by external geodynamics (such as slope,
torrent, snow, coastal and flood dynamics) and
internal (seismic) geodynamics. The information
is displayed by different maps on each published
sheet. The main map is presented on a scale of
1:25,000, and includes landslide, avalanche and
flood hazard. The hazard level is qualitatively
classified as high (red), medium (orange) and low
(yellow). The methods used to analyze hazards
basically consist of geomorphological, spatial and
statistical analysis.
Several complementary maps on a
1:100,000 scale show hazards caused individually
by different phenomena in order to facilitate the
Introduction
With Law 19/2005, the Parliament of Catalonia
approved the creation of the Geological Institute
of Catalonia (IGC) assigned to the Ministry of
Land Planning and Public Infrastructures (DPTOP)
of the Catalonian Government.
One of the functions of the IGC is to
“study and assess geological hazards, including
avalanches, to propose measures to develop
hazard forecast, prevention and mitigation and
to give support to other agencies competent in
land and urban planning, and in emergency
management”. Therefore, the IGC is in charge of
making official hazard maps for such a finality.
These maps comply with the Catalan Urban Law
(1/2005) which indicates that building is not
allowed in those places where a risk exists.
The high density of urban development
and infrastructures in Catalonia requires
geo-thematic information for planning. As
a component of the Geoworks of the IGC,
the strategic programme aimed at acquiring,
elaborating, integrating and disseminating the
basic geological, pedological and geothematic
information concerning the whole of the territory
in scales suitable for land and urban planning.
Geo-hazard mapping is an essential part of this
information. Despite some tests carried out with
wide land recovery (Mountain Regions Hazard
Map 1:50,000 [DGPAT, 1985], Risk Prevention
Map of Catalonia 1:50,000 [ICC, 2003]), at
present the work is done mainly on two scales:
land planning scale (1:25,000), and urban
planning scale (1:5,000 or more detailed). These
scales imply different approaches and methods to
obtain hazard parameters used for such a purpose.
The maps are generated in the framework of a
mapping plan or as the final product of a specific
hazard report. These different types of hazard
mapping products are explained below.
Fig. 1: First published sheet, Vilamitjana (65-23), in 2010.
Abb. 1: Das erste veröffentlichte Blatt, Vilamitjana (65-23), 2010.
Hazard assessment and mapping of mass-movements in the EU
Geohazards Mapping in Catalonia
Kartierung von geologischen Gefahren in Katalonien
Summary:This paper presents the different lines of work being undertaken by the Geological Institute of Catalonia (IGC) on geological hazard mapping. It describes the different map series, scales of representation, methodologies and its expected use.
Keywords: hazard mapping, geohazards, Catalonia.
Zusammenfassung:Diese Abhandlung bietet einen Überblick über die verschiedenen Aktivitäten des Geologi-schen Instituts Katalonien (IGC) für die Kartierung geologischer Gefahren. Sie beschreibt die unterschiedlichen Kartenserien, den Umfang der Darstellungen, die angewandte Methodik und den erwarteten Gebrauch der Karten.
Schlüsselwörter: Gefahrenkartierung, Geogefahren, Katalonien.
PERE OLLER, MARTA GONZÁLEZ, JORDI PINYOL, JORDI MARTURIÀ, PERE MARTÍNEZ
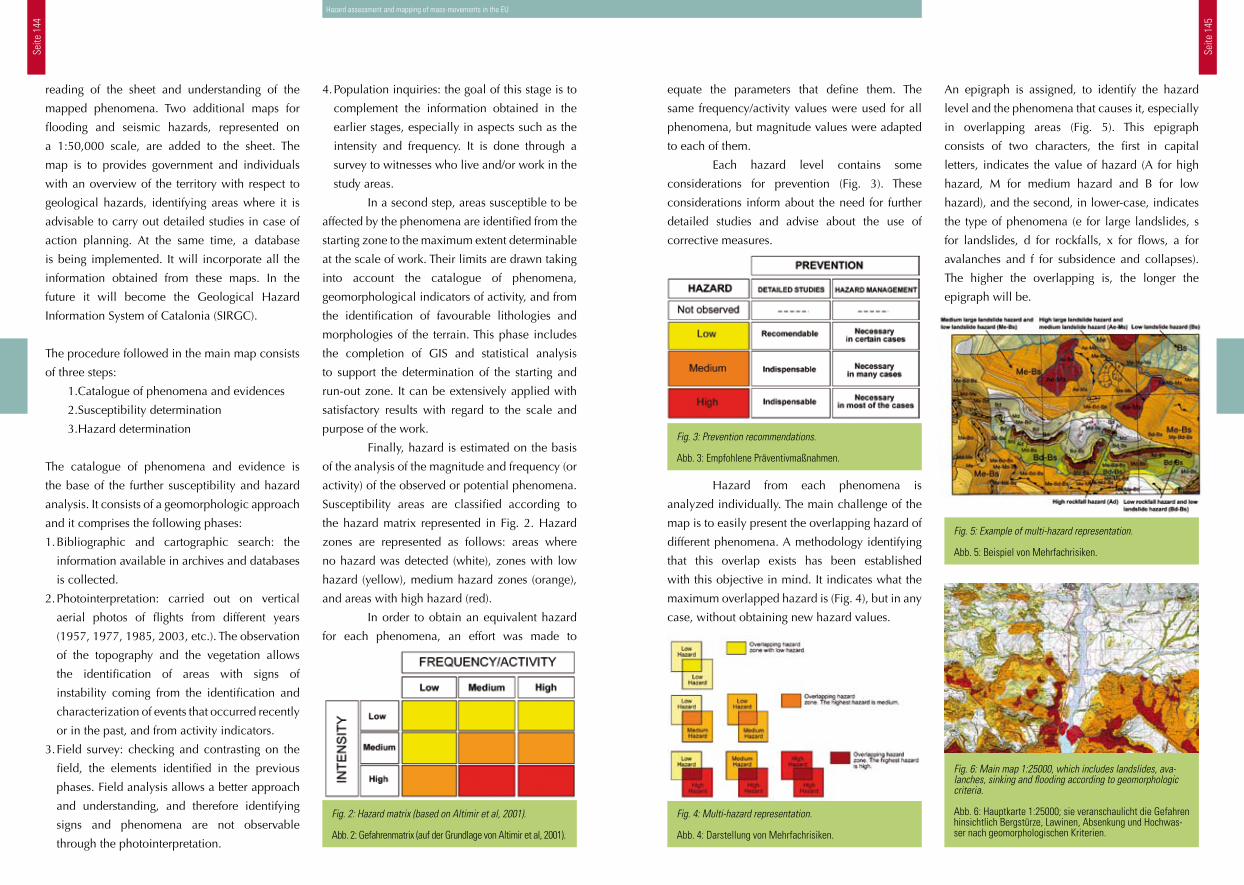
Seite
144
Seite
145
equate the parameters that define them. The
same frequency/activity values were used for all
phenomena, but magnitude values were adapted
to each of them.
Each hazard level contains some
considerations for prevention (Fig. 3). These
considerations inform about the need for further
detailed studies and advise about the use of
corrective measures.
Hazard from each phenomena is
analyzed individually. The main challenge of the
map is to easily present the overlapping hazard of
different phenomena. A methodology identifying
that this overlap exists has been established
with this objective in mind. It indicates what the
maximum overlapped hazard is (Fig. 4), but in any
case, without obtaining new hazard values.
An epigraph is assigned, to identify the hazard
level and the phenomena that causes it, especially
in overlapping areas (Fig. 5). This epigraph
consists of two characters, the first in capital
letters, indicates the value of hazard (A for high
hazard, M for medium hazard and B for low
hazard), and the second, in lower-case, indicates
the type of phenomena (e for large landslides, s
for landslides, d for rockfalls, x for flows, a for
avalanches and f for subsidence and collapses).
The higher the overlapping is, the longer the
epigraph will be.
Fig. 3: Prevention recommendations.
Abb. 3: Empfohlene Präventivmaßnahmen.
Fig. 4: Multi-hazard representation.
Abb. 4: Darstellung von Mehrfachrisiken.
Fig. 5: Example of multi-hazard representation.
Abb. 5: Beispiel von Mehrfachrisiken.
Fig. 6: Main map 1:25000, which includes landslides, ava-lanches, sinking and flooding according to geomorphologic criteria.
Abb. 6: Hauptkarte 1:25000; sie veranschaulicht die Gefahren hinsichtlich Bergstürze, Lawinen, Absenkung und Hochwas-ser nach geomorphologischen Kriterien.
Hazard assessment and mapping of mass-movements in the EU
4. Population inquiries: the goal of this stage is to
complement the information obtained in the
earlier stages, especially in aspects such as the
intensity and frequency. It is done through a
survey to witnesses who live and/or work in the
study areas.
In a second step, areas susceptible to be
affected by the phenomena are identified from the
starting zone to the maximum extent determinable
at the scale of work. Their limits are drawn taking
into account the catalogue of phenomena,
geomorphological indicators of activity, and from
the identification of favourable lithologies and
morphologies of the terrain. This phase includes
the completion of GIS and statistical analysis
to support the determination of the starting and
run-out zone. It can be extensively applied with
satisfactory results with regard to the scale and
purpose of the work.
Finally, hazard is estimated on the basis
of the analysis of the magnitude and frequency (or
activity) of the observed or potential phenomena.
Susceptibility areas are classified according to
the hazard matrix represented in Fig. 2. Hazard
zones are represented as follows: areas where
no hazard was detected (white), zones with low
hazard (yellow), medium hazard zones (orange),
and areas with high hazard (red).
In order to obtain an equivalent hazard
for each phenomena, an effort was made to
reading of the sheet and understanding of the
mapped phenomena. Two additional maps for
flooding and seismic hazards, represented on
a 1:50,000 scale, are added to the sheet. The
map is to provides government and individuals
with an overview of the territory with respect to
geological hazards, identifying areas where it is
advisable to carry out detailed studies in case of
action planning. At the same time, a database
is being implemented. It will incorporate all the
information obtained from these maps. In the
future it will become the Geological Hazard
Information System of Catalonia (SIRGC).
The procedure followed in the main map consists
of three steps:
1.Catalogue of phenomena and evidences
2.Susceptibility determination
3.Hazard determination
The catalogue of phenomena and evidence is
the base of the further susceptibility and hazard
analysis. It consists of a geomorphologic approach
and it comprises the following phases:
1. Bibliographic and cartographic search: the
information available in archives and databases
is collected.
2. Photointerpretation: carried out on vertical
aerial photos of flights from different years
(1957, 1977, 1985, 2003, etc.). The observation
of the topography and the vegetation allows
the identification of areas with signs of
instability coming from the identification and
characterization of events that occurred recently
or in the past, and from activity indicators.
3. Field survey: checking and contrasting on the
field, the elements identified in the previous
phases. Field analysis allows a better approach
and understanding, and therefore identifying
signs and phenomena are not observable
through the photointerpretation.
Fig. 2: Hazard matrix (based on Altimir et al, 2001).
Abb. 2: Gefahrenmatrix (auf der Grundlage von Altimir et al, 2001).
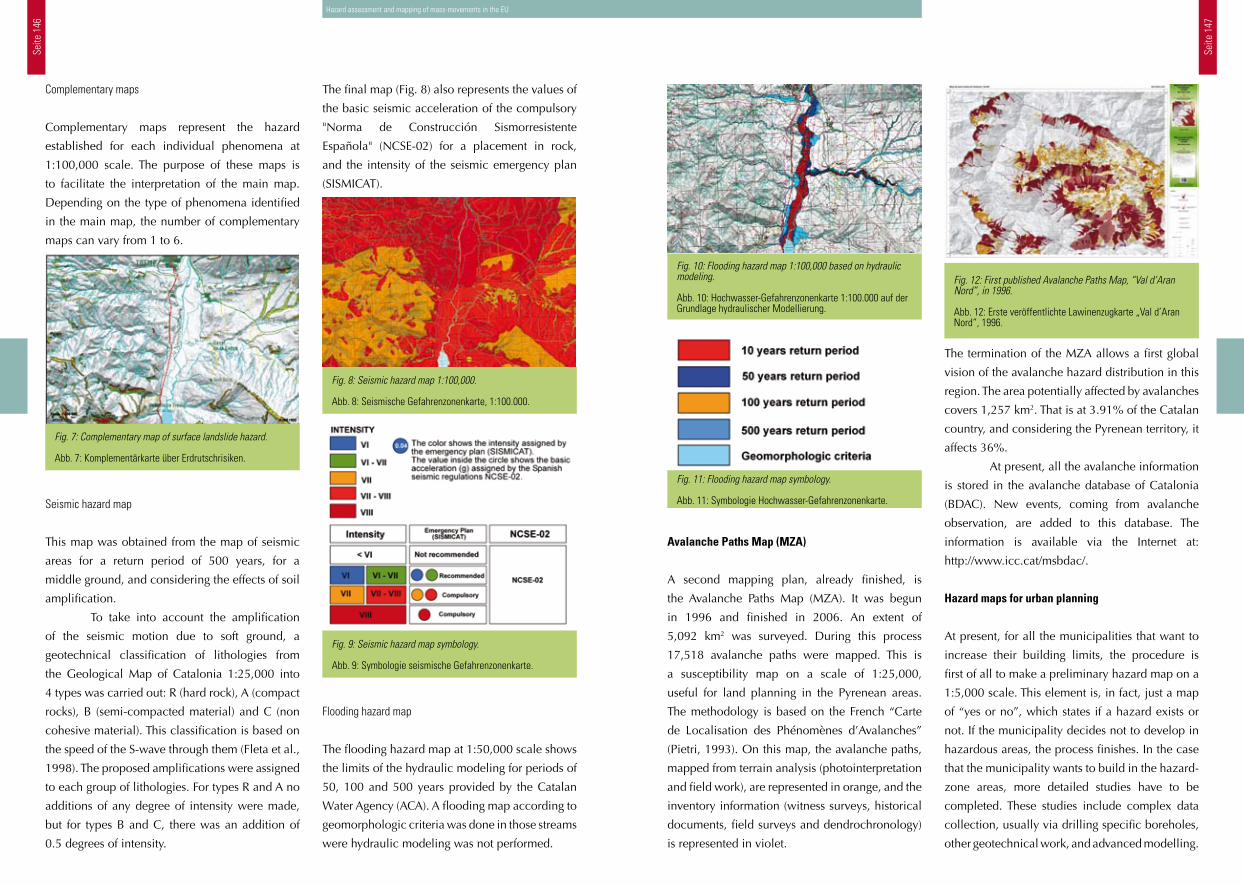
Seite
146
Seite
147
Avalanche Paths Map (MZA)
A second mapping plan, already finished, is
the Avalanche Paths Map (MZA). It was begun
in 1996 and finished in 2006. An extent of
5,092 km2 was surveyed. During this process
17,518 avalanche paths were mapped. This is
a susceptibility map on a scale of 1:25,000,
useful for land planning in the Pyrenean areas.
The methodology is based on the French “Carte
de Localisation des Phénomènes d’Avalanches”
(Pietri, 1993). On this map, the avalanche paths,
mapped from terrain analysis (photointerpretation
and field work), are represented in orange, and the
inventory information (witness surveys, historical
documents, field surveys and dendrochronology)
is represented in violet.
The termination of the MZA allows a first global
vision of the avalanche hazard distribution in this
region. The area potentially affected by avalanches
covers 1,257 km2. That is at 3.91% of the Catalan
country, and considering the Pyrenean territory, it
affects 36%.
At present, all the avalanche information
is stored in the avalanche database of Catalonia
(BDAC). New events, coming from avalanche
observation, are added to this database. The
information is available via the Internet at:
http://www.icc.cat/msbdac/.
Hazard maps for urban planning
At present, for all the municipalities that want to
increase their building limits, the procedure is
first of all to make a preliminary hazard map on a
1:5,000 scale. This element is, in fact, just a map
of “yes or no”, which states if a hazard exists or
not. If the municipality decides not to develop in
hazardous areas, the process finishes. In the case
that the municipality wants to build in the hazard-
zone areas, more detailed studies have to be
completed. These studies include complex data
collection, usually via drilling specific boreholes,
other geotechnical work, and advanced modelling.
Fig. 11: Flooding hazard map symbology.
Abb. 11: Symbologie Hochwasser-Gefahrenzonenkarte.
Fig. 12: First published Avalanche Paths Map, “Val d’Aran Nord”, in 1996.
Abb. 12: Erste veröffentlichte Lawinenzugkarte „Val d’Aran Nord“, 1996.
Fig. 10: Flooding hazard map 1:100,000 based on hydraulic modeling.
Abb. 10: Hochwasser-Gefahrenzonenkarte 1:100.000 auf der Grundlage hydraulischer Modellierung.
Hazard assessment and mapping of mass-movements in the EU
The final map (Fig. 8) also represents the values of
the basic seismic acceleration of the compulsory
"Norma de Construcción Sismorresistente
Española" (NCSE-02) for a placement in rock,
and the intensity of the seismic emergency plan
(SISMICAT).
Flooding hazard map
The flooding hazard map at 1:50,000 scale shows
the limits of the hydraulic modeling for periods of
50, 100 and 500 years provided by the Catalan
Water Agency (ACA). A flooding map according to
geomorphologic criteria was done in those streams
were hydraulic modeling was not performed.
Complementary maps
Complementary maps represent the hazard
established for each individual phenomena at
1:100,000 scale. The purpose of these maps is
to facilitate the interpretation of the main map.
Depending on the type of phenomena identified
in the main map, the number of complementary
maps can vary from 1 to 6.
Seismic hazard map
This map was obtained from the map of seismic
areas for a return period of 500 years, for a
middle ground, and considering the effects of soil
amplification.
To take into account the amplification
of the seismic motion due to soft ground, a
geotechnical classification of lithologies from
the Geological Map of Catalonia 1:25,000 into
4 types was carried out: R (hard rock), A (compact
rocks), B (semi-compacted material) and C (non
cohesive material). This classification is based on
the speed of the S-wave through them (Fleta et al.,
1998). The proposed amplifications were assigned
to each group of lithologies. For types R and A no
additions of any degree of intensity were made,
but for types B and C, there was an addition of
0.5 degrees of intensity.
Fig. 7: Complementary map of surface landslide hazard.
Abb. 7: Komplementärkarte über Erdrutschrisiken.
Fig. 8: Seismic hazard map 1:100,000.
Abb. 8: Seismische Gefahrenzonenkarte, 1:100.000.
Fig. 9: Seismic hazard map symbology.
Abb. 9: Symbologie seismische Gefahrenzonenkarte.
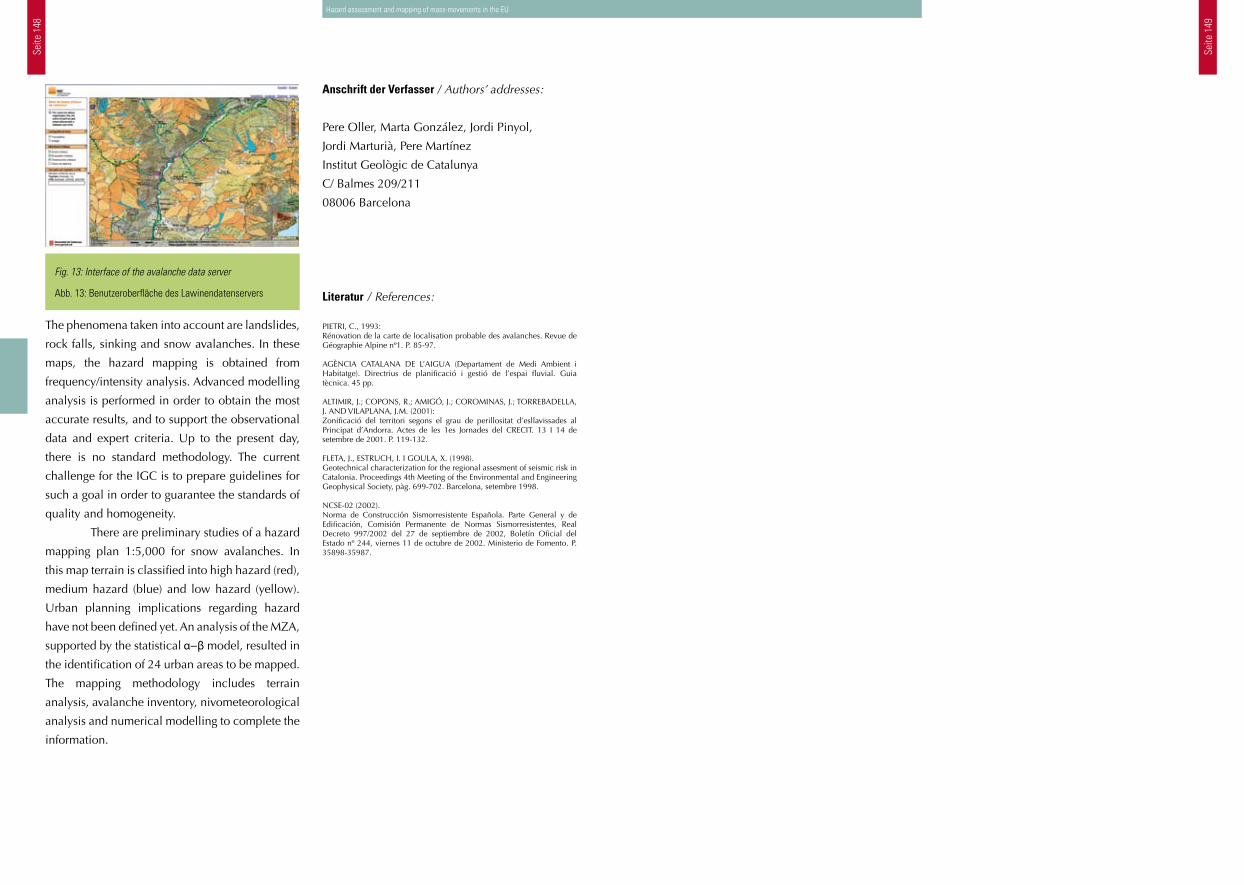
Seite
148
Seite
149
Hazard assessment and mapping of mass-movements in the EU
Anschrift der Verfasser / Authors’ addresses:
Pere Oller, Marta González, Jordi Pinyol,
Jordi Marturià, Pere Martínez
Institut Geològic de Catalunya
C/ Balmes 209/211
08006 Barcelona
Literatur / References:
PIETRI, C., 1993: Rénovation de la carte de localisation probable des avalanches. Revue de Géographie Alpine nº1. P. 85-97.
AGÈNCIA CATALANA DE L’AIGUA (Departament de Medi Ambient i Habitatge). Directrius de planificació i gestió de l’espai fluvial. Guia tècnica. 45 pp.
ALTIMIR, J.; COPONS, R.; AMIGÓ, J.; COROMINAS, J.; TORREBADELLA, J. AND VILAPLANA, J.M. (2001): Zonificació del territori segons el grau de perillositat d’esllavissades al Principat d’Andorra. Actes de les 1es Jornades del CRECIT. 13 I 14 de setembre de 2001. P. 119-132.
FLETA, J., ESTRUCH, I. I GOULA, X. (1998).Geotechnical characterization for the regional assesment of seismic risk in Catalonia. Proceedings 4th Meeting of the Environmental and Engineering Geophysical Society, pàg. 699-702. Barcelona, setembre 1998.
NCSE-02 (2002). Norma de Construcción Sismorresistente Española. Parte General y de Edificación, Comisión Permanente de Normas Sismorresistentes, Real Decreto 997/2002 del 27 de septiembre de 2002, Boletín Oficial del Estado nº 244, viernes 11 de octubre de 2002. Ministerio de Fomento. P. 35898-35987.
The phenomena taken into account are landslides,
rock falls, sinking and snow avalanches. In these
maps, the hazard mapping is obtained from
frequency/intensity analysis. Advanced modelling
analysis is performed in order to obtain the most
accurate results, and to support the observational
data and expert criteria. Up to the present day,
there is no standard methodology. The current
challenge for the IGC is to prepare guidelines for
such a goal in order to guarantee the standards of
quality and homogeneity.
There are preliminary studies of a hazard
mapping plan 1:5,000 for snow avalanches. In
this map terrain is classified into high hazard (red),
medium hazard (blue) and low hazard (yellow).
Urban planning implications regarding hazard
have not been defined yet. An analysis of the MZA,
supported by the statistical α−β model, resulted in
the identification of 24 urban areas to be mapped.
The mapping methodology includes terrain
analysis, avalanche inventory, nivometeorological
analysis and numerical modelling to complete the
information.
Fig. 13: Interface of the avalanche data server
Abb. 13: Benutzeroberfläche des Lawinendatenservers
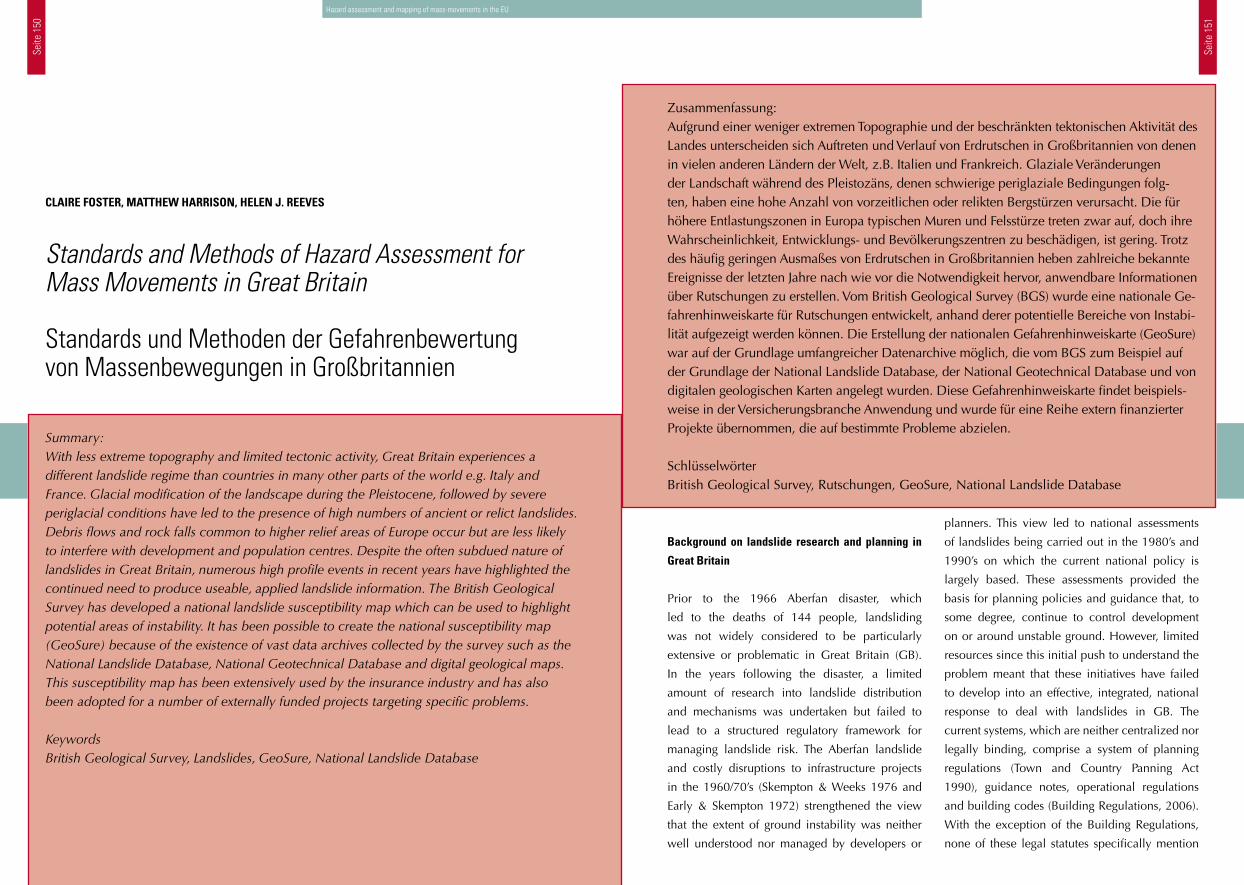
Seite
150
Seite
151
planners. This view led to national assessments
of landslides being carried out in the 1980’s and
1990’s on which the current national policy is
largely based. These assessments provided the
basis for planning policies and guidance that, to
some degree, continue to control development
on or around unstable ground. However, limited
resources since this initial push to understand the
problem meant that these initiatives have failed
to develop into an effective, integrated, national
response to deal with landslides in GB. The
current systems, which are neither centralized nor
legally binding, comprise a system of planning
regulations (Town and Country Panning Act
1990), guidance notes, operational regulations
and building codes (Building Regulations, 2006).
With the exception of the Building Regulations,
none of these legal statutes specifically mention
Background on landslide research and planning in
Great Britain
Prior to the 1966 Aberfan disaster, which
led to the deaths of 144 people, landsliding
was not widely considered to be particularly
extensive or problematic in Great Britain (GB).
In the years following the disaster, a limited
amount of research into landslide distribution
and mechanisms was undertaken but failed to
lead to a structured regulatory framework for
managing landslide risk. The Aberfan landslide
and costly disruptions to infrastructure projects
in the 1960/70’s (Skempton & Weeks 1976 and
Early & Skempton 1972) strengthened the view
that the extent of ground instability was neither
well understood nor managed by developers or
Zusammenfassung:Aufgrund einer weniger extremen Topographie und der beschränkten tektonischen Aktivität des Landes unterscheiden sich Auftreten und Verlauf von Erdrutschen in Großbritannien von denen in vielen anderen Ländern der Welt, z.B. Italien und Frankreich. Glaziale Veränderungen der Landschaft während des Pleistozäns, denen schwierige periglaziale Bedingungen folg-ten, haben eine hohe Anzahl von vorzeitlichen oder relikten Bergstürzen verursacht. Die für höhere Entlastungszonen in Europa typischen Muren und Felsstürze treten zwar auf, doch ihre Wahrscheinlichkeit, Entwicklungs- und Bevölkerungszentren zu beschädigen, ist gering. Trotz des häufig geringen Ausmaßes von Erdrutschen in Großbritannien heben zahlreiche bekannte Ereignisse der letzten Jahre nach wie vor die Notwendigkeit hervor, anwendbare Informationen über Rutschungen zu erstellen. Vom British Geological Survey (BGS) wurde eine nationale Ge-fahrenhinweiskarte für Rutschungen entwickelt, anhand derer potentielle Bereiche von Instabi-lität aufgezeigt werden können. Die Erstellung der nationalen Gefahrenhinweiskarte (GeoSure) war auf der Grundlage umfangreicher Datenarchive möglich, die vom BGS zum Beispiel auf der Grundlage der National Landslide Database, der National Geotechnical Database und von digitalen geologischen Karten angelegt wurden. Diese Gefahrenhinweiskarte findet beispiels-weise in der Versicherungsbranche Anwendung und wurde für eine Reihe extern finanzierter Projekte übernommen, die auf bestimmte Probleme abzielen.
SchlüsselwörterBritish Geological Survey, Rutschungen, GeoSure, National Landslide Database
Standards and Methods of Hazard Assessment for Mass Movements in Great Britain
Standards und Methoden der Gefahrenbewertung von Massenbewegungen in Großbritannien
CLAIRE FOSTER, MATTHEW HARRISON, HELEN J. REEVES
Summary:With less extreme topography and limited tectonic activity, Great Britain experiences a different landslide regime than countries in many other parts of the world e.g. Italy and France. Glacial modification of the landscape during the Pleistocene, followed by severe periglacial conditions have led to the presence of high numbers of ancient or relict landslides. Debris flows and rock falls common to higher relief areas of Europe occur but are less likely to interfere with development and population centres. Despite the often subdued nature of landslides in Great Britain, numerous high profile events in recent years have highlighted the continued need to produce useable, applied landslide information. The British Geological Survey has developed a national landslide susceptibility map which can be used to highlight potential areas of instability. It has been possible to create the national susceptibility map (GeoSure) because of the existence of vast data archives collected by the survey such as the National Landslide Database, National Geotechnical Database and digital geological maps. This susceptibility map has been extensively used by the insurance industry and has also been adopted for a number of externally funded projects targeting specific problems.
KeywordsBritish Geological Survey, Landslides, GeoSure, National Landslide Database
Hazard assessment and mapping of mass-movements in the EU
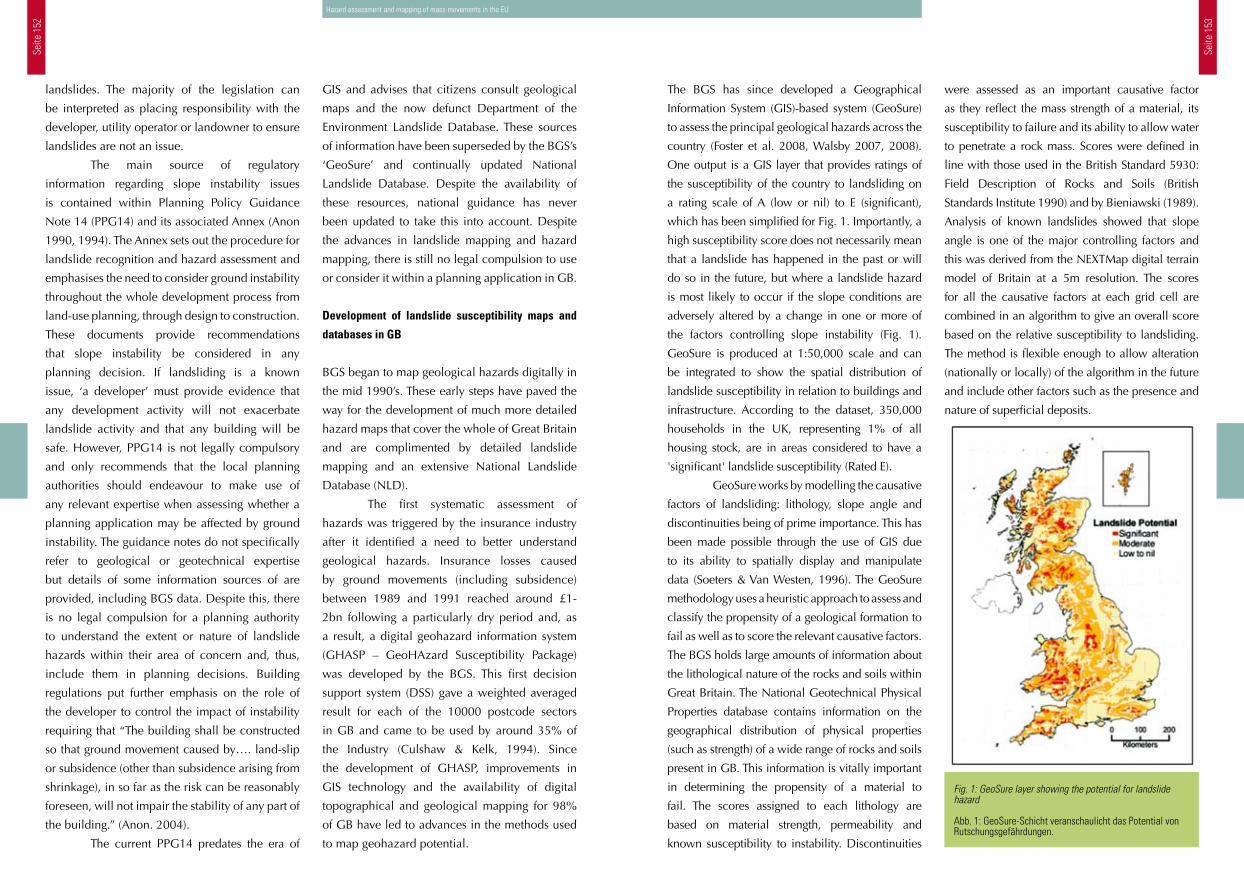
Seite
152
Seite
153
The BGS has since developed a Geographical
Information System (GIS)-based system (GeoSure)
to assess the principal geological hazards across the
country (Foster et al. 2008, Walsby 2007, 2008).
One output is a GIS layer that provides ratings of
the susceptibility of the country to landsliding on
a rating scale of A (low or nil) to E (significant),
which has been simplified for Fig. 1. Importantly, a
high susceptibility score does not necessarily mean
that a landslide has happened in the past or will
do so in the future, but where a landslide hazard
is most likely to occur if the slope conditions are
adversely altered by a change in one or more of
the factors controlling slope instability (Fig. 1).
GeoSure is produced at 1:50,000 scale and can
be integrated to show the spatial distribution of
landslide susceptibility in relation to buildings and
infrastructure. According to the dataset, 350,000
households in the UK, representing 1% of all
housing stock, are in areas considered to have a
'significant' landslide susceptibility (Rated E).
GeoSure works by modelling the causative
factors of landsliding: lithology, slope angle and
discontinuities being of prime importance. This has
been made possible through the use of GIS due
to its ability to spatially display and manipulate
data (Soeters & Van Westen, 1996). The GeoSure
methodology uses a heuristic approach to assess and
classify the propensity of a geological formation to
fail as well as to score the relevant causative factors.
The BGS holds large amounts of information about
the lithological nature of the rocks and soils within
Great Britain. The National Geotechnical Physical
Properties database contains information on the
geographical distribution of physical properties
(such as strength) of a wide range of rocks and soils
present in GB. This information is vitally important
in determining the propensity of a material to
fail. The scores assigned to each lithology are
based on material strength, permeability and
known susceptibility to instability. Discontinuities
were assessed as an important causative factor
as they reflect the mass strength of a material, its
susceptibility to failure and its ability to allow water
to penetrate a rock mass. Scores were defined in
line with those used in the British Standard 5930:
Field Description of Rocks and Soils (British
Standards Institute 1990) and by Bieniawski (1989).
Analysis of known landslides showed that slope
angle is one of the major controlling factors and
this was derived from the NEXTMap digital terrain
model of Britain at a 5m resolution. The scores
for all the causative factors at each grid cell are
combined in an algorithm to give an overall score
based on the relative susceptibility to landsliding.
The method is flexible enough to allow alteration
(nationally or locally) of the algorithm in the future
and include other factors such as the presence and
nature of superficial deposits.
Fig. 1: GeoSure layer showing the potential for landslide hazard Abb. 1: GeoSure-Schicht veranschaulicht das Potential von Rutschungsgefährdungen.
Hazard assessment and mapping of mass-movements in the EU
GIS and advises that citizens consult geological
maps and the now defunct Department of the
Environment Landslide Database. These sources
of information have been superseded by the BGS’s
‘GeoSure’ and continually updated National
Landslide Database. Despite the availability of
these resources, national guidance has never
been updated to take this into account. Despite
the advances in landslide mapping and hazard
mapping, there is still no legal compulsion to use
or consider it within a planning application in GB.
Development of landslide susceptibility maps and
databases in GB
BGS began to map geological hazards digitally in
the mid 1990’s. These early steps have paved the
way for the development of much more detailed
hazard maps that cover the whole of Great Britain
and are complimented by detailed landslide
mapping and an extensive National Landslide
Database (NLD).
The first systematic assessment of
hazards was triggered by the insurance industry
after it identified a need to better understand
geological hazards. Insurance losses caused
by ground movements (including subsidence)
between 1989 and 1991 reached around £1-
2bn following a particularly dry period and, as
a result, a digital geohazard information system
(GHASP – GeoHAzard Susceptibility Package)
was developed by the BGS. This first decision
support system (DSS) gave a weighted averaged
result for each of the 10000 postcode sectors
in GB and came to be used by around 35% of
the Industry (Culshaw & Kelk, 1994). Since
the development of GHASP, improvements in
GIS technology and the availability of digital
topographical and geological mapping for 98%
of GB have led to advances in the methods used
to map geohazard potential.
landslides. The majority of the legislation can
be interpreted as placing responsibility with the
developer, utility operator or landowner to ensure
landslides are not an issue.
The main source of regulatory
information regarding slope instability issues
is contained within Planning Policy Guidance
Note 14 (PPG14) and its associated Annex (Anon
1990, 1994). The Annex sets out the procedure for
landslide recognition and hazard assessment and
emphasises the need to consider ground instability
throughout the whole development process from
land-use planning, through design to construction.
These documents provide recommendations
that slope instability be considered in any
planning decision. If landsliding is a known
issue, ‘a developer’ must provide evidence that
any development activity will not exacerbate
landslide activity and that any building will be
safe. However, PPG14 is not legally compulsory
and only recommends that the local planning
authorities should endeavour to make use of
any relevant expertise when assessing whether a
planning application may be affected by ground
instability. The guidance notes do not specifically
refer to geological or geotechnical expertise
but details of some information sources of are
provided, including BGS data. Despite this, there
is no legal compulsion for a planning authority
to understand the extent or nature of landslide
hazards within their area of concern and, thus,
include them in planning decisions. Building
regulations put further emphasis on the role of
the developer to control the impact of instability
requiring that “The building shall be constructed
so that ground movement caused by…. land-slip
or subsidence (other than subsidence arising from
shrinkage), in so far as the risk can be reasonably
foreseen, will not impair the stability of any part of
the building.” (Anon. 2004).
The current PPG14 predates the era of
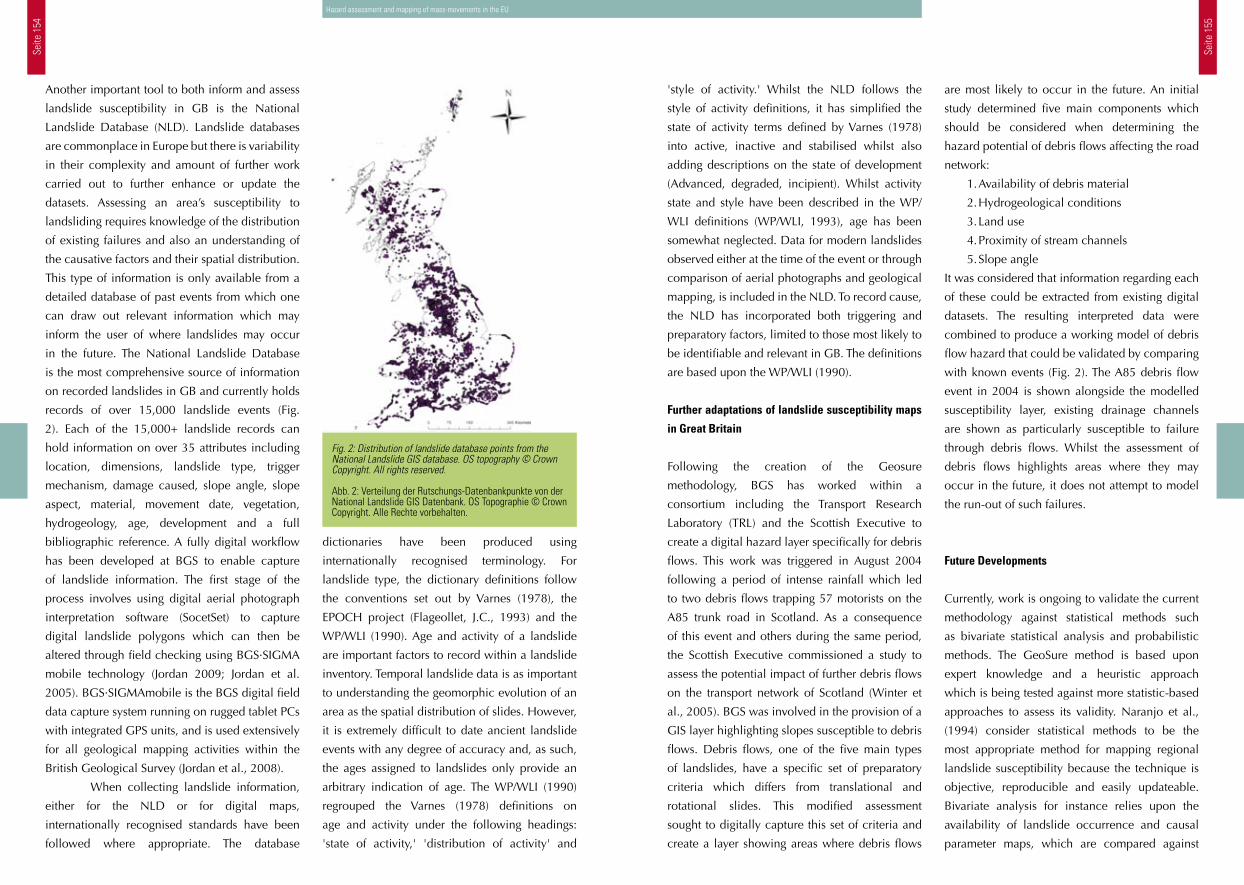
Seite
154
Seite
155
'style of activity.' Whilst the NLD follows the
style of activity definitions, it has simplified the
state of activity terms defined by Varnes (1978)
into active, inactive and stabilised whilst also
adding descriptions on the state of development
(Advanced, degraded, incipient). Whilst activity
state and style have been described in the WP/
WLI definitions (WP/WLI, 1993), age has been
somewhat neglected. Data for modern landslides
observed either at the time of the event or through
comparison of aerial photographs and geological
mapping, is included in the NLD. To record cause,
the NLD has incorporated both triggering and
preparatory factors, limited to those most likely to
be identifiable and relevant in GB. The definitions
are based upon the WP/WLI (1990).
Further adaptations of landslide susceptibility maps
in Great Britain
Following the creation of the Geosure
methodology, BGS has worked within a
consortium including the Transport Research
Laboratory (TRL) and the Scottish Executive to
create a digital hazard layer specifically for debris
flows. This work was triggered in August 2004
following a period of intense rainfall which led
to two debris flows trapping 57 motorists on the
A85 trunk road in Scotland. As a consequence
of this event and others during the same period,
the Scottish Executive commissioned a study to
assess the potential impact of further debris flows
on the transport network of Scotland (Winter et
al., 2005). BGS was involved in the provision of a
GIS layer highlighting slopes susceptible to debris
flows. Debris flows, one of the five main types
of landslides, have a specific set of preparatory
criteria which differs from translational and
rotational slides. This modified assessment
sought to digitally capture this set of criteria and
create a layer showing areas where debris flows
are most likely to occur in the future. An initial
study determined five main components which
should be considered when determining the
hazard potential of debris flows affecting the road
network:
1. Availability of debris material
2. Hydrogeological conditions
3. Land use
4. Proximity of stream channels
5. Slope angle
It was considered that information regarding each
of these could be extracted from existing digital
datasets. The resulting interpreted data were
combined to produce a working model of debris
flow hazard that could be validated by comparing
with known events (Fig. 2). The A85 debris flow
event in 2004 is shown alongside the modelled
susceptibility layer, existing drainage channels
are shown as particularly susceptible to failure
through debris flows. Whilst the assessment of
debris flows highlights areas where they may
occur in the future, it does not attempt to model
the run-out of such failures.
Future Developments
Currently, work is ongoing to validate the current
methodology against statistical methods such
as bivariate statistical analysis and probabilistic
methods. The GeoSure method is based upon
expert knowledge and a heuristic approach
which is being tested against more statistic-based
approaches to assess its validity. Naranjo et al.,
(1994) consider statistical methods to be the
most appropriate method for mapping regional
landslide susceptibility because the technique is
objective, reproducible and easily updateable.
Bivariate analysis for instance relies upon the
availability of landslide occurrence and causal
parameter maps, which are compared against
dictionaries have been produced using
internationally recognised terminology. For
landslide type, the dictionary definitions follow
the conventions set out by Varnes (1978), the
EPOCH project (Flageollet, J.C., 1993) and the
WP/WLI (1990). Age and activity of a landslide
are important factors to record within a landslide
inventory. Temporal landslide data is as important
to understanding the geomorphic evolution of an
area as the spatial distribution of slides. However,
it is extremely difficult to date ancient landslide
events with any degree of accuracy and, as such,
the ages assigned to landslides only provide an
arbitrary indication of age. The WP/WLI (1990)
regrouped the Varnes (1978) definitions on
age and activity under the following headings:
'state of activity,' 'distribution of activity' and
Another important tool to both inform and assess
landslide susceptibility in GB is the National
Landslide Database (NLD). Landslide databases
are commonplace in Europe but there is variability
in their complexity and amount of further work
carried out to further enhance or update the
datasets. Assessing an area’s susceptibility to
landsliding requires knowledge of the distribution
of existing failures and also an understanding of
the causative factors and their spatial distribution.
This type of information is only available from a
detailed database of past events from which one
can draw out relevant information which may
inform the user of where landslides may occur
in the future. The National Landslide Database
is the most comprehensive source of information
on recorded landslides in GB and currently holds
records of over 15,000 landslide events (Fig.
2). Each of the 15,000+ landslide records can
hold information on over 35 attributes including
location, dimensions, landslide type, trigger
mechanism, damage caused, slope angle, slope
aspect, material, movement date, vegetation,
hydrogeology, age, development and a full
bibliographic reference. A fully digital workflow
has been developed at BGS to enable capture
of landslide information. The first stage of the
process involves using digital aerial photograph
interpretation software (SocetSet) to capture
digital landslide polygons which can then be
altered through field checking using BGS·SIGMA
mobile technology (Jordan 2009; Jordan et al.
2005). BGS·SIGMAmobile is the BGS digital field
data capture system running on rugged tablet PCs
with integrated GPS units, and is used extensively
for all geological mapping activities within the
British Geological Survey (Jordan et al., 2008).
When collecting landslide information,
either for the NLD or for digital maps,
internationally recognised standards have been
followed where appropriate. The database
Fig. 2: Distribution of landslide database points from the National Landslide GIS database. OS topography © Crown Copyright. All rights reserved.
Abb. 2: Verteilung der Rutschungs-Datenbankpunkte von der National Landslide GIS Datenbank. OS Topographie © Crown Copyright. Alle Rechte vorbehalten.
Hazard assessment and mapping of mass-movements in the EU
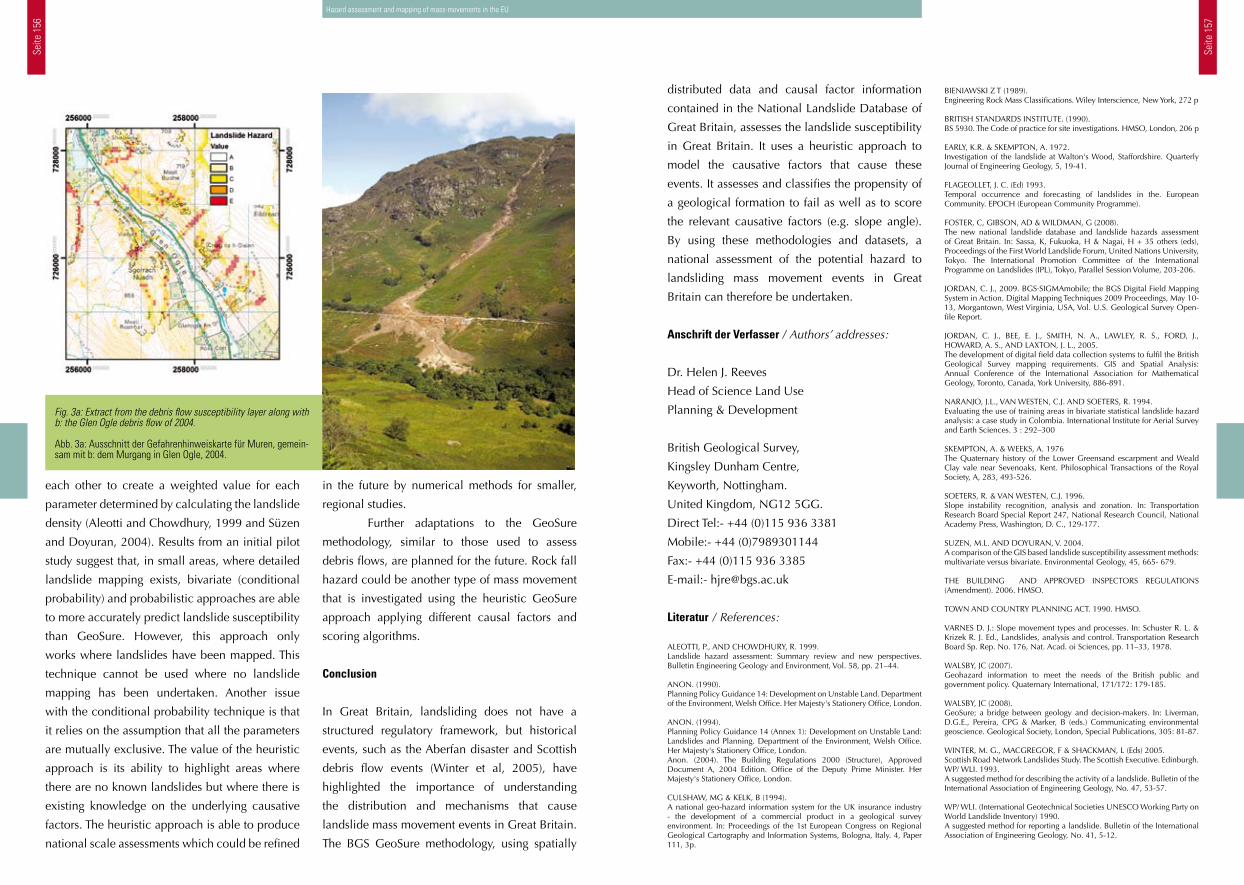
Seite
156
Seite
157
distributed data and causal factor information
contained in the National Landslide Database of
Great Britain, assesses the landslide susceptibility
in Great Britain. It uses a heuristic approach to
model the causative factors that cause these
events. It assesses and classifies the propensity of
a geological formation to fail as well as to score
the relevant causative factors (e.g. slope angle).
By using these methodologies and datasets, a
national assessment of the potential hazard to
landsliding mass movement events in Great
Britain can therefore be undertaken.
Anschrift der Verfasser / Authors’ addresses:
Dr. Helen J. Reeves
Head of Science Land Use
Planning & Development
British Geological Survey,
Kingsley Dunham Centre,
Keyworth, Nottingham.
United Kingdom, NG12 5GG.
Direct Tel:- +44 (0)115 936 3381
Mobile:- +44 (0)7989301144
Fax:- +44 (0)115 936 3385
E-mail:- [email protected]
Literatur / References:
ALEOTTI, P., AND CHOWDHURY, R. 1999. Landslide hazard assessment: Summary review and new perspectives. Bulletin Engineering Geology and Environment, Vol. 58, pp. 21–44.
ANON. (1990). Planning Policy Guidance 14: Development on Unstable Land. Department of the Environment, Welsh Office. Her Majesty's Stationery Office, London.
ANON. (1994). Planning Policy Guidance 14 (Annex 1): Development on Unstable Land: Landslides and Planning. Department of the Environment, Welsh Office. Her Majesty's Stationery Office, London.Anon. (2004). The Building Regulations 2000 (Structure), Approved Document A, 2004 Edition. Office of the Deputy Prime Minister. Her Majesty's Stationery Office, London.
CULSHAW, MG & KELK, B (1994). A national geo-hazard information system for the UK insurance industry - the development of a commercial product in a geological survey environment. In: Proceedings of the 1st European Congress on Regional Geological Cartography and Information Systems, Bologna, Italy. 4, Paper 111, 3p.
BIENIAWSKI Z T (1989).Engineering Rock Mass Classifications. Wiley Interscience, New York, 272 p
BRITISH STANDARDS INSTITUTE. (1990). BS 5930. The Code of practice for site investigations. HMSO, London, 206 p
EARLY, K.R. & SKEMPTON, A. 1972. Investigation of the landslide at Walton's Wood, Staffordshire. Quarterly Journal of Engineering Geology, 5, 19-41.
FLAGEOLLET, J. C. (Ed) 1993. Temporal occurrence and forecasting of landslides in the. European Community. EPOCH (European Community Programme).
FOSTER, C, GIBSON, AD & WILDMAN, G (2008). The new national landslide database and landslide hazards assessment of Great Britain. In: Sassa, K, Fukuoka, H & Nagai, H + 35 others (eds), Proceedings of the First World Landslide Forum, United Nations University, Tokyo. The International Promotion Committee of the International Programme on Landslides (IPL), Tokyo, Parallel Session Volume, 203-206.
JORDAN, C. J., 2009. BGS∙SIGMAmobile; the BGS Digital Field Mapping System in Action. Digital Mapping Techniques 2009 Proceedings, May 10-13, Morgantown, West Virginia, USA, Vol. U.S. Geological Survey Open-file Report.
JORDAN, C. J., BEE, E. J., SMITH, N. A., LAWLEY, R. S., FORD, J., HOWARD, A. S., AND LAXTON, J. L., 2005. The development of digital field data collection systems to fulfil the British Geological Survey mapping requirements. GIS and Spatial Analysis: Annual Conference of the International Association for Mathematical Geology, Toronto, Canada, York University, 886-891.
NARANJO, J.L., VAN WESTEN, C.J. AND SOETERS, R. 1994. Evaluating the use of training areas in bivariate statistical landslide hazard analysis: a case study in Colombia. International Institute for Aerial Survey and Earth Sciences. 3 : 292–300
SKEMPTON, A. & WEEKS, A. 1976 The Quaternary history of the Lower Greensand escarpment and Weald Clay vale near Sevenoaks, Kent. Philosophical Transactions of the Royal Society, A, 283, 493-526.
SOETERS, R. & VAN WESTEN, C.J. 1996. Slope instability recognition, analysis and zonation. In: Transportation Research Board Special Report 247, National Research Council, National Academy Press, Washington, D. C., 129-177.
SUZEN, M.L. AND DOYURAN, V. 2004. A comparison of the GIS based landslide susceptibility assessment methods: multivariate versus bivariate. Environmental Geology, 45, 665- 679.
THE BUILDING AND APPROVED INSPECTORS REGULATIONS (Amendment). 2006. HMSO.
TOWN AND COUNTRY PLANNING ACT. 1990. HMSO.
VARNES D. J.: Slope movement types and processes. In: Schuster R. L. & Krizek R. J. Ed., Landslides, analysis and control. Transportation Research Board Sp. Rep. No. 176, Nat. Acad. oi Sciences, pp. 11–33, 1978.
WALSBY, JC (2007). Geohazard information to meet the needs of the British public and government policy. Quaternary International, 171/172: 179-185.
WALSBY, JC (2008). GeoSure; a bridge between geology and decision-makers. In: Liverman, D.G.E., Pereira, CPG & Marker, B (eds.) Communicating environmental geoscience. Geological Society, London, Special Publications, 305: 81-87.
WINTER, M. G., MACGREGOR, F & SHACKMAN, L (Eds) 2005. Scottish Road Network Landslides Study. The Scottish Executive. Edinburgh. WP/ WLI. 1993. A suggested method for describing the activity of a landslide. Bulletin of the International Association of Engineering Geology, No. 47, 53-57.
WP/ WLI. (International Geotechnical Societies UNESCO Working Party on World Landslide Inventory) 1990. A suggested method for reporting a landslide. Bulletin of the International Association of Engineering Geology, No. 41, 5-12.
Hazard assessment and mapping of mass-movements in the EU
in the future by numerical methods for smaller,
regional studies.
Further adaptations to the GeoSure
methodology, similar to those used to assess
debris flows, are planned for the future. Rock fall
hazard could be another type of mass movement
that is investigated using the heuristic GeoSure
approach applying different causal factors and
scoring algorithms.
Conclusion
In Great Britain, landsliding does not have a
structured regulatory framework, but historical
events, such as the Aberfan disaster and Scottish
debris flow events (Winter et al, 2005), have
highlighted the importance of understanding
the distribution and mechanisms that cause
landslide mass movement events in Great Britain.
The BGS GeoSure methodology, using spatially
each other to create a weighted value for each
parameter determined by calculating the landslide
density (Aleotti and Chowdhury, 1999 and Süzen
and Doyuran, 2004). Results from an initial pilot
study suggest that, in small areas, where detailed
landslide mapping exists, bivariate (conditional
probability) and probabilistic approaches are able
to more accurately predict landslide susceptibility
than GeoSure. However, this approach only
works where landslides have been mapped. This
technique cannot be used where no landslide
mapping has been undertaken. Another issue
with the conditional probability technique is that
it relies on the assumption that all the parameters
are mutually exclusive. The value of the heuristic
approach is its ability to highlight areas where
there are no known landslides but where there is
existing knowledge on the underlying causative
factors. The heuristic approach is able to produce
national scale assessments which could be refined
Fig. 3a: Extract from the debris flow susceptibility layer along with b: the Glen Ogle debris flow of 2004. Abb. 3a: Ausschnitt der Gefahrenhinweiskarte für Muren, gemein-sam mit b: dem Murgang in Glen Ogle, 2004.
Seite
158
Seite
159
processes, a large variety of maps and methods
are used in the different European countries to
prevent natural disasters.
Exactly this variety, which reaches
from simple danger mappings to legally binding
“Hazard Zone Plans” (Gefahrenzonenplan),
should be shown inside this part of the AdaptAlp
project. However main goal of work package 5
(WP 5) is not only the description of this variety, but
a development of a “least common denominator”
which includes the minimum requirements for the
creation of Danger, Hazard and Risk maps.
This article focuses on the AdaptAlp
“Expert Hearing” from 17 March 2010 take place
in Bolzano and which dedicates the contents of
work package 5. In the following sections, the
main goals of this meeting and the contributions
from the involved experts were shown. In the
final chapter, first basic approaches concerning a
possible synthesis out of the big variety of “hazard
planning methods” is pointed out.
1. Introduction
In dealing with geological hazards today,
geotechnical (active) and spatial (passive)
measures come to implementation to minimize
risk. Because of a time limitation of active
measures (e.g. protective walls) and the decrease
of space for permanent settlings, spatial planning
gets more and more important. Due to avalanche
catastrophes in the 1950’s which were affecting
large parts of the Alps, in 1954 in the Swiss
municipal Gadmen, the first “Avalanche-Zone-
Plan” was passed. This was the first time a natural
hazard was considered in spatial planning (cf.
Glade a. Felgentreff 2008, p 160f).
Nowadays, almost 60 years later, “hazard
mapping” is a central part in risk management.
Countless types of “Danger, Hazard and Risk
maps” are produced for all kinds of risks. With
regard to natural hazards, especially geological
Hazard assessment and mapping of mass-movements in the EU
Zusammenfassung:Das AdaptAlp Workpackage 5 „Expert Hearing“ am 17. März 2010 in Bozen wurde von 28 Ex-perten aus acht Ländern besucht und widmete sich inhaltlich vollständig den Zielen von Action 5.1: Der Aufbau eines mehrsprachigen Glossars zu Hangbewegungen und insbesondere die Erarbeitung von Mindestanforderungen zur Erstellung von Gefahrenkarten. Neben einer kurzen Vorstellung des Projektfortschrittes und der weiteren Vorgehensweise hinsichtlich der Erarbeitung eines mehrsprachigen Glossars wurde von Vertretern aus allen beteiligten Ländern der jeweilige „State oft the Art“ bezüglich Gefahrenkartierung vorgestellt. Ausgehend von diesen Präsentatio-nen, welche die Grundlage für das weitere Vorgehen bilden, wurden im Anschluss an das Treffen Kurzzusammenfassungen für jede Region verfasst, welche innerhalb eines Gesamtberichtes auf der AdaptAlp Homepage (www.adaptalp.org) einzusehen sind. In einem weiteren Schritt wur-den auf Basis dieser Beiträge zwei Tabellen erstellt, welche einerseits alle verwendeten Karten strukturiert nach verschiedenen Typen und andererseits unterschiedliche Charakteristiken von Karten zusammenfassen und auf Länderebene vergleichen. Mithilfe dieser Matrizen werden Ge-meinsamkeiten und Unterschiede zwischen den beteiligten Regionen sichtbar und ein „kleinster gemeinsamer Nenner“ kann erarbeitet und in einem nächsten Meeting (Dezember 2010) fixiert werden. Ergebnis dieses Vorgehens und des Projektteiles wird eine Zusammenstellung von Min-destanforderungen zur Erstellung von Gefahrenhinweiskarten und Gefahrenkarten sein.
International Comparison: Summary of the Expert Hearing in Bolzano on 17 March 2010
Internationaler Vergleich: Zusammenfassung des Expert Hearings in Bozen vom 17. März 2010
KARL MAYER, BERNHARD LOCHNER
Summary:The AdaptAlp work package 5 “Expert Hearing” on March 17th, 2010 in Bolzano was attended by 28 experts from eight countries. It was dedicated to the goals of action 5.1: The creation of a multilingual glossary on landslides and especially the elaboration of minimum requirements for “hazard mapping”. Beside a short presentation on the progress and the further approach of the multilingual glossary, the “state of the art” in hazard mapping for each involved region was presented by several people responsible. Based on these presentations, which build the basis for the further approach, short abstracts were composed for each region. These short descriptions can be seen inside the official Hearings report published on the AdaptAlp Homepage (www.adaptalp.org). In a further step, based on these abstracts and the presentations, two tables were created. On the one hand, all used maps were grouped according to different types and on the other hand diverse characteristics of maps were summarized and compared at the country level. With these matrices, similarities and differences between the involved regions become visible and a “least common denominator” could be elaborated. These denominators should be discussed at the next meeting (December 2010) and, as a result, a compilation of minimum requirements to the creation of “Danger, Hazard and Risk maps” will be published.
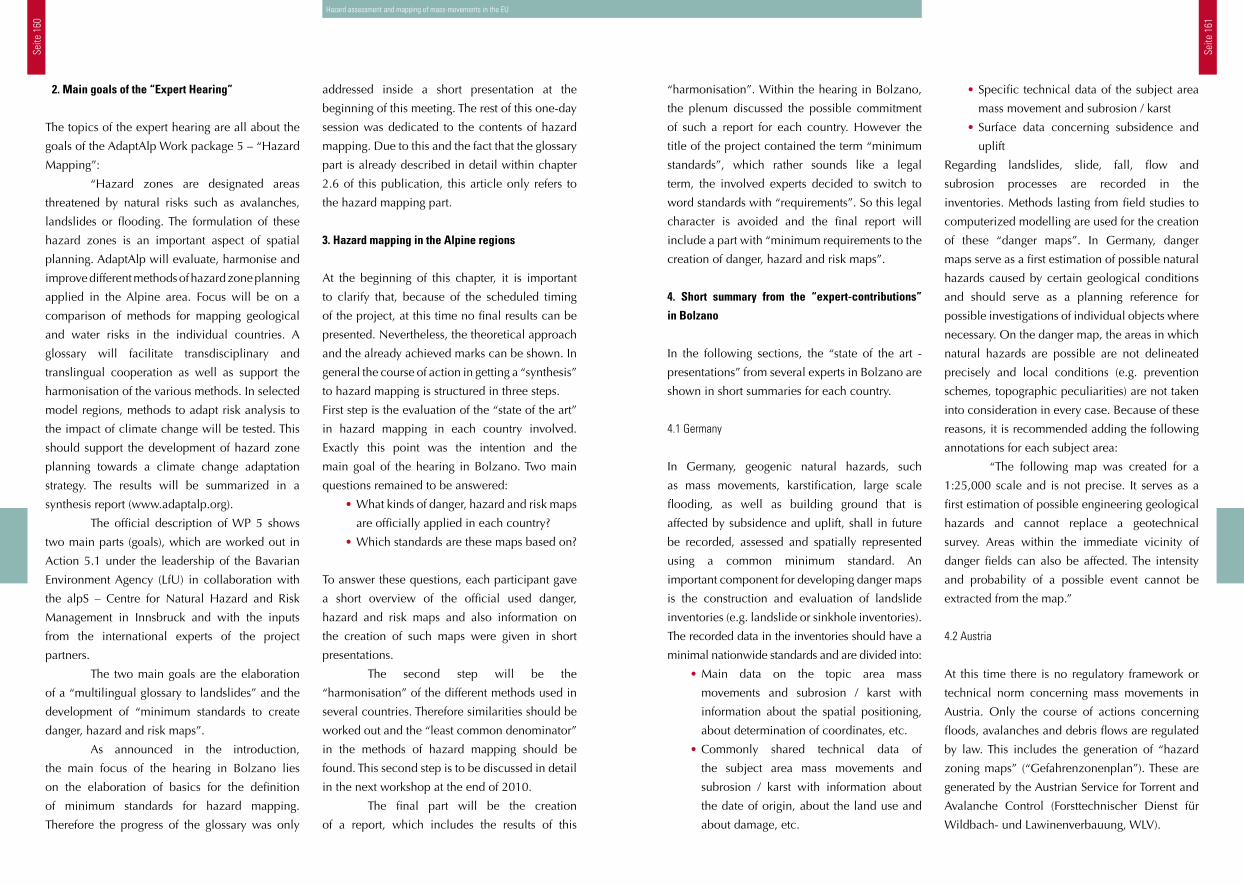
Seite
160
Seite
161
“harmonisation”. Within the hearing in Bolzano,
the plenum discussed the possible commitment
of such a report for each country. However the
title of the project contained the term “minimum
standards”, which rather sounds like a legal
term, the involved experts decided to switch to
word standards with “requirements”. So this legal
character is avoided and the final report will
include a part with “minimum requirements to the
creation of danger, hazard and risk maps”.
4. Short summary from the “expert-contributions”
in Bolzano
In the following sections, the “state of the art -
presentations” from several experts in Bolzano are
shown in short summaries for each country.
4.1 Germany
In Germany, geogenic natural hazards, such
as mass movements, karstification, large scale
flooding, as well as building ground that is
affected by subsidence and uplift, shall in future
be recorded, assessed and spatially represented
using a common minimum standard. An
important component for developing danger maps
is the construction and evaluation of landslide
inventories (e.g. landslide or sinkhole inventories).
The recorded data in the inventories should have a
minimal nationwide standards and are divided into:
• Main data on the topic area mass
movements and subrosion / karst with
information about the spatial positioning,
about determination of coordinates, etc.
• Commonly shared technical data of
the subject area mass movements and
subrosion / karst with information about
the date of origin, about the land use and
about damage, etc.
• Specific technical data of the subject area
mass movement and subrosion / karst
• Surface data concerning subsidence and
uplift
Regarding landslides, slide, fall, flow and
subrosion processes are recorded in the
inventories. Methods lasting from field studies to
computerized modelling are used for the creation
of these “danger maps”. In Germany, danger
maps serve as a first estimation of possible natural
hazards caused by certain geological conditions
and should serve as a planning reference for
possible investigations of individual objects where
necessary. On the danger map, the areas in which
natural hazards are possible are not delineated
precisely and local conditions (e.g. prevention
schemes, topographic peculiarities) are not taken
into consideration in every case. Because of these
reasons, it is recommended adding the following
annotations for each subject area:
“The following map was created for a
1:25,000 scale and is not precise. It serves as a
first estimation of possible engineering geological
hazards and cannot replace a geotechnical
survey. Areas within the immediate vicinity of
danger fields can also be affected. The intensity
and probability of a possible event cannot be
extracted from the map.”
4.2 Austria
At this time there is no regulatory framework or
technical norm concerning mass movements in
Austria. Only the course of actions concerning
floods, avalanches and debris flows are regulated
by law. This includes the generation of “hazard
zoning maps” (“Gefahrenzonenplan”). These are
generated by the Austrian Service for Torrent and
Avalanche Control (Forsttechnischer Dienst für
Wildbach- und Lawinenverbauung, WLV).
Hazard assessment and mapping of mass-movements in the EU
addressed inside a short presentation at the
beginning of this meeting. The rest of this one-day
session was dedicated to the contents of hazard
mapping. Due to this and the fact that the glossary
part is already described in detail within chapter
2.6 of this publication, this article only refers to
the hazard mapping part.
3. Hazard mapping in the Alpine regions
At the beginning of this chapter, it is important
to clarify that, because of the scheduled timing
of the project, at this time no final results can be
presented. Nevertheless, the theoretical approach
and the already achieved marks can be shown. In
general the course of action in getting a “synthesis”
to hazard mapping is structured in three steps.
First step is the evaluation of the “state of the art”
in hazard mapping in each country involved.
Exactly this point was the intention and the
main goal of the hearing in Bolzano. Two main
questions remained to be answered:
• What kinds of danger, hazard and risk maps
are officially applied in each country?
• Which standards are these maps based on?
To answer these questions, each participant gave
a short overview of the official used danger,
hazard and risk maps and also information on
the creation of such maps were given in short
presentations.
The second step will be the
“harmonisation” of the different methods used in
several countries. Therefore similarities should be
worked out and the “least common denominator”
in the methods of hazard mapping should be
found. This second step is to be discussed in detail
in the next workshop at the end of 2010.
The final part will be the creation
of a report, which includes the results of this
2. Main goals of the “Expert Hearing”
The topics of the expert hearing are all about the
goals of the AdaptAlp Work package 5 – “Hazard
Mapping”:
“Hazard zones are designated areas
threatened by natural risks such as avalanches,
landslides or flooding. The formulation of these
hazard zones is an important aspect of spatial
planning. AdaptAlp will evaluate, harmonise and
improve different methods of hazard zone planning
applied in the Alpine area. Focus will be on a
comparison of methods for mapping geological
and water risks in the individual countries. A
glossary will facilitate transdisciplinary and
translingual cooperation as well as support the
harmonisation of the various methods. In selected
model regions, methods to adapt risk analysis to
the impact of climate change will be tested. This
should support the development of hazard zone
planning towards a climate change adaptation
strategy. The results will be summarized in a
synthesis report (www.adaptalp.org).
The official description of WP 5 shows
two main parts (goals), which are worked out in
Action 5.1 under the leadership of the Bavarian
Environment Agency (LfU) in collaboration with
the alpS – Centre for Natural Hazard and Risk
Management in Innsbruck and with the inputs
from the international experts of the project
partners.
The two main goals are the elaboration
of a “multilingual glossary to landslides” and the
development of “minimum standards to create
danger, hazard and risk maps”.
As announced in the introduction,
the main focus of the hearing in Bolzano lies
on the elaboration of basics for the definition
of minimum standards for hazard mapping.
Therefore the progress of the glossary was only
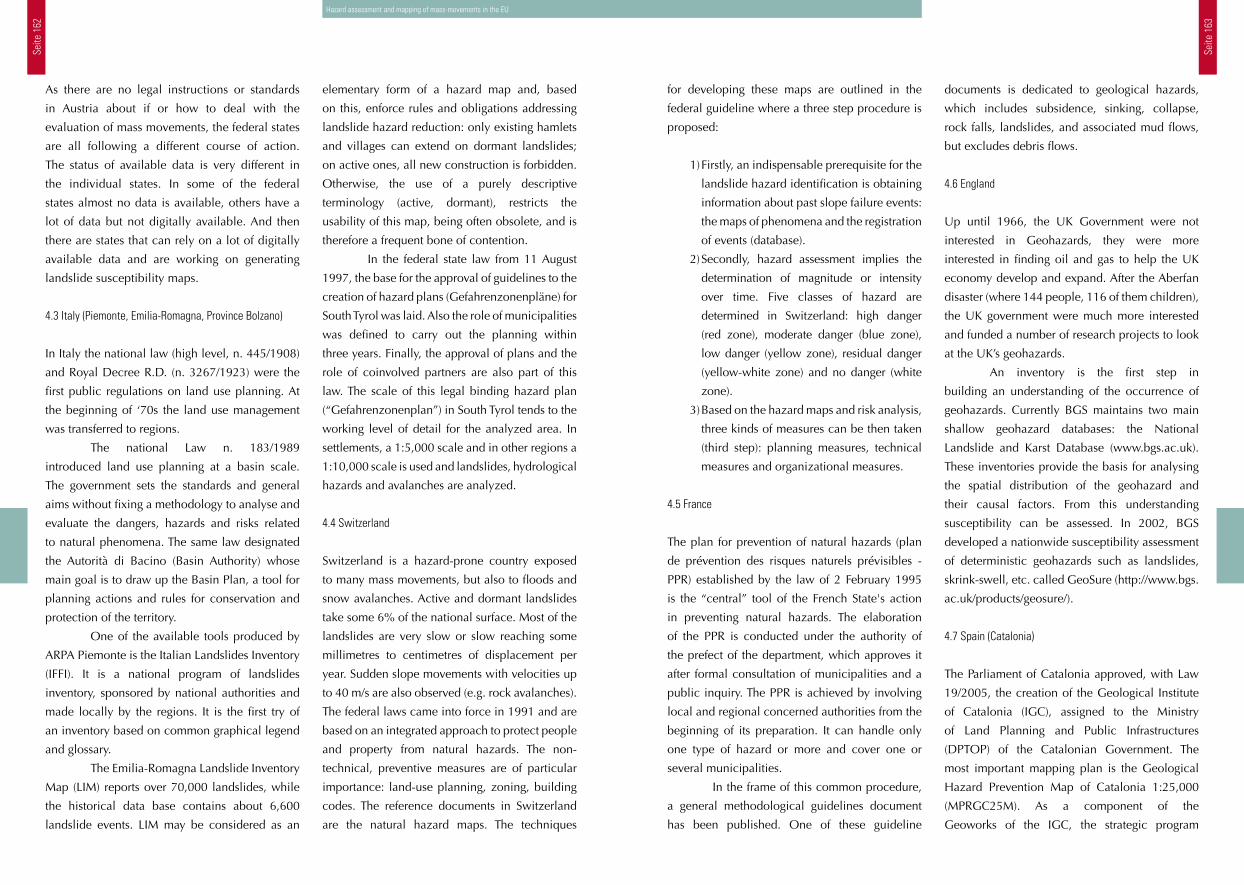
Seite
162
Seite
163
for developing these maps are outlined in the
federal guideline where a three step procedure is
proposed:
1) Firstly, an indispensable prerequisite for the
landslide hazard identification is obtaining
information about past slope failure events:
the maps of phenomena and the registration
of events (database).
2) Secondly, hazard assessment implies the
determination of magnitude or intensity
over time. Five classes of hazard are
determined in Switzerland: high danger
(red zone), moderate danger (blue zone),
low danger (yellow zone), residual danger
(yellow-white zone) and no danger (white
zone).
3) Based on the hazard maps and risk analysis,
three kinds of measures can be then taken
(third step): planning measures, technical
measures and organizational measures.
4.5 France
The plan for prevention of natural hazards (plan
de prévention des risques naturels prévisibles -
PPR) established by the law of 2 February 1995
is the “central” tool of the French State's action
in preventing natural hazards. The elaboration
of the PPR is conducted under the authority of
the prefect of the department, which approves it
after formal consultation of municipalities and a
public inquiry. The PPR is achieved by involving
local and regional concerned authorities from the
beginning of its preparation. It can handle only
one type of hazard or more and cover one or
several municipalities.
In the frame of this common procedure,
a general methodological guidelines document
has been published. One of these guideline
documents is dedicated to geological hazards,
which includes subsidence, sinking, collapse,
rock falls, landslides, and associated mud flows,
but excludes debris flows.
4.6 England
Up until 1966, the UK Government were not
interested in Geohazards, they were more
interested in finding oil and gas to help the UK
economy develop and expand. After the Aberfan
disaster (where 144 people, 116 of them children),
the UK government were much more interested
and funded a number of research projects to look
at the UK’s geohazards.
An inventory is the first step in
building an understanding of the occurrence of
geohazards. Currently BGS maintains two main
shallow geohazard databases: the National
Landslide and Karst Database (www.bgs.ac.uk).
These inventories provide the basis for analysing
the spatial distribution of the geohazard and
their causal factors. From this understanding
susceptibility can be assessed. In 2002, BGS
developed a nationwide susceptibility assessment
of deterministic geohazards such as landslides,
skrink-swell, etc. called GeoSure (http://www.bgs.
ac.uk/products/geosure/).
4.7 Spain (Catalonia)
The Parliament of Catalonia approved, with Law
19/2005, the creation of the Geological Institute
of Catalonia (IGC), assigned to the Ministry
of Land Planning and Public Infrastructures
(DPTOP) of the Catalonian Government. The
most important mapping plan is the Geological
Hazard Prevention Map of Catalonia 1:25,000
(MPRGC25M). As a component of the
Geoworks of the IGC, the strategic program
Hazard assessment and mapping of mass-movements in the EU
elementary form of a hazard map and, based
on this, enforce rules and obligations addressing
landslide hazard reduction: only existing hamlets
and villages can extend on dormant landslides;
on active ones, all new construction is forbidden.
Otherwise, the use of a purely descriptive
terminology (active, dormant), restricts the
usability of this map, being often obsolete, and is
therefore a frequent bone of contention.
In the federal state law from 11 August
1997, the base for the approval of guidelines to the
creation of hazard plans (Gefahrenzonenpläne) for
South Tyrol was laid. Also the role of municipalities
was defined to carry out the planning within
three years. Finally, the approval of plans and the
role of coinvolved partners are also part of this
law. The scale of this legal binding hazard plan
(“Gefahrenzonenplan”) in South Tyrol tends to the
working level of detail for the analyzed area. In
settlements, a 1:5,000 scale and in other regions a
1:10,000 scale is used and landslides, hydrological
hazards and avalanches are analyzed.
4.4 Switzerland
Switzerland is a hazard-prone country exposed
to many mass movements, but also to floods and
snow avalanches. Active and dormant landslides
take some 6% of the national surface. Most of the
landslides are very slow or slow reaching some
millimetres to centimetres of displacement per
year. Sudden slope movements with velocities up
to 40 m/s are also observed (e.g. rock avalanches).
The federal laws came into force in 1991 and are
based on an integrated approach to protect people
and property from natural hazards. The non-
technical, preventive measures are of particular
importance: land-use planning, zoning, building
codes. The reference documents in Switzerland
are the natural hazard maps. The techniques
As there are no legal instructions or standards
in Austria about if or how to deal with the
evaluation of mass movements, the federal states
are all following a different course of action.
The status of available data is very different in
the individual states. In some of the federal
states almost no data is available, others have a
lot of data but not digitally available. And then
there are states that can rely on a lot of digitally
available data and are working on generating
landslide susceptibility maps.
4.3 Italy (Piemonte, Emilia-Romagna, Province Bolzano)
In Italy the national law (high level, n. 445/1908)
and Royal Decree R.D. (n. 3267/1923) were the
first public regulations on land use planning. At
the beginning of ‘70s the land use management
was transferred to regions.
The national Law n. 183/1989
introduced land use planning at a basin scale.
The government sets the standards and general
aims without fixing a methodology to analyse and
evaluate the dangers, hazards and risks related
to natural phenomena. The same law designated
the Autorità di Bacino (Basin Authority) whose
main goal is to draw up the Basin Plan, a tool for
planning actions and rules for conservation and
protection of the territory.
One of the available tools produced by
ARPA Piemonte is the Italian Landslides Inventory
(IFFI). It is a national program of landslides
inventory, sponsored by national authorities and
made locally by the regions. It is the first try of
an inventory based on common graphical legend
and glossary.
The Emilia-Romagna Landslide Inventory
Map (LIM) reports over 70,000 landslides, while
the historical data base contains about 6,600
landslide events. LIM may be considered as an
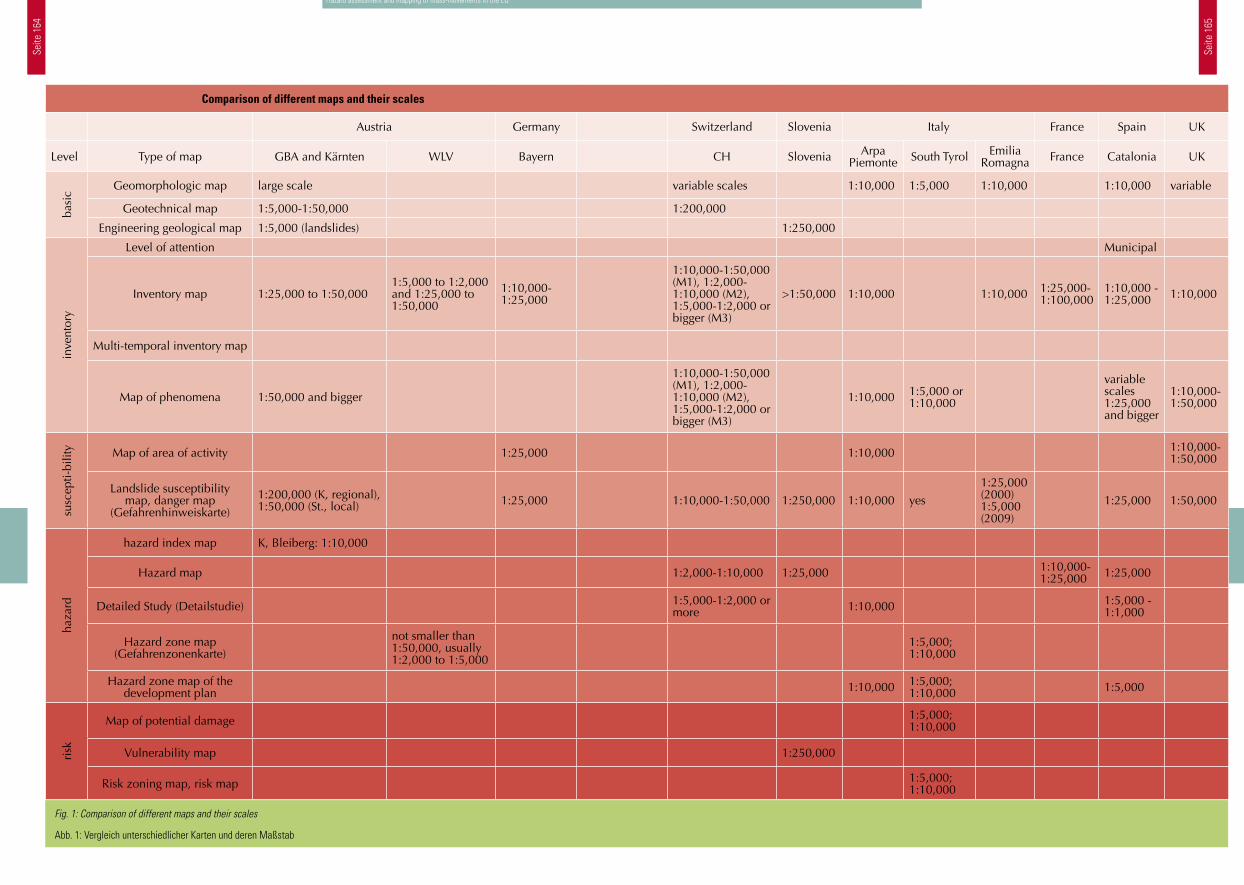
Seite
164
Seite
165
Comparison of different maps and their scales
Austria Germany Switzerland Slovenia Italy France Spain UK
Level Type of map GBA and Kärnten WLV Bayern CH Slovenia Arpa Piemonte South Tyrol Emilia
Romagna France Catalonia UK
basi
c
Geomorphologic map large scale variable scales 1:10,000 1:5,000 1:10,000 1:10,000 variable
Geotechnical map 1:5,000-1:50,000 1:200,000
Engineering geological map 1:5,000 (landslides) 1:250,000
inve
ntor
y
Level of attention Municipal
Inventory map 1:25,000 to 1:50,0001:5,000 to 1:2,000 and 1:25,000 to 1:50,000
1:10,000-1:25,000
1:10,000-1:50,000 (M1), 1:2,000-1:10,000 (M2), 1:5,000-1:2,000 or bigger (M3)
>1:50,000 1:10,000 1:10,000 1:25,000-1:100,000
1:10,000 - 1:25,000 1:10,000
Multi-temporal inventory map
Map of phenomena 1:50,000 and bigger
1:10,000-1:50,000 (M1), 1:2,000-1:10,000 (M2), 1:5,000-1:2,000 or bigger (M3)
1:10,000 1:5,000 or 1:10,000
variable scales 1:25,000 and bigger
1:10,000-1:50,000
susc
epti-
bilit
y Map of area of activity 1:25,000 1:10,000 1:10,000-1:50,000
Landslide susceptibility map, danger map
(Gefahrenhinweiskarte)
1:200,000 (K, regional), 1:50,000 (St., local) 1:25,000 1:10,000-1:50,000 1:250,000 1:10,000 yes
1:25,000 (2000) 1:5,000 (2009)
1:25,000 1:50,000
haza
rd
hazard index map K, Bleiberg: 1:10,000
Hazard map 1:2,000-1:10,000 1:25,000 1:10,000-1:25,000 1:25,000
Detailed Study (Detailstudie) 1:5,000-1:2,000 or more 1:10,000 1:5,000 -
1:1,000
Hazard zone map (Gefahrenzonenkarte)
not smaller than 1:50,000, usually 1:2,000 to 1:5,000
1:5,000; 1:10,000
Hazard zone map of the development plan 1:10,000 1:5,000;
1:10,000 1:5,000
risk
Map of potential damage 1:5,000; 1:10,000
Vulnerability map 1:250,000
Risk zoning map, risk map 1:5,000; 1:10,000
Fig. 1: Comparison of different maps and their scales Abb. 1: Vergleich unterschiedlicher Karten und deren Maßstab
Hazard assessment and mapping of mass-movements in the EU
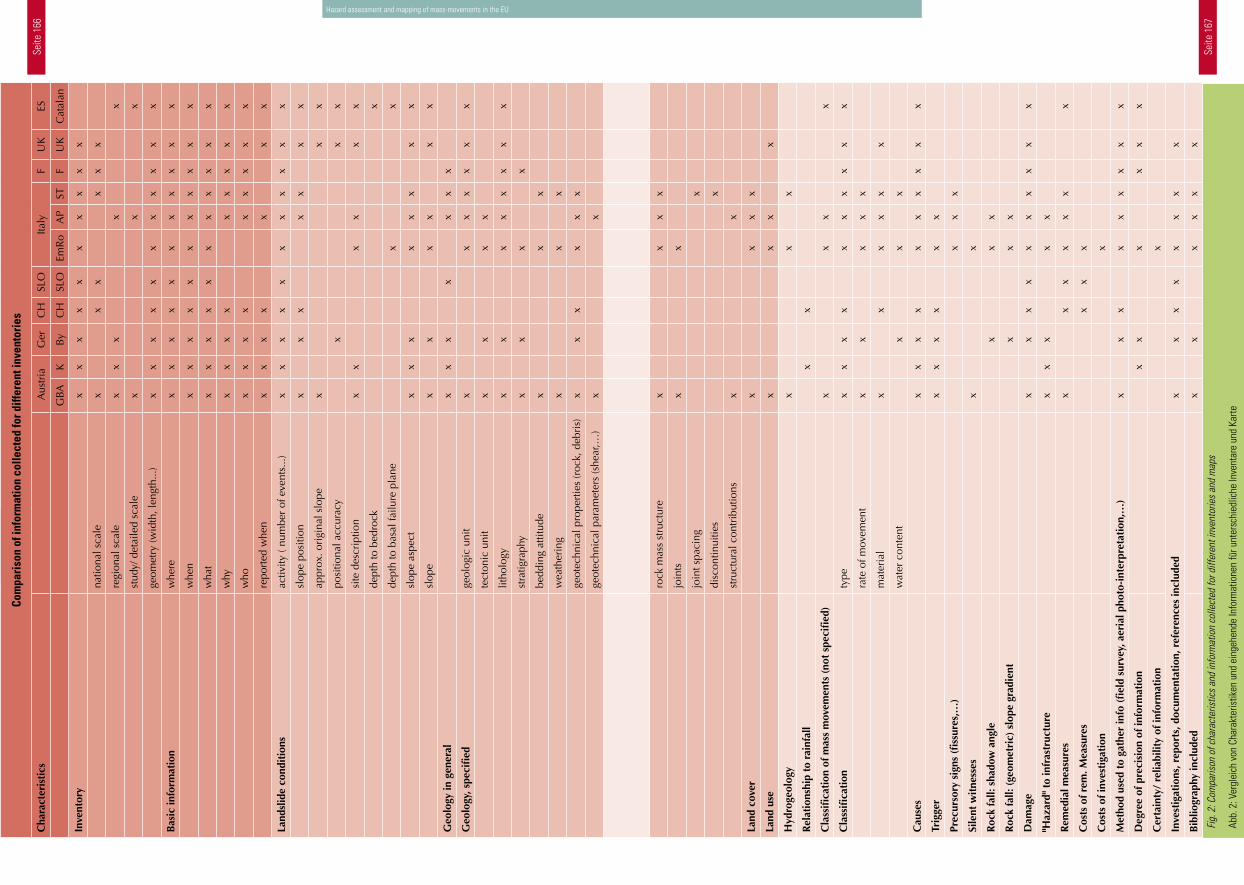
Seite
166
Seite
167
Fig.
2: C
ompa
rison
of c
hara
cter
istic
s an
d in
form
atio
n co
llect
ed fo
r diff
eren
t inv
ento
ries
and
map
s
Abb.
2: V
ergl
eich
von
Cha
rakt
eris
tiken
und
ein
gehe
nde
Info
rmat
ione
n fü
r unt
ersc
hied
liche
Inve
ntar
e un
d Ka
rte
Com
pari
son
of in
form
atio
n co
llect
ed fo
r diff
eren
t inv
ento
ries
Cha
ract
eris
tics
Aus
tria
Ger
CH
SLO
Italy
FU
KES
GBA
KB
yC
HSL
OEm
Ro
AP
STF
UK
Cat
alan
Inve
ntor
yx
xx
xx
xx
xx
x
natio
nal s
cale
xx
xx
xx
regi
onal
sca
lex
xx
xx
stud
y/ d
etai
led
scal
ex
xx
geom
etry
(wid
th, l
engt
h...)
xx
xx
xx
xx
xx
x
Bas
ic in
form
atio
nw
here
xx
xx
xx
xx
xx
x
whe
nx
xx
xx
xx
xx
xx
wha
tx
xx
xx
xx
xx
xx
why
xx
xx
xx
xx
x
who
xx
xx
xx
xx
x
repo
rted
whe
nx
xx
xx
xx
Land
slid
e co
ndit
ions
activ
ity (
num
ber
of e
vent
s...)
xx
xx
xx
xx
xx
x
slop
e po
sitio
nx
xx
xx
xx
appr
ox. o
rigi
nal s
lope
xx
x
posi
tiona
l acc
urac
yx
xx
site
des
crip
tion
xx
xx
xx
dept
h to
bed
rock
x
dept
h to
bas
al fa
ilure
pla
nex
x
slop
e as
pect
xx
xx
xx
xx
slop
ex
xx
xx
x
Geo
logy
in g
ener
alx
xx
xx
xx
Geo
logy
, spe
cifi
edge
olog
ic u
nit
xx
xx
xx
x
tect
onic
uni
tx
xx
x
litho
logy
xx
xx
xx
xx
stra
tigra
phy
xx
xx
bedd
ing
attit
ude
xx
x
wea
ther
ing
xx
x
geot
echn
ical
pro
pert
ies
(roc
k, d
ebri
s)x
xx
xx
x
geot
echn
ical
par
amet
ers
(she
ar,…
)x
x
rock
mas
s st
ruct
ure
xx
xx
join
tsx
x
join
t spa
cing
x
disc
ontin
uitie
sx
stru
ctur
al c
ontr
ibut
ions
xx
Land
cov
erx
xx
x
Land
use
xx
xx
Hyd
roge
olog
yx
xx
Rel
atio
nshi
p to
rai
nfal
lx
x
Cla
ssifi
cati
on o
f mas
s m
ovem
ents
(no
t sp
ecifi
ed)
xx
xx
Cla
ssifi
cati
onty
pex
xx
xx
xx
xx
x
rate
of m
ovem
ent
xx
xx
x
mat
eria
lx
xx
xx
x
wat
er c
onte
ntx
xx
Cau
ses
xx
xx
xx
xx
xx
Trig
ger
xx
xx
xx
Prec
urso
ry s
igns
(fi
ssur
es,…
)x
xx
Sile
nt w
itne
sses
xx
Roc
k fa
ll: s
hado
w a
ngle
xx
x
Roc
k fa
ll: (
geom
etri
c) s
lope
gra
dien
tx
xx
Dam
age
xx
xx
xx
xx
xx
"Haz
ard"
to
infr
astr
uctu
rex
xx
xx
Rem
edia
l mea
sure
sx
xx
xx
xx
Cos
ts o
f rem
. Mea
sure
sx
xx
Cos
ts o
f inv
esti
gati
onx
Met
hod
used
to
gath
er in
fo (
fiel
d su
rvey
, aer
ial p
hoto
-int
erpr
etat
ion,
…)
xx
xx
xx
xx
x
Deg
ree
of p
reci
sion
of i
nfor
mat
ion
xx
xx
xx
Cer
tain
ty/
relia
bilit
y of
info
rmat
ion
x
Inve
stig
atio
ns, r
epor
ts, d
ocum
enta
tion
, ref
eren
ces
incl
uded
xx
xx
xx
xx
Bib
liogr
aphy
incl
uded
xx
xx
xx
Hazard assessment and mapping of mass-movements in the EU
Seite
168
Seite
169
Anschrift der Verfasser / Authors’ addresses:
Karl Mayer
Bavarian Environment Agency (LfU)
(Office Munich)
Lazarettstraße 67
80636 Munich – GERMANY
Bernhard Lochner
alpS – Centre for Natural Hazard and Risk
Management
Grabenweg 3
6020 Innsbruck - AUSTRIAText
Literatur / References:
CRUDEN, D.M. & VARNES, D.J. (1996): Landslide types and processes. In A. Keith Turner & Robert L. Schuster (eds), Landslide investigation and mitigation: 36-75. Transportation Research Board, special report 247. Washington: National Academy Press.
FELGENTREFF, C. & GLADE, T. (Hrsg.) (2008): Naturrisiken und Sozialkatastrophen. Spektrum Akademischer Verlag, Heidelberg, 454 S.
KOMAC, M. (2005): Probabilistic model of slope mass movement susceptibility - a case study of Bovec municipality, Slovenia. Geologija, 48/2, 311-340.
KOMAC, M. & RIBIČIČ, M. (2006): Landslide susceptibility map of Slovenia at scale 1:250.000. Geologija, 49/2, 295-309.
KOMAC, M., KUMELJ, Š. & RIBIČIČ, M. (2009): Debris-flow susceptibility model of Slovenia at scale 1: 250,000. Slovenia. Geologija, 52/1, 87-104.
MAYER, K. & POSCHINGER, A. von (2005): Final Report and Guidelines: Mitigation of Hydro-Geological Risk in Alpine Catchments, “CatchRisk”. Work Package 2: Landslide hazard assessment (Rockfall modelling). Program Interreg IIIb – Alpine Space.
MAYER, K., Patula, S., Krapp, M., Leppig, B., Thom, P., Poschinger, A. von (2010): Danger Map for the Bavarian Alps. Z. dt. Ges. Geowiss., 161/2, p. 119-128, 10 figs. Stuttgart, June 2010
RAETZO, H., LATELTIN, O., TRIPET, J.P., BOLLINGER, D. (2002): Hazard assessment in Switzerland – codes of practice for mass movements. Bull. of Engineering Geology and the Environment 61(3): 263-268.
RIBIČIČ, M., KOMAC, M., MIKOŠ, M., FAJFAR, D., RAVNIK, D., GVOZDANOVIČ, T., KOMEL, P., MIKLAVČIČ, L. & KOSMATIN FRAS, M. (2006): Novelacija in nadgradnja informacijskega sistema o zemeljskih plazovih in vključitev v bazo GIS_UJME : končno poročilo. Ljubljana: Fakulteta za gradbeništvo in geodezijo (in Slovene).
Hazard assessment and mapping of mass-movements in the EU
5. Conclusion
As mentioned in the introduction of this article,
the “state of the art in hazard mapping“ in the
involved countries isn’t in balance. This fact was
also confirmed inside the “Expert Hearing” in
Bolzano.
To solve this problem, in a first step the
big variety of maps applied in the several regions
was summarized in one table (see Fig. 1). This chart
builds the basis for further actions concerning
the creation of minimum requirements. It is
structured into different levels and the associated
type of maps. The levels lasting from “basic” (e.g.
geomorphologic maps) over “inventories” (e.g.
inventory map), “susceptibility” (e.g. susceptibility
map) and “hazard” (e.g. hazard map) to “risk”
(e.g. risk map).
Furthermore, a matrix (see Fig. 2)
with specified characteristics and information
collected for different maps was created out
of the great wealth of information given at the
hearing in Bolzano. In particular, this table should
help to find accordance’s between the different
approaches. All the characteristics used in any
involved country (e.g. inventory) form the basis
for the definition of minimum requirements to
“hazard mapping”.
Finally, out of these two matrices a
recommendation will be created and, based
thereon, the final minimum requirements should
be fixed in the next workshop on December 2010
in Munich. The final report on the whole project
will include a chapter with the decided minimum
requirements to the creation of “Danger, Hazard
and Risk maps”.
aimed to acquiring, elaborating, integrating and
disseminating the basic geological, pedological
and geothematic information concerning the
whole of the territory in the suitable scales for
the land and urban planning. This project started
in 2007. In the MPRGC, evidence, phenomena,
susceptibility and natural hazards of geological
processes are represented. These processes are
generated by external geodynamics (such as slope,
torrent, snow, coastal and flood dynamics) and
internal (seismic) geodynamics. The information
is displayed by different maps on each published
sheet. The main map is presented on a scale of
1:25,000, and includes landslide, avalanche
and flood hazard. Hazard level is qualitatively
classified as high (red), medium (orange) and low
(yellow). The methods used to analyze hazards
basically consist of geomorphologic, spatial and
statistical analysis.
4.8 Slovenia
Legislation, planning and prevention measures are
not satisfying in the field of landslides in Slovenia
and the primary activities are still focused on
remediation instead on the prevention measures.
The updated Act on Spatial planning from
2007, governing natural disasters also discusses
problems with mass movements, but a common
methodology and procedures to prevent geology-
related natural disasters does not exist yet.
At the moment for Slovenia, a
“landslide susceptibility map” (scale 1:250,000)
and a “debris-flow susceptibility map” (scale
1:250,000) is elaborated by the Geological Survey
of Slovenia. In addition to this, a probabilistic
model of slope mass movement susceptibility for
the Bovec municipality in north-western Slovenia
was developed based on the expert geohazard
map at scale 1:25,000 and several other relevant
influence factors.
Seite
170
AdaptAlp
DI Maria Patek, MBABundesministerium für Land- und Forstwirtschaft,
Umwelt und WasserwirtschaftAbteilung IV/5Marxergasse 3
1030 Wien
Tel.: 01/711 00 - 7334Fax: 01/71100 - 7399
E-Mail: [email protected]