handbook for collection of ambient environment data
TRANSCRIPT
HANDBOOK FOR COLLECTION OF
AMBIENT ENVIRONMENT DATA
QCMTM
TM
Page 2 of 38 QCMTM
QUA
NTI
FIED
CIT
IES
MO
VEM
ENT
First Edition, 2015 Published in India by
Center for Development Studies and Activities Survey Nos. 58 & 49/4,
Paud Road, Bavdhan Khurd, Pune, Maharashtra 411021
Copyrights © 2015Center for Development Studies and Activities
All Rights Reserved.
Aneeta Gokhale BenningerExecutive Director, CDSASiddhartha BenningerProject Planner, CDSA
Kalyani WaniProject Planner, CDSA
Abhiram SahasrabuddheProject Planner, CDSA
Aditya SatheProject Planner, CDSA
Amruta KhairnarProject Planner, CDSA
Kavina PatelProject Intern, CDSA
Devshri ShahProject Intern, CDSA
Manasi RanadeProject Intern, CDSA
Kahinee ShahProject Intern, CDSA
Acknowledgements and Special Thanks
Page 3 of 38 QCMTM
C O N T E N T S
CONT
ENTS
Abbreviations & DefinitionsIntroduction: QCMTaxon BriefAir Pollution Sub-Indicators Air Pollution FactsheetTemperatureAmbient SoundSmellAmbient LightAesthetics Article: “Its time to come together” Sub-IndicatorsTraffic Sub-Indicators Article: “Lets Know”Bibliography
..... 4
..... 5
..... 6
..... 8
..... 10
..... 13
..... 14
..... 16
..... 18
..... 20
..... 22
..... 24
..... 25
..... 26
..... 28
..... 32
..... 33
Page 4 of 38 QCMTM
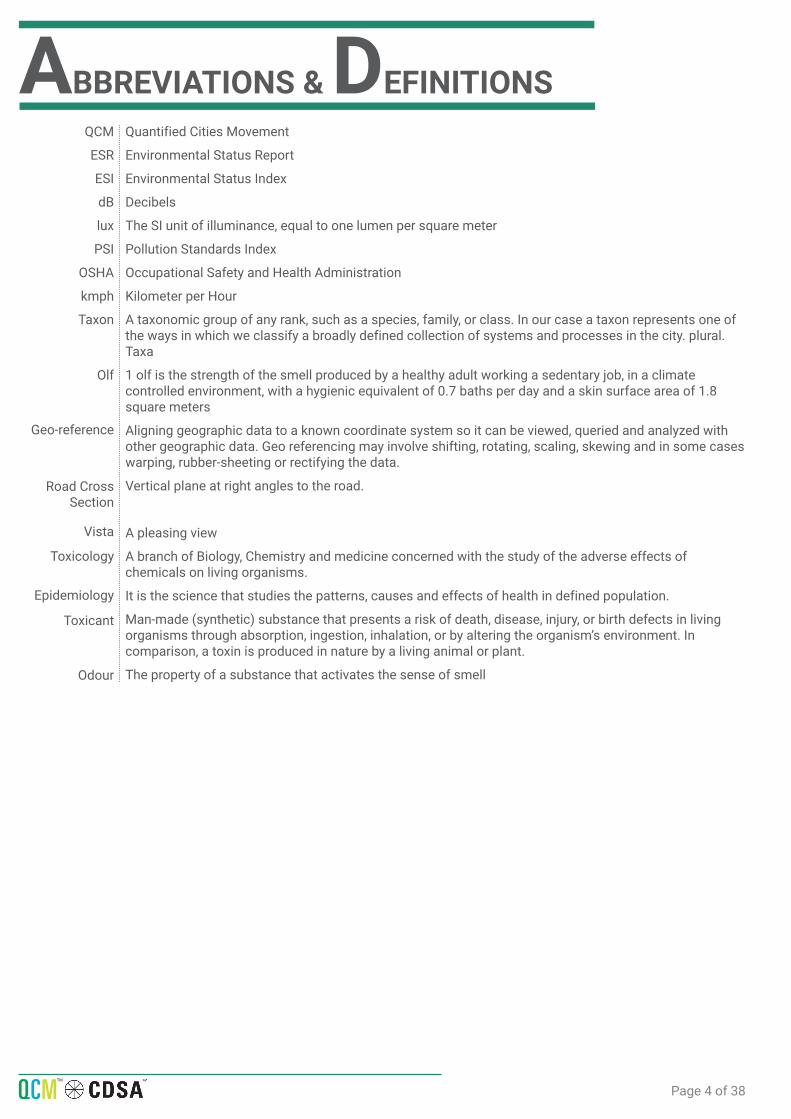
QCM
ESR
ESI
dB
lux
PSI
OSHA
kmph
Taxon
Quantified Cities Movement
Environmental Status Report
Environmental Status Index
Decibels
The SI unit of illuminance, equal to one lumen per square meter
Pollution Standards Index
Occupational Safety and Health Administration
Kilometer per Hour
A taxonomic group of any rank, such as a species, family, or class. In our case a taxon represents one of the ways in which we classify a broadly defined collection of systems and processes in the city. plural. Taxa
1 olf is the strength of the smell produced by a healthy adult working a sedentary job, in a climate controlled environment, with a hygienic equivalent of 0.7 baths per day and a skin surface area of 1.8 square meters
Aligning geographic data to a known coordinate system so it can be viewed, queried and analyzed with other geographic data. Geo referencing may involve shifting, rotating, scaling, skewing and in some cases warping, rubber-sheeting or rectifying the data.
Vertical plane at right angles to the road.
A pleasing view
A branch of Biology, Chemistry and medicine concerned with the study of the adverse effects of chemicals on living organisms.
It is the science that studies the patterns, causes and effects of health in defined population.
Man-made (synthetic) substance that presents a risk of death, disease, injury, or birth defects in living organisms through absorption, ingestion, inhalation, or by altering the organism’s environment. In comparison, a toxin is produced in nature by a living animal or plant.
The property of a substance that activates the sense of smell
ABBREVIATIONS & DEFINITIONS
Olf
Geo-reference
Road Cross Section
Vista
Toxicology
Epidemiology
Toxicant
Odour
Page 5 of 38 QCMTM
QUANTIFIED CITIES MOVEMENT
What is the Quantified Cities Movement?
QCMTM
The importance of documentation of knowledge and information generated through work carried out in various fields cannot be underestimated. All over the world there are individuals studying, working and generally creating new knowledge. Every minute we are asking questions and answering them. This exciting process, a function of our curiosity and the need to make sense of what the world is all about, is being carried out in various ways all over the globe. In order to properly plan, implement and monitor a city or for that matter any space, we require relevant, accurate and timely data. Some of this data is being collected by the government authorities but, is it relevant? There is a need for more information about our city in order to plan it better and monitor its development? How do we create transparency in this process of planning? The citizens need to be involved in the process. How do we ensure that the authorities in charge are held accountable when they plan for our city and in turn affect our lives?To answer these questions we have created the Quantified Cities Movement (QCM).
The purpose of the QCM is to
• Identify the data that is required.
• Provide technical assistance and training to Institutions and Individuals for collection of the required data.
• Create an online and real time repository for this data and give direction too, example.: www.punedata.org.
• Analyze the data, identify problems and their solutions and advocate for better planning, implementation and monitoring of the process.
INTR
ODUC
TION

Page 6 of 38 QCMTM
AMBIENT ENVIRONMENT
A city or any settlement is a place that we can call as our habitat. This habitat is made up of our natural want as well as built environment. We modify and adapt according to our needs, desires and aspirations. The fact that it is an environment that we live in presumes it will adhere to certain standards of quality and beauty we want our home environment to manifest. The most direct way in which to perceive our habitat is through the environment that surrounds us. We perceive the quality of a space through our five senses of perception and then decide whether the place is an acceptable choice to live and work and play in. Through the senses we qualify a place as good, acceptable, bad or uncomfortable.
The environment that surrounds us is called our Ambient Environment and is made up of a multitude of interlinking elements that affect one another. The right combination and balance of these elements decides whether this environment is habitable or not. There is no comprehensive method to precisely quantify an ideal environment. A large number of studies have taken place in an attempt to make sense of the various elements, enumerate and define them and understand their interrelation (refer Bibliography, Page 32). An attempt to do this in one project or to teach methods to study all the elements and their relationships in one handbook would be a gargantuan task. For the purpose of this handbook for collection of data on ambient environment, we will look at seven broad elements- Air pollution, temperature, ambient light, ambient sound, smell, aesthetics and traffic that our ambient environment is made up of. Elements which we are also calling taxa and treating as indicators to measure overall ambient environment in an electoral ward in a city are shown on the next page.
In order to ensure an ideal ambient environment all the elements we study must be within the ideal range that defines a good habitat to live in. Thus if all the ideal ranges are met in a given space we can say it has a good ambient environment. In case there are indicators that do not meet the ideal range or standard range, we shall identify them as stresses. These stresses lead to undesirable situations. For example if a space has low quality ambient environment, the demand for this space falls, this situation causes land values to drop affecting the local economy not to mention the sense of pride of the local population.
How to use this handbook?The handbook is for the use by interested citizens, civil societies organizations, NGOs, institutions and other organisations for data on ambient environment at the electoral ward level encompassing the seven indicators mentioned in the introduction below. A key is provided for each taxon and its indicators with instruction on each indicator enumerating the indicators’ definition, the reason for its relevance, what instrumentation is required for collecting data for the indicator, step by step methodology for data collection, an example of how the results are mapped and finally the potential stresses that can occur due to unacceptable as well as ideal ranges for achieving a good quality of life. At the end of the handbook is provided the bibliography for further reading.
Introduction to Ambient Environment
Page 7 of 38 QCMTM
TAXO
N BR
IEF
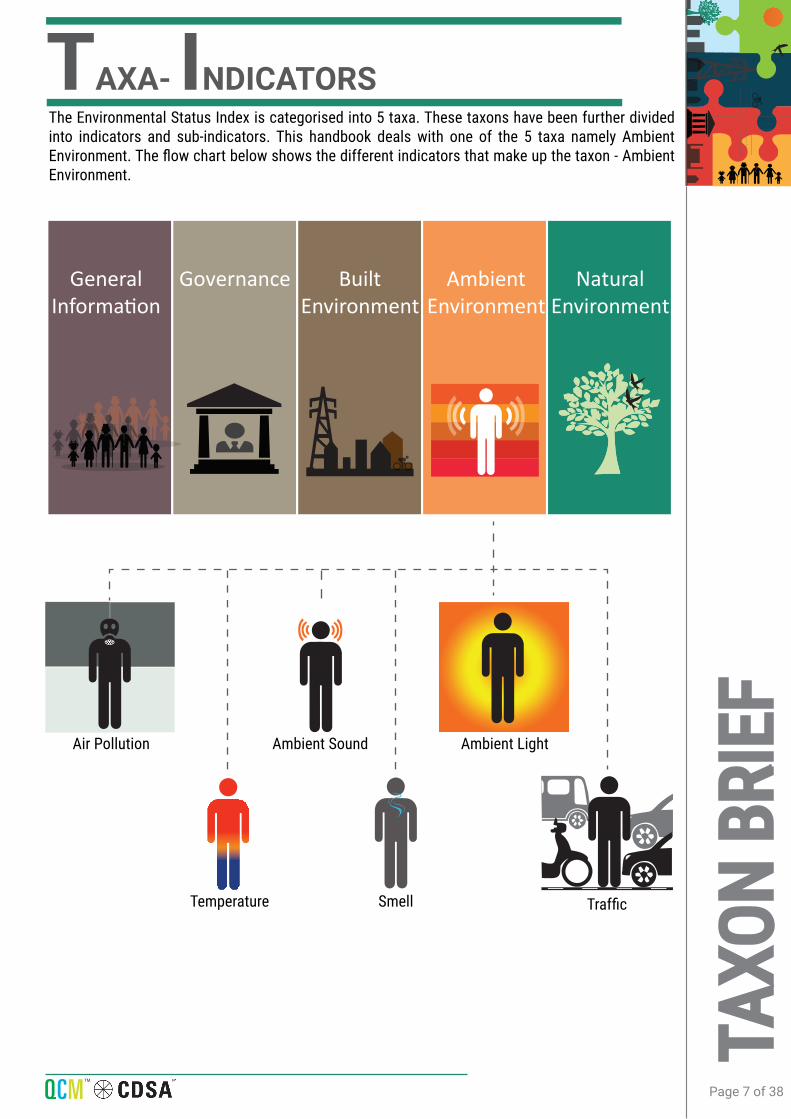
General Governance Built Environment
AmbientEnvironment
Natural Environment
Air Pollution Ambient Sound Ambient Light
TrafficTemperature Smell
The Environmental Status Index is categorised into 5 taxa. These taxons have been further divided into indicators and sub-indicators. This handbook deals with one of the 5 taxa namely Ambient Environment. The flow chart below shows the different indicators that make up the taxon - Ambient Environment.
TAXA- INDICATORS
Page 8 of 38 QCMTM
AIR POLLUTION
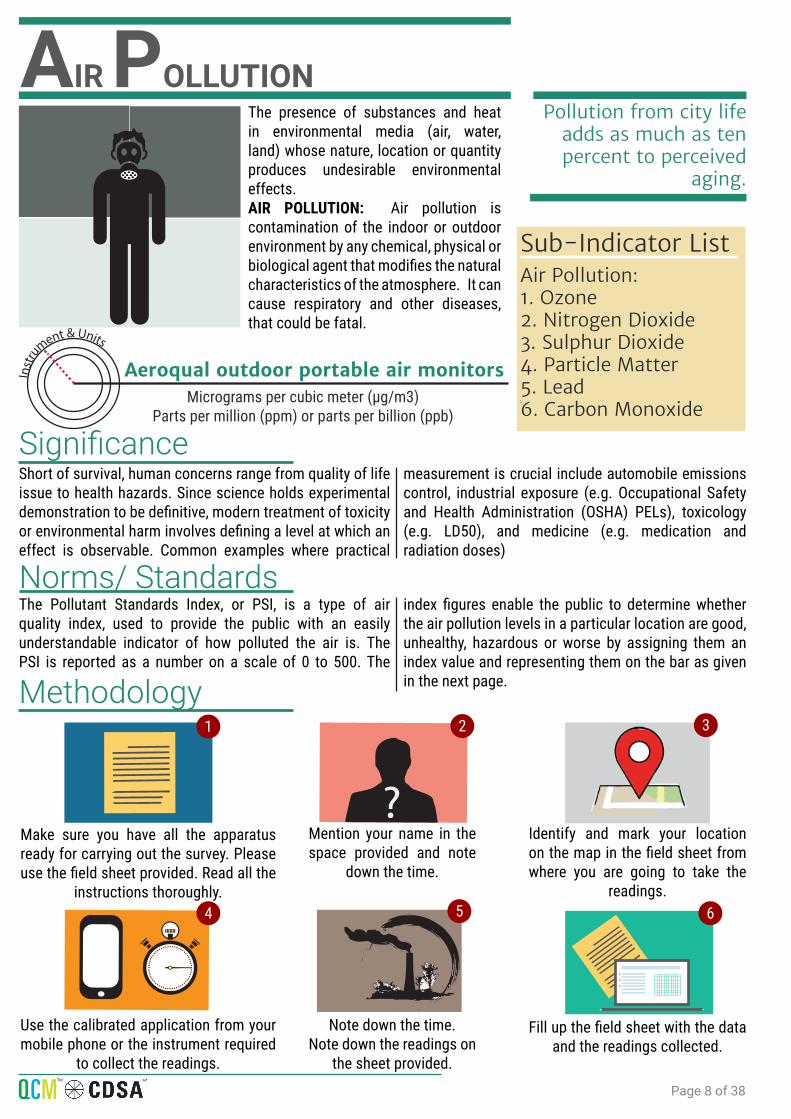
SignificanceShort of survival, human concerns range from quality of life issue to health hazards. Since science holds experimental demonstration to be definitive, modern treatment of toxicity or environmental harm involves defining a level at which an effect is observable. Common examples where practical
measurement is crucial include automobile emissions control, industrial exposure (e.g. Occupational Safety and Health Administration (OSHA) PELs), toxicology (e.g. LD50), and medicine (e.g. medication and radiation doses)
Norms/ StandardsThe Pollutant Standards Index, or PSI, is a type of air quality index, used to provide the public with an easily understandable indicator of how polluted the air is. The PSI is reported as a number on a scale of 0 to 500. The
The presence of substances and heat in environmental media (air, water, land) whose nature, location or quantity produces undesirable environmental effects.AIR POLLUTION: Air pollution is contamination of the indoor or outdoor environment by any chemical, physical or biological agent that modifies the natural characteristics of the atmosphere. It can cause respiratory and other diseases, that could be fatal.
Sub-Indicator ListAir Pollution: 1. Ozone2. Nitrogen Dioxide 3. Sulphur Dioxide4. Particle Matter5. Lead6. Carbon Monoxide
Micrograms per cubic meter (µg/m3)Parts per million (ppm) or parts per billion (ppb)
Aeroqual outdoor portable air monitors
Pollution from city life adds as much as ten percent to perceived
aging.
Inst
ru
ment & Units
?
Methodology
Make sure you have all the apparatus ready for carrying out the survey. Please use the field sheet provided. Read all the
instructions thoroughly.
Use the calibrated application from your mobile phone or the instrument required
to collect the readings.
Mention your name in the space provided and note
down the time.
Note down the time. Note down the readings on
the sheet provided.
Identify and mark your location on the map in the field sheet from where you are going to take the
readings.
Fill up the field sheet with the data and the readings collected.
1 2 3
4 65
index figures enable the public to determine whether the air pollution levels in a particular location are good, unhealthy, hazardous or worse by assigning them an index value and representing them on the bar as given in the next page.
Page 9 of 38 QCMTM
AMBI
ENT
ENVI
RONM
ENT
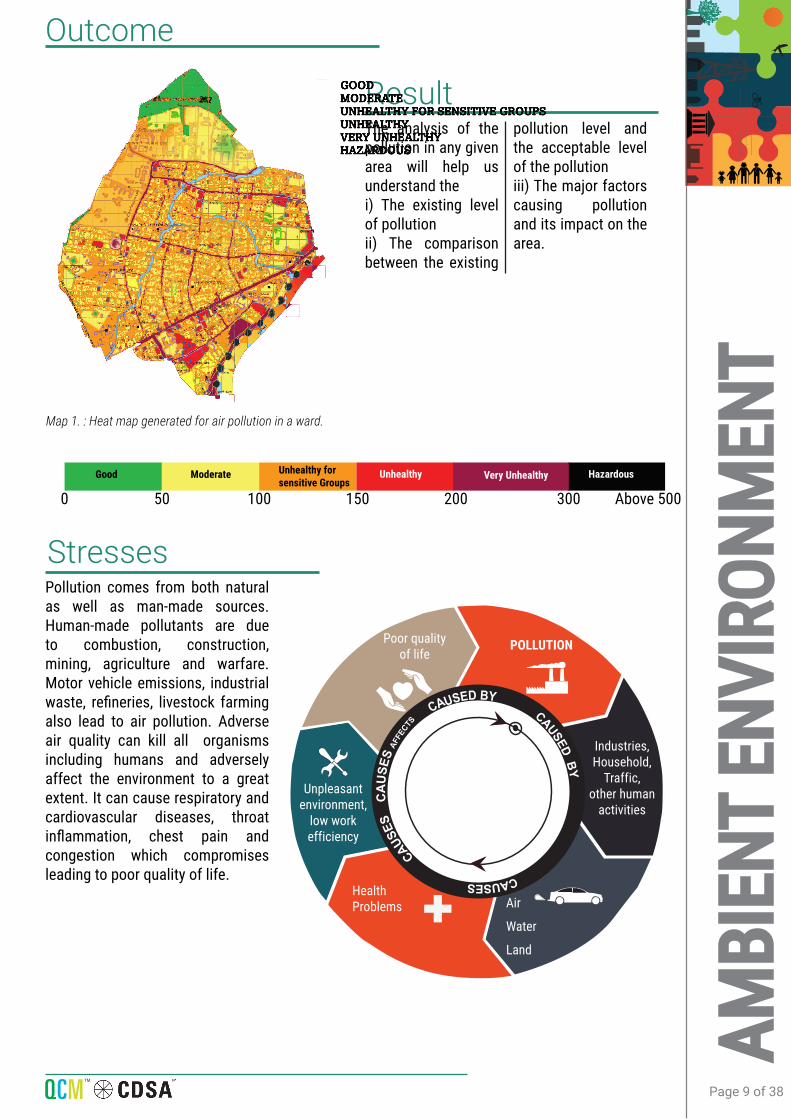
ResultThe analysis of the pollution in any given area will help us understand the i) The existing level of pollutionii) The comparison between the existing
pollution level and the acceptable level of the pollutioniii) The major factors causing pollution and its impact on the area.
Good Moderate Unhealthy for sensitive Groups
Unhealthy Very Unhealthy Hazardous
GOOD MODERATEUNHEALTHY FOR SENSITIVE GROUPSUNHEALTHYVERY UNHEALTHYHAZARDOUS
Pollution comes from both natural as well as man-made sources. Human-made pollutants are due to combustion, construction, mining, agriculture and warfare. Motor vehicle emissions, industrial waste, refineries, livestock farming also lead to air pollution. Adverse air quality can kill all organisms including humans and adversely affect the environment to a great extent. It can cause respiratory and cardiovascular diseases, throat inflammation, chest pain and congestion which compromises leading to poor quality of life.
Stresses
Outcome
0 50 100 150 200 300 Above 500
Unpleasant environment,low work efficien-cy
-
CAUSED BYCAUSED BY
CAUSES
C
AU
SES
AFFE
CTS
CAUSES
Map 1. : Heat map generated for air pollution in a ward.
Unpleasant environment,
low work efficiency
Poor quality of life
Industries, Household,
Traffic, other human
activities
Air
Water
Land
Health Problems
POLLUTION

Page 10 of 38 QCMTM
Excessive ozone in the air can have a marked effect on human health. It can cause breathing problems, trigger asthma, reduce lung function and cause lung diseases. In Europe, Ozone is one of the most
Ozone at ground level – not to be confused with the ozone layer in the upper atmosphere – is one of the major constituents of photochemical smog. It is formed by the reaction of sunlight (photochemical reaction) with pollutants. These pollutants are nitrogen oxides (NOx) from vehicles, industry\ial emissions and volatile organic compounds (VOCs) emitted by vehicles, solvents and industry. As a result, the highest levels of ozone pollution occur during periods of sunny weather.
Norms/Standards100 μg/m3 8-hour mean
Norms/Standards40 μg/m3 annual mean 200 μg/m3 1-hour mean
Ozone [O3]
concerned air pollutant. Several European studies have reported that the daily mortality rises by 0.3% and that for heart diseases by 0.4%, per 10 µg/m3 increase in ozone exposure.
Epidemiological studies have shown that symptoms of bronchitis in asthmatic children increaset with long-term exposure to NO2. Reduced lung function
Nitrogen Dioxide [NO2]
growth is also linked to NO2, at concentrations currently measured (or observed) in cities of Europe and North America.
Health Effects
As an air pollutant, NO2 has several correlated activities. At short-term, concentrations exceeding 200 μg/m3, it is a toxic gas which causes significant inflammation of the airways. NO2 is the main source of nitrate aerosols, which form an important fraction of Particulate Matter 2.5 in the presence of ultraviolet light, of ozone. The major sources of anthropogenic emissions of NO2 are combustion processes (heating, power generation, and engines in vehicles and ships).
Health Effects
1
2
Concentration in Ambient Air
Ozone
Industrial, Residential,
Rural and Other Area
Ecologically Sensitive Area (notified by Central Gov-ernment)
Methods of Measurement
: UV photometric
: Chemilminescence
: Chemical Method100 100Source: National Ambient Air Quality Standards, CPCB, 2009.
Concentration in Ambient Air
Nitrogen Dioxide
Industrial, Residential,
Rural and Other Area
Ecologically Sensitive Area (notified by Central Gov-ernment)
Methods of Measurement
: Modified Jacob & Hochheiser (Narsenite)
: Chemiluminescence40 30Source: National Ambient Air Quality Standards, CPCB, 2009.
Page 11 of 38 QCMTM
4
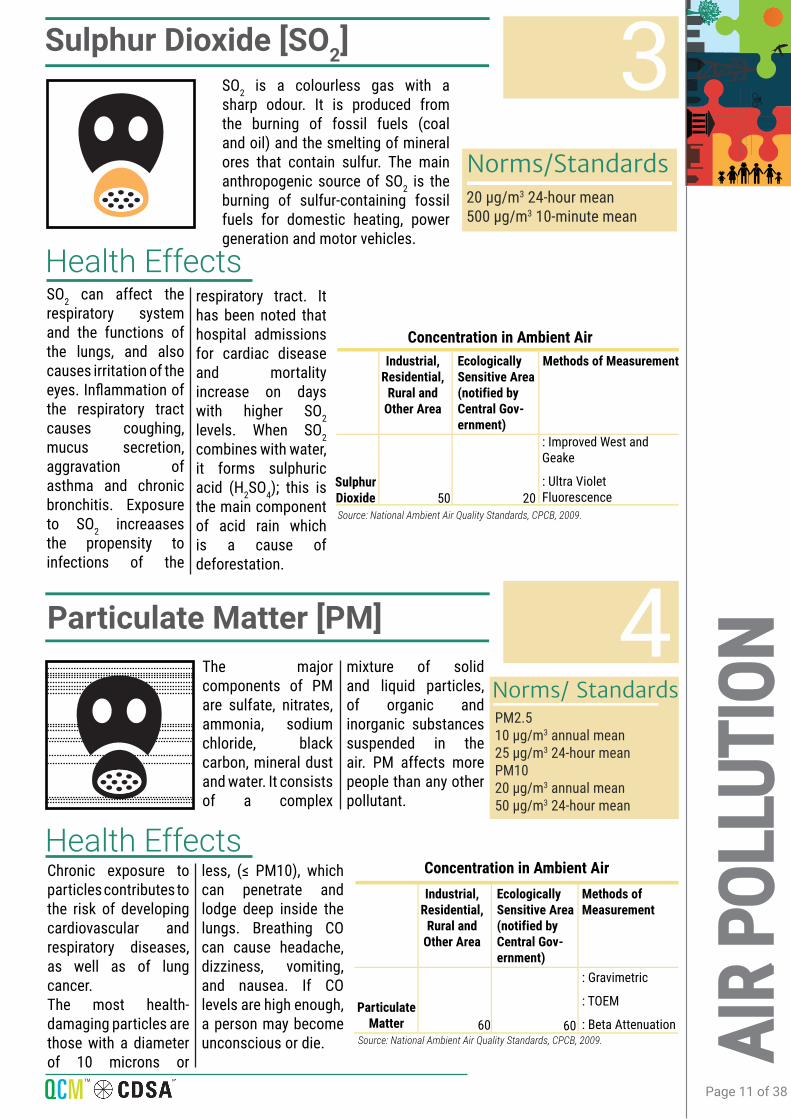
SO2 is a colourless gas with a sharp odour. It is produced from the burning of fossil fuels (coal and oil) and the smelting of mineral ores that contain sulfur. The main anthropogenic source of SO2 is the burning of sulfur-containing fossil fuels for domestic heating, power generation and motor vehicles.
Sulphur Dioxide [SO2]
AIR
POLL
UTIO
N
3
SO2 can affect the respiratory system and the functions of the lungs, and also causes irritation of the eyes. Inflammation of the respiratory tract causes coughing, mucus secretion, aggravation of asthma and chronic bronchitis. Exposure to SO2 increaases the propensity to infections of the
respiratory tract. It has been noted that hospital admissions for cardiac disease and mortality increase on days with higher SO2 levels. When SO2 combines with water, it forms sulphuric acid (H2SO4); this is the main component of acid rain which is a cause of deforestation.
Health Effects
Norms/Standards20 μg/m3 24-hour mean500 μg/m3 10-minute mean
Particulate Matter [PM]
Chronic exposure to particles contributes to the risk of developing cardiovascular and respiratory diseases, as well as of lung cancer. The most health-damaging particles are those with a diameter of 10 microns or
The major components of PM are sulfate, nitrates, ammonia, sodium chloride, black carbon, mineral dust and water. It consists of a complex
Health Effects
mixture of solid and liquid particles, of organic and inorganic substances suspended in the air. PM affects more people than any other pollutant.
less, (≤ PM10), which can penetrate and lodge deep inside the lungs. Breathing CO can cause headache, dizziness, vomiting, and nausea. If CO levels are high enough, a person may become unconscious or die.
PM2.510 μg/m3 annual mean25 μg/m3 24-hour meanPM1020 μg/m3 annual mean50 μg/m3 24-hour mean
Norms/ Standards
4
Concentration in Ambient Air
Sulphur Dioxide
Industrial, Residential,
Rural and Other Area
Ecologically Sensitive Area (notified by Central Gov-ernment)
Methods of Measurement
: Improved West and Geake
: Ultra Violet Fluorescence50 20
Source: National Ambient Air Quality Standards, CPCB, 2009.
Concentration in Ambient Air
Particulate Matter
Industrial, Residential,
Rural and Other Area
Ecologically Sensitive Area (notified by Central Gov-ernment)
Methods of Measurement
: Gravimetric
: TOEM
: Beta Attenuation60 60Source: National Ambient Air Quality Standards, CPCB, 2009.

Page 12 of 38 QCMTM
Lead [Pb]
Carbon Monoxide [CO]
5
6
Lead exposure is estimated to account for 143 000 deaths per year with the highest burden in developing regions. Lead is a cumulative toxicant that affects multiple body systems and is particularly harmful to young children.Lead in the body is distributed to the brain, liver, kidney and
Lead is a naturally occurring toxic metal found in the Earth’s crust. Its widespread use has resulted in extensive environmental contamination and significant public health problems in many parts of
Health Effects
the world.Because it is easily available to extract and to work with, lead has been used in a wide variety of products including Paint, Ceramics, Pipes, Solders, Gasoline, Batteries and Cosmetics.
bones. It is stored in the teeth and bones, where it accumulates over time. Human exposure is usually assessed through the measurement of lead in blood.There is no known level of lead exposure that is considered safe.Lead poisoning is entirely preventable.
On average, about 170 people in the United States die every year from CO produced by non-automotive consumer products. Still others die from CO produced by non-consumer products, such as cars left running
Carbon monoxide (CO) is a poisonous, colorless, odorless, and tasteless gas. Although it has no detectable odor, CO is often mixed with other gases that do have an odor. CO is a common industrial
Health Effects
hazard resulting from the incomplete burning of natural gas and any other material containing carbon, such as gasoline, kerosene, oil, propane, coal, and wood.
in attached garages. The Center for Disease Control and Prevention estimates that several thousand people go to hospital emergency rooms every year to be treated for CO poisoning.
FactsChildhood lead exposure is estimated to contribute to about 6,00,000 new cases of children developing intellectual disabilities every year.
Concentration in Ambient Air
Lead
Industrial, Residential,
Rural and Other Area
Ecologically Sensitive Area (notified by Central Gov-ernment)
Methods of Measurement
:AAS/ICP method after sampling on EMP 2000 or equivalent filter paper
:ED-XRF using Teflon filter0.50 0.50Source: National Ambient Air Quality Standards, CPCB, 2009.
Concentration in Ambient Air
Carbon Monoxide
Industrial, Residential,
Rural and Other Area
Ecologically Sensitive Area (notified by Central Gov-ernment)
Methods of Measurement
:Non Dispersive Infra-Red (NDIR) spectroscopy02 02
Source: National Ambient Air Quality Standards, CPCB, 2009.

Page 13 of 38 QCMTM
AIR
POLL
UTIO
N
Air pollution is a major environmental risk to health. By reducing air pollution levels, countries can reduce the burden of disease from stroke, heart disease, lung cancer, and both chronic and acute respiratory diseases, including asthma.
The lower the levels of air pollution, the better the cardiovascular and respiratory health of the population will be, both in long and short term
Outdoor air pollution in cities and rural areas was estimated to cause 3.7 million premature deaths worldwide in 2012.
Some 88% of those premature deaths occurred in low and middle income countries, and the greatest number under WHO Western Pacific and South-East Asia regions.
Policies and investments supporting cleaner transport, energy efficient housing, power generation, industry and better municipal waste management would reduce key sources of urban outdoor air pollution.
Reducing outdoor emissions from household coal and biomass energy systems, agricultural waste incineration, forest fires and certain agro-forestry activities (e.g. charcoal production) would reduce key rural and peri-urban air pollution sources in developing regions.
Reducing outdoor air pollution will also reduces emissions of CO2 and short-lived climate pollutants such as black carbon particles and methane, thus contributing to the near and long term mitigation of climate change.
In addition to outdoor air pollution, indoor smoke is a serious health risk for some 3 billion people who cook and heat at their homes with biomass fuels and coal.
According to World Health Organization..
Page 14 of 38 QCMTM
Quality of life depends on comfort levels that are strongly related to the ambient temperature of a place. Human beings usually find discomfort in temperatures that are too hot or too cold. Extreme temperatures can also
Significance
1. Ideal Habitable temperature range 20-30oC 2. Acceptable Habitable temperature range 15-35oC
3. Slightly uncomfortable Habitable temperature range is 100C to 50C and 350C to 400C4. Uncomfortable Habitable temperature range less than 100Cand more than 400C
Norms/ Standards
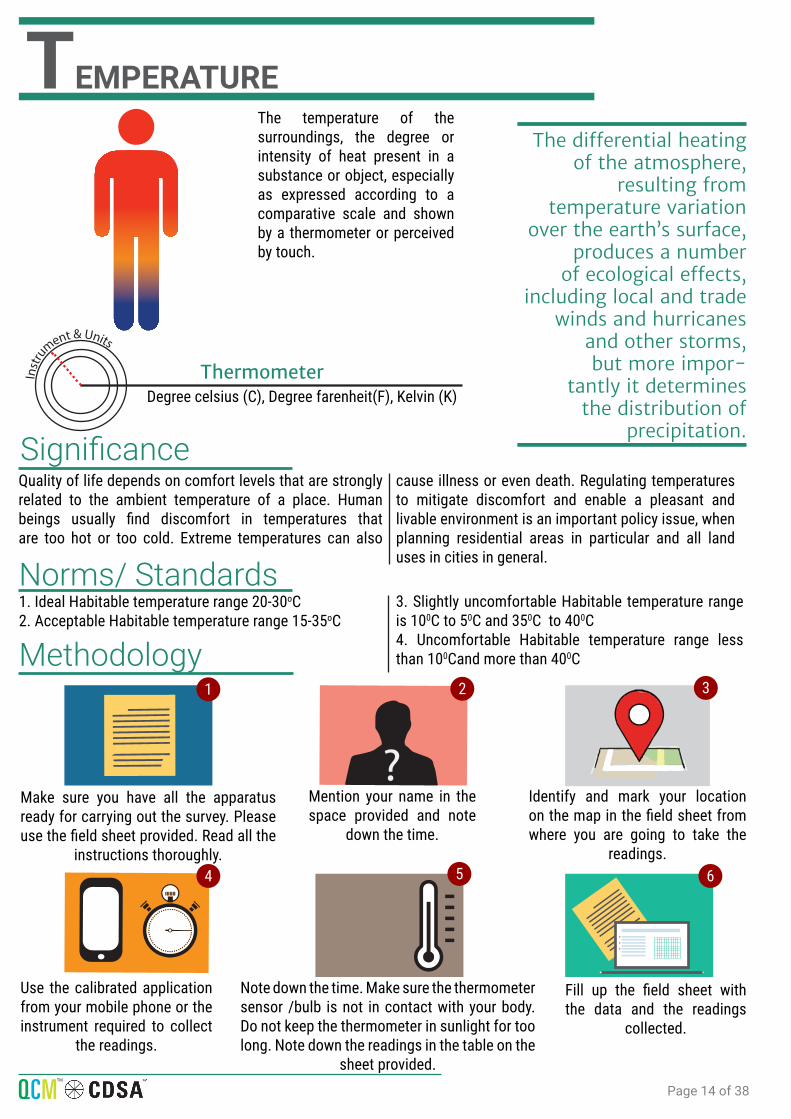
The temperature of the surroundings, the degree or intensity of heat present in a substance or object, especially as expressed according to a comparative scale and shown by a thermometer or perceived by touch.
Degree celsius (C), Degree farenheit(F), Kelvin (K)Thermometer
TEMPERATURE
The differential heating of the atmosphere,
resulting from temperature variation
over the earth’s surface, produces a number
of ecological effects, including local and trade
winds and hurricanes and other storms, but more impor-
tantly it determines the distribution of
precipitation.
Inst
ru
ment & Units
cause illness or even death. Regulating temperatures to mitigate discomfort and enable a pleasant and livable environment is an important policy issue, when planning residential areas in particular and all land uses in cities in general.
?
Methodology
Make sure you have all the apparatus ready for carrying out the survey. Please use the field sheet provided. Read all the
instructions thoroughly.
Use the calibrated application from your mobile phone or the instrument required to collect
the readings.
Mention your name in the space provided and note
down the time.
Note down the time. Make sure the thermometer sensor /bulb is not in contact with your body. Do not keep the thermometer in sunlight for too long. Note down the readings in the table on the
sheet provided.
Identify and mark your location on the map in the field sheet from where you are going to take the
readings.
Fill up the field sheet with the data and the readings
collected.
1 2 3
4 65
Page 15 of 38 QCMTM
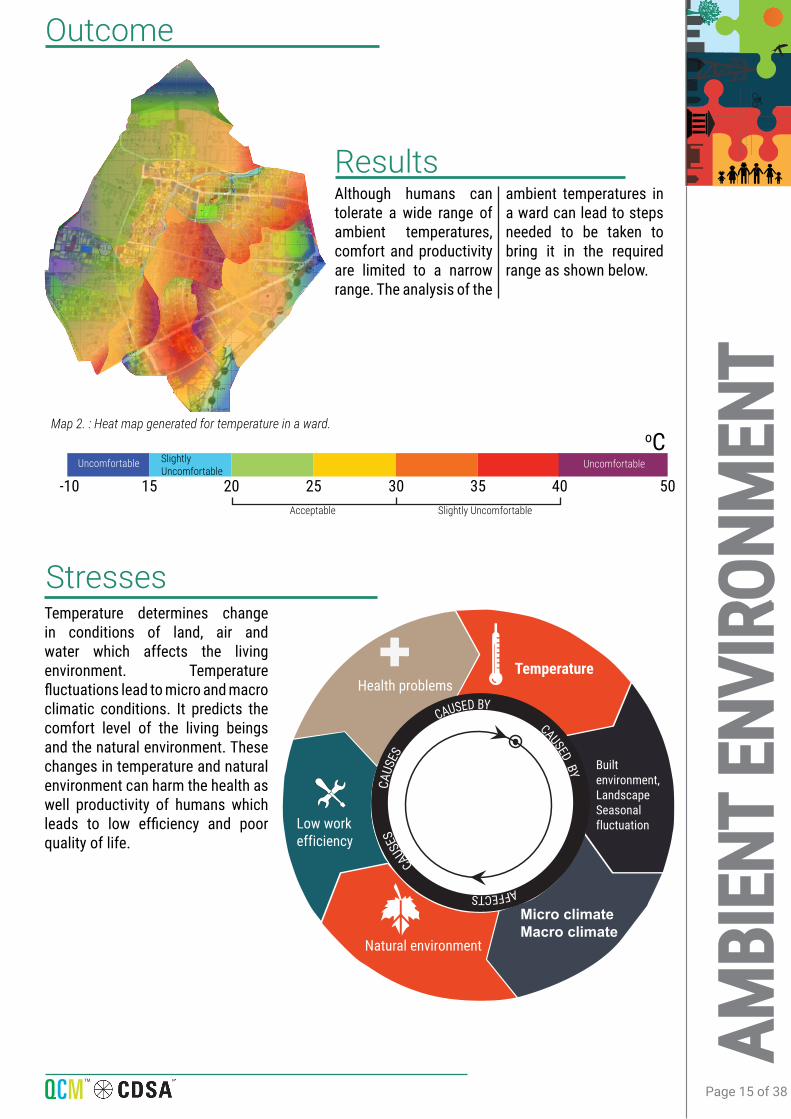
ResultsAlthough humans can tolerate a wide range of ambient temperatures, comfort and productivity are limited to a narrow range. The analysis of the
ambient temperatures in a ward can lead to steps needed to be taken to bring it in the required range as shown below.
Acceptable
Slightly Uncomfortable
Uncomfortable Uncomfortable
Slightly Uncomfortable
Stresses
Outcome
Temperature determines change in conditions of land, air and water which affects the living environment. Temperature fluctuations lead to micro and macro climatic conditions. It predicts the comfort level of the living beings and the natural environment. These changes in temperature and natural environment can harm the health as well productivity of humans which leads to low efficiency and poor quality of life.
AMBI
ENT
ENVI
RONM
ENT
-10 15 20 25 30 35 40 50
oCMap 2. : Heat map generated for temperature in a ward.
Unpleasant environment,low work efficien-cy
Temperature
Built environment,LandscapeSeasonal fluctuation
Micro climateMacro climate
Natural environment
Low work efficiency
Health problems
CAUSED BYCAUSED BY
CAUSE
S CA
USES
AFFECTS
Page 16 of 38 QCMTM
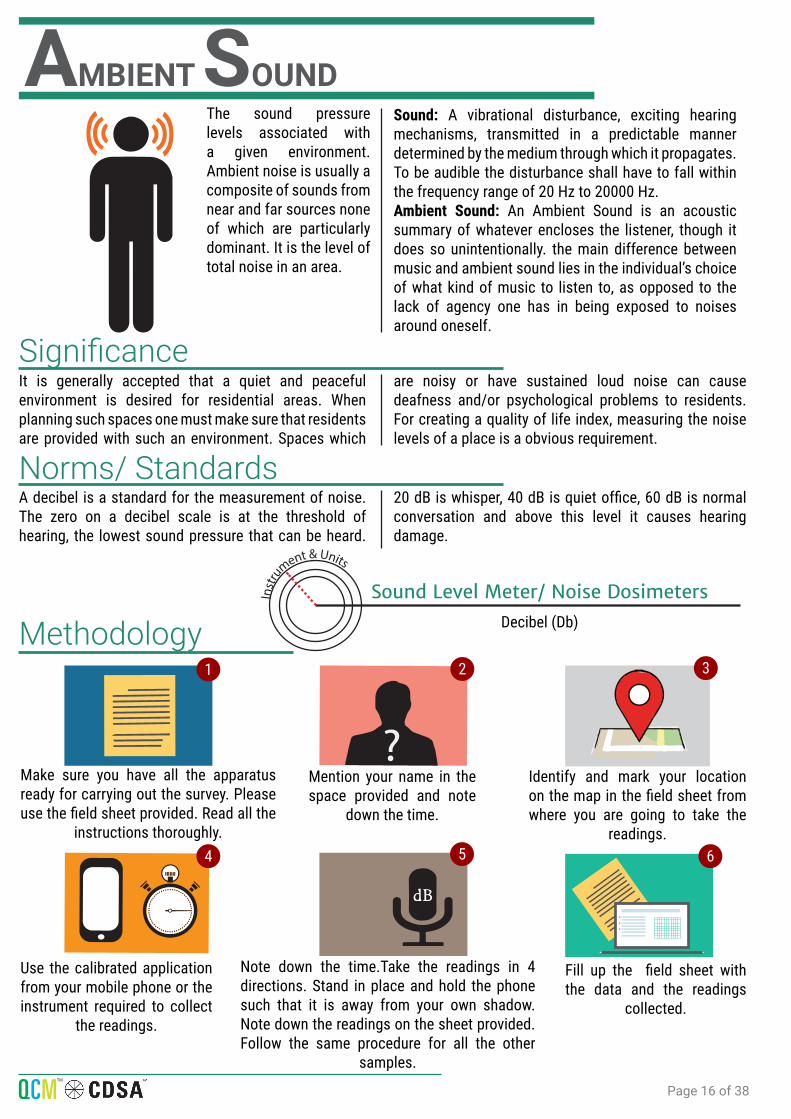
SignificanceIt is generally accepted that a quiet and peaceful environment is desired for residential areas. When planning such spaces one must make sure that residents are provided with such an environment. Spaces which
are noisy or have sustained loud noise can cause deafness and/or psychological problems to residents. For creating a quality of life index, measuring the noise levels of a place is a obvious requirement.
Norms/ StandardsA decibel is a standard for the measurement of noise. The zero on a decibel scale is at the threshold of hearing, the lowest sound pressure that can be heard.
20 dB is whisper, 40 dB is quiet office, 60 dB is normal conversation and above this level it causes hearing damage.
The sound pressure levels associated with a given environment. Ambient noise is usually a composite of sounds from near and far sources none of which are particularly dominant. It is the level of total noise in an area.
Sound: A vibrational disturbance, exciting hearing mechanisms, transmitted in a predictable manner determined by the medium through which it propagates. To be audible the disturbance shall have to fall within the frequency range of 20 Hz to 20000 Hz.Ambient Sound: An Ambient Sound is an acoustic summary of whatever encloses the listener, though it does so unintentionally. the main difference between music and ambient sound lies in the individual’s choice of what kind of music to listen to, as opposed to the lack of agency one has in being exposed to noises around oneself.
AMBIENT SOUND
Decibel (Db)
Sound Level Meter/ Noise DosimetersInst
ru
ment & Units
?
Methodology
Make sure you have all the apparatus ready for carrying out the survey. Please use the field sheet provided. Read all the
instructions thoroughly.
Use the calibrated application from your mobile phone or the instrument required to collect
the readings.
Mention your name in the space provided and note
down the time.
Note down the time.Take the readings in 4 directions. Stand in place and hold the phone such that it is away from your own shadow. Note down the readings on the sheet provided.Follow the same procedure for all the other
samples.
Identify and mark your location on the map in the field sheet from where you are going to take the
readings.
Fill up the field sheet with the data and the readings
collected.
1 2 3
4 65
Page 17 of 38 QCMTM
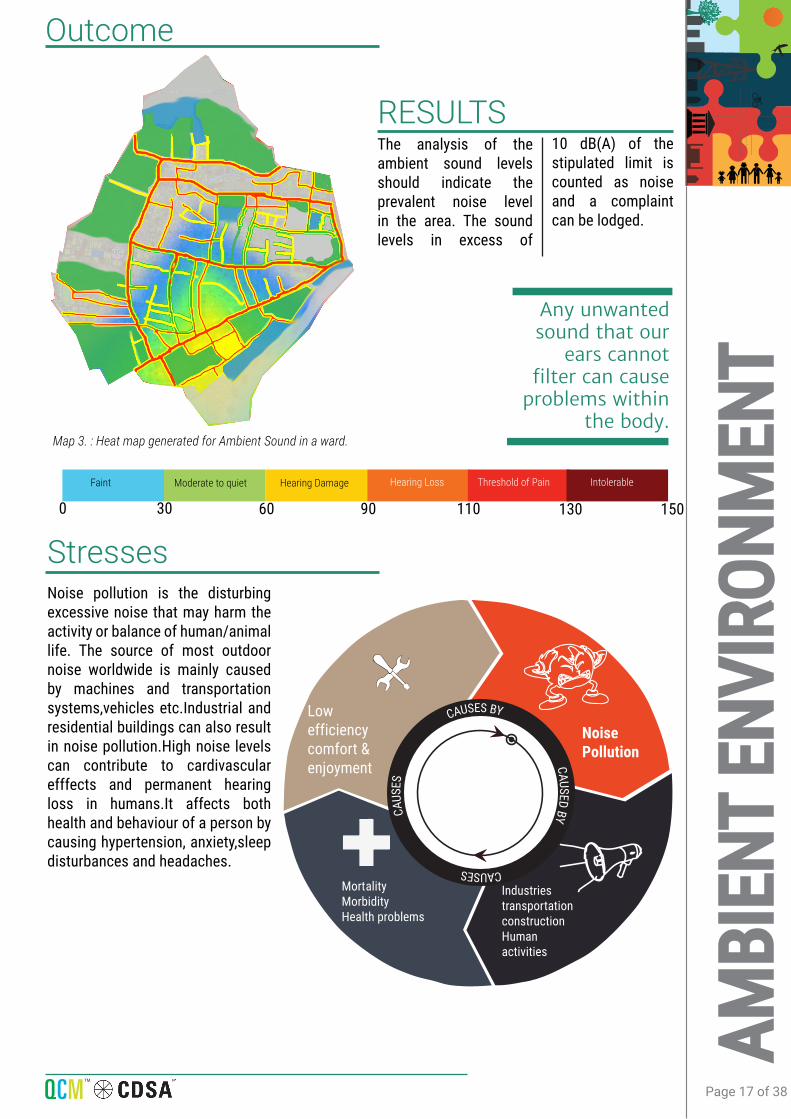
RESULTSThe analysis of the ambient sound levels should indicate the prevalent noise level in the area. The sound levels in excess of
10 dB(A) of the stipulated limit is counted as noise and a complaint can be lodged.
Any unwanted sound that our
ears cannot filter can cause
problems within the body.
Faint Moderate to quiet Hearing Damage Threshold of Pain IntolerableHearing Loss
Decibel (Db)
Stresses
Outcome
Noise pollution is the disturbing excessive noise that may harm the activity or balance of human/animal life. The source of most outdoor noise worldwide is mainly caused by machines and transportation systems,vehicles etc.Industrial and residential buildings can also result in noise pollution.High noise levels can contribute to cardivascular efffects and permanent hearing loss in humans.It affects both health and behaviour of a person by causing hypertension, anxiety,sleep disturbances and headaches.
AMBI
ENT
ENVI
RONM
ENT
D
0 60 13030 11090 150
Map 3. : Heat map generated for Ambient Sound in a ward.
MortalityMorbidityHealth problems
IndustriestransportationconstructionHumanactivities
Low efficiencycomfort &enjoyment
CAUSES
CAUS
ES
CAUSES BY
CAUSED BY
Noise Pollution
Page 18 of 38 QCMTM
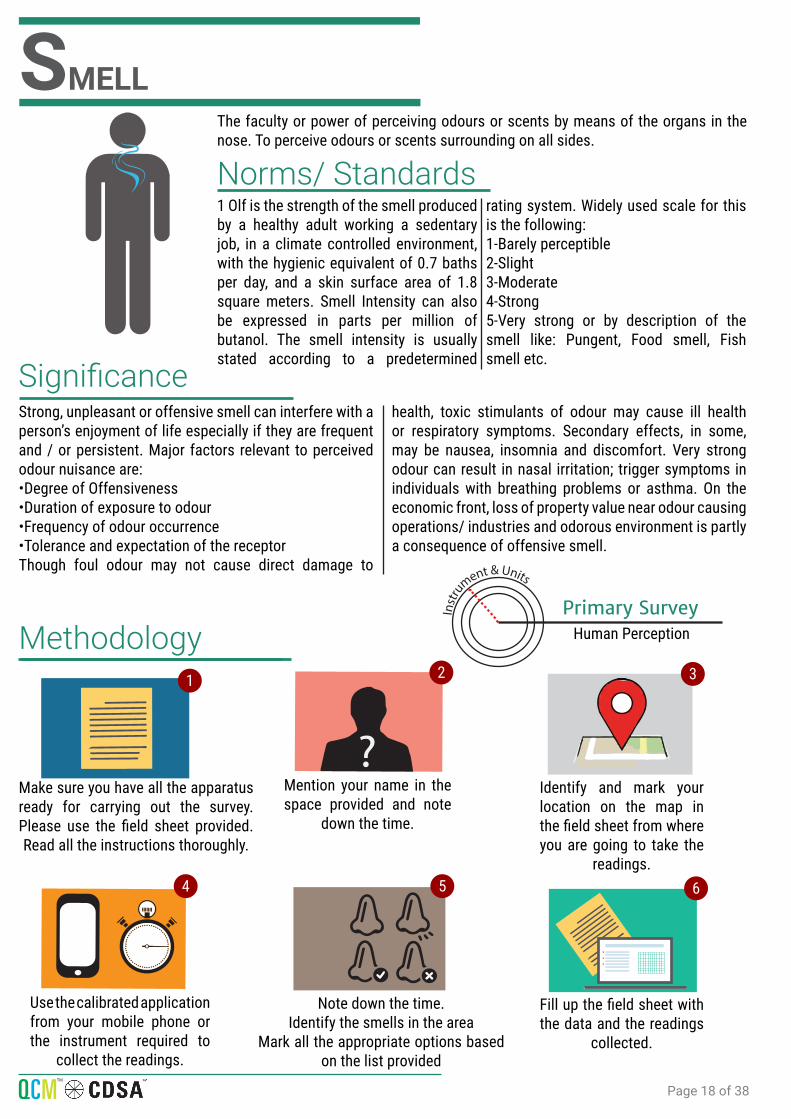
SignificanceStrong, unpleasant or offensive smell can interfere with a person’s enjoyment of life especially if they are frequent and / or persistent. Major factors relevant to perceived odour nuisance are: •Degree of Offensiveness •Duration of exposure to odour •Frequency of odour occurrence •Tolerance and expectation of the receptor Though foul odour may not cause direct damage to
health, toxic stimulants of odour may cause ill health or respiratory symptoms. Secondary effects, in some, may be nausea, insomnia and discomfort. Very strong odour can result in nasal irritation; trigger symptoms in individuals with breathing problems or asthma. On the economic front, loss of property value near odour causing operations/ industries and odorous environment is partly a consequence of offensive smell.
Norms/ Standards
The faculty or power of perceiving odours or scents by means of the organs in the nose. To perceive odours or scents surrounding on all sides.
Human PerceptionPrimary Survey
SMELL
Inst
ru
ment & Units
?
Methodology
Make sure you have all the apparatus ready for carrying out the survey. Please use the field sheet provided. Read all the instructions thoroughly.
Use the calibrated application from your mobile phone or the instrument required to
collect the readings.
Mention your name in the space provided and note
down the time.
Note down the time.Identify the smells in the area
Mark all the appropriate options based on the list provided
Identify and mark your location on the map in the field sheet from where you are going to take the
readings.
Fill up the field sheet with the data and the readings
collected.
1 2 3
4 65
1 Olf is the strength of the smell produced by a healthy adult working a sedentary job, in a climate controlled environment, with the hygienic equivalent of 0.7 baths per day, and a skin surface area of 1.8 square meters. Smell Intensity can also be expressed in parts per million of butanol. The smell intensity is usually stated according to a predetermined
rating system. Widely used scale for this is the following: 1-Barely perceptible 2-Slight 3-Moderate 4-Strong 5-Very strong or by description of the smell like: Pungent, Food smell, Fish smell etc.

Page 19 of 38 QCMTM
ResultsSmells in an area have a part in deciding our physical comfort level. Fragrances (in moderation) generally contribute towards increasing the comfort level while foul odours work exactly the opposite way like garbage, sewage etc. negate. Identifying the smells in an area can give pointers if any activities need to be prohibited or
shifted downwind to increase the comfort of residents and in turn improve their quality of life. The purpose of the study is to identify smell related words on geo-referenced map of individual ward maps. The next stage is to create a structure for a large and apparently unrelated dataset of smell words through a system of classification.
Pleasant Neutral Pungent Unpleasant
Outcome
StressesUnpleasant odours can arise from specific industrial processes, adversely affecting workers and even residents. The most common sources of odour arise from sewage treatment plants, animal rendering factories, chemicals etc in the neighbourhood. Unpleasant smell can affect one’s mood, can lead to frustration, and non-productivity.
AMBI
ENT
ENVI
RONM
ENT
Map 3. : Heat map generated for smell in a ward.
Unpleasant environment,low work efficien-cy
Industries,Household,Traffic,Other human activities
Health problems
Poor quality of life
Unpleasant environment,low work efficiency
Smell
Smell of toilet,food ,chemiclas etc.
CAUSED BYCAUSED
BY
CAUSE
S
CAUS
ES CA
USES
CAUSES

Page 20 of 38 QCMTM
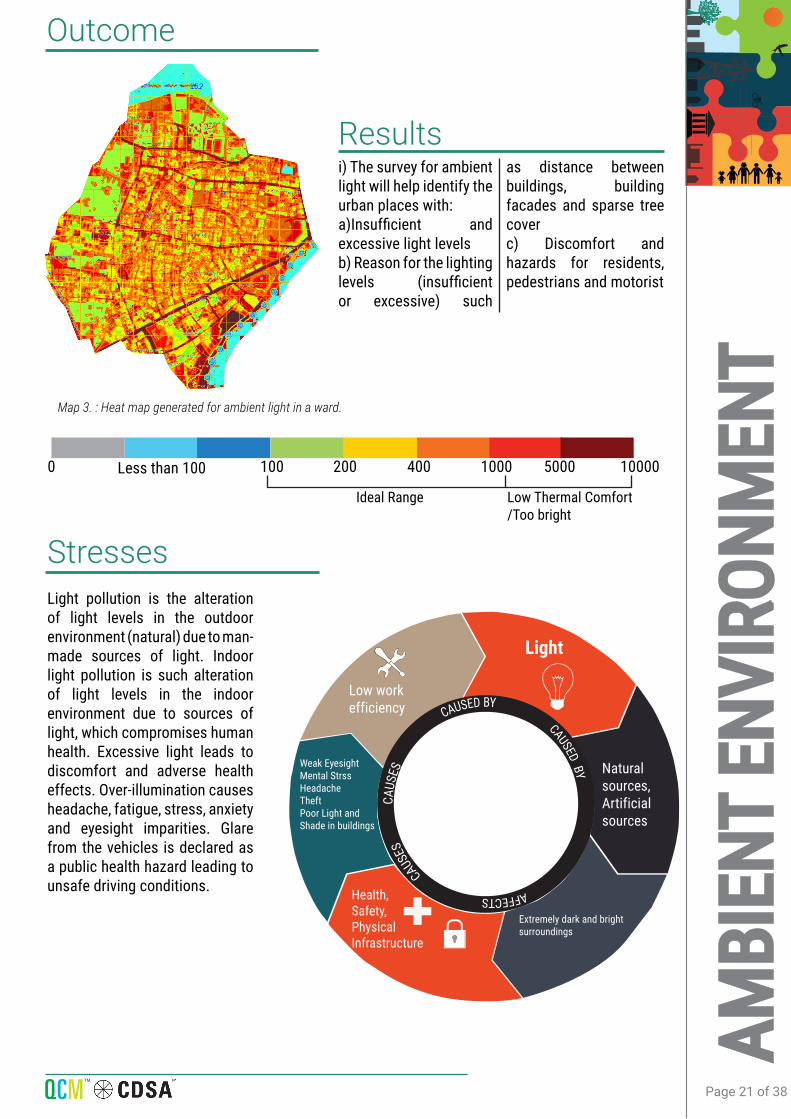
Norms/ Standardsi) Less than 100 lux is insufficient daylightii) Between 100 lux and 2000 lux is useful daylight
iii) More than 2000 lux is too much daylight and can result in visual and thermal discomfort.
The light surrounding the environment or a subject. The term usually refers to sources of light that are already available naturally (e.g. the sun, moon, lightning) or artificial light already in use (e.g. street lighting).
Lux Lux Meter
AMBIENTLIGHT
Inst
ru
ment & Units
?
Methodology
Make sure you have all the apparatus ready for carrying out the survey. Please use the field sheet provided. Read all
the instructions thoroughly.
Use the calibrated application from your mobile phone or the instrument required to
collect the readings.
Mention your name in the space provided and note
down the time.
Note down the time. Take the readings in all the 4 directions. Stand in place and hold the phone such that it is away from your own shadow. Note down the readings on the sheet provided. Follow the same procedure for all the other samples.
Identify and mark your location on the map in the field sheet from where you are going to take the
readings.
Fill up the field sheet with the data and the readings
collected.
1 2 3
4 65
SignificanceVisual resources are an important component of the quality of life of any geographic area. As users experience a place, their primary sensory interaction with that place is visual in nature, and a wide variety of shapes/ space colors, and textures, composed by topography, structures, roadways, and vegetation, forms the views of the city.Visual discomfort is experienced when the ambient
light is well below and above the comfortable light level. Excessive/Reflective light is common in urban areas, where it leads to visual discomfort and annoyance for residents, pedestrians and can create hazards for motorists.Ambient light therefore becomes an important factor to be addressed in policy making to achieve visual comfort and thus good quality of life.
Page 21 of 38 QCMTM
Ideal Range Low Thermal Comfort /Too bright
Resultsi) The survey for ambient light will help identify the urban places with: a)Insufficient and excessive light levelsb) Reason for the lighting levels (insufficient or excessive) such
as distance between buildings, building facades and sparse tree coverc) Discomfort and hazards for residents, pedestrians and motorist
Outcome
StressesLight pollution is the alteration of light levels in the outdoor environment (natural) due to man-made sources of light. Indoor light pollution is such alteration of light levels in the indoor environment due to sources of light, which compromises human health. Excessive light leads to discomfort and adverse health effects. Over-illumination causes headache, fatigue, stress, anxiety and eyesight imparities. Glare from the vehicles is declared as a public health hazard leading to unsafe driving conditions.
AMBI
ENT
ENVI
RONM
ENT
0 200Less than 100 400100 1000 5000 10000
Map 3. : Heat map generated for ambient light in a ward.
Unpleasant environment,low work efficien-cy
Light
Natural sources,Artificial sources
Extremely dark and bright surroundings
Health,Safety, Physical Infrastructure
Weak EyesightMental StrssHeadacheTheftPoor Light and Shade in buildings
Low work efficiency CAUSED BY
CAUSED BY
CAUSE
S CA
USES
AFFECTS
Page 22 of 38 QCMTM
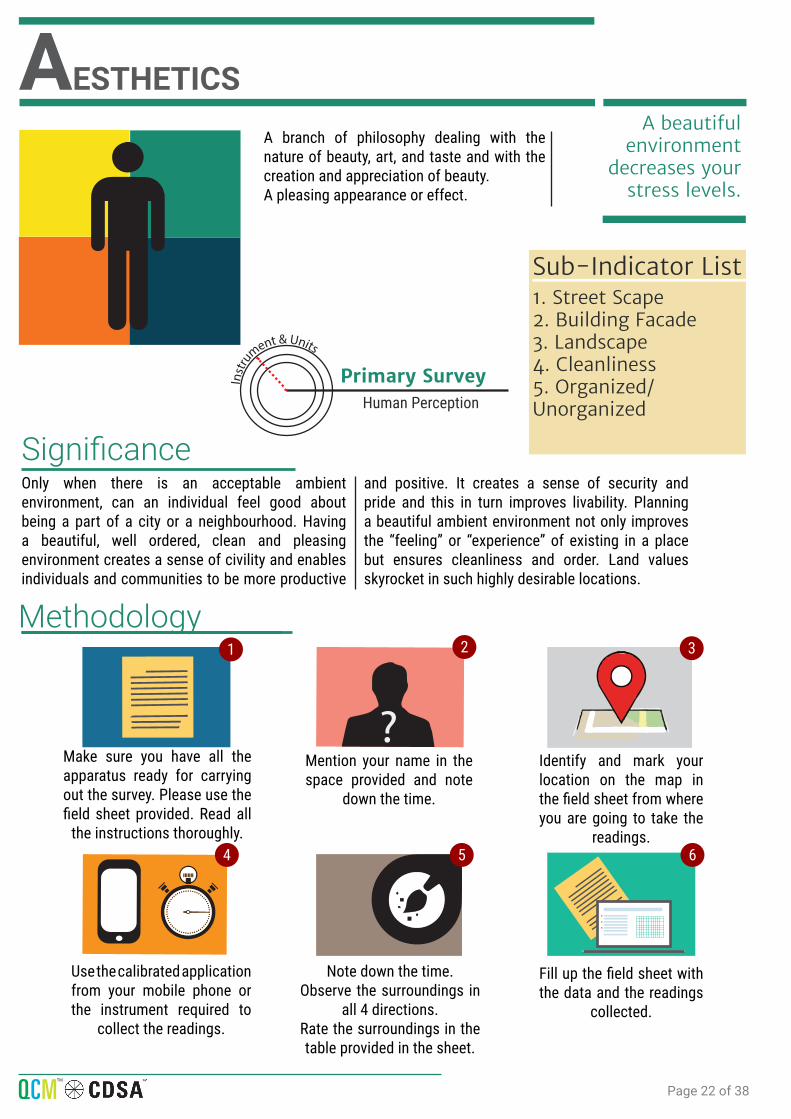
SignificanceOnly when there is an acceptable ambient environment, can an individual feel good about being a part of a city or a neighbourhood. Having a beautiful, well ordered, clean and pleasing environment creates a sense of civility and enables individuals and communities to be more productive
and positive. It creates a sense of security and pride and this in turn improves livability. Planning a beautiful ambient environment not only improves the “feeling” or “experience” of existing in a place but ensures cleanliness and order. Land values skyrocket in such highly desirable locations.
A branch of philosophy dealing with the nature of beauty, art, and taste and with the creation and appreciation of beauty. A pleasing appearance or effect.
A beautiful environment
decreases your stress levels.
?
Methodology
Make sure you have all the apparatus ready for carrying out the survey. Please use the field sheet provided. Read all
the instructions thoroughly.
Use the calibrated application from your mobile phone or the instrument required to
collect the readings.
Mention your name in the space provided and note
down the time.
Note down the time.Observe the surroundings in
all 4 directions.Rate the surroundings in the table provided in the sheet.
Identify and mark your location on the map in the field sheet from where you are going to take the
readings.
Fill up the field sheet with the data and the readings
collected.
AESTHETICS
1 2 3
4 65
Human PerceptionPrimary SurveyIn
stru
ment & Units
Sub-Indicator List1. Street Scape2. Building Facade3. Landscape4. Cleanliness5. Organized/ Unorganized
Page 23 of 38 QCMTM
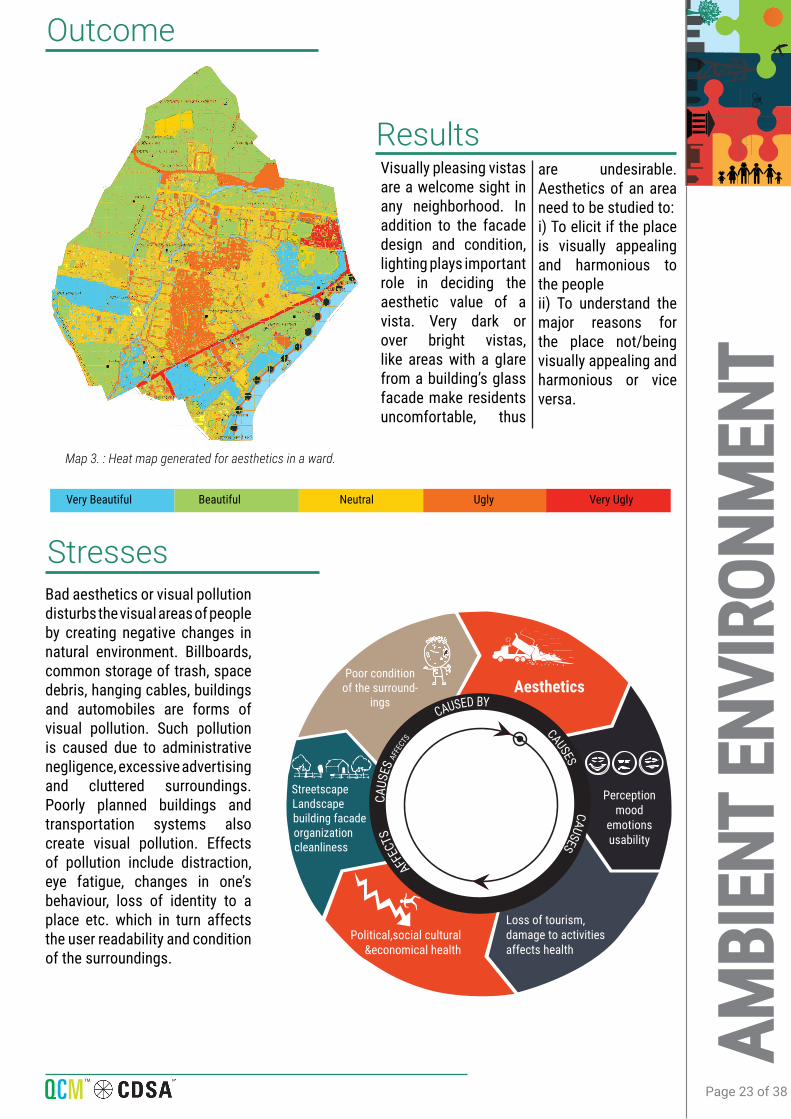
ResultsVisually pleasing vistas are a welcome sight in any neighborhood. In addition to the facade design and condition, lighting plays important role in deciding the aesthetic value of a vista. Very dark or over bright vistas, like areas with a glare from a building’s glass facade make residents uncomfortable, thus
are undesirable. Aesthetics of an area need to be studied to:i) To elicit if the place is visually appealing and harmonious to the peopleii) To understand the major reasons for the place not/being visually appealing and harmonious or vice versa.
Very Beautiful Beautiful Neutral Ugly Very Ugly
Bad aesthetics or visual pollution disturbs the visual areas of people by creating negative changes in natural environment. Billboards, common storage of trash, space debris, hanging cables, buildings and automobiles are forms of visual pollution. Such pollution is caused due to administrative negligence, excessive advertising and cluttered surroundings. Poorly planned buildings and transportation systems also create visual pollution. Effects of pollution include distraction, eye fatigue, changes in one’s behaviour, loss of identity to a place etc. which in turn affects the user readability and condition of the surroundings.
Outcome
Stresses
AMBI
ENT
ENVI
RONM
ENT
Map 3. : Heat map generated for aesthetics in a ward.
Aesthetics
Perceptionmood
emotionsusability
Loss of tourism,damage to activitiesaffects health
Political,social cultural &economical health
Poor condition of the surround-
ings
StreetscapeLandscapebuilding facadeorganizationcleanliness
CAUSED BY
CAUSES
AFFEC
TSCA
USES
AFFE
CTS
CAUSES
Aesthetics
Perceptionmood
emotionsusability
Page 24 of 38 QCMTM
“IT’S TIME TO COME TOGETHER”: CROWDSOURCING A CITIZEN RESPONSE TO QUANTIFIED CITIES MOVEMENT (QCM)
Today, in our times, human participation has been considered a key to develop communities. And new urban planning, instead of theoretical and cognitive issues, is more likely leading to practical planning, implementations and participation.
The precondition for any intervention to be successful is for the beneficiaries to have ownership of that intervention (because they are the ultimate users). Pune data and the Quantified Cities Movement are being created by CDSA to improve decentralized governance by building
transparency and accountability by facilitating citizens’ participation.
The pattern of development of Pune has been decidedly mercenary and unplanned, with the only criteria being accessibility to existing and upcoming IT hubs. As things stand now, Central Pune has lost its previous quality and ambience in residential zones.
It is true that the PMC and other government departments are responsible for different aspects of the cities governance; the recent growth is overwhelming even for the best of governance. As Punekars we can complain, but is that all that we can do? We live in the city, we add
to the traffic, we generate waste, we pollute water, in other words, we add to this crisis. The question to ponder over is, Should we just be a part of the problem, or can we be a part of the solution to make this a better, a more livable city?
Every one of us can make a difference! What starts with a ‘can do’ attitude can go a long way. Shed the attitude of only keeping your house clean. Take responsibility for your neighborhood and the whole city.
Empower yourself! Do you know where your local ward office is located? Do you know your ward counselor, do you know the concerned engineers in your ward, the health officer etc… Reach out and talk to them on issues in your ward. Be aware of their responsibilities, understand their constraints and see how you can work together. These can have a big impact. Each of these might sound trivial, but if all of us are involved,
our collective action can make a lot of difference.
While there is much you can do as an individual, your power is enhanced as part of a group. Become a part of Quantified City Movement (QCM); be responsible for good changes in the city. Coordinated action by a community can work wonders.
While certain facts about our fast growing city are gloomy, the future of Pune will depend on the actions of its residents. Many cities around the globe have turned around splendidly, and given the educated cosmopolitan populace Pune hosts; there is no reason why our city
cannot justifiably regain the title of “Queen of Deccan” instead of the pejorative but sadly title of “Unplanned & Sporadic city”.
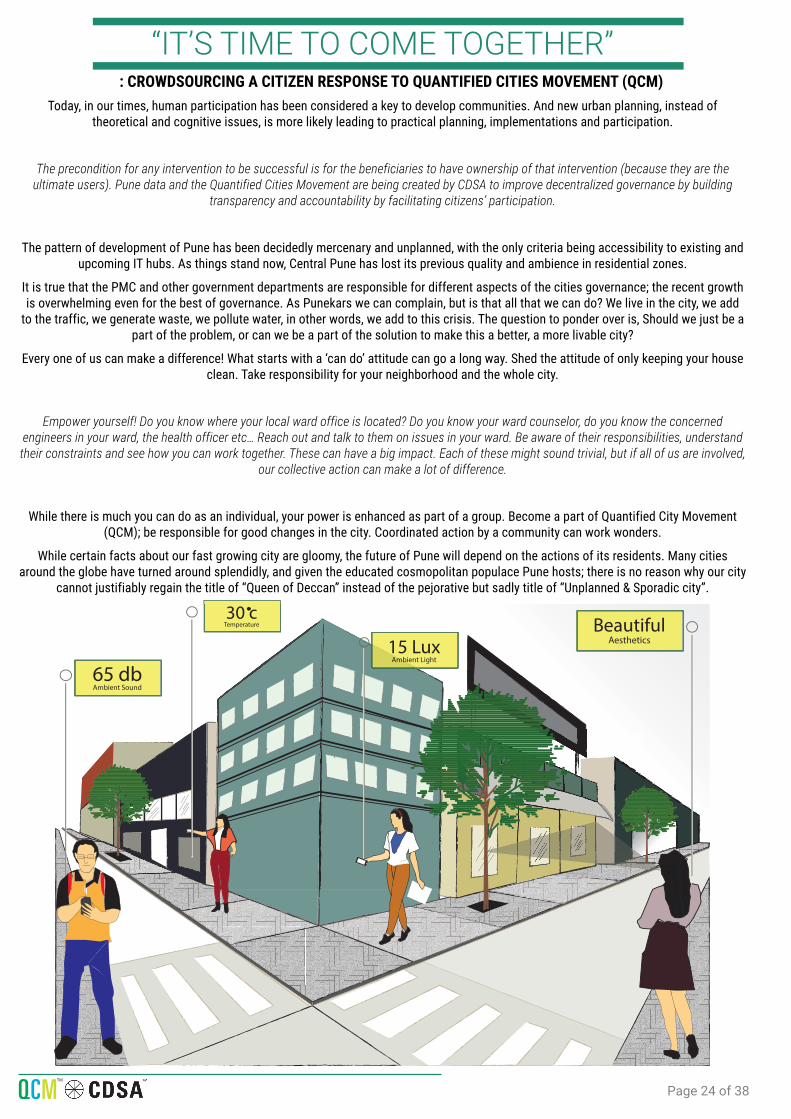
15 LuxAmbient Light
BeautifulAesthetics
30 cTemperature
65 dbAmbient Sound

Page 25 of 38 QCMTM
The visual elements of a street, including the road, adjoining buildings, sidewalks, street furniture, trees and open spaces, etc. that combine to form the street’s character.
Streetscape
Building Facade
Landscape
Cleanliness
Organized / Unorganized
A facade is generally one exterior side of a building, usually, but not always, the front.
Cleanliness means that there is no dirt, no dust, no stains, and no bad smells. The purposes of cleanliness is health, beauty, absence of offensive odour and to avoid the spreading of dirt and contaminants to oneself and others
It can refer to the visible features of an area of land, or to an example of the genre of painting that depicts such an area of land. Landscape, in both senses, includes the physical elements of landforms such as (ice-capped) mountains, hills and water bodies such as rivers, lakes, ponds and the sea, living elements of land cover including indigenous vegetation, human elements including different forms of land use, buildings and structures, and transitory elements such as lighting and weather condition
In case of a city, it is overall arrangement of vehicular & pedestrian way, built mass, signage, street shops, commercial activity, trees (landscape), and act in a systematic way, especially on a large scale.
AEST
HETI
CS

Page 26 of 38 QCMTM
Significance
Sub-Indicator List
The study and regulation of traffic in a given area is of great importance. Levels of traffic or an index of traffic can indicate a good or bad quality of life for a given place. The situation of many of the indicators (mentioned) above can be exacerbated due to high traffic. Traffic and congestion contribute immensly to bad air quality, noise
pollution, increase in ambient temperature, negative smells and an overall negative livable environment. Through proper regulation and planning the ill effects of traffic can be mitigated and the positive effects enhanced.
Norms/ StandardsAny proposed site plan or subdivision plan which is expected to generate over one hundred (100) directional trips during the peak hour of the traffic generator or the
peak hour on the adjacent streets, or over seven hundred fifty (750) trips in an average day.
The movement (as of vehicles or pedestrians) through an area or along a route. Can also be termed as congestion of vehicles stuck in traffic.
1.Vehicle counts 2.Vehicle average speeds3.Direction of vehicular movement 4.Origin/Destination analysis 5.Passenger volume 6.Modal breakup 7.Public transport analysis (time, comfort, cost, route rationalization) 8.Floating population analysis 9.Accident statistics (number of accidents, danger zones, types of vehicles involved, outcomes {deaths, injuries, damages} and major causes)
TRAFFIC
Inst
rument & Units
Human PerceptionPrimary Survey
?
Methodology
Make sure you have all the apparatus ready for carrying out the survey. Please use the field sheet provided. Read all
the instructions thoroughly.
Use the calibrated application from your mobile phone or the instrument required to collect
the readings.
Mention your name in the space provided and note
down the time.
Collect the statistical data showing traffic
Identify and mark your location on the map in the field sheet from where you are going to take the
readings.
Fill up the field sheet with the data and the readings
collected.
1 2 3
4 65
Page 27 of 38 QCMTM
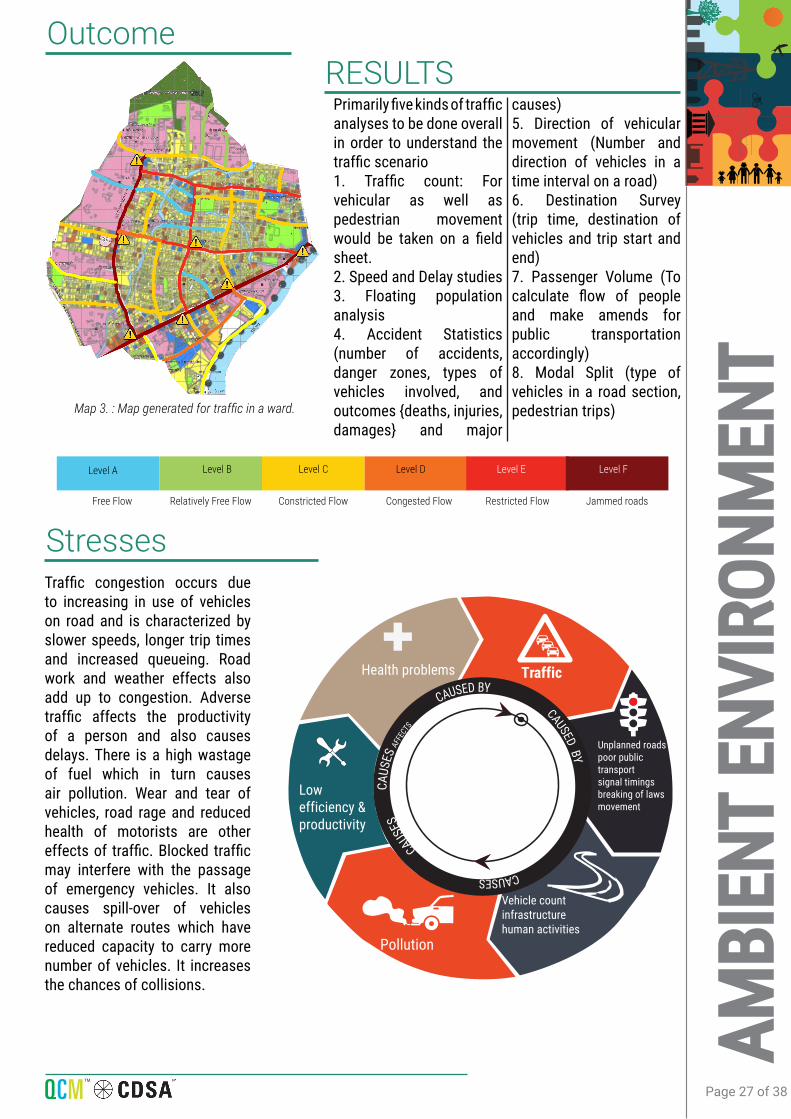
RESULTScauses)5. Direction of vehicular movement (Number and direction of vehicles in a time interval on a road)6. Destination Survey (trip time, destination of vehicles and trip start and end)7. Passenger Volume (To calculate flow of people and make amends for public transportation accordingly)8. Modal Split (type of vehicles in a road section, pedestrian trips)
Level A Level B Level C Level D Level E Level F
Free Flow Relatively Free Flow Constricted Flow Congested Flow Restricted Flow Jammed roads
Primarily five kinds of traffic analyses to be done overall in order to understand the traffic scenario1. Traffic count: For vehicular as well as pedestrian movement would be taken on a field sheet.2. Speed and Delay studies3. Floating population analysis 4. Accident Statistics (number of accidents, danger zones, types of vehicles involved, and outcomes {deaths, injuries, damages} and major
Outcome
StressesTraffic congestion occurs due to increasing in use of vehicles on road and is characterized by slower speeds, longer trip times and increased queueing. Road work and weather effects also add up to congestion. Adverse traffic affects the productivity of a person and also causes delays. There is a high wastage of fuel which in turn causes air pollution. Wear and tear of vehicles, road rage and reduced health of motorists are other effects of traffic. Blocked traffic may interfere with the passage of emergency vehicles. It also causes spill-over of vehicles on alternate routes which have reduced capacity to carry more number of vehicles. It increases the chances of collisions.
AMBI
ENT
ENVI
RONM
ENT
Map 3. : Map generated for traffic in a ward.
Health problems Traffic
Low efficiency & productivity
Pollution
Vehicle countinfrastructurehuman activities
Unplanned roadspoor public transportsignal timings breaking of lawsmovement
CAUSED BY
CAUSED BY
CAUSE
S CA
USES
AFFE
CTS
CAUSES
Page 28 of 38 QCMTM
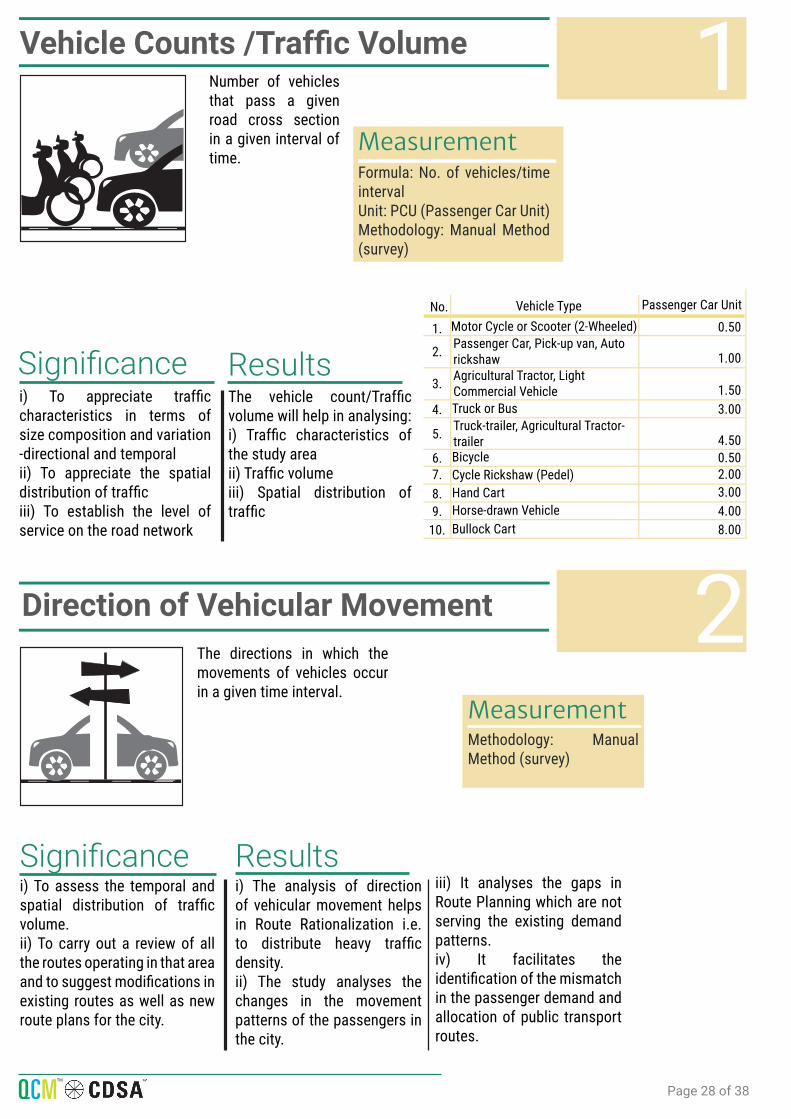
i) To appreciate traffic characteristics in terms of size composition and variation -directional and temporalii) To appreciate the spatial distribution of trafficiii) To establish the level of service on the road network
Number of vehicles that pass a given road cross section in a given interval of time.
MeasurementFormula: No. of vehicles/time intervalUnit: PCU (Passenger Car Unit)Methodology: Manual Method (survey)
Vehicle Counts /Traffic Volume
The vehicle count/Traffic volume will help in analysing:i) Traffic characteristics of the study areaii) Traffic volumeiii) Spatial distribution of traffic
i) To assess the temporal and spatial distribution of traffic volume.ii) To carry out a review of all the routes operating in that area and to suggest modifications in existing routes as well as new route plans for the city.
MeasurementMethodology: Manual Method (survey)
Direction of Vehicular Movement
i) The analysis of direction of vehicular movement helps in Route Rationalization i.e. to distribute heavy traffic density. ii) The study analyses the changes in the movement patterns of the passengers in the city.
iii) It analyses the gaps in Route Planning which are not serving the existing demand patterns.iv) It facilitates the identification of the mismatch in the passenger demand and allocation of public transport routes.
Significance Results
Significance Results
1
2The directions in which the movements of vehicles occur in a given time interval.
No. Vehicle Type Passenger Car Unit
1.
4.
6.7.8.9.
10.
2.
3.
5.
0.50
3.00
0.502.003.004.008.00
1.00
1.50
4.50
Motor Cycle or Scooter (2-Wheeled)
Truck or Bus
Bicycle Cycle Rickshaw (Pedel) Hand Cart Horse-drawn Vehicle Bullock Cart
Passenger Car, Pick-up van, Auto rickshawAgricultural Tractor, Light Commercial Vehicle
Truck-trailer, Agricultural Tractor-trailer
Page 29 of 38 QCMTM
4
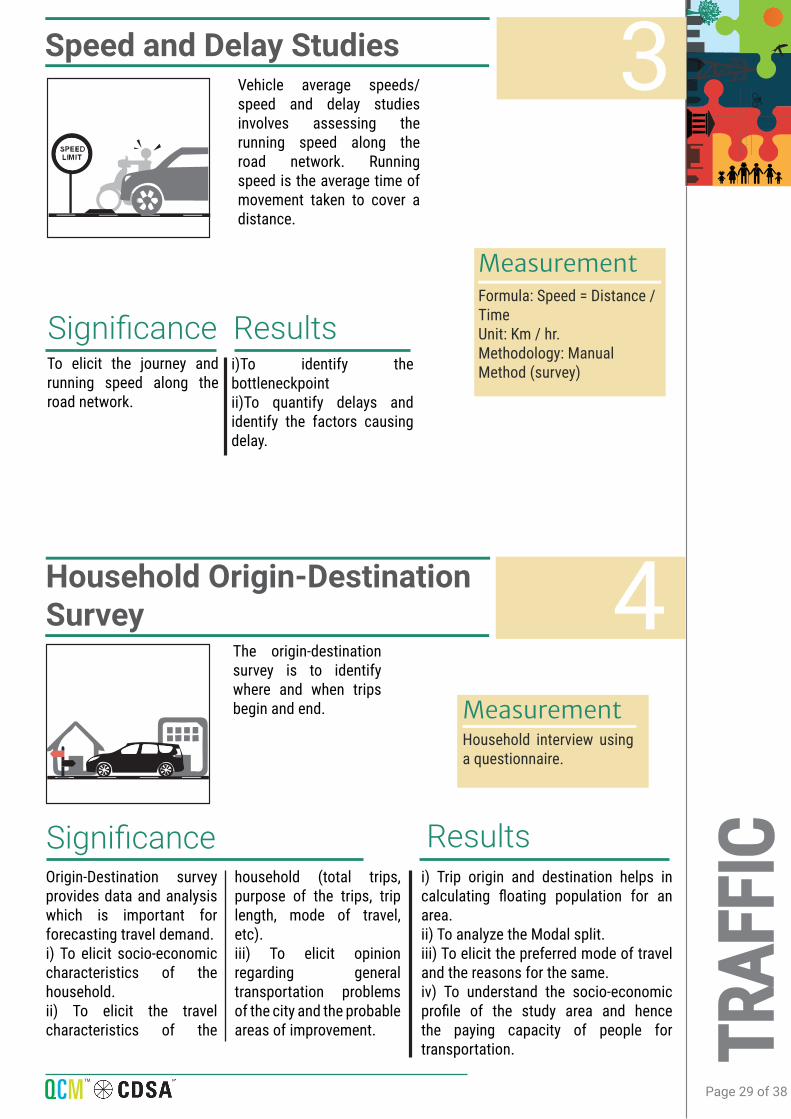
To elicit the journey and running speed along the road network.
Vehicle average speeds/speed and delay studies involves assessing the running speed along the road network. Running speed is the average time of movement taken to cover a distance.
i)To identify the bottleneckpointii)To quantify delays and identify the factors causing delay.
Speed and Delay Studies
MeasurementFormula: Speed = Distance / TimeUnit: Km / hr.Methodology: Manual Method (survey)
Significance Origin-Destination survey provides data and analysis which is important for forecasting travel demand.i) To elicit socio-economic characteristics of the household.ii) To elicit the travel characteristics of the
MeasurementHousehold interview using a questionnaire.
Household Origin-Destination Survey
The origin-destination survey is to identify where and when trips begin and end.
i) Trip origin and destination helps in calculating floating population for an area.ii) To analyze the Modal split.iii) To elicit the preferred mode of travel and the reasons for the same.iv) To understand the socio-economic profile of the study area and hence the paying capacity of people for transportation.
household (total trips, purpose of the trips, trip length, mode of travel, etc).iii) To elicit opinion regarding general transportation problems of the city and the probable areas of improvement.
Results
Significance Results
TRAF
FIC
3

Page 30 of 38 QCMTM
SignificancePassenger volume provides us a threshold for planning of public transportation and overall planning policy.
Number of passengers (in vehicles or pedestrian) that pass a given road cross section during a time interval.
MeasurementFormulae:i) Passenger volume for Particular transport = Number of vehicles (particular transport mode) per hour X Average occupancy of that transport modeii) Total Passenger volume =∑Passenger volume for particular transport mode(Passenger volume is of a given road cross section)
Unit: Passengers per hour
Methodology: Data is analyzed from Traffic volume study
Passenger Volume
Passenger volume gives us the number of people using a particular route and mode of transport.
Significance In order to develop and deploy new transport strategies and services such as Park & Ride systems, carpool/car-share plans, individual public transport services, congestion charging policy, demand responsive services etc. the data collected from modal split represents the basic input data.
MeasurementFormulae:Modal split= % of passengers using particular mode of transportUnit: PercentageMethodology: Data is analysed from Origin-Destination survey
Modal Split
Results
Modal split represents a method used to determine the potential number of trips by mode or in other words, the share of different modes of transport and pedestrian trips in the total transport needs.
i) To assess the number of people using different modes of transport.ii) To compare the modal split of public transportation with recommended norms.
Results
5
6
City SizeRecommended Public Transport modal Split
30%30%
min. 40%min. 50%min. 70%
min. 75% (85%with mass transit system)
Below 1 MillionAround 1 Million1.5 Million3.0 Million6.0 Million9.0 Million
Page 31 of 38 QCMTM
Significance
Measurement
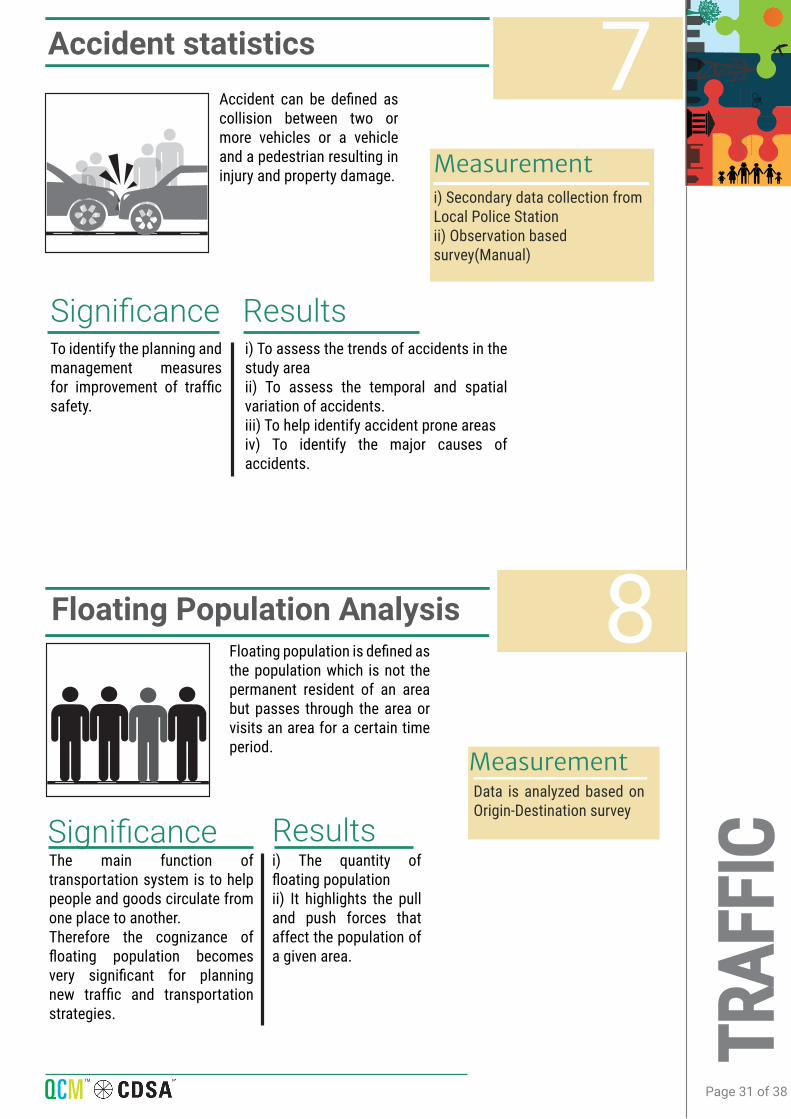
The main function of transportation system is to help people and goods circulate from one place to another.Therefore the cognizance of floating population becomes very significant for planning new traffic and transportation strategies.
Data is analyzed based on Origin-Destination survey
Floating Population Analysis Floating population is defined as the population which is not the permanent resident of an area but passes through the area or visits an area for a certain time period.
i) The quantity of floating populationii) It highlights the pull and push forces that affect the population of a given area.
Results
TRAF
FIC
SignificanceTo identify the planning and management measures for improvement of traffic safety.
Accident can be defined as collision between two or more vehicles or a vehicle and a pedestrian resulting in injury and property damage. Measurement
i) Secondary data collection from Local Police Stationii) Observation based survey(Manual)
i) To assess the trends of accidents in the study areaii) To assess the temporal and spatial variation of accidents.iii) To help identify accident prone areasiv) To identify the major causes of accidents.
Results
Accident statistics 7
8

Page 32 of 38 QCMTM
SignificanceWalking as a mode of transport for humans, is easy to promote, when the walkways are planned and made in such a way so as the children and the elderly can use them easily, it becomes easily usable for the whole population.
Walkable areas experience reduced automobile traffic and therefore reduced congestion and air pollution. When combined with public transport, these beneficial effects can spread over large areas.
Norms/ StandardsFootpath shall have a minimum width of 1.5m excluding unusable spaces around trees or other obstructions like building corners etc.• Increase width by 1 m for business and shopping areas• Minimum 3.5 m for footpaths adjoining shops• Minimum 4.5 m for long shopping areas
The extent to which the built environment is friendly to the presence of people living, shopping, visiting, enjoying or spending time and especially walking in an area.A residential area shall be ideally planned in such a way that children, the specially challenged and the elderly can move from one place to the other easily. It makes getting around easier for everyone and also avoids usage of automobiles for short trips.
WALKABILITY
Inst
rument & Units
MetersMeasuring Tape
?
Methodology
Make sure you have all the apparatus ready for carrying out the survey. Please use the field sheet provided. Read all
the instructions thoroughly.
Use the calibrated application from your mobile phone or the instrument required to collect
the readings.
Mention your name in the space provided and note
down the time.
Mark the presence or absence of footpaths and any obstacles using appropriate symbols as you walk along the road. Obstacles- Trees, electric poles, streetlights, distribution boxes, vendors or shop extensions, Pits, Garbage bins, benches
Identify and mark your location on the map in the field sheet from where you are going to take the
readings.
Fill up the field sheet with the data and the readings
collected.
1 2 3
4 65
In one direction
Pedestrian Count per HourIn both
directionsMinimum Footpath
Width (in M)
12002400 360048006000
8001600240032004000
1.522.534

Page 33 of 38 QCMTM
RESULTS• Quality of footpaths• Usability of footpaths• Potential improvements
to the existing footpaths
• Points of vulnerability for pedestrians
Level A Level B Level C Level D Level E Level F
Free Flow Relatively Free Flow Constricted Flow Congested Flow Restricted Flow Jammed roads
The walkability survey will help identify
• Pavement quality and material
• The roads with and without footpath
Outcome
StressesWalkability determines the ease of access to and moving around the neighbourhood, for various reasons like commute to and from work, to and from amenities, facilities, and services, children walking to and from school, playground etc. More walkable a neighbourhood, more likely are the people to walk and more the enviromental and social benefits as seen above.
AMBI
ENT
ENVI
RONM
ENT
Map 3. : Map generated for footpaths in a ward.
Health problems Traffic
Low efficiency & productivity
Pollution
Vehicle countinfrastructurehuman activities
Unplanned roadspoor public transportsignal timings breaking of lawsmovement
CAUSED BY
CAUSED BY
CAUSE
S CA
USES
AFFE
CTS
CAUSES
Page 34 of 38 QCMTM
AMBIENT LIGHT:
100 lx
TEMPERATURE:
26 C
AESTHETICS:
BEAUTIFUL
AMBIENT SOUND:
110 db AMBIENT SMELL:
NEUTRAL
TRAFFIC:
MODERATE
AIR POLLUTION:
MODERATE
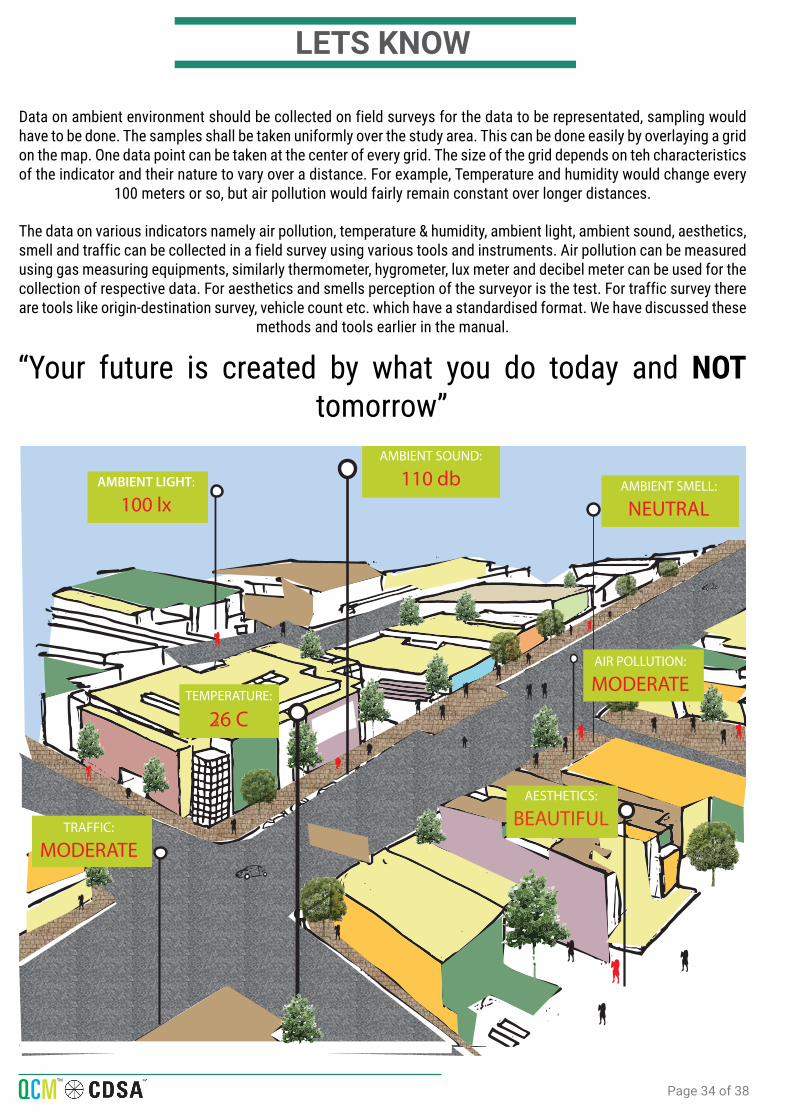
LETS KNOW
Data on ambient environment should be collected on field surveys for the data to be representated, sampling would have to be done. The samples shall be taken uniformly over the study area. This can be done easily by overlaying a grid on the map. One data point can be taken at the center of every grid. The size of the grid depends on teh characteristics of the indicator and their nature to vary over a distance. For example, Temperature and humidity would change every
100 meters or so, but air pollution would fairly remain constant over longer distances.
The data on various indicators namely air pollution, temperature & humidity, ambient light, ambient sound, aesthetics, smell and traffic can be collected in a field survey using various tools and instruments. Air pollution can be measured using gas measuring equipments, similarly thermometer, hygrometer, lux meter and decibel meter can be used for the collection of respective data. For aesthetics and smells perception of the surveyor is the test. For traffic survey there are tools like origin-destination survey, vehicle count etc. which have a standardised format. We have discussed these
methods and tools earlier in the manual.
“Your future is created by what you do today and NOT tomorrow”
Page 35 of 38 QCMTM
BIBLIOGRAPHYI. (May, 2009). Design Principle: Aesthetics. Healty spaces and places.II. Borthakur, M., & Nath, B. K. (Volume 2, Issue 11, November 2012). A Study of Changing Urban Landscape and Heat Island Phenomenon in Guwahati Metropolitan Area. International Journal of Scientific and Research Publications. III. Carlson, A. (2015). Environmental Aesthetics. The Stanford Encyclopedia of Philosophy .IV. Clark, L. (2015, june 8). London ‘stinkmap’ could change urban planning. Retrieved from http://www.wired.co.uk/maps.V. EIR. (July, 2004). Moreno Valley General Plan. VI. Garcia-Martí, I. (2014). A comparative study on VGI and professional noise data. AGILE’2014 International Conference on Geographic Information Science. Castellón.VII. Gerckens, L. C. (n.d.). Retrieved from http://plannersweb.com/.VIII. Hapala, A. (2010). Planning for an Aesthetic City.IX. Irene. (2013). Noise Battle: A Gamified application for Environmental Noise Monitoring in Urban Areas. AGILE 2013. Leuven.X. (June 2004). IV.C Aesthetics. City of El Segundo: Draft Environmental Impact Report.XI. Jovic, J. J. (n.d.). MODAL SPLIT MODELLING - SOME EXPERIENCE.XII. MacDonald, M. Future Cities Existing Buildings Solving the Conundrum Urban Heat Sharing. XIII. Matzarakis, A. Integration of climate issues in urban planning – the example of Freiburg. Freiburg.XIV. Mclean, K. (n.d.). Smellscape: exploring & sharing urban olfactory experiences.XV. Nicola. ( January 3, 2012). Smell-designing Sheffield.XVI. Paetzold, H. (2013, March 18). The Aesthetics of City Strolling. Retrieved from www. contenporartyaesthetics.org.XVII. Poland, D. J. (n.d.). Aesthetics, Design, and New Urbanism. Connecticut.XVIII. Quercia, D. (2014). Smelly Maps: The Digital Life of Urban Smellscapes. Proceedings of the Ninth International AAAI Conference on Web and Social Media. XIX. Sample Employee Travel Survey. Workplace Travel Plans - A Guide for Implementers.XX. SMARDON, R. C. (1988). Perception and Aesthetics of the Urban Environment: Review of the role of vegetation. Landscape and Urban Planning, , 85-106.XXI. Statistics, B. o. (2011). 2011 Transport Customer Survey. NSW Government.XXII. Turton, P., & Coppel, A. (29 May 2014). Urban Heat Risk Mapping. Arup.XXIII. Victoria Henshaw. (2012). Fragrant Cities – Relationships between smell and urban environments. Retrieved from [email protected]. Wong, N., Samsudin, R., Jusuf, S., Eliza, A., & Ignatius, M. (2011). A CLIMATIC RESPONSIVE URBAN PLANNING MODEL FOR HIGH DENSITY CITY: SINGAPORE’S COMMERCIAL DISTRICT. Global Visions: Risks and Opportunities for the Urban Planet. National University of Singapore, Department of Architecture: The 5th International Conference of the International Forum on Urbanism (IFoU).XXV. Zagnoli, O. (2013, october 25). Scent and the City.XXVI. Abha Narain Lambah Associates, n.d. A N L Associates. [Online] Available at: http://www. anlassociates.com/publications/books-publications [Accessed 2015].XXVII. Anderson, S., 2015. Minor Architecture. [Online] Available at: http://map.minorarchitecture. org/ [Accessed 12 May 2015].XXVIII. Anon., 2000. THE NOISE POLLUTION (REGULATION AND CONTROL) RULES, Pune: Government of India.XXIX. Anon., 2014. The Methods of Participatory Management for the Istanbul Land Walls World Heritage Site. Gardens on the edge.

Page 36 of 38 QCMTM
XXX. Anon., 2015. Central Pollution Control Board. [Online] Available at: http://cpcb.nic.in/Noise_Standards.php [Accessed 12 May 2015].XXXI. Anon., n.d. Synergy Enviro Engineers. [Online] Available at: http://www.synergyenviron.com/tools/solar_ insolation.asp?loc=Pune,Maharashtra,India [Accessed 12 May 2015].XXXII. CEE, 2012. Street Furniture and Amenity Design Menu Card for Citizens For use in Participatory Budgeting, s.l.: CEE.XXXIII. Chapagain, N. K., 2011. Rethinking participatory process in heritage conservation. XXXIV. Committee, Hon’ble High Court of Karnataka, 2011. Preservation of Lakes in the City of Bangalore, Bangalore: Committee, Hon’ble High Court of Karnataka.XXXV. CPCB, May, 2008. GUIDELINES ON ODOUR POLLUTION & ITS CONTROL, Delhi: CPCB.XXXVI. D. Saha, K. K. F. R. D. G. K. R. A. K. S. M., 2009. Montioring of Noise Levels at selected Cities in North India. Indian Journal of Air Pollution, March, pp. pp90-98.XXXVII. Department of Economic Sciences and CreaM, 2006. Cities are Fun. Aesthetic Preferences and Urban Landscapes., s.l.: Department of Economic Sciences and CreaM. XXXVIII. European Educational Research Association, n.d. EERA. [Online] Available at: http://www.eera-ecer. de/ecer-programmes/conference/19/contribution/33217/ [Accessed 2015].XXXIX. Finegold, L. S., March, 2011. Guidelines for Community Noise Impact, s.l.: I-INCE.XL. Johnson, C., 2011. Tactical Urbanism. [Online] Available at: http://www.dreamhamar. org/2011/09/about-tactical-urbanism/ [Accessed May 2015].XLI. Keswani, K., 2014. Placemaking workshop at Gandhi Bazaar. Everyday City, 01 June. XLII. Lukas Ruge, B. A. A. S., n.d. SoundOfTheCity - Continuous Noise Monitoring for a Healthy City, Lubeck, Germany: University of Lubeck.XLIII. Mahesh, A., 2015. Asshwin Mahesh. [Online] Available at: http://ashwinmahesh.in/ideas.htmXLIV. Michael Hartfield, S. K., 2003. A participatory approach to the assessment of built Wellington, Aotearoa/ New Zealand. 46(67), pp. 67-72.XLV. MIGA, n.d. ParticipatoryWater Monitoring, s.l.: CAO.XLVI. Mural Arts Program, n.d. City of Philadelphia, Mural Arts Program. [Online] Available at: http://muralarts.org/programs/restored-spaces-environmental-projects [Accessed 2015].XLVII. National Recreation and Park Association, 2011. Rejuvenating Neighborhoods and Communities Through Parks—A Guide To Success, s.l.: National Recreation and Park Association.XLVIII. Pamela Woolner, S. M. C. K. W., n.d. Sage Pub. [Online] Available at: http://imp.sagepub.com/ content/15/1/45.abstract [Accessed 2015].XLIX. Rosso, R. D., 2014. Case Study on Odour Measurements in India. Chemical Engineering Transaction (CEt), p. Vol. 40.L. Sanches, M. G., n.d. Co-design in Public Spaces: an Interdisciplinary Approach to Street Furniture Development, s.l.: Carleton University, Canada.LI. Social Mapping (2014) Referenced. LII. SPUR Urban Center, 2013. SPUR. [Online] Available at: http://www.spur.org/ exhibitions/2013-07-14/adapttransformreuse [Accessed 2015].LIII. SPUR, 2014. SPUR- Ideas and Action for a better city. [Online] Available at: http://www.spur. org/exhibitions/2014-01-30/urban-olfactory [Accessed 17 May 2015].LIV. ToI, 2013. Residents rescue lake from jaws of death. ToI, 14 July. LV. Traffic Infra Tech, 2013. Desinging better pedestrian infrastructure? a participatory approach.. [Online] Available at: http://www.trafficinfratech.com/designing-better-pedestrian- infrastructure-%E2%80%93-a-participatory-approach-2/ [Accessed May 2015].LVI. Ukiah Valley, 2012. Anton Stadium. [Online] Available at: http://www.antonstadium.com/ [Accessed May 2015].
Page 37 of 38 QCMTM
LVII. Zeiger, M., 2011. The Interventionist’s Toolkit. [Online] Available at: https://placesjournal.org/ article/the-interventionists-toolkit/ [Accessed May 2015].LVIII. Agarwal, O. P., 2006. URBAN TRANSPORT: India Infrastructure Report 2006, s.l.: s.n.LIX. Anmol Soni, A. C., 2014. Governance of the Petroleum and Natural Gas Sector in India: A Status Note, s.l.:TERI - NFA.LX. Bedoshruti Sadhukhan, R. T. a. S. C., 2012. ACCESS Sanitation: Case Study: Alandur Municipality, Tamil Nadu, s.l.: ICLEI – Local Governments for Sustainability - South Asia.LXI. CEPT, 2013. Promoting Low Carbon Transport in India, s.l.: UNEP.LXII. Chandrasekaran, Y., 2015. CLEANLINESS DRIVE IN DODDANEKUNDI Students conduct door to door drive, street plays to change their neighborhoods!. [Online] LXIII. Available at: http://bangalore.citizenmatters.in/articles/young-minds-take-lead-in-changing- their neighborhoods [Accessed 25 May 2015].LXIV. Cities, T. N. o., n.d. The Nature of Cities. [Online] Available at: http://www.thenatureofcities. com/roundtable [Accessed 12 May 2015].LXV. CONVENTION ON BIOLOGICAL DIVERSITY, 2007. REPORT OF THE CITIES AND BIODIVERSITY: ACHIEVING THE 2010 BIODIVERSITY TARGET, CURITIBA BRAZIL: UNEP.LXVI. CRISIS, T. E. P. P. M. O. S. I. A. T. O., n.d. THE ECOTIPPING POINTS PROJECT: MODELS OF SUCCESS IN A TIME OF CRISIS. [Online] Available at: http://ecotippingpoints.org/our- stories/indepth/usa-new-york community-garden-urban-renewal.htmlLXVII. Foundation), V. S. (. S., n.d. SSWM sustainable sanitation and water management. [Online] Available at: http://www.sswm.info/content/case-study-raipur [Accessed 25 May 2015].LXVIII. Gardner†, S. S. a. J., 2006. Local knowledge in community-based approaches to medicinal plant conservation: lessons from India. [Online] Available at: http://www.ethnobiomed.com/ content/2/1/20 [Accessed 12 May 2015].LXIX. Gogate, N. G. & Rawal, P. M., 2012. Sustainable Stormwater Management in Developing and Developed Countries: A Review, s.l.: Proc. of Int. Conf. on Advances in Design and Construction of Structures 2012.LXX. I.V. Saradhi, G. P. a. V. P., 2009. Energy Supply, Demand and Environmental Analysis – A Case Study of Indian Energy Scenario, s.l.: International Journal of Civil and Environmental Engineering 1:3 2009.LXXI. IDFC, 2009. Power distribution reforms in Gujarat, s.l.: IDFC.LXXII. Jaeger, D. J., 2011. USER’S MANUAL FOR THE CITY BIODIVERSITY INDEX , s.l.: European Environment Agency & Swiss Federal Office for the Environment (2011): Landscape fragmentation in Europe. .LXXIII. Kumala Sari, P. P., n.d. PARTICIPATORY MONITORING OF SANITATION: THE CASE OF WOTAWATI HAMLET, PUCUNG – INDONESIA, Jakarta, Indonesia : CALTECH.LXXIV. LTD., H. P. C., n.d. CITIZEN’S / CLIENT’S Charter, s.l.: s.n.LXXV. Ma, B. S. S. A. Y., 2005. IMPROVEMENT AND MAINTENANCE MANAGEMENT OF PUBLIC TOILETS IN LIUZHOU: A STUDY , s.l.: The World Bank.LXXVI. P. S. Kharola, G. T. a. D. M. I. I. o. T. D., 2010. Traffic Safety and City Public Transport System: Case Study of Bengaluru, India, s.l.: Journal of Public Transportation.LXXVII. Postma, C. v. W. a. L., 2003. M PA a new methodology for participatory monitoring, s.l.: Water Lines.LXXVIII. Power & Energy Division, Planning Commission, Government of India, 2011. Annual Report 2011- 2012 on The Working of State Power Utilities & Electricity Departments, s.l.: Power & Energy Division, Planning Commission, Government of India.LXXIX. Roychowdhury, A., 2012. Parking Policy: Case Study of Delhi, s.l.: CENTER OF SCIENCE AND ENVIRONMENT.

Page 38 of 38 QCMTM
LXXX. Tare, D. V., 2010. Sewage Treatment in Class I Towns: Recommendations and Guidelines, s.l.: IIT Kanpur.LXXXI. TELECOM REGULATORY AUTHORITY OF INDIA , 2014. Report on Audit and Assesment of Quality of Service of Cellular Mobile Telephone Services for South Zone Andhra Pradesh, Andhra Pradesh:TELECOM REGULATORY AUTHORITY OF INDIA .LXXXII. Telecom Regulatory Authority of India, 2013. The Indian Telecom Services Performance Indicators, New Delhi: Telecom Regulatory Authority of India.LXXXIII. TERI, n.d. CLIMATE RESILIENT INFRASTRUCTURE SERVICES CASE STUDY BRIEF: PANAJI, s.l.: TERI.LXXXIV. Tiel, K. D., 2014-15. SPUR Ideas and Action for a Better City. [Online] Available at: http//www.spur.org/ exhibitions/2014-07-10/future-proof-water [Accessed 25 May 2015].LXXXV. WATER AND SANITATION PROGRAM, n.d. SUSTAINABILITY PLANNING AND MONITORING IN COMMUNITY WATER SUPPLY AND SANITATION, s.l.: INTERNATIONAL WATER AND SANITATION PROGRAM.LXXXVI. Integrated Publishing Inc., n.d. Integrated Publishing. [Online] Available at: http:// medical.tpub.com/14295/css/14295_144.htm [Accessed June 2015].LXXXVII. United Nations, n.d. UN Data: A World of Information. [Online] Available at: https:// data.un.org/Glossary.aspx?q=air+pollution[Accessed 19 June 2015].LXXXVIII. Frank LD, S. J. (2009). The development of a walkability index: application to the Neighborhood Quality of Life Study. NCBI.LXXXIX. World Health Organiation, n.d. World Health Organiation. [Online] Available at: http://www.who.int/ topics/air_pollution/en/[Accessed 19 June 2015].