hamilton capital global bank etf€¦ · financial statements ... hedge some or all of the etf’s...
TRANSCRIPT

Hamilton Capital Global Bank ETF(HBG, HBG.U:TSX)
Interim Report | June 30, 2018
www.hamilton-capital.com
101621 - Hamilton HBG.indd 1 2018-08-10 9:15 AM
ContentsMANAGEMENT REPORT OF FUND PERFORMANCE
Management Discussion of Fund Performance . . . . . . . . . . . . . . . . . . . . . 1
Financial Highlights . . . . . . . . . . . . . . . . . . . . . . . . . . . . . . . . . . . . . . . . . . . . . . . 6
Past Performance . . . . . . . . . . . . . . . . . . . . . . . . . . . . . . . . . . . . . . . . . . . . . . . . . . 9
Summary of Investment Portfolio . . . . . . . . . . . . . . . . . . . . . . . . . . . . . . . . . 10
MANAGER’S RESPONSIBILITY FOR FINANCIAL REPORTING . . . . . . . . . . . . 12
FINANCIAL STATEMENTS
Statements of Financial Position . . . . . . . . . . . . . . . . . . . . . . . . . . . . . . . . . . 13
Statements of Comprehensive Income . . . . . . . . . . . . . . . . . . . . . . . . . . . . 14
Statements of Changes in Financial Position . . . . . . . . . . . . . . . . . . . . . . . 15
Statements of Cash Flows . . . . . . . . . . . . . . . . . . . . . . . . . . . . . . . . . . . . . . . . . 16
Schedule of Investments . . . . . . . . . . . . . . . . . . . . . . . . . . . . . . . . . . . . . . . . . . 17
Notes to Financial Statements . . . . . . . . . . . . . . . . . . . . . . . . . . . . . . . . . . . . 20
101621 - Hamilton HBG.indd 3 2018-08-10 9:15 AM

1
Hamilton Capital Global Bank ETF
MANAGEMENT REPORT OF FUND PERFORMANCE
This interim management report of fund performance for Hamilton Capital Global Bank ETF (“HBG” or the “ETF”) contains �nancial highlights and is included with the unaudited interim �nancial statements for the investment fund. You may request a copy of the investment fund’s unaudited interim or audited annual �nancial statements, interim or annual management report of fund performance, current proxy voting policies and procedures, proxy voting disclosure record or quarterly portfolio disclosures, at no cost, by calling (416) 941-9888, by writing to Hamilton Capital Partners Inc. (“Hamilton Capital” or the “Manager”), at 55 York Street, Suite 1202, Toronto, Ontario, M5J 1R7, by visiting our website at www.hamilton-capital.com or through SEDAR at www.sedar.com.
This document may contain forward-looking statements relating to anticipated future events, results, circumstances, per-formance, or expectations that are not historical facts but instead represent our beliefs regarding future events. By their nature, forward-looking statements require us to make assumptions and are subject to inherent risks and uncertainties. There is signi�cant risk that predictions and other forward-looking statements will not prove to be accurate. We caution readers of this document not to place undue reliance on our forward-looking statements as a number of factors could cause actual future results, conditions, actions or events to di�er materially from the targets, expectations, estimates or intentions expressed or implied in the forward-looking statements.
Actual results may di�er materially from management expectations as projected in such forward-looking statements for a variety of reasons, including but not limited to market and general economic conditions, interest rates, regulatory and statutory developments, the e�ects of competition in the geographic and business areas in which the ETF may invest and the risks detailed from time to time in the ETF’s simpli�ed prospectus. New risk factors emerge from time to time and it is not possible for management to predict all such risk factors. We caution that the foregoing list of factors is not exhaustive, and that when relying on forward-looking statements to make decisions with respect to investing in the ETF, investors and others should carefully consider these factors, as well as other uncertainties and potential events, and the inherent uncertainty of forward-looking statements. Due to the potential impact of these factors, the Manager does not under-take, and speci�cally disclaims, any intention or obligation to update or revise any forward-looking statements, whether as a result of new information, future events or otherwise, unless required by applicable law.
Management Discussion of Fund Performance
Investment Objective and Strategy
The investment objective of HBG is to seek long-term total returns consisting of long-term capital appreciation and regular dividend income from an actively managed portfolio comprised primarily of equity securities of banks and other deposit-taking institutions located anywhere around the globe.
The ETF seeks to achieve its investment objective by investing in a portfolio of equity securities across the global bank-ing sector. By investing worldwide, Hamilton Capital, as the ETF’s portfolio adviser (the “Portfolio Adviser”), aims to take advantage of the most attractive opportunities in global banking, while reducing country-speci�c and concentration risks. The ETF’s portfolio is anticipated to include approximately 40-60 banks and other deposit-taking institutions, from over 10 countries, with a geographic split of roughly 50% U.S./Canada, 25% Europe and 25% other countries. However, the number of positions and percentages by region may vary based on the Portfolio Adviser’s assessment of the most attractive risk/reward opportunities. For certain markets, investments will be made predominantly in American Deposi-tory Receipts (“ADRs”). HBG’s investments may be selected from any country, subsector or capitalization level of the global banking sector. The Portfolio Adviser may, at its discretion, hedge some or all of the ETF’s non-Canadian dollar currency exposure.
101621 - Hamilton HBG.indd 1 2018-08-10 9:15 AM

2
Hamilton Capital Global Bank ETF
Management Discussion of Fund Performance (continued)
The Portfolio Adviser’s investment strategies consider both top-down themes as well as bottom-up analysis. Top-down themes may include, but are not limited to, favourable gross domestic product (GDP) growth, in�ation and interest trends, �scal and monetary policies, and regulatory trends. The Portfolio Adviser’s bottom-up investment process is pri-marily based on fundamental research, as well as quantitative and technical factors. Investment decisions are ultimately based on an understanding of a company, its business, and its expected outlook, including earnings growth, asset quality, capital and reserves, as well as business mix and dividend policy. The Portfolio Adviser monitors and reviews HBG’s invest-ments on an ongoing basis to try to ensure the best relative values are identi�ed.
Risk
Investments in the units of the ETF can be speculative, involve a degree of risk and are suitable only for persons who are able to assume the risk of losing their entire investment. The Manager, as a summary for existing investors, is providing the list below of the risks to which an investment in the ETF may be subject. Prospective investors should read the ETF’s prospectus and consider the full description of the risks contained therein before purchasing units.
The risks to which an investment in the ETF is subject are listed below and have not changed from the list of risks found in the ETF’s prospectus. A full description of each risk listed below may also be found in the prospectus. The prospectus is available at www.hamilton-capital.com or from www.sedar.com, or by contacting Hamilton Capital Partners Inc. directly via the contact information on the back page of this document.
• No assurance of meeting investment objective• Market risk• Speci�c issuer risk• Equity risk• Short selling risk• Legal and regulatory risk• Investing outside of North America• Performance of banks and �nancial institutions• Changes in the regulatory environment in global
�nancial services sector• Foreign stock exchange risk• Foreign markets risk• Currency price �uctuations• Currency exposure risk• Real estate investment trust (REIT) investment risk• Emerging markets risk• Derivatives risk• Use of options risk• Corresponding net asset value risk• Distributions risk• Designated broker/dealer risk
• Reliance on key personnel• Potential con�icts of interest• Counterparty risk• Cease trading of securities risk• No ownership interest• Exchange risk• Early closing risk• Redemption price• Concentration risk• Reliance on historical data risk• Small capitalization risk• Liquidity risk• Tax risk• Securities lending, repurchase and reverse repurchase
transaction risk• Fund of funds investment risk• Exchange-traded funds (ETF) risk• Loss of limited liability• Absence of an active market and lack of operating
history• No guaranteed return
101621 - Hamilton HBG.indd 2 2018-08-10 9:15 AM

3
Hamilton Capital Global Bank ETF
Management Discussion of Fund Performance (continued)
Results of Operations
For the six-month period ended June 30, 2018, the Canadian dollar (“Cdn$ units”) Class E units of the ETF returned 2.20%, when including distributions paid to unitholders. The U.S. dollar (“US$ units”) Class E units of the ETF returned -2.28%, including distributions paid to unitholders. Class E US$ units are not a separate class of units of the ETF, but rather, repre-sent the U.S. dollar value of the Class E Cdn$ units at the current day’s Canada/U.S. exchange rate.
By comparison, the KBW NASDAQ Global Bank Net Total Return Index, an equal weighted index that tracks the perfor-mance of 29 banks, from 12 di�erent countries, returned -5.54% during the period in Canadian dollar terms on a total return basis (-9.99% in U.S. dollars). The MSCI World Index, a broad market equity index with more than 1,000 positions, capturing large and mid-cap representation from 23 developed markets around the globe, returned 5.39% for the period in Canadian dollar terms on a total return basis (0.43% in U.S. dollars).
Global Market/Banking Sector Review
The year began much as 2017 ended: a rally in equity markets fuelled by continued optimism around the U.S. economic outlook. Positive economic momentum in the U.S. supported expectations for the U.S. Federal Reserve (the “Fed”) to con-tinue monetary policy normalization. At the start of the year, market participants expected three rate increases in 2018; by mid-year, the Fed had raised rates twice and provided forward guidance suggesting further increases. This helped U.S. banks (both large-cap and mid-cap) meaningfully outperform their global peers. Moreover, the roll-back of the Dodd-Frank bill was very favourable to the U.S. mid-cap banks, which were among the ETF’s best performers over the period. To-wards the end of the �rst half of 2018 (“H1”), the Fed released results from its Comprehensive Capital Analysis and Review (“CCAR”) which was generally positive with higher expected capital return.
In terms of expectations for monetary policy, other global central banks (including the Bank of Canada, Bank of Eng-land, and European Central Bank) also signalled a more hawkish stance. European bank stocks were volatile in H1 due to political uncertainty. Most prominent among these countries was Italy, where political parties advocating change to their countries’ relationship to the eurozone (or European Union) gained strength and representation. The Italian elections and an unanticipated no-con�dence motion against the Spanish Prime Minister (who was later forced out) resulted in Euro-pean bond yields rising and European bank stocks trending lower. The U.K. made slow progress on Brexit negotiations with the European Union ahead of the March 2019 deadline.
In Australia, the Royal Commission hearings remained a headline risk for bank stocks. Investor sentiment turned negative towards emerging market banks on fears around rising global interest rates, lower liquidity and growing political risk as key emerging markets headed to critical elections with unpredictable outcomes. Indian banks, supported by strong gross domestic product (“GDP”) growth, outperformed global and emerging market peers in the �rst half of the year.
Portfolio Review
The ETF invests in global bank stocks with strong long-term prospects for earnings and attractive dividend yields. Since its inception, the ETF has held between 40-60 positions, with approximately 50% of the NAV invested in North America, 30% in Europe and the remainder in banks located elsewhere in the world, although this mix tends to vary materially as market conditions change.
A key contributor to performance in H1 was the ETF’s allocation to U.S. mid-cap bank stocks (~40% of NAV at the end of the period), which bene�ted from the bipartisan passage of the Dodd-Frank rollback bill and U.S. corporate tax reforms. In Europe (~30% of NAV), the diversi�ed portfolio mix mitigated country-speci�c risks even as market volatility rose on increased trade policy and political uncertainty. In India, a key emerging market, the ETF maintained selective exposure to private sector banks with well-capitalized balance sheets and strong gearing to regulatory reforms on asset quality.
101621 - Hamilton HBG.indd 3 2018-08-10 9:15 AM
4
Hamilton Capital Global Bank ETF
Management Discussion of Fund Performance (continued)
After an extended period of strength in the Canadian dollar, the Manager reduced some currency hedges, in particular against the U.S. dollar, which was bene�cial to the ETF’s returns.
Outlook
While global markets have entered the second half of 2018 with increased trade policy-related uncertainty, the Manager continues to expect favourable trends in GDP growth, �scal policy, monetary policy, and regulation to provide a construc-tive backdrop to global bank stocks. The ETF continues to emphasize banks with higher earnings growth and regions with higher GDP growth, with a skew towards countries with central bank �exibility. The Manager believes that the ETF’s diversi�ed portfolio, both by geography and position, provide it with an attractive risk/return pro�le.
For additional comments on the global �nancial sector, please see the Insights section of the Manager’s website: www.hamilton-capital.com/insights.
Other Operating Items and Changes in Net Assets Attributable to Holders of Redeemable Units
For the six-month period ended June 30, 2018, the ETF generated gross comprehensive income (loss) from investments and derivatives of $1,227,898. This compares to $2,000,613 for the six-month period ended June 30, 2017. The ETF in-curred management, operating and transaction expenses of $838,870 (2017 – $422,594). Of these expenses, the Manager either paid or absorbed $14,900 (2017 – $83,556) on behalf of the ETF. The waiving and/or absorption of such fees and/or expenses by the Manager may be terminated at any time, or continued inde�nitely, at its discretion. The ETF distributed $759,463 (2017 – $470,665) to unitholders during the period.
Presentation
The attached �nancial statements have been prepared in accordance with International Financial Reporting Standards (“IFRS”). Any mention of total net assets, net assets, net asset value or increase (decrease) in net assets in the �nancial statements and/or management report of fund performance is referring to net assets or increase (decrease) in net assets attributable to holders of redeemable units as reported under IFRS.
Recent Developments
There are no recent industry, management or ETF related developments that are pertinent to the present and future of the ETF.
Related Party Transactions
Certain services have been provided to the ETF by related parties and those relationships are described below.
Manager, Trustee and Portfolio Adviser
The manager, trustee and portfolio adviser of the ETF is Hamilton Capital Partners Inc., 55 York Street, Suite 1202, Toronto, Ontario, M5J 1R7, a corporation incorporated under the laws of the Province of Ontario. The Manager has retained Hori-zons ETFs Management (Canada) Inc. (the “Administrator”), 55 University Avenue, Suite 800, Toronto, Ontario, M5J 2H7 to provide assistance to the Manager in respect of certain aspects of the day-to-day administration of the ETF.
101621 - Hamilton HBG.indd 4 2018-08-10 9:15 AM
5
Hamilton Capital Global Bank ETF
Management Discussion of Fund Performance (continued)
Any management fees paid to the Manager (described in detail on page 8) are related party transactions, as the Manager is considered to be a related party to the ETF. Fees paid to the Independent Review Committee are also considered to be related party transactions. Both the management fees and fees paid to the Independent Review Committee are disclosed in the statements of comprehensive income in the attached �nancial statements of the ETF. The management fees pay-able by the ETF as at June 30, 2018, and December 31, 2017, are disclosed in the statements of �nancial position.
101621 - Hamilton HBG.indd 5 2018-08-10 9:15 AM

6
Hamilton Capital Global Bank ETF
Financial Highlights
The following tables show selected key �nancial information about the ETF and are intended to help you understand the ETF’s �nancial performance since it e�ectively began operations on January 22, 2016. This information is derived from the ETF’s audited annual �nancial statements and the current unaudited interim �nancial statements. Please see the front page for information on how you may obtain the annual or interim �nancial statements.
The ETF’s Net Assets per Unit
Class EPeriod (1) 2018 2017 2016
Net assets, beginning of period $ 21.98 20.23 16.00
Increase from operations: Total revenue 0.41 0.60 0.55 Total expenses (0.21) (0.35) (0.34) Realized gains for the period 0.28 1.02 0.75 Unrealized gains (losses) for the period (0.38) 0.85 3.98
Total increase from operations (2) 0.10 2.12 4.94
Distributions: From net investment income (excluding dividends) (0.18) (0.22) (0.12) From dividends – (0.03) (0.02) From net realized capital gains – (0.68) (0.37)
Total distributions (3) (0.18) (0.93) (0.51)
Net assets, end of period (C$ units) (4) $ 22.29 21.98 20.23
Net assets, end of period (US$ units) (1)(4) $ 16.95 17.49 –
1. This information is derived from the ETF’s unaudited interim �nancial statements as at June 30, 2018, and the audited annual �nancial statements as at December 31 of the other years shown. The ETF e�ectively began operations on January 22, 2016. Class E units of the ETF began trading in U.S. dollars on August 15, 2017. Information is presented in accordance with IFRS.
2. Net assets per unit and distributions are based on the actual number of units outstanding at the relevant time. The increase (decrease) from operations is based on the weighted average number of units outstanding over the �nancial period.
3. Income, dividend and/or return of capital distributions, if any, are paid in cash, reinvested in additional units of the ETF, or both. Capital gains distributions, if any, may or may not be paid in cash. Non-cash capital gains distributions are reinvested in additional units of the ETF and subsequently consolidated. They are reported as taxable distributions and increase each unitholder’s adjusted cost base for their units. Neither the number of units held by the unitholder, nor the net asset per unit of the ETF change as a result of any non-cash capital gains distributions. Distributions clas-si�ed as return of capital, if any, decrease each unitholder’s adjusted cost base for their units. The characteristics of distributions, if any, are determined subsequent to the end of the ETF’s tax year. Until such time, distributions are classi�ed as from net investment income (excluding dividends) for reporting purposes.
4. The Financial Highlights are not intended to act as a continuity of the opening and closing net assets per unit.
101621 - Hamilton HBG.indd 6 2018-08-10 9:15 AM
7
Hamilton Capital Global Bank ETF
Financial Highlights (continued)
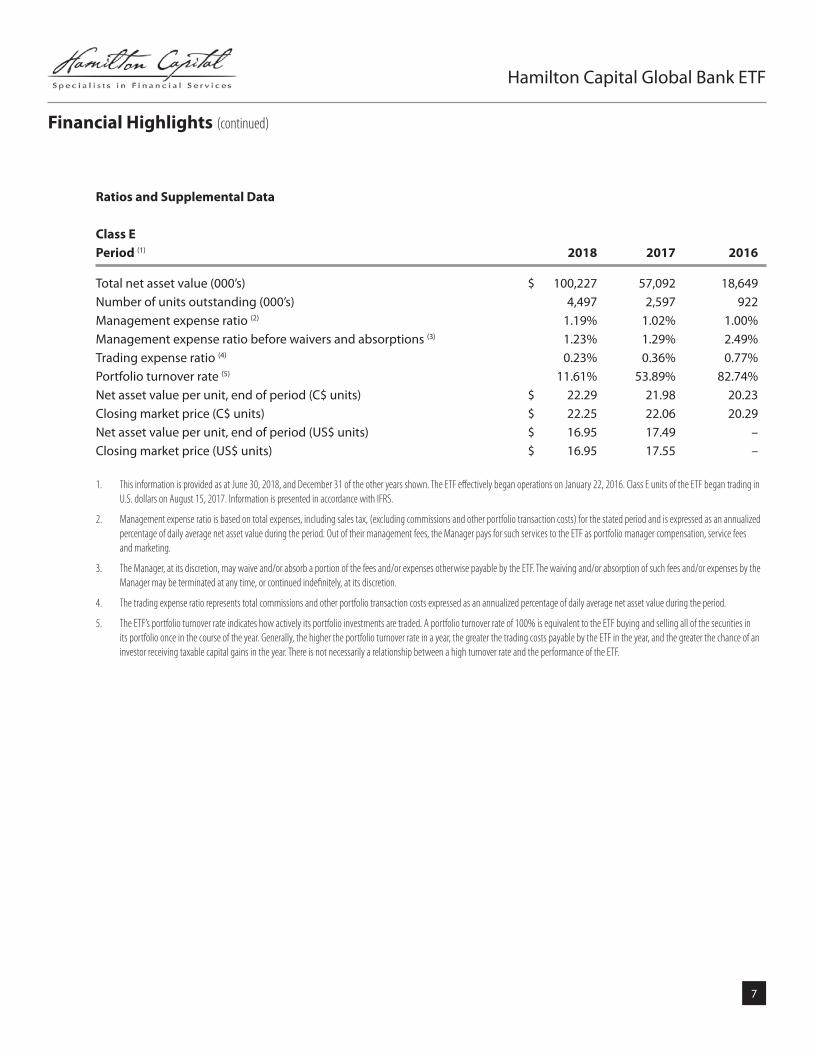
Ratios and Supplemental Data
Class EPeriod (1) 2018 2017 2016
Total net asset value (000’s) $ 100,227 57,092 18,649Number of units outstanding (000’s) 4,497 2,597 922Management expense ratio (2) 1.19% 1.02% 1.00%Management expense ratio before waivers and absorptions (3) 1.23% 1.29% 2.49%Trading expense ratio (4) 0.23% 0.36% 0.77%Portfolio turnover rate (5) 11.61% 53.89% 82.74%Net asset value per unit, end of period (C$ units) $ 22.29 21.98 20.23 Closing market price (C$ units) $ 22.25 22.06 20.29 Net asset value per unit, end of period (US$ units) $ 16.95 17.49 – Closing market price (US$ units) $ 16.95 17.55 –
1. This information is provided as at June 30, 2018, and December 31 of the other years shown. The ETF e�ectively began operations on January 22, 2016. Class E units of the ETF began trading in U.S. dollars on August 15, 2017. Information is presented in accordance with IFRS.
2. Management expense ratio is based on total expenses, including sales tax, (excluding commissions and other portfolio transaction costs) for the stated period and is expressed as an annualized percentage of daily average net asset value during the period. Out of their management fees, the Manager pays for such services to the ETF as portfolio manager compensation, service fees and marketing.
3. The Manager, at its discretion, may waive and/or absorb a portion of the fees and/or expenses otherwise payable by the ETF. The waiving and/or absorption of such fees and/or expenses by the Manager may be terminated at any time, or continued inde�nitely, at its discretion.
4. The trading expense ratio represents total commissions and other portfolio transaction costs expressed as an annualized percentage of daily average net asset value during the period.
5. The ETF’s portfolio turnover rate indicates how actively its portfolio investments are traded. A portfolio turnover rate of 100% is equivalent to the ETF buying and selling all of the securities in its portfolio once in the course of the year. Generally, the higher the portfolio turnover rate in a year, the greater the trading costs payable by the ETF in the year, and the greater the chance of an investor receiving taxable capital gains in the year. There is not necessarily a relationship between a high turnover rate and the performance of the ETF.
101621 - Hamilton HBG.indd 7 2018-08-10 9:15 AM

8
Hamilton Capital Global Bank ETF
Management Fees
The Manager provides, or oversees the provision of, administrative services required by the ETF including, but not limited to: negotiating contracts with certain third-party service providers, such as custodians, registrars, transfer agents, audi-tors and printers; authorizing the payment of operating expenses incurred on behalf of the ETF; arranging for the main-tenance of accounting records for the ETF; preparing reports to unitholders and to the applicable securities regulatory authorities; calculating the amount and determining the frequency of distributions by the ETF; preparing �nancial state-ments, income tax returns and �nancial and accounting information as required by the ETF; ensuring that unitholders are provided with �nancial statements and other reports as are required from time to time by applicable law; ensuring that the ETF complies with all other regulatory requirements, including the continuous disclosure obligations of the ETF under applicable securities laws; administering purchases, redemptions and other transactions in units of the ETF; and dealing and communicating with unitholders of the ETF. The Manager provides o�ce facilities and personnel to carry out these services, if not otherwise furnished by any other service provider to the ETF. The Manager also monitors the investment strategies of the ETF to ensure that the ETF complies with its investment objectives, investment strategies and investment restrictions and practices.
In consideration for the provision of these services, the Manager receives a monthly management fee at the annual rate of 0.85%, plus applicable sales taxes, of the net asset value of the ETF, calculated and accrued daily and payable monthly in arrears.
Any expenses of the ETF which are waived or absorbed by the Manager are paid out of the management fees received by the Manager.
The table below details, in percentage terms, the services received by the ETF from the Manager in consideration of the management fees paid during the period.
MarketingPortfolio management fees, general
administrative costs and pro�tWaived/absorbed expenses
of the ETF
7% 90% 3%
Financial Highlights (continued)
101621 - Hamilton HBG.indd 8 2018-08-10 9:15 AM

9
Hamilton Capital Global Bank ETF
Sales commissions, management fees and expenses all may be associated with an investment in the ETF. Please read the prospectus before investing. The indicated rates of return are the historical total returns including changes in unit value and reinvestment of all distributions, and do not take into account sales, redemptions, distributions or optional charges or income taxes payable by any investor that would have reduced returns. An investment in the ETF is not guaranteed. Its value changes frequently and past performance may not be repeated. The ETF’s performance numbers assume that all dis-tributions are reinvested in additional units of the ETF. If you hold this ETF outside of a registered plan, income and capital gains distributions that are paid to you increase your income for tax purposes whether paid to you in cash or reinvested in additional units. The amount of the reinvested taxable distributions is added to the adjusted cost base of the units that you own. This would decrease your capital gain or increase your capital loss when you later redeem from the ETF, thereby en-suring that you are not taxed on this amount again. Please consult your tax advisor regarding your personal tax situation.
Year-by-Year Returns
The following chart presents the ETF’s performance for the current interim reporting period and for the annual reporting periods for the prior years shown. In percentage terms, the chart shows how much an investment made on the �rst day of the �nancial period would have grown or decreased by the last day of the �nancial period.
2016 2017 2018HBG 29.11% 11.03% 2.20%
HBG.U 6.21% -2.28%
-5.00%
0.00%
5.00%
10.00%
15.00%
20.00%
25.00%
30.00%
Rate
of R
etur
n
The ETF e�ectively began operations on January 22, 2016. Class E units of the ETF began trading in U.S. dollars on August 15, 2017.
Past Performance
101621 - Hamilton HBG.indd 9 2018-08-10 9:15 AM

10
Hamilton Capital Global Bank ETF
Summary of Investment PortfolioAs at June 30, 2018
% of ETF’sAsset Mix Net Asset Value Net Asset Value
Global Equities $ 50,167,038 50.06%U.S. Equities 44,633,101 44.53%Canadian Equities 5,304,260 5.29%Currency Forward Hedge* 235,241 0.23%Cash and Cash Equivalents 1,356,310 1.35%Other Assets less Liabilities (1,469,436) -1.46%
$ 100,226,514 100.00%
% of ETF’sSector Mix Net Asset Value Net Asset Value
Financials $ 100,104,399 99.88%Currency Forward Hedge* 235,241 0.23%Cash and Cash Equivalents 1,356,310 1.35%Other Assets less Liabilities (1,469,436) -1.46%
$ 100,226,514 100.00%
* Positions in forward contracts are disclosed as the gain/(loss) that would be realized if the contracts were closed out on the date of this report.
101621 - Hamilton HBG.indd 10 2018-08-10 9:15 AM

11
Hamilton Capital Global Bank ETF
% of ETF’sTop 25 Holdings Net Asset Value
HDFC Bank Ltd., ADR 3.21%F.N.B. Corp. 2.99%Sterling Bancorp 2.99%SVB Financial Group 2.84%CaixaBank SA 2.71%Credit Suisse Group AG 2.67%Western Alliance Bancorp 2.65%IBERIABANK Corp. 2.61%Bank of the Ozarks 2.59%DNB ASA 2.39%ICICI Bank Ltd., ADR 2.28%PacWest Bancorp 2.25%Home Bancshares Inc. 2.24%Banco Santander (Mexico) SA, ADR 2.22%Canadian Imperial Bank of Commerce 2.19%Sberbank of Russia PJSC, ADR 2.19%Danske Bank AS 2.12%Ing Groep NV 2.12%FCB Financial Holdings Inc. 2.09%KeyCorp 2.07%First Horizon National Corp. 2.06%JPMorgan Chase & Co. 2.02%DBS Group Holdings Ltd. 2.01%Barclays PLC 2.01%Intesa Sanpaolo SPA 1.94%
The summary of investment portfolio may change due to the ongoing portfolio transactions of the ETF. The most recent �nancial statements are available at no cost by calling (416) 941-9888, by writing to us at 55 York Street, Suite 1202, Toronto, Ontario, M5J 1R7, by visiting our website at www.hamilton-capital.com or through SEDAR at www.sedar.com.
Summary of Investment Portfolio (continued)As at June 30, 2018
101621 - Hamilton HBG.indd 11 2018-08-10 9:15 AM
12
Hamilton Capital Global Bank ETF
MANAGER’S RESPONSIBILITY FOR FINANCIAL REPORTING
The accompanying unaudited interim �nancial statements of Hamilton Capital Global Bank ETF (the “ETF”) are the responsibil-ity of the manager and trustee to the ETF, Hamilton Capital Partners Inc. (the “Manager”). They have been prepared in ac-cordance with International Financial Reporting Standards using information available and include certain amounts that are based on the Manager’s best estimates and judgments.
The Manager has developed and maintains a system of internal controls to provide reasonable assurance that all as-sets are safeguarded and to produce relevant, reliable and timely �nancial information, including the accompanying �nancial statements.
These �nancial statements have been approved by the Board of Directors of the Manager.
________________________ ________________________Robert Wessel Jennifer MersereauDirector DirectorHamilton Capital Partners Inc. Hamilton Capital Partners Inc.
NOTICE TO UNITHOLDERS
The Auditors of the ETF have not reviewed these Financial Statements.
Hamilton Capital Partners Inc., the Manager of the ETF, appoints an independent auditor to audit the ETF’s annual �nancial statements.
The ETF’s independent auditors have not performed a review of these interim �nancial statements in accordance with Cana-dian generally accepted auditing standards.
101621 - Hamilton HBG.indd 12 2018-08-10 9:15 AM

13
Hamilton Capital Global Bank ETF
Statements of Financial Position (unaudited)As at June 30, 2018 and December 31, 2017
2018 2017
AssetsCash and cash equivalents $ 1,356,310 $ 858,856 Investments 100,104,399 56,734,397 Amounts receivable relating to accrued income 444,795 91,044 Amounts receivable relating to portfolio assets sold 856,919 –Derivative assets (note 3) 235,241 131,019
Total assets 102,997,664 57,815,316
LiabilitiesAccrued management fees 81,757 46,487 Accrued operating expenses 18,420 9,790 Amounts payable for portfolio assets purchased 2,311,210 286,491 Distribution payable 359,763 363,575 Derivative liabilities (note 3) – 16,993
Total liabilities 2,771,150 723,336
Total net assets (note 2) $ 100,226,514 $ 57,091,980
Number of redeemable units outstanding, Class E (note 8) 4,497,037 2,596,966 Total net assets per unit (C$ units) (note 1) $ 22.29 $ 21.98 Total net assets per unit (US$ units) (note 1) $ 16.95 $ 17.49
(See accompanying notes to �nancial statements)
Approved on behalf of the Board of Directors of the Manager:
______________________ _______________________Robert Wessel Jennifer MersereauDirector Director
101621 - Hamilton HBG.indd 13 2018-08-10 9:15 AM

14
Hamilton Capital Global Bank ETF
Statements of Comprehensive Income (unaudited)For the Periods Ended June 30, 2018 and 2017
2018 2017
IncomeDividend income $ 1,641,143 $ 723,232 Securities lending income (note 7) 2,857 –Net realized gain on sale of investments and derivatives 1,123,248 856,432 Net realized gain on foreign exchange 10,446 14,106 Net change in unrealized appreciation (depreciation) of investments and derivatives (1,558,186) 407,605 Net change in unrealized appreciation (depreciation) of foreign exchange 8,390 (762)
1,227,898 2,000,613
ExpensesManagement fees (note 9) 426,431 172,658 Audit fees 22,187 29,067 Independent Review Committee fees 2,793 4,189 Custodial fees 19,065 11,414 Legal fees 38,989 –Securityholder reporting costs 17,719 12,719 Administration fees 26,376 35,506 Transaction costs 102,311 84,318 Withholding taxes 182,399 72,717 Other expenses 600 6
838,870 422,594
Amounts that were payable by the investment fund that were paid or absorbed by the Manager (14,900) (83,556)
823,970 339,038
Increase in net assets for the period $ 403,928 $ 1,661,575
Increase in net assets per unit, Class E $ 0.10 $ 0.95
(See accompanying notes to �nancial statements)
101621 - Hamilton HBG.indd 14 2018-08-10 9:15 AM

15
Hamilton Capital Global Bank ETF
Statements of Changes in Financial Position (unaudited)For the Periods Ended June 30, 2018 and 2017
2018 2017
Total net assets at the beginning of the period $ 57,091,980 $ 18,649,379
Increase in net assets 403,928 1,661,575 Redeemable unit transactions Proceeds from the issuance of securities of the investment fund 48,094,699 25,998,038 Aggregate amounts paid on redemption of securities of the investment fund (4,606,212) – Securities issued on reinvestment of distributions 1,582 732 Distributions: From net investment income (759,463) (470,665)
Total net assets at the end of the period $ 100,226,514 $ 45,839,059
(See accompanying notes to �nancial statements)
101621 - Hamilton HBG.indd 15 2018-08-10 9:15 AM

16
Hamilton Capital Global Bank ETF
2018 2017
Cash �ows from operating activities:Increase in net assets for the period $ 403,928 $ 1,661,575 Adjustments for:
Net realized gain on sale of investments and derivatives (1,123,248) (856,432)Net realized gain on currency forward contracts 35,480 3,106 Net change in unrealized depreciation (appreciation) of investments and derivatives 1,558,186 (407,605)Net change in unrealized depreciation (appreciation) of foreign exchange (522) 207 Purchase of investments (52,128,347) (33,490,139)Proceeds from the sale of investments 9,334,512 7,739,961 Amounts receivable relating to accrued income (353,751) (98,782)Accrued expenses 43,900 24,196
Net cash used in operating activities (42,229,862) (25,423,913)
Cash �ows from �nancing activities:Amount received from the issuance of units 48,094,699 25,998,038 Amount paid on redemptions of units (4,606,212) –Distributions paid to unitholders (761,693) (304,460)
Net cash from �nancing activities 42,726,794 25,693,578
Net increase in cash and cash equivalents during the period 496,932 269,665 E�ect of exchange rate �uctuations on cash and cash equivalents 522 (207)
Cash and cash equivalents at beginning of period 858,856 676,272
Cash and cash equivalents at end of period $ 1,356,310 $ 945,730
Dividends received, net of withholding taxes $ 1,104,993 $ 551,733
(See accompanying notes to �nancial statements)
Statements of Cash Flows (unaudited)For the Periods Ended June 30, 2018 and 2017
101621 - Hamilton HBG.indd 16 2018-08-10 9:15 AM
17
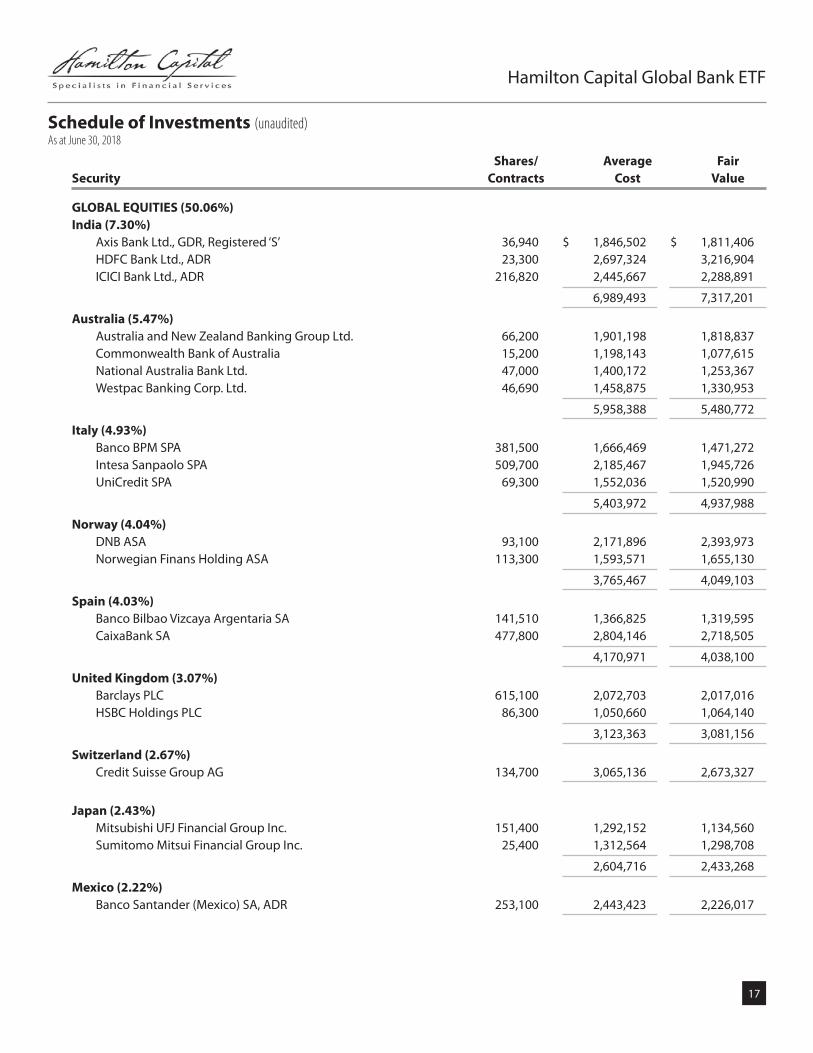
Shares/ Average Fair Security Contracts Cost Value
GLOBAL EQUITIES (50.06%) India (7.30%)
Axis Bank Ltd., GDR, Registered ‘S’ 36,940 $ 1,846,502 $ 1,811,406 HDFC Bank Ltd., ADR 23,300 2,697,324 3,216,904 ICICI Bank Ltd., ADR 216,820 2,445,667 2,288,891
6,989,493 7,317,201
Australia (5.47%) Australia and New Zealand Banking Group Ltd. 66,200 1,901,198 1,818,837 Commonwealth Bank of Australia 15,200 1,198,143 1,077,615 National Australia Bank Ltd. 47,000 1,400,172 1,253,367 Westpac Banking Corp. Ltd. 46,690 1,458,875 1,330,953
5,958,388 5,480,772
Italy (4.93%) Banco BPM SPA 381,500 1,666,469 1,471,272 Intesa Sanpaolo SPA 509,700 2,185,467 1,945,726 UniCredit SPA 69,300 1,552,036 1,520,990
5,403,972 4,937,988
Norway (4.04%) DNB ASA 93,100 2,171,896 2,393,973 Norwegian Finans Holding ASA 113,300 1,593,571 1,655,130
3,765,467 4,049,103
Spain (4.03%) Banco Bilbao Vizcaya Argentaria SA 141,510 1,366,825 1,319,595 CaixaBank SA 477,800 2,804,146 2,718,505
4,170,971 4,038,100
United Kingdom (3.07%) Barclays PLC 615,100 2,072,703 2,017,016
HSBC Holdings PLC 86,300 1,050,660 1,064,140
3,123,363 3,081,156
Switzerland (2.67%) Credit Suisse Group AG 134,700 3,065,136 2,673,327
Japan (2.43%)
Mitsubishi UFJ Financial Group Inc. 151,400 1,292,152 1,134,560 Sumitomo Mitsui Financial Group Inc. 25,400 1,312,564 1,298,708
2,604,716 2,433,268
Mexico (2.22%) Banco Santander (Mexico) SA, ADR 253,100 2,443,423 2,226,017
Schedule of Investments (unaudited)As at June 30, 2018
Hamilton Capital Global Bank ETF
101621 - Hamilton HBG.indd 17 2018-08-10 9:15 AM

18
Russia (2.19%) Sberbank of Russia PJSC, ADR 115,400 2,085,503 2,189,943
Denmark (2.12%)
Danske Bank AS 51,700 2,336,019 2,127,993
Netherlands (2.12%)
ING Groep NV 112,300 2,343,234 2,125,450
Singapore (2.01%)
DBS Group Holdings Ltd. 78,600 2,096,149 2,018,092
Austria (1.93%)
Erste Group Bank AG 35,300 1,818,605 1,937,445
France (1.32%)
Natixis SA 140,600 1,360,669 1,311,972
Chile (1.19%)
Banco Santander Chile, ADR 28,900 896,752 1,194,132
Portugal (1.02%)
Banco Comercial Portugues 2,594,000 1,059,599 1,025,079
TOTAL GLOBAL EQUITIES 51,521,459 50,167,038
U.S. EQUITIES (44.53%) Financials (44.53%)
Bank of the Ozarks 43,800 2,705,644 2,593,478 BankUnited Inc. 22,060 1,038,434 1,184,698 CenterState Banks Corp. 41,000 1,360,558 1,607,317 Chemical Financial Corp. 13,400 905,141 980,700 Citizens Financial Group Inc. 29,000 1,516,229 1,483,057 ConnectOne Bancorp Inc. 32,300 1,095,861 1,057,334 East West Bancorp Inc. 20,000 1,495,613 1,714,304 F.N.B. Corp. 170,000 3,093,399 2,999,242 FCB Financial Holdings Inc., Class ‘A’ 27,100 1,763,194 2,094,868 First Horizon National Corp. 88,100 2,178,169 2,066,241 First Republic Bank 10,600 1,232,317 1,348,797 Home Bancshares Inc. 75,800 2,175,537 2,248,115 Huntington Bancshares Inc. 80,990 1,444,638 1,571,549 IBERIABANK Corp. 26,300 2,657,501 2,620,807 Independent Bank Group Inc. 19,900 1,740,976 1,747,591
Hamilton Capital Global Bank ETF
Shares/ Average FairSecurity Contracts Cost Value
Schedule of Investments (unaudited) (continued)As at June 30, 2018
101621 - Hamilton HBG.indd 18 2018-08-10 9:15 AM

19
JPMorgan Chase & Co. 14,800 1,944,901 2,027,401 KeyCorp 80,570 1,973,985 2,069,703 PacWest Bancorp 34,710 2,186,755 2,255,109 Sandy Spring Bancorp Inc. 18,100 925,862 975,840 Sterling Bancorp 96,900 3,059,644 2,993,655 SVB Financial Group 7,500 1,721,941 2,847,137 Western Alliance Bancorp 35,700 2,320,910 2,656,877 Zions Bancorp 21,500 1,286,355 1,489,281
41,823,564 44,633,101
TOTAL U.S. EQUITIES 41,823,564 44,633,101
CANADIAN EQUITIES (5.29%) Financials (5.29%)
Bank of Nova Scotia (The) 20,900 1,668,275 1,555,796 Canadian Imperial Bank of Commerce 19,200 2,252,311 2,195,712 National Bank of Canada 24,600 1,564,957 1,552,752
5,485,543 5,304,260
TOTAL CANADIAN EQUITIES 5,485,543 5,304,260
DERIVATIVES (0.23%) Currency Forwards (0.23%)
Currency forward contract to buy C$15,080,454 for EUR€9,700,000 maturing August 31, 2018 – 137,210 Currency forward contract to buy C$5,500,998 for AU$5,600,000 maturing August 31, 2018 – 57,260 Currency forward contract to buy C$2,422,897 for JPY¥200,000,000 maturing August 31, 2018 – 40,771
– 235,241
TOTAL DERIVATIVES – 235,241
Transaction Costs (165,216)
TOTAL INVESTMENT PORTFOLIO (100.11%) $ 98,665,350 $ 100,339,640
Cash and cash equivalents (1.35%) 1,356,310 Other assets less liabilities (-1.46%) (1,469,436)
TOTAL NET ASSETS (100.00%) $ 100,226,514
(See accompanying notes to �nancial statements)
Hamilton Capital Global Bank ETF
Shares/ Average FairSecurity Contracts Cost Value
Schedule of Investments (unaudited) (continued)As at June 30, 2018
101621 - Hamilton HBG.indd 19 2018-08-10 9:15 AM

20
1. REPORTING ENTITY
Hamilton Capital Global Bank ETF (“HBG” or the “ETF”) is an investment trust established under the laws of the Province of Ontario by Declaration of Trust on January 15, 2016. The ETF e�ectively began operations on January 22, 2016. The address of the ETF’s registered o�ce is: c/o Hamilton Capital Partners Inc., 55 York Street, Suite 1202, Toronto, Ontario, M5J 1R7.
The ETF is o�ered for sale on a continuous basis by its prospectus in class E units (“Class E”) which trade on the Toronto Stock Exchange (“TSX”) in Canadian dollars (“Cdn$ units”) and in U.S. dollars (“US$ units”) under the symbols HBG and HBG.U, respectively. US$ units are not a separate class of units of the ETF, but rather, represent the U.S. dollar value of the Cdn$ Class E units at the current day’s Canada/U.S. exchange rate. An investor may buy or sell units of the ETF on the TSX only through a registered broker or dealer in the province or territory where the investor resides. Investors are able to trade units of the ETF in the same way as other securities traded on the TSX, including by using market orders and limit orders and may incur customary brokerage commissions when buying or selling units.
The investment objective of HBG is to seek long-term total returns consisting of long-term capital appreciation and regular dividend income from an actively managed portfolio comprised primarily of equity securities of banks and other deposit-taking institutions located anywhere around the globe.
Hamilton Capital Partners Inc. (“Hamilton Capital” or the “Manager”) is the manager, trustee and portfolio adviser of the ETF. The Manager is responsible for implementing the ETF’s investment strategies.
2. BASIS OF PREPARATION
(i) Statement of compliance
These �nancial statements have been prepared in accordance with International Financial Reporting Standards (“IFRS”). Any mention of total net assets, net assets, net asset value or increase (decrease) in net assets is referring to net assets or increase (decrease) in net assets attributable to holders of redeemable units as reported under IFRS.
These �nancial statements were authorized for issue on August 15, 2018, by the Board of Directors of the Manager.
(ii) Basis of measurement
The �nancial statements have been prepared on the historical cost basis except for �nancial instruments at fair value though pro�t or loss, which are measured at fair value.
(iii) Functional and presentation currency
These �nancial statements are presented in Canadian dollars, which is the ETF’s functional currency.
3. SIGNIFICANT ACCOUNTING POLICIES
The accounting policies set out below have been applied consistently to all periods presented in these �nancial statements.
Hamilton Capital Global Bank ETF
Notes to Financial Statements (unaudited)June 30, 2018
101621 - Hamilton HBG.indd 20 2018-08-10 9:15 AM
Notes to Financial Statements (unaudited) (continued)June 30, 2018
21
Hamilton Capital Global Bank ETF
(a) Financial instruments
(i) Recognition, initial measurement and classification
For �scal years beginning January 1, 2018, IFRS 9, Financial Instruments (“IFRS 9”) has replaced International Accounting Standard 39, Financial Instruments – Recognition and Measurement (“IAS 39”). IFRS 9 introduces new classi�cation and measurement requirements for �nancial instruments, including impairment on �nancial assets and hedge accounting.
This new standard requires assets to be classi�ed based on the ETF’s business model for managing the �nancial assets and contractual cash �ow characteristics of the �nancial assets. The standard includes three principal classi�cation cat-egories for �nancial assets: measured at amortized cost, fair value through other comprehensive income, and fair value through pro�t and loss (“FVTPL”). It eliminates the existing IAS 39 categories of held to maturity, loans and receivables and available for sale. IFRS 9 largely retains the existing requirements in IAS 39 for the classi�cation of �nancial liabilities
There were no changes to the measurement basis of the ETF’s �nancial instruments as a result of adopting IFRS 9, and consequently, there was no impact to net assets.
Financial assets and �nancial liabilities at FVTPL are initially recognized on the trade date, at fair value (see below), with transaction costs recognized in the statements of comprehensive income. Other �nancial assets and �nancial liabilities are recognized on the date on which they are originated at fair value.
The ETF classi�es �nancial assets and �nancial liabilities into the following categories:
• Financial assets mandatorily classi�ed at fair value through pro�t or loss: debt securities, equity investments and derivative �nancial instruments
• Financial assets at amortized cost: All other �nancial assets are classi�ed as loans and receivables
• Financial liabilities mandatorily classi�ed at fair value through pro�t or loss: derivative �nancial instruments and securities sold short, if any
• Financial liabilities at amortized cost: all other �nancial liabilities are classi�ed as other �nancial liabilities
(ii) Fair value measurement
Fair value is the price that would be received to sell an asset or paid to transfer a liability in an orderly transaction be-tween market participants at the measurement date in the principal or, in its absence, the most advantageous market to which the ETF has access at that date. The fair value of a liability re�ects its non-performance risk.
Investments are valued at fair value as of the close of business on each day upon which a session of the TSX is held (“Valu-ation Date”) and based on external pricing sources to the extent possible. Investments held that are traded in an active market through recognized public stock exchanges, over-the-counter markets, or through recognized investment deal-ers, are valued at their closing sale price. However, such prices may be adjusted if a more accurate value can be obtained from recent trading activity or by incorporating other relevant information that may not have been re�ected in pricing obtained from external sources. Short-term investments, including notes and money market instruments, are valued at amortized cost which approximates fair value.
101621 - Hamilton HBG.indd 21 2018-08-10 9:15 AM
Notes to Financial Statements (unaudited) (continued)June 30, 2018
22
Hamilton Capital Global Bank ETF
Investments held that are not traded in an active market, including some derivative �nancial instruments, are valued us-ing observable market inputs where possible, on such basis and in such manner as established by the Manager. Deriva-tive �nancial instruments are recorded in the statements of �nancial position according to the gain or loss that would be realized if the contracts were closed out on the Valuation Date. Margin deposits, if any, are included in the schedule of investments as margin deposits. See also the summary of fair value measurements in note 6.
Fair value policies used for �nancial reporting purposes are the same as those used to measure the net asset value (“NAV”) for transactions with unitholders.
The fair value of other �nancial assets and liabilities approximates their carrying values due to the short-term nature of these instruments.
(iii) Offsetting
Financial assets and liabilities are o�set and the net amount presented in the statements of �nancial position when there is a legally enforceable right to o�set the recognized amounts and there is an intention to settle on a net basis, or to real-ize the asset and settle the liability simultaneously.
Income and expenses are presented on a net basis for gains and losses from �nancial instruments at fair value through pro�t or loss and foreign exchange gains and losses.
(iv) Specific instruments
Cash and cash equivalents
Cash and cash equivalents consist of cash on deposit and short-term, interest bearing notes with a term to maturity of less than three months from the date of purchase.
Forward foreign exchange contracts
Forward foreign exchange contracts, if any, are valued at the current market value thereof on the Valuation Date. The val-ue of these forward contracts is the gain or loss that would be realized if, on the Valuation Date, the positions were to be closed out and recorded as derivative assets and/or liabilities in the statements of �nancial position and as a net change in unrealized appreciation (depreciation) of investments and derivatives in the statements of comprehensive income. When the forward contracts are closed out or mature, realized gains or losses on forward contracts are recognized and are included in the statements of comprehensive income in net realized gain (loss) on sale of investments and derivatives. The Canadian dollar value of forward foreign exchange contracts is determined using forward currency exchange rates supplied by an independent service provider.
Redeemable units
The redeemable units are measured at the present value of the redemption amounts and are considered a residual amount of the net assets attributable to holders of redeemable units. They are classi�ed as �nancial liabilities as a result of the ETF’s requirement to distribute net income and capital gains to unitholders.
101621 - Hamilton HBG.indd 22 2018-08-10 9:15 AM

Notes to Financial Statements (unaudited) (continued)June 30, 2018
23
Hamilton Capital Global Bank ETF
(b) Investment income
Investment transactions are accounted for as of the trade date. Realized gains and losses from investment transactions are calculated on a weighted average cost basis. The di�erence between fair value and average cost, as recorded in the �nancial statements, is included in the statements of comprehensive income as part of the net change in unrealized ap-preciation (depreciation) of investments and derivatives. Interest income for distribution purposes from investments in bonds and short-term investments, if any, represents the coupon interest received by the ETF accounted for on an accrual basis. The ETF does not amortize premiums paid or discounts received on the purchase of �xed income securities, if any. The ETF does not use the e�ective interest method. Dividend income is recognized on the ex-dividend date. Distribution income from investments in other funds or ETFs is recognized when earned.
Income from derivatives is shown in the statements of comprehensive income as net realized gain (loss) on sale of invest-ments and derivatives; net change in unrealized appreciation (depreciation) of investments and derivatives; and, interest income for distribution purposes, in accordance with its nature.
Income from securities lending, if any, is included in “Securities lending income” on the statements of comprehensive income and is recognized when earned. Any securities on loan continue to be displayed in the schedule of investments and the market value of the securities loaned and collateral held is determined daily (see note 7).
If the ETF incurs withholding taxes imposed by certain countries on investment income and capital gains, such income and gains are recorded on a gross basis and the related withholding taxes are shown as a separate expense in the state-ments of comprehensive income.
(c) Foreign currency
Transactions in foreign currencies are translated into the ETF’s reporting currency using the exchange rate prevailing on the trade date. Monetary assets and liabilities denominated in foreign currencies at the reporting date are translated at the period-end exchange rate. Foreign exchange gains and losses are presented as “Net realized gain (loss) on foreign exchange”, except for those arising from �nancial instruments at fair value through pro�t or loss, which are recognized as a component within “Net realized gain (loss) on sale of investments and derivatives” and “Net change in unrealized appre-ciation (depreciation) of investments and derivatives” in the statements of comprehensive income.
(d) Cost basis
The cost of portfolio investments is determined on an average cost basis.
(e) Increase (decrease) in net assets attributable to holders of redeemable units per unit
The increase (decrease) in net assets per unit in the statements of comprehensive income represents the change in net assets attributable to holders of redeemable units from operations divided by the weighted average number of units of the ETF outstanding during the reporting period. For management fees please refer to note 9.
(f) Unitholder transactions
The value at which units are issued or redeemed is determined by dividing the net asset value of the class by the total number of units outstanding of that class on the Valuation Date. Amounts received on the issuance of units and amounts paid on the redemption of units are included in the statements of changes in �nancial position.
101621 - Hamilton HBG.indd 23 2018-08-10 9:15 AM

Notes to Financial Statements (unaudited) (continued)June 30, 2018
24
Hamilton Capital Global Bank ETF
(g) Amounts receivable (payable) relating to portfolio assets sold (purchased)
In accordance with the ETF’s policy of trade date accounting for sale and purchase transactions, sales/purchase transac-tions awaiting settlement represent amounts receivable/payable for securities sold/purchased, but not yet settled as at the reporting date.
(h) Net assets attributable to holders of redeemable units per unit
Net assets attributable to holders of redeemable units per unit is calculated by dividing the ETF’s net assets attributable to holders of redeemable units by the number of units of the ETF outstanding on the Valuation Date.
(i) Transaction costs
Transaction costs are incremental costs that are directly attributable to the acquisition, issue or disposal of an investment, which include fees and commissions paid to agents, advisors, brokers and dealers, levies by regulatory agencies and secu-rities exchanges, and transfer taxes and duties. Transaction costs are expensed and are included in “Transaction costs” in the statements of comprehensive income.
4. CRITICAL ACCOUNTING ESTIMATES AND JUDGEMENTS
In preparing these �nancial statements, the Manager has made judgements, estimates and assumptions that a�ect the application of accounting policies and the reported amounts of assets, liabilities, income and expenses. Actual results may di�er from these estimates. Estimates and underlying assumptions are reviewed on an ongoing basis. Revisions to estimates are recognized prospectively.
The ETF may hold �nancial instruments that are not quoted in active markets, including derivatives. The determination of the fair value of these instruments is the area with the most signi�cant accounting judgements and estimates that the ETF has made in preparing the �nancial statements. See note 6 for more information on the fair value measurement of the ETF’s �nancial instruments.
5. FINANCIAL INSTRUMENTS RISK
In the normal course of business, the ETF’s investment activities expose it to a variety of �nancial risks. The Manager seeks to minimize potential adverse e�ects of these risks for the ETF’s performance by employing professional, experienced portfolio advisors, by daily monitoring of the ETF’s positions and market events, and periodically may use derivatives to hedge certain risk exposures. To assist in managing risks, the Manager maintains a governance structure that oversees the ETF’s investment activities and monitors compliance with the ETF’s stated investment strategies, internal guidelines and securities regulations.
Please refer to the most recent prospectus for a complete discussion of the risks attributed to an investment in the units of the ETF. Signi�cant �nancial instrument risks that are relevant to the ETF and an analysis of how they are managed are presented below.
(a) Market risk
Market risk is the risk that changes in market prices, such as interest rates, equity prices, foreign exchange rates and credit spreads (not relating to changes in the obligor’s/issuer’s credit standing) will a�ect the ETF’s income or the fair value of its holdings of �nancial instruments. The objective of market risk management is to manage and control market risk expo-sures within acceptable parameters, while optimizing the return.
101621 - Hamilton HBG.indd 24 2018-08-10 9:15 AM

Notes to Financial Statements (unaudited) (continued)June 30, 2018
25
Hamilton Capital Global Bank ETF
(i) Currency risk
Currency risk is the risk that �nancial instruments which are denominated in currencies other than the ETF’s reporting currency, the Canadian dollar, will �uctuate due to changes in exchange rates and adversely impact the ETF’s income, cash �ows or fair values of its investment holdings. The ETF may reduce its foreign currency exposure through the use of derivative arrangements such as foreign exchange forward contracts or futures contracts. The following table indicates the foreign currencies to which the ETF had signi�cant exposure as at June 30, 2018, and December 31, 2017, in Canadian dollar terms and the potential impact on the ETF’s net assets (including the underlying principal amount of future or for-ward currency contracts, if any), as a result of a 1% change in these currencies relative to the Canadian dollar:
June 30, 2018 Financial Instruments Currency Forward and/
or Futures Contracts TotalImpact on Net
Asset Value
Currency ($000's) ($000's) ($000's) ($000's)
Australian Dollar 5,621 (5,444) 177 2
British Pound 3,095 – 3,095 31
Danish Krone 2,147 – 2,147 21
Euro Currency 15,379 (14,943) 436 4
Japanese Yen 2,474 (2,382) 92 1
Norwegian Krone 4,062 – 4,062 41
Singapore Dollar 1,714 306 2,020 20
Swiss Franc 2,689 – 2,689 27
U.S. Dollar 57,724 – 57,724 577
Total 94,905 (22,463) 72,442 724
As % of Net Asset Value 94.7% -22.4% 72.3% 0.7%
December 31, 2017 Financial Instruments Currency Forward and/
or Futures Contracts TotalImpact on Net
Asset Value
Currency ($000's) ($000's) ($000's) ($000's)
Australian Dollar 2,778 (2,744) 34 –
British Pound 3,523 – 3,523 35
Danish Krone 1,985 – 1,985 20
Euro Currency 7,717 (7,711) 6 –
Japanese Yen 3,553 (3,577) (24) –
Norwegian Krone 2,301 – 2,301 23
Swedish Krona 24 – 24 –
Swiss Franc 578 – 578 6
101621 - Hamilton HBG.indd 25 2018-08-10 9:15 AM
Notes to Financial Statements (unaudited) (continued)June 30, 2018
26
Hamilton Capital Global Bank ETF
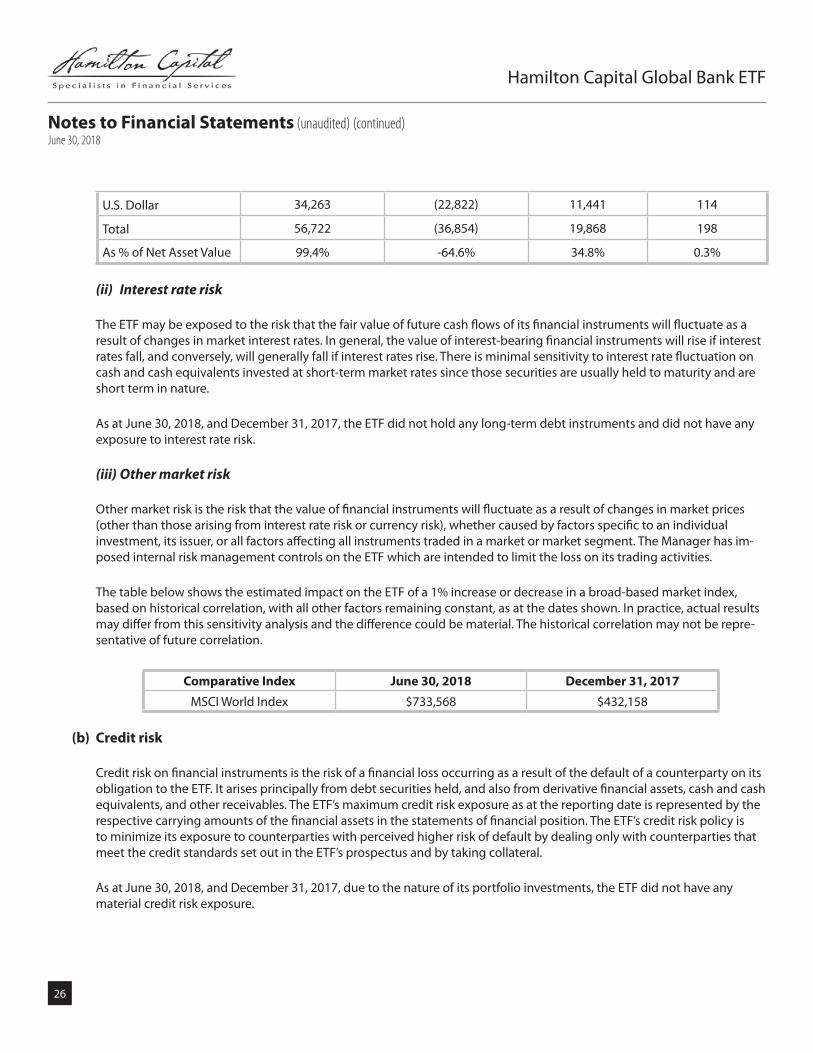
U.S. Dollar 34,263 (22,822) 11,441 114
Total 56,722 (36,854) 19,868 198
As % of Net Asset Value 99.4% -64.6% 34.8% 0.3%
(ii) Interest rate risk
The ETF may be exposed to the risk that the fair value of future cash �ows of its �nancial instruments will �uctuate as a result of changes in market interest rates. In general, the value of interest-bearing �nancial instruments will rise if interest rates fall, and conversely, will generally fall if interest rates rise. There is minimal sensitivity to interest rate �uctuation on cash and cash equivalents invested at short-term market rates since those securities are usually held to maturity and are short term in nature.
As at June 30, 2018, and December 31, 2017, the ETF did not hold any long-term debt instruments and did not have any exposure to interest rate risk.
(iii) Other market risk
Other market risk is the risk that the value of �nancial instruments will �uctuate as a result of changes in market prices (other than those arising from interest rate risk or currency risk), whether caused by factors speci�c to an individual investment, its issuer, or all factors a�ecting all instruments traded in a market or market segment. The Manager has im-posed internal risk management controls on the ETF which are intended to limit the loss on its trading activities.
The table below shows the estimated impact on the ETF of a 1% increase or decrease in a broad-based market index, based on historical correlation, with all other factors remaining constant, as at the dates shown. In practice, actual results may di�er from this sensitivity analysis and the di�erence could be material. The historical correlation may not be repre-sentative of future correlation.
Comparative Index June 30, 2018 December 31, 2017
MSCI World Index $733,568 $432,158
(b) Credit risk
Credit risk on �nancial instruments is the risk of a �nancial loss occurring as a result of the default of a counterparty on its obligation to the ETF. It arises principally from debt securities held, and also from derivative �nancial assets, cash and cash equivalents, and other receivables. The ETF’s maximum credit risk exposure as at the reporting date is represented by the respective carrying amounts of the �nancial assets in the statements of �nancial position. The ETF’s credit risk policy is to minimize its exposure to counterparties with perceived higher risk of default by dealing only with counterparties that meet the credit standards set out in the ETF’s prospectus and by taking collateral.
As at June 30, 2018, and December 31, 2017, due to the nature of its portfolio investments, the ETF did not have any material credit risk exposure.
101621 - Hamilton HBG.indd 26 2018-08-10 9:15 AM

Notes to Financial Statements (unaudited) (continued)June 30, 2018
27
Hamilton Capital Global Bank ETF
(c) Liquidity risk
Liquidity risk is the risk that the ETF will encounter di�culty in meeting the obligations associated with its �nancial li-abilities that are settled by delivering cash or another �nancial asset. The ETF’s policy and the Manager’s approach to managing liquidity is to ensure, as far as possible, that it will always have su�cient liquidity to meet its liabilities when due, under both normal and stress conditions, including estimated redemptions of shares, without incurring unaccept-able losses or risking damage to the ETF’s reputation. All �nancial liabilities are generally due within 90 days. Liquidity risk is managed by investing the majority of the ETF’s assets in investments that are traded in an active market and can be readily disposed. The ETF aims to retain su�cient cash and cash equivalent positions to maintain liquidity; therefore, the liquidity risk for the ETF is considered minimal.
6. FAIR VALUE MEASUREMENT
Below is a classi�cation of fair value measurements of the ETF’s investments based on a three level fair value hierarchy and a reconciliation of transactions and transfers within that hierarchy. The hierarchy of fair valuation inputs is summa-rized as follows:
• Level 1: securities that are valued based on quoted prices in active markets.
• Level 2: securities that are valued based on inputs other than quoted prices that are observable, either directly as prices, or indirectly as derived from prices.
• Level 3: securities that are valued with signi�cant unobservable market data.
Changes in valuation methods may result in transfers into or out of an investment’s assigned level. The following is a summary of the inputs used as at June 30, 2018, and December 31, 2017, in valuing the ETF’s investments and derivatives carried at fair values:
June 30, 2018 December 31, 2017
Level 1 ($) Level 2 ($) Level 3 ($) Level 1 ($) Level 2 ($) Level 3 ($)
Financial Assets
Equities 100,104,399 – – 56,734,397 – –
Currency Forward Contracts – 235,241 – – 131,019 –
Total Financial Assets 100,104,399 235,241 – 56,734,397 131,019 –
Financial Liabilities
Currency Forward Contracts – – – – (16,993) –
Total Financial Liabilities – – – – (16,993) –
Net Financial Assets and Liabilities 100,104,399 235,241 – 56,734,397 114,026 –
There were no signi�cant transfers made between Levels 1 and 2 as a result of changes in the availability of quoted market prices or observable market inputs during the period or year shown. In addition, there were no investments or transactions classi�ed in Level 3 for the period ended June 30, 2018, and for the year ended December 31, 2017.
101621 - Hamilton HBG.indd 27 2018-08-10 9:15 AM
Notes to Financial Statements (unaudited) (continued)June 30, 2018
28
Hamilton Capital Global Bank ETF
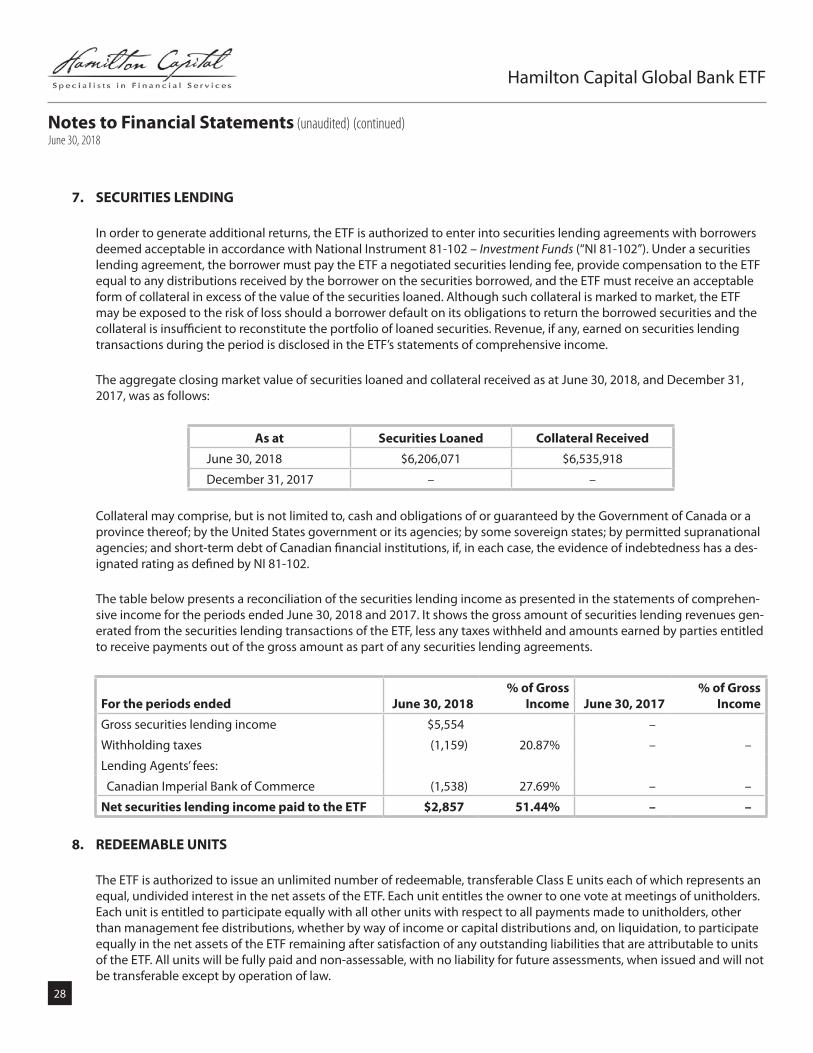
7. SECURITIES LENDING
In order to generate additional returns, the ETF is authorized to enter into securities lending agreements with borrowers deemed acceptable in accordance with National Instrument 81-102 – Investment Funds (“NI 81-102”). Under a securities lending agreement, the borrower must pay the ETF a negotiated securities lending fee, provide compensation to the ETF equal to any distributions received by the borrower on the securities borrowed, and the ETF must receive an acceptable form of collateral in excess of the value of the securities loaned. Although such collateral is marked to market, the ETF may be exposed to the risk of loss should a borrower default on its obligations to return the borrowed securities and the collateral is insu�cient to reconstitute the portfolio of loaned securities. Revenue, if any, earned on securities lending transactions during the period is disclosed in the ETF’s statements of comprehensive income.
The aggregate closing market value of securities loaned and collateral received as at June 30, 2018, and December 31, 2017, was as follows:
As at Securities Loaned Collateral Received
June 30, 2018 $6,206,071 $6,535,918
December 31, 2017 – –
Collateral may comprise, but is not limited to, cash and obligations of or guaranteed by the Government of Canada or a province thereof; by the United States government or its agencies; by some sovereign states; by permitted supranational agencies; and short-term debt of Canadian �nancial institutions, if, in each case, the evidence of indebtedness has a des-ignated rating as de�ned by NI 81-102.
The table below presents a reconciliation of the securities lending income as presented in the statements of comprehen-sive income for the periods ended June 30, 2018 and 2017. It shows the gross amount of securities lending revenues gen-erated from the securities lending transactions of the ETF, less any taxes withheld and amounts earned by parties entitled to receive payments out of the gross amount as part of any securities lending agreements.
For the periods ended June 30, 2018% of Gross
Income June 30, 2017% of Gross
Income
Gross securities lending income $5,554 –
Withholding taxes (1,159) 20.87% – –
Lending Agents’ fees:
Canadian Imperial Bank of Commerce (1,538) 27.69% – –
Net securities lending income paid to the ETF $2,857 51.44% – –
8. REDEEMABLE UNITS
The ETF is authorized to issue an unlimited number of redeemable, transferable Class E units each of which represents an equal, undivided interest in the net assets of the ETF. Each unit entitles the owner to one vote at meetings of unitholders. Each unit is entitled to participate equally with all other units with respect to all payments made to unitholders, other than management fee distributions, whether by way of income or capital distributions and, on liquidation, to participate equally in the net assets of the ETF remaining after satisfaction of any outstanding liabilities that are attributable to units of the ETF. All units will be fully paid and non-assessable, with no liability for future assessments, when issued and will not be transferable except by operation of law.
101621 - Hamilton HBG.indd 28 2018-08-10 9:15 AM
Notes to Financial Statements (unaudited) (continued)June 30, 2018
29
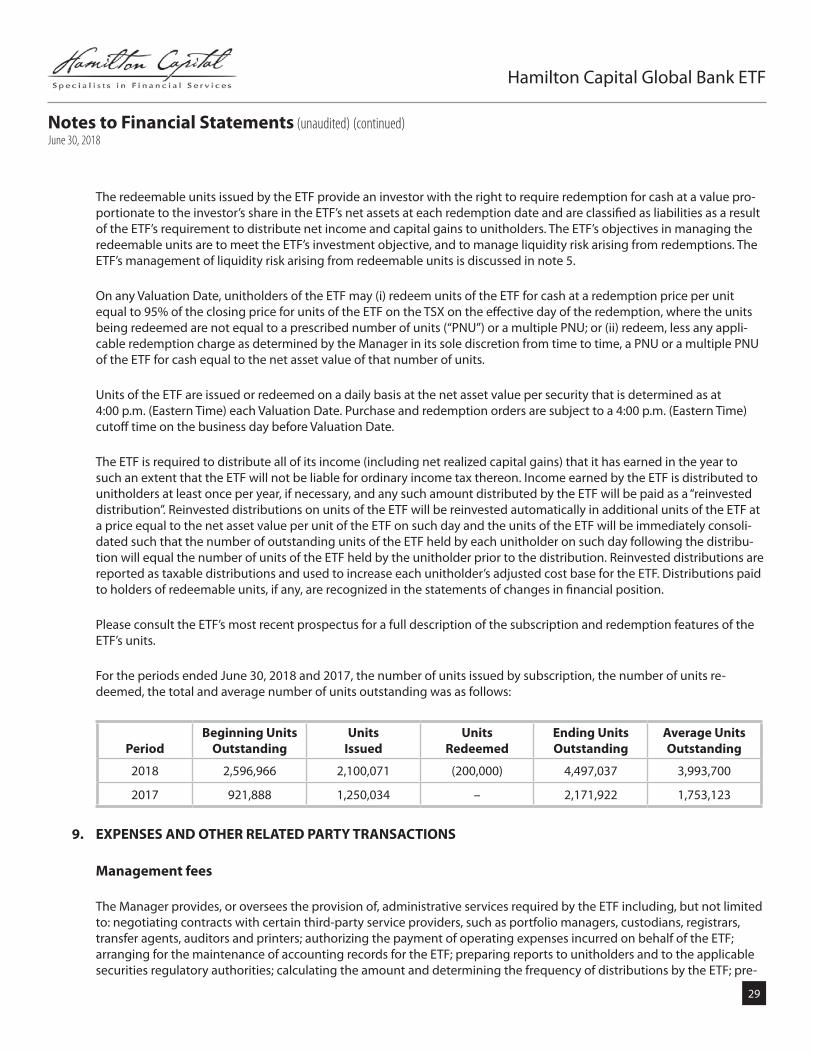
The redeemable units issued by the ETF provide an investor with the right to require redemption for cash at a value pro-portionate to the investor’s share in the ETF’s net assets at each redemption date and are classi�ed as liabilities as a result of the ETF’s requirement to distribute net income and capital gains to unitholders. The ETF’s objectives in managing the redeemable units are to meet the ETF’s investment objective, and to manage liquidity risk arising from redemptions. The ETF’s management of liquidity risk arising from redeemable units is discussed in note 5.
On any Valuation Date, unitholders of the ETF may (i) redeem units of the ETF for cash at a redemption price per unit equal to 95% of the closing price for units of the ETF on the TSX on the e�ective day of the redemption, where the units being redeemed are not equal to a prescribed number of units (“PNU”) or a multiple PNU; or (ii) redeem, less any appli-cable redemption charge as determined by the Manager in its sole discretion from time to time, a PNU or a multiple PNU of the ETF for cash equal to the net asset value of that number of units.
Units of the ETF are issued or redeemed on a daily basis at the net asset value per security that is determined as at 4:00 p.m. (Eastern Time) each Valuation Date. Purchase and redemption orders are subject to a 4:00 p.m. (Eastern Time) cuto� time on the business day before Valuation Date.
The ETF is required to distribute all of its income (including net realized capital gains) that it has earned in the year to such an extent that the ETF will not be liable for ordinary income tax thereon. Income earned by the ETF is distributed to unitholders at least once per year, if necessary, and any such amount distributed by the ETF will be paid as a “reinvested distribution”. Reinvested distributions on units of the ETF will be reinvested automatically in additional units of the ETF at a price equal to the net asset value per unit of the ETF on such day and the units of the ETF will be immediately consoli-dated such that the number of outstanding units of the ETF held by each unitholder on such day following the distribu-tion will equal the number of units of the ETF held by the unitholder prior to the distribution. Reinvested distributions are reported as taxable distributions and used to increase each unitholder’s adjusted cost base for the ETF. Distributions paid to holders of redeemable units, if any, are recognized in the statements of changes in �nancial position.
Please consult the ETF’s most recent prospectus for a full description of the subscription and redemption features of the ETF’s units.
For the periods ended June 30, 2018 and 2017, the number of units issued by subscription, the number of units re-deemed, the total and average number of units outstanding was as follows:
PeriodBeginning Units
Outstanding Units
Issued Units
RedeemedEnding Units Outstanding
Average Units Outstanding
2018 2,596,966 2,100,071 (200,000) 4,497,037 3,993,700
2017 921,888 1,250,034 – 2,171,922 1,753,123
9. EXPENSES AND OTHER RELATED PARTY TRANSACTIONS
Management fees
The Manager provides, or oversees the provision of, administrative services required by the ETF including, but not limited to: negotiating contracts with certain third-party service providers, such as portfolio managers, custodians, registrars, transfer agents, auditors and printers; authorizing the payment of operating expenses incurred on behalf of the ETF; arranging for the maintenance of accounting records for the ETF; preparing reports to unitholders and to the applicable securities regulatory authorities; calculating the amount and determining the frequency of distributions by the ETF; pre-
Hamilton Capital Global Bank ETF
101621 - Hamilton HBG.indd 29 2018-08-10 9:15 AM

Notes to Financial Statements (unaudited) (continued)June 30, 2018
30
Hamilton Capital Global Bank ETF
paring �nancial statements, income tax returns and �nancial and accounting information as required by the ETF; ensuring that unitholders are provided with �nancial statements and other reports as are required from time to time by applicable law; ensuring that the ETF complies with all other regulatory requirements, including the continuous disclosure obliga-tions of the ETF under applicable securities laws; administering purchases, redemptions and other transactions in units of the ETF; and dealing and communicating with unitholders of the ETF. The Manager provides o�ce facilities and personnel to carry out these services, if not otherwise furnished by any other service provider to the ETF. The Manager also monitors the investment strategies of the ETF to ensure that the ETF complies with its investment objectives, investment strategies and investment restrictions and practices.
In consideration for the provision of these services, the Manager receives a monthly management fee at the annual rate of 0.85%, plus applicable sales taxes, of the net asset value of the ETF, calculated and accrued daily and payable monthly in arrears.
Any expenses of the ETF which are waived or absorbed by the Manager are paid out of the management fees received by the Manager.
Other expenses
In addition to the management fees, unless otherwise waived or absorbed by the Manager, the ETF pays all of its op-erating expenses, including but not limited to: audit fees; trustee and custodial expenses; administration costs; valua-tion, accounting and record keeping costs; legal expenses; permitted prospectus preparation and �ling expenses; costs associated with delivering documents to unitholders; listing and annual stock exchange fees; CDS Clearing and Deposi-tory Services Inc. fees; bank related fees and interest charges; extraordinary expenses; unitholder reports and servicing costs; registrar and transfer agent fees; costs of the Independent Review Committee; income taxes; sales taxes; brokerage expenses and commissions; and withholding taxes.
The Manager, at its discretion, may waive and/or absorb a portion of the fees and/or expenses otherwise payable by the ETF. The waiving and/or absorption of such fees and/or expenses by the Manager may be terminated at any time, or con-tinued inde�nitely, at the discretion of the Manager.
10. BROKER COMMISSIONS, SOFT DOLLARS AND RELATED PARTY TRANSACTIONS
Brokerage commissions paid on securities transactions may include amounts paid to related parties of the Manager for brokerage services provided to the ETF.
Research and system usage related services received in return for commissions generated with speci�c dealers are gener-ally referred to as soft dollars.
Total brokerage commissions paid to dealers in connection with investment portfolio transactions, soft dollar transac-tions incurred and amounts paid to related parties of the Manager for the periods ended June 30, 2018 and 2017, were as follows:
Period Ended Brokerage Commissions Paid
Soft Dollar Transactions
Amount Paid to Related Parties
June 30, 2018 $102,311 $26,600 $nil
June 30, 2017 $84,318 $18,200 $nil
101621 - Hamilton HBG.indd 30 2018-08-10 9:15 AM

Notes to Financial Statements (unaudited) (continued)June 30, 2018
31
Hamilton Capital Global Bank ETF
In addition to the information contained in the table above, the management fees paid to the Manager described in note 9 are related party transactions, as the Manager is considered to be a related party to the ETF. Fees paid to the Indepen-dent Review Committee are also considered to be related party transactions. Both fees are disclosed in the statements of comprehensive income. The management fees payable by the ETF as at June 30, 2018, and December 31, 2017, are disclosed in the statements of �nancial position.
The ETF may invest in other ETFs managed by the Manager or its a�liates, in accordance with the ETF’s investment objec-tives and strategies. Such investments, if any, are disclosed in the schedule of investments.
11. INCOME TAX
The ETF has quali�ed as a mutual fund trust under the Income Tax Act (Canada) (the “Tax Act”) and accordingly, is not taxed on the portion of taxable income that is paid or allocated to unitholders. As well, tax refunds (based on redemp-tions and realized and unrealized gains during the year) may be available that would make it possible to retain some net capital gains in the ETF without incurring any income taxes.
12. TAX LOSSES CARRIED FORWARD
Capital losses for income tax purposes may be carried forward inde�nitely and applied against capital gains realized in future years. Non-capital losses carried forwards may be applied against future years’ taxable income. Non-capital losses that are realized in the current taxation year may be carried forward for 20 years. As at December 31, 2017, the ETF has no net capital losses or non-capital losses available.
13. OFFSETTING OF FINANCIAL INSTRUMENTS
In the normal course of business, the ETF may enter into various master netting arrangements or other similar agree-ments that do not meet the criteria for o�setting in the statements of �nancial position but still allow for the related amounts to be set o� in certain circumstances, such as bankruptcy or termination of the contracts. The following table shows �nancial instruments that may be eligible for o�set, if such conditions were to arise, as at June 30, 2018, and De-cember 31, 2017. The “Net” column displays what the net impact would be on the ETF’s statement of �nancial position if all amounts were set-o�.
101621 - Hamilton HBG.indd 31 2018-08-10 9:15 AM

Notes to Financial Statements (unaudited) (continued)June 30, 2018
32
Amounts O�set ($) Amounts Not O�set ($) Net ($)
Financial Assets and Liabilities as at
June 30, 2018
Gross Assets
(Liabilities)
Gross Assets (Liabilities)
O�set
Net Amounts
Financial Instruments
Cash Collateral Pledged
Derivative assets 235,241 – 235,241 – – 235,241
Derivative liabilities – – – – – –
Amounts O�set ($) Amounts Not O�set ($) Net ($)
Financial Assets and Liabilities as at December 31, 2017
Gross Assets
(Liabilities)
Gross Assets (Liabilities)
O�set
Net Amounts
Financial Instruments
Cash Collateral Pledged
Derivative assets 131,019 – 131,019 (16,993) – 114,026
Derivative liabilities (16,993) – (16,993) 16,993 – –
14. COMPARATIVE FINANCIAL STATEMENTS
Certain information in the comparative �nancial statements and/or notes to the �nancial statements for 2017 has been reclassi�ed to conform to the �nancial statement presentation adopted for 2018.
Hamilton Capital Global Bank ETF
101621 - Hamilton HBG.indd 32 2018-08-10 9:15 AM
Hamilton Capital Partners Inc. | 55 York Street, Suite 1202 | Toronto, Ontario M5J 1R7
416.941.9888 | www.hamilton-capital.com
ManagerHamilton Capital Partners Inc. 55 York Street, Suite 1202Toronto, OntarioM5J 1R7Tel: (416) 941-9888www.hamilton-capital.com
CustodianCIBC Mellon Trust Company1 York Street, Suite 900Toronto, OntarioM5J 0B6
AuditorsKPMG LLPBay Adelaide Centre333 Bay Street, Suite 4600Toronto, OntarioM5H 2S5
Registrar and Transfer AgentAST Trust Company (Canada)1 Toronto Street, Suite 1200Toronto, OntarioM5C 2V6
101621 - Hamilton HBG.indd 36 2018-08-10 9:15 AM