halogens and its climate impacts - images.nature.com file2 . table s1. summary of stratospheric...
TRANSCRIPT

1
Ozone loss in the lower stratosphere from short-lived halogens and its climate impacts
R. Hossaini1*, M. P. Chipperfield1, S. A. Montzka2, A. Rap1, S. Dhomse1, and W. Feng1,3
1. School of Earth and Environment, University of Leeds, Leeds, UK 2. National Oceanic and Atmospheric Administration, Boulder, USA
3. National Centre for Atmospheric Science, University of Leeds, Leeds, UK
* Corresponding author ([email protected]) Supplementary Information This supplement contains 4 tables and 3 figures. Table S1 gives a summary of model experiments and their design to examine the impact of halogens from VSLS in the stratosphere. Table S2 gives the calculated global mean radiative effect caused by VSLS-driven ozone perturbations. Table S3 gives a summary of additional model experiments that were performed to examine the impact of VSLS on ozone in the troposphere. Table S4 presents observed CH2Cl2 mixing ratios at 13 surface locations from the ongoing monitoring program of the National Oceanic and Atmospheric Administration (NOAA) Earth System Research Laboratory (ESRL). Table S4 also contains the site-wise CH2Cl2 growth rate over the 2010-2013 period along with hemispheric and global averages. Figure S1 shows the 2011 mean simulated ozone change due to VSLS in the troposphere. Figure S2 shows a comparison between long-term ozone anomalies from the TOMCAT model and TOMS/SBUV satellite data between 1985 and 2013. Finally, Figure S3 shows column O3 changes due to bromine VSLS in 2011 and also in an atmosphere with a pre-industrial stratospheric halogen load.
Efficiency of short-lived halogens at influencingclimate through depletion of stratospheric ozone
SUPPLEMENTARY INFORMATIONDOI: 10.1038/NGEO2363
NATURE GEOSCIENCE | www.nature.com/naturegeoscience 1
© 2015 Macmillan Publishers Limited. All rights reserved

2
Table S1. Summary of stratospheric model experiments and halogen load from VSLS. Experiments were designed to examine the individual and combined impact of halogens from VSLS on ozone.
Experiment* VSLS Loading [ppt] ** Comment Bromine (Br) Chlorine (Cl) Iodine (I)
STRAT1+ 0 0 0 No VSLS, control run
STRAT2+ 6 0 0 Br - best STRAT3+ 3 0 0 Br - lower STRAT4+ 8 0 0 Br - upper
STRAT5 6 40 0 Br - best Cl - lower
STRAT6 6 80 0 Br - best Cl - best
STRAT7 6 130 0 Br - best Cl - upper
STRAT8 6 80 0.15 Br - best Cl - best I - upper
STRAT9^ 3 40 0 All - lower STRAT10^ 8 130 0.15 All - upper
Notes:
* The model was run for the 1979-2013 period at a resolution of ~5.6° longitude by ~5.6° latitude and with 32 levels from the surface to ~60 km. Meteorological forcing data was taken from the European Centre for Medium-Range Weather Forecasts (ECMWF) ERA-Interim (6-hourly) reanalysis.
** Range and best estimates based on the World Meteorological Organization Scientific Assessment of Ozone Depletion 2010. Upper limit of Cl encompasses the recent CH2Cl2 trend.
+ In addition, also performed with a fixed pre-industrial stratospheric halogen load comprising background CH3Br and CH3Cl only.
^ Extreme ranges used to determine the uncertainty on O3 changes and RE due to VSLS.
2 NATURE GEOSCIENCE | www.nature.com/naturegeoscience
SUPPLEMENTARY INFORMATION DOI: 10.1038/NGEO2363
© 2015 Macmillan Publishers Limited. All rights reserved
3
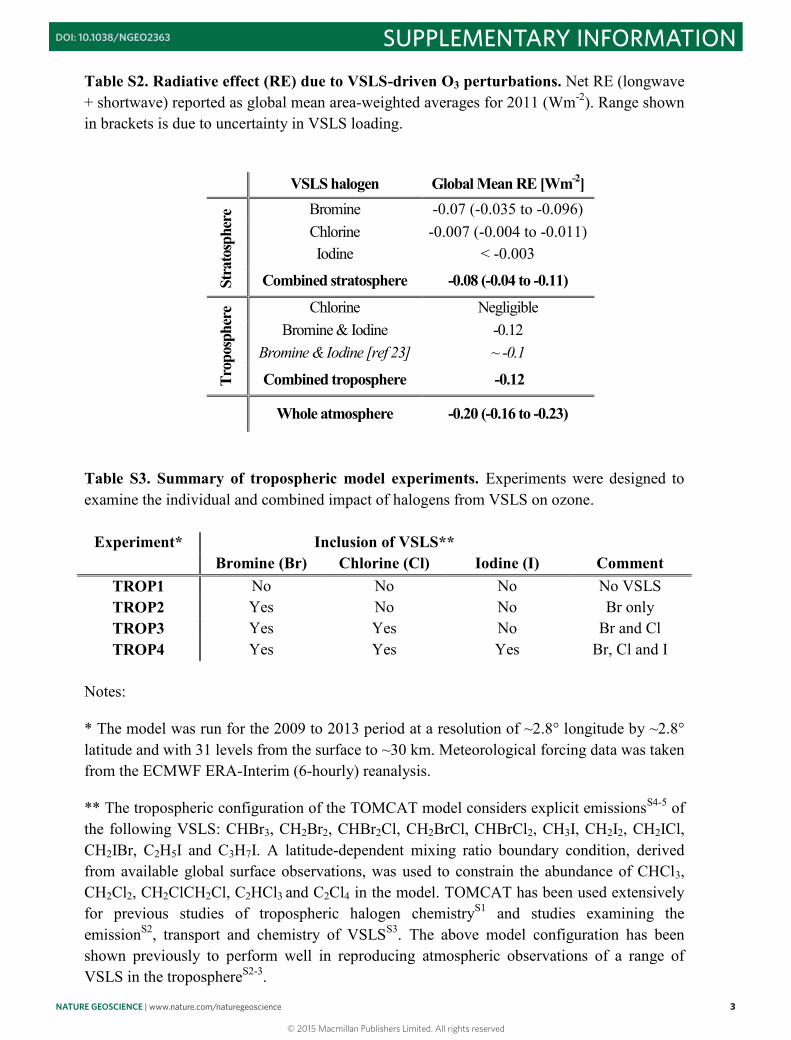
Table S2. Radiative effect (RE) due to VSLS-driven O3 perturbations. Net RE (longwave + shortwave) reported as global mean area-weighted averages for 2011 (Wm-2). Range shown in brackets is due to uncertainty in VSLS loading.
VSLS halogen Global Mean RE [Wm-2]
Stra
tosp
here
Bromine -0.07 (-0.035 to -0.096) Chlorine -0.007 (-0.004 to -0.011) Iodine < -0.003
Combined stratosphere -0.08 (-0.04 to -0.11)
Trop
osph
ere Chlorine Negligible
Bromine & Iodine -0.12 Bromine & Iodine [ref 23] ~ -0.1
Combined troposphere -0.12
Whole atmosphere -0.20 (-0.16 to -0.23)
Table S3. Summary of tropospheric model experiments. Experiments were designed to examine the individual and combined impact of halogens from VSLS on ozone.
Experiment* Inclusion of VSLS** Bromine (Br) Chlorine (Cl) Iodine (I) Comment
TROP1 No No No No VSLS TROP2 Yes No No Br only TROP3 Yes Yes No Br and Cl TROP4 Yes Yes Yes Br, Cl and I
Notes:
* The model was run for the 2009 to 2013 period at a resolution of ~2.8° longitude by ~2.8° latitude and with 31 levels from the surface to ~30 km. Meteorological forcing data was taken from the ECMWF ERA-Interim (6-hourly) reanalysis.
** The tropospheric configuration of the TOMCAT model considers explicit emissionsS4-5 of the following VSLS: CHBr3, CH2Br2, CHBr2Cl, CH2BrCl, CHBrCl2, CH3I, CH2I2, CH2ICl, CH2IBr, C2H5I and C3H7I. A latitude-dependent mixing ratio boundary condition, derived from available global surface observations, was used to constrain the abundance of CHCl3, CH2Cl2, CH2ClCH2Cl, C2HCl3 and C2Cl4 in the model. TOMCAT has been used extensively for previous studies of tropospheric halogen chemistryS1 and studies examining the emissionS2, transport and chemistry of VSLSS3. The above model configuration has been shown previously to perform well in reproducing atmospheric observations of a range of VSLS in the troposphereS2-3.
NATURE GEOSCIENCE | www.nature.com/naturegeoscience 3
SUPPLEMENTARY INFORMATIONDOI: 10.1038/NGEO2363
© 2015 Macmillan Publishers Limited. All rights reserved

4
Table S4. Observed surface mixing ratio (ppt) and growth rate of CH2Cl2. Observations made as part of the ongoing National Oceanic and Atmospheric Administration Earth System Research Laboratory (NOAA/ESRL) monitoring program. Average growth rates at all sites calculated between 2010-2013.
Monitoring Site Annual Mean Mixing Ratio [ppt] Growth Rate 2010 2011 2012 2013 ppt yr-1 % yr-1
Alert, NW Territories, Canada* 46.0 47.0 48.1 59.6 4.5 8.6 Summit, Greenland 46.8 45.7 47.5 60.2 4.5 8.4 Pt. Barrow, Alaska, USA* 46.5 46.3 48.2 59.8 4.4 8.4 Mace Head, Ireland 46.7 45.7 48.1 58.9 4.1 7.8 Wisconsin, USA 48.8 48.4 52.0 62.0 4.4 8.0 Trinidad Head, USA 48.6 48.6 49.7 61.5 4.3 7.9 Niwot Ridge, Colorado, USA* 44.0 45.7 50.7 60.3 5.4 10.5 Cape Kumukahi, Hawaii, USA* 42.9 42.3 45.0 53.9 3.7 7.6 Mauna Loa, Hawaii, USA* 39.2 37.4 41.9 52.0 4.3 9.4 Cape Matatula, American Samoa* 14.9 15.6 16.4 19.3 1.4 8.5 Cape Grim, Tasmania, Australia* 13.1 13.7 14.3 15.6 0.9 6.0 Palmer Station, Antarctica 12.7 13.4 13.4 15.3 0.9 6.3 South Pole* 12.1 13.3 13.3 14.2 0.7 5.4 Northern Hemisphere 43.7 43.7 46.8 57.1 4.5 8.9 Southern Hemisphere 13.4 14.2 14.7 16.4 1.0 6.8 All site average 35.5 35.6 37.6 45.6 3.3 8.3
Notes:
* Sites used in estimating hemispheric mean mixing ratios in Table S3 and in Figure 3.
4 NATURE GEOSCIENCE | www.nature.com/naturegeoscience
SUPPLEMENTARY INFORMATION DOI: 10.1038/NGEO2363
© 2015 Macmillan Publishers Limited. All rights reserved
5
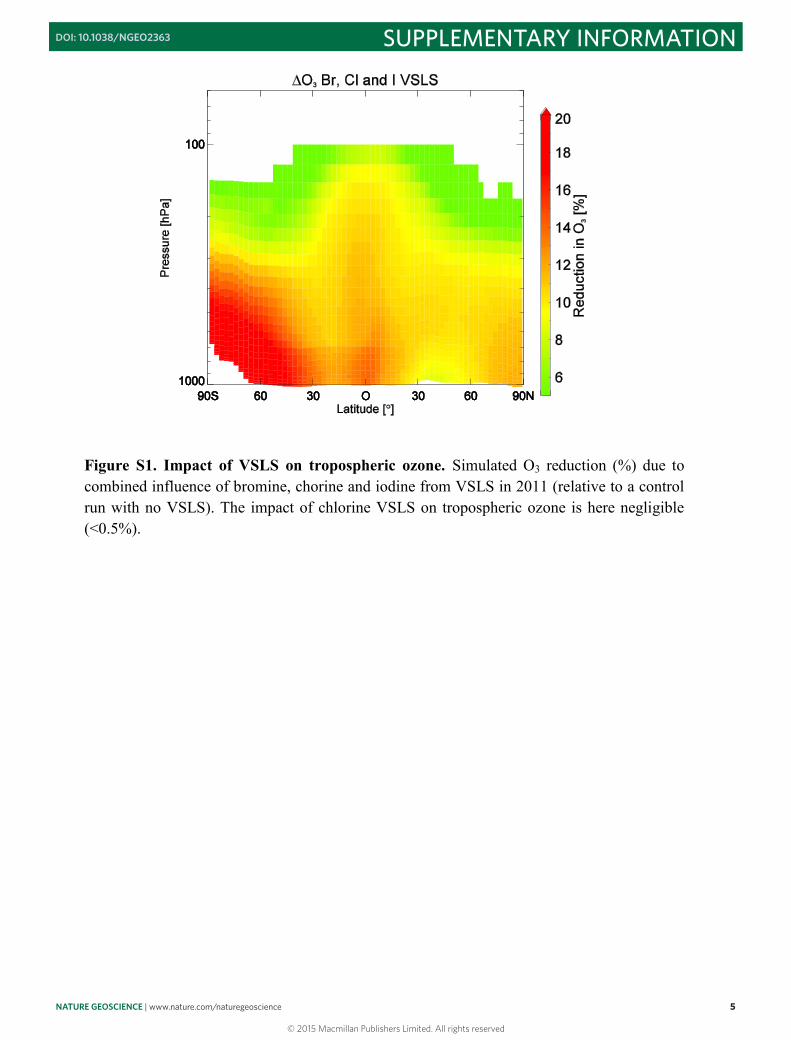
Figure S1. Impact of VSLS on tropospheric ozone. Simulated O3 reduction (%) due to combined influence of bromine, chorine and iodine from VSLS in 2011 (relative to a control run with no VSLS). The impact of chlorine VSLS on tropospheric ozone is here negligible (<0.5%).
NATURE GEOSCIENCE | www.nature.com/naturegeoscience 5
SUPPLEMENTARY INFORMATIONDOI: 10.1038/NGEO2363
© 2015 Macmillan Publishers Limited. All rights reserved

6
Figure S2. Long-term ozone anomalies from observations and model. Comparison of total ozone anomalies (Dobson Units) for (a) northern hemisphere mid-latitudes (35°N-60°N), (b) tropics (20°S-20°N) and (c) southern hemisphere mid-latitudes (35°S-60°S). Anomalies are calculated by subtracting climatological monthly mean column ozone values (1990-2005) from monthly mean values.
6 NATURE GEOSCIENCE | www.nature.com/naturegeoscience
SUPPLEMENTARY INFORMATION DOI: 10.1038/NGEO2363
© 2015 Macmillan Publishers Limited. All rights reserved
7
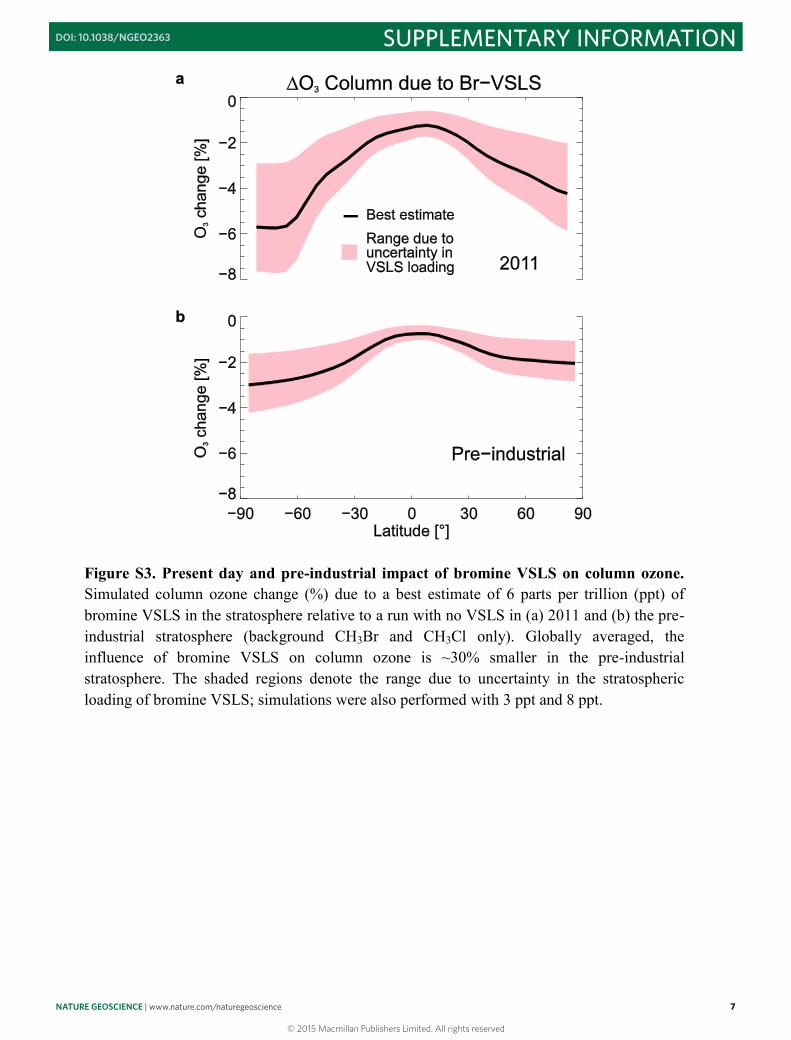
Figure S3. Present day and pre-industrial impact of bromine VSLS on column ozone. Simulated column ozone change (%) due to a best estimate of 6 parts per trillion (ppt) of bromine VSLS in the stratosphere relative to a run with no VSLS in (a) 2011 and (b) the pre-industrial stratosphere (background CH3Br and CH3Cl only). Globally averaged, the influence of bromine VSLS on column ozone is ~30% smaller in the pre-industrial stratosphere. The shaded regions denote the range due to uncertainty in the stratospheric loading of bromine VSLS; simulations were also performed with 3 ppt and 8 ppt.
NATURE GEOSCIENCE | www.nature.com/naturegeoscience 7
SUPPLEMENTARY INFORMATIONDOI: 10.1038/NGEO2363
© 2015 Macmillan Publishers Limited. All rights reserved

8
Supplementary References S1 Breider, T. J. et al. Impact of BrO on dimethylsulfide in the remote marine boundary layer. Geophys. Res. Lett., 37, L02807 (2010). S2 Hossaini, R. et al. Evaluating global emission inventories of biogenic bromocarbons. Atmos. Chem. Phys. 13, 11819-11838 (2013). S3 Hossaini, R. et al. The contribution of natural and anthropogenic very short-lived species to stratospheric bromine. Atmos. Chem. Phys. 12, 371-380 (2012). S4 Ordóñez, C. et al. Bromine and iodine chemistry in a global chemistry-climate model: description and evaluation of very short-lived oceanic sources. Atmos. Chem. Phys. 12, 1423-1447 (2012). S5 Ziska, F. et al. Global sea-to-air flux climatology for bromoform, dibromomethane and methyl iodide. Atmos. Chem. Phys. 13, 8915-8934 (2013).
8 NATURE GEOSCIENCE | www.nature.com/naturegeoscience
SUPPLEMENTARY INFORMATION DOI: 10.1038/NGEO2363
© 2015 Macmillan Publishers Limited. All rights reserved