halifax+gateway+council+strategic+plan+200602
TRANSCRIPT
s t r a t e g i ct r a n s p o r t a t i o n& t o u r i s ms o l u t i o n s
P r e p a r e d i n a s s o c i a t i o n w i t h
a n d
Halifax Gateway Council Strategic Plan
Prepared for
November 2005
Final Report
Halifax Gateway Council Strategic Plan Page ii
November 2005
Table of Contents
Executive Summary .......................................................................................................................iii
1.0 Introduction ........................................................................................................................11.1 Background............................................................................................................................ 11.2 Purpose and Scope ............................................................................................................... 2
2.0 Halifax Gateway Today ......................................................................................................32.1 Airport .................................................................................................................................... 32.2 Port – Shipping .................................................................................................................... 152.3 Port – Cruise........................................................................................................................ 262.4 Ground Transportation......................................................................................................... 33
3.0 Changing Environment....................................................................................................453.1 Global Marketplace.............................................................................................................. 453.2 Government Policy .............................................................................................................. 493.3 Aviation Trends.................................................................................................................... 683.4 Shipping Trends................................................................................................................... 803.5 Cruise Trends ...................................................................................................................... 873.6 Ground Transportation Trends............................................................................................. 96
4.0 Strategic Assessment......................................................................................................984.1 SWOT Analysis.................................................................................................................... 984.2 Halifax Gateway Potential.................................................................................................. 1024.3 Vision ................................................................................................................................. 1054.4 Regional Economic Impact ................................................................................................ 1064.5 Key Strategic Issues .......................................................................................................... 1064.6 Best Practices.................................................................................................................... 113
5.0 Action Plan .....................................................................................................................123
Halifax Gateway Council Strategic Plan Page iii
November 2005
Executive Summary
The Halifax Gateway Council was established in 2004 with the purpose of providing meaningful input intolocal, provincial, and federal policy discussions on improving the competitiveness and efficiency of theHalifax Gateway (in the future, efforts will be undertaken to examine how the gateway council concept canbe broadened to include all four Atlantic provinces). The purpose of this Strategic Plan is to develop a newvision for the Halifax Gateway and establish a detailed Action Plan to achieve it. This plan is based on theextensive research and analysis undertaken during the course of the assignment, as well as on feedbackobtained during consultations with over 20 industry organisations and government agencies.
The Halifax Gateway is an important transportation complex on North America’s east coast for themovement of international cargo and passengers. The region’s Gateway infrastructure is made up of thePort of Halifax, the Halifax International Airport, and the rail and road infrastructure connecting thesefacilities to each other, and to the east-west and north-south road and rail corridors. Presently, the Gatewayhandles roughly 14 million metric tonnes of cargo, over 3 million air passengers, and approximately 200,000cruise passengers. The Gateway is also a major generator of employment in Nova Scotia with an estimated11,930 jobs generated by Gateway-related activities, equivalent to 11,200 person years of employment.
Although global developments are intensifying competition amongst gateways, they are also generatingsignificant opportunities for growth in the transportation industry by expanding international trade. With acapacity crisis occurring at west coast North American ports, and the expected explosion of the Chinese andIndian economies in the years ahead, the Halifax region is well positioned to take advantage of emergingmarket opportunities for the economic benefit and social wellbeing of Atlantic Canada.
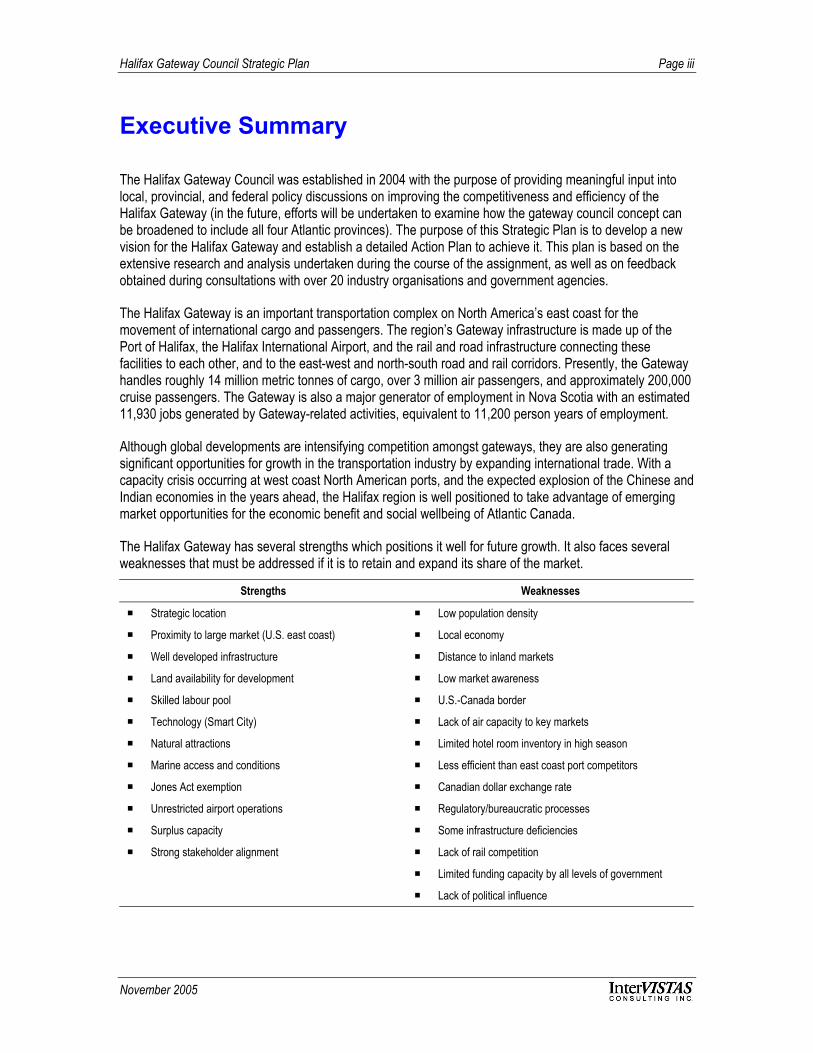
The Halifax Gateway has several strengths which positions it well for future growth. It also faces severalweaknesses that must be addressed if it is to retain and expand its share of the market.
Strengths Weaknesses
Strategic location
Proximity to large market (U.S. east coast)
Well developed infrastructure
Land availability for development
Skilled labour pool
Technology (Smart City)
Natural attractions
Marine access and conditions
Jones Act exemption
Unrestricted airport operations
Surplus capacity
Strong stakeholder alignment
Low population density
Local economy
Distance to inland markets
Low market awareness
U.S.-Canada border
Lack of air capacity to key markets
Limited hotel room inventory in high season
Less efficient than east coast port competitors
Canadian dollar exchange rate
Regulatory/bureaucratic processes
Some infrastructure deficiencies
Lack of rail competition
Limited funding capacity by all levels of government
Lack of political influence

Halifax Gateway Council Strategic Plan Page iv
November 2005
There is an opportunity for Halifax to increase its gateway market position. The region benefits from astrategic geographic location (astride major trade corridors and proximate to the large U.S. market),favourable year round marine conditions, and well-developed infrastructure with surplus capacity.
The following vision is recommended to guide the strategic development of the Halifax Gateway:
To become North America’s preferred eastern gatewayfor the economic and social benefit of Atlantic Canada
Achieving this vision would result in the following activity:
Metric PerformanceTarget
Container Traffic (TEUs) 1.1 million
Air Passengers 5.4 million
Air Cargo (metric tonnes) 64,800
Cruise Passengers 501,000
The projected economic impact associated with achieving the vision in 2020 is:
Component Jobs Person Years Wages(millions)
GDP(millions)
Output(millions)
Current DirectEconomic Impact 11,930 11,200 $477 $602 $1,482
2020 DirectEconomic Impact 18,400 17,270 $736 $928 $2,286
Increase 6,470 6,070 $259 $326 $804
% Change 54% 54% 54% 54% 54%
In order for the Gateway to realise its vision, the following four issues must be addressed:
Government policy – government policy was identified as a key area that needs to be addressed inorder to expand business through the Gateway;
Infrastructure development and funding – Gateway infrastructure must be expanded and improved tobetter serve trade and industry;
Market development – marketing and business development activities will play a critical role in thecontinued development of the Halifax Gateway; and
Economic and industrial development – additional economic growth is required in the region for theGateway to prosper.

Halifax Gateway Council Strategic Plan Page v
November 2005
A detailed Action Plan has been developed to address each of these issues. The plan, provided below,contains four strategies and roughly thirty specific initiatives to be completed during the next five years tobuild the Gateway and achieve the ambitious vision described above. Success will only accrue to theGateway, however, if industry and government work together as partners towards the common goal ofincreasing the competitiveness of the region’s international trade and tourism industries through thedevelopment of a better transportation system.
Goal #1 – Market Development
Use a coordinated approach to pursue sustainable market opportunities 2006
2007
2008
2009
2010
Objectives
□ Develop a strong and consistent Gateway brand identity
□ Develop and implement a Gateway marketing strategy to increase marketawareness and demand to/from/through the region
□ Obtain federal government commitment to increase marketing and financialsupport of the Halifax Gateway
□ Identify and prioritise potential Gateway market opportunities
□ Develop marketing/financial incentive packages to assist in attracting business tothe Gateway
□ Aggressively pursue initiatives to reduce Gateway taxation (e.g. fuel taxes,property taxes)
□ Promote a review of Canadian agency cost recovery policies

Halifax Gateway Council Strategic Plan Page vi
November 2005
Goal #2 – Infrastructure Development and Funding
Ensure integrated infrastructure planning and aligned priorities 2006
2007
2008
2009
2010
Objectives
□ Develop a master plan for the Port of Halifax
□ Acquire and remediate land adjacent to Fairview Cove container terminal
□ Build a common use air cargo facility at Halifax International Airport
□ Convert the existing rail cut for truck/commuter traffic use and/or build an inlandterminal to reduce truck traffic in the downtown core
□ Upgrade the infrastructure at the port’s container terminals to allow for faster truckturnaround times
□ Build group staging areas at Halifax International Airport to support cruisehomeport operations
□ Improve access and widen apron areas at Piers 20-22 to support cruise homeportoperations
□ Upgrade rail facilities and services
□ Complete construction of limited access highways
□ Obtain community support for the Gateway’s long-term growth objectives
□ Ensure the protection of airport buffer lands
□ Work with business partners to protect strategic industrial locations
□ Work with business partners to pursue changes to allow new sources of long-terminvestment capital (e.g. tax exempt bond financing)

Halifax Gateway Council Strategic Plan Page vii
November 2005
Goal #3 – Economic and Industrial DevelopmentGrow the economy of Atlantic Canada by expanding transportation-related businesses
2006
2007
2008
2009
2010
Objectives
□ Develop a master plan for distribution centre activity
□ Build a distripark/transload logistics facility
□ Work with the Department of National Defence to develop a logistics hub
□ Promote expansion and development of logistics businesses in Atlantic Canada
□ Ensure existing plans and resources in Atlantic Canada are aligned to optimisetransportation planning and development
□ Work with industry partners to promote a common voice for the Gateway and theAtlantic Canada region
□ Promote the development of inter-organisation and inter-agency cooperation,particularly between Gateway Council members
□ Promote regional cooperation (domestic and cross border) to improvedevelopment prospects, improve ability to address complex goals, and strengthenpolitical presence
Goal #4 – Government PolicyEstablish policies to support the development of Halifax as NorthAmerica’s preferred east coast gateway
2006
2007
2008
2009
2010
Objectives
□ Promote liberalisation of Canada’s international air policy
□ Aggressively pursue full U.S. preclearance
□ Actively promote development of 24-hour customs operations at HalifaxInternational Airport
□ Pursue initiatives to streamline airport-port transfers
□ Work to harmonise different provincial trucking regulations
□ Ensure adequate staffing levels for border agencies
□ Champion the development of harmonized border entry requirements andprocesses
□ Promote adoption of new technologies to facilitate border crossings
□ Promote development of the Perimeter Clearance concept

Halifax Gateway Council Strategic Plan Page 1
November 2005
1.0 Introduction
1.1 Background
With an excellent airport and modern port infrastructure, Halifax is an international gateway to the world.Halifax International Airport is one of Canada’s fastest growing airports and the Port of Halifax is Canada’sthird largest container port. In addition, Halifax is a major origin and destination point in Atlantic Canada forboth rail and trucking. With a capacity crisis occurring at west coast North American ports, and the expectedexplosion of the Chinese and Indian economies in the years ahead, the time is ripe to take proactive actionto further develop the Halifax Gateway for the economic and social benefit and wellbeing of Atlantic Canada.
To realize its true potential, the Halifax Gateway will need to deal with the real competition posed by severalCanadian and U.S. airports and ports, including Toronto, Montreal, New York, and Boston. In addition, theGateway and its transportation partners in Halifax will need to address several key issues, includinggovernment policy, infrastructure development and funding, market development, and economic andindustrial development in the region.
As a multimodal transportation hub, the Gateway plays a critical role in the economy of Atlantic Canada.The Halifax Gateway Council was established in 2004 with the purpose of providing meaningful input intofederal, provincial, and local region policy discussions on improving the competitiveness and efficiency ofthe Halifax Gateway. Gateway Council members include:
Atlantic Container Line
Air Canada Jazz
CanJet Airlines
CN Rail
Armour Transportation Group
Halifax International Airport Authority
Halifax Port Authority
Destination Halifax
Greater Halifax Partnership
Halifax Chamber of Commerce
Halifax Regional Municipality
Nova Scotia Business Inc.
Nova Scotia Office of EconomicDevelopment
Nova Scotia Department of Transportationand Public Works
Transport Canada
Atlantic Canada Opportunities Agency
Going forward, efforts will be undertaken to examine how the gateway council concept can be broadened toinclude all four Atlantic provinces (Nova Scotia, New Brunswick, Prince Edward Island, and Newfoundland).

Halifax Gateway Council Strategic Plan Page 2
November 2005
1.2 Purpose and Scope
InterVISTAS Consulting Inc. (InterVISTAS), in association with Bermello, Ajamil & Partners Inc. (B&A) andassociate consultant Patrick Morin, was retained by the Halifax Gateway Council to develop a five-yearstrategic plan that would establish a vision for the Gateway, and develop a clear set of priorities and policyinitiatives. The Executive Director of the Gateway Council, James Frost, also worked on this assignmentand made significant contributions to the project.
The project team was guided by a Steering Committee that provided input into the assignment, ensured theco-ordination and support of critical departments and agencies, and provided information as required. ThisSteering Committee was composed of:
James Frost, Halifax Gateway Council;
Jill McLean, Halifax Port Authority;
Alastair Cox, Halifax International Airport Authority;
Fred Morley/Ruth Blades, Greater Halifax Partnership; and
Bill MacDonald, Atlantic Canada Opportunities Agency.
The development of this Plan involved a number of key components, including market and industry analysis,a strategic assessment of the Gateway, and a planning workshop with members of the Gateway Council.
Halifax Gateway Council Strategic Plan Page 3
November 2005
2.0 Halifax Gateway Today
The Halifax Gateway provides the citizens and businesses of Atlantic Canada with a variety of aviation,maritime, and ground transportation services. The Gateway also contributes significantly to the regional andnational economies. The following sections review the basic characteristics – facilities, traffic levels,services, and market/competitive positioning – of the Gateway’s key components (the Port of Halifax, theHalifax International Airport, and the ground transportation services/facilities in the region).
2.1 Airport
Halifax International Airport is the largest international airport in Atlantic Canada. Strategically located 30minutes from the city’s downtown core, Halifax International Airport handled over 3.2 million passengers androughly 90,000 aircraft movements in 2004, while contributing over $1.5 billion to Nova Scotia's economy. Italso processed approximately 33,000 tonnes of cargo.Historically, Halifax International Airport has acted as a gateway for the Atlantic Region. In this role, HalifaxInternational Airport linked the cities of Atlantic Canada and the north east U.S. to major world markets. Inrecent years, however, Halifax International Airport’s role as a gateway has declined due to a reduction inthe number of destinations served by the airport. This decline in destinations can be attributed to the mergerof Air Canada and Canadian Airlines, and the trend in the airline industry of replacing short range commuterturboprop aircraft with longer range regional jets serving point to point destinations. To replace this activity,the airport has repositioned itself as a base for low cost carrier operations.
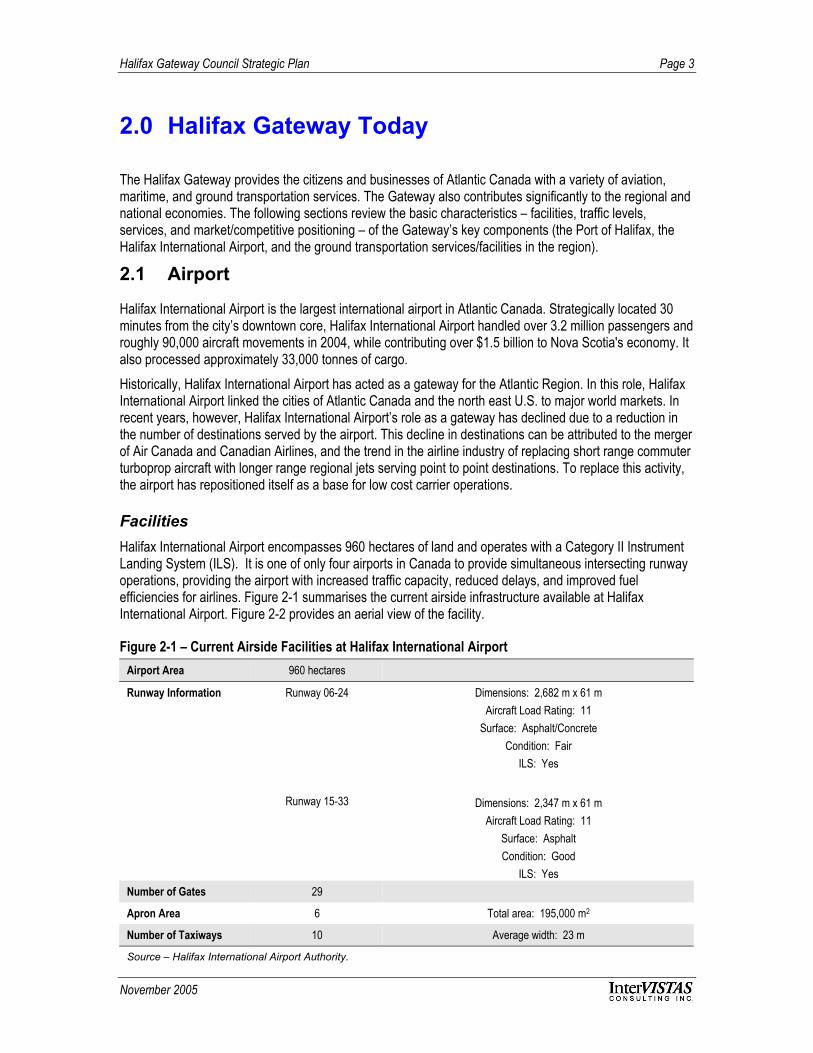
FacilitiesHalifax International Airport encompasses 960 hectares of land and operates with a Category II InstrumentLanding System (ILS). It is one of only four airports in Canada to provide simultaneous intersecting runwayoperations, providing the airport with increased traffic capacity, reduced delays, and improved fuelefficiencies for airlines. Figure 2-1 summarises the current airside infrastructure available at HalifaxInternational Airport. Figure 2-2 provides an aerial view of the facility.
Figure 2-1 – Current Airside Facilities at Halifax International AirportAirport Area 960 hectares
Runway Information Runway 06-24
Runway 15-33
Dimensions: 2,682 m x 61 mAircraft Load Rating: 11
Surface: Asphalt/ConcreteCondition: Fair
ILS: Yes
Dimensions: 2,347 m x 61 mAircraft Load Rating: 11
Surface: AsphaltCondition: Good
ILS: YesNumber of Gates 29
Apron Area 6 Total area: 195,000 m2
Number of Taxiways 10 Average width: 23 m
Source – Halifax International Airport Authority.
Halifax Gateway Council Strategic Plan Page 4
November 2005
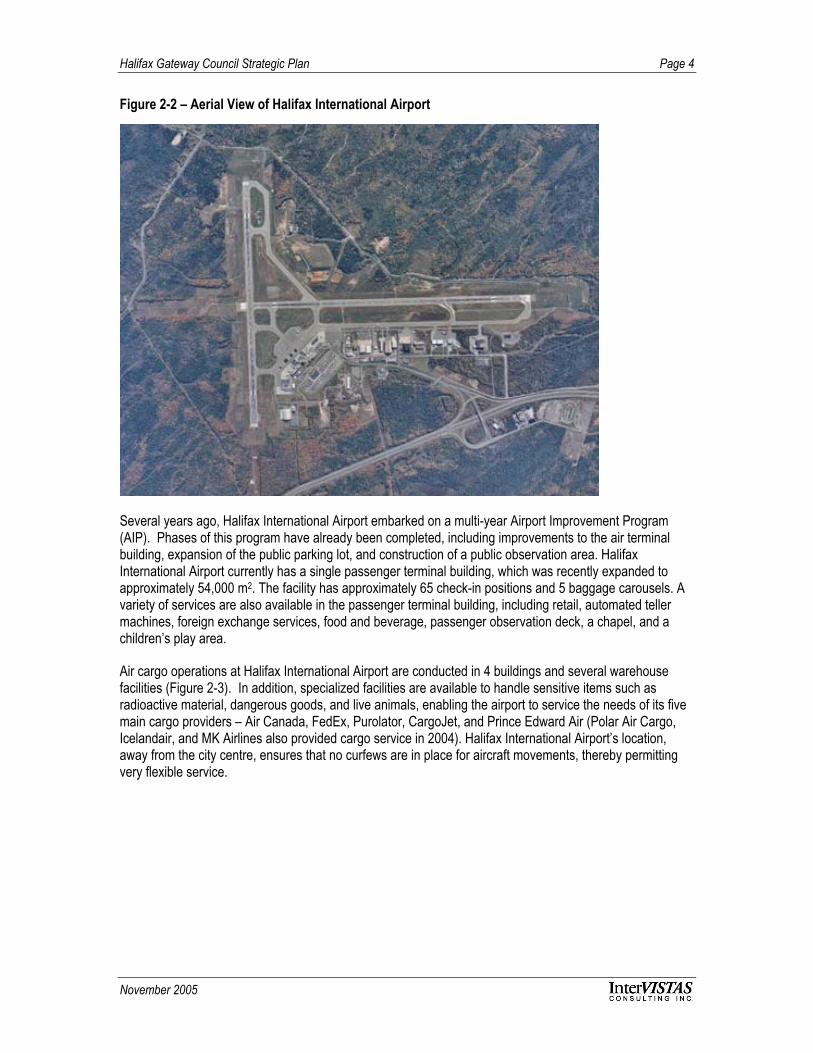
Figure 2-2 – Aerial View of Halifax International Airport
Several years ago, Halifax International Airport embarked on a multi-year Airport Improvement Program(AIP). Phases of this program have already been completed, including improvements to the air terminalbuilding, expansion of the public parking lot, and construction of a public observation area. HalifaxInternational Airport currently has a single passenger terminal building, which was recently expanded toapproximately 54,000 m2. The facility has approximately 65 check-in positions and 5 baggage carousels. Avariety of services are also available in the passenger terminal building, including retail, automated tellermachines, foreign exchange services, food and beverage, passenger observation deck, a chapel, and achildren’s play area.
Air cargo operations at Halifax International Airport are conducted in 4 buildings and several warehousefacilities (Figure 2-3). In addition, specialized facilities are available to handle sensitive items such asradioactive material, dangerous goods, and live animals, enabling the airport to service the needs of its fivemain cargo providers – Air Canada, FedEx, Purolator, CargoJet, and Prince Edward Air (Polar Air Cargo,Icelandair, and MK Airlines also provided cargo service in 2004). Halifax International Airport’s location,away from the city centre, ensures that no curfews are in place for aircraft movements, thereby permittingvery flexible service.

Halifax Gateway Council Strategic Plan Page 5
November 2005
Figure 2-3 – Air Cargo Facilities at Halifax International AirportNumber of Terminals 4
Warehouse Facilities 110,051 m2
(including bonded warehouse space)
Special Services
Aircraft Maintenance
Mechanical Handling
Health Officials
X-Ray Equipment
Express/Courier Centre
Special Storage Facilities
Heated Storage
Air-Conditioned Storage
Refrigerated Storage
Animal Quarantine
Fresh Meat Inspection
Dangerous Goods
Radioactive Goods
Operational Curfew No
Source – Halifax International Airport Authority and A-Z World Airports Guide.
TrafficPassenger traffic has grown steadily at Halifax International Airport during the past 10 years, with theexception of the period between 2000 and 2001 (Figure 2-4). During the latter period, traffic at the airport fellby approximately 8% due to changing economic and industry conditions, and the September 11, 2001terrorist attacks in the U.S. Since 2002, traffic at Halifax International Airport has increased steadily,reaching a record high of 3.2 million passengers in 2004.
Figure 2-4 – Halifax International Airport Passenger Traffic
2,662 2,7452,934
3,089 2,9812,852 2,854
2,973
3,2423,007
0
500
1,000
1,500
2,000
2,500
3,000
3,500
1995 1996 1997 1998 1999 2000 2001 2002 2003 2004
Pas
seng
ers
(thou
sand
s)
Source – Halifax International Airport Authority.
Halifax Gateway Council Strategic Plan Page 6
November 2005
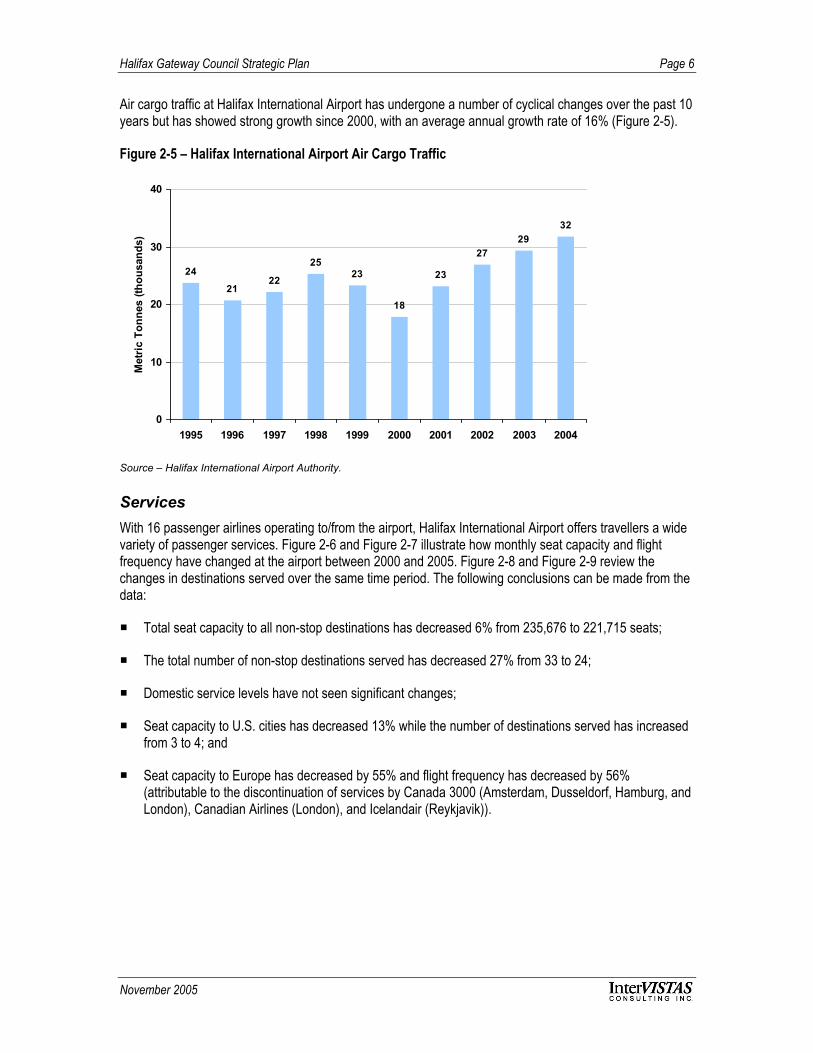
Air cargo traffic at Halifax International Airport has undergone a number of cyclical changes over the past 10years but has showed strong growth since 2000, with an average annual growth rate of 16% (Figure 2-5).
Figure 2-5 – Halifax International Airport Air Cargo Traffic
24
2122 23
18
23
2729
32
25
0
10
20
30
40
1995 1996 1997 1998 1999 2000 2001 2002 2003 2004
Met
ric T
onne
s (th
ousa
nds)
Source – Halifax International Airport Authority.
ServicesWith 16 passenger airlines operating to/from the airport, Halifax International Airport offers travellers a widevariety of passenger services. Figure 2-6 and Figure 2-7 illustrate how monthly seat capacity and flightfrequency have changed at the airport between 2000 and 2005. Figure 2-8 and Figure 2-9 review thechanges in destinations served over the same time period. The following conclusions can be made from thedata:
Total seat capacity to all non-stop destinations has decreased 6% from 235,676 to 221,715 seats;
The total number of non-stop destinations served has decreased 27% from 33 to 24;
Domestic service levels have not seen significant changes;
Seat capacity to U.S. cities has decreased 13% while the number of destinations served has increasedfrom 3 to 4; and
Seat capacity to Europe has decreased by 55% and flight frequency has decreased by 56%(attributable to the discontinuation of services by Canada 3000 (Amsterdam, Dusseldorf, Hamburg, andLondon), Canadian Airlines (London), and Icelandair (Reykjavik)).

Halifax Gateway Council Strategic Plan Page 7
November 2005
Figure 2-6 – Comparison of Halifax International Airport Seat Capacity by RegionJuly 2000 July 2005 % change
Seats Destinations Seats Destinations Seats Destinations
Canada 193,275 18 190,483 14 - 1% - 22%
U.S. 27,933 3 24,419 4 - 13% + 33%
Europe 13,808 11 6,213 5 - 55% - 55%
Central America 660 1 600 1 - 9% 0%
South America - - - - - -
Asia - - - - - -
Total 235,676 33 221,715 24 - 6% -27%
Source – Planet System.
Figure 2-7 – Comparison of Halifax International Airport Flight Frequency by RegionJuly 2000 July 2005 % change
Canada 2271 2270 -
U.S. 570 478 -16%
Europe 57 25 -56%
Central America 5 5 -
South America - - -
Total 2903 2778 -4%
Source – Planet System.
Figure 2-8 – Halifax International Airport Non-Stop Destinations in 2000 (33 destinations)
YHZ
BDA
BOS
YYC
YYG
YDF
FRA
YFC
GLA
YYR
YGR
LGWYQM
YUL MUC
EWR
YOW
YSJYYT
FSPYJT
AMS
DUS
YEG
YQXHAM
LHRYQB
KEF
YVR
IAD
YQIYYZ
Source – Planet System.

Halifax Gateway Council Strategic Plan Page 8
November 2005
Figure 2-9 – Halifax International Airport Non-Stop Destinations in 2005 (24 destinations)
YHZ
BDA
BOS
YYC
YYG
YDF
FRA
YFC
GLA
YYR
YGR
LGWYQM
YUL MUC
EWR
YOW
YSJYYT
FSPYJT
YHMDET
YYZ
JFK
Source – Planet System.
Air cargo capacity between 2000 and 2005 is reviewed in Figure 2-10. The following observations can bemade:
Halifax International Airport’s overall monthly capacity has decreased 3% from 2,676,000 kilograms in2000 to 2,594,000 kilograms in 2005;
Domestic cargo capacity has decreased by 8% or approximately 162,000 kilograms;
New services have been established to U.S. markets that were not available in 2000 (total cargocapacity to the U.S. was estimated to be 46,000 kilograms in July 2005; this increase in U.S. cargocapacity has offset some of the decreases in domestic capacity); and
Service to Europe increased roughly 5% during this period.
Figure 2-10 – Comparison of Halifax International Airport Air Cargo Capacity July 2000 July 2005
Kilograms % Share Kilograms % share% Change
Canada 1,992,000 74% 1,830,000 68% -8%
U.S. - - 46,000 2% -
Europe 684,000 26% 718,000 27% 5%
Central America - - - - -
South America - - - - -
Asia - - - - -
Total 2,676,000 2,594,000 -3%
Source – Planet System.

Halifax Gateway Council Strategic Plan Page 9
November 2005
Market/Competitive PositionIn its efforts to attract passenger and air cargo traffic, Halifax International Airport competes with otherfacilities in the region. For the purposes of this analysis, Halifax International Airport’s key competitors weredetermined to be Boston Logan International Airport, Toronto Pearson International Airport, Montreal PierreElliot Trudeau International Airport, and Ottawa International Airport (Figure 2-11).
Figure 2-11 – Halifax International Airport Competitors
Halifax
Montreal
BostonToronto
Ottawa
Facilities
The airside infrastructure available at Halifax International Airport and at competing facilities on the eastcoast is displayed in Figure 2-12. The following observations can be drawn:
Halifax International Airport is the smallest airport in terms of land size, just behind Boston;
Halifax International Airport’s longest runway is 2,682 metres in length, which can accommodate aBoeing 777, but is shorter than the longest runways at competing airports; and
Halifax International Airport ranks 5th with respect to gate capacity (29 gates).
Figure 2-12 – Comparison of Airside FacilitiesBoston Toronto Montreal Ottawa Halifax
Airport Area (hectares) 971 1,792 ~2,024 1,821 960
Number of Runways 5 5 3 3 2
Number of Gates 94 84 43 22 29
Longest Runway (m) 3,073 3,368 3,650 3,048 2,682
Source – Individual airports.

Halifax Gateway Council Strategic Plan Page 10
November 2005
The passenger terminal infrastructure available at Halifax International Airport and at competing facilities isdisplayed in Figure 2-13. The following observations can be made:
None of the airports have operating restrictions that would limit their capability to handle late nightservices; and
Halifax International Airport has the lowest number of check-in positions (44 in total).
Figure 2-13 – Comparison of Passenger FacilitiesBoston Toronto Montreal Ottawa Halifax
Number of Terminals 5 3 1 1 1Terminal Size (m2) 600,000+ 500,000+ 190,000+ 62,000 54,000Number ofCheck-In Positions 96 370 190 50 44
Number of BaggageCarousels 14 6 4 5
Operational Curfews No No No No NoTotal Carriers 60 57 28 11 25Source – Individual airports.
The cargo terminal infrastructure available at Halifax International Airport and at competing facilities isdisplayed in Figure 2-14. Halifax International Airport’s competitive position is highlighted below:
Halifax International Airport has the largest warehouse space among the competing airports; and
Halifax International Airport, Boston, and Toronto offer a wide range of services for handling specialisedgoods.
Figure 2-14 – Comparison of Air Cargo FacilitiesComponent Boston Toronto Montreal Ottawa Halifax
Number of Terminals 2 4 4 3 4
Number of All Cargo Airlines 9 10 23 2 6
Warehouse Space (m2) 51,000 82,000 64,000 - 110,051
Total Ramp Space (m2) 156,000 125,000 88,000 - 112,000
Heated Storage Yes Yes Yes Yes Yes
Agricultural Inspection Yes Yes Yes(70 kms away)
- Yes
Air Conditioned Storage Yes Yes Yes Yes
Refrigerated Storage Yes Yes Yes Yes Yes
Animal Quarantine Yes Yes Yes - Yes
Fresh Meat Inspection - Yes Yes Yes Yes
Dangerous Goods Yes Yes Yes Yes Yes
Radioactive Goods Yes Yes Yes Yes Yes
Customs Yes Yes Yes Yes Yes
Source – Individual airports.

Halifax Gateway Council Strategic Plan Page 11
November 2005
Traffic
Figure 2-15 compares total enplaned and deplaned passenger traffic at the competing airports in 2000 and2004. The following observations can be made:
From 2000 to 2004, total enplaned and deplaned passengers at these airports decreased 0.8% from71.6 million to 71,0 million;
Total enplaned and deplaned traffic at Halifax International Airport increased from 3.0 million in 2000 to3.2 million in 2004; and
Halifax International Airport’s market share increased from 4% to 5%.
Figure 2-15 – Comparison of Passenger Traffic
9,415
27,727
3,434
28,930
2,981
8,493
26,143
3,610
28,616
3,242
0
5,000
10,000
15,000
20,000
25,000
30,000
35,000
Halifax Montreal Toronto Ottawa Boston
Pas
seng
ers
(thou
sand
s)
2000 2004
Source – Planet System.
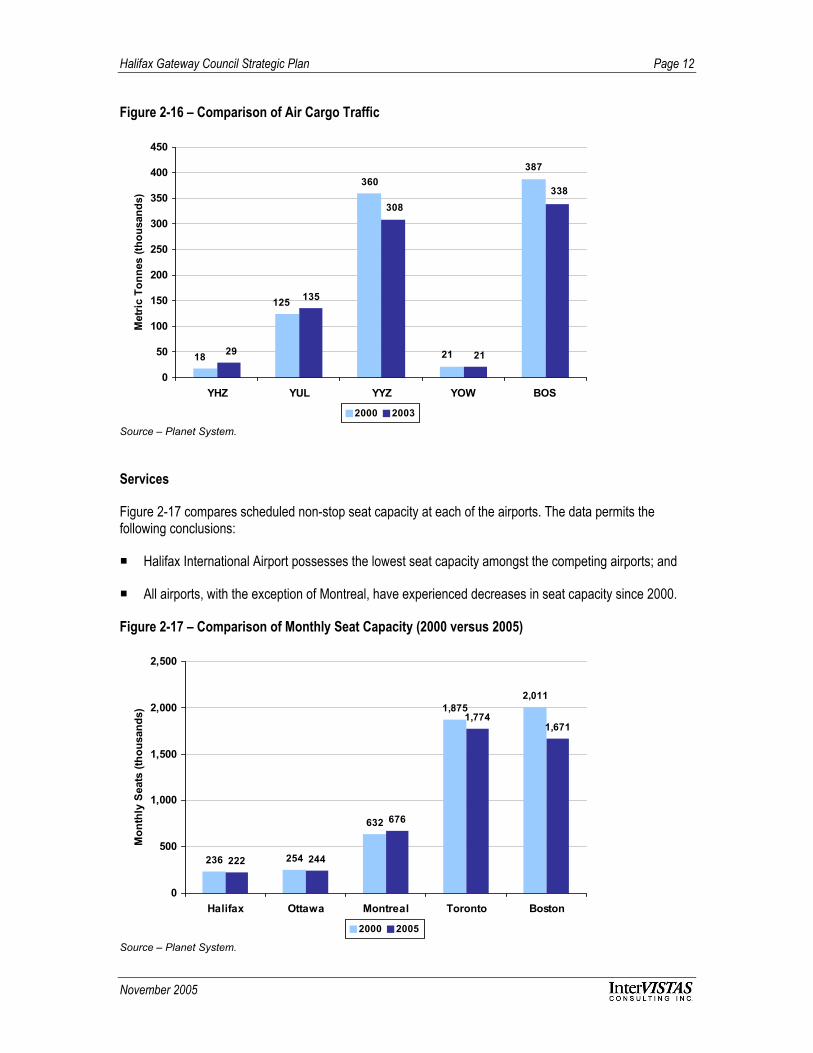
Figure 2-16 compares total air cargo traffic at the competing airports in 2000 and 2003 (the most recent dataavailable). The following observations can be drawn from the data:
Between 2000 and 2003, total air cargo traffic at these airports decreased by 9% from 911,000 tonnesto 832,000 tonnes;
Halifax International Airport traffic levels increased from 18,000 tonnes in 2000 to 29,000 tonnes in2003; and
Halifax International Airport’s market share increased from 2% in 2000 to 4% in 2003.
Halifax Gateway Council Strategic Plan Page 12
November 2005
Figure 2-16 – Comparison of Air Cargo Traffic
135
387
21
360
18
125
338
21
308
29
0
50
100
150
200
250
300
350
400
450
YHZ YUL YYZ YOW BOS
Met
ric T
onne
s (th
ousa
nds)
2000 2003
Source – Planet System.
Services
Figure 2-17 compares scheduled non-stop seat capacity at each of the airports. The data permits thefollowing conclusions:
Halifax International Airport possesses the lowest seat capacity amongst the competing airports; and
All airports, with the exception of Montreal, have experienced decreases in seat capacity since 2000.
Figure 2-17 – Comparison of Monthly Seat Capacity (2000 versus 2005)
236 254
632
1,8752,011
222 244
676
1,7741,671
0
500
1,000
1,500
2,000
2,500
Halifax Ottawa Montreal Toronto Boston
Mon
thly
Sea
ts (t
hous
ands
)
2000 2005
Source – Planet System.
Halifax Gateway Council Strategic Plan Page 13
November 2005
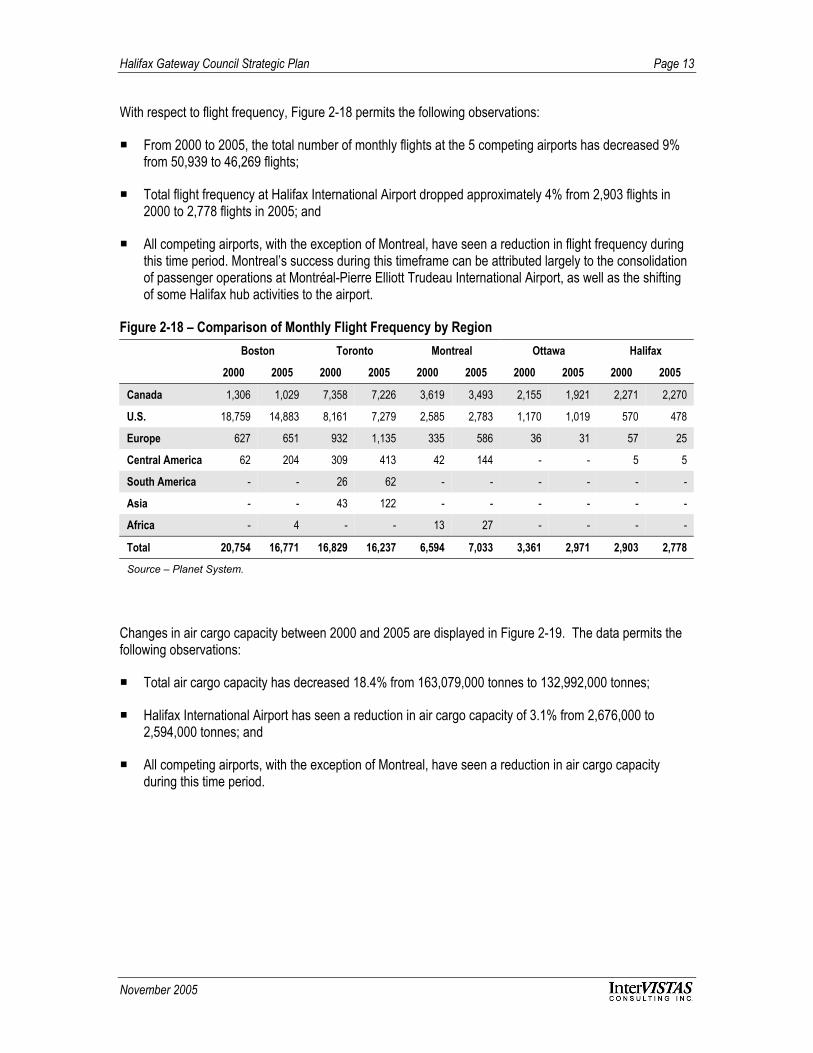
With respect to flight frequency, Figure 2-18 permits the following observations:
From 2000 to 2005, the total number of monthly flights at the 5 competing airports has decreased 9%from 50,939 to 46,269 flights;
Total flight frequency at Halifax International Airport dropped approximately 4% from 2,903 flights in2000 to 2,778 flights in 2005; and
All competing airports, with the exception of Montreal, have seen a reduction in flight frequency duringthis time period. Montreal’s success during this timeframe can be attributed largely to the consolidationof passenger operations at Montréal-Pierre Elliott Trudeau International Airport, as well as the shiftingof some Halifax hub activities to the airport.
Figure 2-18 – Comparison of Monthly Flight Frequency by RegionBoston Toronto Montreal Ottawa Halifax
2000 2005 2000 2005 2000 2005 2000 2005 2000 2005
Canada 1,306 1,029 7,358 7,226 3,619 3,493 2,155 1,921 2,271 2,270
U.S. 18,759 14,883 8,161 7,279 2,585 2,783 1,170 1,019 570 478
Europe 627 651 932 1,135 335 586 36 31 57 25
Central America 62 204 309 413 42 144 - - 5 5
South America - - 26 62 - - - - - -
Asia - - 43 122 - - - - - -
Africa - 4 - - 13 27 - - - -
Total 20,754 16,771 16,829 16,237 6,594 7,033 3,361 2,971 2,903 2,778
Source – Planet System.
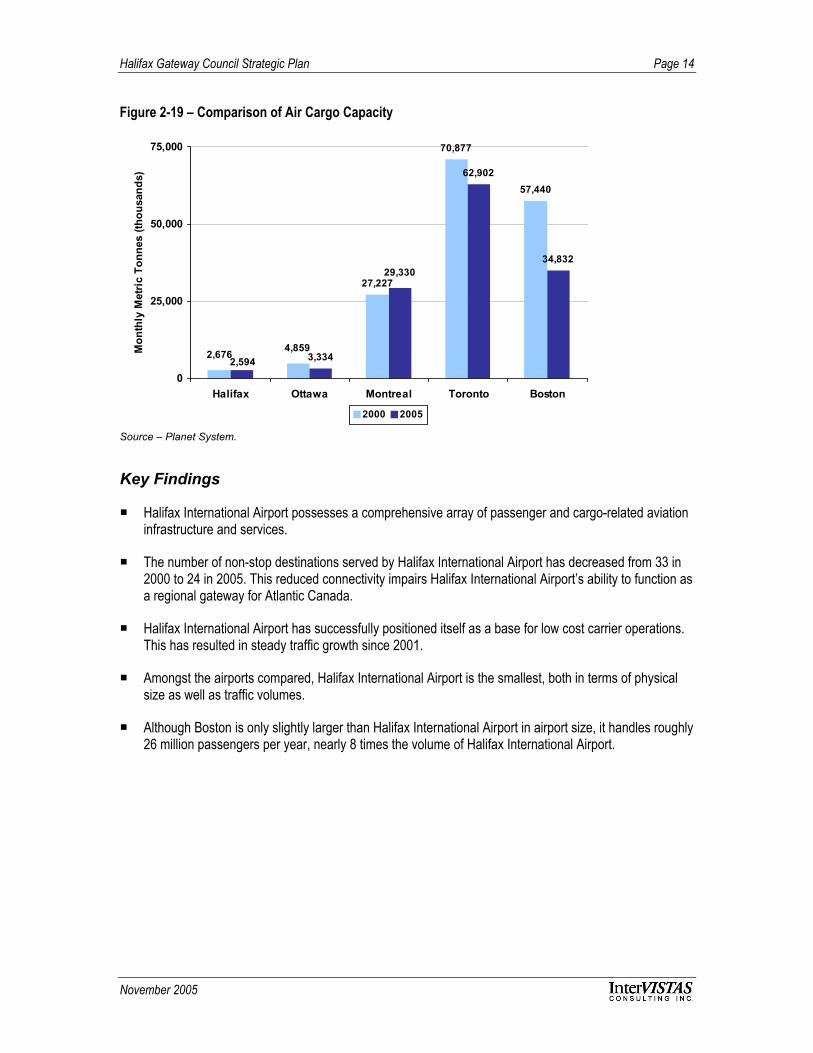
Changes in air cargo capacity between 2000 and 2005 are displayed in Figure 2-19. The data permits thefollowing observations:
Total air cargo capacity has decreased 18.4% from 163,079,000 tonnes to 132,992,000 tonnes;
Halifax International Airport has seen a reduction in air cargo capacity of 3.1% from 2,676,000 to2,594,000 tonnes; and
All competing airports, with the exception of Montreal, have seen a reduction in air cargo capacityduring this time period.
Halifax Gateway Council Strategic Plan Page 14
November 2005
Figure 2-19 – Comparison of Air Cargo Capacity
27,227
70,877
57,440
3,334
62,902
34,832
4,8592,676
29,330
2,5940
25,000
50,000
75,000
Halifax Ottawa Montreal Toronto Boston
Mon
thly
Met
ric
Tonn
es (t
hous
ands
)
2000 2005
Source – Planet System.
Key Findings
Halifax International Airport possesses a comprehensive array of passenger and cargo-related aviationinfrastructure and services.
The number of non-stop destinations served by Halifax International Airport has decreased from 33 in2000 to 24 in 2005. This reduced connectivity impairs Halifax International Airport’s ability to function asa regional gateway for Atlantic Canada.
Halifax International Airport has successfully positioned itself as a base for low cost carrier operations.This has resulted in steady traffic growth since 2001.
Amongst the airports compared, Halifax International Airport is the smallest, both in terms of physicalsize as well as traffic volumes.
Although Boston is only slightly larger than Halifax International Airport in airport size, it handles roughly26 million passengers per year, nearly 8 times the volume of Halifax International Airport.
Halifax Gateway Council Strategic Plan Page 15
November 2005
2.2 Port – Shipping
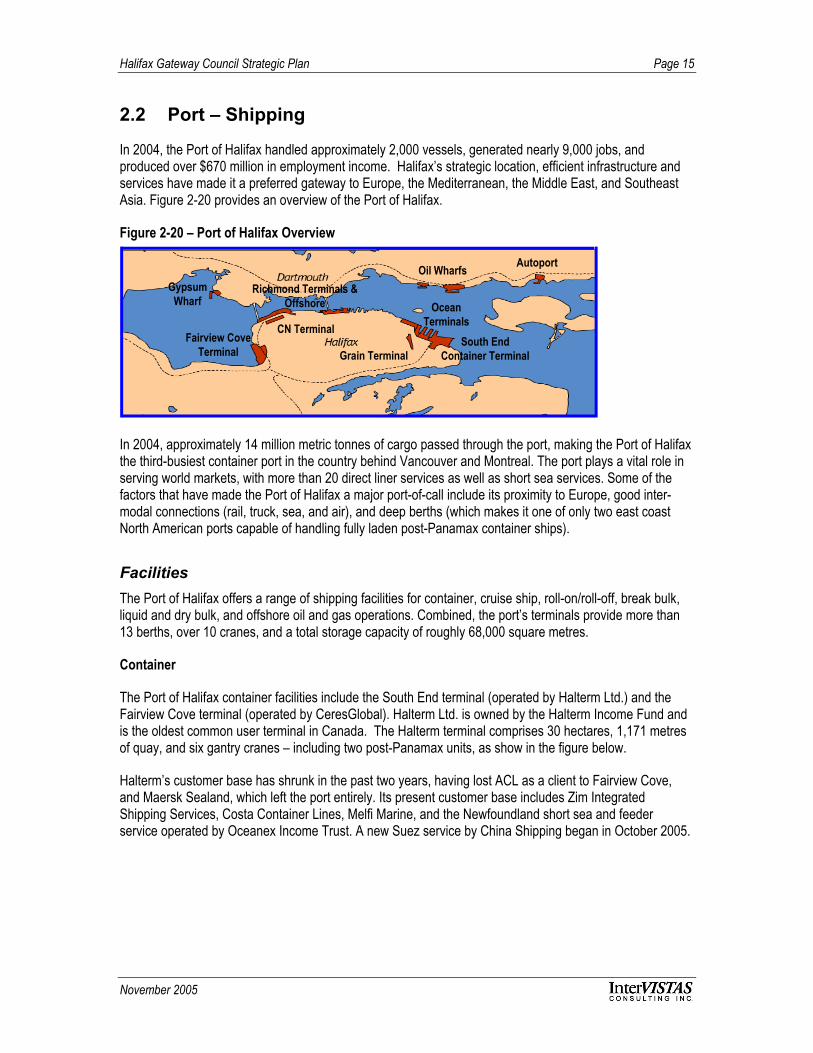
In 2004, the Port of Halifax handled approximately 2,000 vessels, generated nearly 9,000 jobs, andproduced over $670 million in employment income. Halifax’s strategic location, efficient infrastructure andservices have made it a preferred gateway to Europe, the Mediterranean, the Middle East, and SoutheastAsia. Figure 2-20 provides an overview of the Port of Halifax.
Figure 2-20 – Port of Halifax Overview
Fairview CoveTerminal
South EndContainer Terminal
Autoport
CN Terminal
GypsumWharf
Grain Terminal
OceanTerminals
Richmond Terminals &Offshore
Oil Wharfs
In 2004, approximately 14 million metric tonnes of cargo passed through the port, making the Port of Halifaxthe third-busiest container port in the country behind Vancouver and Montreal. The port plays a vital role inserving world markets, with more than 20 direct liner services as well as short sea services. Some of thefactors that have made the Port of Halifax a major port-of-call include its proximity to Europe, good inter-modal connections (rail, truck, sea, and air), and deep berths (which makes it one of only two east coastNorth American ports capable of handling fully laden post-Panamax container ships).
Facilities The Port of Halifax offers a range of shipping facilities for container, cruise ship, roll-on/roll-off, break bulk,liquid and dry bulk, and offshore oil and gas operations. Combined, the port’s terminals provide more than13 berths, over 10 cranes, and a total storage capacity of roughly 68,000 square metres.
Container
The Port of Halifax container facilities include the South End terminal (operated by Halterm Ltd.) and theFairview Cove terminal (operated by CeresGlobal). Halterm Ltd. is owned by the Halterm Income Fund andis the oldest common user terminal in Canada. The Halterm terminal comprises 30 hectares, 1,171 metresof quay, and six gantry cranes – including two post-Panamax units, as show in the figure below.
Halterm’s customer base has shrunk in the past two years, having lost ACL as a client to Fairview Cove,and Maersk Sealand, which left the port entirely. Its present customer base includes Zim IntegratedShipping Services, Costa Container Lines, Melfi Marine, and the Newfoundland short sea and feederservice operated by Oceanex Income Trust. A new Suez service by China Shipping began in October 2005.
Halifax Gateway Council Strategic Plan Page 16
November 2005
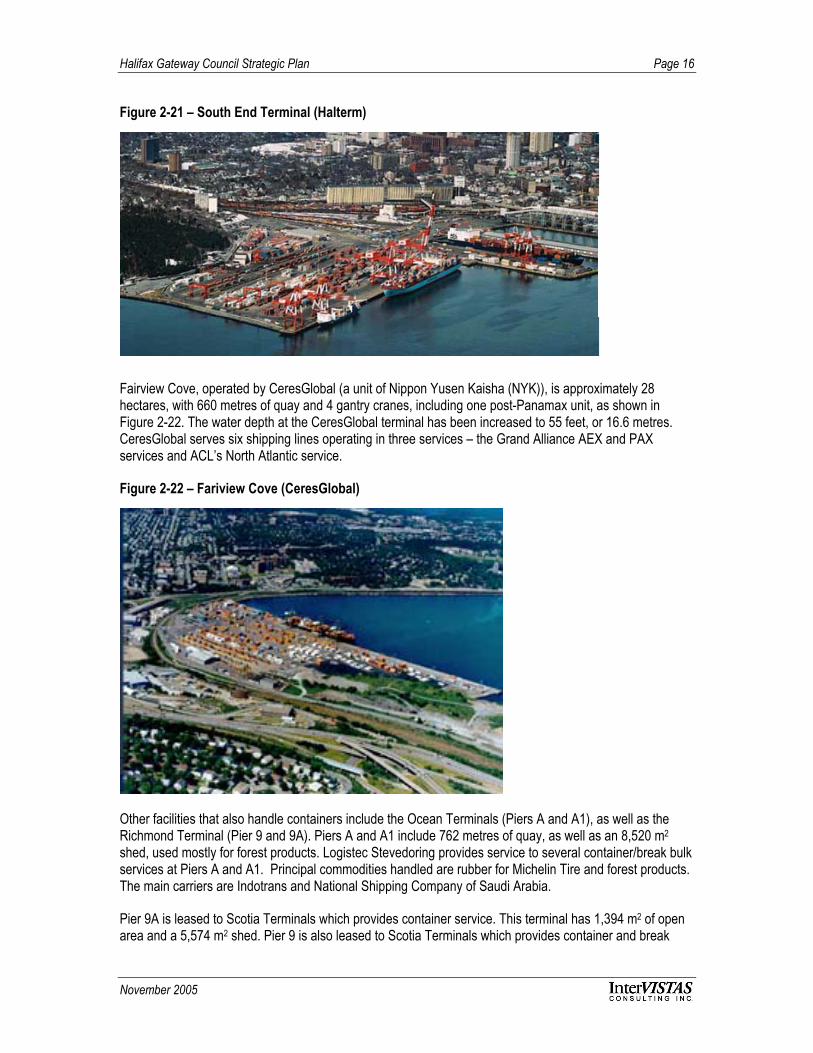
Figure 2-21 – South End Terminal (Halterm)
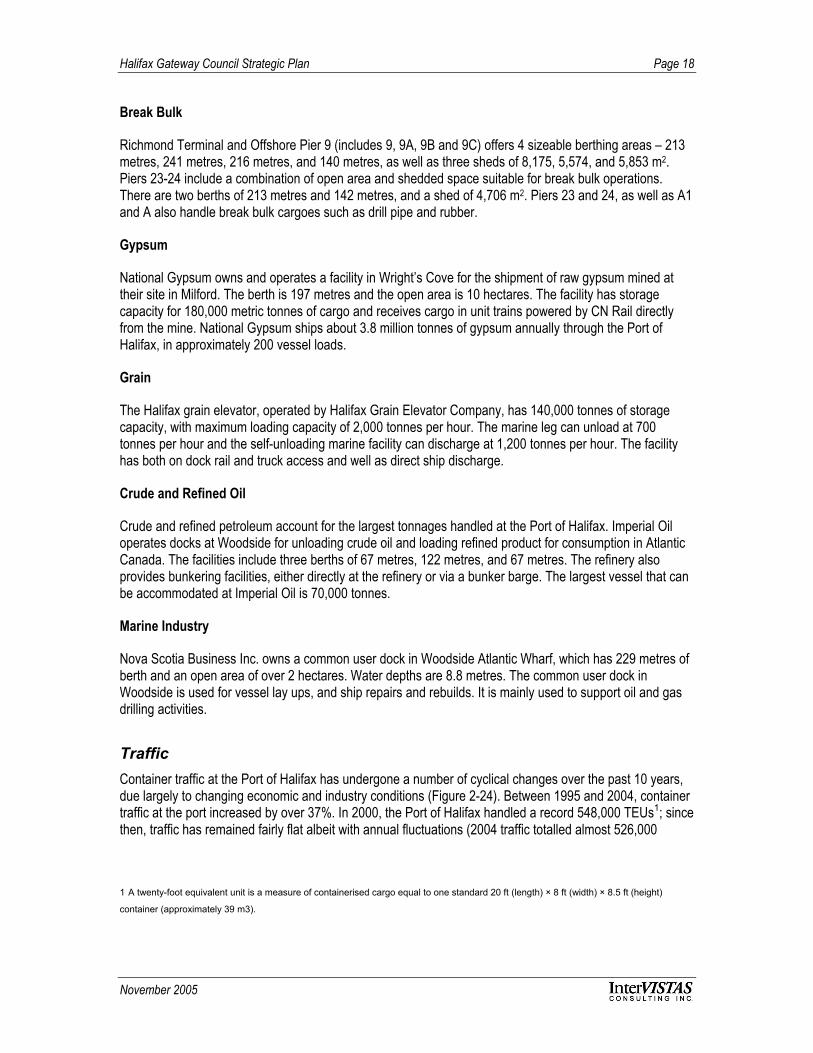
Fairview Cove, operated by CeresGlobal (a unit of Nippon Yusen Kaisha (NYK)), is approximately 28hectares, with 660 metres of quay and 4 gantry cranes, including one post-Panamax unit, as shown inFigure 2-22. The water depth at the CeresGlobal terminal has been increased to 55 feet, or 16.6 metres.CeresGlobal serves six shipping lines operating in three services – the Grand Alliance AEX and PAXservices and ACL’s North Atlantic service.
Figure 2-22 – Fariview Cove (CeresGlobal)
Other facilities that also handle containers include the Ocean Terminals (Piers A and A1), as well as theRichmond Terminal (Pier 9 and 9A). Piers A and A1 include 762 metres of quay, as well as an 8,520 m2
shed, used mostly for forest products. Logistec Stevedoring provides service to several container/break bulkservices at Piers A and A1. Principal commodities handled are rubber for Michelin Tire and forest products.The main carriers are Indotrans and National Shipping Company of Saudi Arabia.
Pier 9A is leased to Scotia Terminals which provides container service. This terminal has 1,394 m2 of openarea and a 5,574 m2 shed. Pier 9 is also leased to Scotia Terminals which provides container and break

Halifax Gateway Council Strategic Plan Page 17
November 2005
bulk service to Cuba via Nirint Shipping Line. The principal break bulk commodity is nickel sulphite, which isshipped by rail to Alberta.
Roll-On/Roll-Off
Autoport is a 41-hectare facility, as displayed in Figure 2-23, with a 201-metre wharf that handles roll-on androll-off cargo. It also has five rail sidings for inward and outward vehicle processing. Autport processesEuropean import vehicles and domestic vehicles destined for Atlantic Canada. Autoport is 100% owned byCN Rail, and North American network of similar facilities under the same brand is managed from Halifax.
Figure 2-23 – Autoport
Autoport processes approximately 100,000 autos per annum through Eastern Passage. These compriseEuropean imports, well as domestic autos destined for the Atlantic Canada market, including all vehiclesexcept DaimlerChrysler products, going to Newfoundland. Other roll-on/roll-off cargoes are handled at theSouth End, Fairview Cove, and Piers A1 and A.
Offshore Oil and Gas
The port has two offshore supply bases, one at Richmond Offshore (Pier 9B, 9C and Area 9D), which isleased to EnCana Corporation, and another owned and operated by ExxonMobil at Woodside. RichmondOffshore includes two berths of 216 metres and 140 metres, and one 5,853 m2 shed. It also includes twoopen areas of 9,290 m2 and 21,368 m2, respectively. The EnCana base is operated on a common userbasis, whereas the ExxonMobil base is not.
Intermodal
CN operates Halifax Intermodal Terminal (HIT) near Richmond Terminals in the north end of the city. Itoffers on-dock double stack train service direct to Montreal, Toronto, and Chicago. Two gantry cranes canhandle 150 units per day, with total annual lift capacity of 52,000 units. CN handles about 25,000intermodal units per annum at HIT. The facility handles CN’s own intermodal cargo, as well as truckers’ andmajor retailers’ 53 foot domestic intermodal containers.
Halifax Gateway Council Strategic Plan Page 18
November 2005
Break Bulk
Richmond Terminal and Offshore Pier 9 (includes 9, 9A, 9B and 9C) offers 4 sizeable berthing areas – 213metres, 241 metres, 216 metres, and 140 metres, as well as three sheds of 8,175, 5,574, and 5,853 m2.Piers 23-24 include a combination of open area and shedded space suitable for break bulk operations.There are two berths of 213 metres and 142 metres, and a shed of 4,706 m2. Piers 23 and 24, as well as A1and A also handle break bulk cargoes such as drill pipe and rubber.
Gypsum
National Gypsum owns and operates a facility in Wright’s Cove for the shipment of raw gypsum mined attheir site in Milford. The berth is 197 metres and the open area is 10 hectares. The facility has storagecapacity for 180,000 metric tonnes of cargo and receives cargo in unit trains powered by CN Rail directlyfrom the mine. National Gypsum ships about 3.8 million tonnes of gypsum annually through the Port ofHalifax, in approximately 200 vessel loads.
Grain
The Halifax grain elevator, operated by Halifax Grain Elevator Company, has 140,000 tonnes of storagecapacity, with maximum loading capacity of 2,000 tonnes per hour. The marine leg can unload at 700tonnes per hour and the self-unloading marine facility can discharge at 1,200 tonnes per hour. The facilityhas both on dock rail and truck access and well as direct ship discharge.
Crude and Refined Oil
Crude and refined petroleum account for the largest tonnages handled at the Port of Halifax. Imperial Oiloperates docks at Woodside for unloading crude oil and loading refined product for consumption in AtlanticCanada. The facilities include three berths of 67 metres, 122 metres, and 67 metres. The refinery alsoprovides bunkering facilities, either directly at the refinery or via a bunker barge. The largest vessel that canbe accommodated at Imperial Oil is 70,000 tonnes.
Marine Industry
Nova Scotia Business Inc. owns a common user dock in Woodside Atlantic Wharf, which has 229 metres ofberth and an open area of over 2 hectares. Water depths are 8.8 metres. The common user dock inWoodside is used for vessel lay ups, and ship repairs and rebuilds. It is mainly used to support oil and gasdrilling activities.
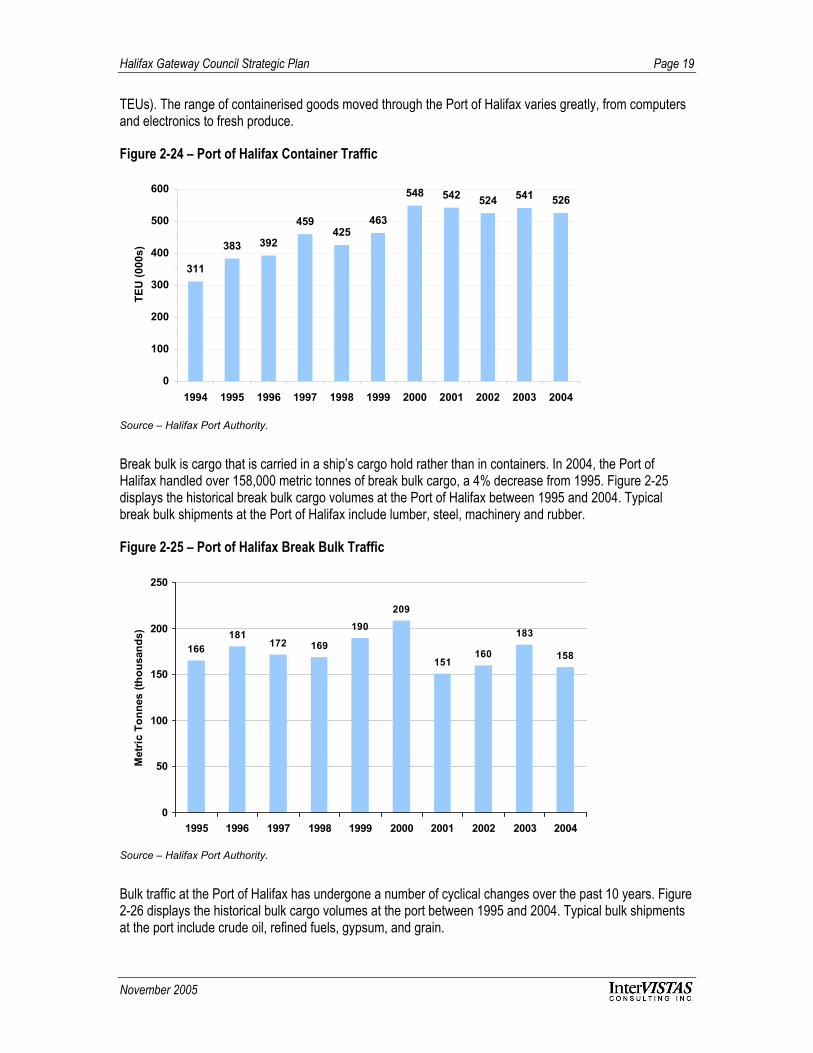
TrafficContainer traffic at the Port of Halifax has undergone a number of cyclical changes over the past 10 years,due largely to changing economic and industry conditions (Figure 2-24). Between 1995 and 2004, containertraffic at the port increased by over 37%. In 2000, the Port of Halifax handled a record 548,000 TEUs1; sincethen, traffic has remained fairly flat albeit with annual fluctuations (2004 traffic totalled almost 526,000
1 A twenty-foot equivalent unit is a measure of containerised cargo equal to one standard 20 ft (length) × 8 ft (width) × 8.5 ft (height)
container (approximately 39 m3).
Halifax Gateway Council Strategic Plan Page 19
November 2005
TEUs). The range of containerised goods moved through the Port of Halifax varies greatly, from computersand electronics to fresh produce.
Figure 2-24 – Port of Halifax Container Traffic
311
383 392
459425
463
548 542 524 541 526
0
100
200
300
400
500
600
1994 1995 1996 1997 1998 1999 2000 2001 2002 2003 2004
TEU
(000
s)
Source – Halifax Port Authority.
Break bulk is cargo that is carried in a ship’s cargo hold rather than in containers. In 2004, the Port ofHalifax handled over 158,000 metric tonnes of break bulk cargo, a 4% decrease from 1995. Figure 2-25displays the historical break bulk cargo volumes at the Port of Halifax between 1995 and 2004. Typicalbreak bulk shipments at the Port of Halifax include lumber, steel, machinery and rubber.
Figure 2-25 – Port of Halifax Break Bulk Traffic
166181
172 169
190
209
151160
183
158
0
50
100
150
200
250
1995 1996 1997 1998 1999 2000 2001 2002 2003 2004
Met
ric T
onne
s (th
ousa
nds)
Source – Halifax Port Authority.
Bulk traffic at the Port of Halifax has undergone a number of cyclical changes over the past 10 years. Figure2-26 displays the historical bulk cargo volumes at the port between 1995 and 2004. Typical bulk shipmentsat the port include crude oil, refined fuels, gypsum, and grain.

Halifax Gateway Council Strategic Plan Page 20
November 2005
Figure 2-26 – Port of Halifax Bulk Traffic
9,476 9,3389,880
9,3019,823
8,999 9,248
8,2068,800 9,000
0
2,000
4,000
6,000
8,000
10,000
12,000
1995 1996 1997 1998 1999 2000 2001 2002 2003 2004
Met
ric T
onne
s (th
ousa
nds)
Source – Halifax Port Authority.
Roll-on and roll-off traffic, including automobiles, accounted from roughly 1% of the total cargo movedthrough the Port of Halifax in 2004. Almost 200,000 metric tonnes of roll-on/roll-off cargo was handledduring the year, representing an 8% decrease from the previous year.
Market/Competitive PositionMarket Position
Halifax serves a number of key markets, including Atlantic Canada, Quebec, Ontario, New England, and theU.S. mid-west. Figure 2-27 outlines the four major geographic markets and their population base.
Figure 2-27– Port of Halifax Market Regions and PopulationMarket Population
Atlantic Canada 2.3 million
Quebec 7.4 million
Ontario 11.8 million
U.S. Midwest 67.9 million
Source – Statistics Canada, Census of Canada, and U.S. Census.
Most of the Port of Halifax’s cargo is origin and destination to/from Atlantic Canada, Quebec, and Ontario.The Maritime provinces (Nova Scotia, New Brunswick, and Prince Edward Island) are served by truck.Quebec, Ontario, and the U.S. mid-west are served by rail.
With a bi-weekly short sea service, Halifax also handles cargo moving between the Canadian mainland andNewfoundland, a significant portion of which is overseas transhipment cargo. It also handles New Englandto Portland and Boston cargo via feeder. Another weekly service provides transhipment service to St. Pierreet Miquelon. Figure 2-28 summarises the Port of Halifax’s container traffic by origin and destination.

Halifax Gateway Council Strategic Plan Page 21
November 2005
Figure 2-28 – Port of Halifax Container Tonnage by Origin/Destination 2004
Province/State Tonnes Laden TEUs(10 tonnes per TEU)
Atlantic Canada 848,698 84,870
Inland Canada 2,060,379 206,037
- Quebec 903,729 90,373
- Ontario 953,010 95,301
- Western Canada 203,640 20,364
Total Canada 2,909,077 290,907
Inland U.S.
- U.S. Midwest 724,485 72,448
- New England 345,381 34,538
- Rest of U.S. 527,533 52,753
Total U.S. 1,597,399 159,739
Other Markets 518,178 52,753
Total 4,497,123 450,649
Source – Halifax Port Authority.
Most importantly from the point of view of the Halifax Gateway, the Port of Halifax is Atlantic Canada’sgateway to world markets. Even though it has a smaller market share than Montreal, it offers more servicesto more world ports than any other port in eastern Canada, with services to and from the United Kingdom,North Europe, Baltic, Mediterranean, Middle East, Indian sub-continent, South East Asia, Far East, andAustralia/New Zealand ports. The volume of regional cargo is comparatively small, and to provide the rangeof services available, is very dependant upon the larger volumes of cargo going to or from larger inlandmarkets. The total export and import volumes for the combined mix of shipping lines offering service at thePort of Halifax is shown in Figure 2-29.

Halifax Gateway Council Strategic Plan Page 22
November 2005
Figure 2-29 – Port of Halifax Container Traffic by Region
Route/Region Export(tonnes)
Import(tonnes)
Total(tonnes)
U.K. Continent 469,685 683,675 1,153,360
Mediterranean 222,682 511,684 734,547
China and Indian SubContinent 402,613 185,740 588,353
Far East 351,490 108,450 459,940
Other Canada/U.S. 229,951 30,995 260,946
Caribbean 173,296 69,016 242,313
Middle East 102,746 72,791 175,537
Central America 120,835 40,154 160,989
Scandinavia 32,959 98,566 131,525
South America 107,903 18,255 126,058
Eastern Europe 22,857 1,177 24,034
Africa 17,289 619 17,908
Oceania 1,482 2,092 3,574
Transhipment 245,044 172,995 418,039
Total 2,500,732 1,996,390 4,497,123
Source – Halifax Port Authority.
Competitive Position
In its efforts to attract cargo and passenger traffic, the Port of Halifax competes with other ports in the NorthAtlantic region. For the purposes of this analysis, Port of Halifax’s key competitors were determined to bethe Port of New York/New Jersey, the Port of Virginia, and the Port of Montreal (Figure 2-30). The followingsections review the Port of Halifax’s competitive position relative to these facilities.

Halifax Gateway Council Strategic Plan Page 23
November 2005
Figure 2-30 – Port of Halifax Shipping Competitors
Halifax
Montreal
New York
Norfolk
Facilities
Port of New York/New Jersey
The Port of New York/New Jersey is located at the centre of one of the world’s most concentrated andaffluent consumer markets. In 2004, more than 25 million tonnes of oceanborne general cargo movedthrough the port, including 4.5 million TEUs of containerised cargo. The majority of this cargo is processedthrough four terminals managed by the Port Authority of New York/New Jersey:
Port Newark/Elizabeth-Port Authority Marine Terminal complex (NJ) (2 terminals);
PA Auto Marine Terminal (NJ) (1 terminal);
Brooklyn Piers Red Hook Container Terminal (NY) (1 terminal and 2 piers); and
Howland Hook Marine Terminal (NY) (1 terminal).
The remaining cargo is handled by private operators such as Global Marine Terminal, the City of New York'sSouth Brooklyn Terminal, and a number of marine terminals operated by private oil companies along thesouthern coastline of New Jersey (which handle loads such as imported liquid bulk crude oil). The port isequipped with a variety of cranes, including Paceco, Paceco Post-Panamax, and ZPMC Post-Panamax.
Ports of Virginia
The Virginia ports are located just 18 nautical miles from the open sea in a year-round, ice-free harbouroffering deep waters of up to 15.2 metres. The ports provide an unobstructed channel that allows easyaccess and manoeuvring room for very large container vessels. The Ports of Virginia own four general

Halifax Gateway Council Strategic Plan Page 24
November 2005
cargo terminals – Norfolk International Terminals, Portsmouth Marine Terminal, Newport News MarineTerminal, and the Virginia Inland Port in Front Royal. All facilities are operated by Virginia InternationalTerminals Inc., a non-profit operating affiliate of the Virginia Port Authority. The port is equipped with chassisstackers, container cranes, a gantry crane, PACECO cranes, Kone cranes, a CEMCO crane, a Deer Parkcrane, and a Clyde Gantry crane.
In addition, the port is connected to an extensive, modern network of interstate and local highways thatpermit direct inland motor-freight transportation to any point in the U.S. Currently, more than 50 motor-carrier companies offer full freight-handling and load-consolidation services at the port.
Port of Montreal
Montreal is one of the busiest inland ports in the world, and a key transfer point for transatlantic cargo.Approximately half of its containerised cargo traffic is destined to/from from the Canadian market, mainlyQuebec and Ontario, with the other half to/from the U.S. market. The Port of Montreal has excellent raillinks that provide shippers with faster transit times to several U.S. destinations – such as Chicago andDetroit – than the port of New York. The port operates six container terminals – Bickerdike Complex (9berths), Racine Terminal (8), Maisonneuve Terminal (4), Cast Terminal (6) and 4 specialised terminals(Grain Terminal (3 berths), Contrecoeur Terminal (2), Petroleum Berths (11), and Logistics Berths (20)).The port is equipped with 30-60 tonne dockside gantry and yard gantry cranes.
Figure 2-31– Comparison of Shipping FacilitiesNY/NJ Norfolk Montreal Halifax
Number of Terminals 5 4 6 6
Terminal Size (acres) 1,423 acres 1,330 acres 175 acres 145 acres
Number of Berths 21+ 30+ 13+
Number of Cranes 34+ 19+ 31+ 10+
Berth Depth Range (m) 9.9 – 12.8 9.2 – 15.2 7.6 – 10.7 8.8 – 16.8
Cargo CapabilitiesContainer, roll-on/
roll-off, bulk,breakbulk, neobulk
Container, roll-on/roll-off, bulk,breakbulk
Container, roll-on/roll-off, bulk,breakbulk
Container, roll-on/roll-off, bulk,breakbulk
Specialized ServicesAuto exports,
fumigation facilities,wallboard
manufacturing- -
Gypsum, oil, autoimports, ship repair,
grain elevator
Storage Capacity(tonnes) - - -
68,000 m2 (excludingspecialized service
areas)
Intermodal ConnectionsOn-dock rail
connection, truck andhighway access
On-dock double-stackrail service, on-dockrail service, truck and
highway access
On-dock double-stackrail service, on-dockrail service, truck and
highway access
Source – Individual ports.

Halifax Gateway Council Strategic Plan Page 25
November 2005
Traffic
In terms of this analysis, the two most relevant market positions are those for container traffic and cruisevessel throughput. While container cargo grew around the turn of the 21st century, the Port of Halifax’smarket share, in terms of its North Atlantic competitors, has fallen almost continuously in the past decade. Inthe past five years, its traffic has stagnated or declined in an overall market that has grown 32% during thepast five years.
Figure 2-32 shows the amount of container traffic at all four ports between 2000 and 2004. Overall,container traffic has risen an average of 5.7% per annum from 6,088,379 TEUs in 2000 to 8,039,282 TEUsin 2004.
Figure 2-32 – Comparison of Container Traffic (TEUs)Port 2000 2001 2002 2003 2004
Halifax 548,404 541,640 524,336 541,650 525,553
Montreal 1,014,148 989,427 1,054,603 1,108,837 1,226,296
Norfolk 1,347,517 1,303,797 1,437,779 1,646,279 1,808,953
New York 3,178,310 3,316,275 3,749,014 4,067,811 4,478,480
Total 6,088,379 6,151,139 6,765,732 7,364,577 8,039,282
Source – Individual ports.
Figure 2-33 displays the relative market shares of each port during this same time period. In terms of marketshare, the Port of Halifax’s market share has declined from roughly 9% in 2000 to approximately 6.5% in2004. By comparison, the Port of New York/New Jersey has seen its market share grow by 3.5 points duringthis period.
Figure 2-33 – Comparison of Market SharePort 2000 2001 2002 2003 2004
Halifax 9.0% 8.8% 7.7% 7.4% 6.5%
Montreal 16.7% 16.1% 15.6% 15.1% 15.3%
Norfolk 22.1% 21.2% 21.3% 22.4% 22.5%
New York 52.2% 53.9% 55.4% 55.2% 55.7%
Total 100.0% 100.0% 100.0% 100.0% 100.0%
Source – Individual ports.
Key Findings
The Port of Halifax possesses a comprehensive array of uncongested shipping infrastructure andservices.
The Port of Halifax’s overall container traffic and market share declined between 2000 and 2004. Thishas occurred in a market that experienced growth of 32% during the period.
Even though it has a smaller market share than Montreal, the Port of Halifax offers more services tomore world ports than any other port in eastern Canada.

Halifax Gateway Council Strategic Plan Page 26
November 2005
2.3 Port – Cruise
FacilitiesPassenger Terminals
The Pier 21 Cruise Pavilion currently offers the best cruise line and passenger experience in terms of port-of-call and potential homeport operations in Halifax. For Piers 20 to 22, the largest issue for homeportinglies in the width of the apron area and access onto the apron by supply trucks. Piers 30 and 31 are preferredfor homeport operations due to the size of the aprons and additional walking room for passengers. Overall,both pier length and height of the berths are sufficient for all of the major cruise ships operating in theregion.
The Pier 21 Cruise Pavilion, in many ways, reflects the current thinking regarding cruise vessel port-of-callfacilities. It is a renovated structure situated close to the downtown area where passengers can enjoy thedestination and where there is a mix of retail and other uses incorporated into the cruise complex. It is in thisproximity to the downtown area that the Pier 21 Cruise Pavilion serves as a significant strength for Halifax,an observation supported by responses from cruise line operational personnel.
Apron and Gangways
Apron areas for cruise ship operations are small and would present significant challenges for cruise vesselhomeport operations, especially those requiring provisions associated with a homeport operation. Apronwidths are generally less than 25-feet (7.6 metres) for the Seawall – Piers 20 to 23. By comparison, cruiselines generally prefer apron widths of approximately twice this amount (50-feet/15.2-metres.) for homeportoperations.
Ground Transportation Area
Ground transportation areas within the Pier 20 and 21 areas provide adequate marshalling space for up to40 motorcoaches, however, with more than one tour operator supporting ship operations on a given call,communication and cooperation will be an essential element for further development. Incorporating ahomeport operational plan will assist in overall efforts to attract cruise homeporting operations.
Availability of Other Cruise Berthing Areas
As noted above, additional cruise berthing – apart from the Pier 21 and 20 berths – is available for use asrequired, although at present, Halifax would primarily be a one-ship homeport operation utilising the Pier 21Cruise Pavilion. Within the context of the general cruise homeport market in the region, this is not presentlya significant constraint for the future growth of cruise homeport operations in Halifax.
Provisioning
The availability of provisions is a strong point for Halifax, and with potential exchange rate savings on theCanadian dollar, may serve as a strength for the destination overall. While the provisioning area along theapron is small, the availability of provisions and stores is reported as good.
TrafficCruise passenger traffic at the Port of Halifax has grown considerably over the past 10 years from roughly30,000 passengers in 1995 to approximately 213,000 passengers in 2004 (an increase of over 600%).
Halifax Gateway Council Strategic Plan Page 27
November 2005
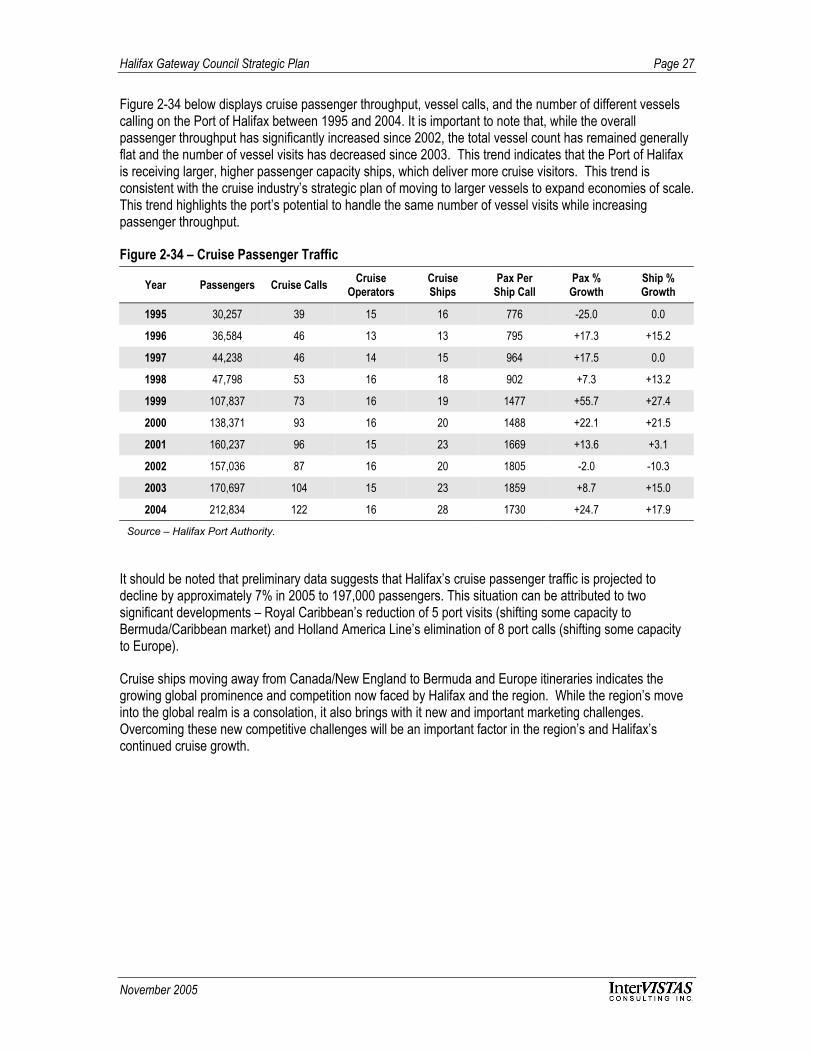
Figure 2-34 below displays cruise passenger throughput, vessel calls, and the number of different vesselscalling on the Port of Halifax between 1995 and 2004. It is important to note that, while the overallpassenger throughput has significantly increased since 2002, the total vessel count has remained generallyflat and the number of vessel visits has decreased since 2003. This trend indicates that the Port of Halifaxis receiving larger, higher passenger capacity ships, which deliver more cruise visitors. This trend isconsistent with the cruise industry’s strategic plan of moving to larger vessels to expand economies of scale.This trend highlights the port’s potential to handle the same number of vessel visits while increasingpassenger throughput.
Figure 2-34 – Cruise Passenger Traffic
Year Passengers Cruise Calls CruiseOperators
CruiseShips
Pax PerShip Call
Pax %Growth
Ship %Growth
1995 30,257 39 15 16 776 -25.0 0.0
1996 36,584 46 13 13 795 +17.3 +15.2
1997 44,238 46 14 15 964 +17.5 0.0
1998 47,798 53 16 18 902 +7.3 +13.2
1999 107,837 73 16 19 1477 +55.7 +27.4
2000 138,371 93 16 20 1488 +22.1 +21.5
2001 160,237 96 15 23 1669 +13.6 +3.1
2002 157,036 87 16 20 1805 -2.0 -10.3
2003 170,697 104 15 23 1859 +8.7 +15.0
2004 212,834 122 16 28 1730 +24.7 +17.9
Source – Halifax Port Authority.
It should be noted that preliminary data suggests that Halifax’s cruise passenger traffic is projected todecline by approximately 7% in 2005 to 197,000 passengers. This situation can be attributed to twosignificant developments – Royal Caribbean’s reduction of 5 port visits (shifting some capacity toBermuda/Caribbean market) and Holland America Line’s elimination of 8 port calls (shifting some capacityto Europe).
Cruise ships moving away from Canada/New England to Bermuda and Europe itineraries indicates thegrowing global prominence and competition now faced by Halifax and the region. While the region’s moveinto the global realm is a consolation, it also brings with it new and important marketing challenges.Overcoming these new competitive challenges will be an important factor in the region’s and Halifax’scontinued cruise growth.
Halifax Gateway Council Strategic Plan Page 28
November 2005
Market/Competitive PositionMarket Position
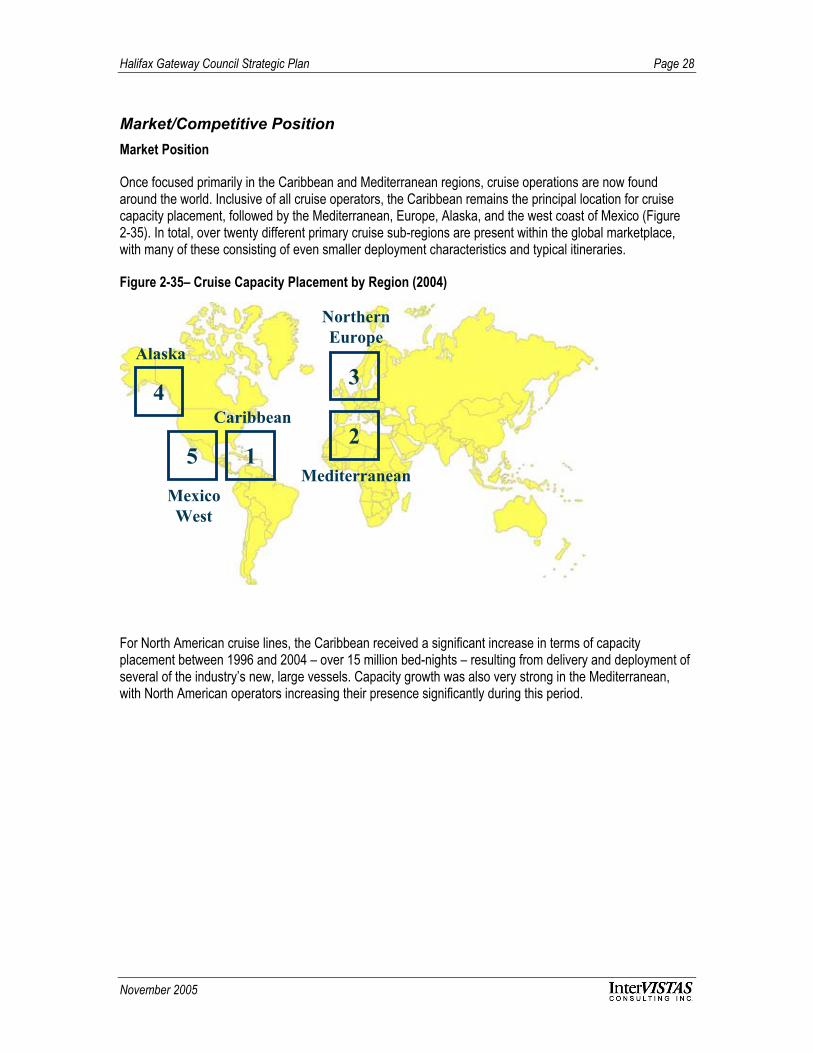
Once focused primarily in the Caribbean and Mediterranean regions, cruise operations are now foundaround the world. Inclusive of all cruise operators, the Caribbean remains the principal location for cruisecapacity placement, followed by the Mediterranean, Europe, Alaska, and the west coast of Mexico (Figure2-35). In total, over twenty different primary cruise sub-regions are present within the global marketplace,with many of these consisting of even smaller deployment characteristics and typical itineraries.
Figure 2-35– Cruise Capacity Placement by Region (2004)
4
Alaska
5MexicoWest
1
Caribbean
3
NorthernEurope
2Mediterranean
For North American cruise lines, the Caribbean received a significant increase in terms of capacityplacement between 1996 and 2004 – over 15 million bed-nights – resulting from delivery and deployment ofseveral of the industry’s new, large vessels. Capacity growth was also very strong in the Mediterranean,with North American operators increasing their presence significantly during this period.
Halifax Gateway Council Strategic Plan Page 29
November 2005
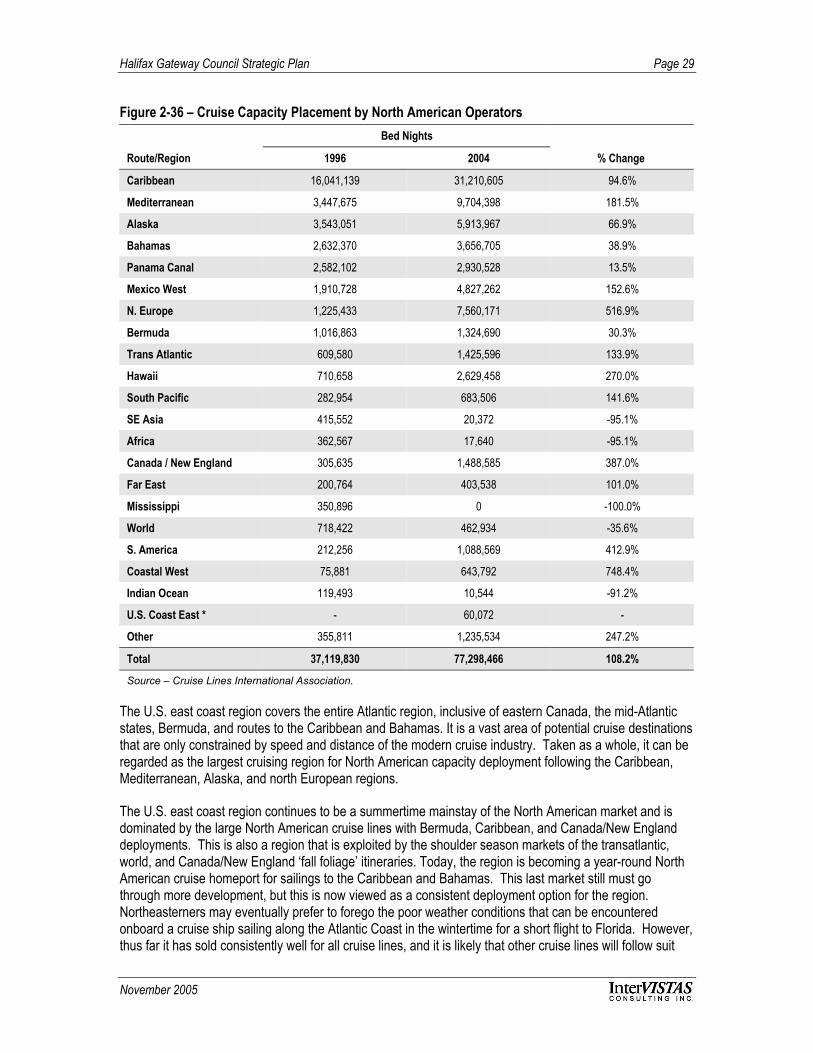
Figure 2-36 – Cruise Capacity Placement by North American OperatorsBed Nights
Route/Region 1996 2004 % Change
Caribbean 16,041,139 31,210,605 94.6%
Mediterranean 3,447,675 9,704,398 181.5%
Alaska 3,543,051 5,913,967 66.9%
Bahamas 2,632,370 3,656,705 38.9%
Panama Canal 2,582,102 2,930,528 13.5%
Mexico West 1,910,728 4,827,262 152.6%
N. Europe 1,225,433 7,560,171 516.9%
Bermuda 1,016,863 1,324,690 30.3%
Trans Atlantic 609,580 1,425,596 133.9%
Hawaii 710,658 2,629,458 270.0%
South Pacific 282,954 683,506 141.6%
SE Asia 415,552 20,372 -95.1%
Africa 362,567 17,640 -95.1%
Canada / New England 305,635 1,488,585 387.0%
Far East 200,764 403,538 101.0%
Mississippi 350,896 0 -100.0%
World 718,422 462,934 -35.6%
S. America 212,256 1,088,569 412.9%
Coastal West 75,881 643,792 748.4%
Indian Ocean 119,493 10,544 -91.2%
U.S. Coast East * - 60,072 -
Other 355,811 1,235,534 247.2%
Total 37,119,830 77,298,466 108.2%
Source – Cruise Lines International Association.
The U.S. east coast region covers the entire Atlantic region, inclusive of eastern Canada, the mid-Atlanticstates, Bermuda, and routes to the Caribbean and Bahamas. It is a vast area of potential cruise destinationsthat are only constrained by speed and distance of the modern cruise industry. Taken as a whole, it can beregarded as the largest cruising region for North American capacity deployment following the Caribbean,Mediterranean, Alaska, and north European regions.
The U.S. east coast region continues to be a summertime mainstay of the North American market and isdominated by the large North American cruise lines with Bermuda, Caribbean, and Canada/New Englanddeployments. This is also a region that is exploited by the shoulder season markets of the transatlantic,world, and Canada/New England ‘fall foliage’ itineraries. Today, the region is becoming a year-round NorthAmerican cruise homeport for sailings to the Caribbean and Bahamas. This last market still must gothrough more development, but this is now viewed as a consistent deployment option for the region.Northeasterners may eventually prefer to forego the poor weather conditions that can be encounteredonboard a cruise ship sailing along the Atlantic Coast in the wintertime for a short flight to Florida. However,thus far it has sold consistently well for all cruise lines, and it is likely that other cruise lines will follow suit

Halifax Gateway Council Strategic Plan Page 30
November 2005
with a similar deployment. This cruise capacity placement is illustrated in Figure 2-37, where the destinationanalyses over the past five years are indicative of the growth of the cruise region. Overall capacity in theprimary east coast markets has grown by 27.7% between 2000 and 2004 with the total North Americanmarket share projected at 3.8%.
In addition, to the small, but steady growth of the primary feeder markets for the region, as illustrated below,the impact of the strong Caribbean and Bahamas market has been the driving force in growth from 2003. In2004, we estimate that the east coast region will be responsible for 2,352,000 bed nights, which translatesinto approximately 8.1% of the total Caribbean and Bahamas North American market share. Thetransatlantic, world and small ship coastal markets are also factors for regional growth.
Figure 2-37– Cruise Capacity Placement in U.S. East Coast Region by North American OperatorsBed Nights
Route/Region 2000 2004 % Change
Bermuda(Bed Nights)* 988,391 1,324,690 25.4%
Bermuda(Passengers)** 152,060 203,798 -
Canada/New England(Bed Nights)* 1,107,689 1,488,585 25.6%
Canada/New England(Passengers)** 170,414 229,013 -
U.S. Coastal East(Bed Nights)* 1,402,429 60,072 -22.3%
U.S. Coastal East(Passengers)** 215,758 9,242 -
Source – Cruise Lines International Association.
From a North American operator perspective, the east coast region has been one of the main beneficiariesof the expansion of the U.S. homeland cruising industry and the diversification of itineraries away from thetraditional Caribbean sailings departing from southern U.S. homeports.
Halifax continues as the most visited destination in all the major cruise lines’ Canada/New Englanditineraries. This valued positioning is expected to continue for the near to mid-term. Halifax is a naturalchoice for the cruise industry to conduct port-of-call operations and the strongest port for potential, futurehomeport actions. Halifax’s regional reputation as a premier city with superior tourism infrastructure, and itsstrategic location all serve as significant pluses for cruise lines considering future operations in AtlanticCanada.
Challenges to Port of Halifax’s market position and its desire to attract homeport operations continue to existand require on-going attention. In addition to the previously stated operational concerns, recent marketactivity has also produced new challenges to Atlantic Canada, and in turn, Port of Halifax’s cruise businessgrowth. The identified factors influencing passenger throughput at Halifax generally fall within one of twocategories. They are:
Cruise line marketing strategy as it relates to revenue demands; and
Local Halifax market conditions with respect to global market competition.

Halifax Gateway Council Strategic Plan Page 31
November 2005
Competitive Position
Port of Halifax’s competitiveness is measured with respect to homeport operations. The Port of Halifax’s keycompetitors in this endeavour have been determined to be the Port of New York/New Jersey, the Port ofMontreal, and the Port of Boston (Figure 2-38). The following sections review the Port of Halifax’scompetitive position relative to these ports.
Figure 2-38 – Port of Halifax Cruise Homeport Competitors
Halifax
Montreal
BostonNew York
Figure 2-39 compares total cruise passenger throughput at competing ports in 2000 and 2004. The followingobservations can be drawn from the data:
Between 2000 and 2004, cruise passenger throughput at competing ports increased roughly 166% from581,000 to 1.55 million passengers;
Total cruise passenger throughput at the Port of Halifax has increased approximately 54% from138,000 passengers in 2000 to 213,000 passengers in 2004; and
Between 2000 to 2004, all competing ports experienced an increase in cruise passenger throughput.

Halifax Gateway Council Strategic Plan Page 32
November 2005
Figure 2-39 – Comparison of Cruise Passenger Traffic
138
25
220 198213
43
1,093
199
0
300
600
900
1,200
Halifax Montreal New York Boston
Pas
seng
ers
(thou
sand
s)
2000 2004
Source – Individual ports.
The Port of Halifax has historically been a port-of-call, that is, where cruise lines call at Halifax in the middleof their itineraries. The Port of Halifax is currently working to entice cruise lines to utilise Halifax as ahomeport, thereby further stimulating the overall of the region. Figure 2-40 displays the relative ratings ofHalifax as a port-of-call and as a homeport by target market.
Figure 2-40 – Port of Halifax Cruise Service Presence by Target Markets
Key: Strong ( ), Fair ( ), Weak ( )
/ n/aBermuda
n/an/aDry-dock/Ship Servicing
/ Newfoundland & Labrador
North Atlantic
/ Round-the-World
Transatlantic
Atlantic Coast Repositioning
/ Canada & New England
Halifax as a HomeportHalifax as a Port-of-CallTarget Market
Source – Bermello, Ajamil & Partners.

Halifax Gateway Council Strategic Plan Page 33
November 2005
Not surprisingly, other nearby ports are also vying for homeport positions. Figure 2-41 identifies keycompetitors and their relative competitive threat level.
Figure 2-41 – Port of Halifax Cruise Competitors Threat Potential
/ (Homeport)Port of Quebec City, Quebec
(Port-of-Call) (Homeport)
Port of Portland, Maine
(Homeport)Port of New York City, New York
(Port-of-Call) (Homeport)
Port of Saint John, New Brunswick
Key: Strong ( ), Fair ( ), Weak ( )
(Homeport)Port of St. John’s, Newfoundland
(Homeport)Port of Boston, Massachusetts
(Port-of-Call)Port of Sydney, Nova Scotia
Competitive Threat PotentialCompetitor
Source – Bermello, Ajamil & Partners.
Key Findings In general, no significant marine conditions or access issues were identified that serve as a constraint
for present or future cruise operations. In fact, in combination with its weather, safe-harbour access,and cruise pier location (within walking distance of the city’s downtown core), the Port of Halifaxexceeds general industry standards for cruise ports.
The Canada/New England cruise market sector has experienced impressive growth over the pastdecade, but the pace has slowed in recent years.
Halifax continues as the most visited destination in all the major cruise lines’ Canada/New Englanditineraries. This valued positioning is expected to continue for the near to mid-term.
Halifax has the strongest potential to secure future cruise homeport operations.
2.4 Ground Transportation
FacilitiesRoad
The main road infrastructure in and out of Halifax consists of a number of 100 series highways, some ofwhich are part of the National Highway System (Figure 2-42). Highway 103 leads to destinations on theSouth Shore, Highway 101 leads to the Annapolis Valley, and Highway 102 is the main transportationcorridor connecting Halifax to the Trans-Canada Highway at Truro. Highway 102 also serves as the accessroute to Halifax International Airport. Highway 107 serves the Eastern Shore.

Halifax Gateway Council Strategic Plan Page 34
November 2005
Two bridges provide access to Halifax Peninsula. The Macdonald Bridge has three lanes, one in eachdirection and one reversing depending on the predominant traffic flow. Access to this bridge is limited toautomobiles and very light pick-up trucks. The MacKay Bridge has two lanes in each direction and handlesa large amount of truck traffic since it is the most convenient route between the container terminals onHalifax Peninsula and the major industrial centre of Burnside Industrial Park. The MacKay Bridge alsoprovides convenient access to the 102, via the 111 and 118, rather than taking the normally congestedBedford Highway towards the 102, or alternatively, the Joseph Howe Drive in the opposite direction to reachHighway 102.
Figure 2-42 – Halifax Road Network
Rail
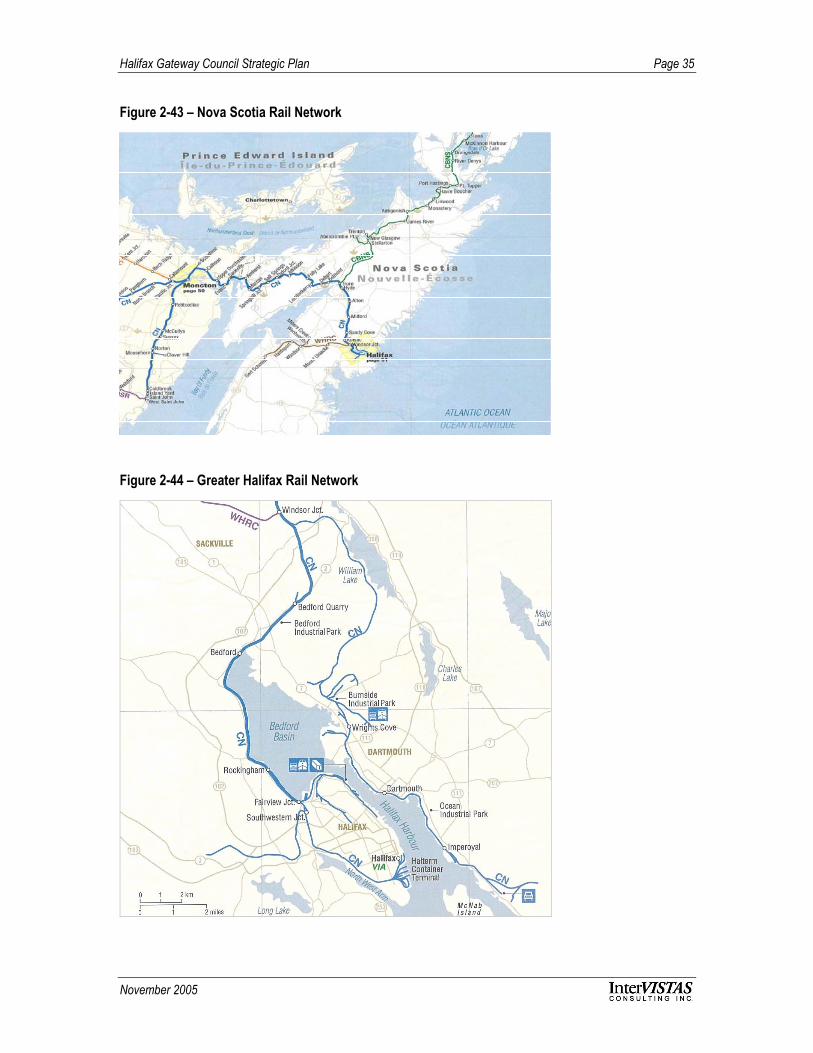
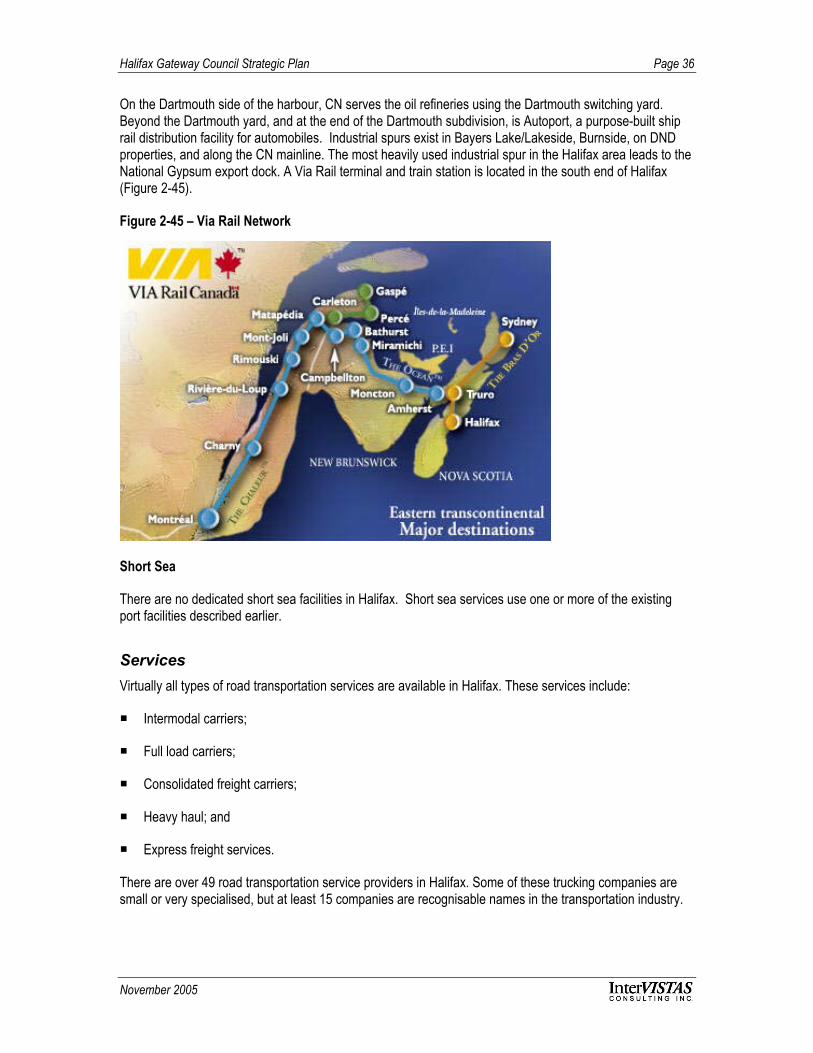
In the Greater Halifax region, CN Rail is the only Class 1 rail carrier that provides rail service to inlandmarkets. Halifax is CN Rail’s eastern terminus for its transcontinental mainline (Figure 2-43). Freight trainsgenerally arrive at or depart from Rockingham yard, and traffic is dispatched from the Rockingham yardtowards the port terminals of Fairview Cove, the South End as well as the Halifax Intermodal Terminal,which is the CN operated domestic terminal for Halifax.
Halifax Gateway Council Strategic Plan Page 35
November 2005
Figure 2-43 – Nova Scotia Rail Network
Figure 2-44 – Greater Halifax Rail Network
Halifax Gateway Council Strategic Plan Page 36
November 2005
On the Dartmouth side of the harbour, CN serves the oil refineries using the Dartmouth switching yard.Beyond the Dartmouth yard, and at the end of the Dartmouth subdivision, is Autoport, a purpose-built shiprail distribution facility for automobiles. Industrial spurs exist in Bayers Lake/Lakeside, Burnside, on DNDproperties, and along the CN mainline. The most heavily used industrial spur in the Halifax area leads to theNational Gypsum export dock. A Via Rail terminal and train station is located in the south end of Halifax(Figure 2-45).
Figure 2-45 – Via Rail Network
Short Sea
There are no dedicated short sea facilities in Halifax. Short sea services use one or more of the existingport facilities described earlier.
ServicesVirtually all types of road transportation services are available in Halifax. These services include:
Intermodal carriers;
Full load carriers;
Consolidated freight carriers;
Heavy haul; and
Express freight services.
There are over 49 road transportation service providers in Halifax. Some of these trucking companies aresmall or very specialised, but at least 15 companies are recognisable names in the transportation industry.

Halifax Gateway Council Strategic Plan Page 37
November 2005
Some of the larger companies have their own warehousing, container storage yards or cross dock facilities.Most of the larger trucking companies operate their own fleet of trucks with employee drivers. They also hireowner-operators when needed.RailCN offers freight services and Via Rail provides rail passenger services in Halifax on CN trackage. CN runsfour scheduled intermodal trains and two mixed freight trains per day and Via runs two passenger trains perday. CN also runs two unit trains per day to/from Milford Station for bulk gypsum destined for the NationalGypsum wharf on the Dartmouth side of Bedford Basin. Project and over-dimensional cargoes are alsohandled by CN on their mixed trains.Short SeaSeveral short sea operators offer service from Halifax – Oceanex, Halship, Sea Transit, and somesteamship lines, barges, and tugs. Currently, Oceanex provides two sailings per week to St. John’s andCorner Brook, out of Halifax. They offer roll-on/roll-off as well as container service and carry automobilesfrom Autoport to Newfoundland. Halship offers a weekly feeder service to Boston and Portland. This servicehas replaced the SPM Marine International that provided a similar service with the MV Shamrock until 2004.Sea Transit provides transportation to and from the islands of St. Pierre et Miqueleon on a weekly schedule.
Steamship lines occasionally carry short-sea freight from Halifax to New York although this service is notadvertised or actively sold. Such short-sea activities are often considered transhipment activities betweencarriers. Barges and tugs are available locally but there is no scheduled service.
TrafficRoadThe trucking industry is very fragmented and competitive, and as a result, traffic data is not readily available.The Canadian Council of Motor Transport Administrators (CCMTA) has a project underway to construct adatabase of road traffic that would include movements throughout Nova Scotia, but the study is scheduledfor completion in one to two years time. A recent polling of some of the major carriers in Halifax hasidentified the typical pattern for the distribution of intermodal traffic to/from Halifax. Figure 2-46 shows thedirection/provenance of the Port of Halifax’s container movements:
Figure 2-46 – Port of Halifax Container Traffic Provenance
South Shore13%
Valley5%
Truro60%Halifax
Regional Municipality
22%
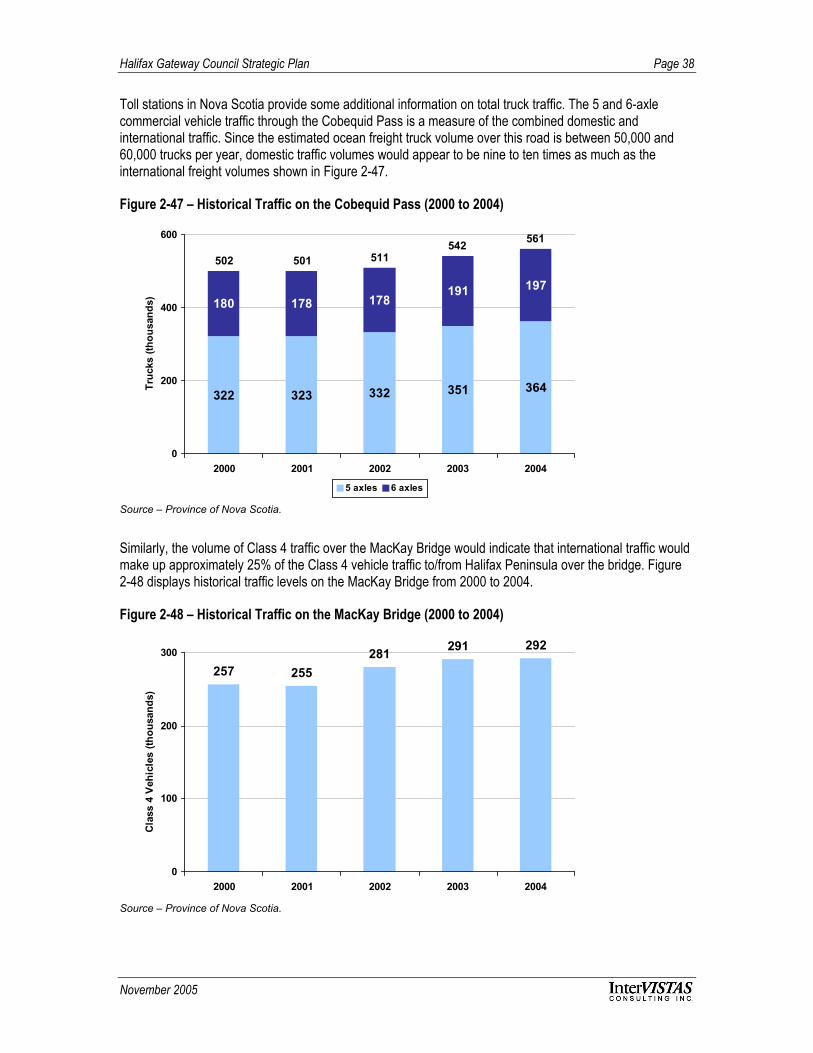
Halifax Gateway Council Strategic Plan Page 38
November 2005
Toll stations in Nova Scotia provide some additional information on total truck traffic. The 5 and 6-axlecommercial vehicle traffic through the Cobequid Pass is a measure of the combined domestic andinternational traffic. Since the estimated ocean freight truck volume over this road is between 50,000 and60,000 trucks per year, domestic traffic volumes would appear to be nine to ten times as much as theinternational freight volumes shown in Figure 2-47.
Figure 2-47 – Historical Traffic on the Cobequid Pass (2000 to 2004)
322 323 332 351 364
180 178 178191 197
0
200
400
600
2000 2001 2002 2003 2004
Truc
ks (t
hous
ands
)
5 axles 6 axles
502 501 511542 561
Source – Province of Nova Scotia.
Similarly, the volume of Class 4 traffic over the MacKay Bridge would indicate that international traffic wouldmake up approximately 25% of the Class 4 vehicle traffic to/from Halifax Peninsula over the bridge. Figure2-48 displays historical traffic levels on the MacKay Bridge from 2000 to 2004.
Figure 2-48 – Historical Traffic on the MacKay Bridge (2000 to 2004)
257 255281 291 292
0
100
200
300
2000 2001 2002 2003 2004
Cla
ss 4
Veh
icle
s (th
ousa
nds)
Source – Province of Nova Scotia.
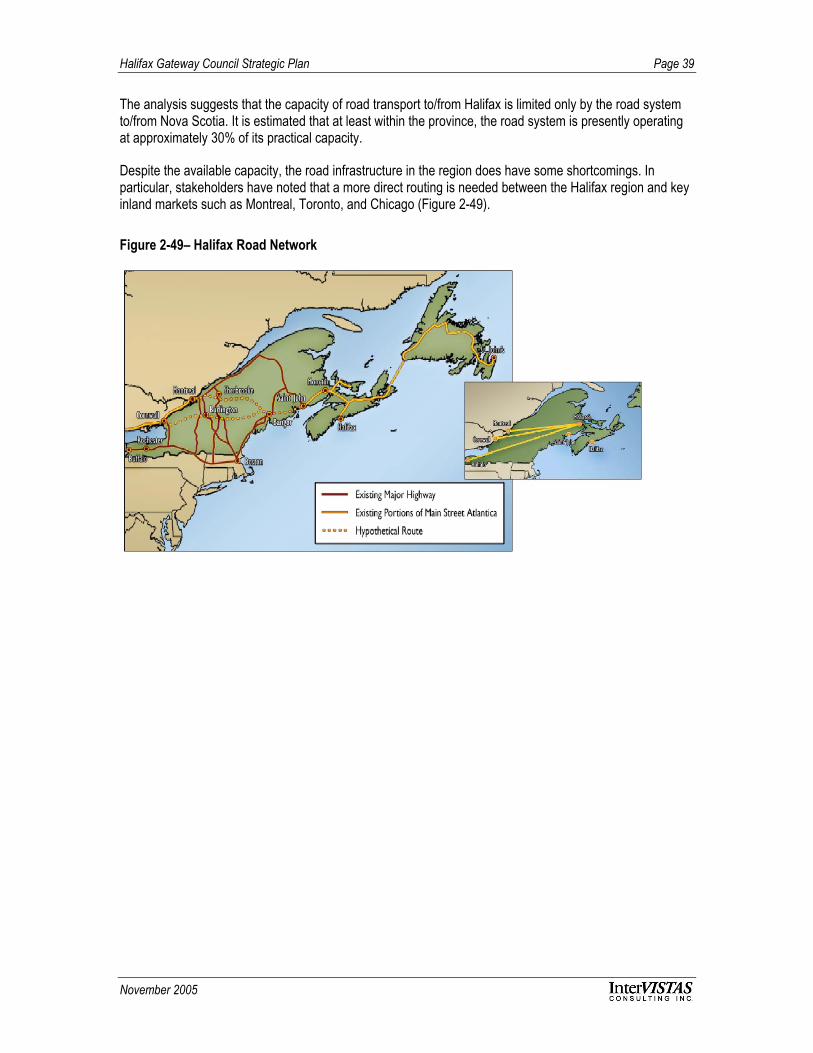
Halifax Gateway Council Strategic Plan Page 39
November 2005
The analysis suggests that the capacity of road transport to/from Halifax is limited only by the road systemto/from Nova Scotia. It is estimated that at least within the province, the road system is presently operatingat approximately 30% of its practical capacity.
Despite the available capacity, the road infrastructure in the region does have some shortcomings. Inparticular, stakeholders have noted that a more direct routing is needed between the Halifax region and keyinland markets such as Montreal, Toronto, and Chicago (Figure 2-49).
Figure 2-49– Halifax Road Network

Halifax Gateway Council Strategic Plan Page 40
November 2005
Rail
Over the past 5 years, the railway handled an average of 70,000 cars and 230,000 cargo containers peryear to/from Halifax. Figure 2-50 and Figure 2-51 display the detailed historical rail traffic, broken down intocar volume and container volume to/from Halifax.
Figure 2-50 – Historical Halifax Car Volume (2000 to 2004)
81
59 56
77 76
0
25
50
75
100
2000 2001 2002 2003 2004
Car
s (th
ousa
nds)
Source – CN Rail.
Figure 2-51– Historical Halifax Rail Container Traffic (2000 to 2004)
238 239226 235
211
0
50
100
150
200
250
2000 2001 2002 2003 2004
Cont
aine
rs (t
hous
ands
)
Source – CN Rail.

Halifax Gateway Council Strategic Plan Page 41
November 2005
As a general rule, a single-track railway is considered to reach its practical capacity at 16 trains per day.With 8 trains per day (10 on short sections), the railway is presently considered to be operating at 50%capacity in terms of daily trains. However, train length can be extended to further increase capacity ifrequired, and the railway could add another 8 intermodal trains per day if there was a sudden demand forincreased import-export freight movement. Based on this scenario, our analysis suggests that the railsystem in Halifax is operating at roughly 20% of capacity. Although CN’s track utilisation to key inlandmarkets such as Montreal or Chicago tends to be higher than in the Halifax region, additional capacity isalso readily available to these destinations.
VIA passenger trains average roughly 100 passengers. Via trains can carry up to 1200 passengers, so ifone assumes a practical capacity of 50% overall utilisation, Via is presently operating at 15% to 20% of itspractical capacity.
Short Sea
Over the past five years, short sea shipping has moved an average of 51,000 TEUs per year. Figure 2-52shows the detailed freight movement volumes to/from the Halifax gateway.
Figure 2-52 – Historical Halifax Short Sea Container Volume (2000 to 2004)
47
56 57
4944
0
10
20
30
40
50
60
2000 2001 2002 2003 2004
Con
tain
ers
(thou
sand
s)
Source – Halifax Port Authority.
Short sea capacity is limited only by its use of existing Halifax port facilities, and as such, its current levelsare considered to be low, with a capacity utilisation of less than 20%.
Market/Competitive PositionCurrently, Halifax is the dominant gateway for freight destined to Atlantic Canada, and other existinggateways offer little or no advantages over Halifax. For freight destined to larger markets such as Montreal,Toronto, and Chicago, Halifax is seen as a discretionary port-of-call, thus its inland connections are a criticalcomponent to its competitive advantage.

Halifax Gateway Council Strategic Plan Page 42
November 2005
Efficient inland transportation is critical for the Halifax gateway. The distance to and from major markets putsHalifax at a geographical disadvantage compared to ports such as Montreal and New York.
Shipping lines often can (and will) change a routing for a very small overall cost difference, as long as theservice is reliable. The competitive position is thus a function of the total (door) cost of transportation.
Figure 2-53 illustrates the rule of thumb costs by transportation mode. The table demonstrates why truckingis not competitive with rail on long inland hauls (higher cost per mile component). It also identifies thereason why short-sea has so far been limited to niche markets, due to its high cost structure and high fixedcost component.
Figure 2-53 – Cost Comparison between Modes
Inland Transportation Mode Truck Rail Short SeaLarge Ship
Short SeaSmall Ship
Local Pick-Up/Delivery Included $200 $200 $200
Terminal Charge (inland) - $100 $250 $200
Terminal Charge (port) $35 $35 $200 $150
Fixed Cost $35 $335 $650 $550
Inland Haul/FEU-Mile $1.71 $0.44 $0.40 $0.50
Source – Global Port Services Inc.
Figure 2-54 shows the cost of inland transits for various distances travelled for each mode of groundtransportation.
Figure 2-54 – Inland Transportation Costs
$0$200$400$600$800
$1,000$1,200$1,400$1,600$1,800$2,000
1 2 3 4 5 6 7 8 9
Distance in milesX100
Cost
Truck Rail Lg ship Sm Ship
Source – Global Port Services Inc.
Halifax Gateway Council Strategic Plan Page 43
November 2005
Road
Road transport (trucking) is the predominant transportation mode for domestic freight and internationalfreight destined to and from Atlantic Canada. Much of the domestic freight consists of consumer goods forthe Atlantic Region and this flow drives the demand for trucking services. Moncton continues to be the hubfor domestic trucking in Atlantic Canada.
Halifax is the hub for international freight to and from the Atlantic Region. Port facilities serve as storageand empty yards for cargo within trucking distance. Steamship containers destined to/from the largermarkets of Montreal, Toronto, and Chicago are normally routed by rail and trucked only in exceptional casessuch as the cargo becoming urgent due to transit delays.
The Halifax Gateway has little real competition for the local market served by road, as alternative intermodalroutings are more expensive, less flexible, and not very practical. As can be seen in Figure 2-54, trucking isonly competitive with rail if the inland distance is less than 480 kilometres.
Rail
Rail is the inland transportation mode of choice for steamship containers to/from the major cargo marketsserved by the Halifax Gateway. The alternative to using rail for these markets is to use another gatewayrather than using an alternate inland transportation system. Other inland transportation modes are simplynot an option at the present time.
Main inland market transportation is a very competitive arena. The competitive position of the HalifaxGateway and inland transportation system is quite different for each of the three main inland markets.
Montreal is served directly by a relatively large number of carriers and nearly the full cost of the inlandtransportation needs to be absorbed by a steamship line that wishes to participate in the Montrealmarket via Halifax.
Toronto is the largest market in Canada and Halifax’s traditional base market. Montreal offers moreviable inland transportation options (CN, CP or trucks) to Toronto than either Halifax (rail only) or NewYork (truck only). However, a Halifax routing can be cost competitive into that market.
The U.S. mid-west is roughly two and a half times the size of Canada (based on population). Halifaxroutings generally become more cost-effective further inland due to the relatively low variable cost ofrail transportation. Containers railed to Chicago from either Montreal or New York incur the same typesof handling costs.
Short Sea
The present short sea routes out of Halifax either shorten the inland transportation distance (Boston) orserve areas surrounded by water (Newfoundland and St. Pierre et Miquelon).
Oceanex offers a reliable option to Newfoundland and is the routing of choice for freight arriving in Halifaxby ship or rail. Cargo also moves to Newfoundland via Marine Atlantic services out of North Sydney.
Domestic freight is generally much more time sensitive and sailing frequency favours the Marine Atlanticroute between North Sydney and Port aux Basques. However, Oceanex captures part of the domesticfreight market to Newfoundland as well, and could attract more with a higher frequency service (as wasintroduced in spring 2005).

Halifax Gateway Council Strategic Plan Page 44
November 2005
Halship mainly competes with barges from New York to Boston. They offer their customers a better deliverytime into Boston and economical access to Portland, Maine. The viability of the service is dependent onvolume and the recent departure of Maersk from the Port of Halifax will make it more difficult to fill the ship.
Key Findings Halifax offers a comprehensive set of facilities and services and is well positioned as an alternative
routing for cargo moving to inland markets.
Halifax presently lacks the critical mass to become a ‘must call’ port. This is mainly due to the smalllocal market and the concentration of distribution centres in the Toronto area.
Halifax’s role as a lightening and topping-off port for vessels on the way to/from New York, provides theregion with shipping services to many world-wide destinations.
Halifax has ample inland transportation capacity and could attract significant freight volume as U.S.inland facilities become insufficient to handle projected future growth.
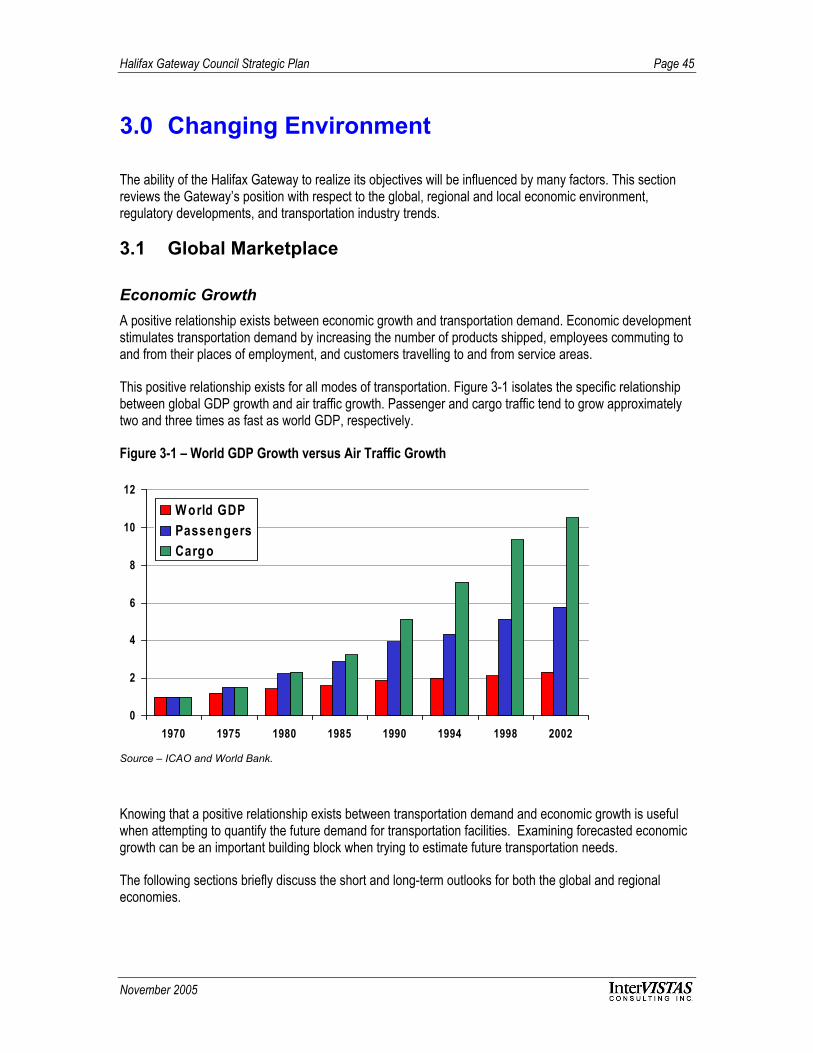
Halifax Gateway Council Strategic Plan Page 45
November 2005
3.0 Changing Environment
The ability of the Halifax Gateway to realize its objectives will be influenced by many factors. This sectionreviews the Gateway’s position with respect to the global, regional and local economic environment,regulatory developments, and transportation industry trends.
3.1 Global Marketplace
Economic GrowthA positive relationship exists between economic growth and transportation demand. Economic developmentstimulates transportation demand by increasing the number of products shipped, employees commuting toand from their places of employment, and customers travelling to and from service areas.
This positive relationship exists for all modes of transportation. Figure 3-1 isolates the specific relationshipbetween global GDP growth and air traffic growth. Passenger and cargo traffic tend to grow approximatelytwo and three times as fast as world GDP, respectively.
Figure 3-1 – World GDP Growth versus Air Traffic Growth
0
2
4
6
8
10
12
1970 1975 1980 1985 1990 1994 1998 2002
W orld GDPPassengersCargo
Source – ICAO and World Bank.
Knowing that a positive relationship exists between transportation demand and economic growth is usefulwhen attempting to quantify the future demand for transportation facilities. Examining forecasted economicgrowth can be an important building block when trying to estimate future transportation needs.
The following sections briefly discuss the short and long-term outlooks for both the global and regionaleconomies.
Halifax Gateway Council Strategic Plan Page 46
November 2005
Global
In the short-term, global real GDP is forecasted to grow approximately 4.3% in 2005 and 4.4% in 2006.2This is lower than the growth experienced in 2004, but still significant given that the global economy grew atits fastest pace in 20 years in 2004. However, global economic growth could be slowed if oil prices remain attheir current high levels.
Over the longer-term, the global economy will continue to experience several key structural changes that willsignificantly affect the economic climate in the long-term. Future global GDP growth will be affected by theemergence of the Chinese and Indian economies, and a fundamental change in the structure of the world’spopulation.
China – after many years of isolation, China is now an emerging part of the global economy. Sincecommencing structural reforms 20 years ago, China has achieved average annual output growth ratesin excess of 9%.3 China’s integration into the global economy is likely to continue increasing as long asthe necessary structural reforms are implemented.
Demographic change – as mentioned above, a fundamental demographic change is occurring whichwill no doubt have a significant affect on the global economy. The United Nations predicts threesignificant changes to the global population:4
– Global population growth will continue to slow. Global population growth sits around 1.25% peryear, but is expected to fall to 0.25% per year by 2050;
– The world’s population will continue to age; and
– The share of the working-age population will fall in advanced countries and increase in developingnations.
If the above predictions do in fact come true, these could significantly affect the growth of the globaleconomy. The IMF performed a study which utilised an econometric model to measure the macroeconomicimpact of demographic changes.5 Their model suggests that per capita GDP growth is positively correlatedwith changes in the relative size of the working-age population, and negatively correlated with changes inthe share of the elderly. Thus the predicted demographic changes would have a dampening effect on futureglobal GDP growth.
2 Real GDP refers to the value of GDP in constant (e.g. inflation-adjusted) dollars, which is used as a measure of anation’s final output.
3 ‘World Economic Outlook – Advancing Structural Reforms.’ International Monetary Fund April 2004: 82.4 ‘World Economic Outlook: The Global Demographic Transition.’ The International Monetary Fund September
2004: 140-141.5 ‘World Economic Outlook: The Global Demographic Transition.’ The International Monetary Fund September
2004: 143.
Halifax Gateway Council Strategic Plan Page 47
November 2005
Regional
Regional economic trends can be split into two geographic components – Canada and Atlantic Canada. Inthe short-term, Canadian real GDP is forecasted to increase 2.8% in 2005 and 3.0% in 2006. TheConference Board of Canada predicts that following the current recovery, real export growth will diminishover the long-term due to declining U.S. economic growth and an appreciation in the Canadian dollar. In thelong-term, the Canadian economy is expected to grow at a compounded annual rate of 2.6% between 2004and 2025.
According to the IMF, several important challenges for the Canadian economy are expected in the nearfuture. Prospective trade liberalisation, the appreciation of the dollar, and a significant increase in the shareof elderly within the population are all challenges listed by the IMF.
In Atlantic Canada, economic growth for the region in 2005 is forecasted to be lower than that expected forthe nation as a whole. After sub-par economic performances in 2004, Nova Scotia and New Brunswick willexpand by 2.6% and 2.9% in 2005, respectively.6 This outlook is brighter than it was earlier this year,largely due to two major capital developments – a $500-million liquefied natural gas terminal in CapeBreton, Nova Scotia and a $750-million project at Canaport in Saint John, New Brunswick. The forecastsare not as encouraging for Newfoundland and Prince Edward Island, as economic growth in both provincesis expected to be sluggish in 2005, at approximately 1%. In 2006, however, Newfoundland is expected tolead all Canadian provinces in economic growth as production ramps up at Voisey's Bay and White Rose.
International TradeGlobal
As globalisation spreads, international trade will become more prevalent within the global economy (Figure3-2). In 2004, world trade increased 10%, primarily reflecting significant increases in industrial production.7
Over 20% of the increase in world merchandise trade volumes is attributable to China. In fact, total Chineseimports grew 32% in 2004, reflecting both its inclusion into the WTO and significant increases inconsumption demand.8 Over the past 20 years, China’s share of world trade has increased from less than1% to close to 6% in 2004, and it is now the fourth largest trader in the world.9
The World Bank predicts slower trade expansion in 2005 and 2006. Trade in goods and non-factor servicesare expected to expand by 8.5% in 2005, compared to the 10% experienced in 2004. It is believed thatmuch of the decline relates to efforts by the Chinese government to slow the pace of activity in China.World GDP forecasts for 2005 and 2006 are provided for advanced economies and emerging markets inFigure 3-3.
6 ‘Provincial Outlook, Autumn 2004.’ The Conference Board of Canada Autumn 2004.7 ‘Prospects for the Global Economy.’ The World Bank Group 16 November 2004.8 ‘Prospects for the Global Economy.’ The World Bank Group 16 November 2004.9 ‘World Economic Outlook: Advancing Structural Reforms.’ The International Monetary Fund April 2004.
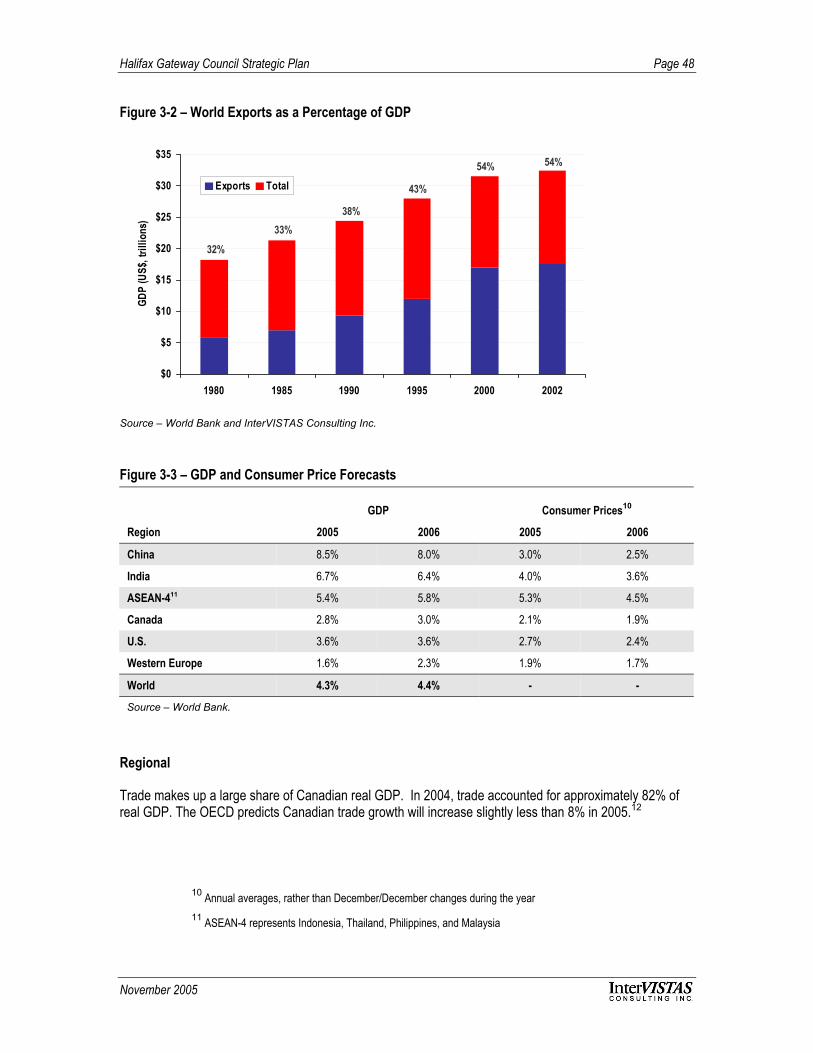
Halifax Gateway Council Strategic Plan Page 48
November 2005
Figure 3-2 – World Exports as a Percentage of GDP
$0
$5
$10
$15
$20
$25
$30
$35
1980 1985 1990 1995 2000 2002
GDP
(US$
, tril
lions
)
Exports Total
54%54%
43%
38%33%
32%
Source – World Bank and InterVISTAS Consulting Inc.
Figure 3-3 – GDP and Consumer Price Forecasts
GDP Consumer Prices10
Region 2005 2006 2005 2006
China 8.5% 8.0% 3.0% 2.5%
India 6.7% 6.4% 4.0% 3.6%
ASEAN-411 5.4% 5.8% 5.3% 4.5%
Canada 2.8% 3.0% 2.1% 1.9%
U.S. 3.6% 3.6% 2.7% 2.4%
Western Europe 1.6% 2.3% 1.9% 1.7%
World 4.3% 4.4% - -
Source – World Bank.
Regional
Trade makes up a large share of Canadian real GDP. In 2004, trade accounted for approximately 82% ofreal GDP. The OECD predicts Canadian trade growth will increase slightly less than 8% in 2005.12
10 Annual averages, rather than December/December changes during the year11 ASEAN-4 represents Indonesia, Thailand, Philippines, and Malaysia

Halifax Gateway Council Strategic Plan Page 49
November 2005
Implications for the Halifax Gateway Current forecasts call for the global economy to grow at healthy rates in 2005 and 2006 (4.3% and
4.4%, respectively). These favourable conditions will continue to fuel trade and tourism, and providegrowth opportunities for the Halifax Gateway.
The structural changes taking place in the world economy – the emergence of the Chinese and Indianeconomies – bode well for Halifax. With congestion at west coast ports and increasing numbers of post-Panamax vessels, Halifax is well positioned to increase its participation in trade to/from these regions.
The Canadian economy is expected to face challenges in the short to medium-term (e.g. tradeliberalisation, appreciation of the dollar, and significant growth in the share of elderly population). Thesedevelopments could reduce Canadian wealth and decrease the demand for travel.
3.2 Government Policy
Rapid changes in trade, global logistics, and tourism places significant pressure upon governments toestablish policy frameworks that enable their countries to better participate in world trade and commerce.The following sections review key regulatory and policy issues and trends that may influence the Gateway’scurrent and future markets.
GlobalDue to increasing globalisation and changing trade patterns, many governments around the world arefinding it increasingly difficult to act autonomously in formulating and implementing transport policies. Asproduction is relocated and the share of east Asia’s share of world trade increases (both in terms of exportsand imports), the liberalisation and growth of trade is being accompanied by a growth of transportation. As aresult, the consolidation of regional trading blocs and the resulting increase in international traffic has ledtransport companies to seek global alliances and greater market liberalisation in the transport sector.
Internationally, governments are pursuing deregulation and divestiture policies in the transport industry.Increasingly, they are also withdrawing from the management, operation, and ownership of national carriers,ports, and airports. This has led to the rise of transnational transport corporations that are governing theglobal flow of air, maritime, and land exchanges and the management of airports, ports, and rail yards.
Given this environment, several key transport polices and trends are emerging globally, including:
Trade and transportation corridor approaches in policy formulation especially in the marine, rail, andtrucking modes (e.g. within the EU, APEC, NAFTA countries);
Liberalised trading bloc air transport agreements such as that amongst several (not all) APECmembers. This also includes a separation of air cargo from passenger provisions in the agreement, atrend that is starting take hold;
12 ‘OECD Economic Outlook No.76.’ Organisation of Economic Co-ordination and Development December 2004.
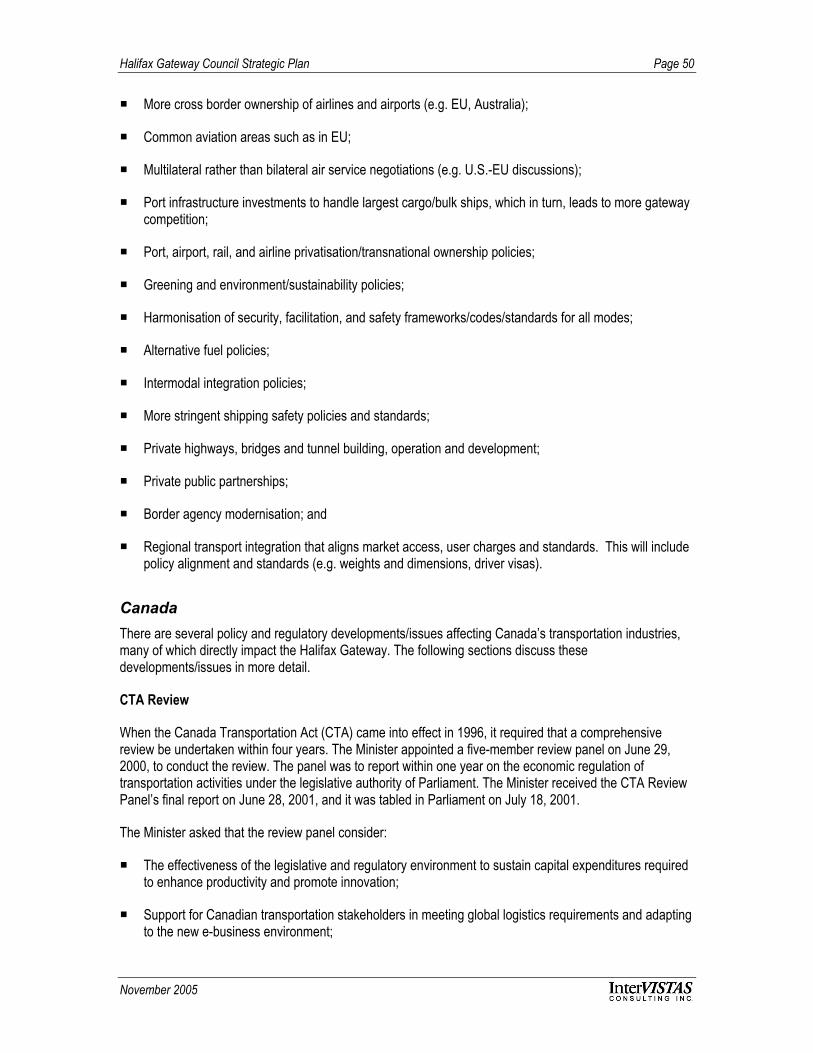
Halifax Gateway Council Strategic Plan Page 50
November 2005
More cross border ownership of airlines and airports (e.g. EU, Australia);
Common aviation areas such as in EU;
Multilateral rather than bilateral air service negotiations (e.g. U.S.-EU discussions);
Port infrastructure investments to handle largest cargo/bulk ships, which in turn, leads to more gatewaycompetition;
Port, airport, rail, and airline privatisation/transnational ownership policies;
Greening and environment/sustainability policies;
Harmonisation of security, facilitation, and safety frameworks/codes/standards for all modes;
Alternative fuel policies;
Intermodal integration policies;
More stringent shipping safety policies and standards;
Private highways, bridges and tunnel building, operation and development;
Private public partnerships;
Border agency modernisation; and
Regional transport integration that aligns market access, user charges and standards. This will includepolicy alignment and standards (e.g. weights and dimensions, driver visas).
CanadaThere are several policy and regulatory developments/issues affecting Canada’s transportation industries,many of which directly impact the Halifax Gateway. The following sections discuss thesedevelopments/issues in more detail.
CTA Review
When the Canada Transportation Act (CTA) came into effect in 1996, it required that a comprehensivereview be undertaken within four years. The Minister appointed a five-member review panel on June 29,2000, to conduct the review. The panel was to report within one year on the economic regulation oftransportation activities under the legislative authority of Parliament. The Minister received the CTA ReviewPanel’s final report on June 28, 2001, and it was tabled in Parliament on July 18, 2001.
The Minister asked that the review panel consider:
The effectiveness of the legislative and regulatory environment to sustain capital expenditures requiredto enhance productivity and promote innovation;
Support for Canadian transportation stakeholders in meeting global logistics requirements and adaptingto the new e-business environment;
Halifax Gateway Council Strategic Plan Page 51
November 2005
Public policy issues that may emerge from newly arising industry structures;
Government powers to support sustainable development objectives; and
The advisability of measures to preserve urban rail corridors for future mass-transit use.
The panel was also asked to submit an interim report on ways to increase competition in the railway sector,including enhanced running rights, proposals for regional railways and other access concepts. Theseconcepts needed to be assessed in the broader context of increasing North American integration andensuring cost-effective service for shippers over the long-term. The interim report highlighted stakeholderpositions and presented a review of various proposals. The panel determined that more detailed work wasnecessary as their review continued to properly assess the full economic, regulatory and legal impacts ofcompetitive rail access.
The panel’s final report contained more than 90 recommendations which will be considered by TransportCanada in the transportation blueprint policy review process. The transportation blueprint project is intendedto renew the transportation agenda of the Government of Canada by developing a strategy that will guidefuture decisions in transportation over the next decade and beyond. The panel’s recommendations in keyareas are summarised below.
Competition in the rail freight and airline industries – The panel’s review focused on the concerns ofshippers using rail freight services and the extent of market power exercised by the mainline railways,concerns arising from Air Canada’s acquisition of Canadian Airlines International and increasedconcentration in the domestic airline industry, and how to review possible future mergers in thetransportation sector.
For the rail freight industry, the panel made a number of recommendations including that interswitchingprovisions be retained, that competitive connection rates replace competitive line rates and that runningrights provisions be enhanced.
With respect to the airline industry, the panel recommended that the Government of Canada pursue thebenefits of foreign competition through multilateral negotiations to liberalise air services, raise theforeign ownership ceiling, eliminate potential barriers to market entry for domestic airlines, remove theCanadian Transportation Agency’s responsibilities for monitoring air fares, and required Air Canada togive at least 180 days notice of services it planned to terminate in the first six months of 2003.
Transport mergers – The panel recommended that, in parallel with the Competition Act review processthat looks into competition issues, a process be established to review potential mergers in alltransportation modes under federal jurisdiction and report to the Minister of Transport on public interestconsiderations.
Commercial operations in ferries, passenger trains, and urban transit – The panel recommended astronger relationship between the cost of providing services and the prices charged for them as well asless reliance on public subsidies.
For ferries, the panel recommended that the Government of Canada continue its efforts to promoteinnovation through commercialisation and divestiture to other levels of government. The panelrecommended for intercity passenger rail services that the Government of Canada continue to supportrail services to remote communities but commercialise tourism services and services in the QuebecCity-Windsor corridor. For urban transit, the panel identified cost-effective ways for local governmentsand agencies to improve transit’s attractiveness and recommends experimentation with alternativedelivery models and innovative forms of service.
Halifax Gateway Council Strategic Plan Page 52
November 2005
Efficiency in other modes –The panel’s recommendations promote the principles of commercially drivencompetition and harmonisation for a seamless transportation system.
For marine, the panel recommended full cost recovery and early negotiations with the United States topromote greater competition in the domestic shipping industry. On the trucking side, the panelrecommended that federal, provincial, and territorial governments establish a time frame for developingand implementing an effective framework to govern all elements of the trucking sector. The panel alsorecommended that the intercity bus industry continue to work toward reducing regulatory fragmentation.
Discipline in the provision of infrastructure services – The panel commended the Government ofCanada’s policy of placing the provision of transportation infrastructure on a more commercial footingover the past decade or more.
For airports, air navigation, ports, and the St. Lawrence Seaway, the panel believed that it may now bethe time to consider a long-term strategy to transform the major ports and airports into for-profitcorporations. In the meantime, the panel recommended several measures to strengthen theaccountability and control of airport and port authorities.
For roads, the panel recommended that the Government of Canada encourage provinces and territoriesto establish road management and funding agencies to set charges and fees for road use. This wouldgive road users a say in decisions about how much to charge for road use. The panel alsorecommended that other modes providing alternatives to road expansion should be allowed to competefor road funds.
Urban rail corridors – The panel recommended enhancing access for commuter rail services andamending the existing process to preserve urban rail corridors for urban transit.
Sustainable development – The panel believed its proposed approach to road management offers anopportunity to achieve needed cooperation. Progress is likely to result from charging directly for roaduse and permitting urban transport and other potentially more sustainable modes to compete forfunding with road projects.
Other matters – In addition, the panel suggested that all transportation policy be guided by overlyingprinciples, proposes to increase the availability of transportation data and recommends that theGovernment of Canada increase its support for transportation research.
Air Policy
International Air Policy
Canada’s current International Air Policy for scheduled passenger services was introduced in December1994 (the Canada-U.S. agreement is governed by a separate policy because of its scope and importance).In early 2001, Transport Canada announced an undertaking to review Canada’s International Air Policy. Anew policy had been anticipated in Fall 2001, but was deferred as a result of September 11th. None of thepolicy changes under consideration would require legislative changes.
On May 21, 2002, Canada’s Minister of Transport announced some minor changes to the InternationalAirport Policy. The first change was the removal of the requirement that a market must have more than300,000 annual passengers before more than one Canadian air carrier is designated to operate on ascheduled route. In effect, this change allows Air Transat to operate to a few additional destinations, mainlyto/from Europe, that it was previously shutout of by policy. In practice, the carrier already operates to thesedestinations as a charter carrier, so the net effect may be small.

Halifax Gateway Council Strategic Plan Page 53
November 2005
The announcement also included changes to the ‘use it or lose it’ provisions of the International Air Policy.This change was designed to provide some stability for charter carriers like Air Transat which operateseasonal services, rather than year-round services. Previously, carriers had to operate a minimum of twice-weekly service year-round to maintain a designation to any particular market.
Canada-U.S. Open Skies
A new Canada-U.S. Open Skies air transport agreement was negotiated in November 2005. Potentialbenefits from the expansion of the 1995 agreement include greater access for Canadian passenger andcargo carriers to a much larger U.S. market (as a platform by which to serve third countries), increasedpricing flexibility for Canadian and U.S. carriers, more options for Canadian airports to attract U.S. carriers,and lower prices for consumers.
The most significant amendments in the new agreement involved liberalizing Canadian air carrier access toU.S. third country markets, and vice versa. The 1995 air services agreement between Canada and the U.S.created a more open regime for air services between both countries, but contained several restrictions.
This agreement follows through on a pledge made earlier in the year by Transport Minister Lapierre andU.S. Transportation Secretary Norman Mineta to discuss opportunities for further air liberalization. It alsosupports the Security and Prosperity Partnership of North America, and its goal of achieving the mostvibrant and dynamic trade relationship in the world. These changes are scheduled to become effective onSeptember 1, 2006.
Airport Policy
Airport Rent Review
A review of the rent policy for 21 Airport Authorities in the National Airports System (NAS) was launched in2001 in response to the demands of airports and aviation communities and to the issues raised by theAuditor General in October 2000. The review was designed to assess whether the federal government'sairport rent policy balances the interests of all stakeholders, including the air industry and Canadiantaxpayers. It was conducted at the same time as, but independently of, the development of proposed airportlegislation. Efforts were undertaken to produce new airport legislation throughout 2004; new legislation isexpected to be tabled in 2005.
In May 2005, the Transport Minster announced a new rent policy for Canada’s airports. The new programhas two components:
Cancellation of any remaining payments for chattels from NAS airports.
The chattels forgiveness is an important benefit for 12 NAS airports which collectively still owed $22million over a period ending in 2014. The largest beneficiary is Prince George ($4.2 million) followed byGander ($3.4 million). The largest airport in this group is Halifax International Airport ($1.3 million), withadditional benefits to a number of small airports, such as Charlottetown and Saint John. There arebeneficiaries in 8 of the 10 provinces.
Reduced rent for each of the 21 rent paying airports in the National Airport System (NAS).
This rent reduction announcement followed several years of intense lobbying by the airports, theircommunities and stakeholders, the airlines, the tourism industry and, some pundits would say, theTransport Minister himself (with the Minister of Finance being the lobbying target). The announcement

Halifax Gateway Council Strategic Plan Page 54
November 2005
essentially indicated that the rent review found that rents paid by the Canadian NAS airports wereexcessive when compared to public utilities and to foreign airports that had been privatised.
Under the new policy, every one of the 21 airports will eventually enjoy reduced rent. The reduced rent willbe phased in slowly until FY2011, as illustrated in Figure 3-4. The new rent formula (Figure 3-5) is simple,transparent, and eliminates anomalies where airports of similar size paid very different rent.
Figure 3-4 – Phase In of Airport Rent Reduction
Source – InterVISTAS Consulting Inc.
Figure 3-5 – Airport Rents and Savings Under New Rent FormulaAirport Rent 2006 2010 2015 2020 Total
Old Formula $337 million $390 million $818 million $1.2 billion $12.9 billion
New Formula $289 million $214 million $274 million $0.3 billion $5.1 billion
All A
irpor
ts
Savings $48 million $176 million $544 million $0.9 billion $7.8 billion
Old Formula $4.5 million $5 million $8 million $11 million $119 million
New Formula $4.2 million $3 million $3 million $4 million $63 million
Halif
ax
Savings $0.3 million $2 million $5 million $7 million $56 million
Source – InterVISTAS Consulting Inc.

Halifax Gateway Council Strategic Plan Page 55
November 2005
Maritime Policy
CMA Review
The Canada Marine Act (CMA), which received Royal Assent in 1998, constituted the first, single,comprehensive piece of legislation to govern many aspects of Canada’s marine industry and allowed for theestablishment of Canada Port Authorities (CPA). The act facilitated the commercialization of the St.Lawrence Seaway, allowed for the continued divestiture of certain harbour beds and port facilities andcontained provisions for the further commercialization of federal ferry services. It also aimed to improve theway Pilotage Authorities operate in Canada.
The CMA required the Minister of Transport to complete a review of the provisions and operation of the actand report back to both Houses of Parliament in the fifth year following Royal Assent. A review panelundertook consultations with stakeholders and prepared a report that the Minister of Transport tabled in theHouse of Commons in June 2003. The review report made two general recommendations and a number ofspecific recommendations concerning implementation issues related to CPAs, the St. Lawrence Seaway,public ports, pilotage, and ferries. The report also included a number of observations on general marineissues.
A comprehensive review of the act addressed issues such as the competitiveness of Canada PortAuthorities in light of the rapid pace of change in the marine sector and levels of funding provided to ports inthe United States.
Overall, stakeholders, and CPAs in particular, have reacted positively to the CMA review report. Theprincipal concerns identified by the review were the marine sector’s financial flexibility, especially for CPAs,to maintain economic viability and respond effectively to changing market demands, as well as access tofederal funding for infrastructure investment.
In an effort to address the key concerns of the marine industry and establish an environment that is morefavourable to investment, the department is proposing a combination of legislative amendments withparticular attention to recommendations related to the financial concerns of ports.
Proposed amendments will establish a framework that respects accountabilities and provides CPAs withaccess to federal funding for infrastructure. They will also allow the Minister, in certain cases, to increase aport authority’s borrowing limits and to reduce the minimum number of directors on the boards of mostCPAs.
In order to improve the competitiveness of the Canadian marine industry, the department will not limit itsactivities to legislative amendments. Transport Canada will pursue other policy initiatives in key areas tocontinue to maximise the efficiency of the marine sector and strengthen its role in relation to Canada’sinternational trade.
Port Divestiture
The Port Divestiture Program was originally scheduled to end on March 31, 2002. However, it has beenextended by Cabinet until March 31, 2006. Therefore, Transport Canada will continue to transfer ownershipand operations of its regional/local ports. Giving local communities more control over port operations is partof the federal government's efforts to modernise Canada's marine system by instilling commercial disciplineand efficiency. This will ultimately lead to a more effective and efficient port system with local accountability.By having greater autonomy, ports will be able to apply more effective business principles at the same timeas they promote employment and economic growth. Once ports have been transferred, Transport Canada
Halifax Gateway Council Strategic Plan Page 56
November 2005
ends its operational role, which includes directly enforcing regulations, collecting user fees, and monitoringport operations.
Of the 549 public ports and port facilities originally controlled and administered by Transport Canada beforethe National Marine Policy came into force, 457 have been transferred, deproclaimed or demolished, orhave had Transport Canada's interests terminated. As of December 31, 2004, Transport Canada still had 92sites under its control. In addition, there are 18 sites where facilities have been transferred but cannot bedeproclaimed because the harbour bed has not yet been divested.
Rail Transportation Policy
Railway Network Rationalisation
After a successful acquisition bid, Canadian National (CN) incorporated BC Rail into its operations in July2004. This was part of the British Columbia government’s effort to increase BC Rail’s efficiency andfacilitate rail network connectivity at the Port of Prince Rupert.
The structure of Canada's rail system remained relatively stable in 2004. There was only a slight loss oftrack – Canadian Pacific Railway discontinued 129 kilometres of track in Saskatchewan and Alberta, whileSouthern Manitoba Railway discontinued about 100 kilometres of its system. There was also a large transferof track, approximately 2,300 kilometres, when CN completed takeover of BC Rail in July. The only othertransfer was in southern British Columbia, where Burlington Northern Santa Fe partially sold and leasednine kilometres of track to the newly formed Kettle Falls International Railway.
Open Rail Access
Open rail access generally refers to one railway (the guest railway) operating trains on tracks owned byanother railway (the host railway). Open access can take on one of two forms. Firstly, the access can belimited to running rights, whereby the host railway grants permission to the guest railway to move traffic fromone place to another on the host’s tracks. Secondly, open access can include broader 'traffic solicitationrights', where the guest railway is also permitted to compete directly with the host by soliciting business onthe host's line.
Open access can occur on a voluntary basis, resulting from commercial negotiation, or through regulation orlegislation requiring track owners to open their lines to competing carriers.
Canada’s national rail carriers are strongly opposed to a regulated open access, and cite several exampleswhere commercial agreements have been established. Co-production agreements have been negotiated inseveral Canadian jurisdictions by Canada’s major rail carriers allowing each party to optimise theirinfrastructure by allowing access to the other party’s tracks. Moreover, Canadian rail carriers note that theCanada Transportation Act contains two competitive access provisions – interswitching and competitive linerates (CLRs), which provide competitive rate protection to shippers.
Given that the railways in Canada are private shareholder enterprises, it is not likely that rail open accesswill be forced on them by legislation. Furthermore, should the government legislate open rail access, theoutcome could be negative. For example, CP Rail announced that it would not proceed with its plannedWestern Canada capacity investment of up to $500 million, unless it gets a commitment from the federalgovernment that open access would not be forced on them.
The proposed amendments to the Canada Transportation Act, tabled in 2005 (Bill C-44), do not include anyconsideration for enhanced rail access, and instead maintain existing provisions of the Act.
Halifax Gateway Council Strategic Plan Page 57
November 2005
Road Transportation Policy
The following legislative and regulatory changes have been undertaken:
Motor Carrier Safety Fitness Certificate Regulations — these proposed amendments to the MotorVehicle Transport Act were published for public comment in the Canada Gazette Part I on May 3, 2003.These proposed regulations would give provinces and territories the responsibility to monitor the safetyperformance of all extra-provincial motor carriers licensed in their jurisdiction. Provinces would maintaina complete safety compliance profile of each motor carrier, using input from all jurisdictions in whichthose carriers operate. They would give all carriers an initial safety fitness certificate of ‘Satisfactory –Unaudited’ until a safety performance is known and/or a facility audit is completed. If a carrier is rated‘Unsatisfactory,’ it could be prohibited from operating on Canadian roads. It is anticipated that thesenew regulations will be implemented in 2005.
Hours of Service Regulations — on February 15, 2003, revisions to the federal Hours of ServiceRegulations for Commercial Vehicle Drivers (bus and truck), applicable to extra-provincial carriers, werepublished in the Canada Gazette Part I. Transport Canada received 50 submissions commenting on theproposed changes.
On December 20, 2004, Transport Canada announced that a consensus had been reached among keyplayers in the Canadian trucking industry to limit commercial vehicle drivers to 13 hours of driving and14 hours on duty per 24-hour period. The proposed regulatory changes are the product of longconsultations with industry, the provinces and territories, and others, including Teamsters Canada. Thenew rules will increase minimum off-duty time over a 24-hour period by 25 per cent, from 8 hours to 10hours. This will provide significantly more opportunity for drivers to rest. The new rules will also reduceon-duty time by 12 per cent, from 16 hours to 14 hours, and will reduce the maximum daily driving timefor truckers in a 24-hour period by 19 per cent, from 16 hours to 13 hours.
The expectation now is that a final federal regulation will be published in the Canada Gazette Part II in2005 and mirrored shortly thereafter in provincial and territorial regulations.
Vehicle Weights and Dimensions — the federal, provincial, and territorial governments agreed to makethree changes to the national standards for the weights and dimensions of trucks and buses. Thecountry's transportation ministers endorsed these changes following a recommendation by theintergovernmental Task Force on Vehicle Weights and Dimensions Policy, which considered them atthe request of industry stakeholders.
The new standards were targeted for implementation by individual provinces and territories on July 1,2005. Canada's national standards are defined in the Memorandum of Understanding (MOU) on Inter-provincial Vehicle Weights and Dimensions.
Safety and Security
The government of Canada carries out policy development, rule-making, monitoring and enforcement, andoutreach activities in support of its safety and security objectives. Through these efforts, Transport Canadaestablishes and implements legislation, regulations, standards, and policies. Two specific areas of interestfor the Gateway are aviation security and marine security.
Aviation Security
The safety of Canada’s commercial air transportation industry has received considerable attention since theterrorist attacks of September 11, 2001. Several government directives have been announced and the
Halifax Gateway Council Strategic Plan Page 58
November 2005
federal government, in its budget of December 2001, committed $2.2 billion towards aviation security overthe next five years, including:
Deployment of advanced Explosives Detection Systems (EDS) at airports across the country;
Requirement that airlines supply Advanced Passenger Information System (APIS)/Passenger NameRecord (PNR) data for all flights, including domestic operations;
Expansion of the RCMP sky marshal program to cover selected domestic and international flights; and
Establishment of a Canadian Air Transport Security Authority (CATSA) to be responsible for thedelivery of air transportation security services in Canada.
Many of these directives have increased industry costs and decreased passenger satisfaction with air travel.Going forward, airports such as Halifax International Airport, will need to remain flexible to accommodatechanging security regulations and policies.
Marine Security
The Government of Canada is taking major action to strengthen marine security. The 2004 budget provided$605 million over five years for security initiatives. These funds will be used to address security priorities,such as intelligence enhancement, marine security, integrated threat assessments, cyber security,emergency response, and enhanced co-ordination of systems.
Following the budget, the Government of Canada also announced the National Security Policy in April 2004,which set out a six-point, $308-million plan to strengthen marine security.
The National Security Policy proposes to strengthen Canada's marine security by:
Clarifying and strengthening accountability for marine security among the various responsibledepartments and agencies. The Minister of Transport has primary responsibility for marine security andpolicy co-ordination. The Minister of Public Safety and Emergency Preparedness is primarilyresponsible for enforcement and policing, while the Minister of Defence is responsible for co-ordinationof on-water response to maritime threats and developing crises.
Establishing Marine Security Operations Centres to bring together all civil and military resourcesnecessary to detect, assess and respond to marine security threats.
Increasing the on-water presence of the Canadian Forces Maritime Command, RCMP and CanadianCoast Guard, as well as increasing the Department of Fisheries and Oceans’ aerial surveillanceactivities.
Investing in secure communications technologies to enhance the ability of Canadian civilian and navalfleets to communicate with each other and Marine Security Operations Centres.
Pursuing greater cooperation with the United States to enhance Canada’s marine defence and security.
Strengthening security at ports and other marine facilities, through the Marine Security ContributionProgram.
While enhancing marine security has many benefits (e.g. combating of organized crime, enhancing searchand rescue capabilities, conserving our fisheries, combating marine pollution, prevention of terrorists from
Halifax Gateway Council Strategic Plan Page 59
November 2005
entering Canada or accessing our marine transportation system), these efforts must be balanced tomaintain the free flow of trade and people, which in turn maintains the competitiveness of Canada’s marinesector and the country’s economic vitality.
Additionally, the International Ship and Port Security Code (ISPS Code), which became effective July 1,2004, is a new, comprehensive security regime that seeks to establish an international framework ofcooperation between governments, government agencies and the shipping and port industries in order todetect and take preventive measures against security incidents affecting ships or port facilities used ininternational trade.
Border Facilitation
Countries around the world are facilitating the movement of people and goods across national bordersthrough the implementation of more streamlined customs and immigration procedures. As NAFTA marketsbecome more closely integrated, the seamless movement of people and goods across the continent willincreasingly become important to ensure continued economic growth.
The Canada-U.S. Shared Border Accord that was signed at the same time as the Open Skies agreement,provides a framework for streamlining and harmonising Canada-U.S. travel and trade opportunities. Sincesigning, progress on a number of initiatives including the establishment of common inspection facilities,information sharing, and other co-operative measures have been achieved. However, over the short,medium, and long-term periods, a number of issues will need to be resolved.
Perimeter Clearance
Perimeter Clearance has been widely endorsed as a means of delivering the Smart Border Action Plan tofacilitate trade and travel between Canada and the U.S. The concept strengthens security and expeditestrade through pre-registration of individuals and goods.
Perimeter Clearance sets a specific course of action to allow clearance of international goods andpassengers at first point-of-arrival. A strategy has been developed by a coalition of airports, ports, shippersand tourism groups on both sides of the border for bi-national modernisation of border managementpractices through the joint application of new information technologies, biometrics and process re-design.Specifically, Perimeter Clearance would involve:
Common procedures for admission of goods and people between Canada and the U.S.;
Providing better security, particularly by interceding inadmissible people offshore and goods at the firstpoint of arrival – our common perimeter;
Distinguishing between low and high risk goods/people in order for both to be processed more quickly,efficiently and securely;
Sharing data to maximise the intelligence and co-ordination of information;
Increasing efficiencies through flexible use of customs and immigration officers working in eithercountry to administer national laws; and
Streamlining traffic flows at border crossings for all modes.
Automated Processing Systems

Halifax Gateway Council Strategic Plan Page 60
November 2005
The introduction of automated and other technology-based passenger control systems is generating interestin a number of nations. The Nexus system, a joint initiative of Canada Border and Services Agency and U.S.Customs and Border Protection, facilitates quick and secure entry into Canada and the U.S. for pre-approved, low-risk air travellers. The program is proving that technology-based services can provide viableand successful alternatives to traditional passenger facilitation processes. To date, Nexus Air has beenimplemented on a pilot project basis at Vancouver International Airport and Nexus Highway is operating at11 Canada-U.S. border locations.
For security reasons, existing systems do not incorporate other passenger processing and airport services.To date, system development has also excluded cargo applications.
Investment in Transportation and Infrastructure
The federal government of Canada continues to play a major role in transportation infrastructure investment.The government’s role includes research, on-going policy development, and program investments in thetransportation sector.
Infrastructure Canada
Infrastructure Canada, led by the Minister of State, John Godfrey was established in 2002, with the mandateto manage the development of long-term strategies to meet Canada’s modern infrastructure needs. Animportant part of its mandate is to administer funding programs that support public infrastructure initiativesand to provide strategic advice and policy direction.
The federal government’s role and investment in infrastructure initiatives has increased considerably overthe past decade, as have the scope of infrastructure projects. Several funding programs were established toaid both national and provincial infrastructure needs. They include: the Canada Strategic InfrastructureFund (CSIF), the Border Infrastructure Fund (BIF), the Municipal Rural Infrastructure Fund (MRIF), theInfrastructure Canada Program (ICP), the Strategic Highway Infrastructure Program, and the GreenMunicipal Funds.
In 2004, the Federation of Canadian Municipalities estimated a $60 billion infrastructure ‘deficit’ in our citiesand communities. To address this issue, the federal government has proposed a ‘New Deal for Cities andCommunities’, where stable, predictable, long-term funding will be given to municipalities to deal withinfrastructure development. This ‘new deal’ will supplement infrastructure programs currently in place.
Infrastructure Canada Funding Programs
Infrastructure Canada currently oversees the management of four contribution programs. Two of these,focus on large-scale strategic investments: the Canada Strategic Infrastructure Fund and the BorderInfrastructure Fund; and two focus on smaller community-based projects: the Municipal Rural InfrastructureFund and the Infrastructure Canada Program.
Canada Strategic Infrastructure Fund ($4 billion)
The Canada Strategic Infrastructure Fund (CSIF) addresses the problem with large-scale infrastructureprojects across the country which are beyond the scope and capacity of previous financial programs. TheCSIF is unique in that it emphasises partnerships with any combination of municipal, provincial, territorialgovernments, as well as the private sector, and each partnership is governed by specific arrangements.
Funding & Investment Criteria
Halifax Gateway Council Strategic Plan Page 61
November 2005
Infrastructure Canada, together with provincial/territorial governments, determines priority projects andfunds five main areas: highway and railway infrastructure, local transportation, infrastructure, tourism andurban development infrastructure, water and sewage infrastructure, and broadband. Priority projects mustaim to provide safer and faster movement of people and goods on Canada’s major land transportationroutes, reduce production of greenhouse gases and airborne pollutants, generate more-effective urbandevelopment, and/or use innovative technologies and practices to minimise pollution.
Border Infrastructure Fund ($600 million)
As border infrastructure is critical to our growing economic and trade relationship with the United States, theBorder Infrastructure Fund (BIF) targets some of the busiest Canada-United States border crossing pointswith the aim of increasing long-term efficiency of the movement of goods and people. The BIF supports theinitiatives in the Smart Borders Action Plan, a 30-point plan, produced by Canada and the United States,which identifies security risks in expediting the flow of goods and people. Three categories of projects arefunded under the BIF: Physical Infrastructure, Intelligent Transportation System Infrastructure, and ImprovedAnalytical Capacity.
Funding & Investment Criteria
The Border Infrastructure Fund is implemented in cooperation with provincial and municipal governments,and partners from the public and private sectors from both Canada and the U.S. The Government ofCanada contributes up to 50% towards the total eligible costs of the project. Project selection is based onthe ability to reduce congestion, enhance infrastructure capacity, coordinate with adjacent U.S. borderfacilities and road access networks, enhance safety and security at border crossings, and/or includefinancial participation of other public and private sector partners.
Municipal Rural Infrastructure Program ($1 billion)
The Municipal Rural Infrastructure Program (MRIF) was announced in 2003 to support smaller scalemunicipal infrastructure projects that improve the quality of life, sustainable development, and economicopportunities for smaller communities. This program also includes a component that addresses theinfrastructure needs of First Nations communities. The MRIF aims at improving core public infrastructure inareas such as water, wastewater, cultural, and recreation.
Funding & Investment Criteria
As the MRIF aims for an equitable balance between provinces, territories and the First Nations component,a base allocation of $15 million is given to each jurisdiction, with the remaining funds allocated on a percapita basis. Furthermore, 80% of the total funding under the MRIF is allocated to municipalities with apopulation of less than 250,000.
Infrastructure Canada Program ($2.05 billion)
The Infrastructure Canada Program (ICP) was created in 2000 to enhance infrastructure in Canada’s urbanand rural communities and to support long-term economic growth. The ICP's main priority is green municipalinfrastructure – projects that improve the quality of our environment and contribute to clean air and water.
Funding & Investment Criteria
Funds from the ICP are awarded to projects that target water and wastewater systems, water management,solid waste management, and recycling. The program also targets projects that improve local transportation,roads and bridges, affordable housing, telecommunications, and tourism, cultural and recreational facilities.

Halifax Gateway Council Strategic Plan Page 62
November 2005
Other Infrastructure Funding Programs
Two other major infrastructure funding programs, not administered by Infrastructure Canada but sponsoredby the federal government are the Strategic Highway Infrastructure Program, managed by TransportCanada and the Green Municipal Funds managed by the Federation of Canadian Municipalities.
Strategic Highway Infrastructure Program ($600 million)
Transport Canada established the Strategic Highway Infrastructure Program (SHIP), in 2001, with the aim ofimproving Canada’s highway infrastructure over 5 years. The program consists of two components: a $500million highway construction component and a $100 million national system integration component. TheGovernment of Canada, together with the provinces and territories identify parts of the national highwaysystem that need immediate attention due to growing traffic and increasing trade. This component aims toprovide a safer and more efficient highway system across Canada. The national system integrationcomponent targets projects that deploy Intelligent Transportation Systems across Canada, improve bordercrossings, and advance transportation planning. Intelligent Transportation Systems include applicationssuch as advanced systems for traveller information, traffic management, public transport, commercialvehicle operations, emergency response management, and vehicle safety.
Green Municipal Funds ($250 million)
The Green Municipal Funds (GMF) consist of a $250-million endowment from the federal government andare designed to remove investment barriers, such as real or perceived risks and higher capital costs, forgreen municipal infrastructure. The GMF consists of a $200-million Green Municipal Investment Fund(GMIF) and a $50-million Green Municipal Enabling Fund (GMEF). The Funds’ priorities are to cutgreenhouse gas emissions, to improve local air, water and soil quality, and to promote renewable energy.
Funding & Investment Criteria
All municipalities can apply for financial services of the Green Municipal Funds. Loans and grants are givento projects that generate environmental improvements, measured as a reduction in: pollutants to air, waterand soil; energy or water consumed; or energy generated by non-renewable resources. Funded projectsmust also demonstrate innovation in one of the following areas: the development of a new knowledge,practice or advanced technology; a unique application of an existing technology; or the adoption of atechnology or process not previously within an area.
Figure 3-6 outlines federal funding for each Infrastructure program and the associated funding period.Available forecasts and planned spending for each infrastructure program is shown in Figure 3-7.
Figure 3-6 – Federal Budget for Infrastructure Programs (as of 2004) Infrastructure Programs Federal Funding Funding Period
Canada Strategic Infrastructure Fund $4.0 billion 2003-2013
Border Infrastructure Fund $600 million 2003-2013
Municipal Rural Infrastructure Fund $1 billion 2004-2009
Infrastructure Canada Program $2.0 billion 2000-2007
Strategic Highways Infrastructure Program $600 million 2002-2007
Green Municipal Funds $250 million Indefinite
Source – Government of Canada.

Halifax Gateway Council Strategic Plan Page 63
November 2005
Figure 3-7 – Federal Budget Planned Contributions (as of 2004)
Contributions (thousands)
Infrastructure Programs2002-2003
ForecastSpending2003-2004
PlannedSpending2004-2005
PlannedSpending2005-2006
PlannedSpending2006-2007
Canada Strategic Infrastructure Fund n/a $92,165 $376,736 $623,606 $784,241
Border Infrastructure Fund n/a $9,695 $72,714 $119,559 $99,556
Municipal Rural Infrastructure Fund 0 0 $125,000 $150,000 $250,000
Infrastructure Canada Program $317,000 n/a n/a n/a n/a
Strategic Highways Infrastructure Program $128,420 $202,393 n/a n/a n/a
Green Municipal Funds n/a $5,191 $1,925 0 0
Source – Government of Canada.
Proposed New Infrastructure Programs
In addition to current Infrastructure Programs, the federal government also established the ‘New Deal forCities and Communities’ in the Budget of 2004. The objective of the program is to continue to promote newpartnerships between federal, provincial, and municipal governments and to begin to deliver stable,predictable, long-term infrastructure funding for cities and communities in urban and rural areas.
The focus of the New Deal is on providing funding for environmentally sustainable municipal infrastructureprojects. As rural and urban communities have very different infrastructure needs, the new deal wascreated to help address these challenges by engaging and consulting with key stakeholders: all orders ofgovernment, the private sector, and national and civil societies.
Roles and Involvement
The New Deal is administered under John Godfrey, Minister of State (Infrastructure and Communities). ThisMinistry was established in July 2004 by combining the Secretariat for Cities with Infrastructure Canada. Itsaim is to orient the ministry towards sustaining and developing vibrant communities.
The New Deal is administered under the Ministry of Infrastructure and Communities. The Prime Ministeralso established an External Advisory Committee on Cities and Communities (EACCC) in December 2003,chaired by Mike Harcourt, to develop a long-term vision for sustainable communities and to providerecommendations to the Prime Minister. The EACCC reports solely to the Prime Minister.
The funding distribution mechanism is through tripartite agreements for each province, where thegovernment of Canada, the provincial government and the municipality will work together to coordinateresources effectively. To date, five tripartite agreements have been signed, committing funds for a five-yearperiod: British Columbia ($636 million); Alberta ($477 million); Ontario ($1.87 billion); Quebec ($1.15 billion);Yukon ($37.5 million); and Prince Edward Island ($37.5 million).
Funding
The program proposes three new programs to fund municipal infrastructure: accelerated infrastructurefunding to existing programs, full GST/HST relief for municipalities of all sizes, and a portion of the gas taxrevenue.
Halifax Gateway Council Strategic Plan Page 64
November 2005
Acceleration of Infrastructure Funding
In 2003, the federal government committed $1 billion for the Municipal Rural Infrastructure Fund to be spentover the next 10 years. In the ‘New Deal for Cities and Communities’, this funding will be administered overfive years, which will give municipalities across Canada quicker access to the funds they need to plan theirinfrastructure improvements.
GST/HST Relief
In addition to increased funding under current infrastructure programs, the federal government has allowedmunicipalities to recover 100 per cent of the GST and the federal component of the harmonised sales tax(HST) they contribute. This is estimated to be $7 billion in GST/HST relief over the next 10 years tomunicipalities.
Portion of the GAS Tax Revenue
Cities have been engaged in on-going discussions with the federal government over receiving a portion ofthe $4.5 billion gas tax revenue. The federal government has preliminarily offered five cents per litre of thefederal gas tax to municipal governments which would amount to about $2.5 billion a year. The federalgovernment and the mayors have set a November 2005 deadline to determine a formula for dividing thenew gas-tax funds. This revenue is to be a source of stable, predictable funding to allow municipalities tomake long-term financial commitments on major infrastructure projects.
Allocation of Gas Tax Revenues
Figure 3-8 summarises the provinces that have signed agreements to the New Deal. It also describes theadministration process for the federal gas tax funds. All other provincial agreements are set to be signed inthe coming months.

Halifax Gateway Council Strategic Plan Page 65
November 2005
Figure 3-8 – Provincial Allocation of Gas Tax Revenues
Province, Date ofAgreement and Amount Agreement Signatories Administration
British Columbia
- April 25, 2005
- $636 million
- Prime Minister
- Premier of British Columbia
- President of the Union of British ColumbiaMunicipalities
- Funds will flow directly to Union of BCMunicipalities
- Committees will be established to ensureaccountability for money spent
Alberta
- May 14, 2005
- $477 million
- Deputy Prime Minister
- Minister of State (Infrastructure andCommunities)
- Alberta Minister of International andIntergovernemental Relations
- Alberta Minister of Infrastructure andTransportation
- Alberta Minister of Municipal Affairs
- Funds will flow from the federal government tothe provincial government, and the provincewill forward the funding to municipalities
- The funds will be distributed based onestimated 2006 populations (99%), with theremaining given to very small municipalitieswho will receive a minimum base amount
Ontario
- June 17, 2005
- $1.87 billion
- Prime Minister
- Minister of State (Infrastructure andCommunities)
- Minister of Ontario Municipal Affairs andHousing
- President of the Association of OntarioMunicipalities
- Funds will flow to the AMO and the City ofToronto
- Committees will be established to maximizeeffectiveness of the partnership and to ensurespending accountability
- Allocation of funds to all Ontario communitiesas determined by Canada in consultation withthe Association of Ontario Municipalities andthe City of Toronto, will be based onpopulation, using the 2001 National Censusdata
Quebec
- June 21, 2005
- $1.151 billion
- Prime Minister
- Premier of Quebec
- Minister of State (Infrastructure andCommunities)
- Quebec Minister of Intergovernemental Affairs
- Funds are paid to the Societe de financementdes infranstructures locales du Quebec(SOFIL), an agency created by theGovernment of Quebec, whose mandate is toprovide financial assistance to municipalitiesand municipal organizations for infrastructureprojects
Yukon
- May 26, 2005
- $37.5 million
- Yukon’s Minister of Community Services
- Member of Parliament for the Yukon on behalfof Minister of State (Infrastructure andCommunities)
- A joint Committee with representation fromYukon First Nations, the AYC, and the Yukonand Canadian governments will be establishedto oversee the funds
Prince Edward Island
- April 27, 2005
- $37.5 million
- Minister of Atlantic Canada OpportunitiesAgency
- Parliament Secretariat to the Minister ofFisheries and Oceans
- Premier of Prince Edward Island
- Minister of Community and Cultural Affairs
- A senior-level partnership ImplementationCommittee will include:
- Infrastructure Canada and the AtlanticCanada Opportunities Agency (ACOA) (onbehalf of Canada)
- Prince Edward Island’s departments ofIntergovernmental Affairs and Communityand Cultural Affaires (on behalf of theprovide)
- Supported by other parties such asTransport Canada
- Gas Tax Funds will be funneled to thiscommittee for disbursement
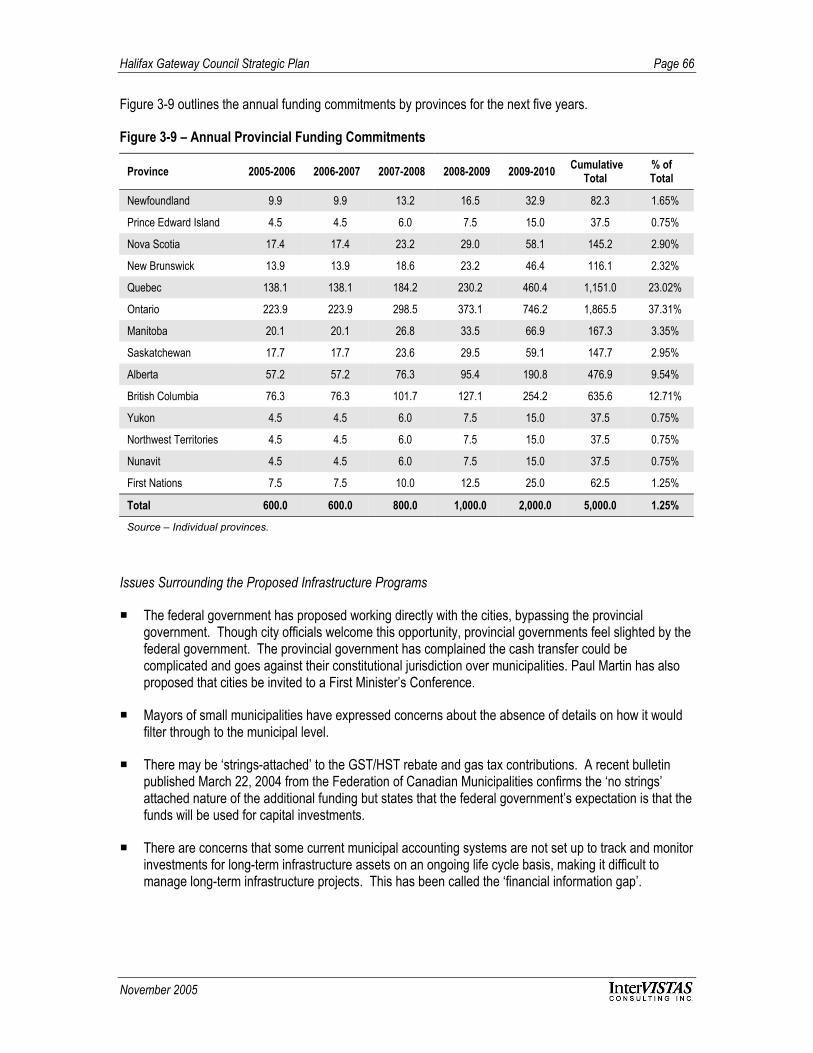
Halifax Gateway Council Strategic Plan Page 66
November 2005
Figure 3-9 outlines the annual funding commitments by provinces for the next five years.
Figure 3-9 – Annual Provincial Funding Commitments
Province 2005-2006 2006-2007 2007-2008 2008-2009 2009-2010 CumulativeTotal
% ofTotal
Newfoundland 9.9 9.9 13.2 16.5 32.9 82.3 1.65%
Prince Edward Island 4.5 4.5 6.0 7.5 15.0 37.5 0.75%
Nova Scotia 17.4 17.4 23.2 29.0 58.1 145.2 2.90%
New Brunswick 13.9 13.9 18.6 23.2 46.4 116.1 2.32%
Quebec 138.1 138.1 184.2 230.2 460.4 1,151.0 23.02%
Ontario 223.9 223.9 298.5 373.1 746.2 1,865.5 37.31%
Manitoba 20.1 20.1 26.8 33.5 66.9 167.3 3.35%
Saskatchewan 17.7 17.7 23.6 29.5 59.1 147.7 2.95%
Alberta 57.2 57.2 76.3 95.4 190.8 476.9 9.54%
British Columbia 76.3 76.3 101.7 127.1 254.2 635.6 12.71%
Yukon 4.5 4.5 6.0 7.5 15.0 37.5 0.75%
Northwest Territories 4.5 4.5 6.0 7.5 15.0 37.5 0.75%
Nunavit 4.5 4.5 6.0 7.5 15.0 37.5 0.75%
First Nations 7.5 7.5 10.0 12.5 25.0 62.5 1.25%
Total 600.0 600.0 800.0 1,000.0 2,000.0 5,000.0 1.25%
Source – Individual provinces.
Issues Surrounding the Proposed Infrastructure Programs
The federal government has proposed working directly with the cities, bypassing the provincialgovernment. Though city officials welcome this opportunity, provincial governments feel slighted by thefederal government. The provincial government has complained the cash transfer could becomplicated and goes against their constitutional jurisdiction over municipalities. Paul Martin has alsoproposed that cities be invited to a First Minister’s Conference.
Mayors of small municipalities have expressed concerns about the absence of details on how it wouldfilter through to the municipal level.
There may be ‘strings-attached’ to the GST/HST rebate and gas tax contributions. A recent bulletinpublished March 22, 2004 from the Federation of Canadian Municipalities confirms the ‘no strings’attached nature of the additional funding but states that the federal government’s expectation is that thefunds will be used for capital investments.
There are concerns that some current municipal accounting systems are not set up to track and monitorinvestments for long-term infrastructure assets on an ongoing life cycle basis, making it difficult tomanage long-term infrastructure projects. This has been called the ‘financial information gap’.
Halifax Gateway Council Strategic Plan Page 67
November 2005
Transportation and the Environment
In Canada and abroad, transportation and the environment continue to be a major policy focus. The federalgovernment (Transport Canada and others) has undertaken several initiatives to help curb green house gasemissions and other pollutants.
A number of new federal transportation-related initiatives were introduced in 2004:
The One-Tonne Challenge, a campaign aimed at providing Canadians with information and tools toreduce their own GHG emissions by one tonne, including emissions related to travelling;
The announcement of the Hydrogen Highway, an initiative to stimulate the development andcommercialisation of hydrogen and fuel cell technologies;
The Urban Transportation Showcase Program, an initiative to demonstrate and evaluate the impacts ofintegrated strategies for reducing GHG emissions, air pollution, congestion, urban form and land use,and increased active transportation;
Federal and provincial announcements of investments in public transit; the New Deal for Cities andCommunities announced in the Speech from the Throne (October 5, 2004); and a national urban transitbus retrofit program;
The Advanced Technology Vehicles Program, aimed at reducing GHG emissions in the transportationsystem;
The Freight Efficiency and Technology Initiative, aimed at reducing the growth of GHG emissions fromfreight transportation;
Proposed amendments to the Sulphur in Diesel Fuel Regulations to introduce limits in off-road, rail andmarine diesel fuels aligned with the levels adopted by the U.S. Environmental Protection Agency inJune 2004; and
Proposed Off-Road Compression-Ignition Engine Emission Regulations to introduce emissionstandards for diesel engines starting in 2006.
Implications for the Halifax Gateway Canada has pursued and continues to pursue (bearing in mind the foregoing) a very market-driven
policy framework – divestiture (ports and airports), P3s, air transport liberalisation, privatisation (e.g. AirCanada and CN Rail), and commercialisation (e.g. Nav Canada, deregulation, user pay systems, tollroads and bridges, etc. have been cornerstones of Canadian Transportation policy).
While the emerging transport policy environment in Canada is still concerned with fine tuning theframeworks described above, it is becoming increasingly focused on security and facilitation, andborder management services with the U.S. and Mexico. The latter includes harmonising securityapproaches for all modes, greening/environmental policies, infrastructure investment policies, intelligenttransportation systems, fiscal and taxation policies, mobility policies, intermodal approaches, planningat ports, short sea shipping, and seaway development policies. The government is also exploring thepros and cons of a multilateral approach in negotiating aviation agreements as opposed to thetraditional bilateral approach (a reflection that trade patterns and trading regions are beginning to drivetransportation demand and consumption).
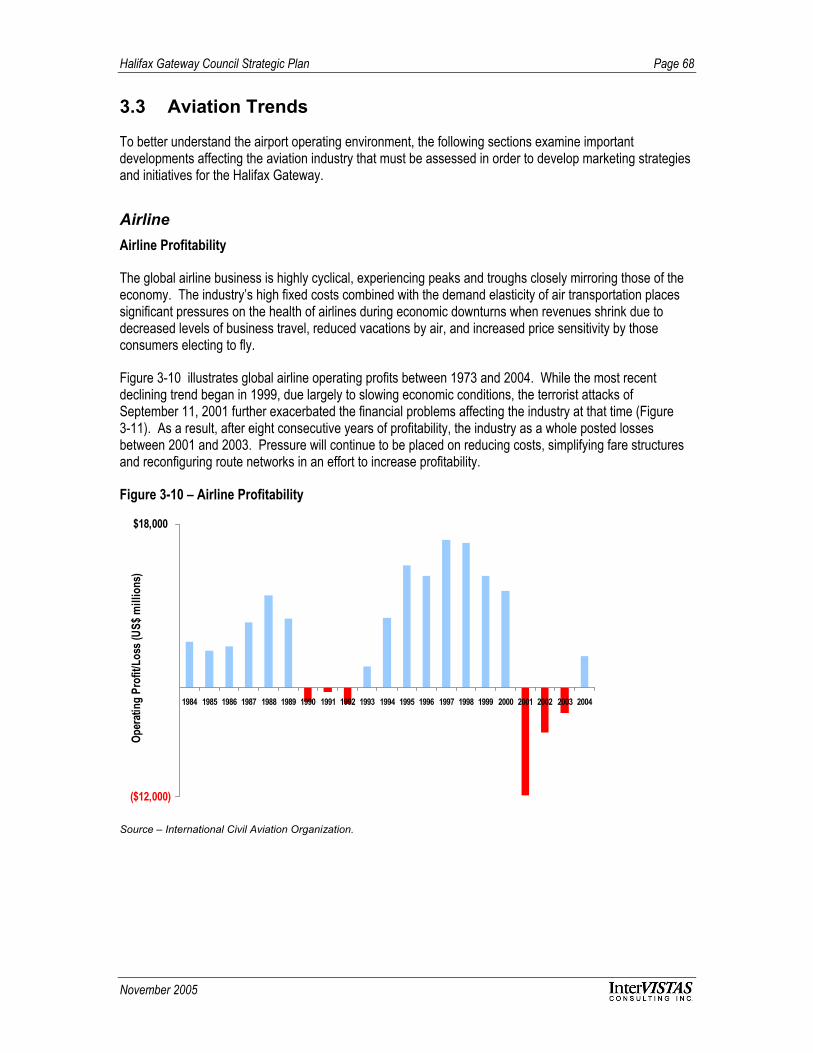
Halifax Gateway Council Strategic Plan Page 68
November 2005
3.3 Aviation Trends
To better understand the airport operating environment, the following sections examine importantdevelopments affecting the aviation industry that must be assessed in order to develop marketing strategiesand initiatives for the Halifax Gateway.
AirlineAirline Profitability
The global airline business is highly cyclical, experiencing peaks and troughs closely mirroring those of theeconomy. The industry’s high fixed costs combined with the demand elasticity of air transportation placessignificant pressures on the health of airlines during economic downturns when revenues shrink due todecreased levels of business travel, reduced vacations by air, and increased price sensitivity by thoseconsumers electing to fly.
Figure 3-10 illustrates global airline operating profits between 1973 and 2004. While the most recentdeclining trend began in 1999, due largely to slowing economic conditions, the terrorist attacks ofSeptember 11, 2001 further exacerbated the financial problems affecting the industry at that time (Figure3-11). As a result, after eight consecutive years of profitability, the industry as a whole posted lossesbetween 2001 and 2003. Pressure will continue to be placed on reducing costs, simplifying fare structuresand reconfiguring route networks in an effort to increase profitability.
Figure 3-10 – Airline Profitability
($12,000)
$18,000
1984 1985 1986 1987 1988 1989 1990 1991 1992 1993 1994 1995 1996 1997 1998 1999 2000 2001 2002 2003 2004
Oper
ating
Pro
fit/L
oss (
US$ m
illio
ns)
Source – International Civil Aviation Organization.

Halifax Gateway Council Strategic Plan Page 69
November 2005
Figure 3-11 – September 11 and Other Market Shocks
0
500
1,000
1,500
2,000
1973 1975 1977 1979 1981 1983 1985 1987 1989 1991 1993 1995 1997 1999 2001
Pass
enge
rs (m
illion
s) Global Recession3-year Recovery
Gulf War & Recession3-year Recovery
Asian Flu1.5-year Recovery
September 11 &Economic Downturn
Recovery ?
Source – InterVISTAS Consulting Inc.
Price of Air Travel
The strong growth of air transport has been driven over the past 50 years by the continuously declining costof air travel. As shown in Figure 3-12, over the 40-year period between 1962 and 2002, revenue perpassenger-mile in inflation adjusted constant 2002 dollars decreased from $0.40 to $0.12. The decline wascontinuous over the period, steadily making air travel more affordable to all segments of society. Thedownward trend in the cost of passenger air travel is expected to continue into the future indefinitely.Airlines continue to focus on reducing costs and manufacturers are producing aircraft with dramaticallylower fuel consumption and operating costs.
Figure 3-12 – Decline in U.S. Airline Yields
$0.00
$0.05
$0.10
$0.15
$0.20
$0.25
$0.30
$0.35
$0.40
$0.45
1962
1964
1966
1968
1970
1972
1974
1976
1978
1980
1982
1984
1986
1988
1990
1992
1994
1996
1998
2000
2002
Yiel
ds ($
US)
- in
200
4 do
llars
DomesticSystem-Wide
Source – Air Transport Association.
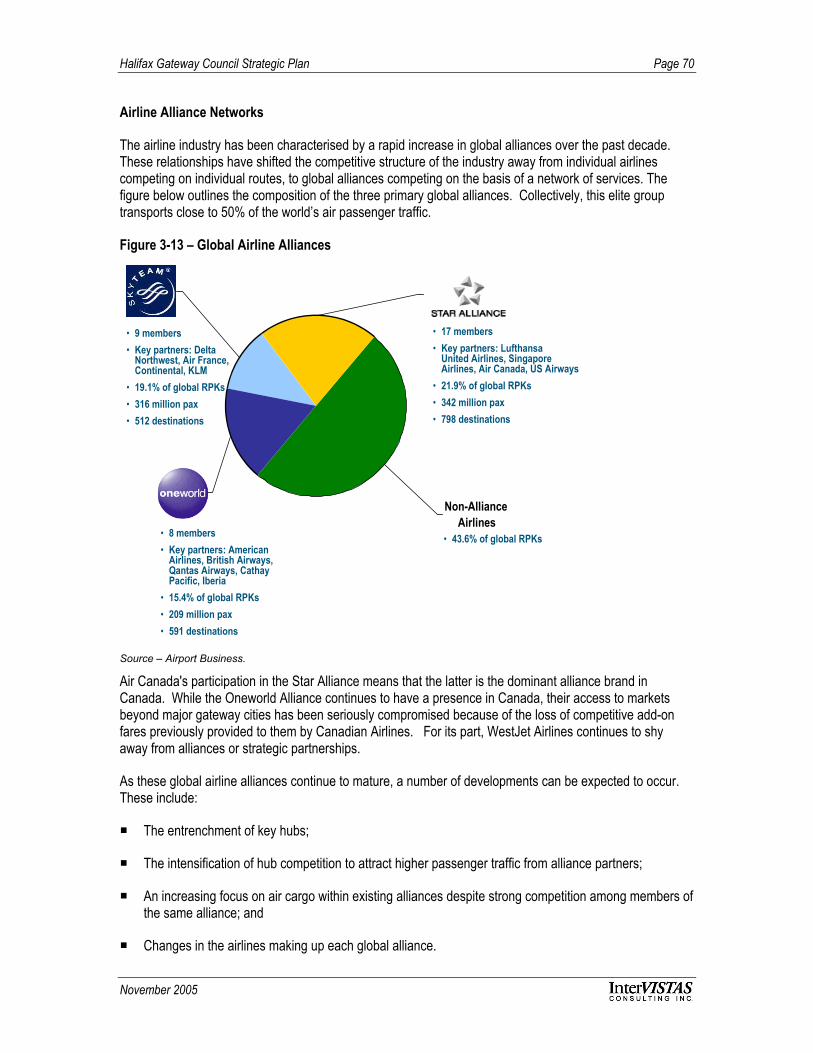
Halifax Gateway Council Strategic Plan Page 70
November 2005
Airline Alliance Networks
The airline industry has been characterised by a rapid increase in global alliances over the past decade.These relationships have shifted the competitive structure of the industry away from individual airlinescompeting on individual routes, to global alliances competing on the basis of a network of services. Thefigure below outlines the composition of the three primary global alliances. Collectively, this elite grouptransports close to 50% of the world’s air passenger traffic.
Figure 3-13 – Global Airline Alliances
Non-Alliance Airlines
• 9 members• Key partners: Delta
Northwest, Air France,Continental, KLM
• 19.1% of global RPKs• 316 million pax• 512 destinations
• 8 members• Key partners: American
Airlines, British Airways,Qantas Airways, CathayPacific, Iberia
• 15.4% of global RPKs• 209 million pax• 591 destinations
• 17 members• Key partners: Lufthansa
United Airlines, SingaporeAirlines, Air Canada, US Airways
• 21.9% of global RPKs• 342 million pax• 798 destinations
• 43.6% of global RPKs
Source – Airport Business.
Air Canada's participation in the Star Alliance means that the latter is the dominant alliance brand inCanada. While the Oneworld Alliance continues to have a presence in Canada, their access to marketsbeyond major gateway cities has been seriously compromised because of the loss of competitive add-onfares previously provided to them by Canadian Airlines. For its part, WestJet Airlines continues to shyaway from alliances or strategic partnerships.
As these global airline alliances continue to mature, a number of developments can be expected to occur.These include:
The entrenchment of key hubs;
The intensification of hub competition to attract higher passenger traffic from alliance partners;
An increasing focus on air cargo within existing alliances despite strong competition among members ofthe same alliance; and
Changes in the airlines making up each global alliance.

Halifax Gateway Council Strategic Plan Page 71
November 2005
It should also be noted that not all of these alliances are stable. As a result, some alliances could cease toexist, with current member airlines joining other alliances or establishing new alliance families altogether.
Growth of Low Cost Carriers
Another noticeable trend in the airline industry has been the tremendous growth of low cost airlines.Originally conceived in the U.S., they have now been established in virtually every region of the world(Figure 3-14).
Figure 3-14 – Distribution of Low Cost Airlines
Low cost carriers, such as WestJet Airlines, Southwest Airlines and Ryannair, offer primarily point to pointservice with few in-flight or airport amenities. They are committed to value pricing, high resource utilization,internet marketing and distribution, and good customer service.
In 1990, the market share of low cost carriers in the U.S. was only 7%. By 2002, this share had increased to24% and industry experts now project that this figure will increase to roughly 50% by 2010.

Halifax Gateway Council Strategic Plan Page 72
November 2005
Figure 3-15 – Airline Industry Transformation
Low Cost Carriers
7%
Network Carriers
93%
1990
Low Cost Carriers
24%
Network Carriers
76%
2002
Low Cost Carriers
50%
Network Carriers
50%
2010
Source – U.S. Department of Transportation.
Looking to the future, JetBlue Airways has placed a large order for Embraer 190 jet aircraft (regional jetswith a capacity of 90-100 seats). These aircraft have very attractive economics and can be operated by lowcost carriers in markets that are 30% smaller than those required for Boeing 737 or Airbus A320 aircraft.
Consolidation of Canada’s Airline Industry
The Canadian airline industry has experienced some dramatic changes over the past few years, includingthe Air Canada/Canadian Airlines merger, the introduction of new carriers (e.g. CanJet) and the exit of somecarriers from the market (e.g. Jetsgo). These developments have impacted revenues, air service levels,and the competitive positions of many airports across the country. As the industry continues change, it willundoubtedly present new challenges for Halifax and other Canadian airports.
U.S. and International Airline Industry Consolidation
Since the development of global airline alliances, air transport economists have been predicting that thesealliances would be the precursor to global airline consolidation. Over the next few years, considerablerestructuring could occur in the U.S. and in the international airline industry due largely to changing foreignownership laws. As these nationality rules are relaxed around the world, it is expected that cross-bordermergers and acquisitions will begin to replace the more common alliance agreements.
Before any merger is authorised to proceed, however, considerable scrutiny will occur, particularly withrespect to its impact on pricing, competition, hub dominance, and labour. In the event that these carriers aresuccessful in obtaining the necessary regulatory approvals, industry experts speculate that others couldsoon be forced to follow suit in order to maintain their market positions.
It should also be noted that if consolidation occurs, it will undoubtedly influence existing airline alliancenetworks and further entrench certain gateway hubs.
Charter Carriers
Charter airlines are continuing to play an important role in the development of tourism and leisure marketsworld-wide. Generally speaking, these carriers are best suited to markets that are seasonal in nature, have

Halifax Gateway Council Strategic Plan Page 73
November 2005
a high concentration of leisure travellers, and a low number of independent travellers. Many charter carriersare tied to integrated travel groups that predominantly serve the package holiday market. In Canada, therehas been considerable growth in the charter market in recent years, particularly to sunspot and Europeandestinations.
Socio-Economic Changes
A number of socio-economic changes are also occurring, which will have an impact on aviation demand,including:
Increasing leisure travel – leisure travel accounts for over half of total air travel and is growing muchfaster than business travel. Recent studies also indicate that travellers are increasingly combiningbusiness and leisure travel.
Changing incomes – family incomes are increasing, and as they do, the demand for air travel is growingas well. In addition, evidence indicates that people are taking shorter, but more frequent holidays.These people have a greater propensity to fly because they want to minimize the amount of holidaytime spent in transit between origin and destination.
Demographic changes – the demographics of society are changing. Today, the fastest growingpopulation segments are empty nesters and echo boomers (now 10-27 years of age). Both groupshave high tendencies to travel.
New Outbound Tourism Markets
Over the longer term, the emergence of major new markets will also affect aviation demand. According tothe World Tourism Organization, China is expected to grow from 12 million outbound tourists in 2001 to 100million outbound tourists by 2020, making it the fourth largest tourism generating nation in the world. Othermarkets anticipated to show large outbound tourism growth include India, the Philippines, Mexico, Chile,Venezuela and Brazil. These markets tend to have relatively young demographic profiles and strong GDPgrowth, combined with a change in attitude towards both foreign and domestic travel.
Figure 3-16 – Comparison of Source Markets (1990 versus 2002)
42%
58%
United States, Germany, United Kingdom, Japan,France, Italy, China, Netherlands, Hong Kong, Russia
Other
20021990
30%
70%
United States, Germany, Japan, United Kingdom,Italy, France, Canada, Austria, Netherlands, Sweden
Other
Source – World Tourism Organization.

Halifax Gateway Council Strategic Plan Page 74
November 2005
Aircraft Technology Trends
Significant advances in aircraft technology have taken place in a relatively short period of time. New aircraftdesigns are expected to have a significant influence on airlines and airports in the future. These aircraft canbe categorised into two groups: large and long-range aircraft and small and regional aircraft.
Large and Long-Range Aircraft
Developments in large and long-range aircraft will further entrench the role of hub airports; this is particularlythe case with high capacity aircraft. In order to maximise the efficiencies of these aircraft, airlines maychoose to further consolidate international operations, and depend on regional feeders to supplypassengers at hub airports.
Specific aircraft designs in this category include:
High capacity aircraft – the first high capacity aircraft, the Airbus A380 is expected to enter service in2006. Due to its size, A380s will likely operate on high-density trunk routes linking some of the world’slargest airports.
Long range aircraft – somewhat smaller capacity, longer-range aircraft, such as the A330/340 andB777, have significantly affected international air travel. This new generation of aircraft enable aircarriers to bypass traditional gateway airports and provide non-stop flights between markets as distantas New York and Delhi.
Small and Regional Aircraft
In addition to the impressive developments in new large and high-speed aircraft, advances in small aircraft,such as regional jets and single engine turboprops have been equally impressive. These new generationsmall aircraft are able to fly increasingly faster and further with greater levels of comfort. In particular,significant developments have been achieved in the following areas:
Regional jets – since their introduction in 1993, regional jets have revolutionised the standards for travelin short to medium-range markets. With fewer seats and lower operating costs than larger aircraft,regional jets can compete aggressively for passengers in smaller markets. As a result, they are beingused to replace turboprops and larger jets on hub routes, develop new spoke-to-spoke markets, providedirect service between smaller communities, by-pass traditional hubs, and add frequency to mainlinehub feed. Over 1,300 regional jets are currently in operation world-wide and another 900 are on order.
Single-engine turboprops – single-engine turboprop aircraft such as the Pilots PC-12 integrateaerodynamically advanced airframes and engines to provide an economical and reliable single-engineturboprop package. With longer ranges, faster cruise speeds, lower operating costs, and goodoperational flexibility, these aircraft permit regional point-to-point services to be established in marketsthat cannot be served with larger regional equipment such as regional jets or larger turboprops.
New Noise Standards
Noise impacts from aircraft operations are an increasingly critical issue for airports around the world. InCanada, airlines were required to eliminate noisy Chapter 2 aircraft by April 2002, and similar rules appliedin Europe and the U.S. While new Chapter 4 noise standards have been developed, no timeframe has

Halifax Gateway Council Strategic Plan Page 75
November 2005
been established for their enforcement. As a result, aircraft operating with Chapter 2 conversions (includingmany in Canada) are expected to remain in use for at least the next five years. Most Chapter 3 aircraftmeet the new Chapter 4 standards.
Internet Reservations
Air carriers are increasingly using the Internet as a means of marketing, selling, and distributing air tickets.In recent years, airlines have divested their interest in the major Computer Reservation Systems (forexample, AMR Corporation sold Sabre in 2000), while at the same time, significantly increasing investmentsin Internet technologies. These investments extend beyond the airlines’ own corporate web sites andinclude development of ‘independent’ travel sites.
The increased use of the Internet for reservations has created some issues for the industry. Firstly, Internetsales have a detrimental effect on travel agent sales. Secondly, many of the issues that emerged over adecade ago with airlines exercising control over Computer Reservation Systems (e.g. biased displays thatfavour one carrier’s services over another) are now beginning to reappear with the Internet. To date, noaction has been taken to prevent this anti-competitive behaviour, but the U.S. Department of Justice isactively monitoring air carrier activities with regards to the Internet.
CargoContinued Growth in Cargo
Since 1970, air cargo has grown at approximately three times the rate of the world economy, rates whichare greater than those for passenger transport. Very strong continued growth is anticipated in internationalair cargo volumes, necessitating greater use of freighters which are less tied to major passenger markets.Domestic air cargo is also anticipated to continue growing, albeit at lower rates.
The growth in air cargo has been driven by declining costs and changing logistics patterns and practices.Since 1985, Boeing reports that air cargo costs have declined by 2.4% per annum, resulting in a shift fromshipping only high-value products by air to mid-value-range goods such as fresh seafood and fashionapparel. A continued reduction in freight rates will result in an ever broadening the scope of air-compatibleshipments, making Halifax more of an air cargo market (e.g., a wider range of seafood products) (Figure3-17).

Halifax Gateway Council Strategic Plan Page 76
November 2005
Figure 3-17 – Air Cargo Value Pyramid
Today’s cargo rate
Tomorrow
AREA REPRESENTS TOTAL VALUE OF ECONOMY
PlatinumGold
Electronics
High-Value Fashion ApparelFresh Shellfish, mushroomsMid-Range Fashion Apparel
Fresh SeafoodFresh Vegetables Canned Fish
GrainCoal OilValu
e of G
oods
: $ p
e r ki
log r
amVa
l ue o
f Goo
ds: $
per
kilo
g ram
Items above line are viable for air cargo
Source – Boeing Corporation and InterVISTAS Consulting Inc.
Trends in Aircraft Type
A number of trends in aircraft usage may impact air cargo at Halifax International Airport. The increasingreliance on narrow-body and RJ service has had detrimental impact on cargo lift. While these aircraft havebeen effective in replacing larger jets in selected passenger markets, their limited cargo capacity usuallyresults in a loss of cargo lift for the impacted communities.
The increasing range of freighters has also lessened the need for tech stops. For example, the Boeing 777freighter will be able to travel 5,200 nautical miles with a full load of 101 tonnes, while the Airbus A380freighter will be able to travel 5,620 nautical miles with a full load of 150 tonnes. In contrast, the longestrange freighter today, the Boeing 747-400 freighter, can only travel 4,300 nautical miles with a 112 tonneload. Other trends include the likely replacement of the Canadian domestic workhorse, the Boeing 727freighter, with the 757 freighter.
International Air Agreements
Continued liberalisation of international air agreements will facilitate innovative new cargo services,particularly ones built up on fifth freedom rights (the right to enplane traffic at one foreign point and deplaneit in another foreign point as part of continuous operation also serving the airline's homeland) and seventhfreedom services (the term applied to an airline operating turn around service and carrying traffic betweenpoints in two foreign countries without serving its home country).

Halifax Gateway Council Strategic Plan Page 77
November 2005
Air Cargo Security Issues
Increasing security requirements could have a negative impact on international air cargo growth as theymay cause the cost of air transportation to rise. However, increased security requirements in the U.S. couldcreate potential opportunities for air cargo to be routes through Canada (air to Canada and surface to U.S.).
Other Cargo Trends
A number of other cargo trends may be relevant for Halifax:
There has been an increasing market share of integrated carriers, which have different airport needsthan heavylift carriers;
The emergence of polar routings as a standard for Asia-North America services may lessenfrequencies on traditional routings; and
As Air Canada Cargo acquires their own freighters and builds up Toronto-oriented internationalservices, the Atlantic Canada market may be fed by surface travel (though increasing costs at YYZ maywork against freighter operations there).
AirportAirport Improvement Fees
As not-for-profit corporations, Canada’s airport authorities do not possess equity capital. Consequently, likeany other commercial organisation, they cannot obtain 100% debt financing for infrastructure projects. Toovercome this challenge, the majority of Canada’s not-for-profit airport authorities have introduced airportimprovement fees (AIF) to generate cash, which can then be levered to finance new airport investments.Airport improvement fees were introduced into the Canadian airport marketplace in 1993, and today, mostairports in Canada have an airport improvement fee.
Commercial Focus
Many nations around the globe, including Canada, have pursued partial or wholesale privatisation of theirairport infrastructure. In Canada, all of Transport Canada’s major airports have been transferred to localairport authorities. In the U.K., Australia, New Zealand, Austria, Germany and many other countries, airportoperations have been privatised. This trend extends to developing nations as well. Countries such asChile, the Dominican Republic, Costa Rica and China and others have turned to the private sector tofinance, build and operate airports.
As a result, airports are increasingly being run as businesses with a bona fide commercial focus. Thismeans that, like Halifax International Airport, they must focus on customer needs, provide high levels ofcustomer service, and earn revenues to support needed infrastructure investments. In addition, they arediscovering that like any other business, they must be strategically positioned, and that these strategiesneed to be implemented through careful planning.
Non-Aeronautical Revenues
Airports have traditionally derived the majority of their revenues from airline charges (e.g. landing andterminal fees). Increasingly, however, airports are focusing on developing and growing their passengerdriven revenue sources by expanding the availability of their in-terminal product and service offerings.
Halifax Gateway Council Strategic Plan Page 78
November 2005
Airport operators are also looking with greater frequency to airport land development as a potential non-traditional non-aeronautical revenue source. Development opportunities exist for many airports in thefollowing areas – air cargo facilities, maintenance-repair-overhaul facilities, and distribution type businesses.
Shift in Airport Fee Structures
Some small airports are dropping their landing fees, and replacing them with a fee per passenger to coveroperating costs (this fee is separate from the AIF which is used for infrastructure investments). Thisapproach tends to stabilise an airport’s revenue base because when one carrier leaves, the remainingcarrier’s traffic will increase and hence that carrier's payments to the airport will increase as well. Similarly,if a single carrier reduces its number of flights, then load factors on remaining flights rise, as do airportrevenues per flight. One drawback to this approach is that it removes the upside revenue growth potentialfor airports.
Increasing Importance of Air Cargo
Air cargo is a $40 billion industry and will play an increasingly important role in modern distribution systems,particularly in support of the growing e-commerce sector. Over the next 20 years, air cargo traffic isexpected to more than triple, outpacing passenger growth. This is expected to provide airports withincremental revenue generating opportunities through increased and more intense land utilisation.
Airline Incentive Programs
Airports and communities are becoming increasingly more aggressive in the pursuit of new air services. Inorder to attract carriers to their facilities, many airports in North America have developed incentive programsto encourage airlines to initiate and maintain service to their facilities. In fact, in order to remain competitivewith other facilities, most airports will need to develop and offer an incentive program. The key strategicquestion for most airport operators is not whether to develop an incentive program, but rather, whatincentive approach should be adopted. Some common incentive program approaches include:
Fee waiver/reduction program;
Revenue guarantee program;
Marketing support/assistance; and
Business-airline partnerships/prepaid travel programs.
Integration into Local and Regional Transportation Systems
As air transport grows, it will continue to put pressures on regional transportation systems. Not only willthere be increasing numbers of passengers accessing the airport, but there will also be larger numbers ormeeters/greeters, employees and air cargo trucks. Airports will need to be integrated into regionaltransportation systems that make primary use of high capacity mass transit (e.g. bus, light rail, heavy rail) tomove people to and from airports.
Increased Use of Technology
Airports are already deploying smart technologies to reduce costs, improve customer service, and expeditethe movement of passengers and goods. These technologies are being uses for airport administration,
Halifax Gateway Council Strategic Plan Page 79
November 2005
security screening, border processes, automated check-in, wireless communications, and radio chiptracking of passenger baggage and cargo shipments.
Air Transport Security
The safety of the air transportation industry has received considerable attention following the events ofSeptember 11, 2001. In Canada, the Canadian Air Transport Security Authority (CATSA) was created inApril 2002 with the mission of protecting the public by securing critical elements of the air transportationsystem as assigned by the government. In the U.S., the Aviation and Transportation Security Act createdthe Transportation Security Administration (TSA) under the Department of Transportation. The U.S.subsequently created the Department of Homeland Security to centralize functions, including border andtransportation security. These agencies are working with airports to develop and implement new securityprocedures for passengers and their luggage, as well non-passengers who access restricted areas.
Border Facilitation
Perimeter Clearance is a concept that has been widely endorsed as a means of delivering new internationalborder management to the external borders of Canada and the U.S. By strengthening security andexpediting trade through pre-registration of individuals and goods, Perimeter Clearance would co-ordinatethe actions of the largest trading partners in the world – Canada and the U.S.
A strategy has been developed by a coalition of airports, ports, shippers and tourism groups for bi-nationalmodernisation of border management practices through the joint application of new informationtechnologies, biometrics and process re-design. Specifically, Perimeter Clearance would involve providingbetter security, particularly by interceding inadmissible people offshore and goods at the first point of arrival;distinguish between low and high risk goods/people in order for both to be processed more quickly,efficiently and securely; sharing data to maximise the intelligence and co-ordination of information;increasing efficiencies through flexible use of customs and immigration officers working in either country toadminister national laws; and streamlining traffic flows at border crossings for all modes.
Growth Outside Airport Boundaries
In the long-term, airports will need to explore solutions to manage growth, including use of lands outside ofcurrent boundaries. This may include offsite check-in (e.g. downtown, in hotels or on cruise ships) andInternet based boarding pass issuance. Other off-site growth strategies may include utilising secondaryairports in metropolitan areas, development of new airports at greenfield sites and acquisition of additionallands.
Implications for the Halifax Gateway The air transport industry continues to be in a growth mode for both passengers (especially leisure) and
cargo. As a result, the market prospects in the medium to longer-term for Halifax are very positive.
Halifax is well connected to the Star Alliance through Air Canada, but has very limited access to theOneworld Alliance.
Low cost carriers will continue to be significant players in the marketplace. Low airport costs and fastturn-around times are critical to the success of these airlines.
The air cargo industry is growing rapidly, and as a result, will continue to provide opportunities forHalifax in the medium to longer-term. This could translate into increased traffic in the belly of passenger

Halifax Gateway Council Strategic Plan Page 80
November 2005
aircraft operating at Halifax International Airport, as well as more activity for integrator carriers suchFedEx and Purolator.
Self-serve check-in kiosks, automated border facilitation programs, and use of biometrics will all benefitHalifax International Airport through improved efficiencies, and in turn, could ‘free up’ facility space.However, new security measures, especially the application of EDS, will have a negative effect onpassenger processing times, which in turn, could lead to lower passenger satisfaction levels.Investments in terminal wireless technology should be anticipated, and could reduce the costs ofcabling.
As expected, changes in aircraft design will impact airports, both in terms of operational considerationsand in terms of passenger and cargo convenience. Among the new aircraft technology developmentsnoted above, the development of long-range aircraft could have the greatest implications on HalifaxInternational Airport for market development because of their ability to bypass traditional gateways andprovide point-to-point services.
3.4 Shipping Trends
Shipping LinesThere are several trends impacting container shipping in 2005. They include increases in vessel size, tradeshifts in China and India, the revival of all water services to the U.S. east coast, further consolidation withinthe shipping industry, and the potential for increased short sea shipping services.
Market Shift
Figure 3-18 – Historical Containerized and Bulk Cargo Traffic
0
100
200
300
400
500
600
700
800
900
1980 1985 1990 1995 2000 2005 2010
[Mill
ions
of T
onne
s]
Bulk Cargo Containerized Cargo
Larger Vessel Size
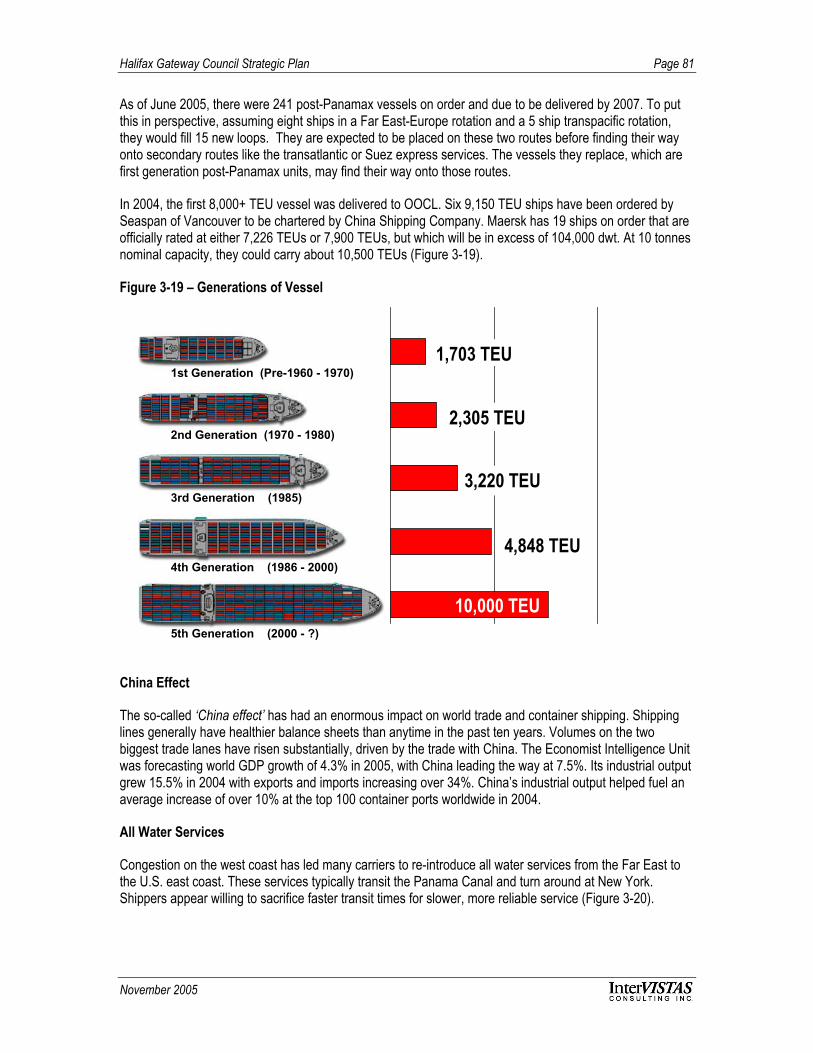
Halifax Gateway Council Strategic Plan Page 81
November 2005
As of June 2005, there were 241 post-Panamax vessels on order and due to be delivered by 2007. To putthis in perspective, assuming eight ships in a Far East-Europe rotation and a 5 ship transpacific rotation,they would fill 15 new loops. They are expected to be placed on these two routes before finding their wayonto secondary routes like the transatlantic or Suez express services. The vessels they replace, which arefirst generation post-Panamax units, may find their way onto those routes.
In 2004, the first 8,000+ TEU vessel was delivered to OOCL. Six 9,150 TEU ships have been ordered bySeaspan of Vancouver to be chartered by China Shipping Company. Maersk has 19 ships on order that areofficially rated at either 7,226 TEUs or 7,900 TEUs, but which will be in excess of 104,000 dwt. At 10 tonnesnominal capacity, they could carry about 10,500 TEUs (Figure 3-19).
Figure 3-19 – Generations of Vessel
5th Generation (2000 - ?)
4th Generation (1986 - 2000)
3rd Generation (1985)
2nd Generation (1970 - 1980)
1st Generation (Pre-1960 - 1970)
2,305 TEU
1,703 TEU
3,220 TEU
4,848 TEU
10,000 TEU
China Effect
The so-called ‘China effect’ has had an enormous impact on world trade and container shipping. Shippinglines generally have healthier balance sheets than anytime in the past ten years. Volumes on the twobiggest trade lanes have risen substantially, driven by the trade with China. The Economist Intelligence Unitwas forecasting world GDP growth of 4.3% in 2005, with China leading the way at 7.5%. Its industrial outputgrew 15.5% in 2004 with exports and imports increasing over 34%. China’s industrial output helped fuel anaverage increase of over 10% at the top 100 container ports worldwide in 2004.
All Water Services
Congestion on the west coast has led many carriers to re-introduce all water services from the Far East tothe U.S. east coast. These services typically transit the Panama Canal and turn around at New York.Shippers appear willing to sacrifice faster transit times for slower, more reliable service (Figure 3-20).

Halifax Gateway Council Strategic Plan Page 82
November 2005
Figure 3-20 – All Water Service Routes
Halifax
Mergers and Acquisitions
Maersk Sealand’s purchase of P&O Nedlloyd may signal another round of merger activity. At the very least,it will shake up the existing alliance structure, as P&O Nedlloyd is a member of the Grand Alliance, whichcalls at Halifax. Maersk is reported to be as much interested in P&ONL’s vessel orderbook as it is its traderoutes and cargo volumes. Another company, CP Ships, that was seen as an acquisitor in 2004, wasacquired by TUI AG, the owners of Hapag Lloyd in 2005. There are other large and strong shipping lineswhich may see the need to get larger to thwart Maersk’s dominant market share, which will go from 13% to22% worldwide.
Short Sea Shipping
In Europe, the EU has had programs in place for over a decade to encourage short sea shipping, and anintermodal shift away from trucks to more environmentally friendly shipping. The U.S. MaritimeAdministration (MARAD) and Transport Canada have followed suit, but thus far have no programs in placeto facilitate modal shifts. There are some interesting trends in this sector too. Some operators are opting forpurpose-built lift-on/lift-off vessels, whereas others are building large roll-on/roll-off vessels with full widthramps to permit speedy loading and unloading. A few major shippers, such as StoraEnso, are building theirown in-house short sea services with specialty containers only suitable to themselves.
Halifax has the largest short sea sector in Canada, with services to Newfoundland, St. Pierre et Miquelon,and New England.
Roll-On/Roll-Off
There are very few roll-on/roll-off operators still mixing containers and roll-on/roll-off cargo. The notableexception is ACL, a long time Port of Halifax customer. Other operators such as Whilhelmsen have built newroll-on/roll-off vessels which carry only cars, trucks, and machinery such as heavy equipment and farmtractors, having decided that there is a huge amount of container capacity capable of carrying thosecargoes. Pure car carriers, or PCTCs, are now able to carry over 7,000 autos.

Halifax Gateway Council Strategic Plan Page 83
November 2005
Offshore Oil and Gas
The offshore supply boat business locally is somewhat dependent upon local drilling activity. However, mostoperators have been forced to seek markets in the North Sea, Brazil, West Africa, and the Middle East, inorder to keep their fleets deployed.
Port The port industry is also in transition, as the following examples illustrate.
Port Congestion on West Coast
The rapid rise in trade flows between North America and the Asia Pacific region is putting significantpressure on North America’s west coast ports. Shippers have stated serious concerns about the condition,capability, and future reliability of ports, road, and rail services and infrastructure. To overcome this concern,shippers are now turning to all options for shipping goods from Asia to North America, including shippingproduct via the Suez Canal and across the Atlantic Ocean to East Coast Gateways, creating growthopportunities at Gateways such as Halifax.
While shipping products via the Suez Canal requires longer times at sea, some shippers believe the routingto be more reliable and in some cases faster than shipping via west coast gateways due to the congestionand lengthy backlogs found at the latter. As it will be at least a year before any new west coast capacity isadded, there is a window of opportunity for Halifax to capture a share of the growing Asia Pacific trade, anddemonstrate to shippers that the Suez Canal routing is a viable long-term option.
Investments in New Facilities
On both the west and east coast of the U.S., ports are responding to record cargo levels and increases inworld trade by investing in new facilities and refurbishing older ones. In New York, the Port Authority iscompleting upgrades to three terminals, APMT, Maher Terminal and Port Newark Container Terminal, whichwill effectively double that port’s capacity. The APM Terminal will add 34 hectares, and encompass a total of108 hectares when completed. At 180 hectares, Maher Terminal will become the largest container terminalin North America when completed. Port Newark, operated by P&O Ports, will be a 71 hectare terminal, withseven post-Panamax cranes. Another project involves dredging and deepening New York’s harbour andberths. The first phase was completed to 13.7 metres in 2004. Further deepening to 15.2 metres will becompleted between 2009-2013.
The Virginia Port Authority's operating company, which handled 1.8 million TEUs last year, is expandingNorfolk International Terminal South, adding 500,000 TEUs of additional capacity over the next six years.Maersk Sealand is building a large 162 hectare private container terminal with 1,220 metres of berth, atnearby Portsmouth, Virginia. When that facility opens in about five years, VIT will have an additional300,000 TEUs of capacity at the terminal vacated by Maersk Sealand. This fall Norfolk will be the first U.S.east coast port capable of handling fully loaded 8,000 TEU ships when it completes a project to dredge theharbor to a depth of 50 feet. The VPA is also studying the feasibility of the phased development of a fourthVPA-owned terminal at Craney Island, which would cost $1.6 billion, eventually handle more than 2 millionTEUs, and be built over the next 25 years.
In Canada, Montreal has a $150 million investment program which will be spent between 2004-2009upgrading terminals and infrastructure.
Halifax Gateway Council Strategic Plan Page 84
November 2005
On the west coast, a new terminal has been announced for Prince Rupert and plans are well advanced foran expansion of DeltaPort at Roberts Bank and Vanterm in Burrard Inlet to handle an expected 5 millionTEUs by 2020. In March 2004, P&O Ports Canada Inc. signed a new 51-year lease with the Vancouver PortAuthority to operate Centerm and announced it will invest $148 million expanding the terminal. The work,which is scheduled to be completed by the spring of 2006, will more than double Centerm's container-handling capacity to almost 800,000 TEUs. The project includes adding two Post Panamax containercranes, 16 RTGs - rubber tired gantries used to move and stack containers – and more than doubling on-dock rail to 8,000 feet. The work will be done on the existing 73-acre terminal footprint located east ofdowntown on the south shore of Burrard Inlet.
Global Terminal Operators
The past decade has seen the emergence of a number of global terminal operators, with significant financialresources and worldwide marketing capability, which has significantly changed the landscape for small,independent terminal operating companies. The so-called ‘big four’ are Hutchison Port Holdings, P&O Ports,PSA Corporation and APM Terminals. In 2003, they handled 34.1% of the world’s container port throughput,or 107.6 million TEUs. Global terminal operators, of which there are at least 25, together handle about 60%of the world’s containers, or 188.2m TEUs. The largest operator, Hutchison Port Holdings, with 34 terminalsand four under development, had revenues of HK$26.9 billion in 2004, with EBIT of HK$8.8 billion and profitof HK$4 billion, a 26% increase over the previous year. PSA Corporation is owned by the Singaporeangovernment through Temasek Holdings. It operates 15 facilities with six under development and handled33.1m TEUs in 2004, including 20.6 million in Singapore. APMT, the third largest operator with 22 terminalsworldwide, is a unit of AP Moller, which owns the world’s largest container shipping company, MaerskSealand. P&O Ports is the fourth largest operator, with the broadest worldwide coverage. It had revenues of£1 billion and net profit of £153.8m in 2004. It is closely affiliated with the Grand Alliance, which includesHapag Lloyd, NYK Line, P&O Nedlloyd, OOCL and Malaysian International Shipping Company (MISC).
Transhipment Hubs
In the past decade, there has been phenomenal growth in the development of transhipment hubs in the FarEast, Middle East, Mediterranean, and Caribbean. Thus far, no such hub has emerged on the east coast ofNorth America, although aspects of such are present at both Halifax and New York. Figure 3-21 illustratesthe importance of transhipment at major worldwide ports.

Halifax Gateway Council Strategic Plan Page 85
November 2005
Figure 3-21 – Leading Transhipment Ports by Volume
Rank Port Country Estimated Transhipment(TEU)
Estimated TranshipmentIncidence
1 Singapore Singapore 12,768,302 82.0%
2 Hong Kong China 5,286,600 29.7%
3 Kaohsiung Taiwan 4,120,620 54.6%
4 Busan S.Korea 2,899,426 36.7%
5 Gioia Tauro Italy 1,990,666 80.0%
6 Tanjung Pelepas Malaysia 1,968,000 96.0%
7 Rotterdam Netherlands 1,830,000 30.0%
8 Algeciras Spain 1,790,273 83.2%
9 Dubai United Arab Emirates 1,729,899 49.4%
10 Hamburg Germany 1,410,000 30.0%
11 Port Klang Malaysia 1,406,160 37.8%
12 Marsaxlokk Malta 1,215,500 93.5%
13 Colombo Sri Lanka 1,194,811 69.2%
14 Salalah Oman 1,144,994 96.4%
15 Khor Fakkan United Arab Emirates 860,000 80.0%
16 Bremerhaven Germany 848,314 29.1%
17 Antwerp Belgium 843,635 20.0%
18 Kingston Jamaica 835,890 85.0%
19 Felixstowe United Kingdom 817,335 30.0%
20 Miami U.S. 668,970 70.0%
21 Manzanillo Panama 664,044 70.0%
22 Damietta Egypt 596,369 85.6%
23 Piraeus Greece 562,500 45.0%
24 Freeport Bahamas 554,400 99.0%
Source: Drewry Shipping Consultants Ltd.
Attraction of Distribution and Transload Facilities
Led by Savannah and Norfolk, many ports in North America are pursuing the establishment of distributionwarehouses in close proximity to port facilities in order to attract the cargo of those retailers and distributors.This trend is epitomized by Home Depot’s 2 million square foot facility less than 10 miles from Savannah’smajor container terminal. If a carrier seeks to carry Home Depot’s business, it makes logistical and financialsense to incorporate a Savannah port call. Other U.S. ports such as New York and Houston, are trying toemulate this strategy. In 2004, Houston attracted a massive distribution facility built by Wal-Mart.

Halifax Gateway Council Strategic Plan Page 86
November 2005
Intermodal and On-Dock Rail
U.S. ports were late in discovering on-dock rail, but they are investing in intermodal infrastructure. The new237 acre Evergreen terminal in Tacoma will boast an on-dock rail facility of 31 acres capable of loading 108rail cars. With a 17% increase per year since its inauguration ten years ago, New York is also investinganother $141million in its ExpressRail facility to move cargo inland, on top of a previous commitment for$310 million. The facility will have the capacity to move 1 million containers inland when completed between2007-2009.
Inland Terminals
Several ports in the U.S. and overseas such as Auckland, as well as Vancouver, have developed inlandterminals to alleviate port and truck congestion. The terminals speed up local deliveries and provide betterasset utilization, both in terms of trucks and terminals. They also help to postpone the need to invest inexpensive terminal infrastructure and attract distribution and transload activity nearby.
Green Ships
Inspection and certification is applicable for crude oil tankers, product tankers and bulk carriers with aminimum deadweight of 20,000 tons. Currently about 170 vessels have a Green Award Certificate.Worldwide about 1,500 tankers and 1,500 bulk carriers, in the categories for which in principle the GreenAward is available, are operational.
The next step on this would be the extension of the Green Award to container carriers.
Another trend that may become noteworthy is that of Alternative Maritime Power (AMP) or cold ironingvessels when they are in port for loading and unloading cargo. The Port of Los Angeles is leading the waywith this trend, as air quality is such an important issue there.
Implications for the Halifax Gateway Congestion on the west coast presents an immediate opportunity for east coast ports. The potential for
Suez Express-type services sailing westbound from Hong Kong, southern China, South East Asia, andthe Indian sub-continent provides a better transit time via Halifax than other east coast gateways.
Halifax is one of the few ports in North America that has unused capacity. Halterm is operating at 25%capacity while Ceres is at 75%. Should the port attract a new carrier and new cargoes, they can easilybe accommodated. The port has an ongoing plan to invest over $100 million to deepen berths to 55’,which will make them the deepest in North America.
On the other hand, investments by other competing ports such as New York and Norfolk will make themeven more formidable. The bigger they get, the better their economies of scale and the better they areable to afford continuous investments in terminals and equipment. There is a risk that Halifax will loseits critical mass.
Halifax presently has one terminal operated by a small-medium sized global terminal operator andanother by a local, independent operator, which is listed on the Toronto Stock Exchange. The lattercompany seems particularly vulnerable to a takeover and in order to compete globally, this may be adesirable option. Global terminal operators are able to marshal significant capital resources andmarketing muscle, which could be of benefit to Halifax.
Halifax Gateway Council Strategic Plan Page 87
November 2005
Halifax already handles more transhipment cargo than other Canadian and most U.S. ports and hasconsiderable upside potential. Because transhipment to U.S. ports is not restricted to Jones Actvessels, the costs to operate between Canadian and U.S. ports is considerably less expensive thanbetween two U.S. ports. There is potential to tranship cargo to points south of Boston, as well asBermuda.
In 2004, the Port of Halifax and its partners undertook a study of potential distribution and transloadactivity that could take place from Halifax. Since this study commenced, a deal was signed between theCanadian Retail Shipper’s Association (CRSA) and Armour Transportation Group to move 4,000 TEUsthrough Halifax and be distributed from a facility in Burnside Industrial Park. There are several moremajor retailers interested in moving additional volumes through Halifax if there was more shippingcapacity.
The development of ExpressRail in New York signals that it is serious about handling hinterlandcargoes, which could threaten Halifax’s markets in Ontario and the mid-west.
Halifax is not congested enough at this point in time to justify building an inland terminal. When capacityat the two container terminals is being approached, the construction of an inland terminal potentiallyfrees up space on the terminals and allows the development of new terminal capacity at a lower cost.
Green Ships and AMP could be a way for Halifax to differentiate itself from other east coast ports.Besides being SmartPort, it could become the GreenPort.
3.5 Cruise Trends
Market Growth
Over the past two decades, the cruise industry has emerged as one of the fastest growing and popularsegments of the worldwide travel and leisure industry. In 1980, approximately 1.4 million individualsembarked on a conventional cruise operated by a North American cruise line, a level that climbed to over9.3 million by 2004. Nearly 3.9 million international passengers were carried on European and Asianmarketed vessels in 2004, elevating the worldwide cruise industry passenger total to nearly 13.2 million(Figure 3-22).

Halifax Gateway Council Strategic Plan Page 88
November 2005
Figure 3-22 – Cruise Passenger Growth Worldwide 1990-2004
0
2,000
4,000
6,000
8,000
10,000
12,000
14,000
'90 '91 '92 '93 '94 '95 '96 '97 '98 '99 '00 '01 '02 '03 '04North America Europe Asia
g
Since 1990, total passenger levels have tripled.Since 1990, total passenger levels have tripled.
Source – Cruise Line International Association, GP Wild, and Bermello, Ajamil & Partners Inc.
The industry’s success over this period is primarily a result of the following:
Cruise lines created products that work to convert land-based resort guests into cruise passengers.Cruise lines were able to package and mass market an all-inclusive resort package-at-sea that is highlyprice competitive when compared to similar land-based resort vacations. These all-inclusive packageswere marketed through a variety of distribution channels inclusive of travel agents, internet-basedretailers, charter operations and cruise line-based phone and internet networks.
Cruise lines were highly successful in introducing new vessel inventory and developing onboardproducts that generated sustained interest in cruising. Lines continually worked to improve the qualityand quantity of on-board experiences with more diverse food and beverage venues, entertainment anddeck activities, meeting and conference facilities, and recreation areas. Discarding smaller ships andolder capacity, larger and more lavish vessels furnished with veranda-style outside cabins, grandcentral atriums, health spas, and other amenities found in the best land-based resorts became the normin the mid-1990s. Consumers generally met each new vessel launch with enthusiasm, and ultimately,increased passenger bookings. In fact, due to the strong correlation observed between vessel supplyexpansion and increased passenger carryings over the past twenty years, many industry expertsconcluded the industry exhibits tendencies of being supply led. Review of future vessel deliveriesremains the primary tool used to project future industry passenger growth.
Industry Consolidation
Today, three major cruise operators dominate the cruise industry worldwide. The ‘big three’ were formedthrough merger and consolidation to provide each with better economies of scale, progressive marketingoptions, and increased channels of distribution. In spring 2003, the Carnival Corporation and PrincessCruises merger was officially accepted by shareholders of P&O Princess, plc, thus forming the nucleus of acruise company with more than 41% of total berth capacity worldwide. This merger continues to reshapethe industry, creating one large super cruise consortium with widespread influence on cruise marketing,operations and deployments. RCCL (22%) and Star Cruises (9%) are the other major industry participants.
Pass
enge
rs
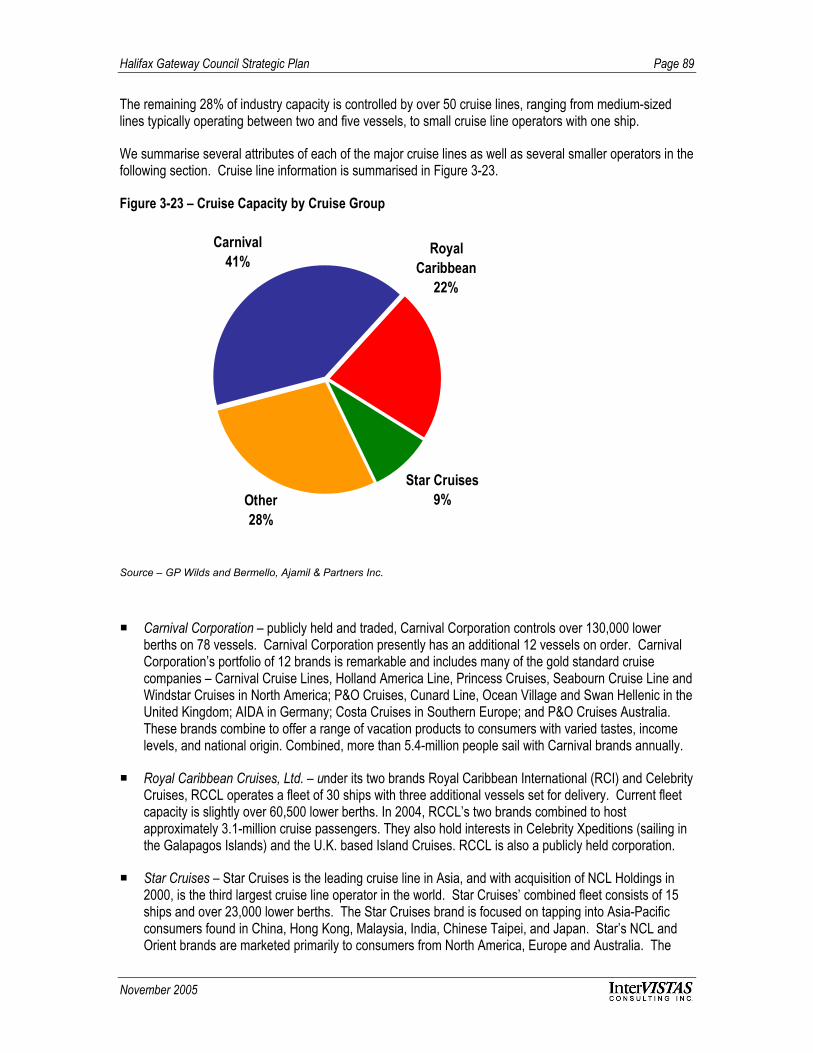
Halifax Gateway Council Strategic Plan Page 89
November 2005
The remaining 28% of industry capacity is controlled by over 50 cruise lines, ranging from medium-sizedlines typically operating between two and five vessels, to small cruise line operators with one ship.
We summarise several attributes of each of the major cruise lines as well as several smaller operators in thefollowing section. Cruise line information is summarised in Figure 3-23.
Figure 3-23 – Cruise Capacity by Cruise Group
Star Cruises9%Other
28%
Royal Caribbean
22%
Carnival41%
Source – GP Wilds and Bermello, Ajamil & Partners Inc.
Carnival Corporation – publicly held and traded, Carnival Corporation controls over 130,000 lowerberths on 78 vessels. Carnival Corporation presently has an additional 12 vessels on order. CarnivalCorporation’s portfolio of 12 brands is remarkable and includes many of the gold standard cruisecompanies – Carnival Cruise Lines, Holland America Line, Princess Cruises, Seabourn Cruise Line andWindstar Cruises in North America; P&O Cruises, Cunard Line, Ocean Village and Swan Hellenic in theUnited Kingdom; AIDA in Germany; Costa Cruises in Southern Europe; and P&O Cruises Australia.These brands combine to offer a range of vacation products to consumers with varied tastes, incomelevels, and national origin. Combined, more than 5.4-million people sail with Carnival brands annually.
Royal Caribbean Cruises, Ltd. – under its two brands Royal Caribbean International (RCI) and CelebrityCruises, RCCL operates a fleet of 30 ships with three additional vessels set for delivery. Current fleetcapacity is slightly over 60,500 lower berths. In 2004, RCCL’s two brands combined to hostapproximately 3.1-million cruise passengers. They also hold interests in Celebrity Xpeditions (sailing inthe Galapagos Islands) and the U.K. based Island Cruises. RCCL is also a publicly held corporation.
Star Cruises – Star Cruises is the leading cruise line in Asia, and with acquisition of NCL Holdings in2000, is the third largest cruise line operator in the world. Star Cruises’ combined fleet consists of 15ships and over 23,000 lower berths. The Star Cruises brand is focused on tapping into Asia-Pacificconsumers found in China, Hong Kong, Malaysia, India, Chinese Taipei, and Japan. Star’s NCL andOrient brands are marketed primarily to consumers from North America, Europe and Australia. The
Halifax Gateway Council Strategic Plan Page 90
November 2005
NCL brand currently has four vessels on order for delivery within the next two years. It is upgrading itsfleet to larger new ships with most of the smaller ships going to the Star Cruises brand. Star Cruises isa publicly held company listed on the Hong Kong Stock Exchange.
While lines in the ‘other’ category are far smaller in terms of fleet size than the ‘big three’ theremaining 28% of industry includes a number of important and unique brands that provideincreased diversity within the industry overall. Representative lines include:
– Disney Cruise Lines – is the leading family entertainment cruise provider with 3-, 4-, and 7-nightitineraries to the Bahamas and Caribbean offered on two cruise ships (Disney Wonder andDisney Magic). While linking cruise offerings to upland facilities is not unique in the industry,Disney’s combination of family brand and upland theme parks creates inherent interest in theircruise product. In 2005, Disney Cruise Lines will take their formula to Los Angeles with 7-nightMexican Riviera cruises during the peak summer season. No new cruise ship orders havebeen placed by Disney; many industry experts anticipate this could change in late 2005.
– Crystal Cruises – offers ultra-luxury cruises to destinations worldwide and is a sizeable cruiseline contributor to the Asia-Pacific marketplace. Crystal Cruises is wholly-owned by NipponYusen Kaisha (NYK). Crystal Cruises has a fleet of three ships, with the newest recentlydelivered in the fall 2003.
– MSC Cruises – offers mid-class cruises to destinations throughout Europe and the Caribbean.MSC North America is currently under start-up operations and is intended to cater to a moreupscale niche market with its newbuild ships. There are currently two on order. This is aprivately held Italian company backed by MSC Cargo – Aponte family ownership. While theyhave strong financial backing some industry analysts are hesitant as to what their level ofsuccess will be in the North American market due to brand placement, and other competitivefactors.
– Radisson Seven Seas Cruises and Silversea Cruise Line – are luxury-class cruise lines offeringitineraries throughout the world to a mainly North American clientele. Both lines are privatelyheld companies by the Carlson and Vlasov Groups respectively. At present, neither line iscurrently planning to expand its fleet through purchase of new vessel capacity.
Similar in composition to the hospitality industry, each major cruise group is comprised of several cruiseline brands with ships positioned to appeal to different geographic markets and consumer tastes. Themajority of cruise brands generally fall into one of the following four segments:
Luxury – the luxury segment offers cruises of greater than seven days on high quality, small andmedium-sized ships. Luxury vessels tend to sail worldwide and offer superior food and service.
Premium – the premium segment is geared toward more experienced cruisers, often older and moreaffluent with time to vacation. Service and food quality are emphasized under the premium segment.
Contemporary – ships found in the contemporary segment appeal to passengers of all ages andincome categories with a focus on middle income levels. While this segment has a healthy rate of past-passenger participation (estimated between 30 to 50% of the industry), this segment is highlydependent on the continued introduction of new cruise passengers to the marketplace.
Budget – the budget segment tends to be a less expensive version of the contemporary market, withships generally older, smaller and offering fewer amenities. There are many of these operations

Halifax Gateway Council Strategic Plan Page 91
November 2005
existing in Europe. However, it is unclear with the implementation of the SOLAS regulations by 2010,whether this segment will be one that will be able to continue its growth.
Several other secondary market segments exist, including exploration and soft adventure cruises, nichecruisers, river cruises, and coastal operations. In addition, several tour operators have chartered vessels fortheir niche market segments.
Cruise Vessel Evolution
The evolution of the cruise ship has been one of the principal mechanisms propelling industry growth. It hasalso required that cruise destinations—both the maritime port facilities handling homeport and port-of-calloperations as well as the destinations themselves—evolve to meet the challenges presented by these shipsif they wish to participate in the large-scale segment of the cruise industry.
Cruise ships have advanced through a number of developmental phases, from the small, 500-passengervessels of the 1970s to the rise of the Post-Panamax, 3,600-passenger ships of the late 1990s (Figure3-24). Beyond 2005 the evolution continues with a focus on the largest ships afloat in the Ultra-VoyagerFreedom class and Carnival’s entry into the arena with their larger Princess vessels.
Figure 3-24 – Evolution of the Modern Cruise ShipPeriod Length Draft Passengers Characteristics of the Period
1960 155 m 11 m 500 Vessels acquired & refurbished.
1970 215 m 10 m 650 Standard business model used with profitable resultsuntil the fuel crisis.
1980 245 m 9 m 1,500 Change in business model; experimentation withlarger ships and operating itineraries.
1990 275 m 8 m 2,600 Larger ships becoming the destination. Shallowerdrafts.
1996 295 m 8 m 3,600Mega-ships that are floating cities. Focus on
maximizing passenger capacity. One-region vesselsnot capable of Panama Canal Transit.
2000 310 m 9 m 2,500Reached possible peak of passenger capacity;concentrating on creating efficiencies with shipdesign, outside cabin development, and flexible
deployment.
2005+ 320 m – 340 m 9 - 10 m 3,600+Ultra-Voyager, 160,000-GT. Allows for increasedonboard revenue areas, largest ship in the world
status (ego boost).
Source – Bermello, Ajamil, and Partners Inc.
Analysis of the current international cruise fleet indicates that the average cruise ship is approximately 200meters long, carries 1,090 passengers at 100% occupancy and is 17 years old. With the average length ofcruise vessels delivered each year continuing to increase, combined with the retirement of older, smallervessels, it is very likely that within the next decade cruise ships with lengths of 300 meters will become theoperational norm. The prospect of orders for even larger cruise ships – possibly for vessels approaching5,000 passengers – remain as the major operators continue to look to further exploit economies of scaleand reduce unit costs as well as to generate excitement around the development of the world’s largestvessel(s). Certainly the operational areas that are suitable for such large vessels will be relatively limited incomparison to smaller cruise ships in the mid-term.
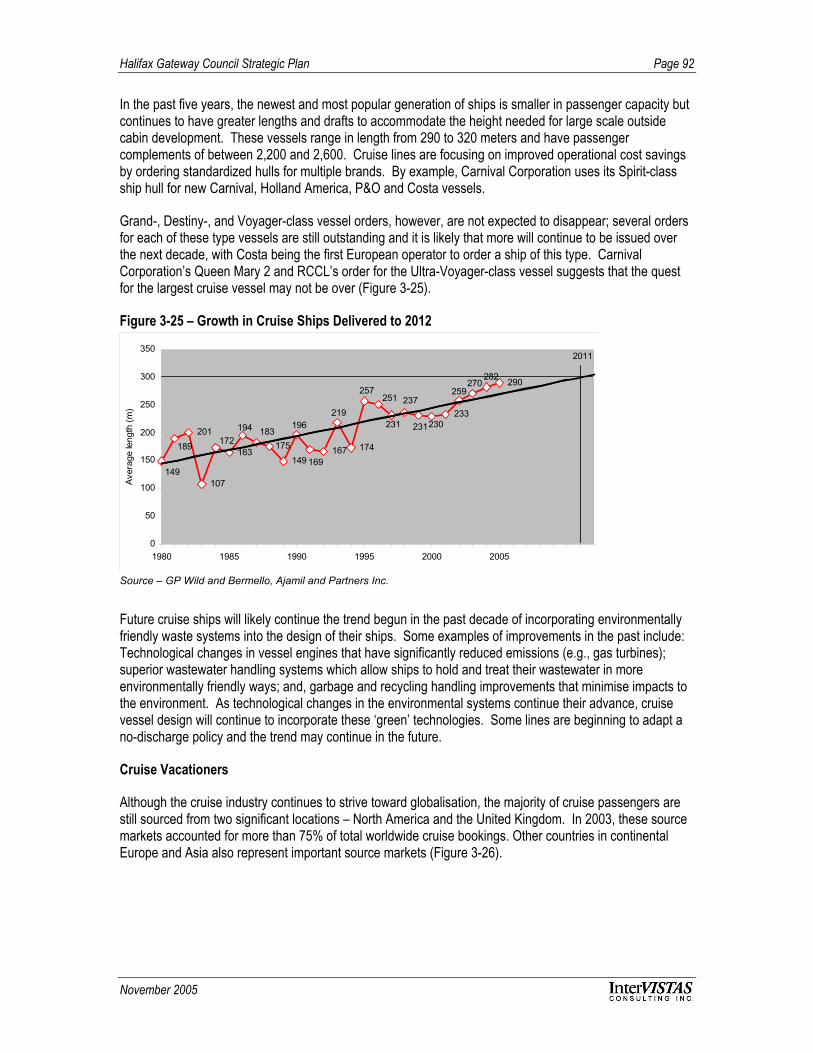
Halifax Gateway Council Strategic Plan Page 92
November 2005
In the past five years, the newest and most popular generation of ships is smaller in passenger capacity butcontinues to have greater lengths and drafts to accommodate the height needed for large scale outsidecabin development. These vessels range in length from 290 to 320 meters and have passengercomplements of between 2,200 and 2,600. Cruise lines are focusing on improved operational cost savingsby ordering standardized hulls for multiple brands. By example, Carnival Corporation uses its Spirit-classship hull for new Carnival, Holland America, P&O and Costa vessels.
Grand-, Destiny-, and Voyager-class vessel orders, however, are not expected to disappear; several ordersfor each of these type vessels are still outstanding and it is likely that more will continue to be issued overthe next decade, with Costa being the first European operator to order a ship of this type. CarnivalCorporation’s Queen Mary 2 and RCCL’s order for the Ultra-Voyager-class vessel suggests that the questfor the largest cruise vessel may not be over (Figure 3-25).
Figure 3-25 – Growth in Cruise Ships Delivered to 2012
201
163149
167 174
233
290
149
175
282270
259
230231
237251
231
257
219
169
196183194
172189
107
0
50
100
150
200
250
300
350
1980 1985 1990 1995 2000 2005
Aver
age
leng
th (m
)
2011
Source – GP Wild and Bermello, Ajamil and Partners Inc.
Future cruise ships will likely continue the trend begun in the past decade of incorporating environmentallyfriendly waste systems into the design of their ships. Some examples of improvements in the past include:Technological changes in vessel engines that have significantly reduced emissions (e.g., gas turbines);superior wastewater handling systems which allow ships to hold and treat their wastewater in moreenvironmentally friendly ways; and, garbage and recycling handling improvements that minimise impacts tothe environment. As technological changes in the environmental systems continue their advance, cruisevessel design will continue to incorporate these ‘green’ technologies. Some lines are beginning to adapt ano-discharge policy and the trend may continue in the future.
Cruise Vacationers
Although the cruise industry continues to strive toward globalisation, the majority of cruise passengers arestill sourced from two significant locations – North America and the United Kingdom. In 2003, these sourcemarkets accounted for more than 75% of total worldwide cruise bookings. Other countries in continentalEurope and Asia also represent important source markets (Figure 3-26).

Halifax Gateway Council Strategic Plan Page 93
November 2005
Figure 3-26 – Worldwide Cruise Passenger Source Markets (1999 to 2003)
Sources: CLIA, Seatrade Communications, and B&A, 2004
01,000,0002,000,0003,000,0004,000,0005,000,0006,000,0007,000,0008,000,0009,000,000
North
Amer
ica
United
King
dom
Cont. E
urop
eAsia
Japan
Austra
lia/N
ew Z
ealan
d
Latin A
merica
Other S
ource
s
19992000
20012002
2003
Pass
enge
rs
Source – Cruise Line International Association and Bermello, Ajamil and Partners Inc.
The U.K. market produced over a million passengers in 2003 for the first time, and increased an additional8% in 2004 to 1.14-million passengers. Record cruise bookings were achieved worldwide despite the IraqWar and other security concerns, proving the resiliency and ability of the cruise industry to perform withinthe overall vacation market. Germany’s provisional 2004 cruise figures show a 4% increase in cruise salesover 2003 (537,000) with 551,000 passengers, and on track to achieve more than 1-million passengers by2012. This growth is the result of the emergence of a new German brand targeting younger consumers(AIDA Cruises), pan-European cruising and the deployment of International brands specifically for theGerman domestic market.13
The Passenger Services Association (PSA), the U.K. based cruise marketing group and Cruise LinesInternational Association (CLIA), North America’s cruise marketing body released studies that provide someindication as to the consumer trends of the industry and more importantly the potential cruiser profile that iscritical to the long-term success of the industry within the vacation market. Much of the detail providedbelow is gleaned from these survey reports and other market sources as indicated.
North American Consumers
Consumer trends continue to be supportive of further industry growth worldwide. Several of these arehighlighted below:
Almost 45-million people have cruised at least once; and of these, nearly 23-million (51%) have cruisedwithin the past three years.
13 Annual Cruise Review 2003 (U.K. and Europe) PSA.

Halifax Gateway Council Strategic Plan Page 94
November 2005
In the 2004 Market Profile Summary from CLIA, the projected total number of cruisers over the nextthree years is 29-million; and a high potential of 48-million.
Cruise passengers spent approximately US$1,651 per person on a typical cruise vacation inclusive ofcruise fare and onboard expenses. Cruisers spend nearly 50% more than non-cruising visitors.
The average cruiser has taken 3.3 cruises. Destination driven cruise passengers sail more with 8.1cruises, followed by luxury (6.3), premium (5.0) and contemporary (3.5).
The average age of actual and potential cruise consumers continues to increase (age 48.3 in 1992 vs.50 in 2004). Household incomes for cruise passengers are high, averaging US$99,000 in 2004 forNorth Americans, increasing from US$58,400 in 1992 and US$79,000 in 2000. As products continue todiversify, however, cruising (as evidenced by cruise prospects) continues to be considered byindividuals with lower household incomes.
Cruisers plan their vacations further in advance (4.3 months on average) than non-cruisers (3.4months).
50% of travellers used cruise line sites to conduct research, but only 5% actually book online. Hotel andairline sites are the most popular source for research and booking.
Cruising is seen by a large majority of passengers as a good way to sample a geographicalarea/destination for future vacations. After sampling the geographical areas/destinations on their recentcruise, more than 75% say they will return for another type of vacation.
Figure 3-27 – Demographic Profile of North American Cruise Passengers
Metric Category RepresentativeSample
CruiseVacationers
Non-CruiseVacationers
Average Age Mean 48 50 46
Average Income (000s) (000s) US$90 US$99 $86
Male 49% 50% 50%Gender
Female 51% 50% 50%
Married 82% 83% 81%
Divorced/Separated 9% 8% 10%Marital Status
Single 9% 9% 9%
Full-time 63% 58% 67%Employment Status
Retired 13% 19% 9%
College Graduate orHigher 58% 66% 41%
EducationPost Graduate 18% 24% 12%
Source – Bermello, Ajamil, and Partners Inc.

Halifax Gateway Council Strategic Plan Page 95
November 2005
European and Asian Consumers
European interest in cruising continues to increase. Passenger growth continues, with the U.K. marketproviding the largest share of this total. U.K. cruise tourists exceeded one million again in 2004. Spain isthe fastest growing cruise market in Europe at present and Germany is expected to grow more rapidly asthe capacity targeted at this market expands. Europeans also continue to approach similar population,income levels, and vacation patterns as their North American counterparts. Critical to success in theEuropean marketplace are tailored products that meet divergent market tastes of the consumer. Expansionof the EU to 25 member states in May 2004 means that the European market has been enlarged by over 75million people.
The other market that is drawing great attention over the past year is China. For all cruise lines, the long-term prospect of tapping into the anticipated growth of tourism by Chinese consumers has created long-terminterest in the Asia-Pacific region. Domestic tourism in China expanded steadily over the past five years,growing from 524,000 to 784,000 between 1994 and 2001. Reports by the World Tourism Organisation(WTO) suggest that China could yield up to 100 million outbound tourists by 2020, a level that would movethe country into fourth position in terms of the world’s top outbound countries.14 Beyond China,demographic and economic indicators in India, Malaysia, Japan, and other Asia-Pacific nations areexpected to bring greater prospects for domestic and outbound tourism.
Other Cruise Trends
Homeland market – homeports along the Atlantic Coast, from Boston to Jacksonville have opened keydrive markets that are playing off potential consumers’ fear of flying due to terrorism, airline service, andcost. New regional airlines, such as JetBlue, Southwest and others may modify this approach overtime.
8-day cruise product – the ability of new ships to reach the Caribbean and Bahamas due to enginetechnology has changed deployments. The determining factor as to the extent to which the industry willcontinue to expand these deployments will be driven by weather, cost and guest satisfaction.
Seasonality of U.S. east coast region – not until 2003 were northern U.S. coastal ports considered foryear-round cruising. This new cruise itinerary philosophy essentially uncaps the potential opportunitiesfor future cruise deployments allowing for consumer tastes and preference.
Airlift – while airline has been removed as a primary factor for cruising in the region, many regionalcruise deployments, such as Bermuda, Canada/New England, transatlantic, and world, rely uponadequate and cost effective airlift to/from all U.S. east coast ports.
14 Chinese Outbound Tourism, WTO, 2003, and the 2003 Edition Tourism Market Trends: World Overview andTourism Topics, WTO, 2004. The fundamentals behind anticipated growth in Chinese outbound tourists include:Anticipated increases in disposable income of Chinese residents (much of this tied to anticipated annual growthof per capita GDP of between 5 to 8%); expansion of the ‘holiday economy’ beyond the three golden weeksresulting from China’s introduction of the practice of holidays with pay for working people over the next fiveyears; and, continued liberalization of outbound travel through expansion of the number of countries withApproved Destination Status (ADS).
Halifax Gateway Council Strategic Plan Page 96
November 2005
Vessel size/capacity – larger cruise vessels are replacing older smaller ships in all U.S. markets. As aresult, possessing adequate infrastructure and having the ability to service these larger vessels arecritical factors which will influence the long-term success of any region.
Implications for the Halifax Gateway Carnival and Royal Caribbean currently account for 63% of global cruise capacity. Future acquisitions
by either of these cruise lines will result in further domination by the industry’s two key players. Tomaintain some independence and flexibility, the Halifax Gateway should encourage greater marketparticipation by cruise lines not affiliated with the top two cruise groups.
As the number of mega-ships in the world fleet increases, the Halifax Gateway will need to planaccordingly. Beyond the physical needs of these ships (e.g., pier capacity), the Gateway will need toensure its support infrastructure is sufficient to accommodate the influx of up to 3,500 passengers perday. This means that there must be adequate capacity of tours, efficient ground transportation, and anample supply of attractions to satisfy the diverse interests of passengers. Furthermore, docksidefacilities and procedures must ensure a seamless embarkation and disembarkation process. Customerservice levels in Halifax must also meet, or exceed, those onboard the ships.
With its rich history, dramatic coastline, white sand beaches history, cultural attractions, Halifax has theability to position itself as something different than the other cruise ports on the east coast.
3.6 Ground Transportation Trends
One of the key drivers of ground transportation trends will be growth in international freight to NorthAmerica.
The demand at major U.S. ports such as Los Angeles, Long Beach, and New York, is growing at such a ratethat inland transportation infrastructure could soon be insufficient and is expected to lag behind for sometime.
All levels of government are promoting more efficient inland transportation modes such as rail and short seashipping. Both are more environmentally friendly and short sea is heavily underutilized at least in partbecause of government regulations.
Road Many trucking companies have started to acquire 53 domestic pallet wide containers and chassis rather
than traditional 53-ft. high cube vans. The container and chassis choice is 10-20% more expensive andhas slightly less weight capacity; however, the ability to use rail and short-sea more effectively can bewell worth it.
The Trans-Canada Highway continues to be upgraded to a limited access two lane divided highway.Once complete (planned two years from now), this could open the door to truck-trains to/from Montrealand Toronto. Truck haulage costs could be reduced by as much as 35-40% and the economic range oftrucking extended to about 500-600 miles.
Halifax Gateway Council Strategic Plan Page 97
November 2005
Synergies between domestic and international shipping are being exploited. ISO containers arefrequently used to move domestic freight while the container is repositioned and international freightcan be transferred to 53-ft high cube equipment.
There continues to be a shortage of long haul drivers in the industry and nearly all major truckingcompanies use owner-operators.
A growing number of trucking companies are offering warehousing and 3PL services to their customers.
Rail Railways continue to seek gains in efficiently through longer trains, better car utilisation track-sharing
agreements, and improved labour efficiently.
CN has been a trendsetter in running a scheduled railway, introducing an appointment system for itsterminals, and implementing a reservation policy for train space.
53-ft high cube containers are now the norm for domestic intermodal freight and are expected tocontinue to displace piggyback traffic on rail.
Short Sea Short sea shipping is in a very dynamic development stage. Governments and private entrepreneurs
are looking for ways to make it work. There are significant barriers to entry into this mode of inlandtransportation and new ideas are being developed and tested to make short sea shipping viable.
The high cost of ship charters and the need for efficiency is driving the industry to build ships that arespecially designed for the trade into which they will be used. Flexible layouts to allow mix of domesticand international containers are seen as a way to ensure high utilisation levels and minimise handlingcosts.
New technology is being sought to overcome the high handling costs associated with ship work in mostNorth American ports. They include various schemes to automate or simplify the handling of containers,innovative barge systems, and new types of handling equipment.
Implications for the Halifax Gateway Halifax is well positioned to take advantage of the potential inland transportation infrastructure shortfall
in the U.S. Halifax has significant reserve rail capacity and increased use of the Halifax mainline willfurther improve CN’s cost efficiency.
Further synergies between the domestic and International markets could be developed.
As capacity issues arise, secondary distribution hubs will be developed to move some transportationactivity away from the largest centres. Halifax has the largest population within a large geographicalarea and its existing inland services make it a natural secondary hub location.
Existing legislation, including the so-called Jones Act allows intercoastal or short sea shipping fromHalifax to anywhere in the U.S. using foreign-flag ships. As such, a virtual short sea transportationsystem could be developed by using ships that presently call on Halifax and by developing newservices with feeder and roll-on/roll-off vessels.

Halifax Gateway Council Strategic Plan Page 98
November 2005
4.0 Strategic Assessment
4.1 SWOT Analysis
Strengths and WeaknessesThe Halifax Gateway has many strengths and weaknesses. The key to the Gateway’s future success is tocapitalise on these strengths while simultaneously working to mitigate its weaknesses.
Strengths Weaknesses
Strategic location
Proximity to large market (U.S. east coast)
Well developed infrastructure
Land availability for development
Skilled labour pool
Technology (Smart City)
Natural attractions
Marine access and conditions
Jones Act exemption
Unrestricted airport operations
Surplus capacity
Strong stakeholder alignment
Low population density
Local economy
Distance to inland markets
Low market awareness
U.S.-Canada border
Lack of air capacity to key markets
Limited hotel room inventory in high season
Less efficient than east coast port competitors
Canadian dollar exchange rate
Regulatory/bureaucratic processes
Some infrastructure deficiencies
Lack of rail competition
Limited funding capacity by all levels of government
Lack of political influence
Strengths
Strategic location – Halifax benefits from its location astride the great circle route and its position at thecrossroads of two powerful trade relationships (e.g. NAFTA and EU-NAFTA).
Proximity to large market (U.S. east coast) – although the population of Atlantic Canada is only 2.5million, the Gateway is well positioned to serve the economically powerful and highly populated U.S.east coast and mid-west markets.
Well-developed infrastructure – the Gateway possesses relatively well-developed facilities with regardsto airport, port, and ground transportation infrastructure.
Land available for development – with ample land available in the region for development, expansion ofpassenger and cargo operations through the Gateway in the future should not be hindered.
Skilled labour pool – Greater Halifax’s working age population has the highest proportion of graduatesfrom trade schools, colleges and universities in Canada.
Halifax Gateway Council Strategic Plan Page 99
November 2005
Natural attractions – Halifax and the surrounding area have a generous assortment of interesting andwell run attractions.
Marine access and conditions – the Port of Halifax offers the deepest waters on the east coast of NorthAmerica with minimal tides and no currents.
Unrestricted airport operations – Halifax International Airport’s 24-hour operational capability providesthe Gateway with another key strength. With flight operations permitted around the clock, HalifaxInternational Airport provides carriers with the flexibility they require to maximise their businessopportunities and equipment utilisation.
Strong stakeholder alignment – the Gateway is viewed as an integral part of the economic fabric ofAtlantic Canada, and as a result, benefits from strong stakeholder support.
Surplus capacity – at present, the existing infrastructure provides capacity that exceeds the Gateway’soperational requirements.
Weaknesses
Low population density – with a population of 2.5 million distributed over a large geographic area, theregion’s low population density stands as a weakness for the Gateway.
Local economy – the region’s small economy limits business opportunities through the Gateway.
Distance to inland markets – while Halifax is North America’s closest port to Europe and within closeproximity to international shipping lanes, its location also means that it is located farther away from keyinland markets than its competitors.
Low market awareness – overall awareness of the Halifax Gateway is low. Effective communication ofthe advantages of using the Halifax Gateway over competing gateways will be essential in attractingadditional business to the region.
U.S.-Canada border – the mere presence of a border between the world’s two largest trading partnersimpedes the movement of goods to/from inland U.S. markets and places the Halifax Gateway at adisadvantage relative to its U.S. competitors.
Lack of air capacity to key markets – a lack of direct flights to key destinations reduces the HalifaxGateway’s connectivity and acts as a disincentive to visit and conduct business in the region.
Limited hotel room inventory in high season – there is recognition by tourism stakeholders that thenumber of hotel rooms available during peak season, particularly those to required to support homeportcruise operations, are limited.
Less efficient than east coast port competitors – gateway stakeholders noted that, on average, Halifaxtends to be less efficient that most of its east coast port competitors. This will act as a disadvantagewhen approaching shipping lines to implement new or incremental services.
Regulatory/bureaucratic processes – the time and cost of dealing with regulatory and bureaucraticprocesses has been identified as a weakness by those having to do business in the Halifax region.

Halifax Gateway Council Strategic Plan Page 100
November 2005
Some infrastructure deficiencies – overall, the Gateway possesses very good infrastructure. However,some deficiencies to exist, particularly those associated with cruise operations (e.g. queuing/stagingareas at the airport, service areas at the port)
Lack of rail competition – unlike some of its competitors, the Port of Halifax is only served by onerailway. Some stakeholders perceived this to be a weakness.
Limited funding capacity by all levels of government – governments at all levels are challenged withinfrastructure investment needs that extend well beyond transportation infrastructure. To rectify this,dedicated sources of infrastructure financing must be created.
Lack of political influence – the Atlantic Region lacks the political influence possessed by other regionsof Canada.
Opportunities and ThreatsThe Halifax Gateway also has some exciting opportunities to pursue and some threats to address.
Opportunities Threats
Diversion from U.S. west coast ports
Diversion from U.S. east coast ports
Increasing vessel size/Suez Express routing
Development of feeder services
Value added/distribution centre activity
Regional cooperation/coalitions
Improved air services
Growth in cruise homeport activity
Regional tourism
Technology
Green port initiative
Offshore oil and gas
Military assets
Maritime export/aviation import centre
Increased competition from other gateways
Limited rail competition
U.S.-Canada border barriers
New security measures
Introduction of airport operating restrictions
Terrorism
Government policies
Diversion to other gateways
Opportunities
Diversion from U.S. west coast ports – with congestion at west coast ports and the inability of newgeneration large container vessels to transit the Panama Canal, an opportunity exists for the HalifaxGateway traffic to divert traffic to Halifax.
Diversion from U.S. east coast ports – by increasing its competitiveness and enhancing its valueproposition, Halifax may be able to capture traffic currently being shipped through competing U.S. eastcoast ports.
Increasing vessel size/Suez Express routing – the introduction of post-Panamax vessels.
Halifax Gateway Council Strategic Plan Page 101
November 2005
Value added/distribution centre activity – the presence of a world-class port and intermodal linkagesprovide the region with an opportunity to attract value added activity/distribution firms to the region.
Regional cooperation/coalitions – an opportunity exists to take joint action to improve the region’sdevelopment prospects, strengthen its ability to address complex goals, and increase politicalpresence.
Improved air services – with the advent of U.S. pre-clearance, the Halifax Gateway has an opportunityto develop new passenger air services, particularly to U.S. markets.
Growth in cruise homeport activity – given its inherent attributes, Halifax is well positioned to attracthomeport cruise operations in the future.
Regional tourism – tourism is an important growth sector in the Atlantic Region. The growth of thisindustry could increase traffic to/from the region.
Military assets – Halifax has been a military city since its founding in 1749. The military assets found inand around Halifax present an opportunity for the region, particularly in the logistics sector.
Maritime export/aviation import centre – directional imbalances in cargo movements have led to veryattractive cargo rates (outbound on the maritime side and inbound on the aviation side). Given thisdevelopment, an opportunity exists to establish the Gateway as an export or import centre (modedependent).
Threats
Increased competition from other gateways – gateways operate in a highly competitive environment.As the Gateway continues to grow and prosper, it will undoubtedly compete with other regions,particularly as it attempts to recapture traffic that originates or is destined to its market area.
Limited rail competition – as noted earlier, the Halifax Gateway is served by a single rail carrier. As aresult, it is vulnerable to CN Rail’s market actions and powerful bargaining position. Therefore,maintaining a positive working relationship with CN Rail will be vitally important.
Canada-U.S. border barriers – the presence of the Canada-U.S. border impedes cargo movements andincreases the costs associated with moving goods between the Gateway and inland U.S. marketsrelative to ports on the U.S. east coast.
New security measures – the terrorist attacks in the U.S. prompted the government to introduce newsecurity procedures. These new procedures have increased transportation costs and negativelyinfluenced overall customer satisfaction. Moreover, the possibility exists that additional securitymeasures could be introduced in the future, particularly for air cargo, which could further intensify theseeffects.
Introduction of airport operating restrictions – one of Halifax International Airport's advantages is itsability to accommodate air traffic activity 24-hours per day. Should operating restrictions be introducedat Halifax International Airport, particularly those restricting or prohibiting night operations, it would havea significant impact on air cargo traffic and could decrease the airport's attractiveness to potential aircargo carriers.

Halifax Gateway Council Strategic Plan Page 102
November 2005
Terrorism – despite economic progress in many parts of the world, real or perceived political injusticescontinue to occur, resulting in outright wars or acts of terrorism. The recent wars in Afghanistan andIraq, and the events of September 11, 2001, illustrate the dramatic impacts that these events can haveon the transportation industry.
Diversion to other gateways – a sizeable amount of the Halifax region’s air passenger and cargo trafficeither departs or arrives via other ports or airports in the region because of their larger networks, lowerrates/fares and higher service frequencies. Halifax International Airport must monitor traffic diversion toneighbouring facilities, as it ultimately affects the future potential of the Gateway.
4.2 Halifax Gateway Potential
The SWOT analysis presented in the previous section illustrates the Halifax Gateway’s key strengths andstrategic opportunities, as well as its weaknesses and strategic threats. By following a targeted action plan,the Halifax Gateway has the potential to realise significant growth in the years ahead. The following sectionsestimate the growth potential of the Halifax Gateway across key industry sectors in an environment offocused and targeted strategic intervention by all Gateway stakeholders. The projections identified beloware assumed to be unconstrained by Gateway infrastructure.
Container TrafficThe Port of Halifax handled about 525,000 TEUs in 2004. Because long-term forecasts are not available forthe port, the project team developed potential growth scenarios based upon annual growth rates of 3% and5% per annum. It is felt that under the existing environment, the Port of Halifax could achieve annual growthof roughly 3%, which would represent 882,300 TEUs by 2020. With a proactive and focused approach byGateway stakeholders, the project team estimates that a 5% growth rate is achievable. The latter scenariowould produce TEU traffic levels of roughly 1.1 million by 2020, as displayed in the figure below.
Figure 4-1 – Projected Container Traffic Growth
0
300
600
900
1,200
2004
2005
2006
2007
2008
2009
2010
2011
2012
2013
2015
2016
2017
2018
2019
2020
TEUs
(tho
usan
ds) 3%
882,000 TEUs
5%1,092,000 TEUs
Source – InterVISTAS Consulting Inc.
The port’s sustainable container handling capacity is around 900,000 TEUs, which it could reach in 2010,2012, 2016 or 2021, depending upon how fast it grows. The port should commence development of either
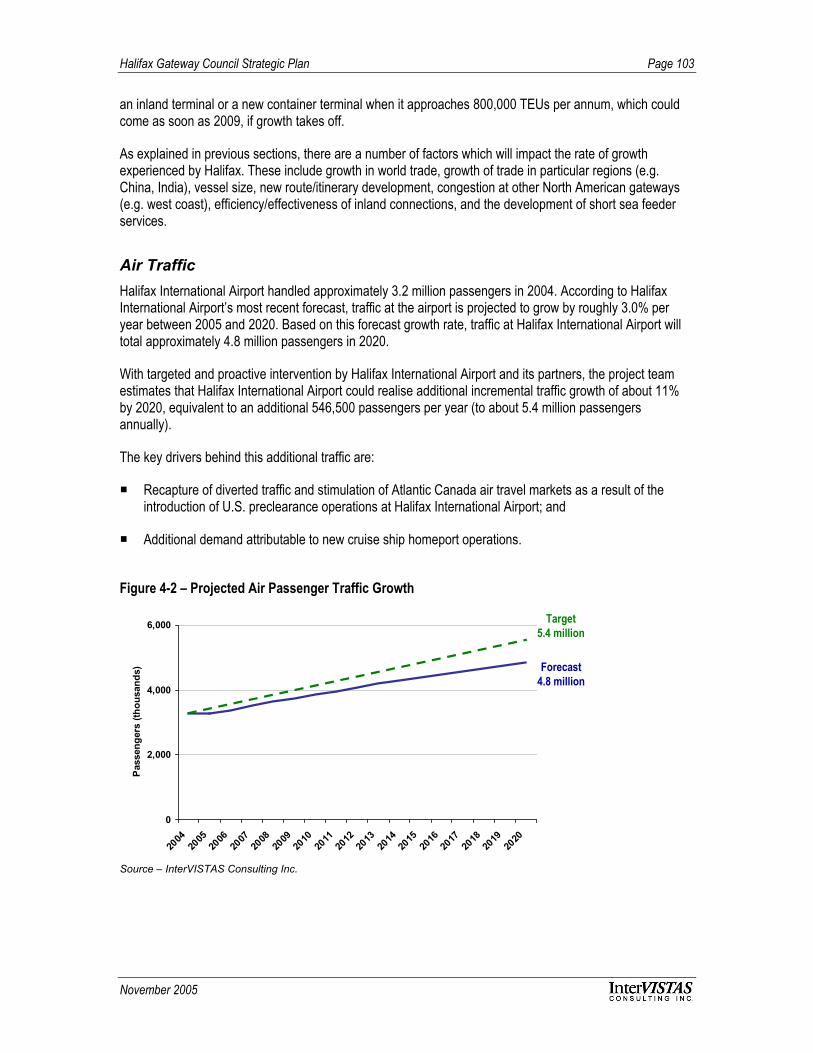
Halifax Gateway Council Strategic Plan Page 103
November 2005
an inland terminal or a new container terminal when it approaches 800,000 TEUs per annum, which couldcome as soon as 2009, if growth takes off.
As explained in previous sections, there are a number of factors which will impact the rate of growthexperienced by Halifax. These include growth in world trade, growth of trade in particular regions (e.g.China, India), vessel size, new route/itinerary development, congestion at other North American gateways(e.g. west coast), efficiency/effectiveness of inland connections, and the development of short sea feederservices.
Air TrafficHalifax International Airport handled approximately 3.2 million passengers in 2004. According to HalifaxInternational Airport’s most recent forecast, traffic at the airport is projected to grow by roughly 3.0% peryear between 2005 and 2020. Based on this forecast growth rate, traffic at Halifax International Airport willtotal approximately 4.8 million passengers in 2020.
With targeted and proactive intervention by Halifax International Airport and its partners, the project teamestimates that Halifax International Airport could realise additional incremental traffic growth of about 11%by 2020, equivalent to an additional 546,500 passengers per year (to about 5.4 million passengersannually).
The key drivers behind this additional traffic are:
Recapture of diverted traffic and stimulation of Atlantic Canada air travel markets as a result of theintroduction of U.S. preclearance operations at Halifax International Airport; and
Additional demand attributable to new cruise ship homeport operations.
Figure 4-2 – Projected Air Passenger Traffic Growth
0
2,000
4,000
6,000
2004
2005
2006
2007
2008
2009
2010
2011
2012
2013
2014
2015
2016
2017
2018
2019
2020
Pass
enge
rs (t
hous
ands
) Forecast4.8 million
Target5.4 million
Source – InterVISTAS Consulting Inc.
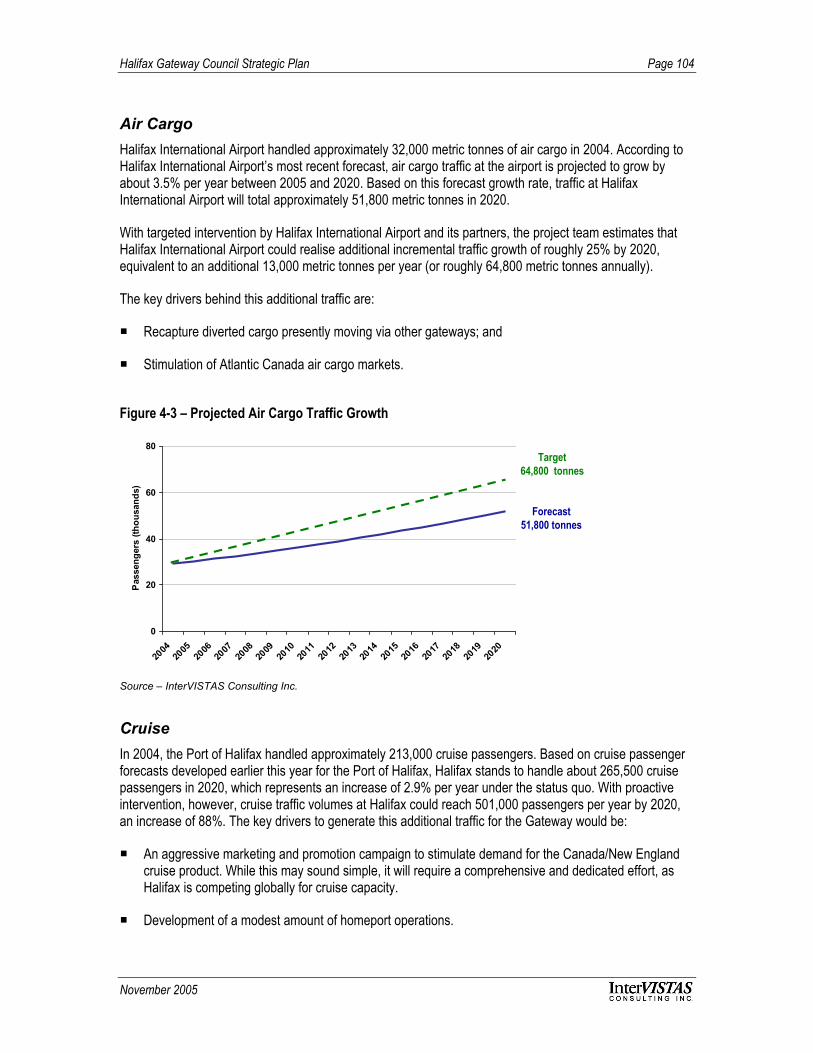
Halifax Gateway Council Strategic Plan Page 104
November 2005
Air CargoHalifax International Airport handled approximately 32,000 metric tonnes of air cargo in 2004. According toHalifax International Airport’s most recent forecast, air cargo traffic at the airport is projected to grow byabout 3.5% per year between 2005 and 2020. Based on this forecast growth rate, traffic at HalifaxInternational Airport will total approximately 51,800 metric tonnes in 2020.
With targeted intervention by Halifax International Airport and its partners, the project team estimates thatHalifax International Airport could realise additional incremental traffic growth of roughly 25% by 2020,equivalent to an additional 13,000 metric tonnes per year (or roughly 64,800 metric tonnes annually).
The key drivers behind this additional traffic are:
Recapture diverted cargo presently moving via other gateways; and
Stimulation of Atlantic Canada air cargo markets.
Figure 4-3 – Projected Air Cargo Traffic Growth
0
20
40
60
80
2004
2005
2006
2007
2008
2009
2010
2011
2012
2013
2014
2015
2016
2017
2018
2019
2020
Pas
seng
ers
(thou
sand
s)
Forecast51,800 tonnes
Target64,800 tonnes
Source – InterVISTAS Consulting Inc.
CruiseIn 2004, the Port of Halifax handled approximately 213,000 cruise passengers. Based on cruise passengerforecasts developed earlier this year for the Port of Halifax, Halifax stands to handle about 265,500 cruisepassengers in 2020, which represents an increase of 2.9% per year under the status quo. With proactiveintervention, however, cruise traffic volumes at Halifax could reach 501,000 passengers per year by 2020,an increase of 88%. The key drivers to generate this additional traffic for the Gateway would be:
An aggressive marketing and promotion campaign to stimulate demand for the Canada/New Englandcruise product. While this may sound simple, it will require a comprehensive and dedicated effort, asHalifax is competing globally for cruise capacity.
Development of a modest amount of homeport operations.

Halifax Gateway Council Strategic Plan Page 105
November 2005
Figure 4-4 – Projected Cruise Passenger Growth
0
100,000
200,000
300,000
400,000
500,000
600,000
2004
2005
2006
2007
2008
2009
2010
2011
2012
2013
2014
2015
2016
2017
2018
2019
2020
Pas
seng
ers
(thou
sand
s)
Forecast265,500
Target501,000
Source – InterVISTAS Consulting Inc.
4.3 Vision
On the basis of the Halifax Gateway’s unique characteristics and strengths, its competitive advantages,current market position and market trends, the following vision is recommended to guide the strategicdevelopment of the Gateway:
To become North America’s preferred eastern gatewayfor the economic and social benefit of Atlantic Canada
This vision will be achieved by:
Improving and expanding the Gateway’s services to fill new market opportunities;
Providing modern, effective and efficient infrastructure and equipment;
Maintaining a competitive cost environment; and
Developing and fostering the use of a common marketing/promotional strategy for the Gateway.
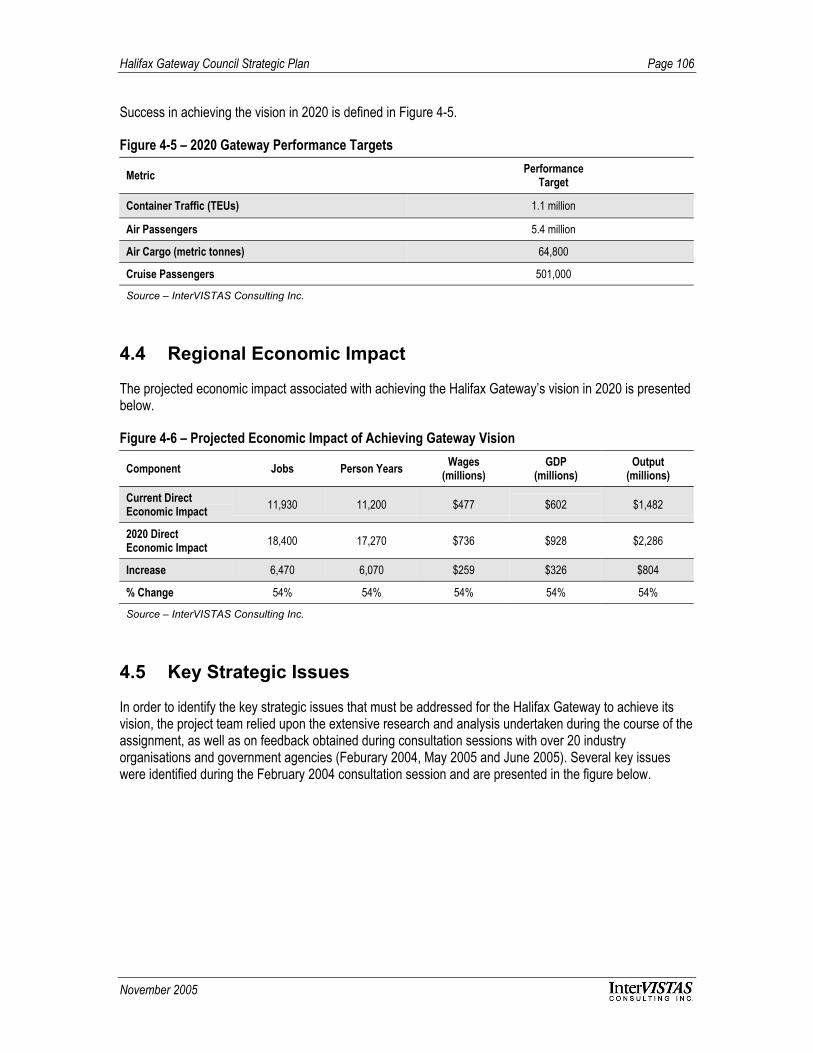
Halifax Gateway Council Strategic Plan Page 106
November 2005
Success in achieving the vision in 2020 is defined in Figure 4-5.
Figure 4-5 – 2020 Gateway Performance Targets
Metric PerformanceTarget
Container Traffic (TEUs) 1.1 million
Air Passengers 5.4 million
Air Cargo (metric tonnes) 64,800
Cruise Passengers 501,000
Source – InterVISTAS Consulting Inc.
4.4 Regional Economic Impact
The projected economic impact associated with achieving the Halifax Gateway’s vision in 2020 is presentedbelow.
Figure 4-6 – Projected Economic Impact of Achieving Gateway Vision
Component Jobs Person Years Wages(millions)
GDP(millions)
Output(millions)
Current DirectEconomic Impact 11,930 11,200 $477 $602 $1,482
2020 DirectEconomic Impact 18,400 17,270 $736 $928 $2,286
Increase 6,470 6,070 $259 $326 $804
% Change 54% 54% 54% 54% 54%
Source – InterVISTAS Consulting Inc.
4.5 Key Strategic Issues
In order to identify the key strategic issues that must be addressed for the Halifax Gateway to achieve itsvision, the project team relied upon the extensive research and analysis undertaken during the course of theassignment, as well as on feedback obtained during consultation sessions with over 20 industryorganisations and government agencies (Feburary 2004, May 2005 and June 2005). Several key issueswere identified during the February 2004 consultation session and are presented in the figure below.

Halifax Gateway Council Strategic Plan Page 107
November 2005
Issue Votes TotalShared Gateway Vision 13 0 0 13 130Perimeter Clearance 12 0 1 13 120Federal Fiscal Policies 11 2 0 13 120Coordinated Land Use & Transportation Planning 10 3 0 13 115US Preclearance 10 3 0 13 115Air Policy liberalization 7 6 0 13 100Halifax Transportation Authority 8 4 1 13 100Competitive Rail Access 5 7 1 13 85Air Cargo Liberalization 4 9 0 13 85Infrastructure Funding and Development 1 12 0 13 70Cruise Development Strategy 1 6 6 13 40
Subsequent discussion identified the following major issues/priorities for the Gateway to address:
Market development;
Infrastructure development and funding;
Economic and industrial development; and
Government policy.
Market DevelopmentMarketing and business development activities will play a critical role in the continued development of theHalifax Gateway. These functions encompass a broad range of activities from generating Gatewayawareness/interest to specific business development activities.
Marketing – stakeholders identified marketing as a critical issue for the Gateway. Competition amongstregions for gateway activity is intense and strong efforts need to be taken to better position Halifax inthe transportation marketplace. Discussions addressed a variety of marketing topics, including marketpositioning, market awareness, and the need for the development of a strong Gateway brand identity.In particular, stakeholders expressed strong feelings that a major commitment was needed by thefederal government to increase marketing and financial support of the Gateway.
Stakeholders also discussed the need for incentives and support packages to help attract activity to theregion. Lastly, cooperation between Gateway partners was cited as a way to leverage the region’ssales and marketing resources for the greatest gain to Halifax and Atlantic Canada.
Identify key market opportunities – a general consensus exists that many opportunities exist tosignificantly increase business through the Gateway. Before the region and it partners begin to activelypursue business opportunity leads, work must be undertaken to identify all potential businessopportunities, quantify the potential, and then prioritise these opportunities so that opportunities can bepursued in a systematic and strategic way.
Some of the potential market opportunities identified by stakeholders included:
– Cruise homeport operations/strategy
– Suez shipping route
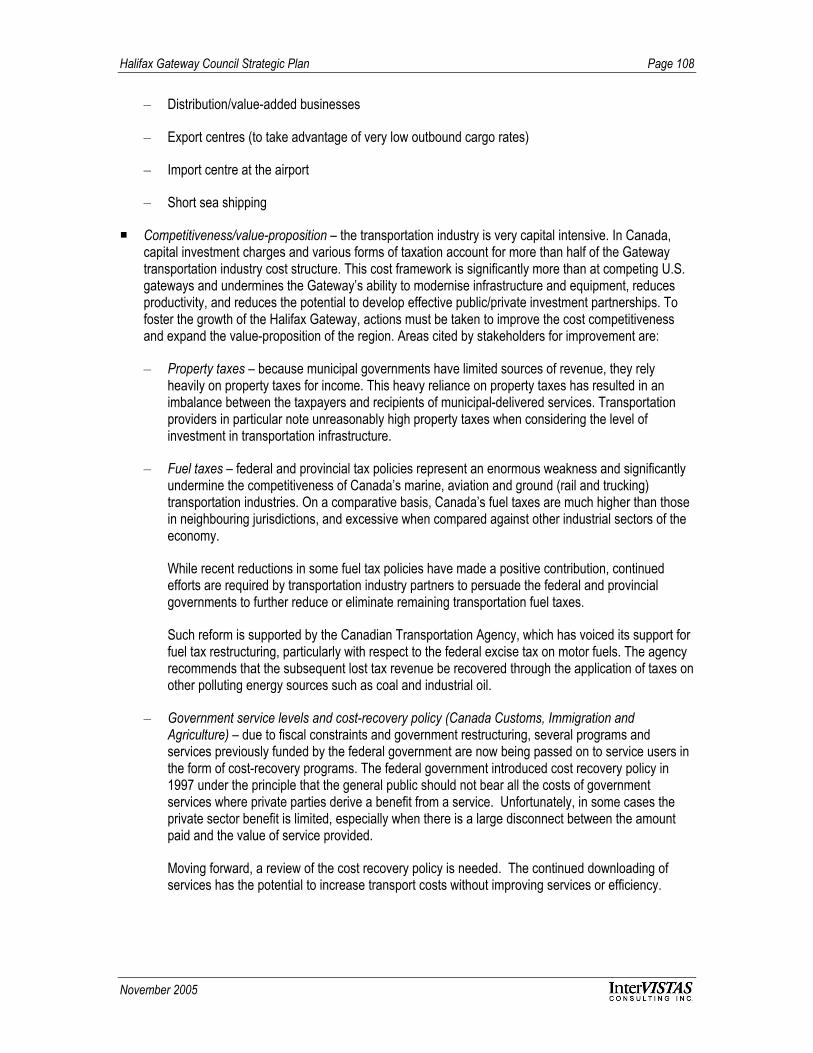
Halifax Gateway Council Strategic Plan Page 108
November 2005
– Distribution/value-added businesses
– Export centres (to take advantage of very low outbound cargo rates)
– Import centre at the airport
– Short sea shipping
Competitiveness/value-proposition – the transportation industry is very capital intensive. In Canada,capital investment charges and various forms of taxation account for more than half of the Gatewaytransportation industry cost structure. This cost framework is significantly more than at competing U.S.gateways and undermines the Gateway’s ability to modernise infrastructure and equipment, reducesproductivity, and reduces the potential to develop effective public/private investment partnerships. Tofoster the growth of the Halifax Gateway, actions must be taken to improve the cost competitivenessand expand the value-proposition of the region. Areas cited by stakeholders for improvement are:
– Property taxes – because municipal governments have limited sources of revenue, they relyheavily on property taxes for income. This heavy reliance on property taxes has resulted in animbalance between the taxpayers and recipients of municipal-delivered services. Transportationproviders in particular note unreasonably high property taxes when considering the level ofinvestment in transportation infrastructure.
– Fuel taxes – federal and provincial tax policies represent an enormous weakness and significantlyundermine the competitiveness of Canada’s marine, aviation and ground (rail and trucking)transportation industries. On a comparative basis, Canada’s fuel taxes are much higher than thosein neighbouring jurisdictions, and excessive when compared against other industrial sectors of theeconomy.
While recent reductions in some fuel tax policies have made a positive contribution, continuedefforts are required by transportation industry partners to persuade the federal and provincialgovernments to further reduce or eliminate remaining transportation fuel taxes.
Such reform is supported by the Canadian Transportation Agency, which has voiced its support forfuel tax restructuring, particularly with respect to the federal excise tax on motor fuels. The agencyrecommends that the subsequent lost tax revenue be recovered through the application of taxes onother polluting energy sources such as coal and industrial oil.
– Government service levels and cost-recovery policy (Canada Customs, Immigration andAgriculture) – due to fiscal constraints and government restructuring, several programs andservices previously funded by the federal government are now being passed on to service users inthe form of cost-recovery programs. The federal government introduced cost recovery policy in1997 under the principle that the general public should not bear all the costs of governmentservices where private parties derive a benefit from a service. Unfortunately, in some cases theprivate sector benefit is limited, especially when there is a large disconnect between the amountpaid and the value of service provided.
Moving forward, a review of the cost recovery policy is needed. The continued downloading ofservices has the potential to increase transport costs without improving services or efficiency.
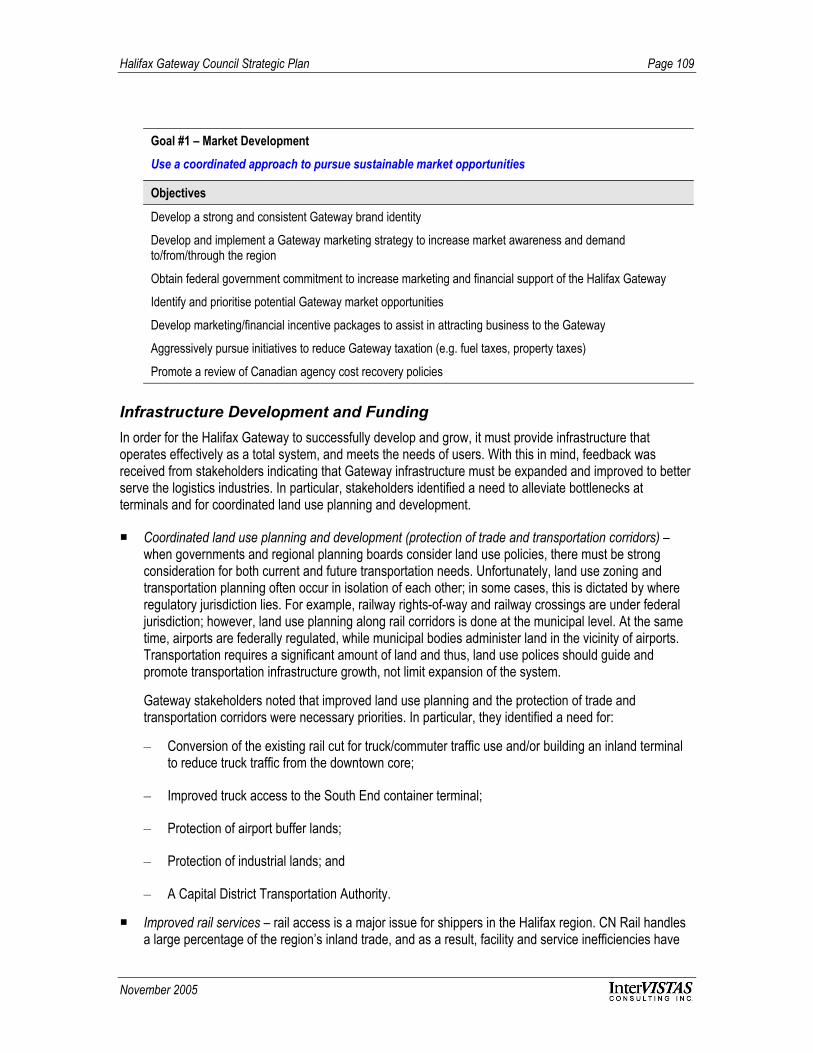
Halifax Gateway Council Strategic Plan Page 109
November 2005
Goal #1 – Market DevelopmentUse a coordinated approach to pursue sustainable market opportunities
Objectives
Develop a strong and consistent Gateway brand identity
Develop and implement a Gateway marketing strategy to increase market awareness and demandto/from/through the region
Obtain federal government commitment to increase marketing and financial support of the Halifax Gateway
Identify and prioritise potential Gateway market opportunities
Develop marketing/financial incentive packages to assist in attracting business to the Gateway
Aggressively pursue initiatives to reduce Gateway taxation (e.g. fuel taxes, property taxes)
Promote a review of Canadian agency cost recovery policies
Infrastructure Development and FundingIn order for the Halifax Gateway to successfully develop and grow, it must provide infrastructure thatoperates effectively as a total system, and meets the needs of users. With this in mind, feedback wasreceived from stakeholders indicating that Gateway infrastructure must be expanded and improved to betterserve the logistics industries. In particular, stakeholders identified a need to alleviate bottlenecks atterminals and for coordinated land use planning and development.
Coordinated land use planning and development (protection of trade and transportation corridors) –when governments and regional planning boards consider land use policies, there must be strongconsideration for both current and future transportation needs. Unfortunately, land use zoning andtransportation planning often occur in isolation of each other; in some cases, this is dictated by whereregulatory jurisdiction lies. For example, railway rights-of-way and railway crossings are under federaljurisdiction; however, land use planning along rail corridors is done at the municipal level. At the sametime, airports are federally regulated, while municipal bodies administer land in the vicinity of airports.Transportation requires a significant amount of land and thus, land use polices should guide andpromote transportation infrastructure growth, not limit expansion of the system.
Gateway stakeholders noted that improved land use planning and the protection of trade andtransportation corridors were necessary priorities. In particular, they identified a need for:
– Conversion of the existing rail cut for truck/commuter traffic use and/or building an inland terminalto reduce truck traffic from the downtown core;
– Improved truck access to the South End container terminal;
– Protection of airport buffer lands;
– Protection of industrial lands; and
– A Capital District Transportation Authority.
Improved rail services – rail access is a major issue for shippers in the Halifax region. CN Rail handlesa large percentage of the region’s inland trade, and as a result, facility and service inefficiencies have
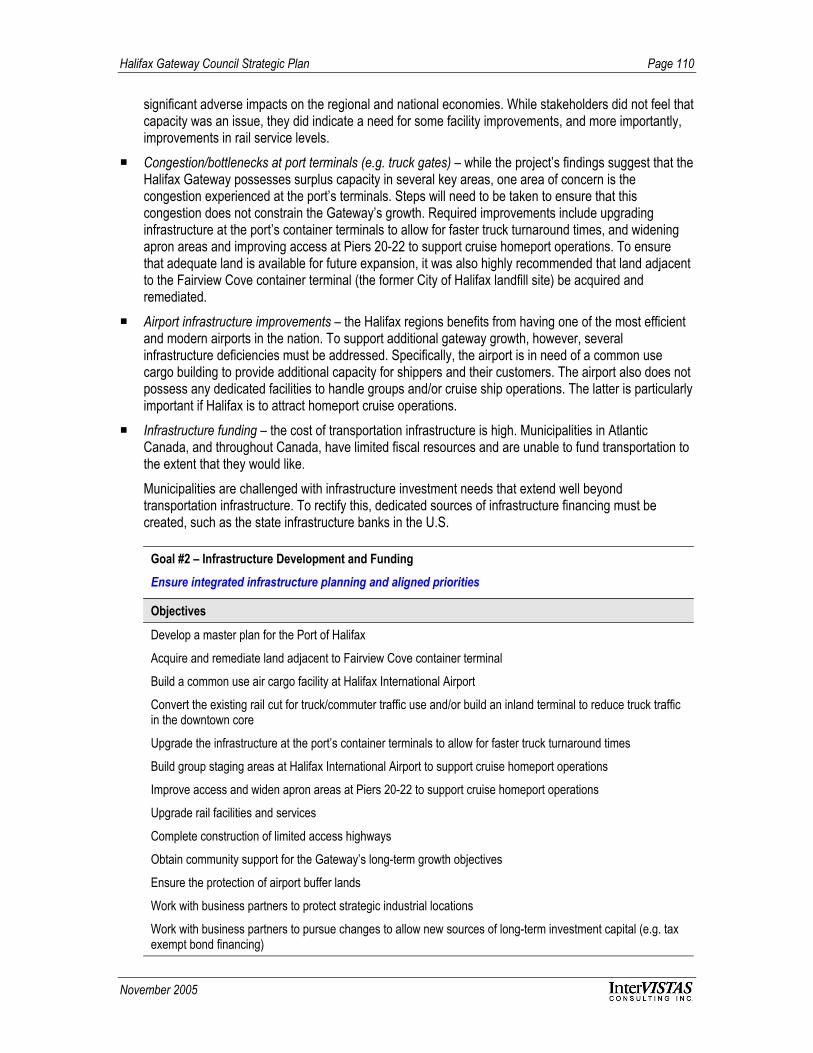
Halifax Gateway Council Strategic Plan Page 110
November 2005
significant adverse impacts on the regional and national economies. While stakeholders did not feel thatcapacity was an issue, they did indicate a need for some facility improvements, and more importantly,improvements in rail service levels.
Congestion/bottlenecks at port terminals (e.g. truck gates) – while the project’s findings suggest that theHalifax Gateway possesses surplus capacity in several key areas, one area of concern is thecongestion experienced at the port’s terminals. Steps will need to be taken to ensure that thiscongestion does not constrain the Gateway’s growth. Required improvements include upgradinginfrastructure at the port’s container terminals to allow for faster truck turnaround times, and wideningapron areas and improving access at Piers 20-22 to support cruise homeport operations. To ensurethat adequate land is available for future expansion, it was also highly recommended that land adjacentto the Fairview Cove container terminal (the former City of Halifax landfill site) be acquired andremediated.
Airport infrastructure improvements – the Halifax regions benefits from having one of the most efficientand modern airports in the nation. To support additional gateway growth, however, severalinfrastructure deficiencies must be addressed. Specifically, the airport is in need of a common usecargo building to provide additional capacity for shippers and their customers. The airport also does notpossess any dedicated facilities to handle groups and/or cruise ship operations. The latter is particularlyimportant if Halifax is to attract homeport cruise operations.
Infrastructure funding – the cost of transportation infrastructure is high. Municipalities in AtlanticCanada, and throughout Canada, have limited fiscal resources and are unable to fund transportation tothe extent that they would like.Municipalities are challenged with infrastructure investment needs that extend well beyondtransportation infrastructure. To rectify this, dedicated sources of infrastructure financing must becreated, such as the state infrastructure banks in the U.S.
Goal #2 – Infrastructure Development and FundingEnsure integrated infrastructure planning and aligned priorities
Objectives
Develop a master plan for the Port of Halifax
Acquire and remediate land adjacent to Fairview Cove container terminal
Build a common use air cargo facility at Halifax International Airport
Convert the existing rail cut for truck/commuter traffic use and/or build an inland terminal to reduce truck trafficin the downtown core
Upgrade the infrastructure at the port’s container terminals to allow for faster truck turnaround times
Build group staging areas at Halifax International Airport to support cruise homeport operations
Improve access and widen apron areas at Piers 20-22 to support cruise homeport operations
Upgrade rail facilities and services
Complete construction of limited access highways
Obtain community support for the Gateway’s long-term growth objectives
Ensure the protection of airport buffer lands
Work with business partners to protect strategic industrial locations
Work with business partners to pursue changes to allow new sources of long-term investment capital (e.g. taxexempt bond financing)

Halifax Gateway Council Strategic Plan Page 111
November 2005
Economic and Industrial DevelopmentSignificant feedback was received from stakeholders indicating that for the Halifax Gateway to prosper,additional economic growth was required in the region. In particular, it was felt that increasing the standardof living by attracting and retaining quality jobs, increasing investment, assisting firms in locating orrelocating commercial operations in the region, and attracting visitors should be areas of focus. In particular,stakeholders identified two key opportunities/priorities for the region – building a distripark/transload logisticsfacility and working with the Department of National Defence to develop a logistics hub. To realize theseobjectives, the Gateway will need to ensure:
Alignment of existing plans and resources – the efficient movement of goods and people requires awell-designed network of transportation infrastructure and services. Transportation planning, however,cannot happen in a vacuum. The geographic expanse called Atlantic Canada includes distinct regions,counties and cities, all with separate transportation planning bodies. On top of this, the provincial andfederal governments have their own planners and policy advisors providing input on transportation inAtlantic Canada. When also considering the transportation authorities and industry associations activein the region, it is easy to see that transportation planning can happen in a disjointed manner.There is a clear need for existing plans and other resources to be aligned and for transportationplanning in Atlantic Canada to occur in an integrated manner. This means that all groups must worktogether to share information, identify issues and develop solutions. The long-term success of thegateway is reliant on a transportation system that allows for the unencumbered flow of goods andpeople throughout the gateway and the streamlined flow of goods and people from one mode toanother.
Regional cooperation – a general feeling exists that Atlantic Canada has been neglected by theCanadian government. This neglect is due to the perennial economic difficulties of the region as well asa decline in the region’s national political influence. It was noted that if the region is to achieve itspotential, a concerted effort must be made to increase regional cooperation. By taking joint action, theregion can improve their development prospects, strengthen their ability to address many complexgoals, and increase political presence.
Stakeholders stressed that this regional cooperation need not be confined to provinces, regions, andcities in Atlantic Canada. In fact, it was suggested that, where appropriate, this regional cooperationinclude southern Quebec and even cross border jurisdictions such as upstate New York and a portionof the U.S. north east, such as the Atlantica initiative.
Workshop participants identified the expansion and development of logistics businesses as an area ofparticular interest and opportunity for the Gateway.

Halifax Gateway Council Strategic Plan Page 112
November 2005
Goal #3 – Economic and Industrial DevelopmentGrow the economy of Atlantic Canada by expanding transportation-related businesses
Objectives
Develop a master plan for distribution centre activity
Build a distripark/transload logistics facility
Work with the Department of National Defence to develop a logistics hub
Promote expansion and development of logistics businesses in Atlantic Canada
Ensure existing plans and resources in Atlantic Canada are aligned to optimise transportation planning anddevelopment
Work with industry partners to promote a common voice for the Gateway and the Atlantic Canada region
Promote the development of inter-organisation and inter-agency cooperation, particularly between GatewayCouncil members
Promote regional cooperation (domestic and cross border) to improve development prospects, improve abilityto address complex goals, and strengthen political presence
Government PolicyGateway stakeholders identified government policy as one of the key areas to address in order to expandbusiness through the Gateway. Specifically, stakeholders asked the Gateway to address the followingissues:
International air policy – While the recent liberalisation of the Canada-U.S. air agreement will improvethe flow of people, goods, and services between Canada and the U.S., Canada’s competitive position inair transportation vis à vis the U.S. continues to deteriorate as the latter enters into new bilateral airagreements with countries throughout the world. Since 1992, the U.S. has aggressively pursued OpenSkies agreements with other nations to expand air services and enable its carriers to fully participate inglobal aviation alliances. To date, the U.S. has over 70 such agreements, which permit unrestrictedinternational air service between participating countries. By comparison, Canada has signed OpenSkies agreements with just three countries (the U.S., the United Kingdom, and Germany).
Canada-U.S. border facilitation (southbound) – since September 11, 2001, new security and customsrequirements have increased the amount of time it takes for trucks and cars to cross the Canada-U.S.border. The cost of border delays to the Canadian economy is estimated to be in excess of $8.4 billionannually. In fact, the Ontario Chamber of Commerce estimates that Border delays cost the automotiveindustry CAD$1 million per day. The Montreal-based Institute for Research on Public Policy (IRPP)concluded in a recent study that border delays add as much as 10 to 15 percent to truck transportationcosts.
Despite initiatives under the Smart Border Declaration and Action Plan, Canada’s Border InfrastructureFund, and other programs, delays and congestion continue to be a significant issue, and one thatnegatively impacts the Halifax Gateway. The Free and Secure Trade (FAST) program, which allowspre-approval of truck shipments from registered shippers, is considered to be a step in the rightdirection. However, the availability of dedicated FAST lanes at crossings is limited, negating the time-saving potential of the program.
Halifax Gateway Council Strategic Plan Page 113
November 2005
In addition to new border infrastructure and staffing requirements, there is a need to explore new policyinitiatives to enable preclearance of trucks at inland facilities (much like what is done for rail shipments),to reduce administrative requirements, harmonise entry requirements with an emphasis on securityregulations, promoting the adoption of new technologies and promoting Perimeter Clearance.
Goal #4 – Government PolicyEstablish policies to support the development of Halifax as North America’s preferred east coastgateway
Objectives
Promote liberalisation of Canada’s international air policy
Aggressively pursue full U.S. preclearance
Actively promote development of 24-hour customs operations at Halifax International Airport
Pursue initiatives to streamline airport-port transfers
Work to harmonise different provincial trucking regulations
Ensure adequate staffing levels for border agencies
Champion the development of harmonised border entry requirements and processes
Promote adoption of new technologies to facilitate border crossings
Promote development of the Perimeter Clearance concept
4.6 Best Practices
The previous section identified the key strategic issues that need to be addressed in order for the HalifaxGateway to realise its vision. The following sections examine what other gateways around the world, andtheir partners, are doing to both address and excel in these specific areas.
Gateway Marketing/Business DevelopmentVancouver, Montreal, and New York are all formidable gateways. Some of the exemplar activities beingundertaken by these gateways to increase market awareness, better position themselves relative to theircompetitors, and attract additional business, include:
Special marketing relationships/programs – during the past two years, New York has partnered with thePanama Canal Commission to promote all water services from Asia to the U.S. east coast. Thisconcept has proved to be very successful, particularly in light of the other factors/conditions affectingwest coast gateways. It has been suggested that a similar initiative between Halifax, New York, andselected U.S. east coast ports with respect to Suez-type services could be beneficial.
Attractive incentives/support packages – Vancouver has emerged as a successful west coast rival toSeattle and Tacoma. It has accomplished this through imaginative and far-sighted leadership and bysuccessfully positioning itself as a leading port for west coast first in, last out (FILO) business. A keystep to achieving the latter involved the development and introduction of incentives for vessels making itthe first inbound port of call across the Pacific.
Halifax Gateway Council Strategic Plan Page 114
November 2005
Strong relationships with key partners – Another key to Vancouver’s success involved seeking, andobtaining, the cooperation of both Canadian transcontinental railways which rose to the occasion byoffering very attractive rates from Vancouver to Chicago and Toronto. This stimulated the developmentof several new services which resulted in Vancouver becoming the first port in Canada to register over1 million TEUs. Another port that has benefited substantially from strong relationships between keypartners is Montreal. Much of the port’s success is attributable to the strong symbiotic relationship thatexists between CP Ships and CP Rail. The two organisations have spent the last 25 years collectivelybuilding the Montreal gateway.
Expanded facilities/capacity – Adequate facilities/capacity is a key consideration for transportationservice providers. Gateways that have reached their capacity will inhibit carriers from maximisingbusiness opportunities and be incapable of meeting future customer demands. To ensure that itprovided its key gateway partners with sufficient capacity to increase and grow operations, the Port ofVancouver made a bold decision to not only construct DeltaPort, but to construct the facility in advanceof demand when there was not yet sufficient justification for it.
New services – The Port of Gothenburg is a gateway to Sweden, Scandinavia, and the Baltic region. In2004, Gothenburg handled roughly 736,000 TEUs and 553,000 roll-on/roll-off units. Part of the port’ssuccess is attributable to its very dynamic feeder and short sea services. The port is also a leader in thedevelopment of new short sea and roll-on/roll-off cargo loading methods, including the development ofStoraEnso’s cassette handling system. One of Halifax’s key customers, ACL, has been a fixture inGothenburg since the introduction of containerised shipping.
Airline Incentive ProgramsOver the past several years, airports, governments, tourism development groups, and other stakeholdershave become increasingly aggressive in pursuing new air services, and have frequently turned toincentive/support packages to induce airlines to serve their community. Some of the key incentiveapproaches being used by airports include (independently or in combination with each other):
Airport fee discounts – an airport fee discount program involves reducing landing, terminal, parking,and/or other airport fees for a pre-determined period of time. This approach is used by dozens ofairports globally, including Fort Lauderdale, Denver, Amsterdam Schiphol, and Kuala Lumpur.
Joint marketing support/assistance – joint marketing support/assistance is intended togenerate/promote awareness of a new service thereby increasing demand for the flight. The programinvolves providing airlines with funds/allowances to promote new services. Promotional activities maybe carried out independently or on a co-operative basis. These programs are very flexible and allow fora wide variety of promotional activities, including advertising, direct mail, sales calls and press releases,participation in trade functions and focus groups, and involvement in integrated promotions. Thisapproach is also utilised by dozens of airports globally, including Denver, San Juan, and Portland(Oregon).
Revenue guarantees – revenue guarantees are intended to prevent an airline from suffering majorfinancial losses during route start-up. The program involves providing an airline with a guarantee that anew service will achieve a specific revenue target over a pre-determined period of time. If the target isnot achieved, an airport/community makes up the revenue shortfall to the airline subject to apredetermined maximum amount (the revenue guarantee cap). If the revenue target is reached orexceeded, the airport/community is not required to make any type of payment. This approach has beenutilised by several airports, including Denver, Kalispell, Wichita, San Juan, and Grand Bahama Island.
Halifax Gateway Council Strategic Plan Page 115
November 2005
Denver, in particular, has used revenue guarantees to strategically develop new international routes toFrance and Mexico.
Community ticket trusts (also called travel banks) – A prepaid travel program involves securing moneyfrom local travellers in advance of an airline’s arrival into a market for a travel bank. Money from thistravel bank is used by travellers to purchase tickets on credit from the specific airline. The purpose ofthe travel bank is to get travellers on the specific airline a few times, get them used to the service, andbreak their traditional travel habits. Once this happens, it is the airline’s job to keep them as customers.Airports/regions that have used this approach include Eugene (Oregon), Pensacola, Wichita, andPortland (Oregon). The latter recently used a community ticket trust to attract new scheduled air serviceto/from Germany.
It should be noted that while incentives such as these can be beneficial, care must be taken to ensure thatthey are used strategically and judiciously, and that limited community resources are used in the mosteffective way possible. Airline incentives are not appropriate in every circumstance. They should bedesigned to reduce the risk to an airline during the start-up phase of a new service, and to build awarenessand demand for a new air service as it becomes established. Incentives should not be used to ‘buy’ airservices that would not be self-sustaining in the long-term (such services are often discontinued the momentthe support is suspended).
Cruise Incentive ProgramsIn an effort capture, retain and grow cruise passenger volumes, several jurisdictions in the Caribbean haveentered into long-term agreements with the cruise lines, or more commonly, with the Florida-CaribbeanCruise Association which represents the collective interests of the cruise lines. In exchange for agreeing toserve a destination for a specific period of time (e.g. 5, 10, or 15 years) with escalating traffic volumes, theports and destinations offer cruise lines cash incentives, protection from tariff increases, or otherconsiderations. For the ports and destinations, these agreements provide revenue stability, allowing them toraise capital and build needed facilities.The practice of establishing long-term agreements has become commonplace to the inland destinations inthe Caribbean. The U.S. Virgin Islands, Cayman Islands, Bahamas, Puerto Rico and Jamaica all signedagreements with individual cruise lines and the Florida-Caribbean Cruise Association. While initially limitedto port-of-call destinations in the Caribbean, the concept of establishing long-term agreements hasexpanded to other cruise regions and to homeports as well.The Port of Miami, Port Everglades, and Port Canaveral all benefit from having long-term commitments withmajor cruise lines. In these cases, the cruise lines essentially sign a long-term terminal lease. In New York,however, the Carnival Corp. and Norwegian Cruise Lines jointly agreed to bring 13 million passengersthrough New York over the next 15-years. This agreement is not structured on the basis of a terminal lease.Instead, this agreement gave the City of New York the financial security to upgrade its Manhattan terminaland construct a new Brooklyn pier.
Infrastructure Investment and FinancingWith its current CAD$25 million borrowing limit, it is anticipated that the Port of Halifax will face somechallenges with respect to financing new infrastructure when it is required. Depending upon future rates ofgrowth, the need for additional container handling capacity could come as early as 2009 or as late as 2016.When new facilities are required, e a number of options available to the port, including expanding existingfacilities, building an inland container terminal, and building a third container terminal.
A new Canada Marine Act could address some concerns regarding port finance. Early indications are thatthe Minister of Transport will now have the ability to increase a port’s borrowing limits without going to
Halifax Gateway Council Strategic Plan Page 116
November 2005
Governor-in-Council. The recent deal announced for Prince Rupert suggests the prohibition of federalfunding for ports contained in the previous 1998 Act is now obsolete. It also suggests there may be newways to fund port development, with participation from multiple partners and levels of government. What isnot clear is how Canadian ports can attract private capital and global terminal operators, other than througha traditional lease. Vancouver has shown, however, that leases can be extended well beyond the 20-yearmark, and that with this type of time frame, a terminal operator has substantial incentive to invest andupgrade.
To build new facilities, most U.S. ports rely on tax free bonds issued by state or local government entities.‘Access to low cost capital and land has contributed to overcapacity at U.S. ports’, according to a leadingU.S. port consultant. Although many ports receive subsidies, they also generate much of their financingthrough fees and investments. Many state ports can issue tax-free bonds, and back them with revenue fromoperations. Most important from Nova Scotia’s perspective, is ‘the North Atlantic range of ports lags the restof the U.S. port industry in terms of financial self-sufficiency’.
As Booz Allen have pointed out, ‘the maritime operations of the PANYNJ receive substantial funding outsideof their own operationally generated cash flows’. Subsidisation comes in the form of direct federal support(e.g. U.S. Army Corps of Engineers dredging at an estimated cost of USD$871 million), tax exempt portrevenue bonds, and cross-subsidisation by other operations (e.g. tunnels and airports). It actually operatesat an annual deficit of US$30 million, generating some US$102 million of the Authority’s USD$2 billion inrevenue. Another advantage the PANYNY enjoys is access to short and long-term capital markets at verycompetitive interest rates, just because of the sheer financial heft of the Authority.
Like New York, the Virginia Port Authority receives substantial funding outside its own cash flow. It obtainsfederal and state funding, as well as outright grants. It can issue tax exempt port revenue bonds, statetransportation funds and general appropriation funds. It also makes payments in lieu of taxes and givesgrants to local communities. The Commonwealth of Virginia subsidises its ports at between US$30-$40million per year. Since 1997, there has been a general move on the part of the Commonwealth towardsencouraging more self-sufficiency. Nonetheless, the VPA continues to receive funding from theCommonwealth Port Fund, ‘which is essentially the Port’s share of revenues collected by theCommonwealth from motor vehicle fuel taxes’. The port receives a significant percentage of the state’stransportation fund. The state also serves as guarantor of tax free Commonwealth Port Fund Bonds issuedby the VPA.
In Gothenburg, the port is owned by the City of Gothenborg and earned 94 MSEK (CAD $14 million) in2003, with earnings on equity of 14.4%. In New Zealand, all ports were privatised in the 1980s. Ports ofAuckland Limited is 80% owned by the regional government and is profitable.
Distribution Centre DevelopmentThe two best North American examples of ports which have leveraged the location of distribution activitiesinto additional container throughput are Savannah and Norfolk.
The Port of Savannah has experienced consistent, strong volume growth for each of the past five years.This volume growth has been driven by a number of factors – notably, an emphasis on all-water servicesfrom Asia and a strong push by the Georgia Ports Authority in concert with the Savannah EconomicDevelopment Authority (SEDA) to attract new logistics/import distribution centres to the southeasternGeorgia area.
In 1995 Home Depot was one of the first of the major retailers to locate a distribution facility near the port ofSavannah. The following table identifies the major retail companies that have located distribution facilities in

Halifax Gateway Council Strategic Plan Page 117
November 2005
and around Savannah, to handle imported containerised shipments. The table also shows the total size ofthese companies’ existing facilities.
The bulk of the facilities cited above are located in the Crossroads Business Center, which is a 2,000 acresite being developed by private real estate firms.
Savannah’s geographic position as the first major port north of the Panama Canal on the east coast with un-congested access to major highways and Class 1 railroads is a major advantage. The Port’s location allowscarriers to maintain highly competitive transit times versus other East Coast alternatives.
Like Savannah, the Virginia Port Authority has spent considerable energy attracting over 30 distributioncentres to locate within the state and within relatively close proximity to the port. Their reasoning is that if acarrier desires to carry a certain shipper or retailer’s cargo, this will lock them into a Norfolk port of call.Likewise, the port’s inland terminal, called Virginia Inland Port, serves these distribution centres and offersspeedier access to cargo.
Multimodal EfficiencySeveral best practices have emerged in the area of multimodal efficiency (terminals, rail, and truckingoperations). These are discussed in the sections below.
Terminals
The best practices in multimodal terminal efficiency involve using all the available information to make thethousands of decisions required at a terminal daily.
Information such as the designated ship, container size, type, destination and dangerous commodityclassification will obviously impact the decision of where to stage an export container and can be dealt witheven in a manual fashion through space allocation on the terminal. However, much more information isavailable at that point in time that could optimise the decision as to ‘ where to put the container’. Thisinformation could include:
Container weight
Yard layout (live inventory)
Status of clearance for export (customs and security)
Location of the terminal equipment at the time
Truck queue at time of arrival
Vessel stow plan
Ship schedules of both designated ship and prior vessels
Advanced terminal management systems take all or most of the relevant information into account to makethe decision and assign the task to the most appropriate piece of equipment. Yard layouts, volumes,handling equipment, customers and cargo mix vary from terminal to terminal and as such there is no ‘best’system; however, a couple deserve mention.

Halifax Gateway Council Strategic Plan Page 118
November 2005
As a semi-automated terminal system, using automatically guided vehicles and Automated Stacking cranescan be seen at the ECT Delta terminal in Rotterdam. It was originally built for Sea Land in 1993 is still agood example of terminal automation.
Maher Terminals in the Port of New York/New Jersey owns and operates an advanced truck-gate systemthat incorporates automatic character recognition to read the container number and digitally recorded andstored transaction records.
Ever larger ships are driving the terminals towards bigger-faster-more powerful handling equipment ZPMCrecently announced the construction of a massive crane capable of lifting four TEU’s at a time (two 40 footcontainers wide) with a reach of 25 containers wide for the United Arab Emirates. Containers are nowroutinely being stacked five high for full containers and seven high for empties.
Terminals are generally constrained by two factors: storage space and handling equipment. Direct movesfrom one mode to another when they can be coordinated make the most efficient use of the terminal’sassets. Grounding is avoided and the container is handled once (in one cycle). Eastern Canadian terminals(Cast, Ceres, Halterm and Racine) are proficient at doing this on the import cycle from ship to rail (althougha much smaller proportion of the containers are handled this way today). Having a single rail provider makesthis easier and CN generally goes directly from truck to rail at their inland terminals (HIT operates this way).
Rail
North American railways are much more efficient at intermodal freight handling than most railwaysworldwide. The double stacking of containers on rail nearly halves the cost per mile of hauling containers byrail. Large volumes of containers move by rail daily and point to point container trains are operated betweenmajor ports and large population centres.
CN operates regularly scheduled intermodal trains between Halifax and inland markets. The company isseen as the leader among North American railways in running a scheduled railway. They have alsoinstituted a reservation system for space on trains.
Container trains running point to point often in a fixed consist were first introduced in Europe by CastContainerline to compensate for their single port of call in Europe. Cast operated con-bulkers; ships thatcarried a mix of containers and bulk cargoes which could only call at one container port in Europe andmaintain their schedule.
P&O in partnership with Nedlloyd and Sealand established a similar unit-train service, European Rail Shuttle(ERS). This service has grown from 22,000 TEUs in 1994 to 494,000 TEUs in 2004. ERS’ shuttle trains arescheduled trains with fixed capacities, departures and arrival times. ERS has become a freight orientedrailway within Europe using the infrastructure of the various (national) railways throughout Europe. The onusto fill the train and provide the appropriate service levels rests with ERS whose only focus is intermodaltransportation. European railways simply hook and haul on schedule.
Trucking
Trucks are involved in nearly every intermodal transportation move. Trucking companies are the first andlast transportation service providers in the chain and are often closest to the shippers and receivers who relyon them to provide just-in-time service. Many trucking companies such as Armour Transport andConsolidated Fastfrate also offer warehousing, distribution, and logistic services.
The migration towards the use of containers on chassis rather than trailers has enabled these truckingcompanies to use other modes of transportation (rail and short-sea) when service requirements can be met.

Halifax Gateway Council Strategic Plan Page 119
November 2005
Clarke Transport, among others, regularly use international containers (that need to be repositioned) tomove domestic freight by rail.
Express services such as Concord use driving teams to ensure speed of transit and have found that teamruns are more attractive to truck drivers as they are away from home for shorter periods. As a consequence,the driver cost per mile can be slightly less, the equipment utilisation is nearly doubled, and the fleet is keptmuch younger.
The Australian Road-Train has 3 or more trailers and is 53 metres long and can haul up to 115 tons. Theyare not allowed near cities and can only be run from terminal to terminal but can greatly reduce the haulagecosts of freight.
Land Use PlanningHalifax bears some striking resemblances with other traditional Canadian gateway cities such as Montrealand Vancouver, with the growth of all three regions closely tied to the strengths of their respective multi-modal transportation networks. While the growth of these regions has fluctuated with the economic cyclesthat have prevailed over the past century, their current strengths and future economic prosperity lies in theforesight given to the management of each region’s development.
Key to this process is the ability of governments, regional bodies, politicians, residents and businesses towork towards a common vision for the region through integrated regional planning. Given the political andeconomic diversity that exists with each urban centre, this approach enables the development of sustainableland use patterns that are supported by an efficient transportation infrastructure.
Vancouver’s Liveable Region Strategic Plan (LRSP), adopted in 1996, is a prime example of effectiveintegrated regional planning. The LRSP is the Greater Vancouver Regional District’s regional growthstrategy adopted with the formal support of all municipalities in the region in 1996, and recognised in BritishColumbia’s Growth Strategies Act. The primary goal of the plan is to help maintain regional liveability andprotect the environment in the face of anticipated growth.
The plan is used by all levels of government as the framework for making regional land use andtransportation decisions. As the region moves towards becoming an even stronger Asia-Pacific gateway andprepares to welcome the 2010 Winter Olympics, the LRSP provides a vital framework for the prioritisation oftransportation investments in the region. These aim to enable the efficient movement of people and goodsthrough the region while maintaining and enhancing the region’s already recognised high quality of life.
In Montreal, the amalgamation of most municipalities in the Island of Montreal into one municipal entity,coupled with similar processes in surrounding municipalities, has considerably reduced the number ofpolitical entities in the region, and is helping create a common vision for the region that is driving a numberof major integrated planning initiatives. Recently advanced key initiatives in the region include a StrategicPlan for the expanded City of Montreal, a new Regional Plan for the expanded Montreal MetropolitanCommunity, and the current development of an integrated Regional Transportation Plan for the region.
Border FacilitationThe Halifax region is already at the forefront of the latest measures implemented by U.S. Customs andBorder Protection. As one of the initial sites for U.S. CBP officers stationed at the Port of Halifax, the areaserved as a model for the new global standards for the Container Security Initiative. Moreover, it is poisedto become the first new Pre-clearance site for passenger traffic to the United States – an emerging modelthat will see processing of goods and passengers well away from physical borders.
Halifax Gateway Council Strategic Plan Page 120
November 2005
To achieve the full potential for the Halifax Gateway, however, additional process re-engineering is neededto draw upon best and emerging practices from across North American and around the world.
Cruiseship process re-engineering – identification of low-risk categories of passengers, such ascruiseship travellers, has enabled cities like Vancouver and Ft. Lauderdale to successfully reducebarriers for cruise-air transfers. Halifax's growing market for cruise travellers provides opportunities toexplore similar gains in efficiency.
Low-risk passenger programs – CANPASS-Air is currently available at Halifax International Airport asone of seven sites in Canada. Future development of NEXUS-Air and associated programs intransportation security will serve as models of facilitating frequent travellers. Business markets, forexample, may even respond greater to the integration of these programs with land border crossingscards such as NEXUS-Highway.
Perimeter clearance – significant gains in cohesion for Europe resulted from the Schengen agreement.This allowed 15 countries to become ‘domestic’ markets for travel. As North America becomesincreasingly integrated, a Perimeter Clearance approach will be needed to deal effectively with U.S.and Canadian clearance of passengers and goods at first point of arrival. Clearance in Halifax, forexample, could signify clearance into the whole of North America. Similarly, a significant reduction inborder delays could bring markets for Halifax closer in access time.
These and other border practices can help to reduce the barriers to legitimate trade and travel, and ensurefull competitiveness of the Halifax Gateway vis-à-vis competing regions.
Air PolicyCanada requires excellent air transportation to support the export of Canadian goods to global markets andenhance tourism. In many ways, Canada’s economic prosperity depends on effective and efficient airservice links. The following sections examine the approaches being used by other jurisdictions to liberalizetheir air policies and promote expansion of their air services.
Domestic air policy – Perhaps the best practice in domestic airline policy is Australia. Australiaderegulated its airline industry, privatised Qantas, and unilaterally introduced right of establishment,thereby permitting foreign investors (including a foreign airline) to establish a domestic Australian aircarrier.
Under this policy, the Virgin Group established Virgin Blue, a U.K. owned and controlled domesticAustralian airline. Further, Australia and New Zealand have established a common aviation marketwhich allows unlimited cabotage and trans-Tasman air services. Thus, Qantas is able to (and does)operate domestic New Zealand flights. Air New Zealand is able to operate domestic Australian flights,but chooses to not do so. There was a period of shakeout in the Australian industry, when a four wayrace between Qantas, Virgin Blue, Ansett, and Impulse was ultimately settled, with Qantas acquiringImpulse (and converting it to a low cost subsidiary, JetStar) and Ansett exiting the industry viabankruptcy. Today, each of Qantas, Virgin Blue, and JetStar are profitable, offering lower prices thanprevailed before, and serving much higher levels of traffic. It should also be pointed out that under itsright of establishment policy, Australia now has foreign-owned regional airlines, providing importantdirect and feeder service to, from, and between low traffic points. Australia now has a stable, profitablelow fare airline industry.
International air policy – Perhaps the emerging best practice in international air policy will be theEuropean Union (EU). Traditionally, individual European nations negotiated their own bilateral

Halifax Gateway Council Strategic Plan Page 121
November 2005
agreements with non-European foreign states, and many of these were quite restrictive. During thepast two years, the European Commission (EC) has been given a number of mandates to negotiateagreements on behalf of all EU member states with non-European foreign powers. The EC approach isone which seeks to achieve two liberal objectives. First, it seeks treaties which allow the designation ofany European carrier to serve a route from any nation in the EU. Thus, in the first such treaty, Bruneiwould accept the designation of British Airways to fly from Germany to Brunei. The second objective ofthe EC is to seek treaties which allow European investors to invest in and control airlines of othernations (e.g. the EC is seeking right of establishment).
It should also be pointed out that the International Civil Aviation Organisation (ICAO), the UnitedNations’ affiliated international agency responsible for commercial aviation, has recommended thatnations replace provisions in air service treaties which require domestic ownership and control of aninternational airline with a provision which merely requires that designated airlines have their principleplace of business in the nation making the designation. Thus, an airline based in Country A, but ownedand controlled by citizens of Country B, could be designated for service from A to B (or A to C).Effectively, ICAO is recommending all air service agreements grant right of establishment to all othernations.
Rail PolicyThe issue of competitive rail access, which would permit trains of one railway company to run on tracksowned by another railway, has been raised in Canada and elsewhere in the world. Shippers are strongsupporters of open access, while track owners are generally strongly opposed.
Government responses to requests to impose open access on track vary by country. Some countries (e.g.Canada) do not legislate access, and thus train operators must voluntarily reach agreements on runningrights with track owners (e.g. Rocky Mountaineer has a voluntary agreement with CP Rail). The U.S.generally does not impose open access on carriers, although voluntary agreements have been reached onsome track involved in mergers between railways. Other countries legislate access by separating railwaysinto separate companies for track ownership and running trains (e.g. Sweden, U.K., and Australia). In thesecases a track access rate may need to be imposed by a regulator if a rate cannot be agreed to by theparties. Separating a railway into separate track and train operation companies is referred to as verticalseparation.
Fundamental changes to rail policy have been made in the past several years in a number of countries. TheEuropean Union has been leading the way in an attempt to revive the ailing European rail freight industry byproviding for open access. While the EU has agreed on general policy directions, the member states are atdifferent stages. Sweden and the United Kingdom are the most advanced, both having created separatecompanies for the provision of rail track services versus the operation of trains. Australia has also pursuedthis approach in New South Wales and on the national network, although NSW appears to be reintegratingtrack and train operation except for the heavy haul coal railways. The concept of separating infrastructurefrom operations has been endorsed by the World Bank, which argues that this can lead to lower costs,create competition, improve the focus on service, and clarify public policy.
There are, however, fundamental differences between Canada’s rail system and those in the U.K., Sweden,and Australia:
Performance – the U.K., Swedish, and Australian railway industries were in much weaker financialposition than Canada’s is, requiring government subsidies to survive while still losing much of theirtraffic to trucks. Moreover, their productivity was a fraction of that of the Canadian railways.
Halifax Gateway Council Strategic Plan Page 122
November 2005
Ownership – the railways in these countries were government-owned, whereas Canada’s railways areprivately held. The view of CN Rail and CP Rail is that allowing access would amount to expropriationof capital.
Traffic base – the U.K. and Sweden (with limited exceptions) carry primarily passenger traffic, whereasin Canada, freight transport dwarfs passenger volumes. Australia is more similar to Canada, though itssystem is far more fragmented than Canada’s.
There is some evidence that these policy changes have had some success and resulted in the emergenceof greater competition in transportation services. This, in turn, led to improved services and lower rates,which drove increased rail market share. However, the results to date have not been conclusively positive,and problems have been cited in the U.K. (provision of track services), Australia (excessive complexity), andSweden (limited competition and continued reliance on subsidies). There are also questions about theimpact of vertical separation if Canada pursued the strategy and the U.S. did not. The track characteristicsand operating procedures of CN Rail and CP Rail also differ in important respects.
The evidence at this time does not make the case for a dramatic change in Canadian rail policy. Indeed, theCTA Review Panel rejected vertical separation and recommended that some increased competitive accesswith solicitation be allowed by enhancing running rights, but only as ‘an extraordinary step where there isclear evidence that the railway providing the service is not acting in the public interest.’ In the revisions tothe Canada Transportation Act currently before Parliament, such provisions were not incorporated.
One potential model for consideration should rail access to the Halifax Gateway become restrictive is theU.S. provision for access by other carriers to rail line serving terminals. The U.S. code states that if theSurface Transport Board (STB) finds such access ‘to be practicable and in the public interest withoutsubstantially impairing the ability of the rail carrier owning the facilities to handle its own business’ suchaccess could be granted. There are provisions for the STB to establish conditions and compensation forrequired access should the parties be unable to reach agreement.
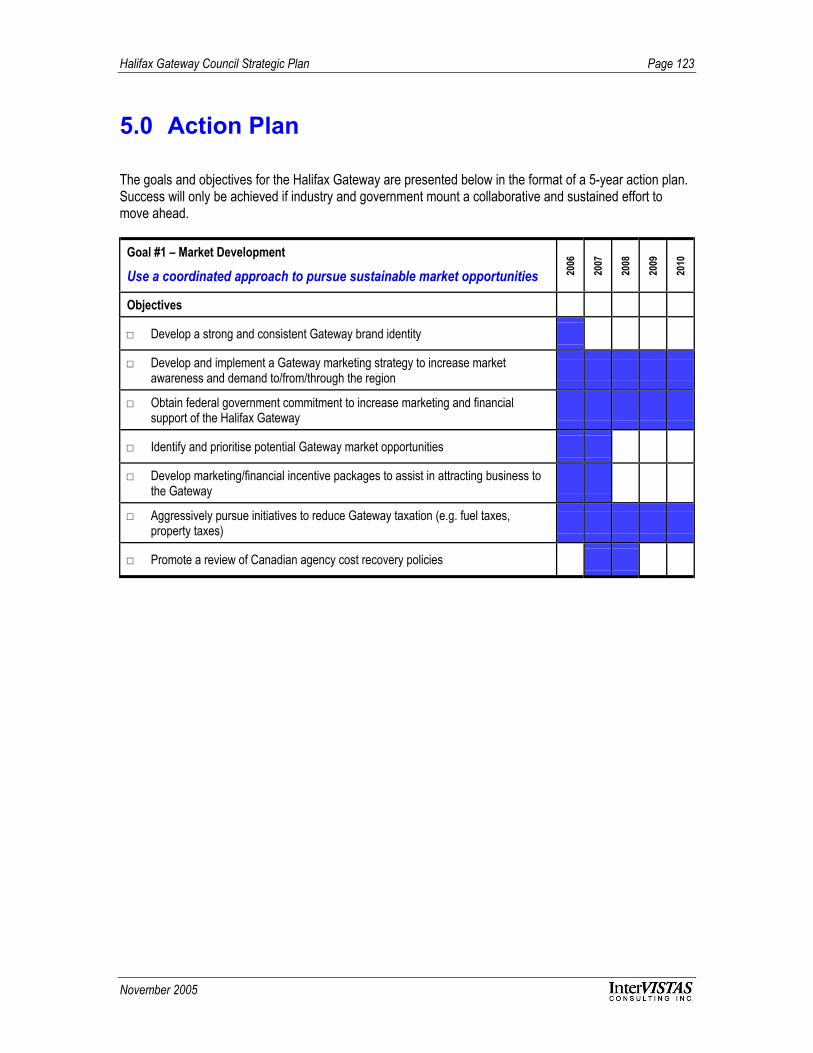
Halifax Gateway Council Strategic Plan Page 123
November 2005
5.0 Action Plan
The goals and objectives for the Halifax Gateway are presented below in the format of a 5-year action plan.Success will only be achieved if industry and government mount a collaborative and sustained effort tomove ahead.
Goal #1 – Market Development
Use a coordinated approach to pursue sustainable market opportunities 2006
2007
2008
2009
2010
Objectives
□ Develop a strong and consistent Gateway brand identity
□ Develop and implement a Gateway marketing strategy to increase marketawareness and demand to/from/through the region
□ Obtain federal government commitment to increase marketing and financialsupport of the Halifax Gateway
□ Identify and prioritise potential Gateway market opportunities
□ Develop marketing/financial incentive packages to assist in attracting business tothe Gateway
□ Aggressively pursue initiatives to reduce Gateway taxation (e.g. fuel taxes,property taxes)
□ Promote a review of Canadian agency cost recovery policies

Halifax Gateway Council Strategic Plan Page 124
November 2005
Goal #2 – Infrastructure Development and Funding
Ensure integrated infrastructure planning and aligned priorities 2006
2007
2008
2009
2010
Objectives
□ Develop a master plan for the Port of Halifax
□ Acquire and remediate land adjacent to Fairview Cove container terminal
□ Build a common use air cargo facility at Halifax International Airport
□ Convert the existing rail cut for truck/commuter traffic use and/or build an inlandterminal to reduce truck traffic in the downtown core
□ Upgrade the infrastructure at the port’s container terminals to allow for faster truckturnaround times
□ Build group staging areas at Halifax International Airport to support cruisehomeport operations
□ Improve access and widen apron areas at Piers 20-22 to support cruise homeportoperations
□ Upgrade rail facilities and services
□ Complete construction of limited access highways
□ Obtain community support for the Gateway’s long-term growth objectives
□ Ensure the protection of airport buffer lands
□ Work with business partners to protect strategic industrial locations
□ Work with business partners to pursue changes to allow new sources of long-terminvestment capital (e.g. tax exempt bond financing)
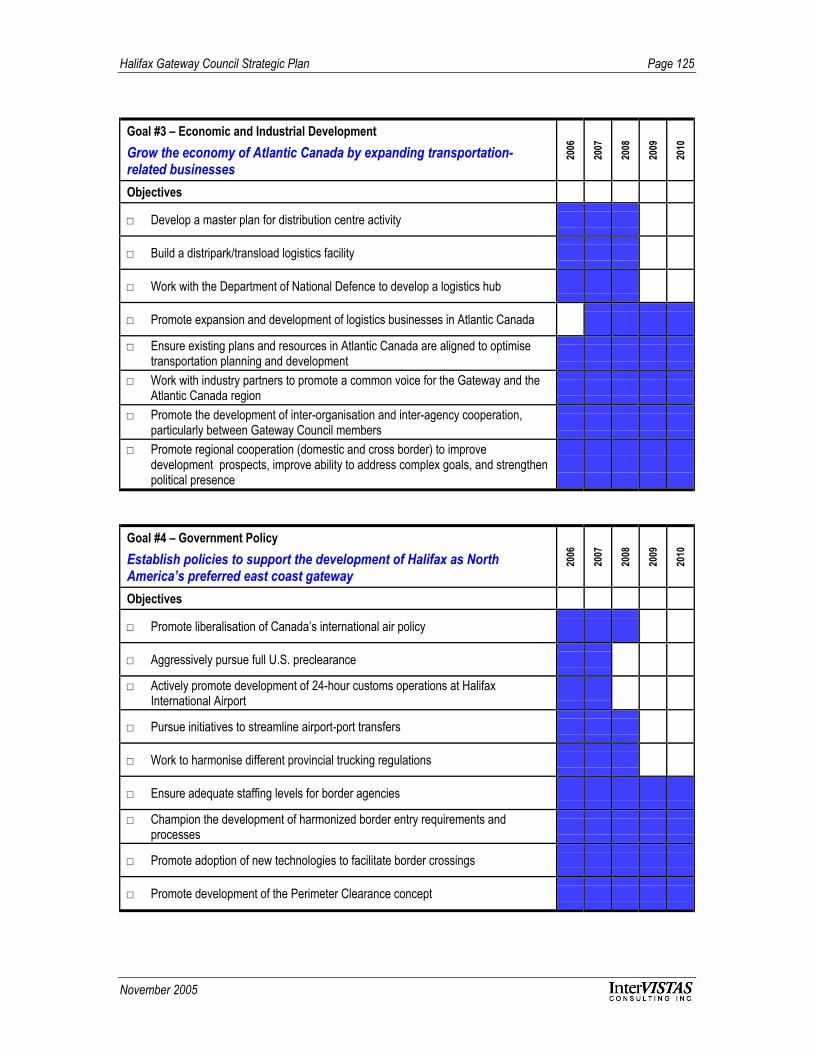
Halifax Gateway Council Strategic Plan Page 125
November 2005
Goal #3 – Economic and Industrial DevelopmentGrow the economy of Atlantic Canada by expanding transportation-related businesses
2006
2007
2008
2009
2010
Objectives
□ Develop a master plan for distribution centre activity
□ Build a distripark/transload logistics facility
□ Work with the Department of National Defence to develop a logistics hub
□ Promote expansion and development of logistics businesses in Atlantic Canada
□ Ensure existing plans and resources in Atlantic Canada are aligned to optimisetransportation planning and development
□ Work with industry partners to promote a common voice for the Gateway and theAtlantic Canada region
□ Promote the development of inter-organisation and inter-agency cooperation,particularly between Gateway Council members
□ Promote regional cooperation (domestic and cross border) to improvedevelopment prospects, improve ability to address complex goals, and strengthenpolitical presence
Goal #4 – Government PolicyEstablish policies to support the development of Halifax as NorthAmerica’s preferred east coast gateway
2006
2007
2008
2009
2010
Objectives
□ Promote liberalisation of Canada’s international air policy
□ Aggressively pursue full U.S. preclearance
□ Actively promote development of 24-hour customs operations at HalifaxInternational Airport
□ Pursue initiatives to streamline airport-port transfers
□ Work to harmonise different provincial trucking regulations
□ Ensure adequate staffing levels for border agencies
□ Champion the development of harmonized border entry requirements andprocesses
□ Promote adoption of new technologies to facilitate border crossings
□ Promote development of the Perimeter Clearance concept