half year results - microsoftnexgroup.blob.core.windows.net/media/1857/half-year-results-2014... ·...
TRANSCRIPT

Half Year ResultsFor six months ended
30 June 2014
30 July 2014

Cautionary statement
This Review is intended to focus on matters which are relevant to the interests of shareholders in the
Company. The purpose of the Review is to assist shareholders in assessing the strategies adopted and
performance delivered by the Company and the potential for those strategies to succeed. It should not
be relied upon by any other party or for any other purpose.
Forward looking statements are made in good faith, based on a number of assumptions concerning
future events and information available to Directors at the time of their approval of this report. These
forward looking statements should be treated with caution due to the inherent uncertainties underlying
any such forward looking information. The user of these accounts should not rely unduly on these
forward looking statements, which are not a guarantee of performance and which are subject to a
number of uncertainties and other facts, many of which are outside of the Company’s control and could
cause actual events to differ materially from those in these statements. No guarantee can be given of
future results, levels of activity, performance or achievements
2
Unless otherwise stated, all profit, margin and EPS data refer to normalised results, which can be found on the face of the Group Income
Statement in the first column. The definition of normalised profit is as follows: IFRS result excluding charges for intangible asset amortisation,
exceptional items, loss on disposal of a business and tax relief thereon. The Board believes that the normalised result gives a better indication of
the underlying performance of the Group.

Delivering our strategy
o Achieve world class safety standards
o Achieve operational excellence
o Grow in each of our core businesses
o Re-establish ourselves in rail
3* Adjusted for one-off events and currency
50% improvement in 3 years
Punctuality and customer service
improving across the business; best-
in-class achieved across the Group
Normalised profit up by £3.8m*
Won Essex Thameside: 15 years,
£4bn in revenue
German Rail, Middle East, Transit
Net debt reduced by £100m since
Petermann acquisition
Group ROCE improves to 11.8%;
North America Return on Assets
+90bps to 22.6%
o Establish new sources of income
o Reduce our debt
o Improve our ROCE
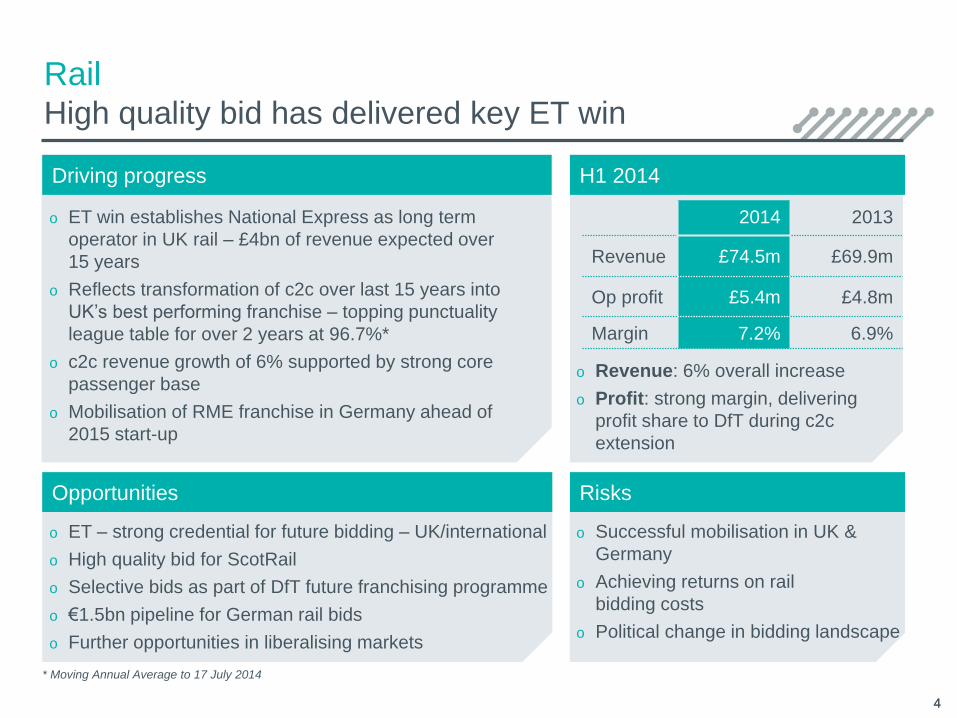
o ET win establishes National Express as long term
operator in UK rail – £4bn of revenue expected over
15 years
o Reflects transformation of c2c over last 15 years into
UK’s best performing franchise – topping punctuality
league table for over 2 years at 96.7%*
o c2c revenue growth of 6% supported by strong core
passenger base
o Mobilisation of RME franchise in Germany ahead of
2015 start-up
H1 2014
o ET – strong credential for future bidding – UK/international
o High quality bid for ScotRail
o Selective bids as part of DfT future franchising programme
o €1.5bn pipeline for German rail bids
o Further opportunities in liberalising markets
o Successful mobilisation in UK &
Germany
o Achieving returns on rail
bidding costs
o Political change in bidding landscape
Opportunities Risks
Driving progress
o Revenue: 6% overall increase
o Profit: strong margin, delivering
profit share to DfT during c2c
extension
RailHigh quality bid has delivered key ET win
4
2014 2013
Revenue £74.5m £69.9m
Op profit £5.4m £4.8m
Margin 7.2% 6.9%
* Moving Annual Average to 17 July 2014
4

Passenger revenue growth forecast
Non-passenger revenue growth forecast
Premium payments* to DfT
A high quality innovative bid
RailEssex Thameside: a new era of rail operations
o Driving revenue through quality, innovation &
customer service
o New timetable and fleet upgrades that add
significant extra capacity
o New technology to support customers & operations
o Ground-breaking commitment to our customers
o Significant opportunities in station management; e.g.
Fenchurch Street
o Investing in passenger growth
o £50m up-front investment in stations, technology &
customer experience
o Strong financial bid that adds value for all
stakeholders
o Annual revenue growth rate consistent with historic
trends ~7.5%; early growth driven by initiatives
o Non-passenger revenue from retail and station
management
o £1.5bn premium to DfT*; £33m in first full year
* 2014 prices. Basis: RPI +1%, Control Period 4
0%
5%
10%
15%
5
Year ‘14 ‘15 ‘16 ‘17 ‘18 ‘19 ‘20 ’21
Premium (£m) 10 33 47 60 74 81 83 90
Year ‘22 ‘23 ‘24 ‘25 ‘26 ‘27 ‘28 ‘29
Premium (£m) 103 116 121 127 132 143 149 97
Long term average
0%
20%
40%
60%
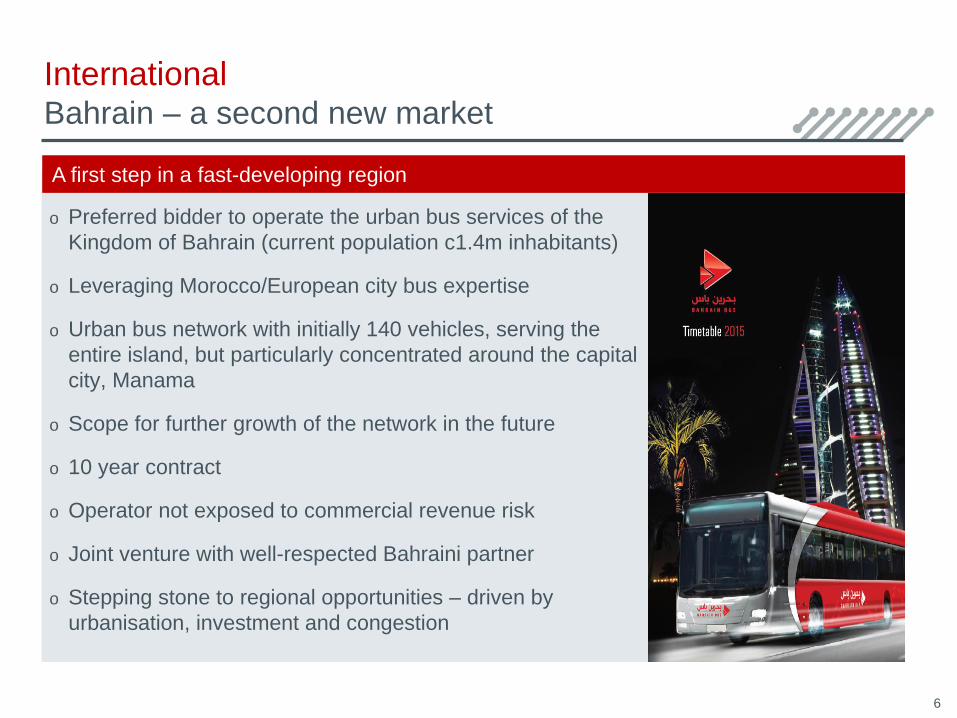
A first step in a fast-developing region
International Bahrain – a second new market
o Preferred bidder to operate the urban bus services of the
Kingdom of Bahrain (current population c1.4m inhabitants)
o Leveraging Morocco/European city bus expertise
o Urban bus network with initially 140 vehicles, serving the
entire island, but particularly concentrated around the capital
city, Manama
o Scope for further growth of the network in the future
o 10 year contract
o Operator not exposed to commercial revenue risk
o Joint venture with well-respected Bahraini partner
o Stepping stone to regional opportunities – driven by
urbanisation, investment and congestion
6
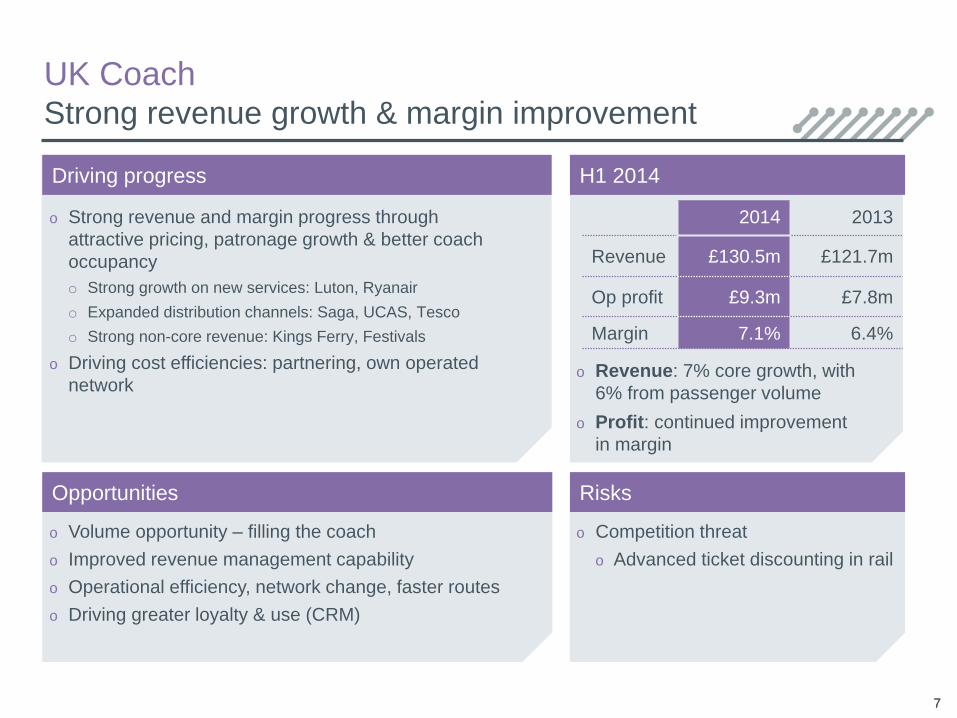
UK Coach Strong revenue growth & margin improvement
o Strong revenue and margin progress through
attractive pricing, patronage growth & better coach
occupancy
o Strong growth on new services: Luton, Ryanair
o Expanded distribution channels: Saga, UCAS, Tesco
o Strong non-core revenue: Kings Ferry, Festivals
o Driving cost efficiencies: partnering, own operated
network
7
H1 2014
2014 2013
Revenue £130.5m £121.7m
Op profit £9.3m £7.8m
Margin 7.1% 6.4%
o Volume opportunity – filling the coach
o Improved revenue management capability
o Operational efficiency, network change, faster routes
o Driving greater loyalty & use (CRM)
o Competition threat
o Advanced ticket discounting in rail
Opportunities Risks
Driving progress
o Revenue: 7% core growth, with
6% from passenger volume
o Profit: continued improvement
in margin
7
H1 2014
Creating opportunities Risks
Driving progress
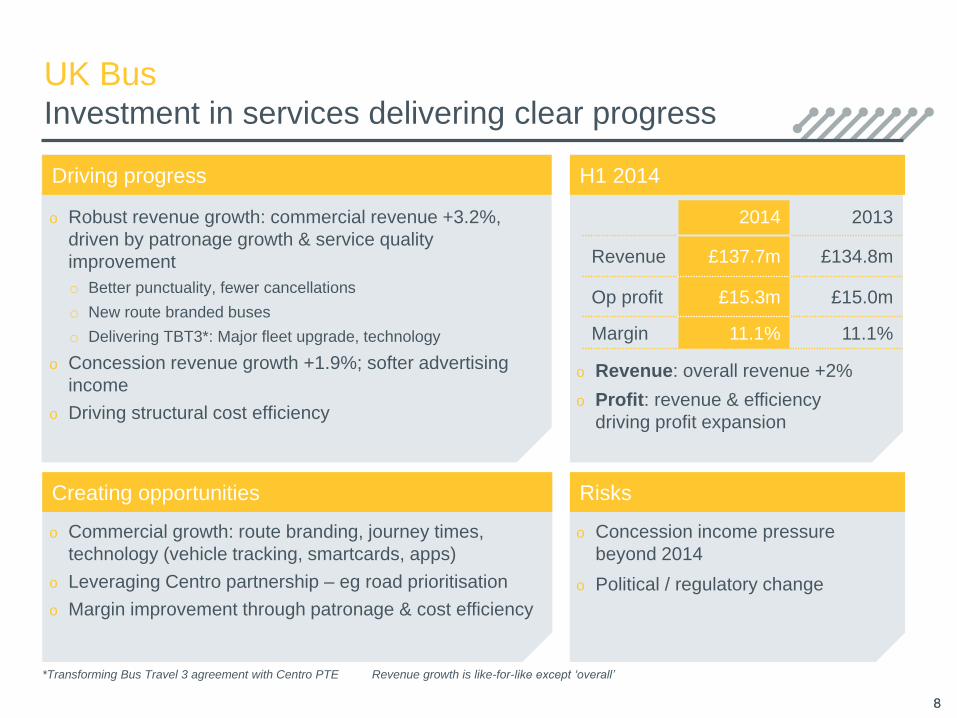
UK Bus Investment in services delivering clear progress
8
2014 2013
Revenue £137.7m £134.8m
Op profit £15.3m £15.0m
Margin 11.1% 11.1%
*Transforming Bus Travel 3 agreement with Centro PTE Revenue growth is like-for-like except ‘overall’
8
o Robust revenue growth: commercial revenue +3.2%,
driven by patronage growth & service quality
improvement
o Better punctuality, fewer cancellations
o New route branded buses
o Delivering TBT3*: Major fleet upgrade, technology
o Concession revenue growth +1.9%; softer advertising
income
o Driving structural cost efficiency
o Commercial growth: route branding, journey times,
technology (vehicle tracking, smartcards, apps)
o Leveraging Centro partnership – eg road prioritisation
o Margin improvement through patronage & cost efficiency
o Concession income pressure
beyond 2014
o Political / regulatory change
o Revenue: overall revenue +2%
o Profit: revenue & efficiency
driving profit expansion
H1 2014
Creating opportunities Risks
Driving progress
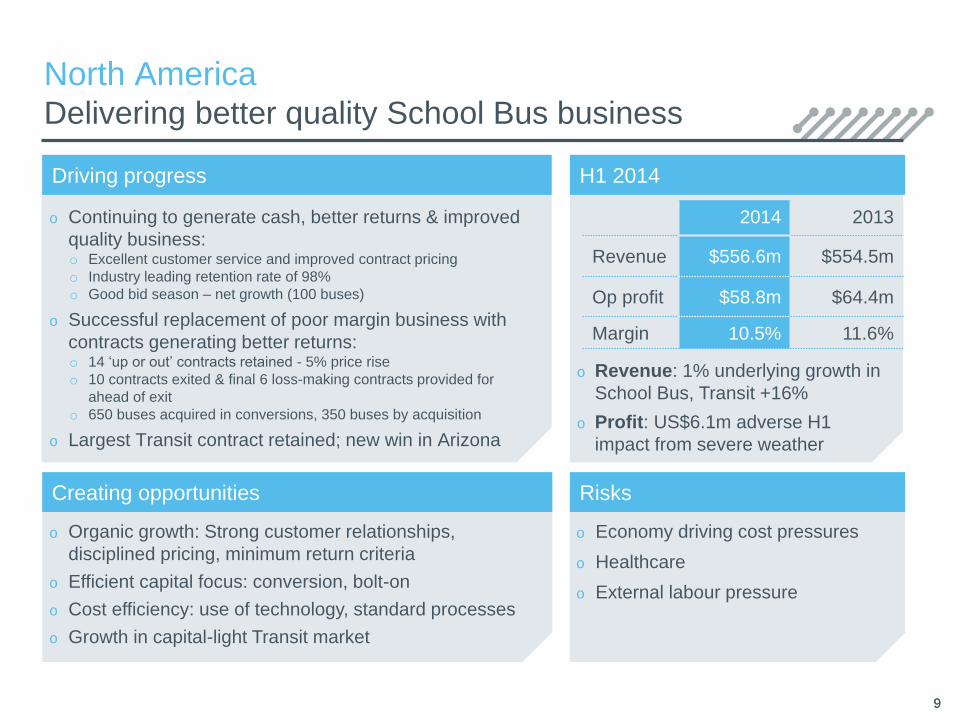
North America Delivering better quality School Bus business
9
2014 2013
Revenue $556.6m $554.5m
Op profit $58.8m $64.4m
Margin 10.5% 11.6%
9
o Continuing to generate cash, better returns & improved
quality business:o Excellent customer service and improved contract pricing
o Industry leading retention rate of 98%
o Good bid season – net growth (100 buses)
o Successful replacement of poor margin business with
contracts generating better returns:o 14 ‘up or out’ contracts retained - 5% price rise
o 10 contracts exited & final 6 loss-making contracts provided for
ahead of exit
o 650 buses acquired in conversions, 350 buses by acquisition
o Largest Transit contract retained; new win in Arizona
o Organic growth: Strong customer relationships,
disciplined pricing, minimum return criteria
o Efficient capital focus: conversion, bolt-on
o Cost efficiency: use of technology, standard processes
o Growth in capital-light Transit market
o Economy driving cost pressures
o Healthcare
o External labour pressure
o Revenue: 1% underlying growth in
School Bus, Transit +16%
o Profit: US$6.1m adverse H1
impact from severe weather

H1 2014
Creating opportunities Risks
Driving progress
o Strong growth in Morocco +20%
o 20 new buses added in Agadir & Marrakech
o New bus fleet launched in Tangiers in June
o Good urban bus performance in Spain
o Madrid contract extended to 2024
o Coach competition from high speed rail stepped up:
o Revenue management introduced on competed corridors
o Growth in regional coach operations
o ‘Alsa Futura’ programme delivering cost efficiencies
o Winning & retaining contracts
o Selected urban & regional opportunities in Spain
o Morocco – potential to add new cities
o Intercity coach concession structure confirmed
o Greater rail competition
o Intercity concession renewal
(not until 2016)
o Continued austerity impact on
urban budgets
o Revenue: overall -1%
o Profit: Resilient - €2m impact from
Madrid industrial action in Q1
Spain
Urban & regional growth mitigates intercity pressure
10
2014 2013
Revenue €319.3m €321.2m
Op profit €38.6m €40.8m
Margin 12.0% 12.7%
10

Spain
Intercity responding well to recovery actions
1111
o 8 competed corridors - €140m annual
revenue
o 5 compete with high speed rail – price & speed
o 3 compete with regional rail – price
o Average 27% price reduction by Renfe to fill
seats & cut deficit
o Alsa revenue on competed corridors -11%
revenue, -6% patronage
o Action taken on 80 flows within 8 corridors
o Dynamic revenue management introduced
o Differentiated fleet & service offerings
o Journey time improvements implemented
o UK skills & capability leveraged
o 2% reduction in kms operated
o Steady improvement seen post-action
o Improving passenger & revenue trend
o YOY passenger growth on 4 corridors
8 main corridors performance
-10.0% -6.5% -4.7%-6.5% -3.4% -0.3%
May June 1 to 18 July
RevenuePassengers
€ cents / kmAverage ticket
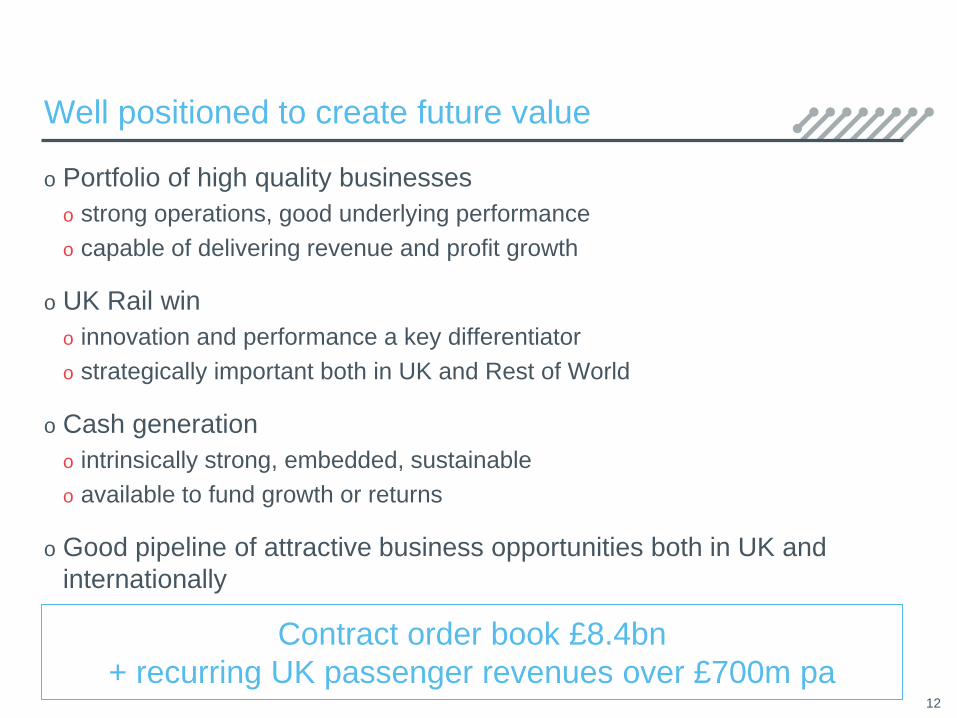
Well positioned to create future value
o Portfolio of high quality businesses
o strong operations, good underlying performance
o capable of delivering revenue and profit growth
o UK Rail win
o innovation and performance a key differentiator
o strategically important both in UK and Rest of World
o Cash generation
o intrinsically strong, embedded, sustainable
o available to fund growth or returns
o Good pipeline of attractive business opportunities both in UK and
internationally
12
Contract order book £8.4bn
+ recurring UK passenger revenues over £700m pa

13
£m H1 2014 H1 2013
Revenue 939.5 956.7
Operating profit 89.5 97.2
Net finance costs (24.2) (25.8)
Associates 0.2 0.4
Profit before tax 65.5 71.8
First half 2014:Profit impacted by one-off events & currency
Basic EPS: Non-rail 9.1p 10.1p
Rail 0.8p 0.7p
Group 9.9p 10.8p
Interim dividend 3.35p 3.25p
13

14
RevenueGood organic growth delivered
957951
978
940
(6)
243
(38)
H1 2013
revenue
Organic
growth
Currency
translation
H1 2014
revenue at
constant
currency
H1 2014
revenue
Underlying
revenue
base
One-off
events
Acquisition
14
o 2% underlying revenue increase
o -4% impact from stronger Sterling:
o US$ moved from $1.55 H1/13 to $1.67 H1/14
o € moved from €1.18 H1/13 to €1.22 H1/14

Revenue (YOY change*) Operating profit
£262m
£333m
£138m
£131m
£75m
Spain (1)%
North America +1%
UK Bus +2%
UK Coach +7%
Rail +6%
Operating profit
UK divisions achieved profit growth
H1 2014 H1 2013
Spain €38.6m €40.8m
North America $58.8m $64.4m
UK Bus £15.3m £15.0m
UK Coach £9.3m £7.8m
Rail £5.4m £4.8m
German coach £(1.4)m £(0.9)m
Centre £(6.0)m £(5.7)m
Group £89.5m £97.2m
* Underlying year-on-year change shown in local currency (excludes German coach)
15

o 1.5% real cost reduction delivered
o £6m profit increase from organic growth, primarily in UK
o £5m adverse impact from stronger Sterling:
o Each US$ cent impacts full year by ~£0.3m
o Each € cent impacts full year by ~£0.6m
16
Normalised operating profitOrganic growth & cost efficiency have offset inflation
16
9792 95
90
(5)
6
1
(17)
14(1)
(5)
2013
operating
profit
One-off
events
2014
profit
base
Cost
inflation
H1 2014
operating
profit
H1 2014
profit at
constant
currency
Cost
efficiency
Organic
growth
M&A/
new
business
FXOther
16
£m

Operating cash flow*
Superior cash and returnsWe continue to generate excellent free cash flow
Operating Profit %
Spain 128%
North America 155%
UK Bus 110%
UK Coach 185%
Rail -%
Group 132%
£m
H1 2014 H1 2013
EBITDA 139.9 153.6
Working capital 7.5 27.6
Replacement capex (25.3) (43.3)
Pension deficit (3.8) (4.8)
Operating cashflow 118.3 133.1
Tax/interest/other (38.0) (38.6)
Free cash flow 80.3 94.5
o Disciplined fleet investment – continue to improve capital deployment
o Continued working capital improvement - public body debt in Spain reduced further
o Operating cash generation at 132% of operating profit – North America continues to
drive progress
o Free cash flow over £80m
* Operating cash flow is intended as the cash equivalent of normalised operating profit
17

11.9
2.3
13.5
Development -UK rail
Development -International
Rationalisation
Exceptional costsCreating future growth & driving efficiency savings
Exceptional cost breakdowno Significant spend of £27.7m
o Investment in new opportunities: £14.2m
o UK rail – completed 3 bids
o Won £4bn 15-yr Essex Thameside
o Strong Scotrail bid in evaluation
o German rail bids
o Steady flow of bids
o Prequalified for 4 bids, including Berlin
o International development
o Preferred bidder in Bahrain
o Expect 2 other bids in 2014
o Rationalisation driving future efficiencyo N America contract strategy - £3m pa benefit
o UK restructuring - £2m pa benefit
o ‘Alsa Futura’ programme - £1m pa cost benefit
& key competitive revenue defence
o No exceptional costs planned for 2015
onwards
18
£m

Good debt maturity profile
Balance sheet remains flexibleNet debt reduced to £729m
o Net debt reduced from year end by £17m to
£729m
o Robust financial strategy:
o Prudent gearing policy: 2-2.5x EBITDA
o Target to reduce gearing towards 2x by
end of year
o Regular dividend covered 2x non-rail EPS
o Strong commitment to IG debt rating
o Strong risk planning – fuel mostly hedged
to 2016 & pension deficit plan in place
o £426m committed headroom*
* Available cash and undrawn committed facilities at 30 June 2014
35 27 20
384
1711
228
63
410
14 15 16 17 18 19 20 21
Drawn Available*
Gearing Ratios H1 2014 H1 2013 Covenant
Net debt/EBITDA 2.5x 2.5x <3.5x
Interest cover 6.0x 6.3x >3.5x
Ratings Grade Outlook
Moodys Baa3 Stable
Fitch BBB- Stable
19

20
Summary
We are making sound progress in our strategy
Delivering
operational
excellence
Generating
superior cash &
returns
Creating new
business
opportunities
2014
20
o Solid platform of core divisions
o Growth established in UK
o Driving cash and returns in N America
o Managing Spain
o Strong cash generation
o £80 million of free cash flow; on track for £150 million this year
o Leveraging our expertise – £5 billion of new business secured

Appendix

22
H1 2014 underlying revenue growth
Yield Volume RevenueNetwork
Efficiency*LFL
growth
Spain
Transport Spain 2% (3)% (1)% 0% (1)%
Transport Morocco (3)% 23% 20% (19)% 1%
Non-passenger 5%
Total1 (1)%
North America1 0%
UK Bus
Commercial 1% 2% 3% 0% 3%
Concession 2%
Total1 2%
UK Coach
Core NE network 1% 6% 7% 0% 7%
Other 8%
Total1 7%
c2c 4% 2% 6%
* Decrease / (increase) in mileage operated1 Reported revenue
22

€41m(€4)
(€1)
€3m
(€2m)
€2m
€39m
Spain
Spain – operating profit bridge
23
Revenue H1 2014
H1 2013
Operating
profit
StrikeCost
inflation
H1 2014
Operating
profit
Cost
efficiencies
Other
23
Revenue
58%34%
3%5%
Passenger Contract
Subsidy Other
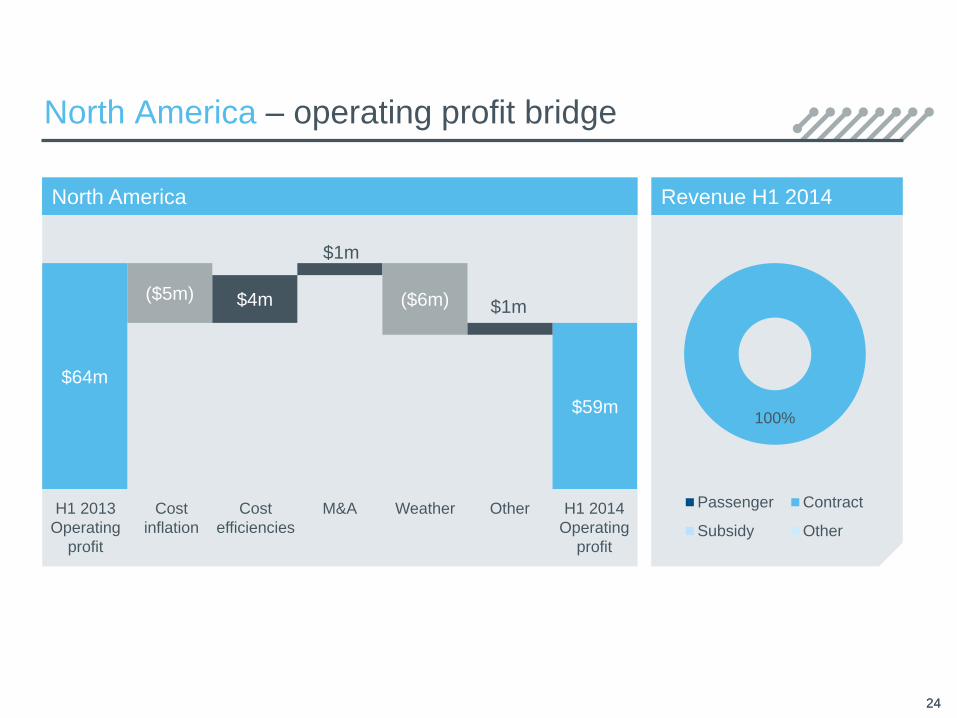
North America
North America – operating profit bridge
24
Revenue H1 2014
100%
Passenger Contract
Subsidy Other
$64m
$59m
($5m) $4m
$1m
($6m) $1m
M&ACost
efficiencies
Cost
inflation
Weather
24
OtherH1 2013
Operating
profit
H1 2014
Operating
profit
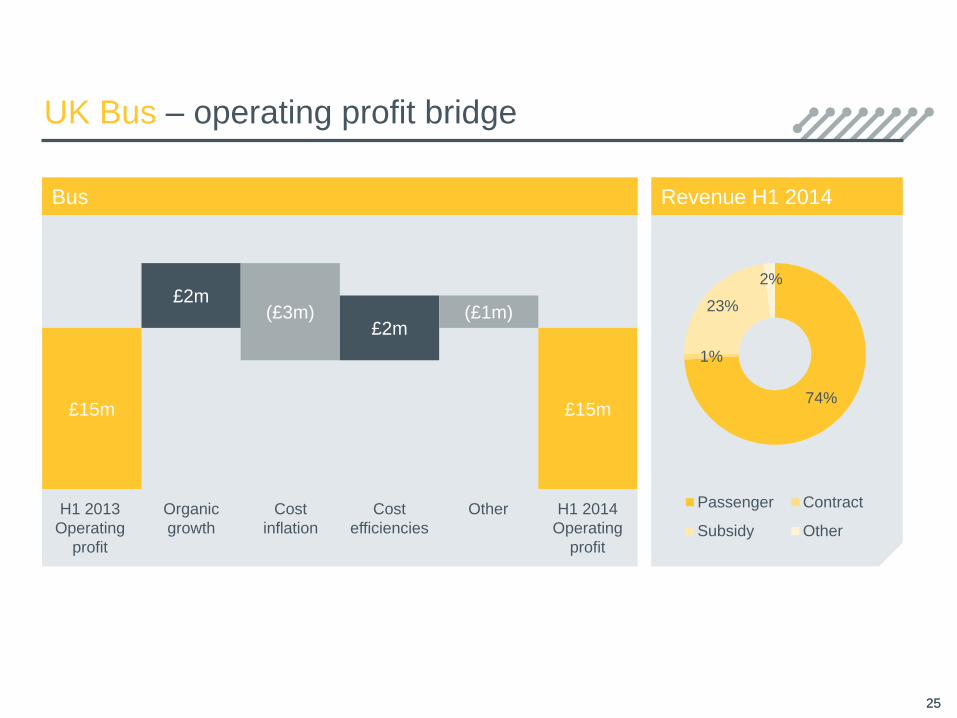
Bus
UK Bus – operating profit bridge
25
Revenue H1 2014
74%
1%
23%
2%
Passenger Contract
Subsidy Other
Organic
growth
£15m £15m
£2m(£3m)
£2m(£1m)
OtherCost
inflation
Cost
efficiencies
25
H1 2013
Operating
profit
H1 2014
Operating
profit

Coach
UK Coach – operating profit bridge
26
Revenue H1 2014
83%
9%
8%
Passenger Contract
Subsidy Other
H1 2013
Operating
profit
Cost
inflation
Cost
efficiencies
Growth/
new routes
£8m£9m
£2m(£3m)
£2m
H1 2014
Operating
profit
26
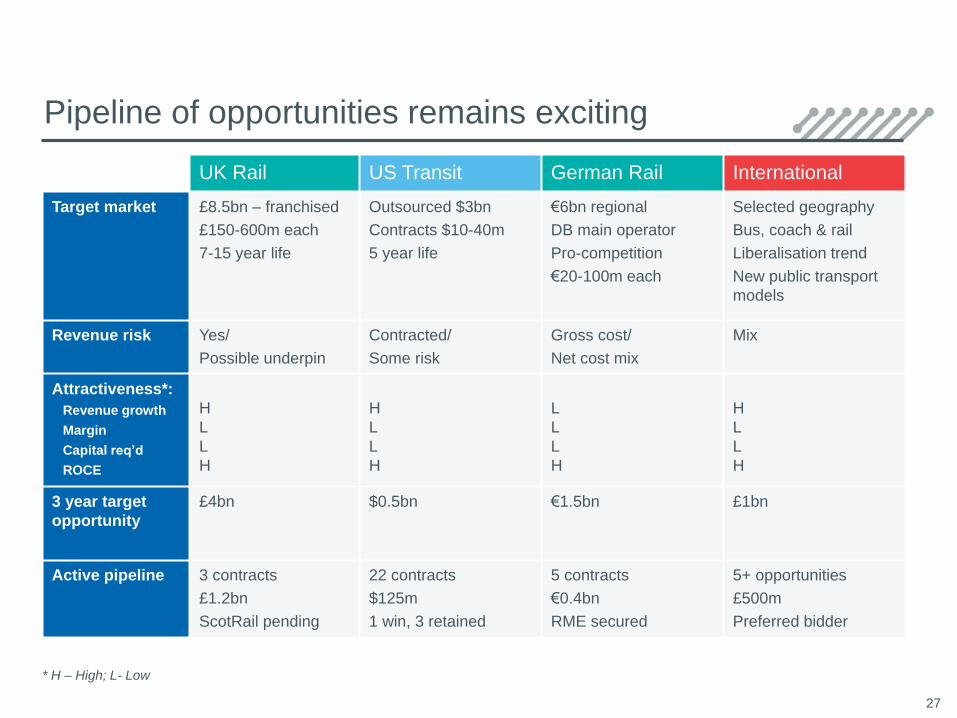
Pipeline of opportunities remains exciting
27
UK Rail US Transit German Rail International
Target market £8.5bn – franchised
£150-600m each
7-15 year life
Outsourced $3bn
Contracts $10-40m
5 year life
€6bn regional
DB main operator
Pro-competition
€20-100m each
Selected geography
Bus, coach & rail
Liberalisation trend
New public transport
models
Revenue risk Yes/
Possible underpin
Contracted/
Some risk
Gross cost/
Net cost mix
Mix
Attractiveness*:
Revenue growth
Margin
Capital req’d
ROCE
H
L
L
H
H
L
L
H
L
L
L
H
H
L
L
H
3 year target
opportunity
£4bn $0.5bn €1.5bn £1bn
Active pipeline 3 contracts
£1.2bn
ScotRail pending
22 contracts
$125m
1 win, 3 retained
5 contracts
€0.4bn
RME secured
5+ opportunities
£500m
Preferred bidder
* H – High; L- Low

Risk managementFuel risk largely fixed until 2016
o Future year on year savings locked in (2013: 49p)
o Contracted revenue policy:
o Extend cover for a minimum of 2 years
o Longer hedging considered, subject to market liquidity & contract life
o Commercial revenue policy:
o Minimum 15 months cover - provides a buffer for retail fare increases
2014 2015 2016
% hedged* 100% 100% 92%
Price per litre 49p 47p 44p
Fuel Hedging
28
* Of addressable volume (c240 million litres)

Risk managementPension deficit plan in place through 2017
£m
Surplus /(Deficit)
H1 2014
Surplus /(Deficit)
31 Dec 2013
Op. profit (charge)
H1 2014
Op. profit (charge)
H1 2013
UK Bus (41.1) (40.8) (2.1) (1.7)
UK Coach 15.7 12.6 0.3 -
UK Rail 5.0 (0.4) (1.3) (1.3)
Other (1.6) (1.5) - -
29
821
588 606 625
863
619 646 658
40 12 10 11
(2) (19) (30) (22)
2011 2012 2013 2014
Assets
Liabilities
Members Share
Surplus/(Deficit)
Pensions £m (IAS19)

National Express Group PLC