half year results 2020 - lamprell
TRANSCRIPT
Half yearresults 2020
1 October 2020

Disclaimer
2
This presentation contains certain forward-looking statements relating to the business,
financial performance and results of the Company and/ or the industry in which it operates.
Forward-looking statements concern future circumstances and results and other
statements that are not historical facts, sometimes identified by the words “believes”,
“expects, “predicts”, ”intends”, “projects”, “plans” “estimates”, “aims”, “foresees”,
anticipates”, “targets” and similar expressions. The forward-looking statements, contained
in this document, including assumptions, opinions and views of the Company or cited from
third party sources are solely opinions and forecasts which are uncertain and subject to
risks. A multitude of factors can cause actual events to differ significantly from any
anticipated development. Neither the Company nor any of its officers or employees
guarantees that the assumptions underlying such forward-looking statements are free from
errors nor does any of the foregoing accept any responsibility for the future accuracy of the
opinions expressed in this document or the actual occurrence of the forecasted
developments.
No representation or warranty (express or implied) is made as to, and no reliance should
be placed on, any information, including projections, estimates, targets and opinions,
contained herein, and no liability whatsoever is accepted as to any errors, omissions or
misstatements contained herein, and, accordingly, neither the Company nor any of its
subsidiary undertakings nor any such person’s officers or employees accepts any liability
whatsoever arising directly or indirectly from the use of this document.

Highlights
Operational review
Financial review
Strategy
Appendices
12345
Agenda
3

HighlightsChristopher McDonald
CEO
l a m p r e l l . c o m
Adaptiv
e R
obotic
Weld
ing

Highlights 1H 2020Improved financial performance and strategic progress
5
▪ New contracts of over $575
million signed in 2020:
▪ Two new build jackup rigs from IMI JV
in Saudi Arabia
▪ 30 jackets for the Seagreen offshore
windfarm
▪ EPIC contract for the Mahani gas field
in Sharjah
▪ Moray East operationally complete
▪ Advancing digital strategy:
▪ Entered partnerships with Injazat and
Akselos;
▪ Several digital initiatives now
deployed in operations
▪1H 2020 FINANCIAL▪STRATEGIC
▪ 34% y-o-y revenue growth to
$142.5 million
▪ EBITDA positive 1H 2020 $0.3
million (1H 2019: $(29.6) million)
▪ Net loss $19.6 million*
(1H 2019: net loss of $51.9 million)
▪ Debt-free balance sheet
▪ Net cash increased to $71.4
million at period end (December
2019: $42.5 million; 30 September
2020: $125 million)
▪ Backlog increased to $580 million* Excluding exceptional restructuring cost and non-cash impairments

OperationalreviewChristopher McDonald
CEO
l a m p r e l l . c o m
Mora
y E
ast
pre
para
tion f
or
load o
ut

7
COVID-19Continue to deliver projects
Impact on operations
▪ Work in the yard continues, impact on cost
and productivity managed well
▪ Continue increased health screening
▪ Current projects progressing in line with
schedule
▪ Steel and other deliveries in line with
project schedules
Temporary cost reduction
▪ Salary and fee reductions of 25%
▪ Reduced working hours where possible
▪ Anticipated saving of $10m for FY 2020
8
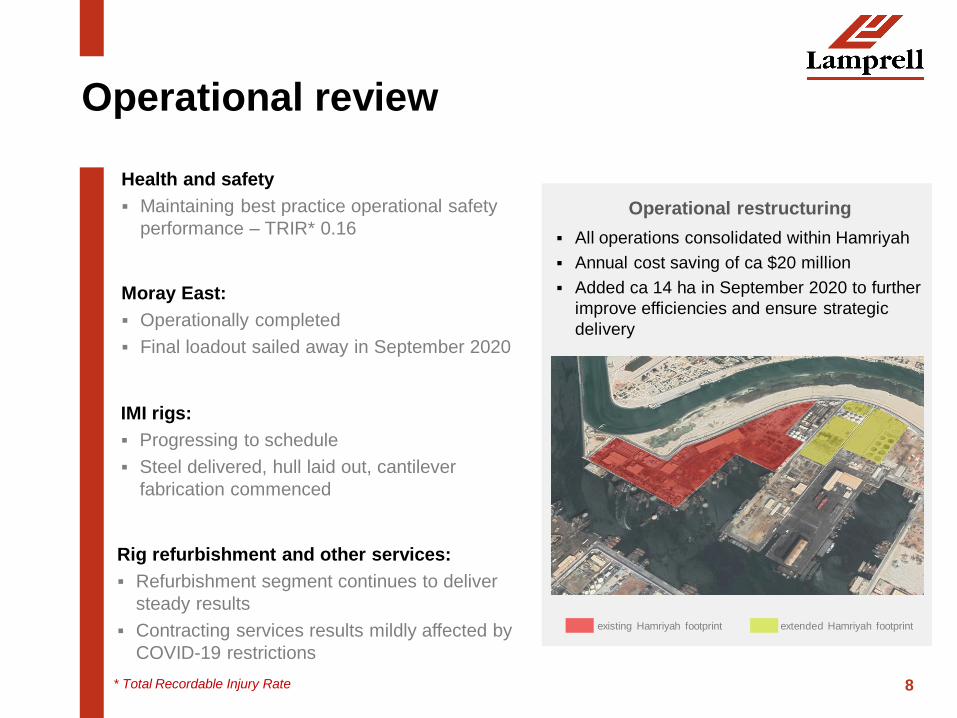
Moray East:
▪ Operationally completed
▪ Final loadout sailed away in September 2020
Rig refurbishment and other services:
▪ Refurbishment segment continues to deliver
steady results
▪ Contracting services results mildly affected by
COVID-19 restrictions
Operational review
IMI rigs:
▪ Progressing to schedule
▪ Steel delivered, hull laid out, cantilever
fabrication commenced
Health and safety
▪ Maintaining best practice operational safety
performance – TRIR* 0.16Operational restructuring
▪ All operations consolidated within Hamriyah
▪ Annual cost saving of ca $20 million
▪ Added ca 14 ha in September 2020 to further
improve efficiencies and ensure strategic
delivery
existing Hamriyah footprint extended Hamriyah footprint
* Total Recordable Injury Rate

9
New contract awards
Seagreen project scope
▪ 30 WTGs Substructures, including the
jackets, transition pieces and suction
caissons
▪ Fabrication in UAE with deliveries to client at
quayside in Hamriyah
▪ Completion in 2H 2021
▪ Steel delivered and fabrication commenced
Mahani gas field
▪ Significant gas condensate discovery made
in Sharjah in January 2020
▪ SNOC developing the field in JV with Eni
▪ Lamprell contracted for EPIC a new 25 km
export pipeline, including existing systems
upgrade and associated tie-ins
Seagreen wind farm
▪ Capacity: 1.5 GW
▪ Commissioning in 2023
▪ Ownership: Total/ SSE Renewables

10
Renewables
▪ Bid pipeline almost doubled since 2017
▪ Sustaining active bidding for opportunities
in Europe and Asia
▪ Further pipeline growth anticipated in 2021
from US foray into renewables
▪ COVID-19 affected timing of decisions on
several projects
Oil and gas
▪ Discussions with regional clients continue,
but progress will be slow
▪ Bid pipeline contribution from Saudi
Aramco LTA consistently around $3 billion
Bid pipeline $5.5bn*
*Including LTA
$1.3bn
$4.2bn
RenewablesOil and gas
Bid pipeline

FinancialreviewTony Wright
CFO
l a m p r e l l . c o m
Mora
y E
ast
Tra
nsiti
on P
iece L
iftin
g

▪ Positive EBITDA on profitable projects and overhead reductions
▪ Overhead before exceptionals reduced 31% y-o-y
▪ 34% y-o-y revenue growth
▪ Net loss before exceptional items $19.6m
▪ Net cash increased to $71.4 m
▪ Debt free balance sheet; current project funding in place
Key Financials
Income statement
($m, unless stated otherwise)HY 2020 HY 2019
Revenue 142.5 106.4
EBITDA 0.3 (29.6)
EBITDA margin 0.2% (27.8)%
Loss from continuing operations after
income tax(27.1) (51.9)
Reported diluted loss per share (US
cents)(7.93) (15.20)
Balance sheet
($m)
Net cash as at 30 June 71.4 42.5*
Tangible net assets 186.8 363.0
Revenue by
segmentHY2020$m HY2019$m
Rigs 31.9 13.2
EPC(I) 85.8 61.9
Contracting
services24.8 31.3
12*As at 31 December 2019

13
Positive EBITDA
Amounts in US$m
(29.6)
0.3
9.1
8.6
12.4 0.2
(35)
(30)
(25)
(20)
(15)
(10)
(5)
-
5
H1 2019 EBITDA Impact of Moray Firthproject margin
Impact of improvedmargins in other
value streams
Decrease inoverheads
Other H1 2020 EBITDA

14
Cost structureActions taken to deliver over 20% overhead reduction for the Full Year
*Non cash: Depreciation, amortization, finance lease costs
▪ 31% y-o-y overhead reduction (pre-
exceptional items): 1H 2020 US$35.1 million
vs 1H 2019 $51.1 million
▪ Overhead reduction resulting from
organisational restructuring: $9 million
▪ Operational overheads to increase moderately
in 2H with 2 major projects in the yard
▪ 2020 overhead (pre exceptional items)
anticipated to be $80 million
▪ 2021 overhead expected to be similar to
current levels
▪ Cost reduction driven by COVID-19: US$10
million in 2020
*Excluding exceptional items (restructuring cost and impairment)
70.6
33.3
Cost Structure US$m
2019
50.4
29.6
Cash Non Cash*
2020E

15
Increased net cash
Amounts in US$m
42.5
0.9
69.6 35.4
3.2 371.4
Net cash as at 31December 2019
Operating cashflows
Monetisation ofrig kits
Movement inworking capital
Asset additions Other Net cash as at 30June 2020

▪ Tight cost control will continue as revenue
levels improve
▪ Ongoing projects supported by balance
sheet and project-specific financing
▪ Conventional debt market remains
challenging, but project financing is open
▪ Net cash to trend to 1H levels at year end as
projects draw working capital
▪ Modest capital expenditure anticipated for
2020
▪ Critical-only capex aimed at optimising yard
efficiencies
16
Financial summaryFocus on maintaining liquidity

Strategy updateChristopher McDonald
CEO
l a m p r e l l . c o m
Mo
ray E
ast
Batc
h S
ail

18
Strategic ProgressAdapting to the evolving energy industry
Solidify position in core
markets
Move up the value chain in
EPC(I)
Improve our business
through innovation and
digital technologies
2020 progress
✓ Third major renewables contract
awarded
✓ Renewables bid pipeline to grow with
the emergence of US offshore wind
✓ IMI new build jackup rigs contract
secured
✓ Regional client relationships supported
through refurbishment work and mid-
size projects
✓ Digital initiatives successfully deployed
in operations
✓ Partnerships with Injazat and Akselos to
accelerate value creating opportunities
in digital solutions

19
▪ Over $300 billion capex in offshore wind
expected in the next 5 years
▪ Global installations growing with Europe
reporting record commissioning in 2019
▪ US accelerating entry into offshore wind with
large scale proposals for US East Coast
▪ COVID-19 is not affecting commissioning of
projects under development but has slowed
down FIDs due to delays with permitting
Offshore Wind
• Source: IEA Offshore Wind Tracking Report, AWEA June status update,
Rystad Energy
5.3
10.0
11.5
12.0
20.0
22.0
30.0
40.0
0.0 10.0 20.0 30.0 40.0 50.0
Denmark
Taiwan
Netherlands
South Korea
Germany
USA
India
United Kingdom
Installed Capacity - GW
2030 Offshore Wind Capacity Targets For Selected
Countries
Global Annual Offshore Wind Capex
32.6
41.147.0
52.0
60.063.0 63.4
0
10
20
30
40
50
60
70Capex ($bn)
2019 cumulative
capacity
27.5GW

20
Offshore Wind in the USAMajor Projects On The Eastern Seaboard
▪ Recent legislation and goals set in a
number of Eastern states to reduce
carbon emissions
▪ European developers are set to leverage
their experience in capturing the rapidly
growing US market
▪ US targets 22GW by 2030
Key:
Ørsted
Equinor
Mayflower (Shell & EDPR)
Vineyard Wind (Iberdrola & CIP)
20% of East Coast targets awarded, with
80% remaining capacity commitments20%
* Source: Rystad Energy

21
Oil & GasFocus on MENA activity region
▪ LTA bidding focused on Aramco’s
production maintenance continues
▪ ADNOC embarking on rig upgrade and
refurbishment programme ahead of major
rig fleet expansion in support of its 2030
smart growth plan
▪ Mahani gas field discovery in Sharjah
supports medium-term fundamentals for
fossil fuels
▪ Lamprell maintains one of the highest
local content scores in the region

22
Delivering Digital Transformation
Industry status
▪ Use of digital solutions to improve quality, safety and productivity:
▪ Adaptive robotic welding
▪ Facial recognition
▪ Digital quality management
▪ Smart non-destructive testing
Lamprell differentiator
▪ Monetise unique experience and knowhow
▪ Partnership with Injazat to develop AI asset integrity solutions
and operations productivity applications
▪ Signed distributor deal with Akselos, advanced technology
provider in structural and process digital twin solutions
USE
COMMERCIALISE
DEVELOP

23
OutlookRevenue growth and cost discipline
▪ Focus on health and wellbeing of employees as
COVID-19 impact persists
▪ Preserve liquidity as we progress strategic
initiatives
▪ Deliver sustained revenue growth: 2020
secured revenue of $325 million, 2021 and
2022 backlog of $400 million
▪ Grow the bid pipeline: strong high quality bid
pipeline in both end markets, with renewables
segment expected to show significant growth
from 2021
▪ Maintain cost discipline
31%
65%
4%
Backlog run off
2020
2021
2022
$580 million

Appendix
l a m p r e l l . c o m
Mora
y E
ast
pro
ject
constr
uctio
n i
n S
harjah F
acility

25
Financial summary
Amounts in $mHY 2020, $m
Reported
HY 2019 $m
Reported
Revenue 142.5 106.4
Cost of sales (136.8) (119.4)
Gross profit/(loss) 5.7 (13.0)
Gross margin % 4.0% (12.2%)
G&A : (22.7) (29.3)
- Restructuring costs and impairment of PPE,
intangibles and investment in associate(7.4) -
- Other G&A expenses (15.3) (29.3)
Operating loss (17.0) (41.7)
Finance costs - net* (2.0) (4.1)
Share of loss in investments accounted using
the equity method (8.1) (6.1)
Loss before income tax (27.1) (51.9)
Income tax expense (0.03) (0.06)
Loss for the period (27.1) (51.9)
Total loss attributable to equity holders (27.1) (51.9)* Represents the net balance of finance costs and finance income