half-year report to 30 june 2017
TRANSCRIPT
Half-Year Report
to 30 June 2017
1
HALF-YEAR
REPORT
TO 30 JUNE 2017 ______________________
First half of 2017
Board of Directors
Milan, 8 September 2017
Half-Year Report
to 30 June 2017
2
DeA Capital S.p.A.
Corporate information DeA Capital S.p.A. is subject to the management
and coordination of De Agostini S.p.A.
Registered office: Via Brera 21, Milan 20121, Italy
Share capital: EUR 306,612,100 (fully paid up),
comprising 306,612,100 shares with a nominal
value of EUR 1 each (including 48,702,930 treasury
shares at 30 June 2017)
Tax code, VAT code and recorded in the Milan
Register of Companies under no. 07918170015
Board of Directors (*)
Chairman Lorenzo Pellicioli
Chief Executive Officer Paolo Ceretti
Directors Lino Benassi
Marco Boroli
Donatella Busso (1/5)
Marco Drago
Carlo Enrico Ferrari Ardicini
Francesca Golfetto (3/5)
Severino Salvemini (2/3/5)
Daniela Toscani (1/5)
Elena Vasco (4/5)
Board of Statutory Auditors (*)
Chairman Cesare Andrea Grifoni
Permanent Auditors Annalisa Raffaella Donesana
Fabio Facchini
Deputy Auditors Andrea Augusto Bonafè
Michele Maranò
Marco Sguazzini Viscontini
Secretary to the Board of Directors
Diana Allegretti
Manager responsible for preparing
the Company’s accounts
Manolo Santilli
Independent Auditors
PricewaterhouseCoopers S.p.A.
(*) In office until the approval of the Financial Statements for the Year Ending 31 December 2018 (1) Member of the Control and Risks Committee (2) Member and Chairman of the Control and Risks Committee (3) Member of the Remuneration and Appointments Committee (4) Member and Chairman of the Remuneration and Appointments Committee (5) Independent Director
Half-Year Report
to 30 June 2017
3
Contents
Interim Report on Operations
1. Profile of DeA Capital S.p.A.
2. Information for shareholders
3. The DeA Capital Group’s key Statement of Financial Position and Income
Statement figures
4. Significant events in the first half of 2017
5. Results of the DeA Capital Group
6. Other information
Summary Consolidated Half-Year Report for the period 1 January to 30 June 2017
Statement of responsibilities for the Consolidated Financial Statements Half-Year Report to 30 June 2017
Half-Year Report
to 30 June 2017
4
Interim Report on Operations

Half-Year Report
to 30 June 2017
5
1. Profile of DeA Capital S.p.A.
With assets under management of more than EUR 11,500 million and an investment
portfolio of approximately EUR 450 million, DeA Capital S.p.A. is one of Italy's largest
alternative investment operators.
The Company, which operates in both the Private Equity Investment and Alternative
Asset Management businesses, is listed on the FTSE Italia STAR section of the Milan
stock exchange and heads the De Agostini Group in the area of financial investments.
In the Private Equity Investment business, DeA Capital S.p.A. has “permanent” capital,
and therefore has the advantage – compared with traditional private equity funds, which
are normally restricted to a pre-determined duration – of greater flexibility in optimising
the timing of entry to and exit from investments. In terms of investment policy, this
flexibility allows it to adopt an approach based on value creation, including over the
medium to long term.
With regard to Alternative Asset Management activities, DeA Capital S.p.A. – through its
subsidiaries IDeA FIMIT SGR and IDeA Capital Funds SGR – is Italy’s leading operator in
real estate fund management and private equity programmes, respectively. The two
asset management companies are active in the promotion, management and value
enhancement of investment funds, using approaches based on sector experience and
the ability to identify opportunities for achieving the best returns.
The Company's ability to carry out investment initiatives (including those that are
structurally very complex), on the one hand, and raise funds through its asset
management subsidiary companies on the other, is proof of the effectiveness of its
business model, which combines private investment and asset management activities to
create value in a unique way in Italy's alternative asset management sector. It does this
thanks to:
the quality, built up over time, of the management team, which has over 200
professionals dedicated to managing funds in the most attractive alternative
investment asset classes (real estate, private equity and NPL);
its solid financial position, which enables it to support the launch of new
initiatives with its own capital, and hence substantially align its interests with
those of the investors in our managed funds;
an extensive network of international relationships, which makes DeA Capital the
preferred Gate-to-Italy for alternative investment decisions in our country;
its membership of one of Italy's leading business Groups, whose structure is built
on a long-term approach that best supports the Company's growth path.
Half-Year Report
to 30 June 2017
6
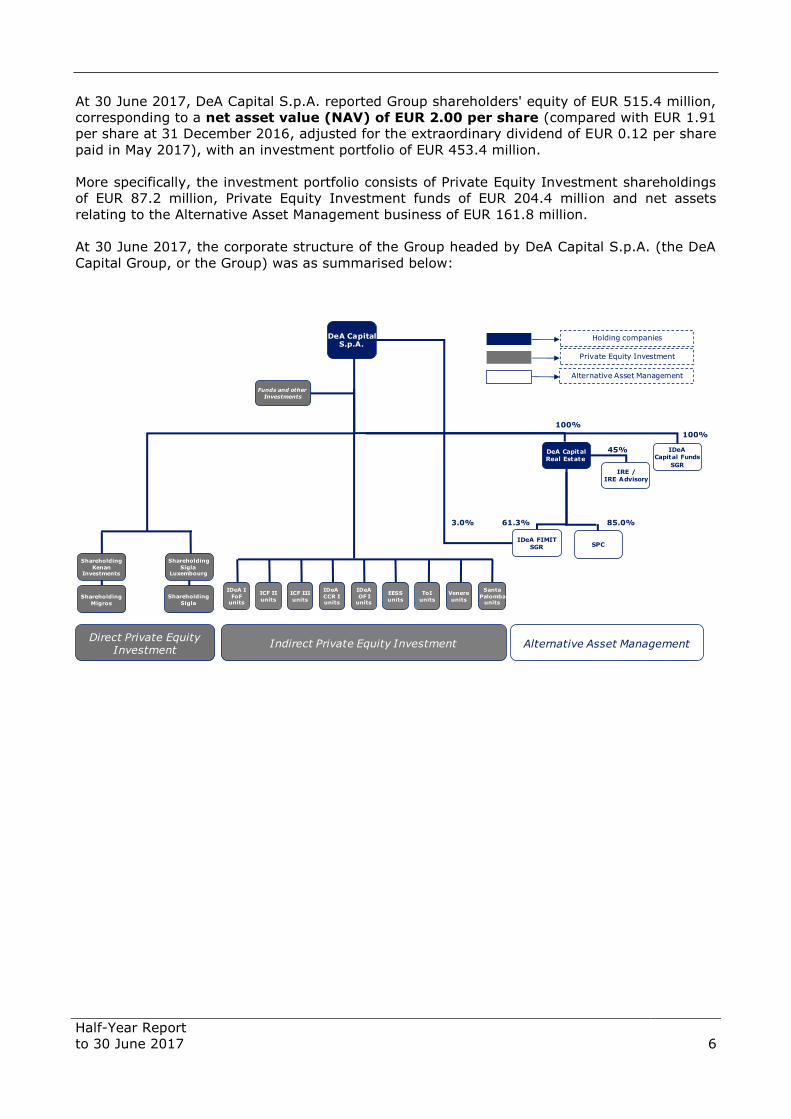
At 30 June 2017, DeA Capital S.p.A. reported Group shareholders' equity of EUR 515.4 million,
corresponding to a net asset value (NAV) of EUR 2.00 per share (compared with EUR 1.91
per share at 31 December 2016, adjusted for the extraordinary dividend of EUR 0.12 per share
paid in May 2017), with an investment portfolio of EUR 453.4 million.
More specifically, the investment portfolio consists of Private Equity Investment shareholdings
of EUR 87.2 million, Private Equity Investment funds of EUR 204.4 million and net assets
relating to the Alternative Asset Management business of EUR 161.8 million.
At 30 June 2017, the corporate structure of the Group headed by DeA Capital S.p.A. (the DeA
Capital Group, or the Group) was as summarised below:
DeA CapitalS.p.A.
Funds and other
Investments
Shareholding
KenanInvestments
Shareholding
Sigla Luxembourg
Shareholding
Migros
IRE /
IRE Advisory
100%
IDeA
Capital Funds
SGR
100%
45%
Shareholding
Sigla
61.3%
IDeA FIMIT
SGR
Direct Private EquityInvestment
Indirect Private Equity Investment
DeA Capital
Real Estate
Alternative Asset Management
3.0%
ICF II
units
IDeA I
FoFunits
ICF III
units
IDeA
OF Iunits
EESS
units
Venere
units
ToI
units
IDeA
CCR Iunits
85.0%
Santa
Palombaunits
SPC
Private Equity Investment
Alternative Asset Management
Holding companies
Half-Year Report
to 30 June 2017
7
PRIVATE EQUITY INVESTMENT
o Main shareholdings
minority shareholding in Migros, the leading company in the food retail
sector in Turkey, whose shares are listed on the Istanbul Stock Exchange;
the investment is held through the Luxembourg-registered company Kenan
Investments S.A. and recorded in the AFS portfolio of the DeA Capital Group
(17.1% stake in Kenan Investments, with a fully diluted stake of
approximately 5.2% in Migros)
strategic shareholding in Sigla, which provides consumer credit for non-
specific purposes (salary-backed loans and personal loans) and services non-
performing loans in Italy. The investment is held through the Luxembourg-
registered company Sigla Luxembourg S.A., an associate of the DeA Capital
Group (with a stake of 41.4%).
o Funds
units in seven funds managed by the subsidiary IDeA Capital Funds SGR, i.e.
in the three funds of funds IDeA I Fund of Funds (IDeA I FoF), ICF II
and ICF III, in the co-investment fund IDeA Opportunity Fund I (IDeA
OF I), in the theme funds IDeA Efficienza Energetica e Sviluppo
Sostenibile (Energy Efficiency and Sustainable Development - IDeA
EESS) and IDeA Taste of Italy (IDeA ToI), and in the credit fund IDeA
Corporate Credit Recovery I (IDeA CCR I);
units in two funds managed by the subsidiary IDeA FIMIT SGR, i.e. in the
real estate funds Venere and Santa Palomba;
units in six venture capital funds.
ALTERNATIVE ASSET MANAGEMENT
100% control of IDeA Capital Funds SGR, which manages private equity
funds (funds of funds, co-investment funds and theme funds) with about EUR
1.9 billion in assets under management (AUM) and nine managed funds;
controlling interest in IDeA FIMIT SGR (64.3%), Italy's largest
independent real estate asset management company, with about EUR 9.4
billion in assets under management and 41 managed funds (including five
listed funds);
controlling interest in SPC (85.0%), a company that specialises in
secured and unsecured debt recovery, with a focus on the banking, leasing,
consumer and commercial sectors in Italy, with assets under management of
around EUR 0.3 billion;
strategically important stake in IRE/IRE Advisory (45.0%), which
operate in project, property and facility management, as well as in real
estate brokerage.
Half-Year Report
to 30 June 2017
8
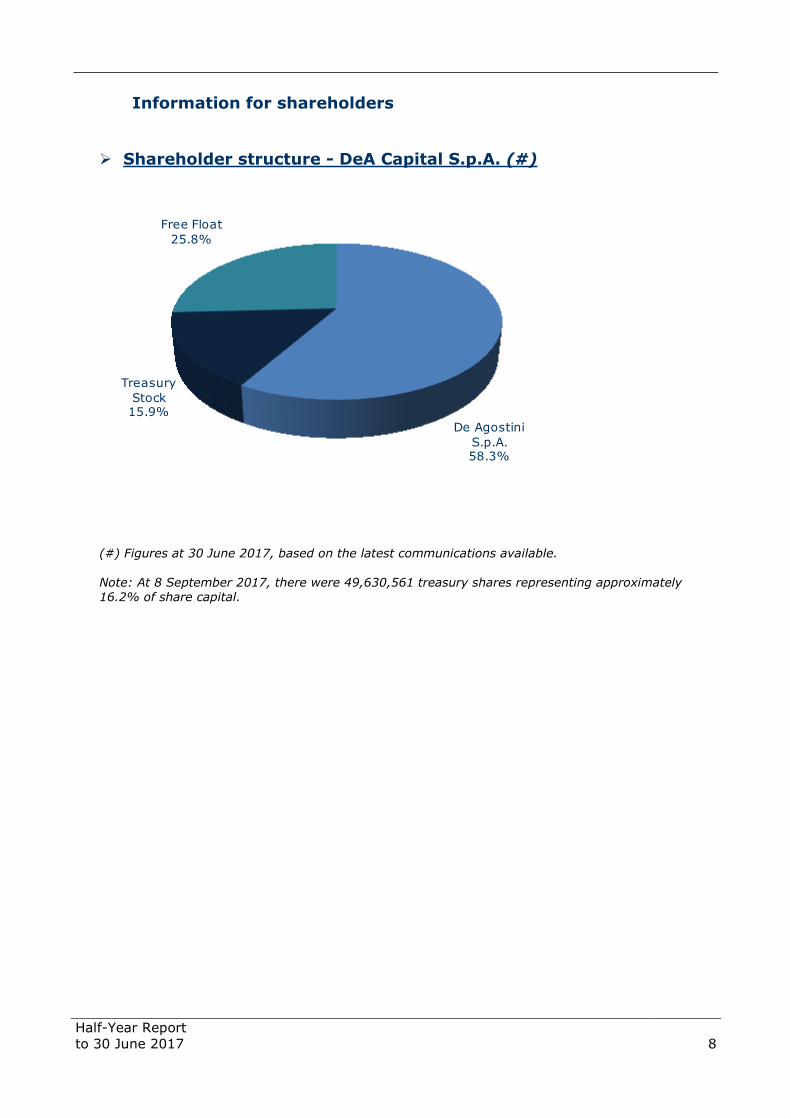
Information for shareholders
Shareholder structure - DeA Capital S.p.A. (#)
(#) Figures at 30 June 2017, based on the latest communications available.
Note: At 8 September 2017, there were 49,630,561 treasury shares representing approximately 16.2% of share capital.
De Agostini
S.p.A.58.3%
Treasury
Stock15.9%
Free Float
25.8%
Half-Year Report
to 30 June 2017
9
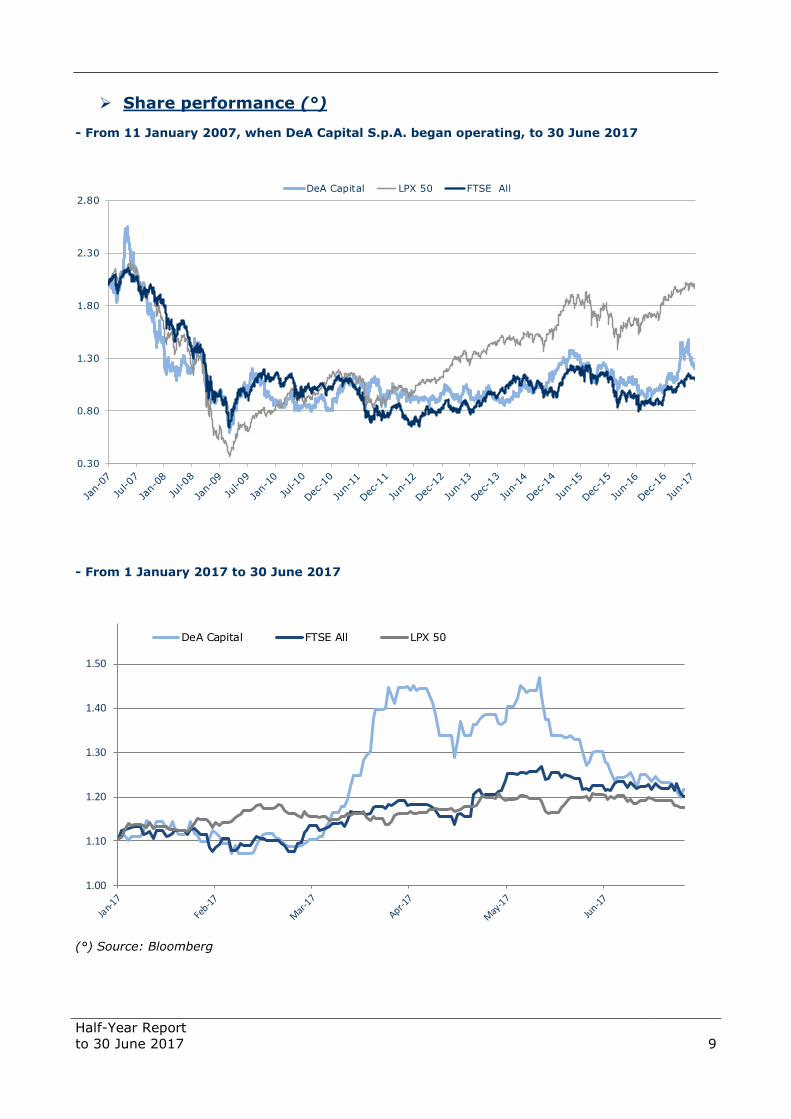
Share performance (°)
- From 11 January 2007, when DeA Capital S.p.A. began operating, to 30 June 2017
- From 1 January 2017 to 30 June 2017
(°) Source: Bloomberg
0.30
0.80
1.30
1.80
2.30
2.80
DeA Capital LPX 50 FTSE All
1.00
1.10
1.20
1.30
1.40
1.50
DeA Capital FTSE All LPX 50
Half-Year Report
to 30 June 2017
10
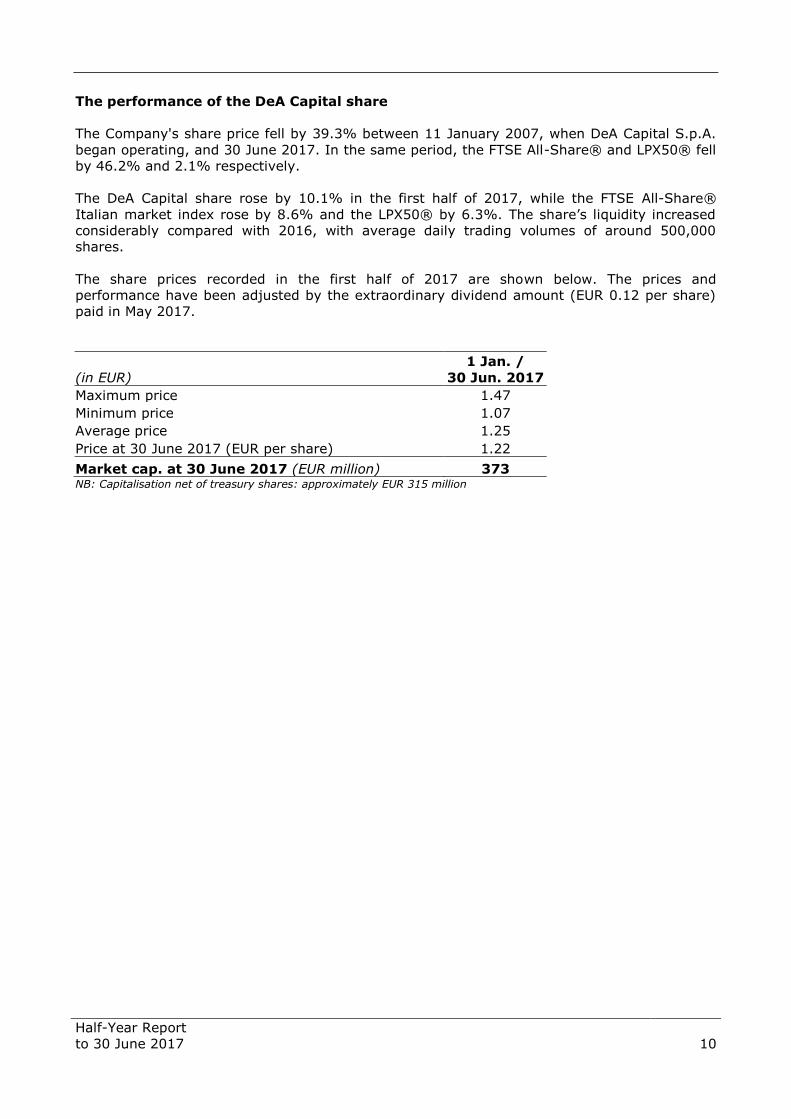
The performance of the DeA Capital share
The Company's share price fell by 39.3% between 11 January 2007, when DeA Capital S.p.A.
began operating, and 30 June 2017. In the same period, the FTSE All-Share® and LPX50® fell
by 46.2% and 2.1% respectively.
The DeA Capital share rose by 10.1% in the first half of 2017, while the FTSE All-Share®
Italian market index rose by 8.6% and the LPX50® by 6.3%. The share’s liquidity increased
considerably compared with 2016, with average daily trading volumes of around 500,000
shares.
The share prices recorded in the first half of 2017 are shown below. The prices and
performance have been adjusted by the extraordinary dividend amount (EUR 0.12 per share)
paid in May 2017.
(in EUR)
1 Jan. /
30 Jun. 2017
Maximum price 1.47
Minimum price 1.07
Average price 1.25
Price at 30 June 2017 (EUR per share) 1.22
Market cap. at 30 June 2017 (EUR million) 373 NB: Capitalisation net of treasury shares: approximately EUR 315 million
Half-Year Report
to 30 June 2017
11
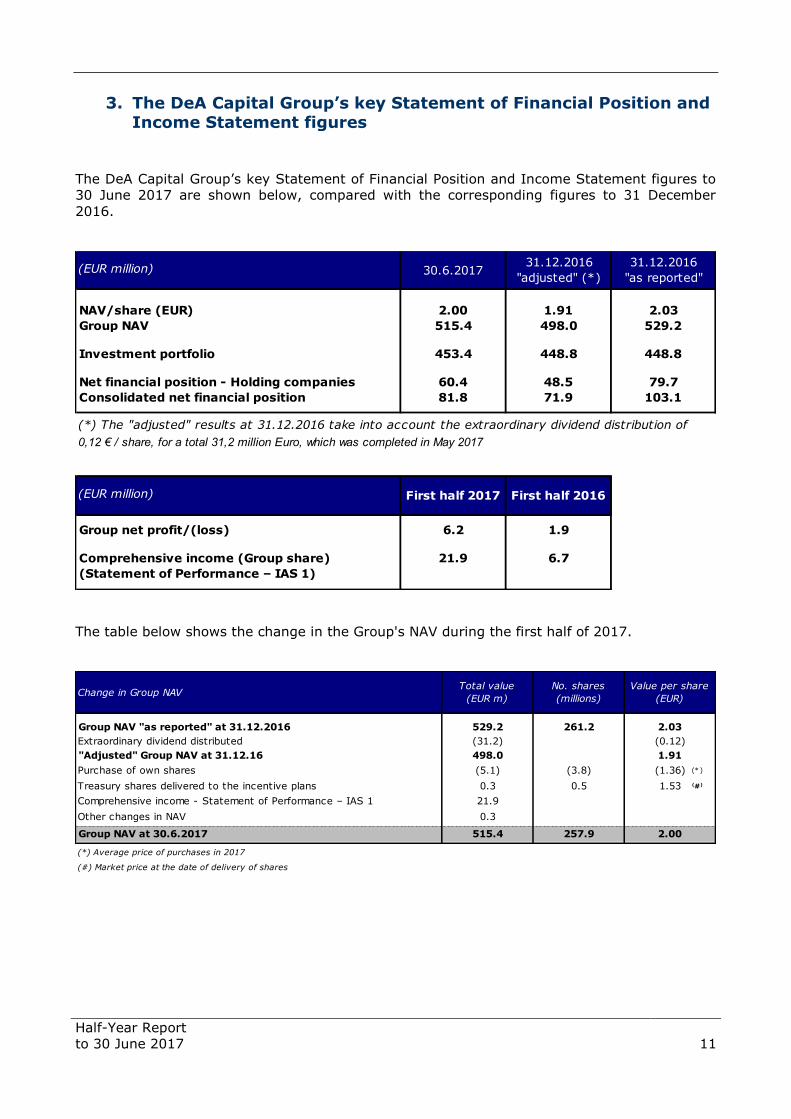
3. The DeA Capital Group’s key Statement of Financial Position and Income Statement figures
The DeA Capital Group’s key Statement of Financial Position and Income Statement figures to
30 June 2017 are shown below, compared with the corresponding figures to 31 December
2016.
The table below shows the change in the Group's NAV during the first half of 2017.
(EUR million)
NAV/share (EUR) 2.00 1.91 2.03
Group NAV 515.4 498.0 529.2
Investment portfolio 453.4 448.8 448.8
Net financial position - Holding companies 60.4 48.5 79.7
Consolidated net financial position 81.8 71.9 103.1
(*) The "adjusted" results at 31.12.2016 take into account the extraordinary dividend distribution of
0,12 € / share, for a total 31,2 million Euro, which was completed in May 2017
(EUR million)
Group net profit/(loss) 6.2 1.9
Comprehensive income (Group share) 21.9 6.7
(Statement of Performance – IAS 1)
31.12.2016
"as reported"
First half 2017 First half 2016
31.12.2016
"adjusted" (*)30.6.2017
Group NAV "as reported" at 31.12.2016 529.2 261.2 2.03
Extraordinary dividend distributed (31.2) (0.12)
"Adjusted" Group NAV at 31.12.16 498.0 1.91
Purchase of own shares (5.1) (3.8) (1.36)
Treasury shares delivered to the incentive plans 0.3 0.5 1.53
Comprehensive income - Statement of Performance – IAS 1 21.9
Other changes in NAV 0.3
Group NAV at 30.6.2017 515.4 257.9 2.00
(*) Average price of purchases in 2017
(#) Market price at the date of delivery of shares
No. shares
(millions)
Value per share
(EUR)Change in Group NAV
Total value
(EUR m)
(*)
(#)
Half-Year Report
to 30 June 2017
12
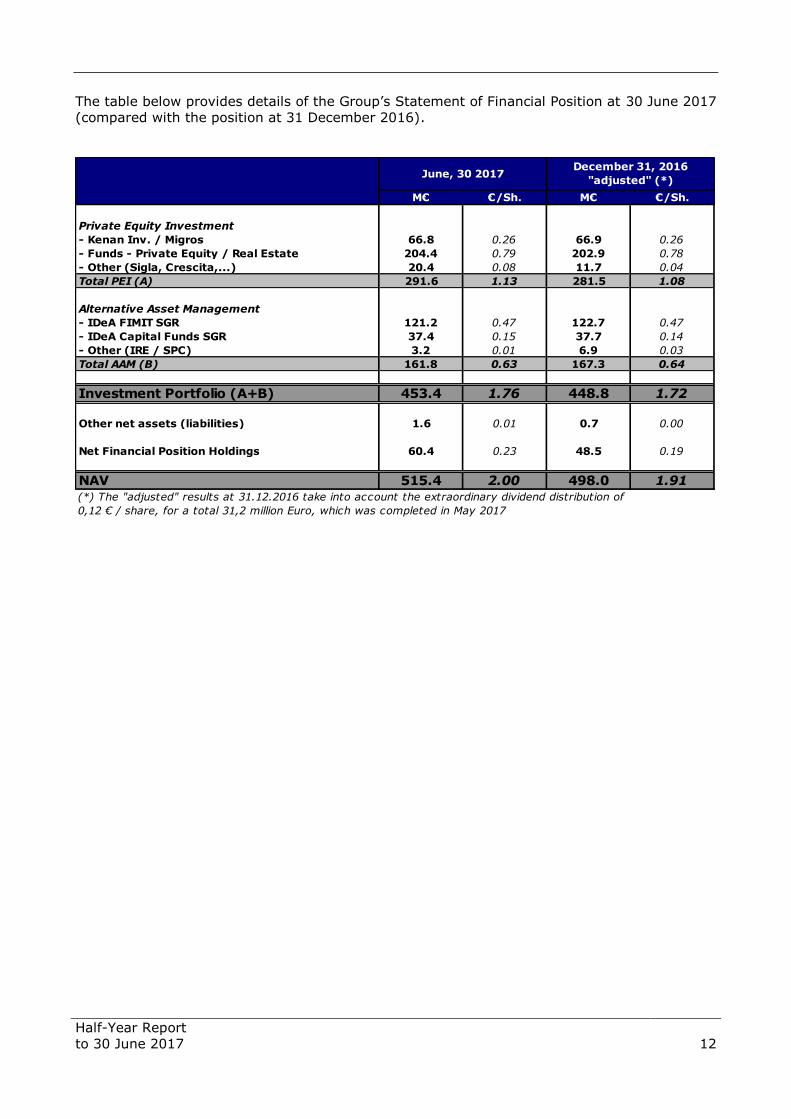
The table below provides details of the Group’s Statement of Financial Position at 30 June 2017
(compared with the position at 31 December 2016).
M€ €/Sh. M€ €/Sh.
Private Equity Investment
- Kenan Inv. / Migros 66.8 0.26 66.9 0.26
- Funds - Private Equity / Real Estate 204.4 0.79 202.9 0.78
- Other (Sigla, Crescita,...) 20.4 0.08 11.7 0.04
Total PEI (A) 291.6 1.13 281.5 1.08
Alternative Asset Management
- IDeA FIMIT SGR 121.2 0.47 122.7 0.47
- IDeA Capital Funds SGR 37.4 0.15 37.7 0.14
- Other (IRE / SPC) 3.2 0.01 6.9 0.03
Total AAM (B) 161.8 0.63 167.3 0.64
Investment Portfolio (A+B) 453.4 1.76 448.8 1.72
Other net assets (liabilities) 1.6 0.01 0.7 0.00
Net Financial Position Holdings 60.4 0.23 48.5 0.19
NAV 515.4 2.00 498.0 1.91(*) The "adjusted" results at 31.12.2016 take into account the extraordinary dividend distribution of
0,12 € / share, for a total 31,2 million Euro, which was completed in May 2017
June, 30 2017December 31, 2016
"adjusted" (*)
Half-Year Report
to 30 June 2017
13
4. Significant events in the first half of 2017
The significant events that occurred in the first half of 2017 are reported below.
AAM funds – paid calls/distributions
During the first half of 2017, the DeA Capital Group increased its investments in the IDeA I
FoF, ICF II, ICF III, IDeA CCR I, IDeA EESS and IDeA ToI funds with payments totalling EUR
4.8 million.
At the same time, the DeA Capital Group received capital reimbursements totalling EUR 8.7
million from the IDeA I FoF, ICF II, IDeA EESS and Venere funds.
Thus, in the first half of 2017, the funds in which DeA Capital S.p.A. has invested produced a
net positive cash balance totalling EUR 3.9 million for the portion relating to the Group.
Investment in the “Crescita” (“Growth”) special purpose acquisition company
(SPAC)
During the first half of 2017, the DeA Capital Group completed its investment in the “Crescita”
(“Growth”) special purpose acquisition company (SPAC), whose shares commenced trading on
the Italian stock exchange on 15 March 2017, for a total outlay of EUR 7.8 million for DeA
Capital. The portion acquired equates to 5.8% of the ordinary shares (totalling EUR 130
million) and 9.2% of the preference shares (totalling EUR 3 million); the latter can be
converted into a maximum of six ordinary shares each, subject to the achievement of certain
objectives.
The SPAC's objective is to complete a business combination with an Italian target company
within 24 months of its listing date.
Liquidation of the Atlantic Value Added fund (involving the distribution in kind
of the units in the Venere fund)
In March 2017, the Group completed the early liquidation of the Atlantic Value Added fund,
managed by IDeA FIMIT SGR, which involved the distribution in kind of the units held in the
Venere fund (as well as the distribution of the remaining liquidity).
Thus, at the date of this document, the DeA Capital Group directly owns 9.1% of the Venere
fund, managed by IDeA FIMIT SGR, and has no residual commitments.
Dividends from Alternative Asset Management
During the first half of 2017, the Alternative Asset Management business distributed a total of
EUR 5.4 million to the DeA Capital Group's holding companies (EUR 9.7 million in 2016),
broken down as follows: EUR 3.3 million to IDeA FIMIT (pro-rata share of EUR 5.1 million),
EUR 1.5 million to IDeA Capital Funds (100% of the dividends paid) and EUR 0.6 million to IRE
(pro-rata share of the total EUR 1.4 million).

Half-Year Report
to 30 June 2017
14
Share buyback plan
On 20 April 2017, the Shareholders’ Meeting of DeA Capital S.p.A. authorised the Board of
Directors to buy and sell, on one or more occasions and on a revolving basis, a maximum
number of treasury shares representing a stake of up to 20% of the share capital.
The new plan replaces the previous plan approved by the Shareholders’ Meeting on 21 April
2016 (which was scheduled to expire with the approval of the 2016 Annual Financial
Statements), and will pursue the same objectives, including purchasing treasury shares to be
used for extraordinary transactions and share incentive schemes, offering shareholders a
means of monetising their investment, stabilising the share price and regulating trading within
the limits of current legislation.
The authorisation specifies that purchases may be made until the date of the Shareholders’
Meeting to approve the Financial Statements for the Year Ending 31 December 2017, and in
any case not beyond the maximum duration of 18 months allowed by law, and that DeA
Capital S.p.A. may also sell the shares purchased for the purposes of trading, without time
limits. The unit price for the purchase of the shares will be set on a case-by-case basis by the
Board of Directors, but must not be more than 20% above or below the share’s reference price
on the trading day prior to each purchase.
The authorisation to sell treasury shares already held in the Company’s portfolio and any
shares bought in the future was granted for an unlimited period; sales may be carried out
using the methods deemed most appropriate and at a price to be determined on a case-by-
case basis by the Board of Directors, which must not, however, be more than 20% below the
share’s reference price on the trading day prior to the sale (apart from certain exceptions
specified in the Plan), although this limit may not apply in certain cases.
On the same date, the Board of Directors voted to implement the plan to buy and sell treasury
shares authorised by the Shareholders’ Meeting, vesting the Chairman of the Board of
Directors and the Chief Executive Officer with all the necessary powers, to be exercised
severally and with full power of delegation, and set the maximum unit price above which
purchases of treasury shares may not be made, at the NAV per share indicated in the most
recent statement of financial position approved and disclosed to the market.
At the same meeting, the Company's Board of Directors also voted to adopt market practice
regarding the acquisition of treasury shares by setting up a “securities warehouse”, as
permitted by Consob Resolution 16839 of 19 March 2009.
New performance share plan
On 20 April 2017, the DeA Capital S.p.A. Shareholders' Meeting approved the DeA Capital
Performance Share Plan 2017-2019, under which a maximum of 1,200,000 units may be
allocated. On the same date, in implementation of the shareholders’ resolution, the Board of
Directors of DeA Capital S.p.A. voted: (i) to launch the DeA Capital Performance Share Plan
2017-2019 approved by the Shareholders’ Meeting, vesting the Chairman of the Board of
Directors and the Chief Executive Officer with all the necessary powers, to be exercised
severally and with full power of delegation; and (ii) to allocate 975,000 units (representing the
right to receive ordinary shares in the Company free of charge, under the terms and conditions
of the plan) to certain employees and/or directors performing particular roles at the Company,
its subsidiaries and the Parent Company De Agostini S.p.A. The shares allocated due to the
vesting of units will be drawn from the treasury shares already held by the Company; the
allocation will therefore not have a dilutive effect.
Half-Year Report
to 30 June 2017
15
Receipt of the penultimate tranche of the proceeds of the sale of the
controlling stake in IRE
On 28 April 2017, the DeA Capital Group received, via its subsidiary DeA Capital Real Estate,
EUR 0.6 million, being the penultimate tranche of the proceeds of the sale of the majority
stake in IRE, which was completed in 2016. The last tranche of the price – a further EUR 0.6
million – is scheduled to be paid by 30 April 2018.
Vesting of the DeA Capital performance share plan and the stock option plan
for 2014-2016
In May 2017, 480,571 treasury shares (approx. 0.2% of the share capital) were allocated as a
result of the vesting of the 2014-2016 long-term incentive-based plans of DeA Capital S.p.A.
(performance share and stock option).
Distribution of the share premium reserve
On 15 May 2017, in accordance with the vote of the Shareholders' Meeting on 20 April 2017,
DeA Capital S.p.A. made a partial distribution of the share premium reserve in an amount of
EUR 0.12 per share, i.e. based on the total number of shares net of treasury shares held, in an
amount of around EUR 31.2 million.
Exercise of the put option on a stake in Migros
In May 2017, Kenan Investments, an investee company of which DeA Capital holds about 17%
and which holds a 40.25% stake in Migros, completed the transactions relating to a put option
on a stake of 9.75% in Migros.
The terms and conditions of the option were defined in agreements entered into in 2015 with
Turkish group Anadolu when the latter acquired a 40.25% co-controlling stake in the
supermarket chain from the total 80.5% stake held at the time by Kenan Investments.
The transaction, which was completed at a price of TRY 30.2 per Migros share, generated
proceeds of around EUR 105 million for Kenan Investments, net of expenses, taxes and an
amount held in escrow until 2020 to cover potential tax liabilities.
On 1 June 2017, the above transaction generated proceeds of around EUR 17.8 million for DeA
Capital, with the group realising a capital gain of EUR 3.8 million. Following the transaction,
Kenan Investments holds a 30.5% stake in Migros, via an indirect pro-rata stake held by DeA
Capital of approximately 5.2%.
Half-Year Report
to 30 June 2017
16
5. Results of the DeA Capital Group
The consolidated results for the period relate to the operations of the DeA Capital Group in the
following businesses:
Private Equity Investment, which includes the reporting units involved in private equity
investment, broken down into shareholdings (direct investments) and investments in
funds (indirect investments);
Alternative Asset Management, which includes the reporting units dedicated to asset
management activities and related services, with a focus on the management of private
equity and real estate funds.
Private Equity Investment
At 30 June 2017, the DeA Capital Group was a shareholder of:
Kenan Investments, the indirect parent company of Migros (valued at EUR 66.8
million);
Sigla Luxembourg, the parent company of Sigla (valued at EUR 11.5 million);
Crescita, a special purpose acquisition company (valued at EUR 8.7 million);
Harvip, which manages funds and investment vehicles used to purchase distressed real
estate and other investments (valued at EUR 0.2 million).
The DeA Capital Group is also a shareholder in other smaller companies which are not included
in the investment portfolio as they are either dormant or in liquidation and have a zero
carrying value.
At 30 June 2017, the DeA Capital Group held units in the following funds (net carrying value
from the funds' consolidated financial statements shown in brackets):
IDeA I FoF (valued at EUR 64.9 million);
ICF II (valued at EUR 45.0 million);
ICF III (valued at EUR 6.6 million);
IDeA OF I (valued at EUR 45.5 million);
IDeA EESS (valued at EUR 21.0 million);
IDeA ToI (valued at EUR 7.1 million);
IDeA CCR I (valued at EUR 1.7 million);
Venere (valued at EUR 3.3 million);
Santa Palomba (valued at EUR 0.4 million);
six venture capital funds (with a total value of approximately EUR 8.9 million).
Valuations of shareholdings and funds in the portfolio reflect estimates made using the
information available on the date this document was prepared.

Half-Year Report
to 30 June 2017
17
Investments in associates
- Sigla Luxembourg (Parent Company of Sigla)
Registered office: Italy
Sector: Consumer credit
Website: www.siglacredit.it
Investment details:
On 5 October 2007, the DeA Capital Group finalised the acquisition of a stake (currently
41.4%) in Sigla Luxembourg, the holding company that fully controls Sigla, which operates in
Italy and provides consumer credit for non-specific purposes.
Brief description:
Sigla specialises in salary-backed loans. It is a benchmark operator in the provision of
financial services to households throughout Italy, chiefly through a network of agents.
Its activities also include servicing unsecured non-performing loans (personal loans and credit
cards).
The investment in Sigla Luxembourg, amounting to EUR 11.5 million, which was unchanged
compared with 31 December 2016, was classified under ”Held-for-sale assets” in light of the
process to sell the shareholding, which is under way. As explained more fully in “Significant
events after the end of the period”, in July 2017, Sigla Luxembourg received and accepted a
binding offer to purchase 100% of the capital of its subsidiaries Sigla and SiCollection; DeA
Capital's pro-rata share of the purchase price, totalling around EUR 11.8 million, is broadly in
line with the carrying value of the subsidiary.
In the first half of 2017, Sigla continued to show sustained growth in salary-backed loans
(+23%); the Company confirmed that fund-raising to support the recent pace of growth in
CQS loans is very buoyant from the point of view of both quantity (around EUR 400 million
raised in the first half of 2017) and quality (diversification of the financing institutions and the
introduction of securitisations as a form of funding).
At the same time, Sigla's risk profile has continued to improve significantly, given the gradual
recovery of the portfolio of outstanding personal loans (down to EUR 26.8 million at 30 June
2017) and the pronounced reduction in financial debt (EUR 2.6 million at 30 June 2017, an
improvement of around EUR 30 million over the last two-and-a-half years, from EUR 32 million
at 31 December 2014).
Sigla (mln €) First Half 2017 First Half 2016 Change
Salary-backed loans granted 106.0 85.9 20.1
Revenues from Salary-backed loans 6.4 6.4 0.0
Group net profit 1.0 1.5 (0.5)
Half-Year Report
to 30 June 2017
18
Investments in other companies
- Kenan Investments (holder of a shareholding in Migros)
Registered office: Turkey
Sector: Food retail
Website: www.migros.com.tr
Investment details:
In 2008, the DeA Capital Group acquired 17.1% of the capital of Kenan Investments, the
company heading the structure to acquire Migros.
This holding is currently 30.50%, after the sale of a 40.25% interest in Anadolu Endüstri
Holding, a leading Turkish conglomerate, which was finalised in 2015, and the exercise of a
put option on a 9.75% stake in Migros in the first half of 2017.
Brief description:
Established in 1954, Migros is the leading company in the food retail sector in Turkey. The
company has 1,844 sales outlets (at 30 June 2017), with a total net area of 1,429 thousand
square metres.
Migros is present in all seven regions of Turkey, and has marginal presences in Kazakhstan
and Macedonia.
The company operates under the following names: Migros and Macrocenter (supermarkets),
5M (hypermarkets), Ramstore (supermarkets abroad) and Kangurum (online store).
Growth in the retail sector in Turkey is a relatively recent phenomenon, brought about by the
transition from traditional systems such as bakkals (small stores typically run by families) to
an increasingly widespread organised distribution model.
On 1 March 2017, Migros completed the acquisition of 95.5% of Tesco-Kipa, a large
supermarket chain with a turnover of over TRY 2 billion and 168 sales outlets. Subsequently,
on 26 July 2017, the acquisition of a further stake was completed, bringing the total
investment in Tesco-Kipa's capital to 96.25%.
The stake in Kenan Investments (indirectly corresponding to approximately 5.2% of Migros'
capital, i.e. 30.50% of Migros' capital via the Group's investment in Kenan Investments) is
recorded in the Consolidated Financial Statements to 30 June 2017 at EUR 66.8 million
(compared with EUR 66.9 million at 31 December 2016).
The decrease (EUR 0.1 million) on the figure at 31 December 2016 is due to a combination of:
- net proceeds (EUR 17.8 million) realised on 1 June 2017 following the exercise of the
put option on the 9.75% stake in Migros;
- an increase in fair value (EUR 17.7 million) due to the combined effect of the rise in the
price per share (TRY 27.56 per share at 30 June 2017, versus TRY 17.58 per share at
Half-Year Report
to 30 June 2017
19
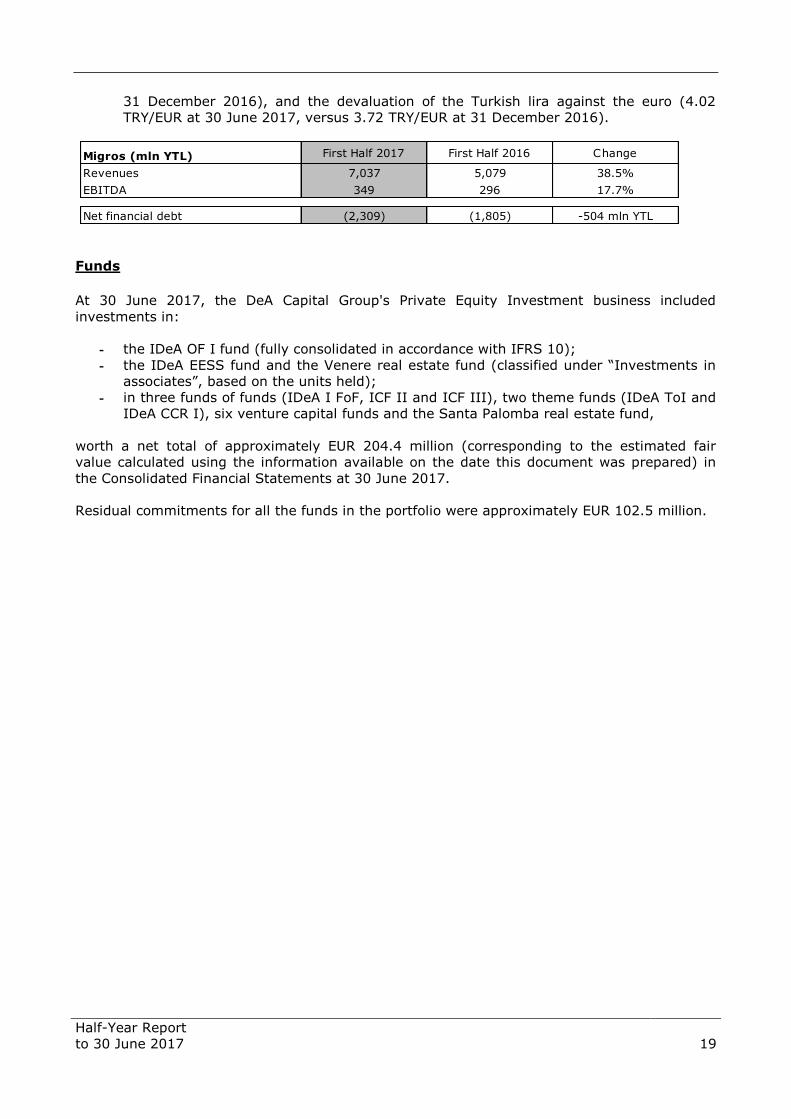
31 December 2016), and the devaluation of the Turkish lira against the euro (4.02
TRY/EUR at 30 June 2017, versus 3.72 TRY/EUR at 31 December 2016).
Funds
At 30 June 2017, the DeA Capital Group's Private Equity Investment business included
investments in:
- the IDeA OF I fund (fully consolidated in accordance with IFRS 10);
- the IDeA EESS fund and the Venere real estate fund (classified under “Investments in
associates”, based on the units held);
- in three funds of funds (IDeA I FoF, ICF II and ICF III), two theme funds (IDeA ToI and
IDeA CCR I), six venture capital funds and the Santa Palomba real estate fund,
worth a net total of approximately EUR 204.4 million (corresponding to the estimated fair
value calculated using the information available on the date this document was prepared) in
the Consolidated Financial Statements at 30 June 2017.
Residual commitments for all the funds in the portfolio were approximately EUR 102.5 million.
Migros (mln YTL) First Half 2017 First Half 2016 Change
Revenues 7,037 5,079 38.5%
EBITDA 349 296 17.7%
Net financial debt (2,309) (1,805) -504 mln YTL
Half-Year Report
to 30 June 2017
20
- IDeA I FoF
IDeA I Fund of Funds
Registered office: Italy
Sector: Private equity
Website: www.ideasgr.com
Investment details:
IDeA I FoF is a closed-end fund under Italian law, for qualified investors, which began operations
on 30 January 2007 and is managed by IDeA Capital Funds SGR.
The DeA Capital Group has a total commitment of up to EUR 173.5 million in the fund.
Brief description:
IDeA I FoF, which has total assets of approximately EUR 681 million, invests its assets in units of
unlisted closed-end funds that are mainly active in the private equity sector in various countries. It
optimises the risk-return profile through careful diversification of assets among managers with a
proven track record of returns and solidity, different investment approaches, geographical areas
and maturities.
According to the latest report available, the IDeA I FoF portfolio was invested in 41 funds with
different investment strategies; these funds in turn hold positions, with varying maturities, in 330
companies active in geographical regions with different growth rates.
The funds are diversified in the buy-out (control) and expansion (minorities) categories, with
overweighting towards medium- and small-scale transactions and special situations (distressed
debt/equity and turnaround).
At 30 June 2017, IDeA I FoF had called up 85.6% of its total commitment and had made
distributions totalling 77.7% of that commitment.
Half-Year Report
to 30 June 2017
21
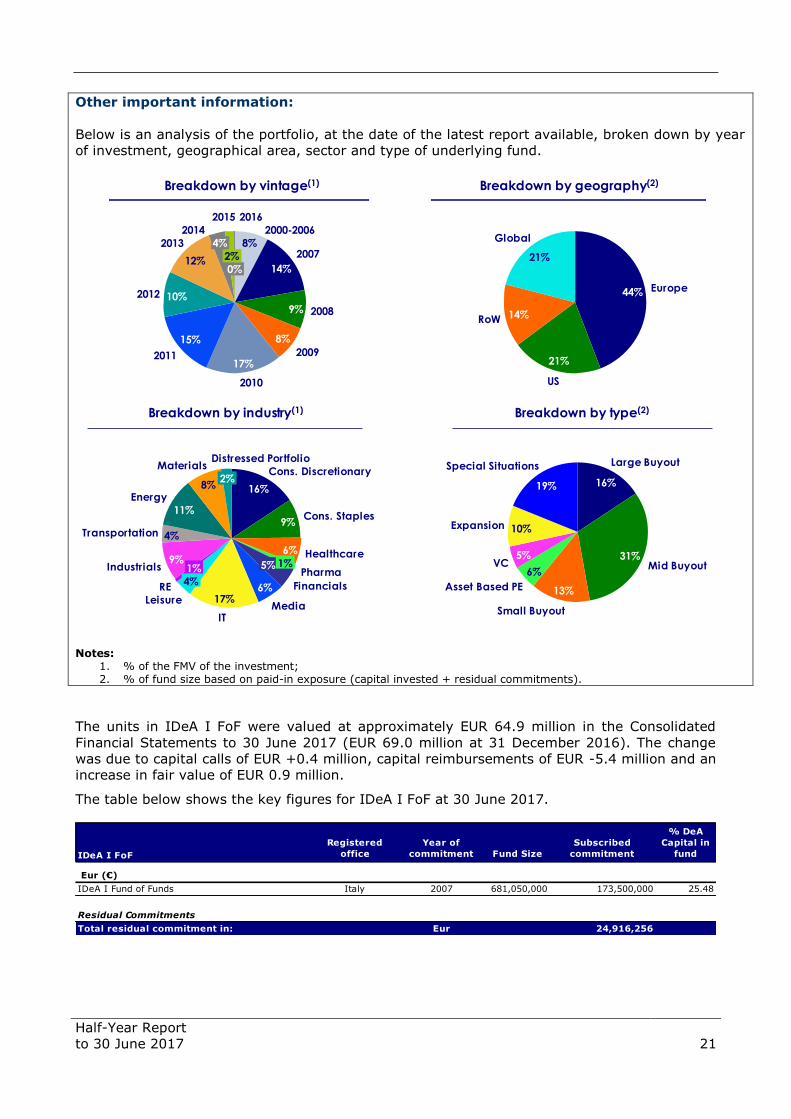
Other important information:
Below is an analysis of the portfolio, at the date of the latest report available, broken down by year
of investment, geographical area, sector and type of underlying fund.
Notes:
1. % of the FMV of the investment; 2. % of fund size based on paid-in exposure (capital invested + residual commitments).
The units in IDeA I FoF were valued at approximately EUR 64.9 million in the Consolidated
Financial Statements to 30 June 2017 (EUR 69.0 million at 31 December 2016). The change
was due to capital calls of EUR +0.4 million, capital reimbursements of EUR -5.4 million and an
increase in fair value of EUR 0.9 million.
The table below shows the key figures for IDeA I FoF at 30 June 2017.
Breakdown by industry(1) Breakdown by type(2)
Breakdown by vintage(1) Breakdown by geography(2)
Global
21%
RoW 14%
US
21%
Europe44%
Mid Buyout31%
Large Buyout
16%
Special Situations
19%
Expansion 10%
VC5%
Asset Based PE
6%
Small Buyout
13%
Distressed Portfolio
2%
Materials
8%Energy
11%
Transportation 4%
Industrials9%
RE
1%
Leisure
4%
IT
17%Media
6% Financials
5%Pharma
1%Healthcare6%
Cons. Staples9%
Cons. Discretionary
16%
2016
0%
2015
2%
2014
4%2013
12%
2012 10%
2011
15%
2010
17%2009
8%
20089%
2007
14%
2000-2006
8%
IDeA I FoF
Registered
office
Year of
commitment Fund Size
Subscribed
commitment
% DeA
Capital in
fund
Eur (€)
IDeA I Fund of Funds Italy 2007 681,050,000 173,500,000 25.48
Residual Commitments
Total residual commitment in: Eur 24,916,256
Half-Year Report
to 30 June 2017
22
- ICF II
ICF II
Registered office: Italy
Sector: Private equity
Website: www.ideasgr.com
Investment details:
ICF II is a closed-end fund under Italian law, for qualified investors, which began operating on 24
February 2009 and is managed by IDeA Capital Funds SGR.
The DeA Capital Group has a total commitment of up to EUR 51 million in the fund.
Brief description:
ICF II, with total assets of EUR 281 million, invests in units of unlisted closed-end funds that are
mainly active in the private equity sector of various countries. It optimises the risk-return profile
through careful diversification of assets among managers with a proven track record of returns and
solidity, different investment approaches, geographical areas and maturities.
The fund started building its portfolio by focusing on funds in the area of mid-market buy-outs,
distressed and special situations, loans, turnarounds and funds with a specific sector slant,
targeting, in particular, opportunities offered in the secondary market.
Based on the latest report available, the ICF II portfolio was invested in 27 funds with different
investment strategies; these funds in turn hold positions, with varying maturities, in around 382
companies active in various geographical areas.
At 30 June 2017, ICF II had called up around 72.1% of its total commitment and had made
distributions totalling 32.0% of that commitment.
Half-Year Report
to 30 June 2017
23
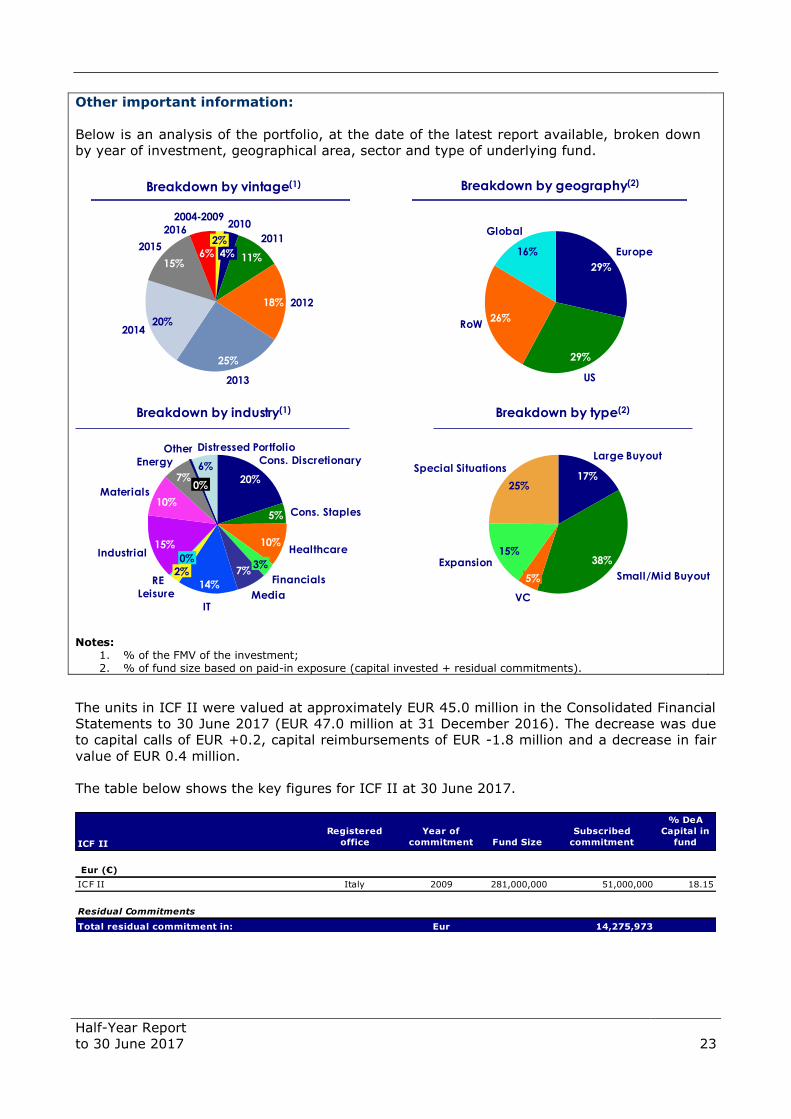
Other important information:
Below is an analysis of the portfolio, at the date of the latest report available, broken down
by year of investment, geographical area, sector and type of underlying fund.
Notes: 1. % of the FMV of the investment; 2. % of fund size based on paid-in exposure (capital invested + residual commitments).
The units in ICF II were valued at approximately EUR 45.0 million in the Consolidated Financial
Statements to 30 June 2017 (EUR 47.0 million at 31 December 2016). The decrease was due
to capital calls of EUR +0.2, capital reimbursements of EUR -1.8 million and a decrease in fair
value of EUR 0.4 million.
The table below shows the key figures for ICF II at 30 June 2017.
Global
16%
RoW26%
US
29%
Europe
29%
Small/Mid Buyout
38%
Large Buyout
17%Special Situations
25%
Expansion15%
VC
5%
6%
2016
2015
15%
201420%
2013
25%
201218%
2011
11%
2010
4%
2004-2009
2%
0%7%
Distressed Portfolio
6%Energy
Other
Materials10%
Industrial15%
RE
0%
Leisure
2%
IT
14%Media
7%Financials
3%
Healthcare10%
Cons. Staples5%
Cons. Discretionary
20%
Breakdown by vintage(1) Breakdown by geography(2)
Breakdown by type(2)Breakdown by industry(1)
ICF II
Registered
office
Year of
commitment Fund Size
Subscribed
commitment
% DeA
Capital in
fund
Eur (€)
ICF II Italy 2009 281,000,000 51,000,000 18.15
Residual Commitments
Total residual commitment in: Eur 14,275,973
Half-Year Report
to 30 June 2017
24
- ICF III
ICF III
Registered office: Italy
Sector: Private equity
Website: www.ideasgr.com
Investment details:
ICF III is a closed-end fund under Italian law, for qualified investors, which began operating on 10
April 2014 and is managed by IDeA Capital Funds SGR.
The DeA Capital Group has a total commitment of up to EUR 12.5 million in the fund.
Brief description:
ICF III, with total assets of approximately EUR 67 million, intends to invest its assets in units of
closed-end private equity funds or in schemes that replicate that financial model, either as the lead
investor or with other co-investors.
The fund is divided into three sub-funds:
Core, with a focus on buy-outs, expansion capital and special situations;
Credit & Distressed, which invests in special credit operations (preferred equity,
mezzanine, senior loans), turnarounds and other credit strategies;
Emerging Markets, which focuses on expansion capital, buy-outs, distressed assets and
venture capital operations in emerging markets.
At 30 June 2017, ICF III had called up 48.1%, 59.0% and 42.5% in the Core, Credit & Distressed
and Emerging Markets segments respectively.
The units in ICF III were valued at a total of EUR 6.6 million in the Consolidated Financial
Statements to 30 June 2017 (EUR 6.9 million at 31 December 2016). The decrease was due to
capital calls of EUR +0.1 million and a decrease in fair value of EUR 0.4 million.
The table below shows the key figures for ICF III at 30 June 2017.
ICF III
Registered
office
Year of
commitment Fund Size
Subscribed
commitment
% DeA
Capital in
fund
Eur (€)
ICF III Italy 2014 66,950,000 12,500,000 18.67
of which:
Segment Core 34,600,000 1,000,000 2.89
Segment Credit & Distressed 17,300,000 4,000,000 23.12
Segment Emerging Markets 15,050,000 7,500,000 49.83
Residual Commitments
Total residual commitment in: Eur 6,472,998
Half-Year Report
to 30 June 2017
25
- IDeA OF I
IDeA Opportunity Fund I
Registered office: Italy
Sector: Private equity
Website: www.ideasgr.com
Investment details:
IDeA OF I is a closed-end fund under Italian law, for qualified investors, which began
operating on 9 May 2008 and is managed by IDeA Capital Funds SGR.
The DeA Capital Group has a total commitment of up to EUR 101.8 million in the fund.
Brief description:
IDeA OF I has total assets of approximately EUR 217 million. Its objective is to invest,
independently or via syndicates with a lead investor, by purchasing qualified minority
interests.
At 30 June 2017, IDeA OF I had called up 84.8% of the total commitment and distributed
31.5% of that commitment, after making nine investments (of which seven were still in the
portfolio at that date).
Significant events during the year
In June 2017, the Carlyle and GTCR funds launched a public takeover bid for the shares of
AMRI, at a value of USD 21.75 per share (compared with a carrying value of USD 15.5 per
share for the OF I fund), with completion expected by the end of 2017. As a reminder, the
AMRI shares in the OF I portfolio came from the sale to AMRI of the entire stake held in
Euticals in 2016; the purchase price for this transaction was settled partly in cash, with the
rest paid for by a vendor note and AMRI shares.
The units held in IDeA OF I were reported in the Consolidated Financial Statements to 30 June
2017 at EUR 45.5 million, an increase on the figure at 31 December 2016 (EUR 44.2 million).
This was due to the combination of pro-rata net profit of EUR +1.1 million for the period and
an increase in fair value of EUR +0.2 million.
The table below shows a breakdown of the fund’s NAV at 30 June 2017. These figures were
fully consolidated in the financial statements of DeA Capital S.p.A..
(EUR million) Industry % share Investment date 100%DeA
Capital
Portfolio investments
Giochi Preziosi Games 4.3% October 8, 2008 5.2 2.4
Manutencoop Facility Management Integrated facility Management 4.7% December 22, 2008 18.9 8.9
Lauro Cinquantasette (Euticals) Active Pharmaceutical Ingredients 8.0% February 10, 2011 15.9 7.5
Iacobucci HF Electronics Aircraft furnishing and coffee machines 34.9% September 11, 2012 6.0 2.8
Pegaso Transportation Investments (Talgo) Rail market 2.5% October 8, 2012 17.3 8.1
2IL Orthopaedics LTD (Corin) Orthopedic implants 29.3% October 31, 2012 15.0 7.0
Elemaster Electronic boards with high technological content 10.0% February 27, 2013 8.5 4.0
Total portfolio investments 86.8 40.7
Other long term receivables 8.8 4.2
Other assets (liabilities) (0.9) (0.5)
Cash and cash equivalents 2.3 1.1
Total Net equity 96.9 45.5
Half-Year Report
to 30 June 2017
26
The table below shows the key figures for IDeA OF I at 30 June 2017.
IDeA OF I
Registered
office
Year of
commitment Fund Size
Subscribed
commitment
% DeA
Capital in
fund
Eur (€)
IDeA Opportunity Fund I Italy 2008 216,550,000 101,750,000 46.99
Residual Commitments
Total residual commitment in: Eur 15,415,125
Half-Year Report
to 30 June 2017
27
- IDeA EESS
IDeA Efficienza Energetica e Sviluppo Sostenibile (IDeA Energy Efficiency and
Sustainable Development)
Registered office: Italy
Sector: Private equity
Website: www.ideasgr.com
Investment details:
IDeA EESS is a closed-end fund under Italian law, for qualified investors, which began
operating on 1 August 2011and is managed by IDeA Capital Funds SGR.
The DeA Capital Group has a total commitment of up to EUR 30.4 million in the fund.
Brief description:
IDeA EESS, which has total assets of EUR 100 million, is a closed-end mutual fund under
Italian law, for qualified investors, which seeks to acquire minority and controlling
shareholdings in unlisted companies in Italy and abroad, by investing jointly with local
partners.
The fund is dedicated to investing in small and medium-sized manufacturing and service
companies operating in the field of energy saving and the efficient use of natural resources.
It focuses on the development of solutions that make faster and cheaper use of renewable
energy sources without compromising effectiveness in reducing CO2 emissions.
At 30 June 2017, IDeA EESS had called up 77.4% of the total commitment and distributed
37.3% of that commitment, after making nine investments (of which eight were still in the
portfolio at that date).
Significant events during the year
In the first half of 2017, the fund completed the sale of 893,000 SMRE shares, generating
proceeds, net of the transaction costs, of EUR 4.35 million. Following this transaction, IDeA
EESS holds a residual stake of 20.45% in SMRE.
The units held in IDeA EESS were reported in the Consolidated Financial Statements to 30 June
2017 at approximately EUR 21.0 million, an increase on the figure at 31 December 2016 (EUR
16.9 million). This was due to the pro-rata net profit of EUR +5.0 million for the period (mainly
associated with the marking to market of the SMRE stock in the portfolio), capital calls of EUR
+0.3 million and distributions of EUR -1.1 million.
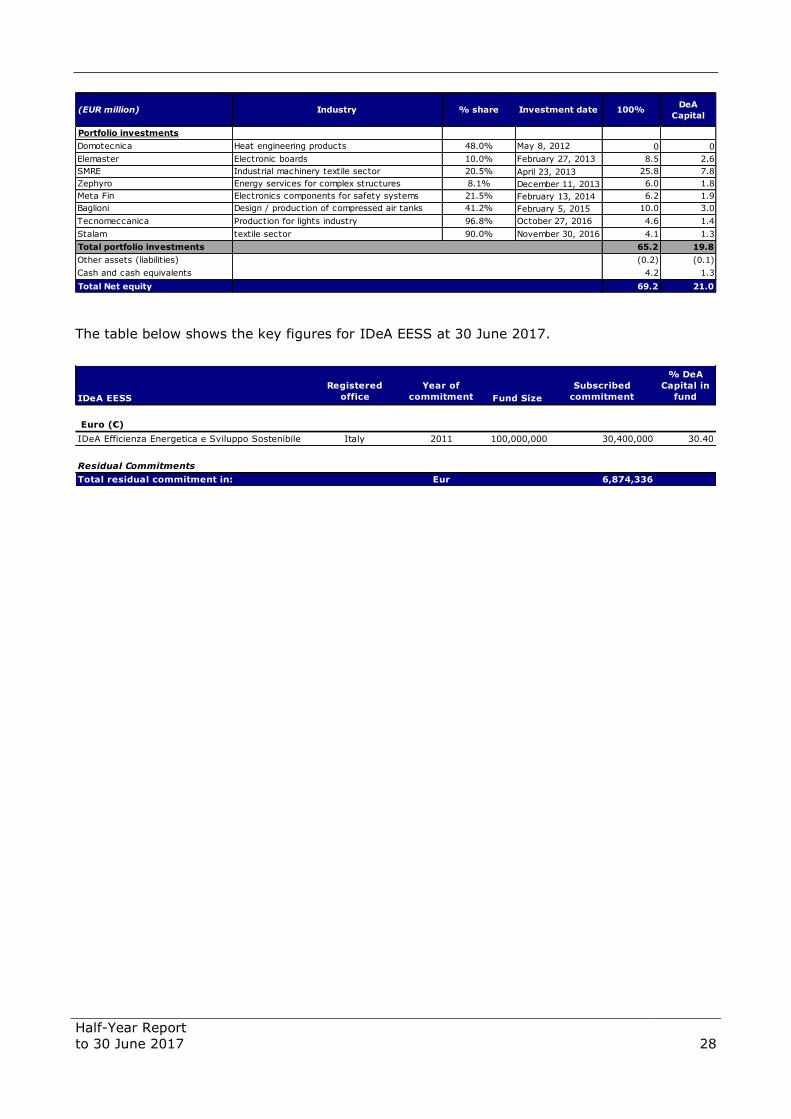
The table below shows a breakdown of the fund’s NAV at 30 June 2017.
Half-Year Report
to 30 June 2017
28
The table below shows the key figures for IDeA EESS at 30 June 2017.
(EUR million) Industry % share Investment date 100%DeA
Capital
Portfolio investments
Domotecnica Heat engineering products 48.0% May 8, 2012 0 0
Elemaster Electronic boards 10.0% February 27, 2013 8.5 2.6
SMRE Industrial machinery textile sector 20.5% April 23, 2013 25.8 7.8
Zephyro Energy services for complex structures 8.1% December 11, 2013 6.0 1.8
Meta Fin Electronics components for safety systems 21.5% February 13, 2014 6.2 1.9
Baglioni Design / production of compressed air tanks 41.2% February 5, 2015 10.0 3.0
Tecnomeccanica Production for lights industry 96.8% October 27, 2016 4.6 1.4
Stalam
Production of radiofrequency machinery for
textile sector 90.0% November 30, 2016 4.1 1.3
Total portfolio investments 65.2 19.8
Other assets (liabilities) (0.2) (0.1)
Cash and cash equivalents 4.2 1.3
Total Net equity 69.2 21.0
IDeA EESS
Registered
office
Year of
commitment Fund Size
Subscribed
commitment
% DeA
Capital in
fund
Euro (€)
IDeA Efficienza Energetica e Sviluppo Sostenibile Italy 2011 100,000,000 30,400,000 30.40
Residual Commitments
Total residual commitment in: Eur 6,874,336
Half-Year Report
to 30 June 2017
29
- IDeA ToI
IDeA Taste of Italy (ToI)
Registered office: Italy
Sector: Private equity
Website: www.ideasgr.com
Investment details:
IDeA ToI is a closed-end fund under Italian law for qualified investors, which began operating
on 30 December 2014, and is managed by IDeA Capital Funds SGR.
The DeA Capital Group has a total commitment of EUR 25.2 million in the fund.
Brief description:
IDeA ToI, which has total assets of EUR 218.1 million, is a closed-end mutual fund under
Italian law, for qualified investors, which seeks to acquire minority and controlling interests in
mainly small and medium-sized enterprises in Italy, either independently or with other co-
investors. The fund invests in companies operating in the agricultural foods sector, especially
in areas involved in the production and distribution of foodstuffs and in secondary (processed)
products or related services.
At 30 June 2017, IDeA ToI had called up 34.4% of its total commitment from subscribers,
after making four investments.
Significant events during the year
On 9 January 2017, the fund invested EUR 19.8 million in a 33% stake in Acque Minerali, a
manufacturer of Lurisia-branded mineral water and drinks.
On 30 March 2017, the fund invested EUR 17 million in a 35% stake in CDS Lavorazione
Materie Plastiche, Italy's leading independent manufacturer of plastic bottle caps.
The units in IDeA ToI were valued at approximately EUR 7.1 million in the Consolidated
Financial Statements to 30 June 2017 (EUR 5.2 million at 31 December 2016). The changes
during the period were mainly due to capital calls of EUR +2.2 million and a EUR 0.3 million
decrease in fair value.
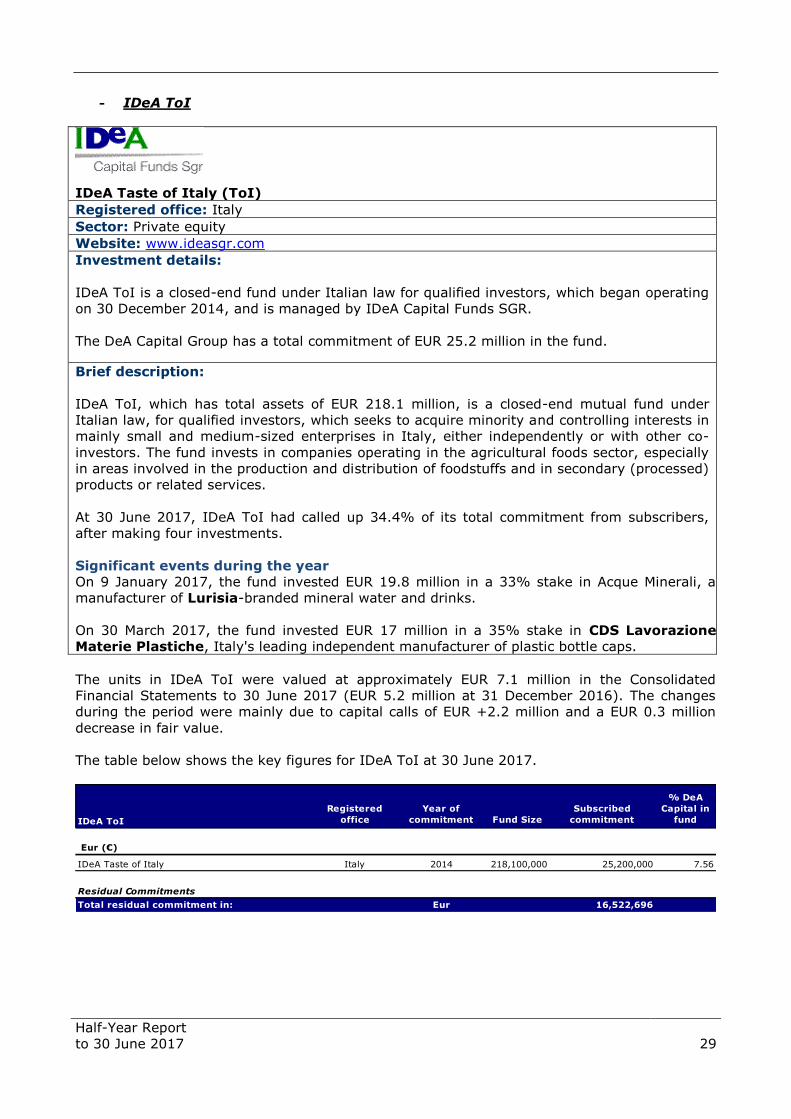
The table below shows the key figures for IDeA ToI at 30 June 2017.
IDeA ToI
Registered
office
Year of
commitment Fund Size
Subscribed
commitment
% DeA
Capital in
fund
Eur (€)
IDeA Taste of Italy Italy 2014 218,100,000 25,200,000 7.56
Residual Commitments
Total residual commitment in: Eur 16,522,696
Half-Year Report
to 30 June 2017
30
- IDeA CCR I
IDeA Corporate Credit Recovery I (IDEA CCR I)
Registered office: Italy
Sector: Private equity
Website: www.ideasgr.com
Investment details:
IDeA CCR I is a closed-end fund under Italian law, for qualified investors, which began
operating on 23 June 2016, and is managed by IDeA Capital Funds SGR.
The DeA Capital Group has a total commitment of EUR 15.2 million in the fund.
Brief description:
IDeA CCR I, which had total assets of EUR 264.3 million at 30 June 2017, is a closed-end
mutual fund under Italian law, for qualified investors, which aims to help relaunch medium-
sized Italian companies that are facing financial difficulties but have solid business
fundamentals (Target Companies), sharing the profits between creditors and new investors,
by the:
- proactive management of loans to the Target Companies;
- potential investments to be carried out via debtor-in-possession financing transactions,
which means that the new investments have greater seniority than existing financial
debt;
- “equity-style” involvement in the management of debtor companies.
The fund is divided into two sub-funds:
Loans sub-fund, which has acquired loans and financial equity instruments relating
to the Target Companies from eight banks for a consideration of approximately EUR
179 million, in exchange for the allocation of units of the Loans sub-fund itself;
New Finance sub-fund, which has obtained commitments for new financial resources
of up to around EUR 85 million, which could be used for the Target Companies or
companies with similar characteristics.
By its very nature, as it was created by means of contributions, the loans segment is fully
invested; as at 30 June 2017, the new finance segment had called up 12.0% of the total
commitment.
The units in IDeA CCR I were valued at approximately EUR 1.7 million in the Consolidated
Financial Statements to 30 June 2017 (EUR 0.1 million at 31 December 2016). The changes
during the period were mainly due to capital calls of EUR +1.6 million.
The table below shows the key figures for the IDeA CCR I fund at 30 June 2017.
Half-Year Report
to 30 June 2017
31
- Venere
Registered office: Italy
Sector: Private Equity – Real Estate
Website: www.ideafimit.it
Investment details:
In March 2017, the Group completed the early liquidation of the Atlantic Value Added fund via
the distribution in kind of the units held in the Venere fund and of the remaining liquidity.
Thus, at the date of this document, the DeA Capital Group directly owns 9.1% of the Venere
fund and has no residual commitments.
Brief description:
The fund, which is managed by the subsidiary IDeA FIMIT SGR and has a commitment of
around EUR 77 million, comprises real estate of 15 buildings for predominantly residential
use, comprising five free-standing buildings and ten property units that were sold separately.
The real estate portfolio is located in northern Italy, mainly in Milan, where there are seven
buildings representing approximately 70% of the assets by market value.
The units in Venere were valued at approximately EUR 3.3 million in the Consolidated Financial
Statements to 30 June 2017 (EUR 3.7 million at 31 December 2016). The changes during the
period were mainly due to distributions of EUR -0.4 million in the period.
The table below shows the key figures for the Venere fund at 30 June 2017.
IDeA CCR I
Registered
office
Year of
commitment Fund Size
Subscribed
commitment
% DeA
Capital in
fund
Euro (€)
IDeA CCR I Italy 2016 264,321,595 15,150,000 5.73
of which:
Segment New Financing 85,250,000 15,075,000 17.68
Segment Credit 179,071,595 75,000 0.04
Residual Commitments
Total residual commitment in: Eur 13,229,906
Venere
Registered
office
Year of
commitment Fund Size
Subscribed
commitment
% DeA
Capital in
fund
Eur (€)
Venere Italy 2011 77,000,000 7,000,000 9.09
Residual Commitments
Total residual commitment in: Eur 0

Half-Year Report
to 30 June 2017
32
- Santa Palomba
DeA Capital S.p.A. has subscribed to a total commitment of EUR 1.0 million. The fund, which is
managed by the subsidiary IDeA FIMIT SGR, builds social housing in the metropolitan area of
Rome.
The units in Santa Palomba are valued at approximately EUR 0.4 million in the Consolidated
Financial Statements to 30 June 2017 (unchanged on the figure at 31 December 2016).
The table below shows the key figures for the Santa Palomba fund at 30 June 2017.
- Venture capital funds
The units in venture capital funds had a total value of approximately EUR 8.9 million in the
Financial Statements to 30 June 2017 (EUR 9.5 million at 31 December 2016). The decrease
was due to capital distributions of EUR -0.2 million and the decrease in fair value of EUR 0.4
million.
The table below shows the key figures for venture capital funds in the portfolio at 30 June
2017.
Santa Palomba
Registered
office
Year of
commitmentFund Size
Subscribed
commitment
% DeA
Capital in
fund
Eur (€)
Santa Palomba Italy 2016 82,500,000 1,000,000 1.21
Residual Commitments
Total residual commitment in: Eur 600,000
Venture Capital Funds Registered officeYear of
commitmentFund Size
Subscribed
commitment
% DeA Capital
in fund
Dollars (USD)
Doughty Hanson & Co Technology UK EU 2004 271,534,000 1,925,000 0.71
GIZA GE Venture Fund III Delaware U.S.A. 2003 211,680,000 10,000,000 4.72
Israel Seed IV Cayman Islands 2003 200,000,000 5,000,000 2.50
Pitango Venture Capital III Delaware U.S.A. 2003 417,172,000 5,000,000 1.20
Totale Dollars 21,925,000
Eur (€)
Nexit Infocom 2000 Guernsey 2000 66,325,790 3,819,167 5.76
Sterlings (GBP)
Amadeus Capital II UK EU 2000 235,000,000 13,500,000 5.74
Residual Commitments
Total residual commitment in: Eur 4,237,378
Half-Year Report
to 30 June 2017
33
Alternative Asset Management
At 30 June 2017, DeA Capital S.p.A. was the owner of:
100% of IDeA Capital Funds SGR;
64.3% of IDeA FIMIT SGR;
85.0% of SPC (which operates in debt recovery);
45.0% of IRE/IRE Advisory (which operates in project, property and facility
management, and real estate brokerage).
- IDeA Capital Funds SGR
Registered office: Italy
Sector: Alternative Asset Management - Private Equity
Website: www.ideasgr.com
Investment details:
IDeA Capital Funds SGR operates in the management of private equity funds (funds of funds, co-
investment funds and theme funds). At 30 June 2017, the asset management company managed
nine closed-end private equity funds, including four funds of funds (IDeA I FoF, ICF II, ICF III and
IDeA Crescita Globale, which serves the retail segment), a “direct” co-investment fund (IDeA OF
I), three theme funds (IDeA EESS, which operates in energy efficiency, IDeA ToI, in the
agricultural foods sector, and IDeA CCR I, Italy's leading debtor-in-possession financing fund)
and, since April 2015, Investitori Associati IV (in liquidation).
The investment programmes of IDeA Capital Funds SGR, which are regulated by the Bank of Italy
and Consob, capitalise on the management teams' wealth of experience.
The investment strategies of the funds of funds focus on building diversified portfolios in private
equity funds that are in the top quartile or that are next-generation leaders with balanced asset
allocation through diversification by:
industrial sector;
investment strategy and stage (buy-outs, venture capital, special situations, etc.);
geographical area (Europe, US and the Rest of the World);
maturity (commitments with investment periods diluted over time).
The investment strategies of the “direct” co-investment fund focus on minority interests in
businesses that primarily concentrate on Europe, and on diversification based on the appeal of
individual sectors.
The investment philosophy of the IDeA EESS sector fund focuses on growth capital and buy-out
private equity to support the growth of small and medium-sized enterprises with products/services
of excellence in energy efficiency and sustainable development.
The investment target of the IDeA ToI fund is small and medium-sized enterprises operating in
the agricultural foods industry, through operations in development capital and early-stage buy-
outs.
The IDeA CCR I fund's objective is to relaunch medium-sized Italian companies that are in
financial difficulties but have solid business fundamentals.
Half-Year Report
to 30 June 2017
34
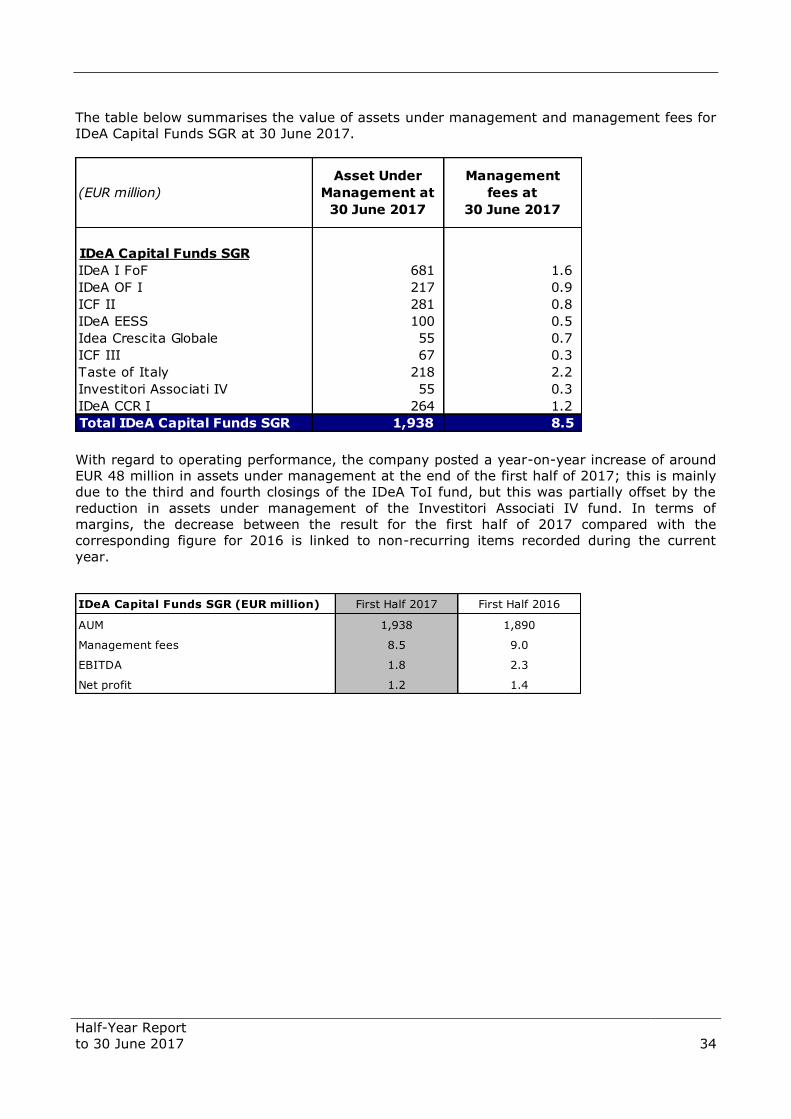
The table below summarises the value of assets under management and management fees for
IDeA Capital Funds SGR at 30 June 2017.
With regard to operating performance, the company posted a year-on-year increase of around
EUR 48 million in assets under management at the end of the first half of 2017; this is mainly
due to the third and fourth closings of the IDeA ToI fund, but this was partially offset by the
reduction in assets under management of the Investitori Associati IV fund. In terms of
margins, the decrease between the result for the first half of 2017 compared with the
corresponding figure for 2016 is linked to non-recurring items recorded during the current
year.
(EUR million)
Asset Under
Management at
30 June 2017
Management
fees at
30 June 2017
IDeA Capital Funds SGR
IDeA I FoF 681 1.6
IDeA OF I 217 0.9
ICF II 281 0.8
IDeA EESS 100 0.5
Idea Crescita Globale 55 0.7
ICF III 67 0.3
Taste of Italy 218 2.2
Investitori Associati IV 55 0.3
IDeA CCR I 264 1.2
Total IDeA Capital Funds SGR 1,938 8.5
IDeA Capital Funds SGR (EUR million) First Half 2017 First Half 2016
AUM 1,938 1,890
Management fees 8.5 9.0
EBITDA 1.8 2.3
Net profit 1.2 1.4
Half-Year Report
to 30 June 2017
35
- IDeA FIMIT SGR
Registered office: Italy
Sector: Alternative Asset Management – Real Estate
Website: www.ideafimit.it
Investment details:
IDeA FIMIT SGR is the largest independent real estate asset management company in Italy,
with around EUR 9.4 billion in assets under management and 41 managed funds (including
five listed funds). This makes it a benchmark operator for Italian and international
institutional investors in the promotion, creation and management of mutual real estate
investment funds.
IDeA FIMIT SGR is engaged in three main lines of business:
the development of mutual real estate investment funds designed for institutional
clients and private investors;
the promotion of innovative real estate financial instruments to satisfy investors’
increasing demands;
the professional management (technical, administrative and financial) of real estate
funds with the assistance of in-house experts and independent technical, legal and tax
advisors.
The company has concentrated investments in transactions with low risk, stable returns, low
volatility, simple financial structures and, most importantly, an emphasis on property value.
In particular, the asset management company specialises in “core” and “core plus” properties,
although its major investments also include “value added” transactions.
Due in part to successful transactions concluded in recent years, the asset management
company is able to rely on a panel of prominent unit-holders consisting of Italian and
international investors of high standing, such as pension funds, banking and insurance
groups, companies and sovereign funds.
The table below summarises the value of assets under management and management fees for
IDeA FIMIT SGR at 30 June 2017.
(EUR million)
Asset Under
Management at
30 June 2017
Management
fees at
30 June 2017
Breakdown of funds
Atlantic 1 533 0.9
Atlantic 2 Berenice 151 0.3
Alpha 336 2.0
Beta 50 0.1
Delta 186 1.2
Listed funds 1,256 4.5
Reserved funds 8,097 15.5
Total IDeA FIMIT SGR 9,353 20.0
Half-Year Report
to 30 June 2017
36
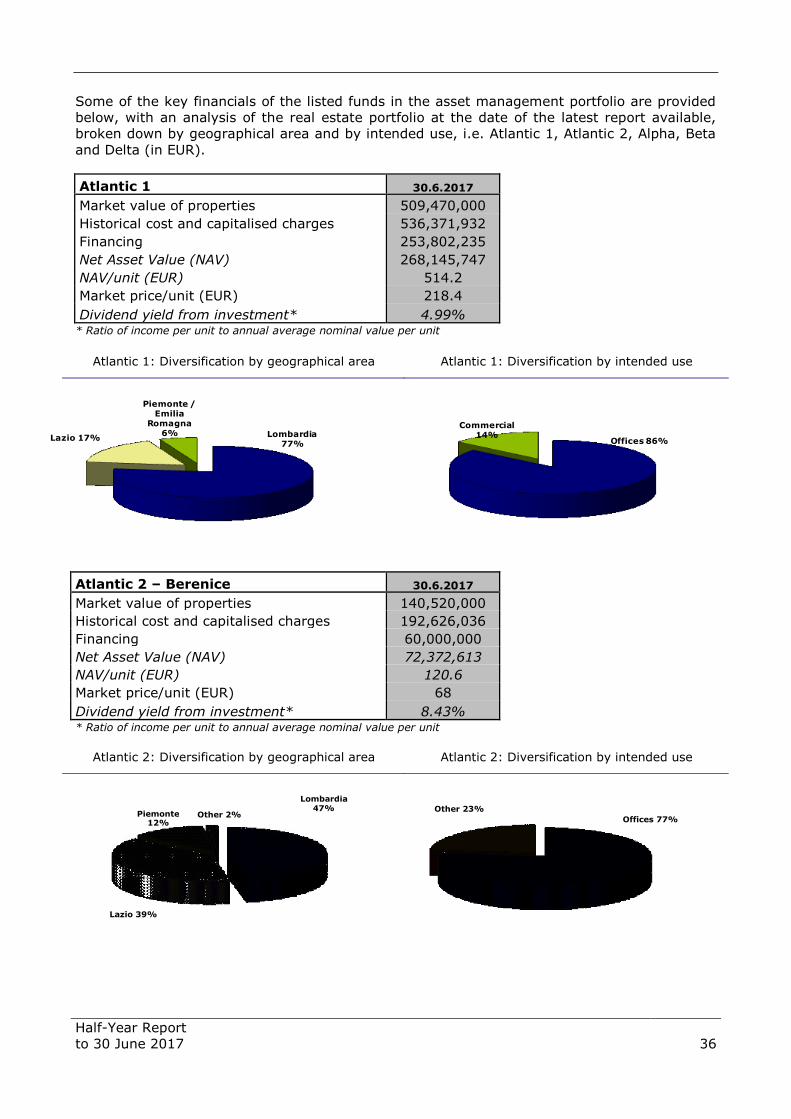
Some of the key financials of the listed funds in the asset management portfolio are provided
below, with an analysis of the real estate portfolio at the date of the latest report available,
broken down by geographical area and by intended use, i.e. Atlantic 1, Atlantic 2, Alpha, Beta
and Delta (in EUR).
Atlantic 1 30.6.2017
Market value of properties 509,470,000
Historical cost and capitalised charges 536,371,932
Financing 253,802,235
Net Asset Value (NAV) 268,145,747
NAV/unit (EUR) 514.2
Market price/unit (EUR) 218.4
Dividend yield from investment* 4.99% * Ratio of income per unit to annual average nominal value per unit
Atlantic 1: Diversification by geographical area Atlantic 1: Diversification by intended use
Atlantic 2 – Berenice 30.6.2017
Market value of properties 140,520,000
Historical cost and capitalised charges 192,626,036
Financing 60,000,000
Net Asset Value (NAV) 72,372,613
NAV/unit (EUR) 120.6
Market price/unit (EUR) 68
Dividend yield from investment* 8.43% * Ratio of income per unit to annual average nominal value per unit
Atlantic 2: Diversification by geographical area Atlantic 2: Diversification by intended use
Lombardia 77%
Lazio 17%
Piemonte / Emilia
Romagna 6%
Offices 86%
Commercial 14%
Lombardia 47%
Lazio 39%
Piemonte 12%
Other 2% Offices 77%
Other 23%
Half-Year Report
to 30 June 2017
37
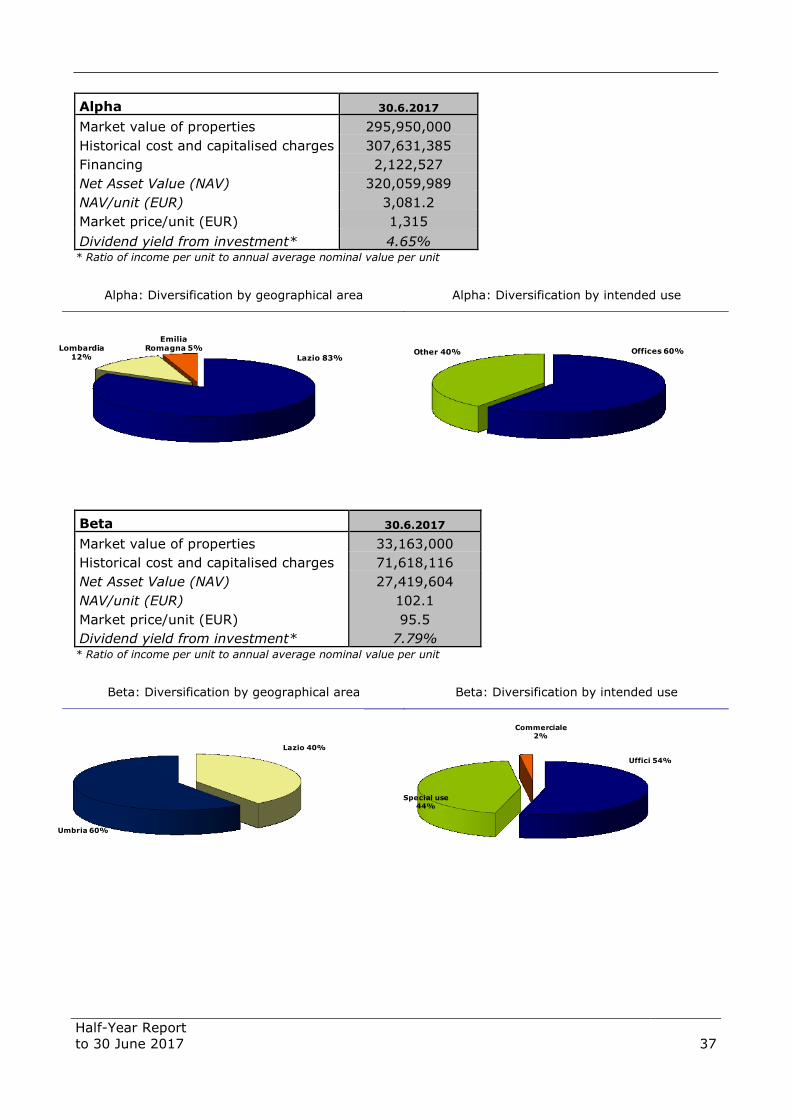
Alpha 30.6.2017
Market value of properties 295,950,000
Historical cost and capitalised charges 307,631,385
Financing 2,122,527
Net Asset Value (NAV) 320,059,989
NAV/unit (EUR) 3,081.2
Market price/unit (EUR) 1,315
Dividend yield from investment* 4.65% * Ratio of income per unit to annual average nominal value per unit
Alpha: Diversification by geographical area Alpha: Diversification by intended use
Beta 30.6.2017
Market value of properties 33,163,000
Historical cost and capitalised charges 71,618,116
Net Asset Value (NAV) 27,419,604
NAV/unit (EUR) 102.1
Market price/unit (EUR) 95.5
Dividend yield from investment* 7.79% * Ratio of income per unit to annual average nominal value per unit
Beta: Diversification by geographical area Beta: Diversification by intended use
Lazio 83%
Lombardia 12%
Emilia Romagna 5% Offices 60%Other 40%
Lazio 40%
Umbria 60%
Uffici 54%
Special use 44%
Commerciale 2%
Half-Year Report
to 30 June 2017
38
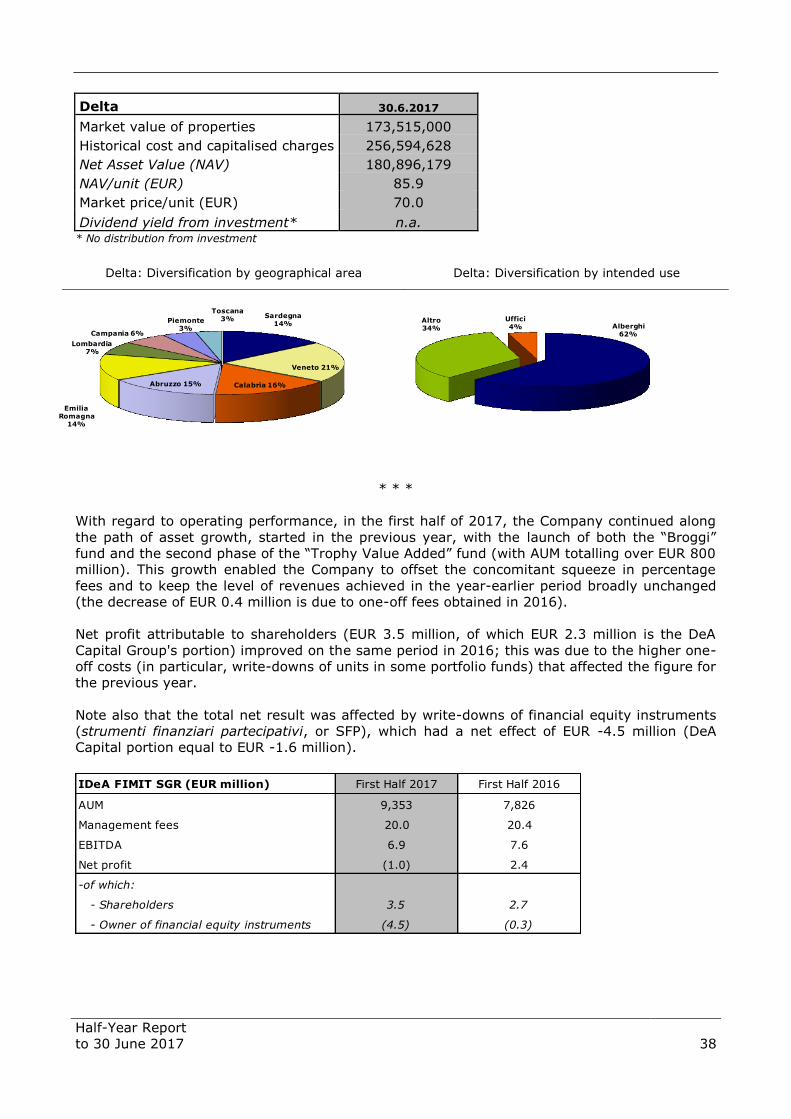
Delta 30.6.2017
Market value of properties 173,515,000
Historical cost and capitalised charges 256,594,628
Net Asset Value (NAV) 180,896,179
NAV/unit (EUR) 85.9
Market price/unit (EUR) 70.0
Dividend yield from investment* n.a. * No distribution from investment
Delta: Diversification by geographical area Delta: Diversification by intended use
* * *
With regard to operating performance, in the first half of 2017, the Company continued along
the path of asset growth, started in the previous year, with the launch of both the “Broggi”
fund and the second phase of the “Trophy Value Added” fund (with AUM totalling over EUR 800
million). This growth enabled the Company to offset the concomitant squeeze in percentage
fees and to keep the level of revenues achieved in the year-earlier period broadly unchanged
(the decrease of EUR 0.4 million is due to one-off fees obtained in 2016).
Net profit attributable to shareholders (EUR 3.5 million, of which EUR 2.3 million is the DeA
Capital Group's portion) improved on the same period in 2016; this was due to the higher one-
off costs (in particular, write-downs of units in some portfolio funds) that affected the figure for
the previous year.
Note also that the total net result was affected by write-downs of financial equity instruments
(strumenti finanziari partecipativi, or SFP), which had a net effect of EUR -4.5 million (DeA
Capital portion equal to EUR -1.6 million).
Alberghi62%
Altro34%
Uffici4%
Sardegna 14%
Veneto 21%
Calabria 16%Abruzzo 15%
Emilia Romagna
14%
Lombardia 7%
Campania 6%
Piemonte 3%
Toscana 3%
IDeA FIMIT SGR (EUR million) First Half 2017 First Half 2016
AUM 9,353 7,826
Management fees 20.0 20.4
EBITDA 6.9 7.6
Net profit (1.0) 2.4
-of which:
- Shareholders 3.5 2.7
- Owner of financial equity instruments (4.5) (0.3)
Half-Year Report
to 30 June 2017
39
- SPC
Registered office: Italy
Sector: Debt recovery Website: www.spc-spa.com
Investment details:
SPC Credit Management has been operating for over 15 years in restructuring, outsourced
management and the enhancement of non-performing loans.
Over the years, the company has developed specific expertise, namely:
debt recovery actions in and out of court (with a strong performance in out-of-court
resolutions of non-performing loans);
advisory services via the valuation and clustering of credit portfolios and the
identification of strategic solutions to enhance the value of these;
due diligence and asset quality reviews of NPL portfolio acquisitions.
With specific regard to debt recovery, the company has acquired the expertise to monitor the
entire range of non-performing loans, namely:
banking (current accounts; mortgages, personal loans);
leasing (terminated or active agreements; remaining leased properties post-sale of non-
performing portfolio);
consumer (consumer credit, salary-backed loans, credit cards);
commercial (outstanding invoices);
with a focus on secured loans.
During the first half of 2017, SPC launched a reorganisation of operating procedures under the
leadership of a new management team, which led, inter alia, to a more prudent valuation of
prospective income flows. This had a one-off effect of EUR -2.9 million (of which EUR -2.4
million related to goodwill impairment, with the remainder relating to extraordinary expenses)
on the Group's Income Statement, which should be added to the pro-rata portion of the net
result for the period (Group portion: EUR -0.3 million).
SPC (EUR million) First Half 2017
Revenues 343
EBITDA 0.4
Net profit (0.4)
Half-Year Report
to 30 June 2017
40
- Innovation Real Estate
Registered office: Italy
Sector: Property Services Website: www.innovationre.it
Investment details:
Innovation Real Estate (IRE) operates in property valuation and is structured along the
following strategic lines:
project & construction management (property planning, development and
refurbishment);
property management (administrative and legal management of properties);
facility & building management (services connected with buildings and related
maintenance);
due diligence (technical and environmental due diligence, town-planning
regularisation procedures);
asset management (strategic support for improving the rental condition of buildings
and optimising associated management costs, in order to maximise the return on
property investment).
IRE currently manages a property portfolio comprising 50% offices, with the remainder split
between commercial, tourist, logistics & industrial, and residential property.
The investment in IRE (45%), which is classified under “Investments in associates”, was
recorded at EUR 4.9 million in the Consolidated Financial Statements to 30 June 2017.
Turning to management performance, the company was affected in the first half of 2017 by
the completion of some project management tasks during 2016 (revenue was EUR 1.5 million
lower, EUR 0.9 million of which was due to one-off income reflected in the 2016 figure).
Innovation Real Estate (EUR million) First Half 2017 First Half 2016
Revenues 6.0 7.8
EBITDA 0.7 2.4
Net profit 1.2 2.1

Half-Year Report
to 30 June 2017
41
Consolidated Income Statement
The Group reported net profit of EUR 6.2 million for the first half of 2017, compared with net
profit of EUR 1.9 million in the same period of 2016.
Revenues and other income break down as follows:
- fees of EUR 27.7 million for the Alternative Asset Management business (EUR 28.5
million in the same period of 2016);
- income from investments valued at equity of EUR +5.3 million, linked to the
performance of the EESS fund;
- other investment income, net of expenses, totalling EUR 7.2 million (EUR -1.9 million in
the same period of 2016); this was mainly due to the effects of exercising the put
option on a 9.75% stake in Migros (EUR 3.8 million) and the performance of the
investments held by IDeA OF I;
- service revenues of EUR 0.3 million (EUR 7.6 million recorded in 2016), which were
lower due to the deconsolidation of IRE from June 2016.
In the first half of 2017, costs totalled EUR 35.3 million, compared with EUR 32.3 million in the
same period of 2016.
Costs in the first half of 2017 break down into EUR 31.3 million relating to Alternative Asset
Management, EUR 1.2 million to Private Equity Investment and EUR 2.9 million to holding
company activities. Alternative Asset Management costs include the effects of amortisation and
write-downs of intangible assets, totalling EUR 6.8 million, recorded when a portion of the
purchase price of the investment in IDeA FIMIT SGR was allocated.
Net financial expenses totalled EUR 0.1 million at 30 June 2017 (compared with expenses of
EUR 1.3 million in the same period of 2016).
The total tax impact for the first half of 2017, totalling EUR +0.4 million (EUR -0.9 million in
the first half of 2016), is the result of taxes of EUR 0.4 million due in respect of Alternative
Asset Management activities (EUR 2.8 million due in the same period of 2016) and tax credits
of EUR +0.8 million relating to holding company activities (EUR +1.9 million in the first half of
2016). Alternative Asset Management taxes include the positive tax effect of amortisation and
write-downs of intangible assets, totalling EUR 1.8 million, recorded when a portion of the
purchase price of the investment in IDeA FIMIT SGR was allocated.
Consolidated net profit of EUR 5.6 million breaks down as follows: EUR +11.3 million
attributable to Private Equity Investment, EUR -3.0 million to Alternative Asset Management
and EUR -2.6 million to holding company operations/eliminations.
The Group’s net profit of EUR 6.2 million comprises: EUR +10.1 million attributable to Private
Equity Investment, EUR -1.2 million to Alternative Asset Management and EUR -2.6 million to
holding company operations/eliminations.
Half-Year Report
to 30 June 2017
42
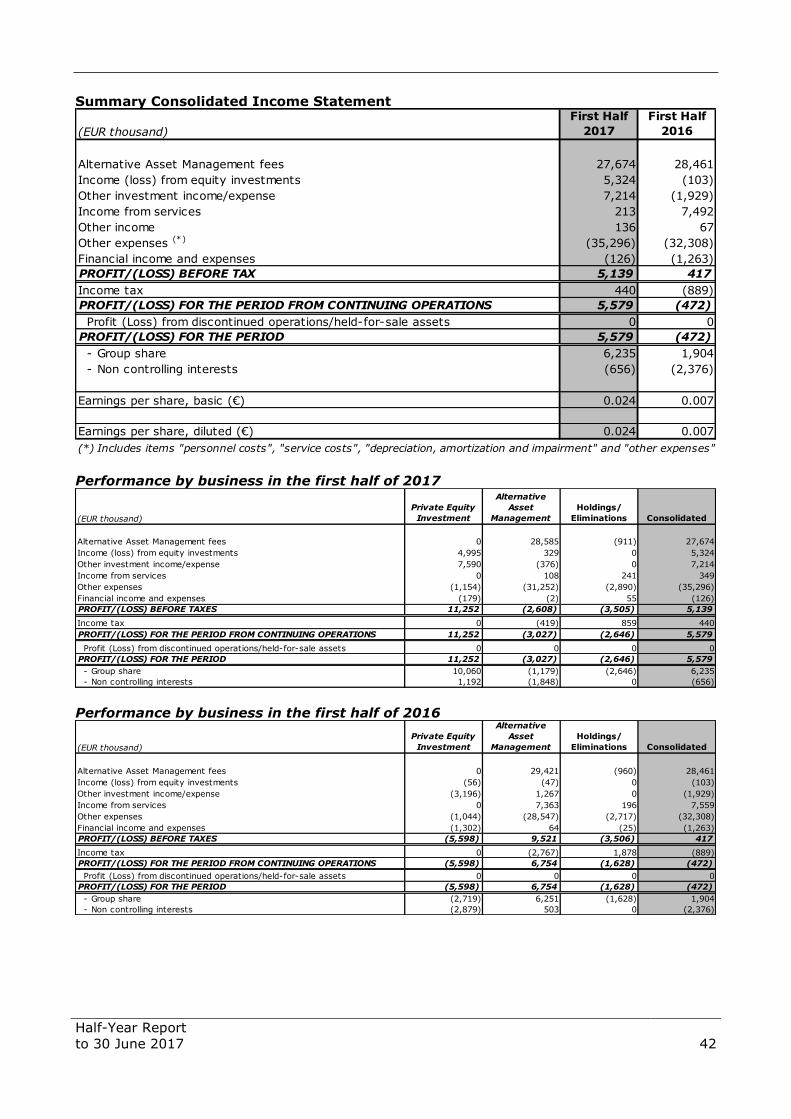
Summary Consolidated Income Statement
Performance by business in the first half of 2017
Performance by business in the first half of 2016
(EUR thousand)
First Half
2017
First Half
2016
Alternative Asset Management fees 27,674 28,461
Income (loss) from equity investments 5,324 (103)
Other investment income/expense 7,214 (1,929)
Income from services 213 7,492
Other income 136 67
Other expenses (*) (35,296) (32,308)
Financial income and expenses (126) (1,263)
PROFIT/(LOSS) BEFORE TAX 5,139 417
Income tax 440 (889)
PROFIT/(LOSS) FOR THE PERIOD FROM CONTINUING OPERATIONS 5,579 (472)
Profit (Loss) from discontinued operations/held-for-sale assets 0 0
PROFIT/(LOSS) FOR THE PERIOD 5,579 (472)
- Group share 6,235 1,904
- Non controlling interests (656) (2,376)
Earnings per share, basic (€) 0.024 0.007
Earnings per share, diluted (€) 0.024 0.007
(*) Includes items "personnel costs", "service costs", "depreciation, amortization and impairment" and "other expenses"
(EUR thousand)
Private Equity
Investment
Alternative
Asset
Management
Holdings/
Eliminations Consolidated
Alternative Asset Management fees 0 28,585 (911) 27,674
Income (loss) from equity investments 4,995 329 0 5,324
Other investment income/expense 7,590 (376) 0 7,214
Income from services 0 108 241 349
Other expenses (1,154) (31,252) (2,890) (35,296)
Financial income and expenses (179) (2) 55 (126)
PROFIT/(LOSS) BEFORE TAXES 11,252 (2,608) (3,505) 5,139
Income tax 0 (419) 859 440
PROFIT/(LOSS) FOR THE PERIOD FROM CONTINUING OPERATIONS 11,252 (3,027) (2,646) 5,579
Profit (Loss) from discontinued operations/held-for-sale assets 0 0 0 0
PROFIT/(LOSS) FOR THE PERIOD 11,252 (3,027) (2,646) 5,579
- Group share 10,060 (1,179) (2,646) 6,235
- Non controlling interests 1,192 (1,848) 0 (656)
(EUR thousand)
Private Equity
Investment
Alternative
Asset
Management
Holdings/
Eliminations Consolidated
Alternative Asset Management fees 0 29,421 (960) 28,461
Income (loss) from equity investments (56) (47) 0 (103)
Other investment income/expense (3,196) 1,267 0 (1,929)
Income from services 0 7,363 196 7,559
Other expenses (1,044) (28,547) (2,717) (32,308)
Financial income and expenses (1,302) 64 (25) (1,263)
PROFIT/(LOSS) BEFORE TAXES (5,598) 9,521 (3,506) 417
Income tax 0 (2,767) 1,878 (889)
PROFIT/(LOSS) FOR THE PERIOD FROM CONTINUING OPERATIONS (5,598) 6,754 (1,628) (472)
Profit (Loss) from discontinued operations/held-for-sale assets 0 0 0 0
PROFIT/(LOSS) FOR THE PERIOD (5,598) 6,754 (1,628) (472)
- Group share (2,719) 6,251 (1,628) 1,904
- Non controlling interests (2,879) 503 0 (2,376)
Half-Year Report
to 30 June 2017
43
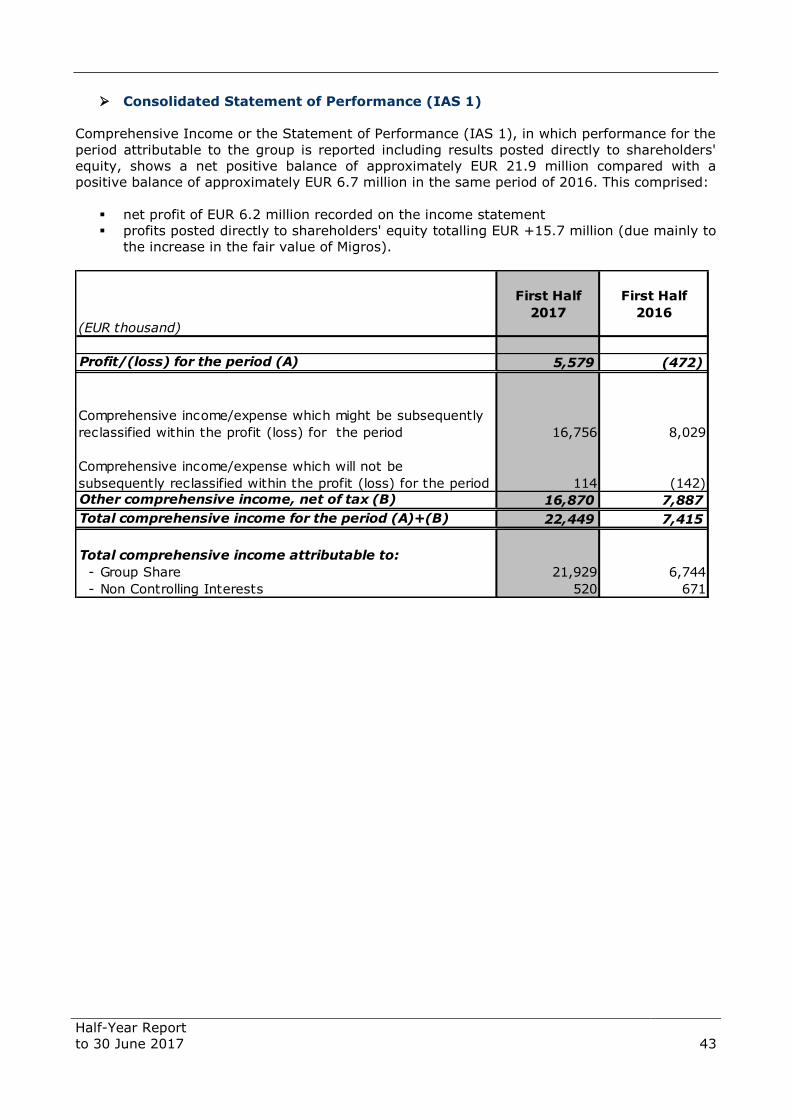
Consolidated Statement of Performance (IAS 1)
Comprehensive Income or the Statement of Performance (IAS 1), in which performance for the
period attributable to the group is reported including results posted directly to shareholders'
equity, shows a net positive balance of approximately EUR 21.9 million compared with a
positive balance of approximately EUR 6.7 million in the same period of 2016. This comprised:
net profit of EUR 6.2 million recorded on the income statement
profits posted directly to shareholders' equity totalling EUR +15.7 million (due mainly to
the increase in the fair value of Migros).
(EUR thousand)
First Half
2017
First Half
2016
Profit/(loss) for the period (A) 5,579 (472)
Comprehensive income/expense which might be subsequently
reclassified within the profit (loss) for the period 16,756 8,029
Comprehensive income/expense which will not be
subsequently reclassified within the profit (loss) for the period 114 (142)
Other comprehensive income, net of tax (B) 16,870 7,887
Total comprehensive income for the period (A)+(B) 22,449 7,415
Total comprehensive income attributable to:
- Group Share 21,929 6,744
- Non Controlling Interests 520 671

Half-Year Report
to 30 June 2017
44
Consolidated statement of financial position
Below is the Group’s Statement of Financial Position at 30 June 2017, compared with 31
December 2016.
(EUR thousand)
June 30,
2017
December 31,
2016
ASSETS
Non-current assets
Intangible and tangible assets
Goodwill 127,923 129,399
Intangible assets 24,168 27,184
Property, plant and equipment 1,804 2,145
Total intangible and tangible assets 153,895 158,728
Investments
Investments valued at equity 36,023 33,449
Investments held by Funds 86,764 84,084
- available for sale investments 48,531 47,845
- invest. in associates and JV valued at FV through P&L 38,233 36,239
Other available-for-sale companies 75,681 67,166
Available-for-sale funds 181,528 182,787
Other avalaible-for-sale financial assets 22 22
Total Investments 380,018 367,508
Other non-current assets
Deferred tax assets 1,805 1,992
Loans and receivables 506 960
Tax receivables from Parent companies 755 0
Other non-current assets 25,375 30,147
Total other non-current assets 28,441 33,099
Total non-current assets 562,354 559,335
Current assets
Trade receivables 17,089 11,191
Available-for-sale financial assets 4,216 4,242
Financial receivables 578 2,715
Tax receivables from Parent companies 2,282 2,282
Other tax receivables 3,290 9,190
Other receivables 5,401 3,976
Cash and cash equivalents 77,206 96,438
Total current assets 110,062 130,034
Total current assets 110,062 130,034
Held-for-sale assets 11,487 11,487
TOTAL ASSETS 683,903 700,856
SHAREHOLDERS' EQUITY AND LIABILITIES
SHAREHOLDERS' EQUITY
Net equity Group 515,440 529,203
Minority interests 130,627 131,844
Shareholders' equity 646,067 661,047
LIABILITIES
Non-current liabilities
Deferred tax liabilities 8,569 8,588
Provisions for employee termination benefits 3,874 4,016
Long term financial loans 19 19
Payables to staff 206 207
Total non-current liabilities 12,668 12,830
Current liabilities
Trade payables 5,824 6,019
Payables to staff and social security organisations 5,413 7,033
Current tax 2,789 2,941
Other tax payables 1,190 1,429
Other payables 9,255 8,335
Short term financial loans 697 1,222
Total current liabilities 25,168 26,979
Held-for-sale liabilities - -
TOTAL SHAREHOLDERS' EQUITY AND LIABILITIES 683,903 700,856

Half-Year Report
to 30 June 2017
45
At 30 June 2017, Consolidated Shareholders' Equity relating to the Group totalled EUR 515.4
million, compared with EUR 529.2 million at 31 December 2016.
The decrease of about EUR 13.8 million in Group Shareholders' Equity in the first half of 2017
was mainly due to the extraordinary dividend paid (EUR 31.2 million), as well as the effects of
changes in treasury shares (totalling EUR -4.9 million), and the reasons set out in the
Statement of Performance (IAS 1) (EUR +21.9 million).
Consolidated net financial position
At 30 June 2017, the consolidated net financial position was positive at EUR 81.8 million, as
shown in the table below, which provides a comparison with 31 December 2016:
The decrease of EUR 21.3 million in the consolidated net financial position in the first half of
2017 was mainly due to the distribution of the extraordinary dividend by DeA Capital S.p.A.
(EUR -31.2 million), changes in own shares (EUR -4.9 million) and the net cash generated by
private equity investments (EUR +14.4 million).
The Company believes that the cash and cash equivalents and the other financial resources
available are sufficient to meet the requirement relating to payment commitments already
subscribed to in funds, also taking into account the amounts expected to be called
up/distributed by these funds. With regard to these residual commitments, the Company
believes that the resources currently available, as well as those that will be generated by its
operating and financing activities, will enable the DeA Capital Group to meet the financing
required for its investment activity and to manage working capital.
Net financial position (EUR million)
Cash and cash equivalents 77.2 96.4 (19.2)
Available-for-sale financial assets 4.2 4.2 0.0
Financial receivables 1.1 3.7 (2.6)
Non-current financial liabilities 0.0 0.0 0.0
Current financial liabilities (0.7) (1.2) 0.5
TOTAL 81.8 103.1 (21.3)
of which:
- Alternative Asset Management 19.1 23.3 (4.2)
- Private Equity Investment 2.3 0.1 2.2
- Holdings 60.4 79.7 (19.3)
30.6.2017 31.12.2016 Change

Half-Year Report
to 30 June 2017
46
6. Other information Main risks and uncertainties to which the Parent Company and consolidated
Group companies are exposed
As described in the Report on Operations, the DeA Capital Group operates through, and is
structured as, two business areas, Private Equity Investment and Alternative Asset
Management.
The risks set out below reflect: the characteristics of the market; the operations of Parent
Company DeA Capital S.p.A. and the companies included in the Group’s Half-Year Report; the
main findings of a risk assessment in 2017; and periodic monitoring conducted partly through
the regulatory policies adopted by the Group.
The Group has adopted a modern corporate governance system that provides effective
management of the complexities of its operations, and enables both individual companies and
the Group to achieve their strategic objectives. Furthermore, the assessments carried out by
the organisational units and the directors confirm the non-critical nature of these risks and
uncertainties, as well as the DeA Capital Group's financial solidity.
With reference to the specific risks relating to Migros, the main private equity investment,
please see the Migros Annual Report (available on the Migros website).
A. Contextual risks
A.1. Risks relating to general economic conditions
The operating performance and financial position of the DeA Capital Group are affected by the
various factors that make up the macro-economic environment in the countries in which the
Group has invested, including GDP performance, investor and consumer confidence, interest
rates, inflation, the costs of raw materials and unemployment. The ability to meet medium- to
long-term objectives could be affected by general economic trends, which could slow the
development of sectors the Group has invested in and/or the business of the investee
companies.
A.2. Socio-political events
In line with its own strategic growth guidelines, one of the DeA Capital Group’s activities is
private equity investment in companies and funds in different jurisdictions and countries
around the world which, in turn, invest in a number of countries and geographical areas. The
DeA Capital Group may have invested in foreign countries whose social, political and economic
conditions put the achievement of its investment objectives at risk.
A.3. Regulatory changes
Group companies conduct their operations in regulated sectors and markets. Any changes to or
developments in the legislative or regulatory framework that affect the costs and revenues
structure of investee companies or the tax regime applied could have negative effects on the
Group’s financial results and necessitate changes to the Group’s strategy. To combat this risk,
the Group has established procedures to constantly monitor sector regulation and any changes
thereto, in order to take advantage of business opportunities and respond promptly to any
changes to the prevailing legislation and regulations.
A.4. Performance of the financial markets
The Company’s ability to meet its strategic and management objectives could depend on the
performance of financial markets. A negative trend in financial markets could have an effect on
Private Equity Investment in general, making investment and divestment transactions more
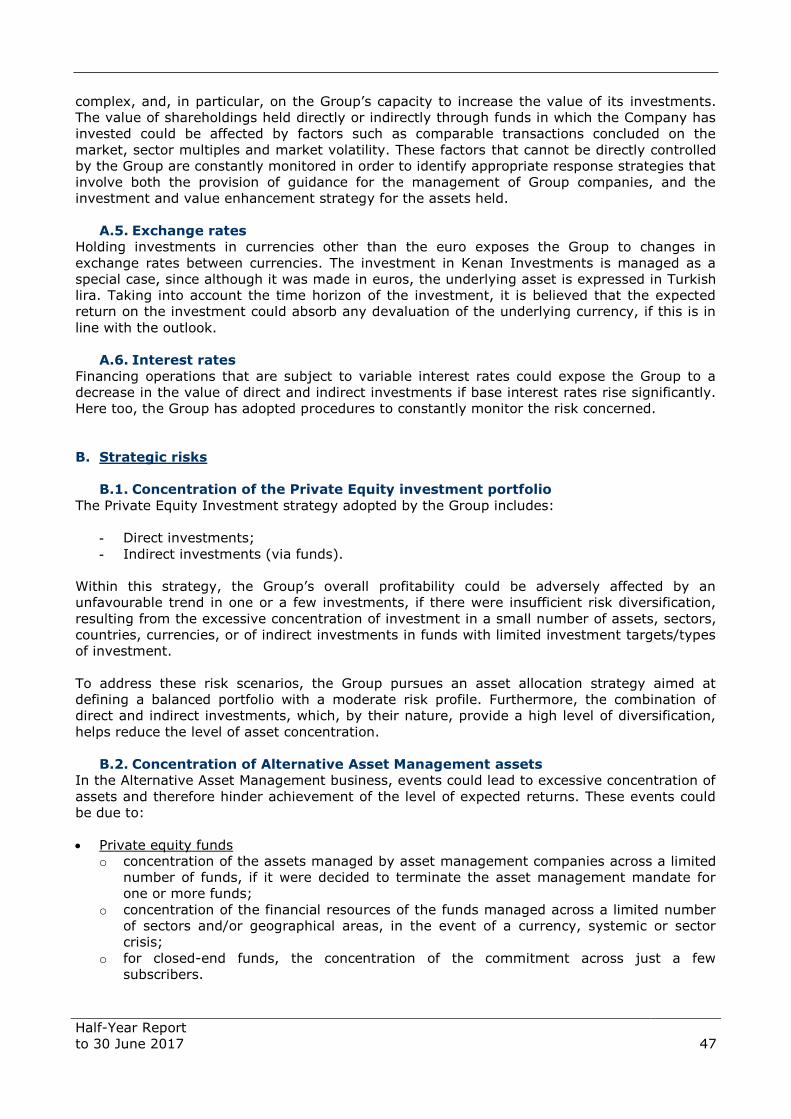
Half-Year Report
to 30 June 2017
47
complex, and, in particular, on the Group’s capacity to increase the value of its investments.
The value of shareholdings held directly or indirectly through funds in which the Company has
invested could be affected by factors such as comparable transactions concluded on the
market, sector multiples and market volatility. These factors that cannot be directly controlled
by the Group are constantly monitored in order to identify appropriate response strategies that
involve both the provision of guidance for the management of Group companies, and the
investment and value enhancement strategy for the assets held.
A.5. Exchange rates
Holding investments in currencies other than the euro exposes the Group to changes in
exchange rates between currencies. The investment in Kenan Investments is managed as a
special case, since although it was made in euros, the underlying asset is expressed in Turkish
lira. Taking into account the time horizon of the investment, it is believed that the expected
return on the investment could absorb any devaluation of the underlying currency, if this is in
line with the outlook.
A.6. Interest rates
Financing operations that are subject to variable interest rates could expose the Group to a
decrease in the value of direct and indirect investments if base interest rates rise significantly.
Here too, the Group has adopted procedures to constantly monitor the risk concerned.
B. Strategic risks
B.1. Concentration of the Private Equity investment portfolio
The Private Equity Investment strategy adopted by the Group includes:
- Direct investments;
- Indirect investments (via funds).
Within this strategy, the Group’s overall profitability could be adversely affected by an
unfavourable trend in one or a few investments, if there were insufficient risk diversification,
resulting from the excessive concentration of investment in a small number of assets, sectors,
countries, currencies, or of indirect investments in funds with limited investment targets/types
of investment.
To address these risk scenarios, the Group pursues an asset allocation strategy aimed at
defining a balanced portfolio with a moderate risk profile. Furthermore, the combination of
direct and indirect investments, which, by their nature, provide a high level of diversification,
helps reduce the level of asset concentration.
B.2. Concentration of Alternative Asset Management assets
In the Alternative Asset Management business, events could lead to excessive concentration of
assets and therefore hinder achievement of the level of expected returns. These events could
be due to:
Private equity funds
o concentration of the assets managed by asset management companies across a limited
number of funds, if it were decided to terminate the asset management mandate for
one or more funds;
o concentration of the financial resources of the funds managed across a limited number
of sectors and/or geographical areas, in the event of a currency, systemic or sector
crisis;
o for closed-end funds, the concentration of the commitment across just a few
subscribers.
Half-Year Report
to 30 June 2017
48
Real estate funds
o concentration of real estate present in the portfolio of managed funds in a few cities
and/or in limited types of property (management/commercial), in the event of a slump
in the property market concerned;
o concentration in respect of certain major tenants, if they were to withdraw from the
rental contracts, which could lead to a vacancy rate that would have a negative impact
on the funds' financial results and the valuation of the properties managed;
o concentration of the maturities of numerous real estate funds within a narrow
timeframe, with related high availability of property on the market, leading to a
decrease in property values and an increase in selling times.
For each of the risk scenarios outlined above, the Group has defined and implemented
appropriate strategies that include strategic, operational and management aspects, as well as
a system monitoring the level of asset diversification in the Alternative Asset Management
business.
B.3. Key resources (governance/organisation)
The success of the DeA Capital Group depends to a large extent on its executive directors and
certain key management figures, their ability to efficiently manage the business and the
ordinary operations of the Group, as well as their knowledge of the market and the
professional relationships established. The departure of one or more of these key resources,
without a suitable replacement being found, as well as an inability to attract and retain new
and qualified resources, could impact growth targets and have a negative effect on the Group’s
operating performance and financial results. To mitigate this risk, the Group has put in place
HR management policies that correspond closely to the needs of the business, and incentive
policies that are periodically reviewed, in light of, among other things, the general
macroeconomic climate and the results achieved by the Group.
C. Operating risks
C.1. Investment operations
Investment operations conducted by the Group are subject to the risks typical of private equity
activities, such as the accurate valuation of the target company and the nature of the
transactions carried out. The Group has implemented a structured process of due diligence on
the target companies and a careful definition of shareholders’ agreements in order to conclude
agreements in line with the investment strategy and the risk profile defined by the Group.
C.2. Compliance with covenants
Some investment operations were concluded using financial leverage to invest in the target
companies. For financing contracts signed by investee companies, specific covenants generally
backed by collateral are in place; failure to comply with these could necessitate recapitalisation
operations for investee companies and/or lead to an increase in financial expenses relating to
debt refinancing. Failure to comply with covenants attached to loans could have negative
effects on both the financial position and operations of investee companies, and the value of
the investment.
C.3. Divestment operations
In its Private Equity Investment business, the Group generally invests over a medium-/long-
term time horizon. Over the investment management period, external situations could arise
that might have a significant impact on the operating results of the investee companies and,
consequently, on the value of the investment itself. Furthermore, in the case of co-investment,
guiding the management of an investee company could prove problematic or unfeasible, and it
may ultimately prove impossible to dispose of the stakes held, for example due to the
Half-Year Report
to 30 June 2017
49
presence of lock-up clauses. The divestment strategy could therefore be negatively affected by
various factors, some of which cannot be foreseen at the time the investments are made.
To combat these risk situations, the Group has defined a process to monitor the performance
of its investee companies, facilitated by its representation on the management bodies of
significant investee companies, with a view to identifying any critical situations in good time.
C.4. Fund-raising Risk
The income flows expected from the Alternative Asset Management business depend on the
capacity of the Group’s asset management companies to stabilise/grow their assets under
management. In this environment, fundraising activities could be harmed both by external and
internal factors, such as bad timing in respect of fundraising activities by the asset
management companies, or the departure of key managers from the companies. The Group
has established appropriate risk management strategies in relation to fundraising, with a view
to both involving new investors and retaining current investors.
Transactions with parent companies, subsidiaries and related parties
Transactions with related parties, including intercompany transactions, are typical, usual
transactions that are part of the normal business activities of Group companies. Such
transactions are concluded under standard market terms for the types of goods and/or
services offered.
Other information
At 30 June 2017, the Group had 197 employees (186 at the end of 2016), including 36 senior
managers, 59 middle managers and 102 clerical staff. Of these, 180 worked in Alternative
Asset Management and 17 in Private Equity Investment/the Holding Company. These staff
levels do not include personnel on secondment from the Parent Company De Agostini S.p.A.
With regard to the regulatory requirements set out in art. 36 of the Market Regulation on
conditions for the listing of parent companies of companies formed or regulated by laws of
non-EU countries and of material importance in the consolidated financial statements, it should
be noted that no Group company falls within the scope of the above-mentioned provision.
Furthermore, conditions prohibiting listing pursuant to art. 37 of the Market Regulation relating
to companies subject to the management and coordination of other parties do not apply.
Half-Year Report
to 30 June 2017
50
Summary Consolidated Half-Year Report
for the period 1 January to 30 June 2017
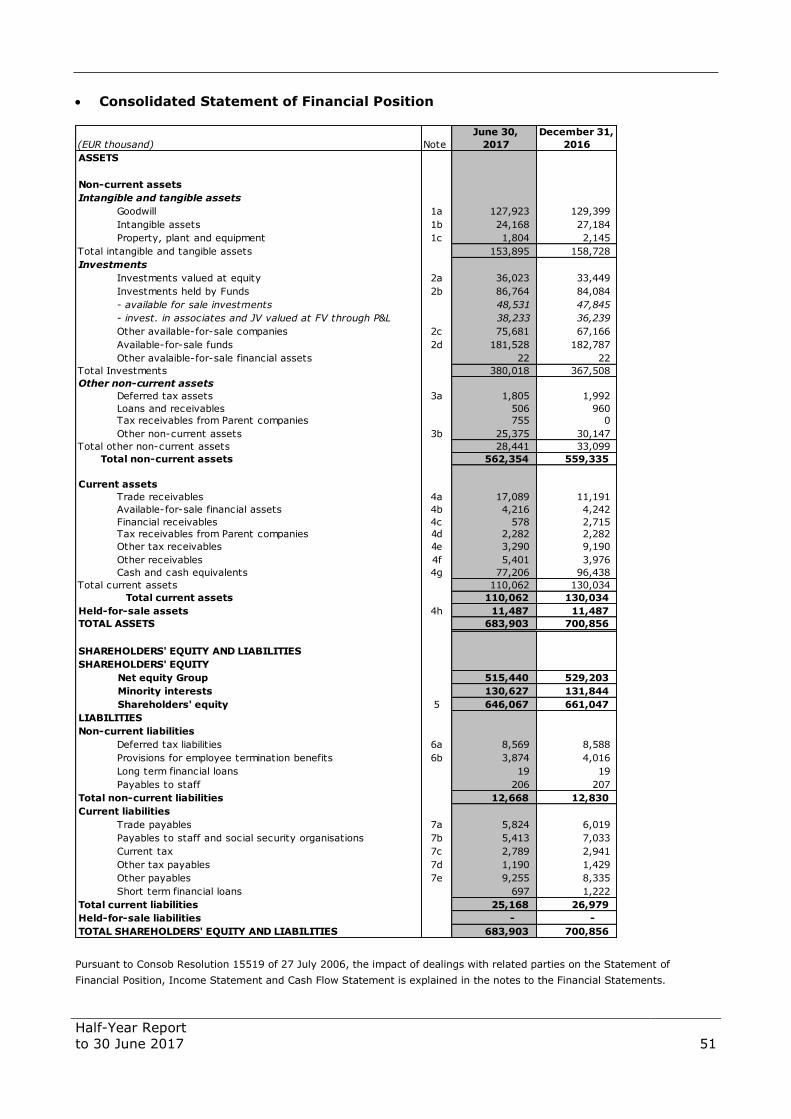
Half-Year Report
to 30 June 2017
51
Consolidated Statement of Financial Position
Pursuant to Consob Resolution 15519 of 27 July 2006, the impact of dealings with related parties on the Statement of
Financial Position, Income Statement and Cash Flow Statement is explained in the notes to the Financial Statements.
(EUR thousand) Note
June 30,
2017
December 31,
2016
ASSETS
Non-current assets
Intangible and tangible assets
Goodwill 1a 127,923 129,399
Intangible assets 1b 24,168 27,184
Property, plant and equipment 1c 1,804 2,145
Total intangible and tangible assets 153,895 158,728
Investments
Investments valued at equity 2a 36,023 33,449
Investments held by Funds 2b 86,764 84,084
- available for sale investments 48,531 47,845
- invest. in associates and JV valued at FV through P&L 38,233 36,239
Other available-for-sale companies 2c 75,681 67,166
Available-for-sale funds 2d 181,528 182,787
Other avalaible-for-sale financial assets 22 22
Total Investments 380,018 367,508
Other non-current assets
Deferred tax assets 3a 1,805 1,992
Loans and receivables 506 960
Tax receivables from Parent companies 755 0
Other non-current assets 3b 25,375 30,147
Total other non-current assets 28,441 33,099
Total non-current assets 562,354 559,335
Current assets
Trade receivables 4a 17,089 11,191
Available-for-sale financial assets 4b 4,216 4,242
Financial receivables 4c 578 2,715
Tax receivables from Parent companies 4d 2,282 2,282
Other tax receivables 4e 3,290 9,190
Other receivables 4f 5,401 3,976
Cash and cash equivalents 4g 77,206 96,438
Total current assets 110,062 130,034
Total current assets 110,062 130,034
Held-for-sale assets 4h 11,487 11,487
TOTAL ASSETS 683,903 700,856
SHAREHOLDERS' EQUITY AND LIABILITIES
SHAREHOLDERS' EQUITY
Net equity Group 515,440 529,203
Minority interests 130,627 131,844
Shareholders' equity 5 646,067 661,047
LIABILITIES
Non-current liabilities
Deferred tax liabilities 6a 8,569 8,588
Provisions for employee termination benefits 6b 3,874 4,016
Long term financial loans 19 19
Payables to staff 206 207
Total non-current liabilities 12,668 12,830
Current liabilities
Trade payables 7a 5,824 6,019
Payables to staff and social security organisations 7b 5,413 7,033
Current tax 7c 2,789 2,941
Other tax payables 7d 1,190 1,429
Other payables 7e 9,255 8,335
Short term financial loans 697 1,222
Total current liabilities 25,168 26,979
Held-for-sale liabilities - -
TOTAL SHAREHOLDERS' EQUITY AND LIABILITIES 683,903 700,856

Half-Year Report
to 30 June 2017
52
Consolidated Income Statement
Pursuant to Consob Resolution 15519 of 27 July 2006, the impact of dealings with related parties on the Statement of
Financial Position, Income Statement and Cash Flow Statement is explained in the notes to the Financial Statements.
Performance by business in the first half of 2017
Performance by business in the first half of 2016
(EUR thousand) Note
First Half
2017
First Half
2016
Alternative Asset Management fees 8 27,674 28,461
Income from equity investments 9 5,324 (103)
Other investment income/expense 10 7,214 (1,929)
Income from services 11 213 7,492
Other income 136 67
Personnel costs 12a (14,752) (16,284)
Service costs 12b (9,007) (11,297)
Depreciation, amortization and impairment 12c (6,027) (3,093)
Other expenses 12d (5,510) (1,634)
Financial income 13 324 522
Financial expenses 13 (450) (1,785)
PROFIT/(LOSS) BEFORE TAX 5,139 417
Income tax 14 440 (889)
PROFIT/(LOSS) FOR THE PERIOD FROM CONTINUING OPERATIONS 5,579 (472)
Profit (Loss) from discontinued operations/held-for-sale assets 0 0
PROFIT/(LOSS) FOR THE PERIOD 5,579 (472)
- Group share 6,235 1,904
- Non controlling interests (656) (2,376)
Earnings per share, basic (€) 15 0.024 0.007
Earnings per share, diluted (€) 15 0.024 0.007
(EUR thousand)
Private Equity
Investment
Alternative
Asset
Management
Holdings/
Eliminations Consolidated
Alternative Asset Management fees 0 28,585 (911) 27,674
Income (loss) from equity investments 4,995 329 0 5,324
Other investment income/expense 7,590 (376) 0 7,214
Income from services 0 108 241 349
Other expenses (1,154) (31,252) (2,890) (35,296)
Financial income and expenses (179) (2) 55 (126)
PROFIT/(LOSS) BEFORE TAXES 11,252 (2,608) (3,505) 5,139
Income tax 0 (419) 859 440
PROFIT/(LOSS) FOR THE PERIOD FROM CONTINUING OPERATIONS 11,252 (3,027) (2,646) 5,579
Profit (Loss) from discontinued operations/held-for-sale assets 0 0 0 0
PROFIT/(LOSS) FOR THE PERIOD 11,252 (3,027) (2,646) 5,579
- Group share 10,060 (1,179) (2,646) 6,235
- Non controlling interests 1,192 (1,848) 0 (656)
(EUR thousand)
Private Equity
Investment
Alternative
Asset
Management
Holdings/
Eliminations Consolidated
Alternative Asset Management fees 0 29,421 (960) 28,461
Income (loss) from equity investments (56) (47) 0 (103)
Other investment income/expense (3,196) 1,267 0 (1,929)
Income from services 0 7,363 196 7,559
Other expenses (1,044) (28,547) (2,717) (32,308)
Financial income and expenses (1,302) 64 (25) (1,263)
PROFIT/(LOSS) BEFORE TAXES (5,598) 9,521 (3,506) 417
Income tax 0 (2,767) 1,878 (889)
PROFIT/(LOSS) FOR THE PERIOD FROM CONTINUING OPERATIONS (5,598) 6,754 (1,628) (472)
Profit (Loss) from discontinued operations/held-for-sale assets 0 0 0 0
PROFIT/(LOSS) FOR THE PERIOD (5,598) 6,754 (1,628) (472)
- Group share (2,719) 6,251 (1,628) 1,904
- Non controlling interests (2,879) 503 0 (2,376)
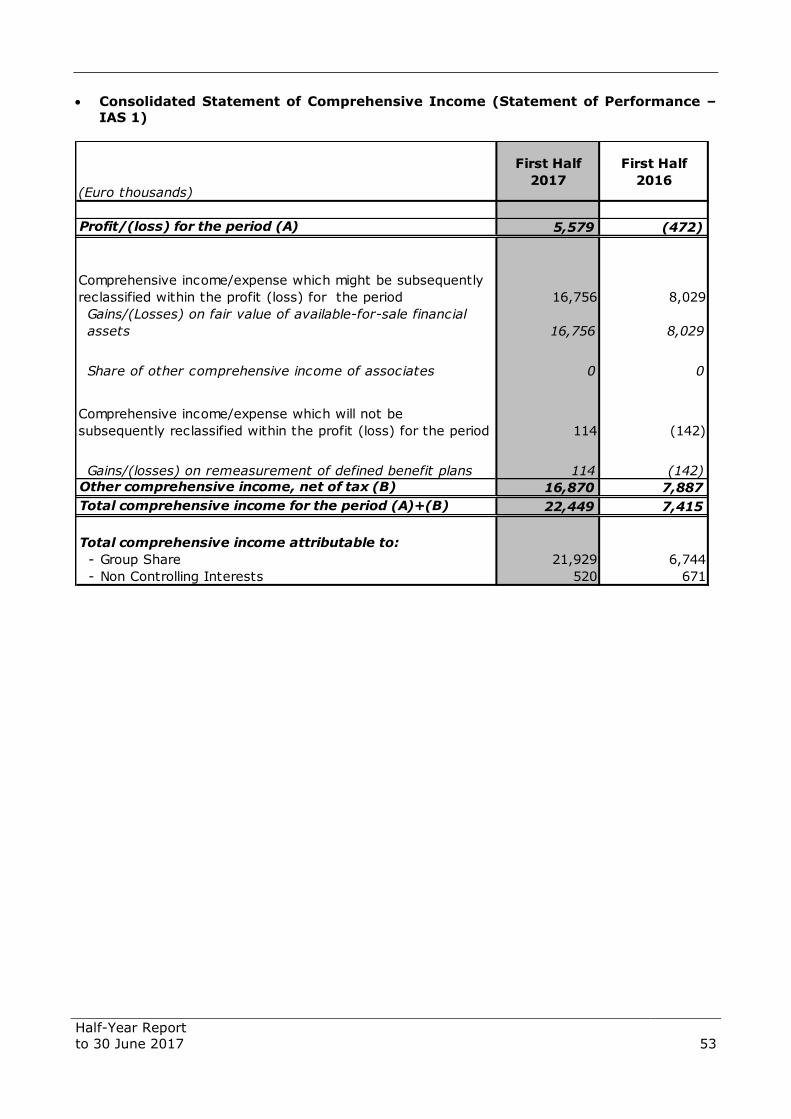
Half-Year Report
to 30 June 2017
53
Consolidated Statement of Comprehensive Income (Statement of Performance –
IAS 1)
(Euro thousands)
First Half
2017
First Half
2016
Profit/(loss) for the period (A) 5,579 (472)
Comprehensive income/expense which might be subsequently
reclassified within the profit (loss) for the period 16,756 8,029
Gains/(Losses) on fair value of available-for-sale financial
assets 16,756 8,029
Share of other comprehensive income of associates 0 0
Comprehensive income/expense which will not be
subsequently reclassified within the profit (loss) for the period 114 (142)
Gains/(losses) on remeasurement of defined benefit plans 114 (142)
Other comprehensive income, net of tax (B) 16,870 7,887
Total comprehensive income for the period (A)+(B) 22,449 7,415
Total comprehensive income attributable to:
- Group Share 21,929 6,744
- Non Controlling Interests 520 671

Half-Year Report
to 30 June 2017
54
Consolidated Cash Flow Statement – Direct Method
Pursuant to Consob Resolution 15519 of 27 July 2006, the impact of dealings with related parties on the Statement of
Financial Position, Income Statement and Cash Flow Statement is explained in the notes to the Financial Statements.
(EUR thousand) First Half 2017 First Half 2016
CASH FLOW from operating activities
Investments in funds and shareholdings (12,617) (14,882)
Capital reimbursements from funds 10,056 4,128
Proceeds from the sale of investments 18,479 8,694
Interest received 83 187
Interest paid (13) (4)
Cash distribution from investments 1,328 234
Realized gains (losses) on exchange rate derivatives (2) (1)
Taxes paid (416) (815)
Dividends received 607 0
Management and performance fees received 22,818 26,515
Revenues for services 671 10,798
Operating expenses (24,635) (33,208)
Net cash flow from operating activities 16,359 1,646
CASH FLOW from investment activities
Acquisition of property, plant and equipment (15) (36)
Sale of property, plant and equipment 1 3
Purchase of licenses (338) (234)
Net cash flow from investing activities (352) (267)
CASH FLOW from investing activities
Acquisition of financial assets 0 (1,939)
Sale of financial assets 0 3,506
Share capital issued 276 2,154
Own shares acquired (5,142) (2,804)
Dividends paid (32,962) (33,492)
Loan 582 (128)
Quasi-equity loan 0 0
Bank loan paid back 2,007 0
Net cash flow from financing activities (35,239) (32,703)
CHANGE IN CASH AND CASH EQUIVALENTS (19,232) (31,324)
CASH AND CASH EQUIVALENTS AT BEGINNING OF PERIOD 96,438 123,468
Cash and cash equivalents relating to held-for-sale assets 0 0
Cash and cash equivalents at beginning of period 96,438 123,468
Effect of change in basis of consolidation: cash and cash equivalents 0 (8,035)
CASH AND CASH EQUIVALENTS AT END OF PERIOD 77,206 84,109
Held-for-sale assets and minority interests 0 0
CASH AND CASH EQUIVALENTS AT END OF PERIOD 77,206 84,109
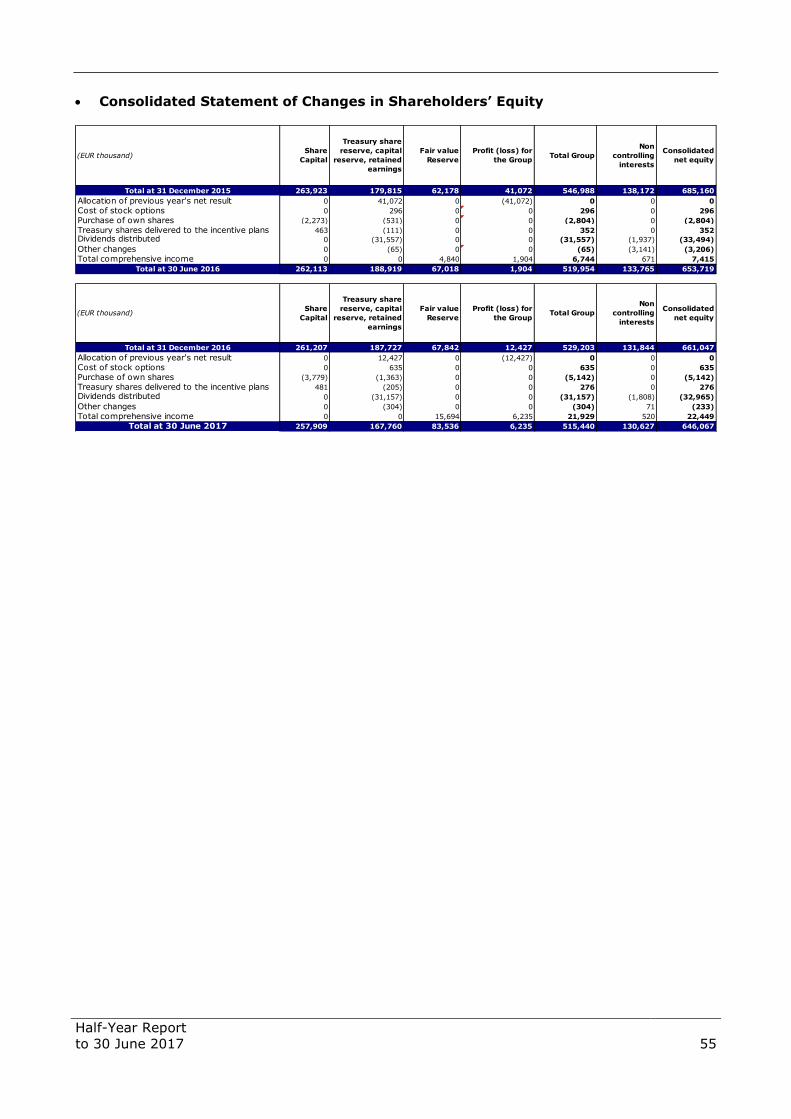
Half-Year Report
to 30 June 2017
55
Consolidated Statement of Changes in Shareholders’ Equity
(EUR thousand)Share
Capital
Treasury share
reserve, capital
reserve, retained
earnings
Fair value
Reserve
Profit (loss) for
the GroupTotal Group
Non
controlling
interests
Consolidated
net equity
Total at 31 December 2015 263,923 179,815 62,178 41,072 546,988 138,172 685,160
Allocation of previous year's net result 0 41,072 0 (41,072) 0 0 0
Cost of stock options 0 296 0 0 296 0 296
Purchase of own shares (2,273) (531) 0 0 (2,804) 0 (2,804)
Treasury shares delivered to the incentive plans 463 (111) 0 0 352 0 352
Dividends distributed 0 (31,557) 0 0 (31,557) (1,937) (33,494)
Other changes 0 (65) 0 0 (65) (3,141) (3,206)
Total comprehensive income 0 0 4,840 1,904 6,744 671 7,415
Total at 30 June 2016 262,113 188,919 67,018 1,904 519,954 133,765 653,719
(EUR thousand)Share
Capital
Treasury share
reserve, capital
reserve, retained
earnings
Fair value
Reserve
Profit (loss) for
the GroupTotal Group
Non
controlling
interests
Consolidated
net equity
Total at 31 December 2016 261,207 187,727 67,842 12,427 529,203 131,844 661,047
Allocation of previous year's net result 0 12,427 0 (12,427) 0 0 0
Cost of stock options 0 635 0 0 635 0 635
Purchase of own shares (3,779) (1,363) 0 0 (5,142) 0 (5,142)
Treasury shares delivered to the incentive plans 481 (205) 0 0 276 0 276
Dividends distributed 0 (31,157) 0 0 (31,157) (1,808) (32,965)
Other changes 0 (304) 0 0 (304) 71 (233)
Total comprehensive income 0 0 15,694 6,235 21,929 520 22,449
Total at 30 June 2017 257,909 167,760 83,536 6,235 515,440 130,627 646,067
Half-Year Report
to 30 June 2017
56
Notes to the Financial Statements
Structure and content of the Summary Consolidated Half-Year Report to 30 June
2017
The Summary Consolidated Half-Year Report to 30 June 2017 comprises the Consolidated
Statement of Financial Position, Consolidated Income Statement, Consolidated Statement of
Comprehensive Income (Statement of Performance), Consolidated Cash Flow Statement,
Statement of Changes in Consolidated Shareholders' Equity and these notes to the Financial
Statements. They are also accompanied by the Interim Report on Operations and the
Statement of Responsibilities for the Summary Consolidated Half-Year Financial Statements
pursuant to art. 154-bis of Legislative Decree 58/98.
Information regarding the Company’s operating performance and cash flow relates to the first
half of 2017 and the first half of 2016; information on the assets and liabilities relates to 30
June 2017 and 31 December 2016.
The Consolidated Financial Statements are provided in the same format as those for 31
December 2016. The Consolidated Statement of Financial Position provides a breakdown of
current and non-current assets and liabilities with separate reporting for those resulting from
discontinued or held-for-sale operations. The Consolidated Income Statement breaks down
costs and revenues based on their nature. The Consolidated Cash Flow Statement is prepared
using the “direct method”.
Unless otherwise indicated, all tables and figures included in these notes to the Financial
Statements are reported in EUR thousand.
Statement of compliance with accounting standards
The Summary Consolidated Half-Year Report to 30 June 2017 was prepared in accordance with
the going concern principle and with the International Accounting Standards adopted by the
European Union and approved by the date this document was prepared (the International
Accounting Standards, or individually, IAS/IFRS, or collectively IFRS - International Financial
Reporting Standards), and in accordance with art. 154-ter of Legislative Decree 58/1998 that
implements the “Transparency Directive”. IFRS also includes all interpretations of the
International Financial Reporting Interpretations Committee (IFRIC), including those previously
issued by the Standing Interpretations Committee (SIC), and approved by the European Union.
The Summary Consolidated Half-Year Report to 30 June 2017 is prepared in summary format
in accordance with IAS 34 (Interim financial reporting). It does not, therefore, contain all of
the information required for the year-end Consolidated Financial Statements, and must be read
in conjunction with the Consolidated Financial Statements prepared for the year ending 31
December 2016.
In accordance with the provisions of IAS/IFRS and current laws, the Company authorised the
publication of the Half-Year Report to 30 June 2017 by the legal deadline.
The valuation criteria adopted on the basis of the International Accounting Standards are
consistent with going concern principle and were the same as those used to prepare the
Consolidated Financial Statements for the Year Ending 31 December 2016, to which reference
should be made for additional details.
No new international accounting standards and interpretations were applied for the first time
from 1 January 2017. The Group did not apply any IFRS in advance.

Half-Year Report
to 30 June 2017
57
The Group will adopt these new standards, amendments and interpretations based on the
stipulated effective date, and will assess their potential impact when they have been approved
by the European Union.
Note that IFRS 9 (Financial instruments) will become effective on 1 January 2018. This
standard, which introduces changes to both the recognition and measurement of financial
assets and liabilities, and hedge accounting, will fully replace IAS 39 (Financial Instruments:
Recognition and Measurement). More specifically, the standard introduces changes relating to:
- the classification and measurement of financial instruments, for which an assessment
model is proposed based on three categories (amortised cost, fair value, and fair value
with changes recognised in the Statement of Comprehensive Income);
- impairment, which differs from that currently set out in IAS 39, and is mainly based on
the concept of expected losses;
- hedge accounting.
The DeA Capital Group has started work to assess the potential impact on its financial
statements of applying this standard, with a main emphasis on the classification and
measurement of financial instruments. It aims to complete this work in the second half of this
year.
* * *
The accounting standards and criteria used in the Summary Consolidated Half-Year Report to
30 June 2017 may not coincide with IFRS provisions that will come into effect on 31 December
2017 as a result of the future position of the European Commission regarding the approval of
International Accounting Standards or the issue of new standards, interpretations or
implementation guides by the International Accounting Standards Board (IASB) or the
International Financial Reporting Interpretation Committee (IFRIC).
* * *
Use of estimates and assumptions in the preparation of the Summary Consolidated
Half-Year Report to 30 June 2017
The Company must make assessments, estimates and assumptions that affect the application
of accounting principles and the amounts of assets, liabilities, costs and revenues recorded in
the financial statements. Estimates and related assumptions are based on past experience and
other factors deemed reasonable in the case concerned; these are used to estimate the
carrying value of assets and liabilities that cannot be easily obtained from other sources. Since
these are estimates, the results obtained should not necessarily be considered definitive.
These estimates and assumptions are reviewed regularly. Any changes resulting from revisions
to accounting estimates are recorded in the period when the revision is made if such revision
only affects that period; if the revision affects current and future periods, the change is
recorded in the period in which the revision is made and in related future periods.
The use of reasonable estimates is an essential part of preparing the Summary Consolidated
Half-Year Financial Statements to 30 June 2017, and this use of estimates is particularly
significant for valuing the assets and shareholdings that make up the investment portfolio.
An estimate may be adjusted as a result of changes in the circumstances on which it was
based, or as a result of new information. Any change in the estimate is applied prospectively
and has an impact on the Income Statement in the period in which the change occurred and
potentially on Income Statements in future periods.

Half-Year Report
to 30 June 2017
58
As permitted by IAS/IFRS, the preparation of the Summary Consolidated Half-Year Report to
30 June 2017 required the use of significant estimates by the Company's management,
especially with regard to fair value assessments of the investment portfolio (shareholdings and
funds).
These fair value measurements were determined by the directors based on their best
estimates and judgement, using their knowledge and the evidence available at the time the
Summary Consolidated Half-Year Report to 30 June 2017 was prepared. However, due to
objective difficulties in making assessments and the absence of a liquid market, the values
assigned to such assets could differ, in some cases significantly, from those that could be
obtained when the assets are sold.
For a more complete description of the most significant assessment processes for the Group,
see the Consolidated Financial Statements for the Year Ending 31 December 2016.
Scope of consolidation
There was no change to the basis of consolidation at 30 June 2017 compared with the position
at 31 December 2016. Therefore, at 30 June 2017, the following companies formed part of the
DeA Capital Group's scope of consolidation:
Information on the fair value hierarchy
IFRS 13 stipulates that financial instruments reported at fair value should be classified based
on a hierarchy that reflects the importance and quality of the inputs used in calculating the fair
value. Three levels have been determined:
Level 1: includes prices quoted on active markets for assets or liabilities identical to
those being valued;
Level 2: includes observable inputs other than those included in level 1, for example:
o prices quoted on active markets for similar assets and liabilities;
o prices quoted on inactive markets for identical assets and liabilities;
o interest rate curves, implicit volatility, credit spreads;
Level 3: unobservable data. These input data may be used if no observable input data
are available. IFRS 13 specifies that unobservable input data used to measure fair value
must reflect the assumptions used by market participants when fixing the price for the
assets or liabilities being valued.
The table below shows assets valued at fair value by hierarchical level at 30 June 2017:
Company Registered office Currency Share capital % holding Consolidation method
DeA Capital S.p.A. Milan, Italy Euro 306,612,100 Holding
IDeA Capital Funds SGR S.p.A. Milan, Italy Euro 1,200,000 100.00% Full consolidation
IDeA OF I Milan, Italy Euro - 46.99% Full consolidation
DeA Capital Real Estate S.p.A. Milan, Italy Euro 600,000 100.00% Full consolidation
IDeA FIMIT SGR S.p.A. Rome, Italy Euro 16,757,557 64.30% Full consolidation
SPC S.p.A. Milan, Italy Euro 104,147 85.05% Full consolidation
Innovation Real Estate S.p.A. Milan, Italy Euro 597,725 45.00% Equity accounted
(Associate)Innovation Real Estate Advisory S.r.l. Milan, Italy Euro 105,000 45.00% Equity accounted
(Associate)IDeA Efficienza Energetica e Sviluppo
Sostenibile
Milan, Italy Euro - 30.40% Equity accounted
(Associate)Venere Rome, Italy Euro - 27.27% Equity accounted
(Associate)
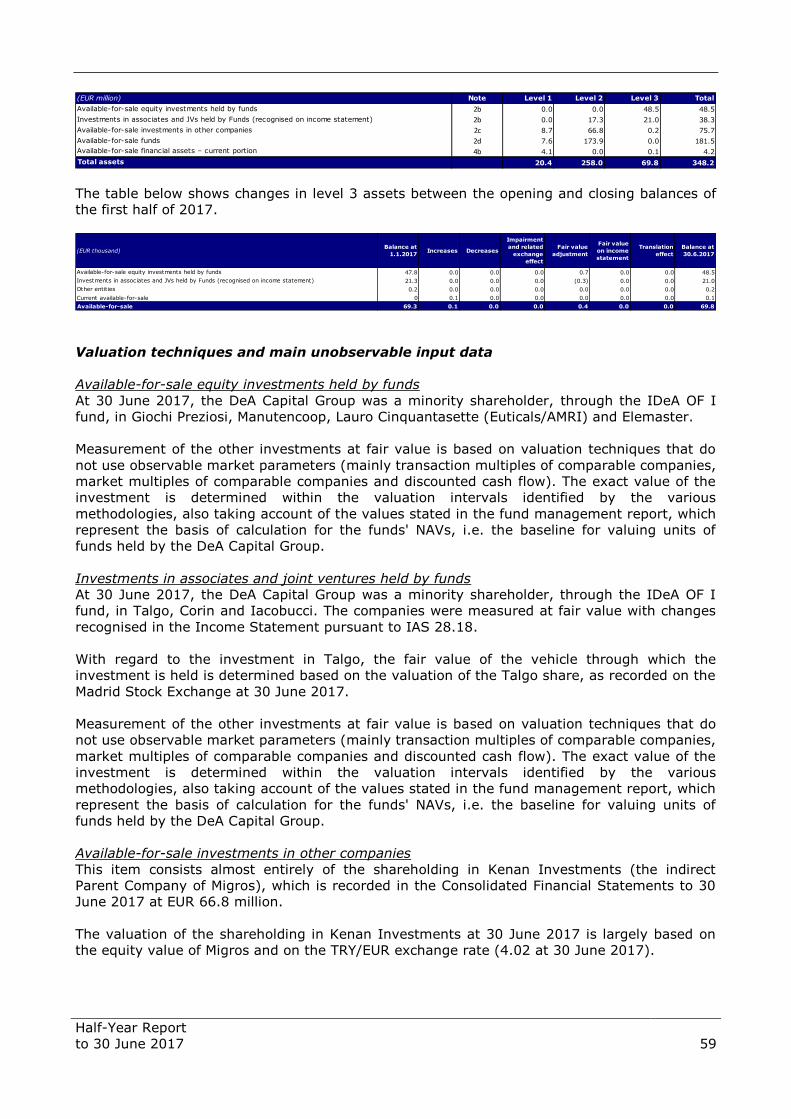
Half-Year Report
to 30 June 2017
59
The table below shows changes in level 3 assets between the opening and closing balances of
the first half of 2017.
Valuation techniques and main unobservable input data
Available-for-sale equity investments held by funds
At 30 June 2017, the DeA Capital Group was a minority shareholder, through the IDeA OF I
fund, in Giochi Preziosi, Manutencoop, Lauro Cinquantasette (Euticals/AMRI) and Elemaster.
Measurement of the other investments at fair value is based on valuation techniques that do
not use observable market parameters (mainly transaction multiples of comparable companies,
market multiples of comparable companies and discounted cash flow). The exact value of the
investment is determined within the valuation intervals identified by the various
methodologies, also taking account of the values stated in the fund management report, which
represent the basis of calculation for the funds' NAVs, i.e. the baseline for valuing units of
funds held by the DeA Capital Group.
Investments in associates and joint ventures held by funds
At 30 June 2017, the DeA Capital Group was a minority shareholder, through the IDeA OF I
fund, in Talgo, Corin and Iacobucci. The companies were measured at fair value with changes
recognised in the Income Statement pursuant to IAS 28.18.
With regard to the investment in Talgo, the fair value of the vehicle through which the
investment is held is determined based on the valuation of the Talgo share, as recorded on the
Madrid Stock Exchange at 30 June 2017.
Measurement of the other investments at fair value is based on valuation techniques that do
not use observable market parameters (mainly transaction multiples of comparable companies,
market multiples of comparable companies and discounted cash flow). The exact value of the
investment is determined within the valuation intervals identified by the various
methodologies, also taking account of the values stated in the fund management report, which
represent the basis of calculation for the funds' NAVs, i.e. the baseline for valuing units of
funds held by the DeA Capital Group.
Available-for-sale investments in other companies
This item consists almost entirely of the shareholding in Kenan Investments (the indirect
Parent Company of Migros), which is recorded in the Consolidated Financial Statements to 30
June 2017 at EUR 66.8 million.
The valuation of the shareholding in Kenan Investments at 30 June 2017 is largely based on
the equity value of Migros and on the TRY/EUR exchange rate (4.02 at 30 June 2017).
(EUR million) Note Level 1 Level 2 Level 3 Total
Available-for-sale equity investments held by funds 2b 0.0 0.0 48.5 48.5
Investments in associates and JVs held by Funds (recognised on income statement) 2b 0.0 17.3 21.0 38.3
Available-for-sale investments in other companies 2c 8.7 66.8 0.2 75.7
Available-for-sale funds 2d 7.6 173.9 0.0 181.5
Available-for-sale financial assets – current portion 4b 4.1 0.0 0.1 4.2
Total assets 20.4 258.0 69.8 348.2
(EUR thousand)Balance at
1.1.2017Increases Decreases
Impairment
and related
exchange
effect
Fair value
adjustment
Fair value
on income
statement
Translation
effect
Balance at
30.6.2017
Available-for-sale equity investments held by funds 47.8 0.0 0.0 0.0 0.7 0.0 0.0 48.5
Investments in associates and JVs held by Funds (recognised on income statement) 21.3 0.0 0.0 0.0 (0.3) 0.0 0.0 21.0
Other entities 0.2 0.0 0.0 0.0 0.0 0.0 0.0 0.2
Current available-for-sale 0 0.1 0.0 0.0 0.0 0.0 0.0 0.1
Available-for-sale 69.3 0.1 0.0 0.0 0.4 0.0 0.0 69.8
Half-Year Report
to 30 June 2017
60
Available-for-sale funds (venture capital funds, funds of funds, co-investment funds, theme
funds and real estate funds)
Valuations of shareholdings and funds in the portfolio reflect estimates made using the
information available on the date this document was prepared.
At 30 June 2017, the DeA Capital Group held units in the following funds:
IDeA I FoF (valued at EUR 64.9 million);
ICF II (valued at EUR 45.0 million);
ICF III (valued at EUR 6.6 million);
IDeA ToI (valued at EUR 7.1 million);
IDeA CCR I (valued at EUR 1.7 million);
Santa Palomba (valued at EUR 0.4 million);
six venture capital funds (with a total value of approximately EUR 8.9 million);
thirteen unlisted property funds (with a total value of approximately EUR 46.9 million).
For venture capital funds, the fair value of each fund is based on the fund's stated NAV,
calculated according to international valuation standards.
For the other funds, the fair value of each fund is represented by the NAV advised by the
management company in the fund management report for the half-year to 30 June 2017,
drafted in accordance with the Bank of Italy’s regulation of 19 January 2015 on collective asset
management.
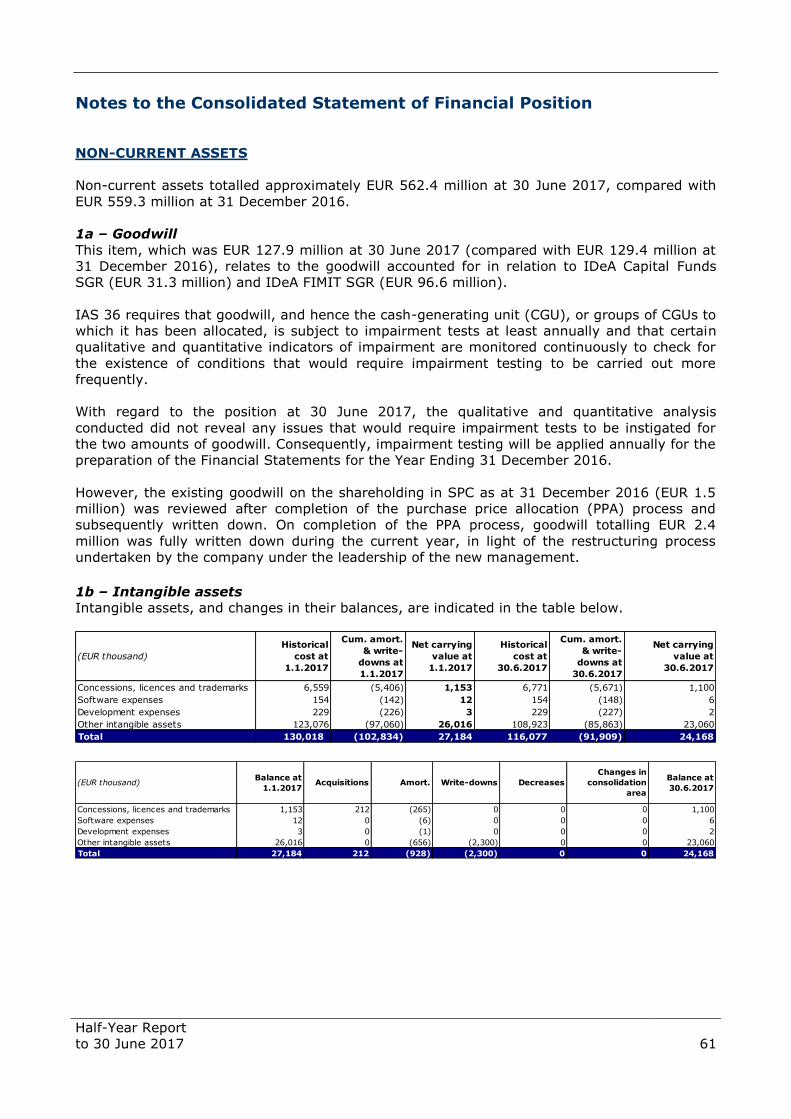
Half-Year Report
to 30 June 2017
61
Notes to the Consolidated Statement of Financial Position
NON-CURRENT ASSETS
Non-current assets totalled approximately EUR 562.4 million at 30 June 2017, compared with
EUR 559.3 million at 31 December 2016.
1a – Goodwill
This item, which was EUR 127.9 million at 30 June 2017 (compared with EUR 129.4 million at
31 December 2016), relates to the goodwill accounted for in relation to IDeA Capital Funds
SGR (EUR 31.3 million) and IDeA FIMIT SGR (EUR 96.6 million).
IAS 36 requires that goodwill, and hence the cash-generating unit (CGU), or groups of CGUs to
which it has been allocated, is subject to impairment tests at least annually and that certain
qualitative and quantitative indicators of impairment are monitored continuously to check for
the existence of conditions that would require impairment testing to be carried out more
frequently.
With regard to the position at 30 June 2017, the qualitative and quantitative analysis
conducted did not reveal any issues that would require impairment tests to be instigated for
the two amounts of goodwill. Consequently, impairment testing will be applied annually for the
preparation of the Financial Statements for the Year Ending 31 December 2016.
However, the existing goodwill on the shareholding in SPC as at 31 December 2016 (EUR 1.5
million) was reviewed after completion of the purchase price allocation (PPA) process and
subsequently written down. On completion of the PPA process, goodwill totalling EUR 2.4
million was fully written down during the current year, in light of the restructuring process
undertaken by the company under the leadership of the new management.
1b – Intangible assets
Intangible assets, and changes in their balances, are indicated in the table below.
(EUR thousand)
Historical
cost at
1.1.2017
Cum. amort.
& write-
downs at
1.1.2017
Net carrying
value at
1.1.2017
Historical
cost at
30.6.2017
Cum. amort.
& write-
downs at
30.6.2017
Net carrying
value at
30.6.2017
Concessions, licences and trademarks 6,559 (5,406) 1,153 6,771 (5,671) 1,100
Software expenses 154 (142) 12 154 (148) 6
Development expenses 229 (226) 3 229 (227) 2
Other intangible assets 123,076 (97,060) 26,016 108,923 (85,863) 23,060
Total 130,018 (102,834) 27,184 116,077 (91,909) 24,168
(EUR thousand)Balance at
1.1.2017Acquisitions Amort. Write-downs Decreases
Changes in
consolidation
area
Balance at
30.6.2017
Concessions, licences and trademarks 1,153 212 (265) 0 0 0 1,100
Software expenses 12 0 (6) 0 0 0 6
Development expenses 3 0 (1) 0 0 0 2
Other intangible assets 26,016 0 (656) (2,300) 0 0 23,060
Total 27,184 212 (928) (2,300) 0 0 24,168
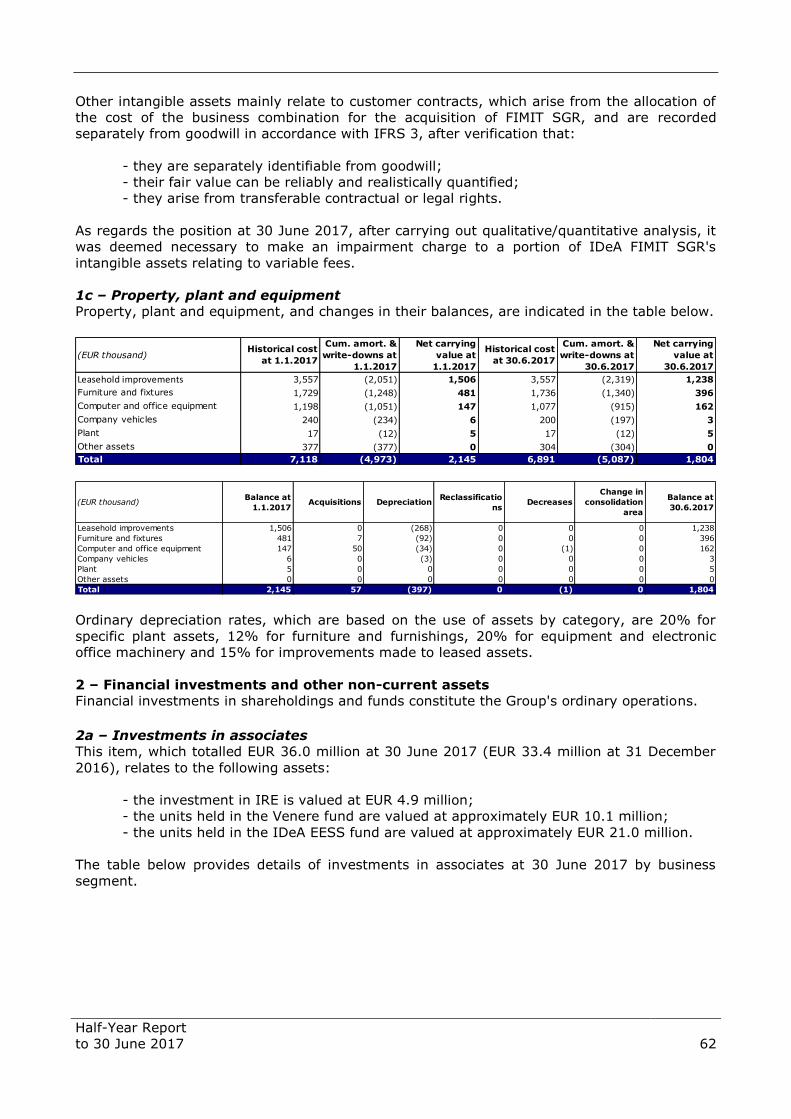
Half-Year Report
to 30 June 2017
62
Other intangible assets mainly relate to customer contracts, which arise from the allocation of
the cost of the business combination for the acquisition of FIMIT SGR, and are recorded
separately from goodwill in accordance with IFRS 3, after verification that:
- they are separately identifiable from goodwill;
- their fair value can be reliably and realistically quantified;
- they arise from transferable contractual or legal rights.
As regards the position at 30 June 2017, after carrying out qualitative/quantitative analysis, it
was deemed necessary to make an impairment charge to a portion of IDeA FIMIT SGR's
intangible assets relating to variable fees.
1c – Property, plant and equipment
Property, plant and equipment, and changes in their balances, are indicated in the table below.
Ordinary depreciation rates, which are based on the use of assets by category, are 20% for
specific plant assets, 12% for furniture and furnishings, 20% for equipment and electronic
office machinery and 15% for improvements made to leased assets.
2 – Financial investments and other non-current assets
Financial investments in shareholdings and funds constitute the Group's ordinary operations.
2a – Investments in associates
This item, which totalled EUR 36.0 million at 30 June 2017 (EUR 33.4 million at 31 December
2016), relates to the following assets:
- the investment in IRE is valued at EUR 4.9 million;
- the units held in the Venere fund are valued at approximately EUR 10.1 million;
- the units held in the IDeA EESS fund are valued at approximately EUR 21.0 million.
The table below provides details of investments in associates at 30 June 2017 by business
segment.
(EUR thousand)Historical cost
at 1.1.2017
Cum. amort. &
write-downs at
1.1.2017
Net carrying
value at
1.1.2017
Historical cost
at 30.6.2017
Cum. amort. &
write-downs at
30.6.2017
Net carrying
value at
30.6.2017
Leasehold improvements 3,557 (2,051) 1,506 3,557 (2,319) 1,238
Furniture and fixtures 1,729 (1,248) 481 1,736 (1,340) 396
Computer and office equipment 1,198 (1,051) 147 1,077 (915) 162
Company vehicles 240 (234) 6 200 (197) 3
Plant 17 (12) 5 17 (12) 5
Other assets 377 (377) 0 304 (304) 0
Total 7,118 (4,973) 2,145 6,891 (5,087) 1,804
(EUR thousand)Balance at
1.1.2017Acquisitions Depreciation
Reclassificatio
nsDecreases
Change in
consolidation
area
Balance at
30.6.2017
Leasehold improvements 1,506 0 (268) 0 0 0 1,238
Furniture and fixtures 481 7 (92) 0 0 0 396
Computer and office equipment 147 50 (34) 0 (1) 0 162
Company vehicles 6 0 (3) 0 0 0 3
Plant 5 0 0 0 0 0 5
Other assets 0 0 0 0 0 0 0
Total 2,145 57 (397) 0 (1) 0 1,804

Half-Year Report
to 30 June 2017
63
The table below summarises the financial information relating to Innovation Real Estate and
IDeA EESS, based on the reporting package prepared in accordance with the accounting
principles used by the DeA Capital Group at 30 June 2017:
(EUR million)Private Equity
Investment
Alternative
Asset
Management
Total
IDeA EESS fund 21.0 0.0 21.0
Venere fund 3.3 6.8 10.1
IRE group 0.0 4.9 4.9
Total 24.3 11.7 36.0
Innovation
Real EstateIDeA EESS
(EUR thousand)
First Half
2017
First Half
2017
Revenues 6,582 0
Net profit/(loss) for the year 525 16,325
Other profit/(loss), net of tax effect 8 (130)
Total comprehensive profit/(loss) for the year 533 16,195
Total comprehensive profit/(loss) for the year attributable to minorities 293 11,272
Total comprehensive profit/(loss) for the year attributable to Group 240 4,923
(EUR thousand) 30.6.2017 30.6.2017
Current assets 18,309 4,216
Non-current assets 1,990 68,773
Current liabilities (10,919) (3,772)
Non-current liabilities (1,467) 0
Net assets 7,913 69,217
Net assets attributable to minorities 4,352 48,175
Goodwill 1,384
Net assets attributable to the Group 4,944 21,042
(EUR thousand) 30.6.2017 30.6.2017
Net initial assets attributable to the Group 5,312 16,898
Total comprehensive profit/(loss) for the year attributable to Group 240 4,923
Dividends received in the period (608) (779)
Net final assets attributable to minorities 4,944 21,042
Book value of associate company 4,944 21,042
Dividends paid to minorities during the year (743) 0
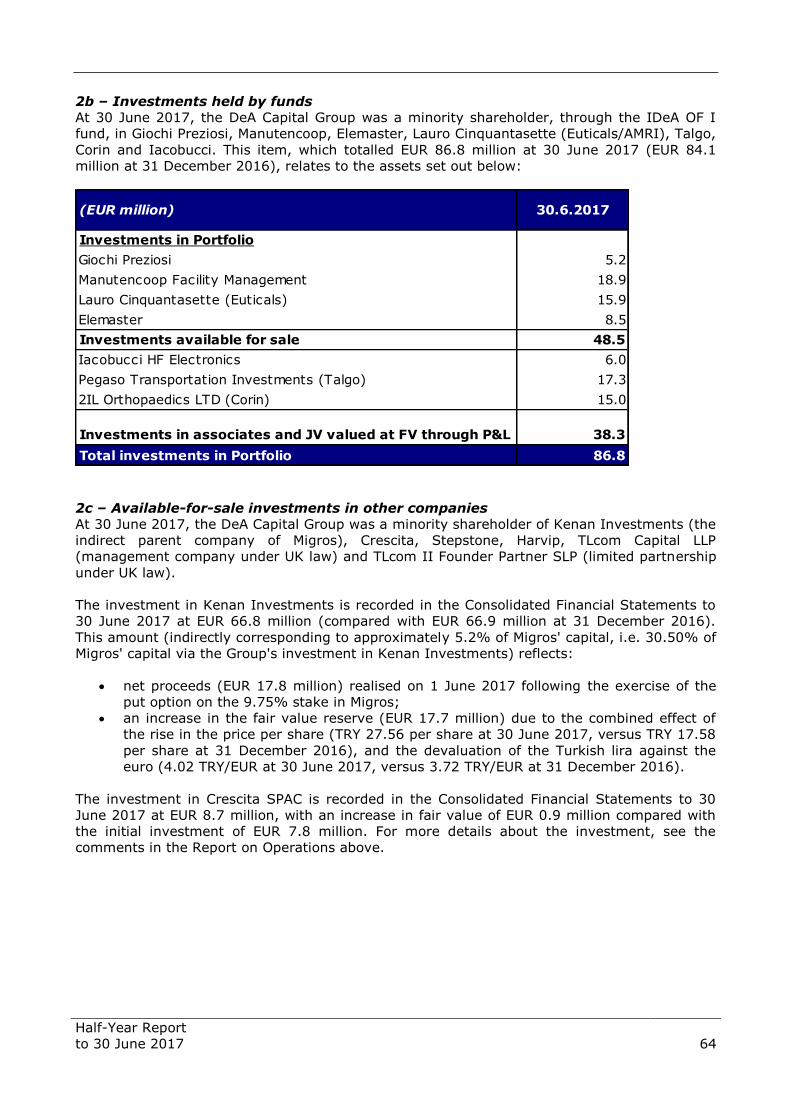
Half-Year Report
to 30 June 2017
64
2b – Investments held by funds
At 30 June 2017, the DeA Capital Group was a minority shareholder, through the IDeA OF I
fund, in Giochi Preziosi, Manutencoop, Elemaster, Lauro Cinquantasette (Euticals/AMRI), Talgo,
Corin and Iacobucci. This item, which totalled EUR 86.8 million at 30 June 2017 (EUR 84.1
million at 31 December 2016), relates to the assets set out below:
2c – Available-for-sale investments in other companies
At 30 June 2017, the DeA Capital Group was a minority shareholder of Kenan Investments (the
indirect parent company of Migros), Crescita, Stepstone, Harvip, TLcom Capital LLP
(management company under UK law) and TLcom II Founder Partner SLP (limited partnership
under UK law).
The investment in Kenan Investments is recorded in the Consolidated Financial Statements to
30 June 2017 at EUR 66.8 million (compared with EUR 66.9 million at 31 December 2016).
This amount (indirectly corresponding to approximately 5.2% of Migros' capital, i.e. 30.50% of
Migros' capital via the Group's investment in Kenan Investments) reflects:
net proceeds (EUR 17.8 million) realised on 1 June 2017 following the exercise of the
put option on the 9.75% stake in Migros;
an increase in the fair value reserve (EUR 17.7 million) due to the combined effect of
the rise in the price per share (TRY 27.56 per share at 30 June 2017, versus TRY 17.58
per share at 31 December 2016), and the devaluation of the Turkish lira against the
euro (4.02 TRY/EUR at 30 June 2017, versus 3.72 TRY/EUR at 31 December 2016).
The investment in Crescita SPAC is recorded in the Consolidated Financial Statements to 30
June 2017 at EUR 8.7 million, with an increase in fair value of EUR 0.9 million compared with
the initial investment of EUR 7.8 million. For more details about the investment, see the
comments in the Report on Operations above.
(EUR million) 30.6.2017
Investments in Portfolio
Giochi Preziosi 5.2
Manutencoop Facility Management 18.9
Lauro Cinquantasette (Euticals) 15.9
Elemaster 8.5
Investments available for sale 48.5
Iacobucci HF Electronics 6.0
Pegaso Transportation Investments (Talgo) 17.3
2IL Orthopaedics LTD (Corin) 15.0
Investments in associates and JV valued at FV through P&L 38.3
Total investments in Portfolio 86.8

Half-Year Report
to 30 June 2017
65
The table below provides details of equity investments in other companies at 30 June 2017 by
business segment.
2d – Available-for-sale funds
This item relates to investments in units of three funds of funds (IDeA I FoF, ICF II and ICF
III), two theme funds (IDeA ToI and IDeA CCR I with two sub-funds), six venture capital funds
and 13 real estate funds, totalling approximately EUR 181.5 million in the Consolidated
Financial Statements to 30 June 2017, compared with EUR 182.8 million at the end of 2016.
The table below provides a breakdown of the funds in the portfolio at 30 June 2017 by
business segment.
3a – Deferred tax assets
The balance on the item “deferred tax assets” comprises the value of deferred tax assets
minus deferred tax liabilities, where they may be offset.
At 30 June 2017, deferred tax assets totalled EUR 1.8 million at 30 June 2017, compared with
EUR 2.0 million at 31 December 2016.
(EUR million)Private Equity
Investment
Alternative
Asset
Management
Total
Kenan Investments 66.8 0.0 66.8
Crescita 8.7 0.0 8.7
Minority interests 0.2 0.0 0.2
Total 75.7 0.0 75.7
(EUR thousand)Balance at
1.1.2017
Increases
(Capital call)
Decreases
(Capital
distribution)
Impairment Fair value
adjustment
Translation
effect
Balance at
30.6.2017
Venture capital funds 9,488 0 (147) (37) (436) 2 8,870
IDeA I FoF 69,015 432 (5,379) 0 826 0 64,894
ICF II 47,000 172 (1,805) 0 (374) 0 44,993
ICF III Core 520 56 0 0 (17) 0 559
ICF III Credit & Distressed 2,897 0 0 0 (88) 0 2,809
ICF III Emerging Markets 3,489 0 0 0 (266) 0 3,223
IDeA ToI 5,196 2,149 0 0 (264) 0 7,081
IDeA CCR I CD 75 0 (2) 0 0 0 73
IDeA CCR I NF 0 1,687 0 0 (67) 0 1,620
Santa Palomba 402 0 0 0 13 0 415
IDeA FIMIT SGR Funds 44,705 0 (34) (518) 2,838 0 46,991
Total funds 182,787 4,496 (7,367) (555) 2,165 2 181,528
(EUR million)Private Equity
Investment
Alternative
Asset
Management
Total
Venture capital funds 8.9 0.0 8.9
IDeA I FoF 64.9 0.0 64.9
ICF II 45.0 0.0 45.0
ICF III 6.6 0.0 6.6
IDeA ToI 7.1 0.0 7.1
IDeA CCR I 1.7 0.0 1.7
Santa Palomba 0.4 0.0 0.4
IDeA FIMIT SGR Funds 0.0 46.9 46.9
Total funds 134.6 46.9 181.5

Half-Year Report
to 30 June 2017
66
3b – Other non-current assets
This item, valued at EUR 25.4 million at 30 June 2017, compared with EUR 30.1 million at 31
December 2016, relates mainly to the receivable from the IDeA OF I fund for the sale of 1% of
Manutencoop, and the receivable from the Beta Immobiliare fund (pertaining to IDeA FIMIT)
relating to the final variable fee. The receivable from the Beta Immobiliare fund corresponds to
the portion of the overperformance fee that has accrued since the fund was launched and
which IDeA FIMIT SGR expects to receive when the fund is liquidated.
CURRENT ASSETS
Current assets totalled approximately EUR 110.1 million at 30 June 2017, compared with EUR
130.0 million at 31 December 2016.
4a – Trade receivables
This item amounted to EUR 17.1 million at 30 June 2017, compared with EUR 11.2 million at
31 December 2016. The item mainly includes receivables of IDeA FIMIT SGR.
4b – Available-for-sale financial assets
At 30 June 2017, available-for-sale financial assets totalled EUR 4.2 million, broadly
unchanged on the figure at 31 December 2016. The item includes investments to be regarded
as a temporary use of cash.
4c – Financial receivables
This item amounted to EUR 0.6 million at 30 June 2017, compared with EUR 2.7 million at 31
December 2016. At 30 June 2017, this item mainly related to the residual receivable due from
the purchasers of the majority stake in IRE for the deferred purchase price component, which
is expected to be received in April 2018.
4d – Tax receivables relating to the tax consolidation scheme
At 30 June 2017, receivables totalled EUR 2.3 million, unchanged on the figure at 31
December 2016. It includes receivables relating to the national tax consolidation scheme for
the Group headed by De Agostini S.p.A.
4e – Other tax receivables
At 30 June 2017, other receivables totalled EUR 3.3 million, compared with EUR 9.2 million at
31 December 2016. The item chiefly includes advance payments on IRAP and IRES, tax
deductions in the form of advance payments on interest, IRES tax credits to be carried forward
and VAT receivables.
4f – Other receivables
At 30 June 2017, other receivables totalled EUR 5.4 million, compared with EUR 4.0 million at
31 December 2016. The item includes guarantee deposits, advances to suppliers and prepaid
expenses.
4g – Cash and cash equivalents (bank deposits and cash)
At 30 June 2017, this item was EUR 77.2 million, compared with EUR 96.4 million at 31
December 2016. The change, totalling EUR -19.2 million, is mainly attributable to the
extraordinary dividend paid by DeA Capital S.p.A. (EUR -31.2 million), changes in own shares
(EUR -4.9 million) and the net cash generated by private equity investments (EUR +14.4
million).
4h – Held-for-sale assets
At 30 June 2017, the item totalled EUR 11.5 million (unchanged on 31 December 2016) and
relates to the investment in Sigla Luxembourg.
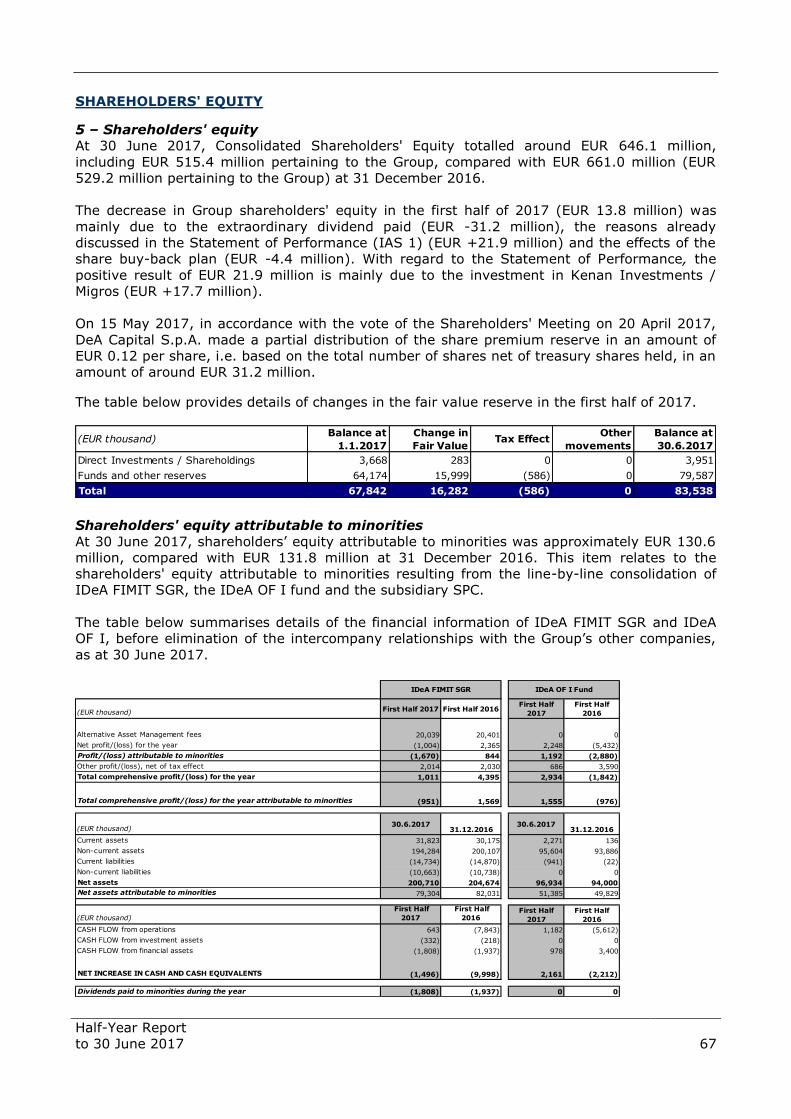
Half-Year Report
to 30 June 2017
67
SHAREHOLDERS' EQUITY o 57.096 5 – Shareholders' equity
At 30 June 2017, Consolidated Shareholders' Equity totalled around EUR 646.1 million,
including EUR 515.4 million pertaining to the Group, compared with EUR 661.0 million (EUR
529.2 million pertaining to the Group) at 31 December 2016.
The decrease in Group shareholders' equity in the first half of 2017 (EUR 13.8 million) was
mainly due to the extraordinary dividend paid (EUR -31.2 million), the reasons already
discussed in the Statement of Performance (IAS 1) (EUR +21.9 million) and the effects of the
share buy-back plan (EUR -4.4 million). With regard to the Statement of Performance, the
positive result of EUR 21.9 million is mainly due to the investment in Kenan Investments /
Migros (EUR +17.7 million).
On 15 May 2017, in accordance with the vote of the Shareholders' Meeting on 20 April 2017,
DeA Capital S.p.A. made a partial distribution of the share premium reserve in an amount of
EUR 0.12 per share, i.e. based on the total number of shares net of treasury shares held, in an
amount of around EUR 31.2 million.
The table below provides details of changes in the fair value reserve in the first half of 2017.
Shareholders' equity attributable to minorities
At 30 June 2017, shareholders’ equity attributable to minorities was approximately EUR 130.6
million, compared with EUR 131.8 million at 31 December 2016. This item relates to the
shareholders' equity attributable to minorities resulting from the line-by-line consolidation of
IDeA FIMIT SGR, the IDeA OF I fund and the subsidiary SPC.
The table below summarises details of the financial information of IDeA FIMIT SGR and IDeA
OF I, before elimination of the intercompany relationships with the Group’s other companies,
as at 30 June 2017.
(EUR thousand)Balance at
1.1.2017
Change in
Fair ValueTax Effect
Other
movements
Balance at
30.6.2017
Direct Investments / Shareholdings 3,668 283 0 0 3,951
Funds and other reserves 64,174 15,999 (586) 0 79,587
Total 67,842 16,282 (586) 0 83,538
(EUR thousand) First Half 2017 First Half 2016First Half
2017
First Half
2016
Alternative Asset Management fees 20,039 20,401 0 0
Net profit/(loss) for the year (1,004) 2,365 2,248 (5,432)
Profit/(loss) attributable to minorities (1,670) 844 1,192 (2,880)
Other profit/(loss), net of tax effect 2,014 2,030 686 3,590
Total comprehensive profit/(loss) for the year 1,011 4,395 2,934 (1,842)
Total comprehensive profit/(loss) for the year attributable to minorities (951) 1,569 1,555 (976)
(EUR thousand)30.6.2017
31.12.201630.6.2017
31.12.2016
Current assets 31,823 30,175 2,271 136
Non-current assets 194,284 200,107 95,604 93,886
Current liabilities (14,734) (14,870) (941) (22)
Non-current liabilities (10,663) (10,738) 0 0
Net assets 200,710 204,674 96,934 94,000
Net assets attributable to minorities 79,304 82,031 51,385 49,829
(EUR thousand)
First Half
2017
First Half
2016 First Half
2017
First Half
2016
CASH FLOW from operations 643 (7,843) 1,182 (5,612)
CASH FLOW from investment assets (332) (218) 0 0
CASH FLOW from financial assets (1,808) (1,937) 978 3,400
NET INCREASE IN CASH AND CASH EQUIVALENTS (1,496) (9,998) 2,161 (2,212)
Dividends paid to minorities during the year (1,808) (1,937) 0 0
IDeA FIMIT SGR IDeA OF I Fund
Half-Year Report
to 30 June 2017
68
NON-CURRENT LIABILITIES
At 30 June 2017, non-current liabilities totalled EUR 12.7 million, compared with EUR 12.8
million at 31 December 2016.
6a – Deferred tax liabilities
This item totalled EUR 8.6 million at 30 June 2017, unchanged on 31 December 2016. It
mainly included deferred tax liabilities related to the tax effects of allocating part of the
acquisition cost of the subsidiaries in the purchase price allocation (PPA) phase.
6b – End-of-service payment fund
At 30 June 2017, this item totalled EUR 3.9 million, compared with EUR 4.0 million at 31
December 2016, and included end-of-service payments that are part of defined benefit plans,
which were therefore valued using actuarial assessments.
CURRENT LIABILITIES
At 30 June 2017, current liabilities totalled EUR 25.2 million, compared with EUR 27.0 million
at 31 December 2016.
7a – Trade payables
At 30 June 2017, other payables totalled EUR 5.8 million, compared with EUR 6.0 million at 31
December 2016.
7b – Payables in respect of staff and social security organisations
At 30 June 2017, this item was EUR 5.4 million, compared with EUR 7.0 million at 31
December 2016, and primarily comprised the liability to staff for unused leave, bonuses, and
payables to social security organisations.
7c – Current tax payables
At 30 June 2017, this item was EUR 2.8 million, compared with EUR 2.9 million at 31
December 2016, and mainly related to the EUR 2.4 million payable of IDeA Capital Funds SGR
in relation to the national tax consolidation scheme of the Group headed by De Agostini S.p.A.
7d – Other tax payables
Other tax payables totalled EUR 1.2 million at 30 June 2017, compared with EUR 1.4 million at
31 December 2016, and chiefly relate to the payable to the tax authorities for taxes deducted
from the income of employees and self-employed staff.
7e – Other payables
At 30 June 2017, other payables amounted to EUR 9.3 million, compared with EUR 8.3 million
at 31 December 2016. Of these, an amount of EUR 7.7 million related to payables due by IDeA
FIMIT SGR to managed funds (for VAT) and to distributors.
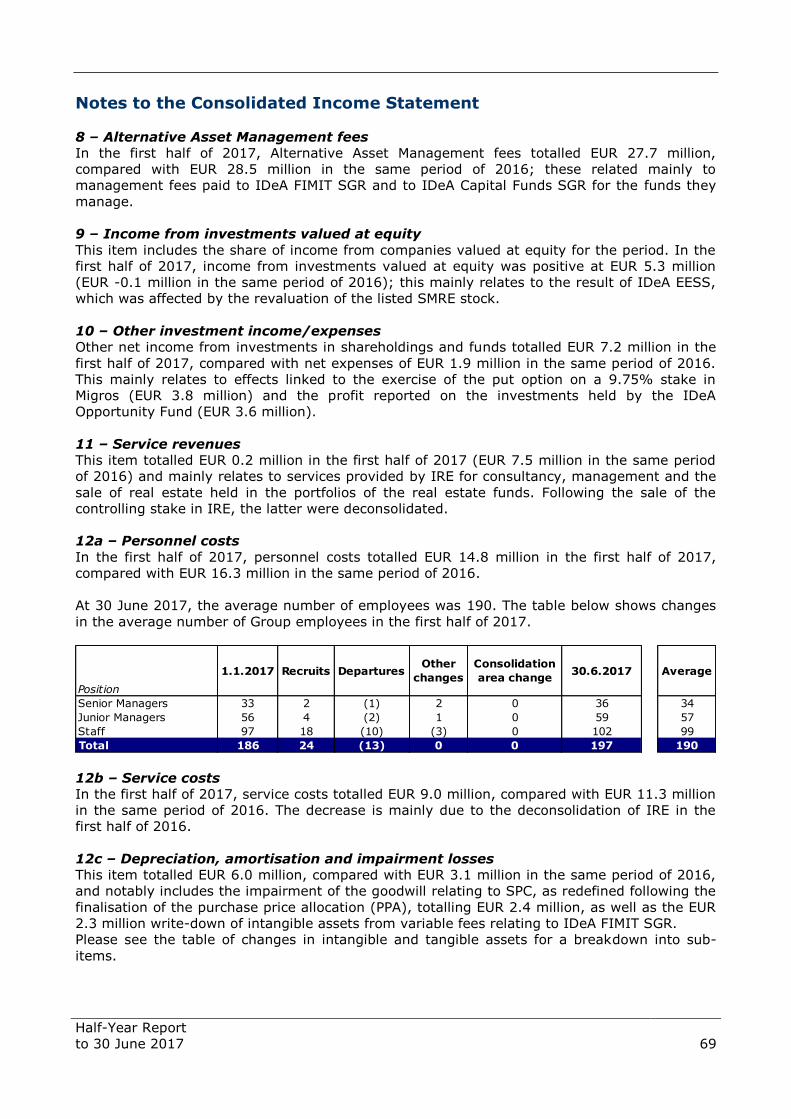
Half-Year Report
to 30 June 2017
69
Notes to the Consolidated Income Statement
8 – Alternative Asset Management fees
In the first half of 2017, Alternative Asset Management fees totalled EUR 27.7 million,
compared with EUR 28.5 million in the same period of 2016; these related mainly to
management fees paid to IDeA FIMIT SGR and to IDeA Capital Funds SGR for the funds they
manage.
9 – Income from investments valued at equity
This item includes the share of income from companies valued at equity for the period. In the
first half of 2017, income from investments valued at equity was positive at EUR 5.3 million
(EUR -0.1 million in the same period of 2016); this mainly relates to the result of IDeA EESS,
which was affected by the revaluation of the listed SMRE stock.
10 – Other investment income/expenses
Other net income from investments in shareholdings and funds totalled EUR 7.2 million in the
first half of 2017, compared with net expenses of EUR 1.9 million in the same period of 2016.
This mainly relates to effects linked to the exercise of the put option on a 9.75% stake in
Migros (EUR 3.8 million) and the profit reported on the investments held by the IDeA
Opportunity Fund (EUR 3.6 million).
11 – Service revenues
This item totalled EUR 0.2 million in the first half of 2017 (EUR 7.5 million in the same period
of 2016) and mainly relates to services provided by IRE for consultancy, management and the
sale of real estate held in the portfolios of the real estate funds. Following the sale of the
controlling stake in IRE, the latter were deconsolidated. 12a – Personnel costs
In the first half of 2017, personnel costs totalled EUR 14.8 million in the first half of 2017,
compared with EUR 16.3 million in the same period of 2016.
At 30 June 2017, the average number of employees was 190. The table below shows changes
in the average number of Group employees in the first half of 2017.
12b – Service costs
In the first half of 2017, service costs totalled EUR 9.0 million, compared with EUR 11.3 million
in the same period of 2016. The decrease is mainly due to the deconsolidation of IRE in the
first half of 2016.
12c – Depreciation, amortisation and impairment losses
This item totalled EUR 6.0 million, compared with EUR 3.1 million in the same period of 2016,
and notably includes the impairment of the goodwill relating to SPC, as redefined following the
finalisation of the purchase price allocation (PPA), totalling EUR 2.4 million, as well as the EUR
2.3 million write-down of intangible assets from variable fees relating to IDeA FIMIT SGR.
Please see the table of changes in intangible and tangible assets for a breakdown into sub-
items.
Position
1.1.2017 Recruits DeparturesOther
changes
Consolidation
area change30.6.2017 Average
Senior Managers 33 2 (1) 2 0 36 34
Junior Managers 56 4 (2) 1 0 59 57
Staff 97 18 (10) (3) 0 102 99
Total 186 24 (13) 0 0 197 190
Half-Year Report
to 30 June 2017
70
12d – Other costs
Other costs totalled EUR 5.5 million in the first half of 2017, compared with EUR 1.6 million in
the same period of 2016. This item consists of pro-rata non-deductible VAT on costs incurred
by IDeA FIMIT SGR in the first half of 2017 (EUR 0.7 million) and the impairment of
receivables due to IDeA FIMIT (EUR 4.1 million, of which EUR 3.8 million relates to final
variable fees for the Beta fund and EUR 0.3 million to receivables for management fees).
13 – Financial income (expenses)
Financial income totalled EUR 0.3 million in the first half of 2017 (EUR 0.5 million in the same
period of 2016), and financial expenses were EUR 0.5 million (EUR 1.8 million in the year-
earlier period).
Financial income
Financial expenses
14 – Income tax
Income tax came to EUR +0.4 million in the first half of 2017, compared with EUR -0.9 million
in the first half of 2016.
(EUR thousand) First Half 2017 First Half 2016
Interest income 322 450
Income from financial instruments valued at fair
value through profit and loss0 0
Foreign exchange gains 2 2
Other income 0 5
Total 324 522
(EUR thousand) First Half 2017 First Half 2016
Interest expense 18 107
Exchange losses 407 1,652
Financial charge IAS 19 25 26
Other 0 0
Total 450 1,785
(EUR thousand) First Half 2017 First Half 2016
Current taxes:
Income from tax consolidation scheme 735 1,037
- IRES (432) (1,461)
- IRAP (538) (1,199)
- Other tax 0 (50)
Total Current taxes (235) (1,673)
Deferred taxes for the period:
- Charges for deferred/prepaid taxes (187) (1,076)
- Income from deferred/prepaid taxes 862 1,499
- Use of deferred tax liabilities 0 361
- Use of deferred tax assets 0 0
Total deferred taxes 675 784
Total income tax 440 (889)

Half-Year Report
to 30 June 2017
71
15 – Earnings per share
Basic earnings per share are calculated by dividing net profit attributable to the Group's
shareholders by the weighted average number of shares outstanding, in both cases relating to
the period.
Diluted earnings per share are calculated by dividing net profit attributable to the Group's
shareholders by the weighted average number of shares outstanding during the period,
including any diluting effects of any existing stock option plans that are currently “in the
money”.
(EUR thousand) First Half 2017 First Half 2016
Consolidated net profit/(loss) - Group share (A) 6,235 1,904
Weighted average number of ordinary shares outstanding (B) 259,890,427 266,557,823
Basic earnings/(loss) per share (€ per share) (C=A/B) 0.024 0.007- -
Restatement for dilutive effect 0 0
Consolidated net profit/(loss) restated for dilutive effect (D) 6,235 1,904
Weighted average number of shares to be issued for the exercise of
stock options (E) 162,211 956,844
Total number of shares outstanding and to be issued (F) 260,052,638 267,514,667
Diluted earnings/(loss) per share (€ per share) (G=D/F) 0.024 0.007
Half-Year Report
to 30 June 2017
72
Other information
Transactions with parent companies, subsidiaries and related parties
Transactions with related parties, including those with other Group companies, were carried
out in accordance with the Procedure for Related Party Transactions adopted by the Company
with effect from 1 January 2011, in accordance with the provisions of the Regulation
implemented pursuant to art. 2391-bis of the Italian Civil Code with Consob Resolution 17221
of 12 March 2010, as subsequently amended. During the first half of the year, the Company
did not carry out any atypical or unusual transactions with related parties. In addition, it did
not carry out any "significant transactions" as defined in the above-mentioned procedure.
Transactions with related parties during the first half of 2017 were carried out under standard
market conditions for the nature of the goods and/or services offered.
With regard to transactions with parent companies, note the following:
1) DeA Capital S.p.A. has signed a service agreement with the controlling shareholder, De
Agostini S.p.A., for the latter to provide operating services in administration, finance,
control, legal, corporate, tax, investor relations, and institutional and press services.
This agreement, which is automatically renewed each year, is priced at market rates,
and is intended to allow the Company to maintain a streamlined organisational
structure in keeping with its development policy, while obtaining sufficient operational
support.
In addition, on 1 January 2013, DeA Capital S.p.A. signed an “Agreement to sub-let
property for use other than residential use” with the controlling shareholder, De
Agostini S.p.A. The agreement relates to parts of a building located at Via Brera, 21,
Milan, comprising space for office use, warehousing and car parking.
This agreement is renewable every six years after an initial term of seven years.
2) DeA Capital S.p.A., IDeA Capital Funds SGR and DeA Capital Real Estate have adopted
the national tax consolidation scheme of the De Agostini Group (the Group headed by
De Agostini S.p.A., formerly B&D Holding di Marco Drago e C. S.a.p.a.). This option was
exercised jointly by each company and De Agostini S.p.A. through the signing of the
“Regulation for participation in the national tax consolidation scheme for companies in
the De Agostini Group” and notifying the tax authorities of this option pursuant to the
procedures and terms and conditions laid down by law. The option is irrevocable unless
the requirements for applying the scheme are not met.
The option is irrevocable for DeA Capital S.p.A. for the three-year period 2017-2019, for
IDeA Capital Funds SGR for the three-year period 2015-2017 and for DeA Capital Real
Estate for the three-year period 2016-2018.
3) In order to allow more efficient use of liquidity and the activation of credit lines with
potentially better terms and conditions compared with those that may be obtained from
banks, DeA Capital S.p.A. has signed a framework agreement (Framework Agreement)
with the Parent Company De Agostini S.p.A. for the provision of short-term
intercompany loans/deposits.
Deposit/financing operations falling within this Framework Agreement shall be activated
only subject to verification that the terms and conditions, as determined from time to
time, are advantageous, and will be provided on a revolving basis, and with maturities

Half-Year Report
to 30 June 2017
73
of not more than three months. The Framework Agreement has a duration of one year
and is automatically renewed each year.
The amounts involved in the deposit/financing operations will, however, always be
below the thresholds defined for “transactions of lesser importance” pursuant to Consob
Regulation 17221/2010 (Related Party Transactions) and the internal Procedure for
Related Party Transactions adopted by DeA Capital S.p.A.
Note that there have been no deposit/financing transactions between DeA Capital
S.p.A. and the Parent Company De Agostini S.p.A. since the above framework
agreement was signed.
* * *
In the first half of 2017, the Company also carried out transactions with its subsidiaries under
market conditions.
During the first half of 2017, the Company did not hold, purchase or sell, through a trust
company or third party, any shares in the Parent Company De Agostini S.p.A.
The table below summarises the amounts of trade-related transactions between DeA Capital
Group companies.
Directors’ and auditors’ remuneration
In the first half of 2017, remuneration payable to the Parent Company's directors and auditors
for the performance of their duties totalled EUR 147.9 thousand and EUR 75.5 thousand
respectively.
(EUR thousand)Trade receivables Tax receivables Other tax receivables Tax payables Trade payables Income from servicesFinancial income Personnel costs Service costs
Sigla S.r.l. 0 0 0 0 0 0 0 0 0
Innovation Real Estate Group 0 0 0 0 0 0 0 0 0
De Agostini S.p.A. 83 3,037 130 2,354 33 173 64 (45) 0
Gruppo De Agostini Editore S.p.A. 0 0 0 0 0 0 0 0 (131)
Lottomatica S.p.A. 0 0 0 0 0 13 0 0 0
DeA Factor S.p.A. 0 0 0 0 0 0 0 0 0
De Agostini Invest S.A. 0 0 0 0 0 0 0 0 0
Total related parties 83 3,037 130 2,354 33 186 64 (45) (131)
Total financial statement line item 17,089 3,037 3,290 2,789 5,824 27,887 324 (14,752) (9,007)
As % of financial statement line item 0.5% 100.0% 4.0% 84.4% 0.6% 0.7% 19.8% 0.3% 1.5%
30.6.2017 First Half 2017
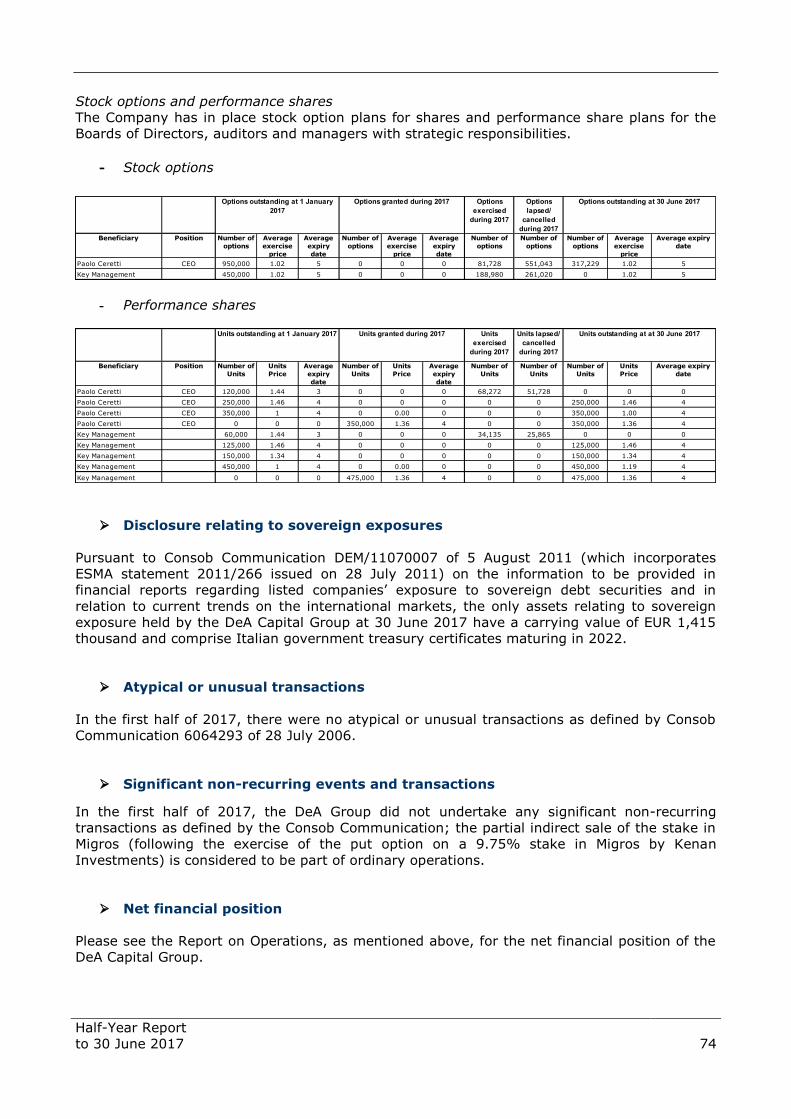
Half-Year Report
to 30 June 2017
74
Stock options and performance shares
The Company has in place stock option plans for shares and performance share plans for the
Boards of Directors, auditors and managers with strategic responsibilities.
- Stock options
- Performance shares
Disclosure relating to sovereign exposures
Pursuant to Consob Communication DEM/11070007 of 5 August 2011 (which incorporates
ESMA statement 2011/266 issued on 28 July 2011) on the information to be provided in
financial reports regarding listed companies’ exposure to sovereign debt securities and in
relation to current trends on the international markets, the only assets relating to sovereign
exposure held by the DeA Capital Group at 30 June 2017 have a carrying value of EUR 1,415
thousand and comprise Italian government treasury certificates maturing in 2022.
Atypical or unusual transactions
In the first half of 2017, there were no atypical or unusual transactions as defined by Consob
Communication 6064293 of 28 July 2006.
Significant non-recurring events and transactions
In the first half of 2017, the DeA Group did not undertake any significant non-recurring
transactions as defined by the Consob Communication; the partial indirect sale of the stake in
Migros (following the exercise of the put option on a 9.75% stake in Migros by Kenan
Investments) is considered to be part of ordinary operations.
Net financial position
Please see the Report on Operations, as mentioned above, for the net financial position of the
DeA Capital Group.
Options
exercised
during 2017
Options
lapsed/
cancelled
during 2017
Beneficiary Position Number of
options
Average
exercise
price
Average
expiry
date
Number of
options
Average
exercise
price
Average
expiry
date
Number of
options
Number of
options
Number of
options
Average
exercise
price
Average expiry
date
Paolo Ceretti CEO 950,000 1.02 5 0 0 0 81,728 551,043 317,229 1.02 5
Key Management 450,000 1.02 5 0 0 0 188,980 261,020 0 1.02 5
Options outstanding at 30 June 2017Options outstanding at 1 January
2017
Options granted during 2017
Units
exercised
during 2017
Units lapsed/
cancelled
during 2017
Beneficiary Position Number of
Units
Units
Price
Average
expiry
date
Number of
Units
Units
Price
Average
expiry
date
Number of
Units
Number of
Units
Number of
Units
Units
Price
Average expiry
date
Paolo Ceretti CEO 120,000 1.44 3 0 0 0 68,272 51,728 0 0 0
Paolo Ceretti CEO 250,000 1.46 4 0 0 0 0 0 250,000 1.46 4
Paolo Ceretti CEO 350,000 1 4 0 0.00 0 0 0 350,000 1.00 4
Paolo Ceretti CEO 0 0 0 350,000 1.36 4 0 0 350,000 1.36 4
Key Management 60,000 1.44 3 0 0 0 34,135 25,865 0 0 0
Key Management 125,000 1.46 4 0 0 0 0 0 125,000 1.46 4
Key Management 150,000 1.34 4 0 0 0 0 0 150,000 1.34 4
Key Management 450,000 1 4 0 0.00 0 0 0 450,000 1.19 4
Key Management 0 0 0 475,000 1.36 4 0 0 475,000 1.36 4
Units outstanding at 1 January 2017 Units granted during 2017 Units outstanding at at 30 June 2017
Half-Year Report
to 30 June 2017
75
Significant events after the end of the period and outlook
SIGNIFICANT EVENTS AFTER THE END OF THE PERIOD
AAM funds – paid calls/distributions After the end of the first half of 2017, the DeA Capital Group increased its investments in the
IDeA I FoF, ICF II, IDeA ToI and ICF III funds with payments totalling EUR 2.0 million.
At the same time, the DeA Capital Group received capital reimbursements from the IDeA I FoF,
ICF II and Venere funds (EUR 7.8 million, EUR 3.6 million and EUR 0.5 million respectively) to
be used in full to reduce the carrying value of the units.
Sale of investments in Sigla and SiCollection
On 7 July 2017, Sigla Luxembourg, a 41.4%-owned investee company of DeA Capital S.p.A,
signed an agreement for the sale of two investments (100% of the capital) held in Sigla and
SiCollection to Alchemy Special Opportunities Fund (Alchemy).
Sigla, which is recorded in the register of intermediaries pursuant to art. 106 of the Italian
Consolidated Banking Law (TUB), operates in salary-backed loans, while SiCollection is active
in the servicing of non-performing loans. Alchemy specialises in investments in private equity
and special situations in Europe and has a proven track record in the financial services sector.
The transaction includes, inter alia, the standard reps and warranties for this type of
agreement. It is subject to conditions precedent, which include obtaining the necessary
approval of the supervisory authorities. Completion is expected by the end of 2017.
The consideration for the sale, net of transaction costs and expenses relating to the
management equity plan (for Sigla Luxembourg), is expected to generate a pro-rata share of
around EUR 11.8 million for DeA Capital (slightly higher than the book value of the investment
in Sigla Luxembourg).
Increased voting rights for DeA Capital S.p.A. shares held by the Parent
Company De Agostini S.p.A.
On 7 July 2017, an increase was made to the voting rights relating to 178,795,798 ordinary
shares of DeA Capital S.p.A., held by De Agostini S.p.A. (subsidiary of B&D Holding di Marco
Drago e C. S.a.p.a.), pursuant to Art. 127-quinquies of the T.U.F. and the provisions of the
Articles of Association.
Following this increase, De Agostini S.p.A. – which holds approximately 58.3% of the share
capital of DeA Capital S.p.A. – held approximately 73.7% of the related voting rights.
Acquisition of Yard by IRE
On 24 July 2017, Innovation Real Estate (IRE), a 45%-owned investee company of the DeA
Capital Group, completed the acquisition of the Yard Group, a full-service provider operating in
the real estate sector, which has a customer/services mix that is complementary to that of
Half-Year Report
to 30 June 2017
76
IRE. The transaction, which does not involve any share exchanges, will take the form of a
merger by incorporation of Yard into IRE, and is expected to complete by 2018.
SPC capital increase
In July 2017, paid calls totalling EUR 2.5 million were made on the capital of SPC (DeA Capital
share: EUR 2 million). Following the subsequent shareholder resolutions (to cover losses and
increase the share capital), these decreased the DeA Capital Group's stake in SPC to 80%
(from the previous 85%).
OUTLOOK
In relation to Private Equity Investment, work will continue on enhancing the value of the
portfolio investments, while simultaneously assessing the possibility of new initiatives, on a
more modest scale than previously, mainly with a view to club deals / co-investment (including
with the funds managed by the asset management platform). Using the capital already
available, as well as proceeds from the sale of assets currently held in the portfolio and from
redemptions of the funds in which DeA Capital S.p.A. has invested, the Group will also
continue to sponsor new initiatives promoted by the asset management platform, (by investing
in funds launched by this platform).
In relation to Alternative Asset Management, work will continue on developing the
platform, aiming to consolidate the leadership in Italy and to widen the investor base and the
product range, with a greater presence in the NPL segment. Against this backdrop, in order to
make optimal use of internal know-how and with a view to encouraging the recognition of DeA
Capital as an integrated platform (Private Equity, Real Estate and NPL), there will be a
strengthening of the coordination of the development and investor coverage functions.
In terms of assets, DeA Capital S.p.A. will continue to maintain a solid financial structure while
simultaneously ensuring cash returns for shareholders (through dividends and buy-backs),
according to the available funds.
Half-Year Report
to 30 June 2017
77
Statement of responsibilities for the Consolidated Financial Statements
Half-Year Report to 30 June 2017

Half-Year Report
to 30 June 2017
78
STATEMENT OF RESPONSIBILITIES FOR THE SUMMARY CONSOLIDATED HALF-
YEAR REPORT TO 30 JUNE 2017 (PURSUANT TO ART. 154-BIS OF LEGISLATIVE
DECREE 58/98)
The undersigned, Paolo Ceretti, as Chief Executive Officer, and Manolo Santilli, as
the manager responsible for preparing the Company's financial statements, hereby certify,
pursuant to art. 154-bis, paragraphs 3 and 4 of Legislative Decree 58 of 24 February 1998
that, based on the characteristics of the company, the administrative and accounting
procedures for preparing the Summary Consolidated Half-Year Report of the DeA Capital Group
to 30 June 2017 were appropriate and effectively applied.
The assessment as to the suitability of the administrative and accounting procedures for
preparing the Summary Consolidated Half-Year Report to 30 June 2017 was based on a
process established by DeA Capital S.p.A. in keeping with the Internal Control - Integrated
Framework model issued by the Committee of Sponsoring Organisations of the Treadway
Commission, which is the generally accepted reference framework at international level.
It should be noted in this regard that, as described in the notes to the Summary Consolidated
Half-Year Report to 30 June 2017, the preparation of the Summary Consolidated Half-Year
Report to 30 June 2017, as permitted by IAS/IFRS, required the use of significant estimates by
the Company's management, especially with regard to fair value assessments of the
investment portfolio (shareholdings and funds). These fair value measurements were
determined by the directors based on their best estimates and judgement, using their
knowledge and evidence available at the time the summary consolidated half-year financial
statements to 30 June 2017 were prepared. However, due to objective difficulties in making
assessments and the absence of a liquid market, the values assigned to such assets could
differ, in some cases significantly, from those that could be obtained when the assets are sold.
The undersigned further certify that the Summary Consolidated Half-Year Report to 30 June
2017:
- was prepared in accordance with the applicable international accounting standards
recognised in the European Community pursuant to (EC) European Parliamentary and
Council Regulation 1606/2002 of 19 July 2002 and, in particular, IAS 34 (Interim
Financial Reporting), and the rules issued to implement art. 9 of Legislative Decree
38/2005;
- correspond to book and accounting entries of the Group companies;
- provide a true and fair view of the operating performance and financial position of the
issuer and all the companies included in the consolidation.
The Interim Report on Operations contains references to significant events that occurred in the
first six months of 2017 and their impact on the Summary Consolidated Half-Year Financial
Statements to 30 June 2017, together with a description of the main risks and uncertainties for
the remaining six months of the year, and information on significant related-party
transactions.
Milan, 8 September 2017
Paolo Ceretti Manolo Santilli
Chief Executive Officer Manager responsible for preparing the
Company’s accounting statements