half year report - home - vastned retail belgium committee closed limited liability company under...
TRANSCRIPT
HALF YEAR REPORT3 0 J U N E 2 0 0 6

HALF YEAR REPORT3 0 J U N E 2 0 0 6
U i t b r e i d i n g s t r a a t 1 8
2 6 0 0 B e r c h e m
P r o p e r t y i n v e s t m e n t f u n d w i t h
F i x e d C a p i t a l u n d e r B e l g i a n l a w

1
Intervest Retail - half year report
CONTENTS
MANAGEMENT AND ORGANISATION P. 2
1. INTERVEST RETAIL P. 31.1. Profile P. 31.2. Investment policy P. 31.3. Management P. 4
2. DEVELOPMENTS IN THE FIRST HALF YEAR OF 2006 P. 52.1. Investments P. 5 2.1.1. Factory Shopping Messancy P. 5 2.1.2. Olen P. 5 2.1.3. Tongeren P. 62.2. Sales P. 6
3. GROWTH PROSPECTS P. 7
4. FINANCIAL RESULTS P. 84.1. Analysis of financial results P. 84.2. Financial statements P. 104.3. Net asset value and share price P. 184.4. Statutory Auditor’s report P. 19
5. PROPERTY PORTFOLIO P. 205.1. Valuations per 30 June 2006 P. 205.2. Overview retail market P. 205.3. Key figures and charts P. 215.4. Overview of the property portfolio P. 22

2
MANAGEMENT AND ORGANISATION
Registered offi ceUitbreidingstraat 18, 2600 Berchem
Enterprise identifi cation number0431.391.860
Board of DirectorsPaul Christiaens, Director
Gérard Philippson, DirectorJoost Rijnboutt, Managing DirectorHubert Roovers, Managing Director
Reinier van Gerrevink, Chairman
Executive CommitteeClosed Limited Liability Company under Belgian Law Jean-Paul Sols, CEO
Closed Limited Liability Company under Belgian Law Rudi Taelemans, COOInge Tas, CFO
Reinier van Gerrevink
Statutory AuditorDeloitte Company Auditors, professional partnership in the form of a co-operative partnership
with limited liability, Berkenlaan 8b, 1831 Diegem, represented by Rik Neckebroeck
Custodian bank – Financial services – Liquidity providerBank Degroof, Nijverheidsstraat 44, 1000 Brussels
Property expertsCushman & Wakefi eld, Kunstlaan 58 bus 7, 1000 Brussels
de Crombrugghe & Partners, G. Demeylaan 72-74, 1160 Brussels
Date of annual general meetingFirst Wednesday in April, 2.30 p.m.

3
Intervest Retail - half year report
1. INTERVEST RETAIL 1 . 1 . P r o f i l e
Intervest Retail invests exclusively in Belgian commercial property, focusing pri-marily on inner city shops in prime locations and on retail warehouses. Shopping centres also represent possible investment opportunities. Beside, the company also invests in a factory outlet in Messancy.
At present the portfolio is made up of 297 lettable units, spread over 85 different locations. 42% of the retail portfolio consists of inner city shops, 45% of retail ware-houses and 13% of a factory outlet. The total fair value of the investment properties as at 30 June 2006 amounts to € 260.803.000 (investment value € 267.323.000). The fair value of the development projects amounts to € 8.881.000 on 30 June 2006 (investment value € 8.995.000).
Intervest Retail has been registered as a property investment fund in the list of Belgian investment institutions since 22.12.1998, and has been included in the Next Prime segment of Euronext in Brussels since 01.01.2002.
1 . 2 . I n v e s t m e n t p o l i c y
The investment policy is geared towards achieving a combination of a direct yield based on rental income and an indirect yield based on the increase in the value of the property portfolio.
Expansion of the portfolio should always lead to a better risk spread, cost benefi ts and increased shareholder value. As far as possible, mergers and contributions in kind are realised against payment of new shares, whereby the free fl oat1 and liqui-dity2 of the share are improved.
As a result of the recent change in law by the Royal Decree dated 21 June 2006, a maximum debt ratio of 65% is allowed. Intervest Retail will make appropriate use of this possibility in developing its investment programme. Intervest Retail also wi-shes to keep suffi cient fi nancing capacity available to enable a fl exible reaction on investment opportunities without having to recourse to capital increases.
1 Free fl oat is the number of shares circulating freely on the stock exchange and therefore not in permanent ownership.
2 Liquidity is the ease with which a share can be traded.
4
1 . 3 . M a n a g e m e n t
Intervest Retail applies the principles of corporate governance to ensure that share-holder value can be increased in the most effi cient way.
The Board of Directors, composed for the greater part of independent directors, has as principal tasks working out the company’s strategy, approving the annual ac-counts and controlling the Executive Committee. Within the Board of Directors, an Audit Committee was set up, mainly controlling the correctness, completeness and quality of the fi nancial information to be published.The Board of Directors consists of the following members:
• Gérard Philippson, independent director and member of the Audit Committee;• Paul Christiaens, independent director and chairman of the Audit Committee;• Joost Rijnboutt, independent managing director;• Hubert Roovers, managing director and representative of the majority shareholder;• Reinier van Gerrevink, chairman of the Board of Directors, member of the Audit
Committee and representative of the majority shareholder.
As of 1 January 2004, Intervest Retail is a ‘self managed fund’, with own personnel and an own Executive Committee. This Executive Committee has all powers, with the exception of the actions that, on the basis of legal stipulations, are reserved for the Board of Directors as well as the strategic policy. As of 30 June 2006 the Execu-tive Committee is composed as follows:
• Closed Limited Liability Company under Belgian Law Jean-Paul Sols, represented by Jean-Paul Sols, Chief Executive Offi cer;
• Closed Limited Liability Company under Belgian Law Rudi Taelemans, represented by Rudi Taelemans, Chief Operating Offi cer;
• Inge Tas, Chief Financial Offi cer;• Reinier van Gerrevink.
As of 1 April 2006, the Closed Limited Liability Company under Belgian Law Gert Cowé, represented by Gert Cowé, resigned its function as Chief Executive Offi cer and chairman of the Executive Committee. Reinier van Gerrevink was temporarily employed for the period from 1 April 2006 to 23 April 2006 as Chief Executive Of-fi cer and chairman of the Executive Committee, replacing Gert Cowé.

5
Intervest Retail - half year report
2. DEVELOPMENTS IN FIRST HALF YEAR OF 2006
2 . 1 . I n v e s t m e n t s
2.1.1. Factory Shopping Messancy
Letting of Factory Shopping Messancy (FSM) is proceeding well.Newcomers include Kids Factory, Crossways, Compagnie de Californie and Berlingot, together with attractive catering businesses that increase the experiential value for visitors.
Since the efforts in architecture and design, the value of the centre as an attraction has been highly apparent. Minale Design was recently awarded the “Janus du com-merce” award by the Institut Français du Design for its work at Messancy.
In the second quarter of 2006 an amendment to FSM’s socio-economic license was obtained as a result of which 3.500 m2 of leisure area has been converted into retail space. The occupancy rate of the whole (expanded) retail part of FSM is 76% on 30 June 2006. The occupancy rate of the operational part is 93 %. The leisure areas have been made ready for letting in the fi rst half of the year. Contacts currently exist for letting these units.
Besides letting the additional areas, increasing visitor numbers and their associ-ated turnover fi gures remains a challenge. Visitor numbers are increasing favou-rably. So far as turnover is concerned, clear differences are apparent between the different shops. FSM’s onsite management is reacting to this by arranging specifi c commercial campaigns and discussions with shop management.
2.1.2. Olen
The redevelopment of Wooncentrum Van De Ven in Olen requires a lot of attention. The permit phase for the redevelopment of Shopping Park Olen is now coming to an end. Intervest Retail expects the building permit to be granted in the autumn.
On 14 February 2006, a claim is submitted to have the expansion of the socio-eco-

6
nomic permit declared invalid, however this claim should not prevent the future Shopping Park from operating as long as the City Council does not rule against it. The dispute only involves expanding the authorised net selling surface area of 11.282m2 to a total of 26.642 m2.
Aside from the great interest shown by the tenants, Intervest Retail is looking into ways to further enhance the concept. In particular, Intervest Retail is busy deter-mining the ideal placement for its top-selling tenants in order to drive maximum revenue.
2.1.3. Tongeren
Commercialisation of the Julianus shop project, which is under construction, is going according to plan. In the current stage, around 30 % of the shops have been let. Besides Kruidvat, JBC, Torfs Schoenen, Essenza and Bel Company, Veritas and Zanier have also signed leases. This means that around 30 % of the ground fl oor of the shopping centre is let.
An agreement in principle has been signed with H&M and the negotiations to fi nalise the lease are at a very advanced stage. Negotiations with an experienced catering establishment operator are also in their fi nal phase. If, as expected, both deals are formally settled in the near future, more than 50% of the ground fl oor area will have been let.
An important issue for the centre is to conclude a lease for a supermarket of at least 1.000 m2 on level -1. A well-known international distribution chain is showing interest in this respect.
The building works, both new construction and renovation, are going according to plan
2 . 2 . S a l e s
Intervest Retail has completed a sales programme worth (originally) approximately € 18 million. This involves non-strategic buildings. Selling these buildings and rein-vesting the funds has a positive effect on the average quality of the portfolio

7
Intervest Retail - half year reportThe following properties are sold during the fi rst half of 2006:
Location Address Surface in m2
Sales price in €
Fair value at the moment
of sale in €
Gain-/loss in €
Aalst Kalfstraat 3 9,726 7,643,252 8,086,317 -443,065Dinant Tienne de l’Europe 4,330 3,124,989 3,267,357 -141,968Gerpinnes rue de Bertransart 99 290 192,161 199,587 -7,426Glain rue St-Nicolas 572 1,990 912,000 1,007,711 -95,711Hannut rue de Huy 63 3,015 1,668,348 2,081,947 -413,599Kapellen Eikendreef 5 906 485,528 476,224 9,304Oostende Torhoutsesteenweg 610 1,000 1,028,461 1,045,086 -16,625Roeselare Brugsesteenweg 524 1,000 857,478 868,612 -11,134Seraing boulevard Pasteur 47 1,263 1,080,000 834,135 245,865Sint-Niklaas Kapelstraat 119 940 315,275 357,665 -42,390Sint-Truiden Hasseltsesteenweg 69 850 890,303 831,907 58,396Sint-Truiden Kattestraat 25 1,401 1,299,899 1,200,234 99,665Total sales -758,688
Transaction costs -392,180
TOTAL 26,711 19,497,694 20,256,782 -1,150,868
3. GROWTH PROSPECTS In the short term, Intervest Retail’s efforts will be directed mainly to improving the quality of the existing property portfolio, investigating various growth scenarios, further commercial strengthening of Factory Shopping Messancy and redevelop-ment of the Shopping Park in Olen.
The company is continuously studying investment fi les. Given the high availability of liquidity in the capital market and the still relatively low long-term interest rates, historically speaking absolute top prices are being paid. Particularly in prime sites in Antwerp and Brussels, properties are being bought at a gross initial return of 4,25 %. A comparable phenomenon is occurring in other important locations.
Since such investments generate a limited yield, Intervest Retail is concentrating on cases that attract less attention from foreign investors and are a good deal more profi table. However, these investments are frequently on a smaller scale, which slows growth to some extent.

8
4. FINANCIAL RESULTS The consolidated fi nancial statements for the six months period ended 30 June 2006 have been prepared in accordance with IAS 34 “Interim fi nancial reporting”. The accounting principles have been consistently applied with those of the fi nan-cial statements of the accounting year 2005.
4 . 1 . A n a l y s i s o f t h e f i n a n c i a l r e s u l t s 4
In the fi rst half of 2006, the retail property market experienced solid growth in both the rental as well as the investment markets. Rental prices are on the rise for prime retail locations in major shopping streets. Rental prices for retail warehouses and retail car parks have remained strong. The shortage of investment properties has been driving prices up for retail space in prime locations.
The total occupancy rate on 30 June 2006 reached 95,35% (96,05 % at the end of 2005), or 99,06% when excluding Factory Shopping Messancy (FSM).
Rental income in the fi rst half of 2006 fell slightly to € 9 million (€ 9,2 million) be-cause of eligible rent incentives related to letting at FSM to be taken into account.
Property charges rose to € 1,6 million (€ 1,3 million) due to higher operating costs at FSM. Since the second quarter of 2005, these costs are no longer capitalised but charged directly to the operating result. These are mainly marketing costs that can-not be passed on to the tenants.
General costs have increased in the fi rst half of 2006 to reach € 0,7 million (€ 0,6 million).
The operating result before the result on the portfolio was € 6,6 million (€ 7,4 million).
A loss of € 1,2 million was realised on the sale of 12 non-strategic properties, com-pared to the fair value of € 20,3 million. Intervest Retail has been actively involved in identifying reinvestment opportunities for this excess cash. However, shorta-ges on the investment market make it a challenge to fi nd suitable investments at reasonable conditions.
4 Comparable fi gures for 2005 between brackets.

9
Intervest Retail - half year report

1 0
The fi nancial result amounts to -€ 1,9 million (-€ 1,7 million) in the face of higher interest charges, given that FSM-related interest charges are no longer being capitalised.
The net profi t for the fi rst half of the year is € 2,2 million (€ 10,1 million) and can be broken down into a distributable operating result of € 4,7 million (€ 5,7 million) and a result on the portfolio of -€ 2,5 million (€ 4,4 million). This represents distributa-ble earnings per share of € 0,94 (€ 1,12).
The fair value of the portfolio on 30 June 2006 was € 269,7 million (€ 284,7 million on 31 December 2005). This decrease is primarily the consequence of disposals in 2006 (-€ 20,3 million), investments in Tongeren and FSM (€ 7,1 million) and portfo-lio value fl uctuations (-€ 1,4 million).
The net asset value (fair value) per share amounts to € 32,20 (€ 33,81). Given that the stock price on 30 June 2006 was € 36,98, the Intervest Retail share is quoted with a premium of 14,8% compared to net asset value (fair value).
According to the calculation method in article 6 of the Royal Decree dated 21 June 2006, the debt ratio was 42,02% on 30 June 2006 (40,73% on 31 December 2005).
The 2006 result will depend largely on the commercial and fi nancial success of FSM. The additional rentals and sustained marketing efforts should result in higher sales, from which sales-related rents can be generated.
For the entire year 2006, Intervest Retail is expecting distributable earnings per share between € 1,80 and € 1,90.

1 1
Intervest Retail - half year report
4 . 2 . F i n a n c i a l s t a t e m e n t s ( i n € 0 0 0 )
4.2.1. Consolidated balance sheet
ASSETS 30/06/2006 31/12/2005 Non-current assets 270,185 285,152 Intangible fi xed assets 23 10 Investment properties 260,803 280,107 Development projects 8,881 4,561 Other tangible fi xed assets 460 455 Trade receivables and other non-current assets 18 19 Current assets 15,223 9,121 Trade receivables 2,217 1,454 Tax receivables and other current assets 1,254 932 Cash and cash equivalents 11,450 6,566 Deferred charges and accrued income 302 169TOTAL ASSETS 285,408 294,273
SHAREHOLDERS’ EQUITY AND LIABILITIES 30/06/2006 31/12/2005 Shareholders’ equity 163,548 171,703 Shareholders’ equity attributable to the shareholders
of the parent company163,545 171,700
Capital 97,213 97,213 Share premium 4,183 4,183 Reserves 63,229 66,269 Result 5,682 11,841 Impact on fair value of estimated transaction rights
and costs resulting from the hypothetical disposal of investment properties
-6,634 -7,116
Changes in fair value of fi nancial assets and liabilities
-128 -690
Minority interests 3 3
Liabilities 121,860 122,570 Non-current liabilities 72,840 73,314 Provisions 195 195 Non-current fi nancial debts 72,267 72,816 Credit institutions 72,228 72,790 Financial lease 39 26 Other non-current liabilities 378 303 Current liabilities 49,020 49,256 Current fi nancial debts 42,261 32,719 Credit institutions 42,254 32,710 Financial lease 7 9 Trade debts and other current debts 4,026 2,691 Other current liabilities 1,113 12,025 Accrued charges and deferred income 1,620 1,821TOTAL SHAREHOLDERS’ EQUITY AND LIABILITIES 285,408 294,273

1 2
4.2.2. Consolidated income statement
30/06/2006 30/06/2005Rental income 8,951 9,153Rental related expenses -148 -76
NET RENTAL INCOME 8,803 9,077
Recovery of property expenses 78 81Recovery of charges and taxes normally payable by tenants on let properties
2,375 1,606
Charges and taxes normally payable by tenants on let properties
-2,375 -1,606
Other rental-related income and expenses -1 -5PROPERTY RESULT 8,880 9,153
Technical costs -300 -372Commercial costs -61 -73Charges and taxes on unlet properties -832 -414Property management costs -364 -384Other property charges -2 -8
PROPERTY CHARGES -1,559 -1,251
OPERATING PROPERTY RESULT 7,321 7,902General costs -726 -589Other current operating income and expenses 34 80
OPERATING RESULT BEFORE RESULT ON THE PORTFOLIO 6,629 7,393Result on disposals of investment property -1,151 -15Result on sales of other non fi nancial assets 0 3Changes in fair value of investment property and development projects
-1,407 4,425
OPERATING RESULT 4,071 11,806Financial income 34 6Interest charges -1,933 -1,705Other fi nancial charges -21 -15
FINANCIAL RESULT -1,920 -1,714
RESULT BEFORE TAXES 2,151 10,092
NET RESULT 2,151 10,092
RESULT PER SHARE 30/06/2006 30/06/2005Number of ordinary shares 5,078,525 5,078,525Basic earning per share (in €) 0.42 1.99Diluted earnings per share (in €) 0.42 1.99Distributable earnings per share (in €) 0.94 1.12

1 3
Intervest Retail - half year report

1 4
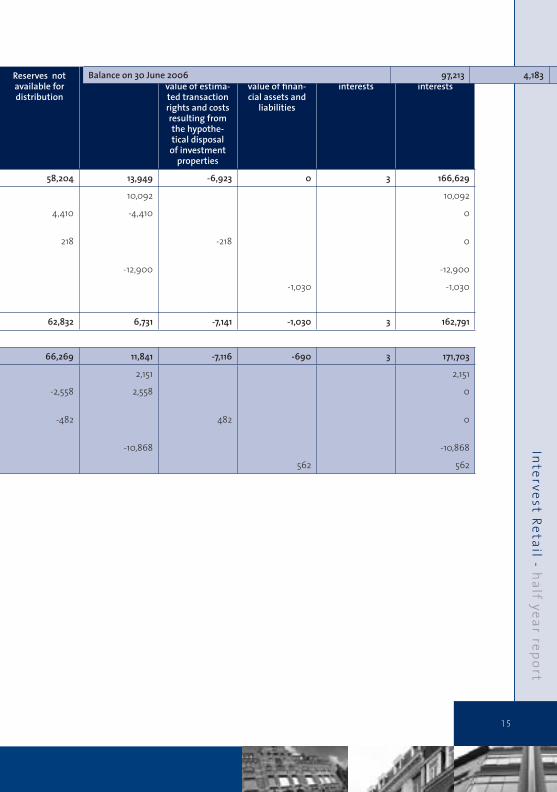
4.2.3. Statement of changes in consolidated equity
Share capital
Ordinary shares
Share-premium
Read
Balance on 31 December 2004 97,213 4,183
- Profi t of the fi rst six months of 2005
- Transfer of the result on the portfolio to the reserves not available for distribution
- Impact on fair value of estimated transaction rights and costs resulting from the hypothetical disposal of investment properties
- Dividends of the fi nancial year 2004
- Changes in fair value of fi nancial assets and liabilities
Balance on 30 June 2005 97,213 4,183
Balance on 31 December 2005 97,213 4,183
- Profi t of the fi rst six months of 2006
- Transfer of the result on the portfolio to the reserves not available for distribution
- Impact on fair value of estimated transaction rights and costs resulting from the hypothetical disposal of investment properties
- Dividends of fi nancial year 2005
- Changes in fair value of fi nancial assets and liabilities
1 5
Intervest Retail - half year report
Reserves not available for distribution
Result Impact on fair value of estima-ted transaction rights and costs resulting from the hypothe-tical disposal
of investment properties
Changes in fair value of fi nan-cial assets and
liabilities
Minority interests
Minority interests
,183 58,204 13,949 -6,923 0 3 166,629
10,092 10,092
4,410 -4,410 0
218 -218 0
-12,900 -12,900
-1,030 -1,030
,183 62,832 6,731 -7,141 -1,030 3 162,791
,183 66,269 11,841 -7,116 -690 3 171,703
2,151 2,151
-2,558 2,558 0
-482 482 0
-10,868 -10,868
562 562
Balance on 30 June 2006 97,213 4,183

1 6
4.2.4. Consolidated cash-fl ow statement 30/06/2006 30/06/2005
CASH AND CASH EQUIVALENTS AT THE BEGINNING OF THE FINANCIAL YEAR
6,566 1,665
1. Cash-fl ow from operating activities -5,817 13,621
Net profi t of the fi rst six months of the fi nancial year 2,151 10,092
Adjustments for transactions of non-current nature 3,028 -4,403
- Depreciations on intangible and other tangi-ble fi xed assets
64 11
- Loss on the sale of investment properties 1,151 15
- Profi t on the sale of other non fi nancial fi xed assets
0 -2
- Apportion of rental discounts and rent incentives
406 -2
- Changes in fair value of investment property and development projects
1,407 -4,425
Changes in working capital -10,996 7,932
* Movement of assets
- Trade receivables -763 -526
- Tax receivables and other current assets -322 -6
- Deferred charges and accrued income -133 -193
* Movement of liabilities
- Trade debts and other current debts 1,335 -354
- Other current liabilities -10,912 8,049
- Accrued charges and deferred income -201 962
30/06/2006 30/06/2005
2. Cash-fl ow from investment activities 11,953 -4,298
Acquisition of intangible and other tangible fi xed assets
-82 -29
Investments in existing investment properties -2,218 -4,570
Investments in development projects -4,627 -163
Capitalised interest expenses -239 -220
Acquisition of assets with deferred payment 13 0
Proceeds from the sale of investment properties 19,106 675
Proceeds from the sale of other non fi nancial fi xed assets
0 9
3. Cash-fl ow from fi nancing activities -1,252 -8,090
Repayments of loans -156 -147
Drawdown of loans 9,700 4,961
Repayment of fi nancial lease liabilities -3 -5
Receipts from non-current liabilities as guarantee 75 1
Dividends paid -10,868 -12,900
CASH AND CASH EQUIVALENTS AT THE END OT THE FIRST HALF YEAR
11,450 2,898

1 7
Intervest Retail - half year report

1 8
4 . 3 . N e t a s s e t s v a l u e a n d s h a r e p r i c e
30/06/06 31/12/05 30/06/05 31/12/04
Net asset value (fair value) 32.20 33.81 32.06 32.81
Net asset value (investment value) 33.51 35.21 33.46 34.17
Gross dividend 0.94 2.14 1.12 2.54
Net dividend 0.80 1.82 0.95 2.16
Share price on closing date 36.98 43.50 38.00 34.89
Over-/undervaluation on net asset value (fair value) (%)
14.8 28.7 18.5 6.3
During the fi rst six months of the year 2006 the share price fl uctuated between € 35,70 and € 45,00. On 30 June 2006 the share was quoted at € 36,98. This means a premium of 14,8% compared to the net asset value on 30 June 2006.
The free fl oat per 30 June 2006 amounted to 27,62% (27,62% ultimo 2005).
The daily average traded volume mounted to 1.119 shares during the fi rst six months of 2006.
Share price
For the interpretation of the above chart, the payment of the dividend over fi nancial year 2005 amounting to € 2,14 per share on 26 May 2006 has to be considered.
35
37
39
41
43
45
47
1/01/06 1/02/06 1/03/06 1/04/06 1/05/06 1/06/06

1 9
Intervest Retail - half year report
4 . 4 . S t a t u t o r y A u d i t o r s r e p o r t
INTERVEST RETAIL NV, BELGIAN REAL ESTATE INVESTMENT FUND
LIMITED REVIEW REPORT ON THE CONSOLIDATED HALF-YEAR FINANCIAL INFOR-MATION FOR THE SIX MONTHS PERIOD ENDED 30 JUNE 2006
(Free translation from the original in Dutch)
To the Board of Directors
We have performed a limited review of the accompanying consolidated balance sheet, in-come statement, cash fl ow statement, statement of changes in equity and notes (jointly the “interim fi nancial information”) of INTERVEST RETAIL NV, BELGIAN REAL ESTATE INVEST-MENT FUND (“the company”) and its subsidiaries ( jointly “the group”) for the six months period ended 30 June 2006. The Board of Directors of the company is responsible for the preparation and fair presentation of this interim fi nancial information. Our responsibility is to express a conclusion on this interim fi nancial information based on our review.
The interim fi nancial information has been prepared in accordance with IAS 34, “Interim Financial Reporting”.
Our limited review of the interim fi nancial information was conducted in accordance with the recommended auditing standards on limited reviews applicable in Belgium, as issued by the ”Institut des Reviseurs d’Entreprises/Instituut der Bedrijfsrevisoren”. A limited review consists of making inquiries of group management and applying analy-tical and other review procedures to the interim fi nancial information and underlying fi nancial data. A limited review is substantially less in scope than an audit performed in accordance with the auditing standards on consolidated annual accounts as issued by the ”Institut des Reviseurs d’Entreprises/Instituut der Bedrijfsrevisoren”. Accordingly, we do not express an audit opinion.
Based on our limited review nothing has come to our attention that causes us to believe that the interim fi nancial information for the six months period ended 30 June 2006 is not prepared, in all material respects, in accordance with legal and regulatory require-ments and IAS 34 Interim Financial Reporting.
9 August 2006
The Statutory AuditorDELOITTE Company AuditorsSC s.f.d. SCRLRepresented by Rik Neckebroeck

2 0
5. PROPERTY PORTFOLIO 5 . 1 . V a l u a t i o n s p e r 3 0 J u n e 2 0 0 6
Factory Shopping Messancy is valued by de Crombrugghe & Partners. All other retail premises are valued by Cushman & Wakefi eld.
In its report of 30 June 2006, Cushman & Wakefi eld states that the investment va-lue of the retail portfolio (excluding Factory Shopping Messancy) is € 236.390.420. In its report of 30 June 2006, de Combrugghe & Partners states that the invest-ment value of Factory Shopping Messancy is € 35.607.393.
These investment values are in accordance with the price that an investor would be prepared to pay for each of the real properties in the portfolio in order to become its owner, enjoy rental income and bear the associated costs.
The Julianus project was valued as of 30 June 2006 at its current cost (€ 4.320.000).
5 . 2 . O v e r v i e w r e t a i l m a r k e t
The letting market
The general tone of the retail sector is one of muted optimism. Consumer confi -dence has increased greatly in the last year but remains fragile.
The letting market for town centre shops and shopping centres is developing fa-vourably with increased prices resulting from demand by both existing retailers and newcomers to the market. Prices in the market for out-of-town stores have stabilised at a favourable level in the last six months.
The investment market
Just as in previous years, demand for good retail investments greatly exceeds sup-ply.
Not only are there many foreign investors (such as the Irish), but more institutional investors who normally invest in other segments (such as offi ces) are being attrac-ted by the retail market.
This is causing a permanent downward pressure on yields. Yields on prime positi-ons in main shopping streets are hovering around 4,25 %, or up to 5 % for absolute
2 1
Intervest Retail - half year reportprime locations. Yields of 7% are being paid for individual out-of-town stores. It is expected that the yield from newly built retail parks will be even lower.
It is very questionable whether the recent interest rises will result in a more conser-vative attitude among investors.
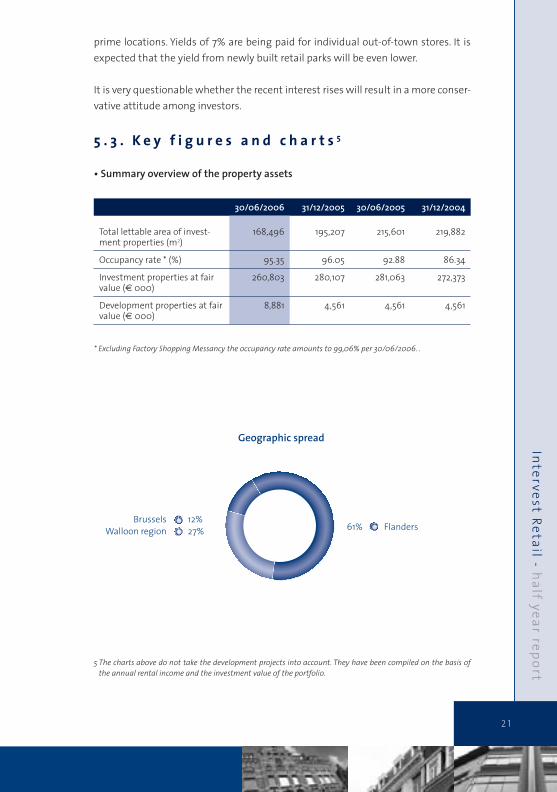
5 . 3 . K e y f i g u r e s a n d c h a r t s 5
• Summary overview of the property assets
30/06/2006 31/12/2005 30/06/2005 31/12/2004
Total lettable area of invest-ment properties (m2)
168,496 195,207 215,601 219,882
Occupancy rate * (%) 95.35 96.05 92.88 86.34
Investment properties at fair value (€ 000)
260,803 280,107 281,063 272,373
Development properties at fair value (€ 000)
8,881 4,561 4,561 4,561
* Excluding Factory Shopping Messancy the occupancy rate amounts to 99,06% per 30/06/2006. .
5 The charts above do not take the development projects into account. They have been compiled on the basis of the annual rental income and the investment value of the portfolio.
61% Flanders Brussels 12% Walloon region 27%
Geographic spread
2 2
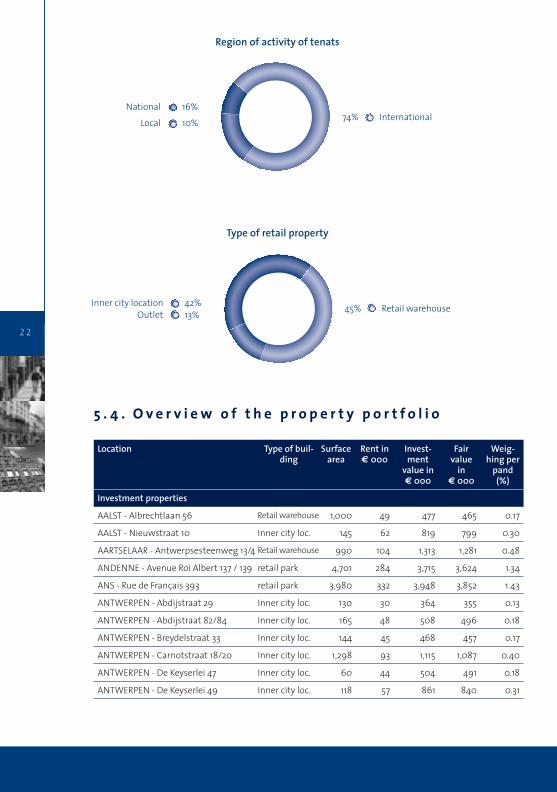
National 16%74% International
45% Retail warehouse Inner city location 42% Outlet 13%
Region of activity of tenats
Type of retail property
Local 10%
5 . 4 . O v e r v i e w o f t h e p r o p e r t y p o r t f o l i o
Location Type of buil-ding
Surface area
Rent in € 000
Invest-ment
value in € 000
Fair value
in € 000
Weig-hing per
pand (%)
Investment properties
AALST - Albrechtlaan 56 Retail warehouse 1,000 49 477 465 0.17
AALST - Nieuwstraat 10 Inner city loc. 145 62 819 799 0.30
AARTSELAAR - Antwerpsesteenweg 13/4 Retail warehouse 990 104 1,313 1,281 0.48
ANDENNE - Avenue Roi Albert 137 / 139 retail park 4,701 284 3,715 3,624 1.34
ANS - Rue de Français 393 retail park 3,980 332 3,948 3,852 1.43
ANTWERPEN - Abdijstraat 29 Inner city loc. 130 30 364 355 0.13
ANTWERPEN - Abdijstraat 82/84 Inner city loc. 165 48 508 496 0.18
ANTWERPEN - Breydelstraat 33 Inner city loc. 144 45 468 457 0.17
ANTWERPEN - Carnotstraat 18/20 Inner city loc. 1,298 93 1,115 1,087 0.40
ANTWERPEN - De Keyserlei 47 Inner city loc. 60 44 504 491 0.18
ANTWERPEN - De Keyserlei 49 Inner city loc. 118 57 861 840 0.31

2 3
Intervest Retail - half year report
Location Type of buil-ding
Surface area
Rent in € 000
Invest-ment
value in € 000
Fair value
in € 000
Weig-hing per
pand (%)
ANTWERPEN - Frankrijklei 27 Inner city loc. 624 52 724 706 0.26
ANTWERPEN - Groendalstraat 11 Inner city loc. 39 23 344 336 0.12
ANTWERPEN - Huidevettersstraat 12 Inner city loc. 791 266 4,535 4,425 1.64
ANTWERPEN - Korte Gasthuisstraat 27 Inner city loc. 155 66 1,042 1,016 0.38
ANTWERPEN - Leysstraat 17 Inner city loc. 334 162 2,604 2,540 0.94
ANTWERPEN - Leysstraat 28/32 Inner city loc. 1,870 749 12,570 12,263 4.55
ANTWERPEN - Meir 99 Inner city loc. 384 415 7,283 7,105 2.64
ANTWERPEN - Schuttershofstraat 30 Inner city loc. 66 50 916 894 0.33
ANTWERPEN - Schuttershofstraat 32/Arme Duivelstraat 2
Inner city loc. 54 51 863 842 0.31
ANTWERPEN - Schutterhofstraat 24/Kelderstraat 7
Inner city loc. 320 64 1,196 1,167 0.43
BALEN - Molsesteenweg 56 retail park 1,871 121 1,352 1,319 0.49
BASTOGNE - Route de Marche 104 retail park 593 33 277 270 0.10
BEAUMONT - Rue G. Michiels 40 Retail warehouse 1,113 99 961 937 0.35
BOECHOUT - Hovensesteenweg 123-127 Retail warehouse 1,022 67 760 742 0.28
BORGLOON - Sittardstraat 10 retail park 996 55 555 542 0.20
BREE - Toleikstraat 30 Retail warehouse 855 53 638 622 0.23
BRUGGE - Steenstraat 80 Inner city loc. 2,670 800 13,383 13,057 4.84
BRUXELLES - Avenue Louise 7 Inner city loc. 248 218 4,350 4,244 1.57
BRUXELLES/SCHAARBEEK - Chaussée de Louvain 610/640
retail park 2,964 304 4,615 4,503 1.67
BRUXELLES - Chée d’Ixelles 16 Inner city loc. 1,255 231 3,072 2,997 1.11
BRUXELLES - Chée d’Ixelles 41/43 Inner city loc. 5,248 1,256 17,149 16,731 6.21
BRUXELLES - Rue Neuve 98 Inner city loc. 162 151 2,641 2,576 0.96
CHARLEROI - Rue de la Montagne 5/7 Inner city loc. 948 192 2,248 2,193 0.81
CHÊNÉE - Rue de la Station 23 retail park 2,881 224 2,481 2,421 0.90
DIEST - Hasseltstraat 15 Inner city loc. 200 35 430 420 0.16
DILSEN - STOKKEM - Rijksweg 17 Retail warehouse 992 72 717 700 0.26
FLÉMALLE - Rue de la Fabrique 6 retail park 2,835 206 2,288 2,232 0.83
FROYENNES - Rue des Roselieres 6 Retail warehouse 950 76 1,049 1,023 0.38
GENK - G. Lambertlaan 115 retail park 3,109 202 2,299 2,243 0.83
GENK - Hasseltweg 74 retail park 2,099 182 2,439 2,380 0.88
GENT - Veldstraat 81/Zonnestraat 6/10 Inner city loc. 3,510 419 6,279 6,125 2.27
GENT - Volderstraat 15 Inner city loc. 279 87 1,146 1,118 0.41
GRIVEGNÉE - Rue Servais Malaise Retail warehouse 2,000 118 1,274 1,242 0.46

2 4
Location Type of buil-ding
Surface area
Rent in € 000
Invest-ment
value in € 000
Fair value
in € 000
Weig-hing per
pand (%)
HASSELT - Genkersteenweg 76 Retail warehouse 1,241 98 1,320 1,288 0.48
HASSELT - Genkersteenweg 282 Retail warehouse 2,020 103 1,185 1,157 0.43
HEUSDEN-ZOLDER - Inakker Retail warehouse 1,019 65 714 696 0.26
HOBOKEN - Zeelandstraat 6-8 Retail warehouse 2,490 187 2,080 2,029 0.75
KAMPENHOUT - Mechelsesteenweg 38/42
retail park 3,002 189 2,329 2,272 0.84
LA LOUVIÈRE - Rue Albert I 84/86 Inner city loc. 190 56 592 578 0.21
LEOPOLDSBURG - Lidostraat 7 retail park 1,670 106 1,145 1,117 0.41
LEUVEN - Bondgenotenlaan 69-73 Inner city loc. 1,589 549 9,243 9,018 3.35
LIÈGE - Pont d’Ile 35 Inner city loc. 80 58 877 855 0.32
LIÈGE - Pont d’Ile 45 Inner city loc. 60 63 991 967 0.36
LIÈGE - Pont d’Ile 49 Inner city loc. 380 91 1,729 1,687 0.63
MALMÉDY - Avenue des Alliés 14B retail park 813 53 605 590 0.22
MECHELEN - Bruul 39-41 Inner city loc. 378 186 2,810 2,742 1.02
MECHELEN - Bruul 42-44 Inner city loc. 1,410 410 6,297 6,144 2.28
MECHELEN - Yzerenleen 30 Inner city loc. 350 50 572 558 0.21
MERKSEM - Bredabaan 474/476 Inner city loc. 470 66 874 853 0.32
MESSANCY - Route d’Arlon 199 outlet 18,459 2,564 35,607 34,739 12.89
MESSANCY - Rue de l’Institut 44 retail park 1,998 105 1,022 997 0.37
MONS - Chaussée de Binche 101 Retail warehouse 1,000 80 935 912 0.34
MONS - Grand Rue 19 Inner city loc. 170 73 910 888 0.33
MONS - Rue de La Chaussée 31/33 Inner city loc. 380 134 1,840 1,795 0.67
MORTSEL - Statielei 71/73 Inner city loc. 425 125 1,300 1,268 0.47
MOUSCRON - Petite Rue 18 Inner city loc. 235 39 464 453 0.17
OLEN - Lammerdries 6 retail park 13,452 732 6,505 6,346 2.35
OVERPELT - Burgemeester Misotten-straat 3
Retail warehouse 877 79 876 854 0.32
PHILIPPEVILLE - Rue de France retail park 3,705 297 3,919 3,823 1.42
SCHELLE - Provinciale Steenweg 453/455retail park 2,962 192 2,264 2,209 0.82
SCHERPENHEUVEL - Manneberg 26 Retail warehouse 600 71 583 569 0.21
SINT-JOB-IN-’T-GOOR - Handelslei 10 Retail warehouse 600 63 669 653 0.24
TIELT-WINGE - Aarschotsesteenweg 1/6 retail park 18,866 1,467 17,787 17,353 6.44
TIENEN - Slachthuisstraat 36 retail park 4,871 401 5,118 4,994 1.85
TURNHOUT - Gasthuisstraat 5-7 Inner city loc. 1,047 253 3,928 3,832 1.42
TURNHOUT - Gasthuisstraat 32 Inner city loc. 1,743 260 4,032 3,934 1.46
VILVOORDE - Leuvensestraat 39/41 - Nowélaan 41
Inner city loc. 485 55 688 671 0.25

2 5
Intervest Retail - half year report
Location Type of buil-ding
Surface area
Rent in € 000
Invest-ment
value in € 000
Fair value
in € 000
Weig-hing per
pand (%)
VILVOORDE - Luchthavenlaan 5 Retail warehouse 6,345 467 5,856 5,713 2.12
VILVOORDE - Mechelsesteenweg 30 retail park 7,656 639 8,696 8,484 3.15
VILVOORDE - Mechelsesteenweg 30 Offi ces 784 39 333 325 0.12
WATERLOO - Chée de Bruxelles 284 retail park 1,198 110 1,375 1,341 0.50
WAVRE - Rue du Commerce 26 Inner city loc. 272 52 605 591 0.22
WAVRE - Rue Pont du Christ 46 - Rue Barbier 15
Inner city loc. 315 109 1,355 1,322 0.49
WILRIJK - Boomsesteenweg 643-645 Retail warehouse 1,837 140 1,687 1,646 0.61
WILRIJK - Boomsesteenweg 666-672 retail park 4,884 467 7,034 6,862 2.55
TOTAL INVESTMENT PROPERTIES 168,496 19,590 267,323 260,803 96.74
Development projects
OLEN - Lammerdries 6 Retail warehouse 14,030 471 4,091 3,991 1.48
OLEN - Lammerdries 6 Land 32,389 0 0 0 0.00
OLEN - Lammerdries 6 Villa’s 0 0 584 570 0.21
TONGEREN Land and phase I 12,728 6 0 4,320 4,320 1.56
TOTAL DEVELOPMENT PROJECTS 59,147 471 8,995 8,881 3.26
Total investment properties and deve-lopment projects
227,643 20,061 276,318 269,684 100.00
6 Purchased as joint property.

INTERVEST RETAIL
Uitbreidingstraat 18
B-2600 Berchem-Antwerpen
t +32 (0)3 287 67 81 - F +32 (0)3 287 67 89
www.intervest.be