half year report for 2012 - arla.ph · consolidated balance sheet 32 consolidated cash flow...
TRANSCRIPT

1
Half year rePOrT fOr 2012 MaNaGeMeNT rePOrT
Half year rePOrT fOr 2012

2
arla fOODS
MANAGEMENT REPORT Group
european strength and global visions 5
Highlights of the first half of 2012 7
Drive and efficiency improvements 11
ONe arla 14
Closer to Nature™ 16
Business groups
Global Categories & Operations 19
Consumer International 21
Consumer UK 22
Consumer Sweden 23
Consumer Denmark 24
Consumer Germany & the Netherlands 26
Arla Foods Ingredients 27
hAlf yEAR fiNANciAl sTATEMENTs
Primary statements
Consolidated income statement 30
Consolidated statement of comprehensive income 31
Consolidated balance sheet 32
Consolidated cash flow statement 34
Consolidated statement of changes in equity 35
Notes
Note 1. Accounting policies 36
Note 2. Operating profit 43
Note 3. Net working capital 45
Note 4. Financial items and debt 45
Note 5. Other areas 48
The Interim Report has not been audited or reviewed by the Group’s auditors
content

3
Half year rePOrT fOr 2012 MaNaGeMeNT rePOrT
“As a European company with a global strategy, Arla needs to have the strength to negotiate with customers which are becoming larger and more global. The merger agreements in the first half of 2012 will ensure a significant volume of milk and a wide range of products are available.”

4
arla fOODS
1 23
4 5
strengthen Arla earningsOur ambition is to deliver a competitive milk price
The Group’s seven main objectives in 2012
strong cost positionDeliver DKK 500 million in sustainable cost savings
Mergers and acquisitionsMake significant mergers/acquisitions in the UK, Germany and in the growth markets
Germany as a core marketAchieve a top five position in 2012
Brand growthContinue growth of our three global brands, Arla®, Lurpak® and Castello®
76 iTHave stable IT operations
closer to Nature™Deliver significant activities within Closer to Nature™ in our core markets

5
Half year rePOrT fOr 2012 MaNaGeMeNT rePOrT
Arla has the vision of becoming the leading dairy company in Europe. We want to achieve the highest possible milk price for our owners by creating added value and showing active market leadership. In order to achieve our vision and maintain Arla as a robust develop-ing company, it is absolutely essential that we gain access to more and more of the raw materials needed for milk production and a larger market for our sales. In the first half of 2012 we strengthened Arla’s position in the European and global dairy industries when an overwhelming majority of shareholders in Denmark, Sweden, Germany and the UK in June voted to join forces to ensure a strong dairy business and new opportunities for growth. If the authorities approve these mergers, approximately 12 billion kilograms of milk will flow through Arla each year.
In June 2012, Arla was chosen as a strategic partner of COFCO, which is the majority shareholder in China’s largest dairy. This is helping us gain access to one of the world’s fastest growing dairy markets. The agreement is recognition of our global strategy and network, but it is also an indication that we, as a company, are a leader when it comes to quality and food safety. China’s growing middle class is demanding quality products with a focus on safety. We can deliver this with our new export agreement. And on the basis of the Arlagården quality programme, we can simultaneously educate Chinese farmers about the quality of products and how they can be part of proving food for 1.3 billion Chinese people.
Market leadership and an increasingly significant position in the dairy industry also comes with responsibilities. We have to be
clear about who we are and what we want. About building trust and acting decisively, so that we are attractive to our future co-owners, strategic partners, employees, customers, consumers and business partners. About continuing to strengthen our innovation, so that we can focus on the developing activities in our core and emerging markets. About setting new standards for quality and processes from cow to consumer.
focus on businessIt has been a busy year which has seen an abundance of new initiatives to create growth and increase profits. We are making good progress with the seven essential goals we have set ourselves for 2012 despite the fact that the markets are under pressure. Now, we need to work on executing the strategies and realising the synergies following the acquisi-tions and mergers in 2011 and 2012.
In order to deliver a good result for Arla’s owners, and make progress in accordance with our strategic ambition for 2015, 7 essential objectives have been established in cooperation with the Board of Directors. These objectives set the direction (we follow). We expect to achieve our annual profit but the milk price is not what we would like it to be. The markets have been more unfavorable than anticipated. This is mainly because of an unexpected increase in milk production world wide that is pushing prices down, but also because of the general caution among European consumers as a result of the economic situation.
Although we have adequate safeguards in place, we have had to lower the price of milk several times. Most recently, we lowered the
price by approximately DKK 0.07 on 1 July and by DKK 0.04 on 6 August. We are working against a background of major factors, such as the increase in the global supply of milk and world prices, but however we have some handles to turn. Arla is in a more robust position than many of our competitors. This is due to our wide range of products aimed at both the retail and industrial sectors, current efficiency programmes and our brands which are holding firm in volatile markets, against private labels and discounted products. There is no doubt however that we must constantly monitor our costs if we are to protect our brands in these tough market conditions. We are doing so with the Tetris efficiency programme that is currently enabling our organisation to more control costs. Through a series of operational excellence programmes, we will be reviewing all of our departments and products in the coming years in order to permanently minimise costs and simplify workflows. This is a stimulating process and one that is forcing us to rethink and act quickly. The objective is to streamline Arla, so that we are prepared for a tough, competitive future.
Prepared for growthArla is prepared for growth. We need to have the strenght to negotiate with customers, which are becoming larger and more global, and today’s increasing demands for value products, a wider product range, new product development power and reliable delivery of large quantities. Our proposed merger with Milk Link in the UK will put us in a leading position in the UK market. The merger and resulting synergies, we will create a complete business in terms of both fresh dairy products and cheese.
European strength and global visions
The future of the dairy industry is currently
being mapped out. Arla is playing a leading
role in the industry’s present consolidation.
Peder Tuborgh, CEO

6
arla fOODS
We are on a similar journey in Germany. Our merger with MilchUnion Hocheifel (MUH) makes us the third-largest market player in this country and continues the business strategy we set in motion with the merger with Hansa-Milch in 2011. MUH’s product range fits in with that of Hansa-Milch and we will be able to reap more synergies by approaching the German business holistically. This is a logical development towards greater authority and supply.
These proposed two mergers will fundamen-tally strengthen Arla. We are becoming a strong European dairy company, operating in a global market. If our mergers are approved by the competition authorities, they will increase our sales by about DKK 11 billion on an annual basis. In 2012, these mergers are expected to contribute approximately DKK 2 billion to sales. This would bring us closer to the target of DKK 75 billion sales in 2015.
Milk production in Europe is in growth, making it necessary for Arla and other European dairy companies to sell more milk outside Europe. We must therefore seize any opportunities available to us. We took the opportunity of a strategic partnership in China. This billion kroner investment in China’s largest dairy Mengniu will multiply exports of European Arla milk to China in the long term. Our target in the future is to export 600-800 million kilograms of milk to China each year, primarily in the form of value-added products.
We see this agreement as a solution to the imbalance between supply and demand in Europe. It is expected to contribute positively to our members’ milk price because we now
have the opportunity to access and process significantly greater quantities of milk, which was previously sold on the global industrial market where earnings are historically much lower.
Our new strategic partner COFCO sees Arla as a dynamic and visionary company and one that is moving with the times and with technology. A company that has an eye for consumers, that focuses on innovation and works according to an ambitious environmen-tal strategy.
QualityThe agreement with China provides Arla with stability in a turbulent world market. In return, we can help China’s farmers improve milk quality. The Chinese want to draw on our knowledge and experience in order to ensure the best milk quality, traceability and controlled milk production on farm. That is a huge pat on the back to the thousands of Arla dairy farmers who are following the Ar-lagården quality programme on a daily basis.
The story of Arlagården shows that there is an untapped potential in our mission to offer modern consumers natural milk-based food products and in our pledge to bring consum-ers closer to nature. This is a pledge that commits us to continuous improvement. We have therefore adopted an ambitious environmental strategy, among other things, and set about involving farmers in making their milk production more sustainable in order to boost environmental and climate-based efforts throughout our value chain. In brief, our philosophy Closer to Nature™ is not just a slogan. It is a belief that creates value
– throughout the entire supply chain. Our experiences from China clearly demonstrate this.
The cooperative model standing strongIn 2010, the owners decided that Arla should continue to be a cooperative. Mergers in recent years with cooperatives in Germany and Sweden and the planned mergers in Germany and the UK are direct results of that decision. As a cooperative, when there is no external capital to be added, the owners must themselves invest in order to develop the company. As a result, having more hands to perform that task is now an advantage.
A cooperative is a strong and future-oriented business model. It makes it possible for individual owners to run their farms independently while maintaining an influence on the company, which creates added value for the milk produced. Our common objective to achieve a size that ensures the best possible milk price. Farmers have endorsed this objective with their overwhelming ment to the mergers. It is important for individual owners to ensure good earnings right here and now. We work with that in mind every day. In addition, we are working to develop a joint company in order to promote the industry’s future earnings potential.
Outlook for 2012The half year has been influenced by challenging global marked conditions. We expect the conditions to improve at the end of the year, so that earnings again can increase.
Strategic ambitions for 2015
Highest possible milk price
Becoming the best dairy company for more than 250 million consumers in Northern Europe and the UK
Three global brands: Arla®, Castello® and Lurpak®
Doubling of sales of processed protein products and global leadership for whey protein
Net sales of DKK 75 billion

7
Half year rePOrT fOr 2012 MaNaGeMeNT rePOrT
china
On 15 June 2011 arla signed an agreement to increase its exports to China.
This agreement means that• Arla will enter into an agree-
ment with China Mengniu Dairy Company Limited in order to expose the Arla® brand to more Chinese consumers.
• Arla is becoming an indirect owner of Mengniu along with the state-owned COFCO, China’s largest food group.
• Arla will enter into an agree-ment to establish a centre for technology and quality that will strengthen the Chinese dairy industry based on the Ar-lagården quality programme.
This is an investment of some DKK 1.75 billion. In 2011, Arla’s total sales in the Chinese market were about DKK 700 million. Together, the new agreements are expected to increase Arla’s revenue in China fivefold by 2016.
Germany
On 22 May, Arla announced a plan to merge with one of Germany’s 10 largest dairies, the Milch-Union Hocheifel (MUH) cooperative, which has owners in Germany, Belgium and Luxem-bourg.
MUH’s territorial position improves cohesion with Hansa-Milch in the north and Arla Foods Käsereien, previously Allgäuland Käsereien, in the south, and a fully integrated German organisation will be created. This merger is a natural extension of the business strategy that was introduced with the merger with Hansa-Milch in 2011. The merger with MUH will optimise Arla’s capacity and purchasing strength in Germany. MUH’s product range comple-ments that of Hansa Milch and the dairy’s production facilities will strengthen Arla’s other activities in Germany. 98.5 per cent of Arla’s Board of Directors voted in favour of the merger on 26 June. The merger is awaiting approval by the competition authorities.
UK
On 22 May, Arla announced a plan to merge with UK’s fourth largest dairy, the cooperative Milk Link. Today, the UK is Arla’s largest market generating a revenue of almost DKK 13 billion in 2011. After the merger with Milk Link, Arla will become the UK’s largest dairy company and with a complete dairy portfolio including fresh milk, cheese and UHT. Arla’s sales will increase by more than DKK 5 billion.
Milk Link will ensure access to raw milk for Arla in the UK and add cheese as an attractive customer offering, as it is the UK’s largest cheese producer and exports cheese to more than 19 countries. 96.8 per cent of Arla’s Board of Directors voted in favour of the merger on 26 June. The merger is awaiting approval by the competition authorities.
Efficiency programme
arla is preparing for intense competition in the future as is analysing business trends in all countries and across all product categories. Our plan is called Tetris and it will ensure sustain-able savings of DKK 500 million by reducing complexity, collecting knowledge and skills and exploiting synergies of scale. The goal is to increase profits without increasing costs, by increasing the organisation’s agility and drive. The following initiatives are being carried out:• 140 salaried positions has been
made redundant in 2012• 50 positions has moved from
the Corporate Centre and business areas to the Global Business Service
• New, effective and streamlined working methods will be developed for operational excellence
• The market analysis budget will be reduced
• Packaging and other material costs will be reduced
Highlights of the first half of 2012
In 2012, Arla’s size and structure will change fundamentally. Before the year is out, we expect Arla to be owned by 12,000 European shareholders in six countries who have pledged to make Arla a company with global ambitions. We will be number 3 in Germany, number 1 in the UK and we will get a strong foothold in one of the world’s fastest growing dairy markets, China.

8
arla fOODS

9
Half year rePOrT fOr 2012 MaNaGeMeNT rePOrT

10
revenue
DKK 29.9 billionPerformance price per kg of cooperative owner milk
DKK 2.64Profit
DKK 513 million Growth in sales
12.2 per cent
arla fOODS

11
Half year rePOrT fOr 2012 MaNaGeMeNT rePOrT
What drives Arla as a company is to ensure the highest possible milk price for our owners. It is possible, through goodwill on the part of the milk producers, to invest both in their own farm and the joint company, which will help to ensure earning potential now and in the future. Our job is to manage their values in a world of increasing competition and rapidly changing markets conditions. This places great demands on the company’s management.
half-year resultsThe half year result is at the expected level. We have begun work to reduce costs early and we have reached important milestones in our 2015 strategy.
RevenueWe are seeing positive volume growth across all business areas, which is contributing to the positive sales increases Arla has delivered. In the first six months we realised sales of DKK 29.9 billion – an increase of 12.2 per cent, driven primarily by mergers and acquisitions.
The first half of 2012 has shown healthy organic sales growth of 2.8 per cent despite tough market conditions. This growth is a prerequisite for us to be able to increase the sale of our members’ milk through value-added channels. Increased demand for added value products provides good opportunities for selling this increasing volume of milk. Arla has, in recent years succeeded in reducing the share of member milk sold on the commodity markets despite of a considerable increase in volume.
We are seeing strong underlying volume growth in Arla’s sales to retailers which is is helping to drive the business forward both in our core markets in Europe and globally. Emerging markets, particularly Russia and the Middle East, are major contributors of the positive growth. Overall, sales in our growth markets have increased by 24 per cent, of which organic growth accounts for 19 per cent. We are also seeing a clear positive trend in profitability in the emerging markets. Our global brands are showing growth of around 8 per cent, despite the trend towards private label products. On top of that lies significant growth through the mergers and acquisitions implemented in 2011.
Net profitWithin Arla, the key financial goal is the price of milk for our shareholders and it is under pressure. Since January the price of milk regularly paid to our owners has decreased from 2.56 to 2.33 DKK per kilogram of milk, effective from August 2012. The performance price, which contain term consolidation and expected supplementary payments, have been 2.64 DKK for the first half of 2012. During the first half of 2012, we have paid a larger share of earnings to our owners, which means that the net profit for the period is 1.7 per cent of revenue, against our goal of 3 per cent. We made this decision fully aware of the realities and the profit target for the full 2012 remains unchanged. The net profit for the first half of 2012, DKK 513 million, which is below the level for the first half of 2011.
Global overproduction of milk, which has been unexpectedly high, coupled with European consumers’ sensitivity to high prices, has led
to a price war and increased demand for private label products. We are currently witnessing a series of difficult circumstances that, for better or worse, are part of the dynamics of the global milk market. This is a serious situation for our farmers who are finding it difficult to cover their costs with the current milk price, especially when feed prices rise sharply. It is therefore our job to ensure that we remain a robust business at all times and one that has control over costs and are able to adapt rapidly. We are delivering in both domains and are therefore doing well against these requirements compared to our competitors. In the first half of 2012, we have maintained the focus on the efficiency programs aimed at creating lasting reductions in our costs. However, the majority of these will only be realised in 2013.
Working capitalWorking capital has been high on the agenda in 2011 and 2012 and the focus will intensify in the autumn. Over the past 18 months we have worked systematically to reduce the company’s working capital, the goal being to free up capital. In 2011, we implemented a payment policy to increase finance from trade payables. The effect of this is estimated at DKK 1 billion for 2011. In the first half of 2012 we have also worked to optimise processes around payment terms for our customers in order to reduce the money tied up in trade receivables. The company’s growth and exchange rate developments have tied up more assets in working capital, while growing stocks have been driven by the general surplus of milk. Therefore, our efforts have not reduced net working capital, as is clear from the half year report.
Tough market conditions have given
Arla major challenges in the first half of 2012
and put milk prices under pressure.
We are focusing on continuous improvement
and challenging existing structures.
Frederik Lotz, CFO
Drive and efficiency improvements

12
arla fOODS
DebtArla must maintain a good credit standing, especially when the general economic climate is difficult. Therefore, it is a key priority to ensure good management of debt and capital across the enterprise. Arla’s latest investment in China means that Arla’s debt as of 30 June has grown by DKK 1.75 billion. This is affecting key ratios, leverage and solvency. Leverage has grown to 4.5 and solvency is at 24 per cent. During the first half of 2012, pension debt has increased by some DKK 422 million, mainly because of falling interest rates. With this year’s debt we have reached a level where we will need to implement synergies and ensure a strong cash flow in order to reduce debt.
ConsolidationImplementing mergers means more owners to carry the investment. Despite historically high indebtedness the Committee of Shareholders has chosen to reduce the consolidation ratio from 6 to 4.5 with effect from 2012 provided that the mergers with Milk Link and MUH are approved by the competition authorities.
Outlook for the full yearThe expected revenue for 2012 is DKK 60 billion without mergers. Including mergers, it is expected to be in the region of DKK 62 billion. By comparison, the revenue for 2011 was DKK 55 billion and for 2010 DKK 49 billion. This puts Arla well on track to deliver a revenue of DKK 75 billion in 2015, which is the aim of our strategy. The result of the year is expected to be the set 3 per cent equivalent to around 1.7 to 1.8 billion DKK. For the full year we can see that it will be difficult to reach the same level of performance price as in 2011. Our current expectation in a turbulent market is to reacha performance price, that
increases in accordance to the realised earning for the half year. However, that will unfortunately still be below the earning in 2011.
Although we continue to maintain focus on our core European markets, in the future Arla will increase its activities outside Europe and look to expand into countries where there is growth. By that we do not mean just China, the Middle East and Russia, where we have already established a strong presence. We expect a significant increase in demand from the world’s emerging markets which will absorb the increasing quantities of milk.
stretching targetsArla’s growth agenda is driven by mergers and acquisitions. This is a challenge to the traditional budget that is static and prevents propensity to invest. At Arla, we have therefore replaced the traditional budget with what we call stretched targets. What lies behind this term is the idea of a criteria for success that is fundamentally about perform-ing significantly better than last year. This is because, in a world characterised by rapid change, budgets become outdated the moment they are set and relative targets are far more resilient to changes. Working on ambitious stretched targets creates energy and promotes structural changes in the company. When we set the bar high, we challenge leaders to rethink the ways in which we act as a company and we challenge existing structures. This ability is crucial in a world that is constantly changing.
Transition to IFRS
Cash flow, credit standing, financial leverage and working capital are important terms when we talk about Arla’s opportunities for international growth. From 2012, we have therefore started presenting financial statements according to international IFRS standards. We want to be able to compare our results more directly with those of other similar companies and to be even more transparent than we have been in the past. IFRS standards enhance our financial statements and empower us in terms of growth and acquisitions.

13
Half year rePOrT fOr 2012 MaNaGeMeNT rePOrT

14
arla fOODS
ONE Arla
Every decision, job and action at Arla must be linked to our common goal. In this way we create one single direction across the company and Arla becomes one global company, where we all contribute to our common success. This is described in ONE, which contains our common mission, character, vision, strategy and resources. We use ONE to actively integrate new companies and new employees. In order to obtain synergies from mergers and acquisitions, it is important that Arla’s goals and values become a part of everyday life and management of the new company as soon as possible. We strive to ensure that we present ourselves as one company to our customers, consumers and the outside world, wherever in the world they might come in contact with us. However, values should always be interpreted in context, so there is room for professional, cultural and market differences. But when we all act on the basis of Lead, Sense & Create, which are the key words in our character, we create the best opportunities to operate in a global world and achieve the objectives we have set ourselves.

15
Half year rePOrT fOr 2012 MaNaGeMeNT rePOrT
leaDWe strive to take leadership and implement opportunities. We will take the lead in everything we do and be the best in our field. We demonstrate energy, drive and courage. We want to develop the best methods and tools and we are proud to produce the best milk products. We are dedicated, at the cutting edge technologically, well trained and professional. We are passionate about what we do and see the greatest possible potential in our employees, business and partners.
SeNSeWe have a sense of the world around us. We are in touch with employees, consumers and the markets we operate in. We want to create a sense of belonging and meaning to people inside and outside the company. Through respect and dialogue we want to understand and learn from the outside world. We respect and value diversity and are open-minded and responsible. We have a global mindset, but remain local in attitude and action. We approach the world with genuine curiosity and can look at things from many sides.
CreaTeWe have an innovative culture. We are innovative in developing skills, products and market relations. We develop both businesses and employees that can provide excellent and sound products. We have a learning culture and a creative side that keeps us open to new inspiration. We create and build relationships based on trust and respect, both inside and outside the company. We create opportunities for creative work in visionary and educational environments.

16
closer to Nature™
It is Arla’s mission is to provide modern consumers with natural milk-based products that create inspiration, confidence and well-being. Our consumers expect us to be responsible towards nature throughout the value chain. As a cooperative with close links between business and dairy farmers, we have a unique opportunity to make a difference in this area.
arla fOODS

17
closer to Nature™
Closer to Nature™ is a business philosophy that commits Arla to improvements in three areas: 1) Arla’s milk farmers should remain at the
forefront when it comes to sustainable milk production
2) Arla’s dairy farmers must be motivated to work more sustainably on their farms
3) Arla’s production and transportation should have the least possible effect on the environment and climate and we are investigating sustainable packaging solutions.
Our many Close to Nature™ activities are collected in a database where more than 600 activities now clearly show that Arla acts on its words.
In 2011, we adopted an ambitious environ-mental strategy and we are starting to involve our owners in how they can work continu-ously to achieve even more sustainable milk production. These efforts are rooted in Arla’s Environmental Strategy 2020, one of the main long-term goals of which is to ensure that the milk used in our products is produced sustainably.
In the first half of 2012, we have carried out a number of Close to Nature™ activities in our core markets. In Sweden and Denmark, more than 200,000 consumers visited Arla’s farm to watch the cows come out to pasture.
In Finland, sales of organic products and awareness of Arla has increased through the introduction of a new organic product line. In the Netherlands, we have introduced an innovative drinking yogurt which is sweetened with stevia, a natural sweetener, and in the UK and Germany, a number of Arla’s activities have inspired children to spend time in nature and put it to good use.
Half year rePOrT fOr 2012 MaNaGeMeNT rePOrT

18
arla fOODS
The dairy industry is both local and global.Arla wants to be at the forefront onboth of these fronts. Therefore, today, we are locallyanchored, European-owned and operating globallythrough seven well-functioning business areas which know and meet the specific needs of the markets.

19
Half year rePOrT fOr 2012 BUSINESS GROUPS
Global Categories & Operations
Global Categories & Operations (GCO) is a key player when it comes to Arla’s organic growth. GCO is responsible for the company’s three global brands, Arla®, Lurpak® and Castello® and covers most of the value chain. GCO is a complex unit that combines responsibility for global innovation, research, logistics, manufacturing and marketing at Arla. GCO employs almost a third of Arla’s workforce.
GCO wants to generate growth by offering its customers and consumers the most innovative and high-quality products in the butter and spreads, cheese and milk powder markets.
If the merger with Milk Link in the UK and MUH in Germany is approved, 12 billion kilograms of milk will flow through Arla every year. The logistics involved in weighing this quantity of milk will be GCO’s responsibility in the future.
Activities during the first half of 2012The work to establish Arla’s three global brands as global leaders in their respective categories is continuing. We have launched a new global advertising campaign for the Arla® brand. Lurpak® continued its growth at a rate of 13 per cent. Castello® had lower than expected growth.
Efforts to develop and strengthen a competi-tive and efficient production structure are continuing. In the first half of 2012, we continued to rationalise the production of yellow cheese. The cheese is expensive to produce and competition is tough. The goal, therefore, is to improve profitability. This will be achieved, among other ways, by closing dairies in Klovborg and Hjørring in Denmark and Falkenberg in Sweden. The closure process is progressing according to plan. Operations at Klovborg dairy ceased on 1 April and production has transferred to Taulov. At the same time, Arla is investing in a massive expansion of its Danish dairies in Taulov and Nørre Vium. During this period, Milko mejeri, as it was formerly known, in Östersund, Sweden, became part of GCO.
The production plants are getting ready for the OPEX efficiency programme – operational excellence – this is a natural extension of the lean process. Nine GCO dairies have implemented the lean process in the first half of the year. OPEX will be rolled out in 2013 in order to achieve savings through better and more efficient production.
On 3 April, for the first time ever, Arla sold dairy products on GlobalDairyTrade.com, an auction platform for international trade in milk-based ingredients. The exchange is a more flexible trading platform and provides access to a wider market.
Innovation and value creationInnovation is a top priority in Arla’s strategy for 2015, where new products are expected to generate 10 per cent of Arla’s revenue. Arla Strategic Innovation Centre (ASIC) brings together R&D expertise at Arla. ASIC bridges the gap between marketing and innovation and will play a leading role in turning good ideas into profitable products. Several innovative achievements made in the first half of the year are the launch of Lurpak® Lightest in the UK and Zin!® drinking yogurt in the Netherlands.
Arla Natura Havarti® has been introduced in Germany, the Netherlands and Russia. An innovation mindset is also integral to Arla’s Tetris efficiency programme where GCO is working with design-to-value, among other strategies. The goal is to redesign products in order to make them more competitive through quality, with less cost, and without losing focus on the positive consumer experience.
closer to Nature™In 2011, GCO formulated an ambitious Closer to Nature™ strategy, which also includes an environment and climate strategy. This means that GCO is now responsible for all efforts under Closer to Nature™: It must ensure fulfilment of the targets and efficient documentation of progress made, which will strengthen the arla brand.
Several initiatives to increase biodiversity in areas surrounding the dairies have been launched. In Visby in Sweden, half of the energy used for the drying of milk powder is now being supplied from biogas. In the Danish Nørre Vium, Arla has teamed up with Xergi to construct a similar biogas plant. In the first half of the year, DKK 11 million has been invested in a 16 km long pipeline at the Danish Høgelund Mejeri that will transport saline wastewater into the sea instead of the local watercourses. Salt is a problem for the salmon that spawn in freshwater streams.
strategic focal pointsFor the remainder of 2012, development of the three global brands will remain a top priority. The brands’ profiles and sales need to be strengthened. The strong focus on innovation will continue.
Arla®9,790
10,584
Lurpak®1,375
1,557
Castello®627
634
BRAND SALES
2012 2011DKK million
02,000
4,0006,000
8,000
10,000
12,000
KEY LAUNCHES
Lurpak® Lightest, UK;
Arla, Natura Havarti, Germany, the Netherlands and Russia;
Zin!, the Netherlands
GLOBAL CATEGORIES & OPERATIONS
Executive Vice-President: Jais Valeur
Head office: Aarhus, Denmark
Number of employees: 5,036
Product categories: Yellow cheese, speciality cheeses, butter and spreads, and milk powder.
21 plants in Denmark and 7 in Sweden.

20
arla fOODS

21
Half year rePOrT fOr 2012 BUSINESS GROUPS
Consumer International
Consumer International (CIN) is the growth machine that drives Arla’s business outside of the six core European markets. The goal is to strengthen Arla’s position in the world’s emerging markets with a focus on the Middle East and North Africa (MENA), Russia, U.S. and China. CIN has the sales and marketing responsibility for cheese, butter and milk powder on four continents.
In recent years, CIN has achieved impressive growth rates of more than 10 per cent in terms of revenue. This looks set to continue in 2012. The general outlook for the global consumption of dairy products remains positive and growth is expected to continue as the general standard of living rises. The goal is to increase profit generation in the markets and to maintain high sales growth.
Market forecastAcross all markets we are witnessing growing demand for high-quality dairy products and those of European origin. In China, the growing middle class sector is looking for quality products where food safety is paramount. At the same time, global growth in discount chains is placing demands on increased cost efficiency. In the Middle East, the Puck® brand has a strong position and consumers are demanding an expansion of the range across categories.
PerformanceCIN has delivered strong results in all emerging markets in the first half of 2012. In MENA, we have seen growth of 20 per cent, in Russia, growth of over 40 per cent. In 2012, the overall organic growth for CIN is 19 per cent. At the same time, profit levels are significantly higher. The availability of products from Allgäuland, which Arla bought in late 2011, has also contributed to grow, particularly in Italy.
Restructuring and investmentsThe biggest new investments made in the first half of the year include production invest-ments in Canada and those in Danya in Riyadh; these are intended to expand the categories under the Puck® brand. In addition, Arla’s dairy in Poland has been sold and the transfer took place in April.
Activities during the first half of 2012The first half of 2012 has been dominated by the signing of the strategic agreement with China’s biggest food company, COFCO, on a co-ownership of the country’s largest dairy, China Mengnui Dairy Company Limited. CIN will supply European milk products to China under the Arla® brand that will reach Chinese retailers via Mengniu’s distribution network. The goal over the next few years is to send 600-800 million kilograms of milk annually to China, mainly in the form of value-added products.
In Russia, we have signed a production contract with the country’s third-largest dairy company Molvest Group. The contract concerns local cheese production due to start in the first half of 2013. This will help meet CIN’s long-term growth ambitions in Russia.
Arla’s three global brands are experiencing volume growth in CIN’s markets.
closer to Nature™In the Chinese market, there is currently a shortage of products that are safe and contain no artificial additives. Responsibility in Arla, which is expressed through the Arlagården quality programme, has been a great strength for Arla in negotiations with its new Chinese partners. Based on its experience with Arlagården, CIN can help to improve both milk quality and animal welfare on Chinese farms.
strategic focal pointsThe challenges that will require focus for the remainder of the year are: 1) ensuring suc-cess in China through the establishment of an organisation that can meet the ambitious and promising agreements and support Mengniu, 2) ensuring further expansion and growth in MENA, and 3) risk-managing our operations in Southern europe.
CONSUMER INTERNATIONAL
Executive vice president: Finn S. HansenHead office: Aarhus, Denmark.Number of employees: 1,901Product categories: Cheese, butter and milk products and milk powder.8 plants in Europe, North America and the Middle East
KEY FIGURES
3,916
4,304
1,00002,000
3,0004,000
5,000
DKK million 2011 2012
BRAND SALES
DKK million
0300
600900
1,2001,500
Arla®1,253
1,345
Lurpak®385
444
Castello®260
263
2011 2012
DKK million
SALES CATEGORIES
Fresh milk products 264
Cheese 2,601
Butter and spreads 468
Other 971
TOTAL 4,304

22
arla fOODS
consumer UK
Consumer UK (CUK) is responsible for Arla’s core market, the UK, and accounts for 23 per cent of Arla’s overall revenue. CUK covers production and logistics for milk, butter, cream and a range of fresh dairy products and is responsible for sales and marketing in the UK.
The merger agreement entered into with Milk Link in the first half of 2012 will, if approved by the EU, realise Arla’s vision to become the UK’s largest dairy company. The merger will help CUK become established in the UK cheese market, an area where Arla does not currently have a presence. By bringing the companies together and implementing synergies, a complete new company will emerge, with access to cheese production, a modern UHT plant and exports of cheese to 19 countries.
Market forecastMarket conditions in the UK are difficult. Commodity prices are falling and consumer confidence is at a record low. Thirty-five per cent of all groceries are now bought by consumers through price promotions. This means that they want more for less, without quality being compromised. The new consumption patterns are forcing CUK to come up with new approaches. CUK is aiming to build strong brands that can be sold at a higher price.
PerformanceCUK has succeeded in increasing both profits and volume in the first six months of this year, but it will only be able to maintain its current standing by becoming the most cost-effective dairy. Therefore, there is considerable focus on streamlining the supply chain and investing in LEAN programs. CUK’s sales are 13 per cent a head of those for the first half of 2011. This is due to price rises, mainly of private label products, but also of increased sales of fresh milk and products under Arla’s strongest brands Lurpak® (butter), Castello® (cheese) and Anchor® (butter and spreads).
Anchor® has shown solid value growth in the first half of the year. Value growth was also positive for Lurpak®, despite the fact that the volume dropped slightly due to intense promotion of the product category.
Compared to the same period last year, Castello® rose in terms of both value and volume. Lactofree® is Arla’s range of cheeses, yogurts, spread and ice cream based on cow’s milk from which lactose has been removed. Lactofree® has experienced six strong months with a value growth of 11 per cent and a volume growth of 10 per cent. In January this year, Arla launched Lactofree spreadable which is showing steady growth and, in May,
it launched the first allergy-friendly ice cream in the UK made of real cream. The first filtered milk brand in the UK, Cravendale® has had a challenging six months, with volume falling because of increased competition from private label products.
Restructuring and investmentsIn February this year, the first spade went into the ground, in Aylesbury of outside London marking the start of one of the world’s largest and most environmentally advanced dairies. The dairy will have a capacity of 1 billion litres of fresh milk per year and is expected to become operational in the summer of 2013.
Activities during the first half of 2012The agreement with Milk Link has been Arla’s greatest successes and an activity that has consumed most of its time in the first six months. Lurpak® Lightest has been the largest new product launch by CUK in the past decade. There are high expectations for this product which is intended for health-con-scious consumers who have not previously purchased Lurpak®. Lurpak® Lightest contains only 40 per cent fat and the desire is to reach sales of £16 million in the year of launch.
closer to Nature™The first half of 2012 has shown that CUK is taking the ambition to become the UK’s most sustainable dairy company very seriously. None of Arla’s sites in the UK sent waste to landfills and recycling rates at sites has increased from 40 per cent to 90 per cent. Dairies in the UK have reduced CO2 emissions by 8.8 per cent, energy consumption by 5.3 per cent and water consumption by 6.1 per cent.
strategic focal pointsCUK’s objectives for the remainder of 2012 are 1) ensuring a successful start of Anchor® butter production at the Westbury plant, 2) implementing the proposed merger with Milk Link and reaping the expected synergies, and 3) maintaining focus on cost levels so as to deliver the stretched targets for 2012.
CONSUMER UK
Executive vice president: Peter LauritzenHead office: Leeds.Number of employees: 2,621Product categories: Milk, butter, cream and a range of fresh dairy products8 plants in the UK.
KEY FIGURES
6,166
6,951
02,000
4,0006,000
8,000
DKK million 2011 2012
BRAND SALES
DKK million
0300
600900
1,2001,500
Arla®1,215
1,234
Lurpak®881
985
Castello®21
30
2011 2012
DKK million
SALES CATEGORIES
Fresh milk products 4.353
Cheese 161
Butter and spreads 1.787
Other 649
TOTAL 6.951

23
Half year rePOrT fOr 2012 BUSINESS GROUPS
consumer sweden
Consumer Sweden (CSE) is responsible for more than half of the consumer market in Sweden and therefore has a strong position in the Swedish core market. Arla has a strategic ambition to become the main food inspirator for Swedish consumers. CSE also includes the Finnish subsidiary Arla Ingman and is responsible for marketing, sales, logistics and production of fresh milk and fermented products in Sweden and Finland.
The repositioning Arla announced in the Swedish dairy market several years ago is now a reality. After the merger between Arla and Milko in 2011, efforts to integrate Milko and create a common Arla identity were finalised in May 2012. The new organisation is making a clear mark on the market, synergies are being reaped as expected and today Arla has a strong presence as well as in the geographical areas where Milko was previously market leader.
Market forecastThe Swedish market is a depressed one, with a focus on inexpensive foodproducts. The competition is tough and the number of private label products on the shelves is increasing. The high price sensitivity also lowers the demand for organic milk. However, the health trend that focuses on natural foods and low-carbohydrate/high fat products is sending out a positive signal to the market for dairy products. The Finnish market has a markedly different profile. Here, overall consumer confidence is strong, although the general price level for milk is low, which negatively affects earnings in Finland.
PerformanceThe strategy to source more milk and create geographic growth in northern Sweden is being achieved following the merger with Milko and the acquisition of Sundsvall dairy. The first half of 2012 has shown a volume growth of approximately 5 per cent and an 11 per cent growth in revenue, mainly driven by the successful integration of Milko. Profitabil-ity is stable. The highest growth has been in cooking products and butter and spreads, due in particular to the above-mentioned low-carbohydrate/high-fat trend. The fruit juice category is growing, while the markets for milk and cheese are being challenged by private labels. In Finland, increasing growth is seen in both value and volume terms. Arla Ing-man has had a strong start to the year with a growth of 10 per cent and improved profitability.
Activities during the first half of 2012In both Sweden and Finland there is a continued focus on lowering costs and ensuring long-term competitiveness locally and internationally. The ambition to become the main food inspirator for Swedish consumers has been a strategic engine in marketing activities. Arlas website and app
now has 1 million Swedish users a month. Arla is the official supplier to the Swedish Olympic Committee and the Olympic Games are being linked to the promotion of milk as nature’s own sports drink. Our cooperation with them has been communicated in advertisements, stores and milk cartons. The dairy in Sundsvall has now become established as a strategically important Arla dairy. The inventory manage-ment system Astro is in place and a common IT platform has been established for the distribution centre, which can now deliver more than 500 Arla products to 2,400 Swedish customers and ensure better access to fresh milk in northern Sweden. After the many restructurings, including new order proce-dures for all customers, operation is now entering a more stable period with improved service to both customers and consumers. Arla’s largest dairy in Sweden, Stockholm, has expanded cold storage to accommodate larger quantities of milk and serve the regions north of Stockholm. Arla has also complied with all of the pledges imposed by competition authorities as a prerequisite for the merger with Milko going ahead.
closer to Nature™Arla’s focus on getting Closer to Nature™ is beginning to deliver results. Our pledge to consumers has become a natural part of the business and the results are particularly obvious in brand image ratings. Specifically, in the first half of the year, Sweden has been focusing on increasing efficiency in the supply chain in order to reduce energy consumption. In Finland, the sustainability of our ambitions has gained momentum. An organic product range has been launched and is doing well and sustainable thinking is driving the development of the Arla® brand among consumers.
strategic focal pointsFor CSE, the strategy is to increase earnings from three strategic levers: 1) helping to increase the profitability of the dairy market, 2) increasing sales of value-added products within yogurt, cooking and butter and spreads, and 3) reducing costs, increasing efficiency especially in the supply chain and conducting a review of the production strategy. The Finnish competition authorities are currently carrying out an investigation into the pricing in the Finnish milk market which is characterised by a significant and unhealthy drinking milk price war.
CONSUMER SWEDEN
Executive vice president: Christer Åberg
Head office: Stockholm
Number of employees: 2,653
Product categories: Fresh products, juice, cheese and butter and spreads.
8 plants in Sweden and 3 in Finland.
KEY FIGURES
6,261
6,985
02,000
4,0006,000
8,000
DKK million 2011 2012
BRAND SALES
DKK million
01,000
2,0003,000
4,0005,000
6,000
Arla®4,981
5,549
Lurpak®1
5
Castello®137
132
2011 2012
DKK million
SALES CATEGORIES
Fresh milk products 4,168
Cheese 1,509
Butter and spreads 944
Other 364
TOTAL 6,985

24
arla fOODS
consumer Denmark
Consumer Denmark (CDK) is focusing on developing a strong position in the Danish core market, in particular, by contributing to the enhancement of Danish food culture in the home, on the road and at school. CDK is responsible for the marketing and sales to the Danish retail sector and the production and development of fresh milk products in Denmark.
Arla is continuing its efforts to raise and develop awareness of food in the Danish population by exploiting opportunities such as new Nordic cuisine and the increased political focus on Danish cuisine. The sugar tax announced by the Danish government is being followed closely because dairy products are in danger of being grouped with indulgent products such as sweets and soft drinks. Arla, along with, for example, Thise Dairy and the Danish Dairy Board, will continue its fight to ensure that staple foods should not be subject to sugar tax.
Market forecastThe Danish consumer confidence remains low, price sensitivity is high and the market is characterised by a price war on milk. Consumers are increasingly focusing on afford-able products and a greater number of private label products are now available across all categories. This trend is putting both brands and organic production under pressure.
The most significant external factor during the first half of the year has been the Danish fat tax which was introduced in October 2011 and which has adversely affected sales of products containing fat. The tax has led to price increases which in turn are reducing sales of butter, cream and cheese, as well as driving consumers’ search for less expensive products.
PerformanceSales during the first half of 2012 have increased. The increase is mainly driven by higher prices as a result of the fat tax, but there has also been an encouraging increase in sales, especially those of fresh products, where strong yoghurt brands have performed well. Conversely, consumers’ overall demand for more private labels has been affecting our sales, because a larger proportion of sales are sold at lower prices. This is true, in particular, of basic products such as milk and cheese.
In the first half of 2012, CDK succeeded in continuing to significantly reduce costs in order to maintain competitiveness against increasing foreign competition.
Activities during the first half of 2012In April, Unika Arla opened its doors at Copenhagen’s Torvehallerne food market, where gourmet cheeses that have so far been reserved for guests of Denmark’s finest restau-
rants are now available to consumers. Among the cheeses on offer is Lykkebjerg, a cheese made of raw milk. The Gourmet cheeses are the answer to Danish chefs’ demand for exclusive Danish cheese. The Unika shop is part of Arla’s strategy to take the lead in the dairy industry and also a good opportunity to show consumers that Arla can produce both products in large quantities for a broad consumer audience and niche products for special occasions.
2012 marks the 50th anniversary of the Karolines Køkken® brand, which was created in order to inspire Danes to cook on a daily basis. Arla is celebrating this anniversary by relaunching cottage cheese in Denmark and publishing Alle tiders Karoline, a cookery book, the purpose of which is to reaffirm Karoline’s position as the number one source of inspiration in Danish cuisine through tasteful reinterpretations of classic recipes.
Arla Kærgården® has been relaunched in a smaller and cheaper unit sizes in response to growing consumer demand for less expensive products.
closer to Nature™Consumers who are most interested in organic production live in the largest cities. That is why, on Eco Day in April, Arla organised a special train which brought 650 children and adults to Brørup in South Jutland in order to give these Copenhagen families a chance to see cows going to pasture and to catch a glimpse of modern dairy production. A total of 86,000 Danes visited the 36 open Arla farms on Eco Day. In an effort to bring consumers closer to nature, in 2012 Arla also put food waste on the agenda. The goal is to help consumers, through research, innovation and information, to reduce wastage of dairy products by 50 per cent by 2020.
strategic focal pointsCDK wants to continue implementing the strategy to strengthen its core business, including the market share of its branded products in the face of the growing private label market. The focus will be to target product development to consumer needs and purchase situations and to continue invest-ment in CDK’s key brands.
CONSUMER DENMARK
Executive vice president: Peter Giørtz-Carlsen
Head office: Aarhus, Denmark
Number of employees: 1,807
Product categories: Fresh products, cheese and butter
5 plants in Denmark
KEY FIGURES
3,268
3,403
01,000
2,0003,000
4,000
DKK million 2011 2012
BRAND SALES
DKK million
Arla®1,776
1,790
Lurpak®106
124
Castello®54
48
0500
1,0001,500
2,000
2011 2012
DKK million
SALES CATEGORIES
Fresh milk products 1,959
Cheese 863
Butter and spreads 451
Other 130
TOTAL 3,403

25
Half year rePOrT fOr 2012 BUSINESS GROUPS

26
arla fOODS
consumer Germany & the Netherlands
With 80 million consumers and a high average consumption of milk, Germany is a core market for Arla. Consumer Germany & the Netherlands (CGN) tasked with tapping the potential in these rapidly growing markets and leveraging the synergies between Germany and the Netherlands. CGN is responsible for production, logistics, marketing and sales to retailers. Integration of the recently acquired companies, production sites and products are key focus areas for 2012.
CGN was established as a business entity on 1 January 2012 and consists of the sales organisation in Düsseldorf and acquisitions made in 2011 – the merger in April with the German dairy company Hansa-Milch and acquisition in November of Allgäuland-Käsereien (now Arla Foods Käsereien). After the merger agreement with Milchunion Hocheifel (MUH) was signed in 2012, the pieces of the puzzle have fallen into place: we expect this brand new entity to become Germany’s third largest dairy company and to almost double sales in Germany and the Netherlands from EUR 800 million (equivalent to DKK 6 billion) in 2011 to EUR 1,500 million (equivalent to DKK 11 billion) in 2012. Arla is awaiting the EU’s final approval of the merger.
Market forecastThe German and Dutch markets are domi-nated by private labels and discount products driven by Aldi and Lidl and the Dutch retail sector.
PerformanceThe pressure on prices has been strong in the first half of 2012, but Arla has maintained its brand positions despite intense pressure from private label products. In the first six months, we posted double-digit growth driven by Arla Kærgården® which is now available in all major grocery chains. Our second major brand in Germany, Arla BUKO®, is experiencing continued growth and it also in double-digit growth.
Restructuring and investmentsOur efforts in Germany require major restructuring and investments in 2012. The acquisition of Arla Foods Käsereien in 2011 gave us access to alpine milk and a variety of speciality cheese which will now come under the Castello® brand and be included in the development of export markets. Since November, CGN has been concentrating merging Arla Foods Käsereien with the rest of Arla, which has been a far-reaching process. This has meant closing down the Riedlingen dairy in January, certification of the other dairies and reorganisation of the sales structure. CGN is preparing a global launch of alpine cheeses in September.
The expected merger with MUH also creates an opportunity for national distribution of milk in Germany.
In addition, Arla also gains access to a new product category that has had little promi-nence in the past UHT milk, also known as long-life milk. This is easily the largest milk market outside Scandinavia and the UK. Arla will therefore be spending some time in 2012 on further developing MUH’s existing long-life milk platform for both the German and export markets, particularly China.
Activities during the first half of 2012We have spent the first six months of 2012 putting the management team in place and negotiating the merger with MUH. During the remainder of 2012, we will be focusing on uniting the various companies under a common management, name and organisa-tion and establishing a single Arla identity in Germany – ONE Arla. In Germany, CGN has expanded the Arla Kærgården® range with Arla Kærgården® mix, among other products.
In the Netherlands, Arla became one of the first companies this year to introduce a zero-fat, low-calorie yoghurt without artificial sweeteners. The product, Arla Zin!® is an innovative product because it is based on the plant stevia which was approved for use in food by the European Commission in 2011. Leaves of the stevia plant are up to 300 times sweeter than sugar, 100 per cent natural, without any calories and a part of the future for arla.
closer to Nature™The launch of Zin!® in the Netherlands is not just a story of innovation, it is also a story of coming Closer to Nature™. It has the potential to move many of Arla’s products closer to nature and therefore help us keep the pledge we have given to consumers in a number of markets.
In Germany, too, CGN is seeing its Closer to Nature™ activities helping to strengthen Arla’s market position.
strategic focal pointsThere are many expectations of the organic market in Germany after the merger with Hansa-Milch. In the Netherlands, the strong Dutch brand Melkunie®, which has been off the market for 7 years, will be reintroduced later this year. It is still a brand which the Dutch associate with milk.
CONSUMER GERMANY & the NETHERLANDS
Executive Vice President: Tim Ørting JørgensenHead office: Düsseldorf, GermanyNumber of employees: 1,315Product categories: Fresh products, cheese and butter in Germany and the Netherlands5 plants in Germany and 1 in the Netherlands
KEY FIGURES
2,482
3,617
01,000
2,0003,000
4,000
DKK million 2011 2012
BRAND SALES
DKK million
0100
200300
400500
600700
800
Arla®1,776
1,790
Lurpak®106
124
Castello®54
48
2011 2012
DKK million
SALES CATEGORIES
Fresh milk products 1,549
Cheese 1,347
Butter and spreads 471
Other 250
TOTAL 3,617

27
Half year rePOrT fOr 2012 BUSINESS GROUPS
Arla foods ingredients
The subsidiary Arla Foods Ingredients (AFI) is a global market leader in whey protein technology and one of Arla’s most profitable business units. AFI has a strategic ambition to double net sales from 2008 to 2015 – an ambitious goal for one of the world’s leading manufacturers of highly processed whey protein and lactose products.
Whey-based food ingredients are an essential part of Arla’s overall strategy and long-term development. Whey is a by-product of cheese making and AFI is responsible for Arla’s whey proteins globally. AFI’s products are used in the nutrition, dairy, bakery and ice cream industries and they are part of special products, such as infant formula.
Innovation is a core competence at AFI which has developed a functional whey protein (Nutrilac® BK-7781) that is an effective substitute for eggs and that in 2012 became an expensive commodity for the bakery industry because of an EU directive on animal welfare. Nutrilac® BK-7781 is cheaper than eggs and contains fewer calories, less saturated fat and cholesterol. AFI has a wide range of whey proteins and the innovation potential is great.
Market forecastGlobal markets for whey proteins and lactose are growing. This trend is mainly driven by the growing middle class sector in both China and India. Strong demand has led to a rising price level and the trend is expected to remain stable over the next 6 months.
PerformanceIn the first half of 2012, AFI’s sales have grown by 14 per cent. This increase is mainly driven by higher prices and an improved product mix and, only to a lesser extent, by growth in volume.
Restructuring and investmentsAFI accounts for some of Arla’s largest investments in 2012. One of the most important projects has been the construction of a modern lactose factory in northern Germany, which is the purpose behind Arla and German DMK’s joint venture dedicated to whey processing, ArNoCo. Approximately EUR 50 million, corresponding to DKK 370 million, is being invested in the new plant which is expected to start in the summer of 2013. Each year, the plant will process 700 million kg of whey into whey protein concentrate and lactose. As part of the agreement, whey protein concentrate will be dried in AFI’s plant in Nørre Vium in Denmark.
In addition, DKK 450 million are being invested in a new drying tower, additional filtration capacity and a new administration building for Denmark Protein in Nørre Vium. This investment will increase plant capacity and the value of protein. The drying tower, which is expected to start in the fourth quarter of 2012, is a prerequisite for ArNoCo’s success.
In Argentina, AFI has embarked on a joint venture with SanCor, AFISA. The AFISA plant is expanding in order to secure a strong position for Arla in South America, where cheese production and whey weighing are on the increase. AFISA is investing USD 10 million in extra capacity and expects to increase whey intake by 25 per cent.
AFI has sold its 30 per cent stake in Milei, the whey joint venture that Arla took over with the acquisition of the southern German dairy Allgäuland Käsereien in 2011. Milei has been sold because AFI was not able to achieve strategic and operational control of the company.
closer to Nature™AFI is focusing on reducing energy consump-tion, in particular in the drying towers which extract water from milk so that it can be converted into powder. In addition, AFI is working on an initiative called Dry Blending Quality of lactose and protein products which allows customers to use AFI’s products without reconstituting and drying them again. Dry Blending Quality saves us from one round of drying, which results in significant energy savings and a final higher-quality product.
strategic focal pointsAFI’s most important strategic priority in 2012 is to find a production footing in the U.S. where there is great potential for more whey use.
ARLA FOODS INGREDIENTS
Managing director: Henrik Andersen
Head office: Aarhus, Denmark
Number of employees: 717
Product categories: Products within the whey segment, including highly refined whey protein.
2 Arla plants in Denmark plus 5 partnerships and joint ventures in Europe and South America.
KEY FIGURES
982
1,102
0300
600900
1,200
DKK million 2011 2012

28
arla fOODS

29
Half year rePOrT fOr 2012 MaNaGeMeNT rePOrT

30
arla fOODS
consolidated statement of income
Mio. DKK 1. HAlF-yEAR 2012 1. HAlF-yEAR 2011 fUll yEAR 2011
revenue 29,911 26,663 54,893
Production costs -23,300 -21,045 -42,819
Gross profit 6,611 5,618 12,074
Research and development costs -110 -84 -173
Sales and distribution costs -4,381 -3,654 -7,819
Administration and joint costs -1,419 -1,192 -2,436
Other operating income 187 81 164
Other operating costs -219 -54 -87
Operating profit 669 715 1,723
Results after tax in joint ventures -13 -8 17
Results after tax in associates 1 0 15
Financial income 112 40 143
Financial costs -314 -226 -448
Profit before tax 455 521 1,450
Tax 58 91 -51
Profit for the period 513 612 1,399
Allocated as follows:
Owners in Arla Foods amba 502 599 1,370
Minority interests 11 13 29
Total 513 612 1,399
31
half year fINaNCIal rePOrT fOr 2012 half year fINaNCIal sTaTemeNTs
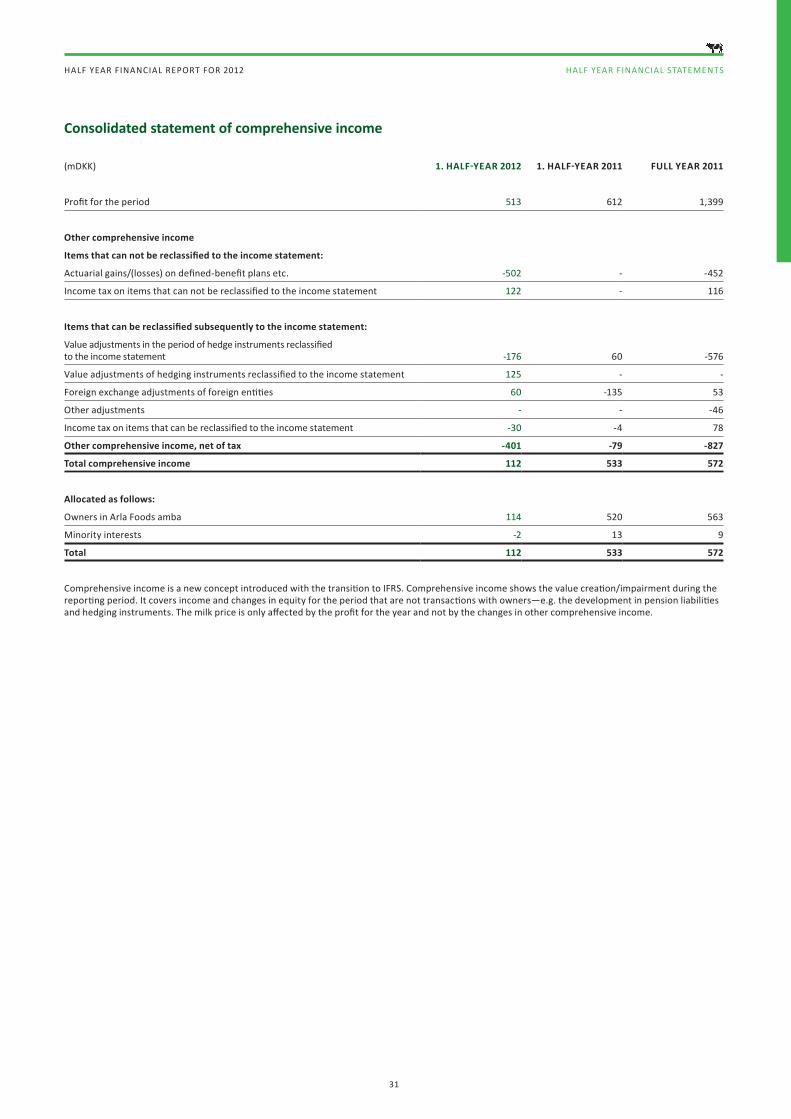
(mDKK) 1. half-year 2012 1. half-year 2011 full year 2011
Profit for the period 513 612 1,399
Other comprehensive income
Items that can not be reclassified to the income statement:
Actuarial gains/(losses) on defined-benefit plans etc. -502 - -452
Income tax on items that can not be reclassified to the income statement 122 - 116
Items that can be reclassified subsequently to the income statement:
Value adjustments in the period of hedge instruments reclassified to the income statement -176 60 -576
Value adjustments of hedging instruments reclassified to the income statement 125 - -
Foreign exchange adjustments of foreign entities 60 -135 53
Other adjustments - - -46
Income tax on items that can be reclassified to the income statement -30 -4 78
Other comprehensive income, net of tax -401 -79 -827
Total comprehensive income 112 533 572
allocated as follows:
Owners in Arla Foods amba 114 520 563
Minority interests -2 13 9
Total 112 533 572
Comprehensive income is a new concept introduced with the transition to IFRS. Comprehensive income shows the value creation/impairment during the reporting period. It covers income and changes in equity for the period that are not transactions with owners—e.g. the development in pension liabilities and hedging instruments. The milk price is only affected by the profit for the year and not by the changes in other comprehensive income.
Consolidated statement of comprehensive income

32
arla fOODS
consolidated balance sheet
(mDKK) 1. HAlF-yEAR 2012 1. HAlF-yEAR 2011 fUll yEAR 2011
AssETs
Non-current assets
Intangible assets
Goodwill 4,001 3,642 3,912
Licenses and trademarks etc. 410 469 448
IT development 410 348 401
Total intangible assets 4,821 4,459 4,761
Property, plant and equipment
land and buildings 4,819 4,653 4,843
Plant and machinery 5,455 5,183 5,688
Fixtures and fittings, tools and equipment 647 600 667
Assets in course of construction 2,397 966 1,270
Total property, plant and equipment 13,318 11,402 12,468
Financial assets
Investments in joint ventures 418 366 421
Investments in associates 1,975 209 264
Other securities etc. 549 535 560
Deferred tax assets 464 138 267
Total financial assets 3,406 1,248 1,512
Total non-current assets 21,545 17,109 18,741
current assets
Inventories 5,573 4,902 5,321
Trade receivables 5,840 5,399 5,756
Amounts owed by associates 26 44 50
Derivatives 125 - 67
Other receivables 468 412 394
Prepayments 193 219 180
Securities 4,024 4,103 4,088
Cash at bank and at hand 480 381 504
Total current assets 16,729 15,460 16,360
assets held for sale 45 - 45
Total current assets 16,774 15,460 16,405
TOTAl AssETs 38,319 32,569 35,146

33
HALF yEAR FINANCIAL REPORT FOR 2012 HALF yEAR FINANCIAL STATEMENTS
consolidated balance sheet
(mDKK) 1. HAlF-yEAR 2012 1. HAlF-yEAR 2011 fUll yEAR 2011
EQUiTy AND liABiliTiEs
EQUiTy
Capital account 6,960 7,106 7,364
Delivery-based owner certificates 833 833 840
Contributed capital 676 342 682
Reserve for special items 500 500 500
Reserve for hedge accounting -617 -15 -566
Reserve for exchange adjustments 113 -135 53
Profit for the period 502 599 -
Equity, excl. supplementary payments to members 8,967 9,230 8,873
Proposed supplementary payments to members - - 491
Equity attributable to the parent company's members 8,967 9,230 9,364
Minority interests 160 166 162
Total equity 9,127 9,396 9,526
liABiliTiEs
Non-current liabilities
Pension liabilities 2,645 1,713 2,223
Deferred tax 116 119 120
Other provisions 368 211 323
Issued bonds 1,270 1,214 1,251
Mortgage credit institutions 5,956 5,968 5,970
Credit institutions etc. 4,225 1,655 1,828
Total non-current liabilities 14,580 10,880 11,715
Current liabilities
Short-term portion of long-term liabilities 409 160 118
Bank loans and overdrafts 6,341 6,159 5,830
Trade payables 4,701 3,998 4,910
Amounts owed to joint ventures - - 3
Amounts owed to associates 8 2 14
Derivatives 965 24 920
Tax 11 38 29
Other payables 2,073 1,862 1,962
Deferred income 104 50 119
Total current liabilities 14,612 12,293 13,905
Total liabilities 29,192 23,173 25,620
TOTAl EQUiTy AND liABiliTiEs 38,319 32,569 35,146
34
arla fOODS
Consolidated cash flow statement
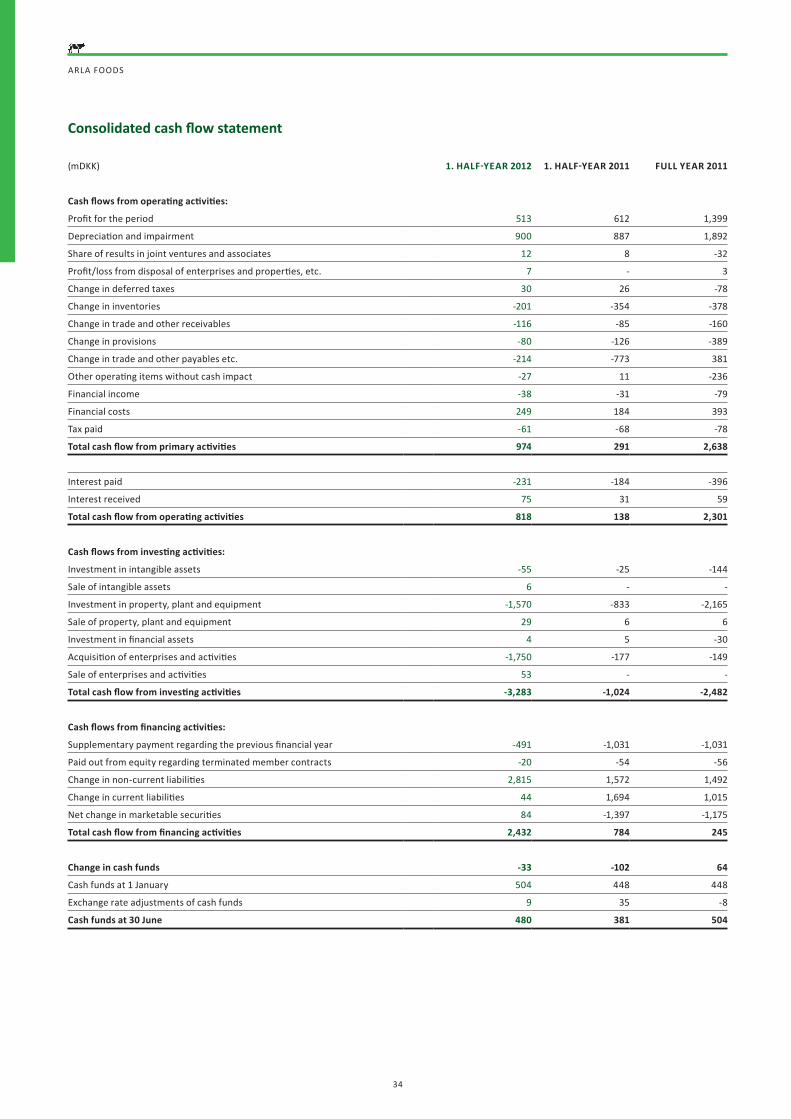
(mDKK) 1. HAlF-yEAR 2012 1. HAlF-yEAR 2011 fUll yEAR 2011
Cash flows from operating activities:
Profit for the period 513 612 1,399
Depreciation and impairment 900 887 1,892
Share of results in joint ventures and associates 12 8 -32
Profit/loss from disposal of enterprises and properties, etc. 7 - 3
Change in deferred taxes 30 26 -78
Change in inventories -201 -354 -378
Change in trade and other receivables -116 -85 -160
Change in provisions -80 -126 -389
Change in trade and other payables etc. -214 -773 381
Other operating items without cash impact -27 11 -236
Financial income -38 -31 -79
Financial costs 249 184 393
Tax paid -61 -68 -78
Total cash flow from primary activities 974 291 2,638
Interest paid -231 -184 -396
Interest received 75 31 59
Total cash flow from operating activities 818 138 2,301
Cash flows from investing activities:
Investment in intangible assets -55 -25 -144
Sale of intangible assets 6 - -
Investment in property, plant and equipment -1,570 -833 -2,165
Sale of property, plant and equipment 29 6 6
Investment in financial assets 4 5 -30
Acquisition of enterprises and activities -1,750 -177 -149
Sale of enterprises and activities 53 - -
Total cash flow from investing activities -3,283 -1,024 -2,482
Cash flows from financing activities:
Supplementary payment regarding the previous financial year -491 -1,031 -1,031
Paid out from equity regarding terminated member contracts -20 -54 -56
Change in non-current liabilities 2,815 1,572 1,492
Change in current liabilities 44 1,694 1,015
Net change in marketable securities 84 -1,397 -1,175
Total cash flow from financing activities 2,432 784 245
change in cash funds -33 -102 64
Cash funds at 1 January 504 448 448
Exchange rate adjustments of cash funds 9 35 -8
Cash funds at 30 June 480 381 504

35
HALF yEAR FINANCIAL REPORT FOR 2012 HALF yEAR FINANCIAL STATEMENTS
consolidated statement of changes in equity
(mDKK)
cAPiTA
l AccO
UN
T
DElIv
ERy-bASED
Ow
NER
cERTificATEs
cON
TRiBUTED
cAPiTA
l
REsERvE fO
R sPEciA
l iTEMs
REsERvE fO
R hED
GE
AccO
UN
TiNG
REsERvE fO
R ExchA
NG
E A
DJu
STMEN
TS
PROPO
sED
sUPPlEM
ENTA
Ry PAyM
ENTs TO
MEM
BERs
PROfiT fO
R ThE PERiO
D
TOTA
l
MiN
ORiTy iN
TEREsTs
TOTA
l EQU
iTy
Equity at 1 January 2012 7,364 840 682 500 -566 53 491 - 9,364 162 9,526
Profit for the period 502 502 11 513
Other comprehensive income -397 -51 60 -388 -13 -401
Total comprehensive income for the period
-397 - - - -51 60 - 502 114 -2 112
Paid in capital from new members - -
Payments to members -14 -6 -20 -20
Supplementary payments to members -491 -491 -491
Exchange rate adjustments -7 7 - -
Total transactions with members -7 -7 -6 - - - -491 - -511 - -511
EquITy AT 30 JuNE 2012 6,960 833 676 500 -617 113 - 502 8,967 160 9,127
Equity at 1 January 2011 6,895 892 233 500 -71 - 1,031 - 9,480 153 9,633
Profit for the period 599 599 13 612
Other comprehensive income 56 -135 -79 - -79
Total comprehensive income for the period
- - - - 56 -135 - 599 520 13 533
Paid in capital from new members 214 103 317 317
Payments to members -54 -2 -56 -56
Supplementary payments to members -1,031 -1,031 -1,031
Exchange rate adjustments -3 -5 8 0
Total transactions with members 211 -59 109 - - - -1,031 - -770 -770
Equity at 30 June 2011 7,106 833 342 500 -15 -135 - 599 9,230 166 9,396

36
arla fOODS
NOTE 1. AccOUNTiNG POliciEs, AccOUNTiNG EsTiMATEs AND TRANsiTiON TO ifRs
1.1 AccOUNTiNG POliciEs
basis of preparationThe interim report is presented in Danish kroner (DKK), which is the parent enterprise’s functional currency.
The annual report was prepared based on the historical cost accounting model, except for the following assets and liabilities, which were measured at fair value: Derivatives, financial instruments held for trading and financial instruments classified as being available for sale.
Non-current assets and asset groups held for sale are measured at the lower value of the accounting value before the changed classification or fair value, less costs to sell.
The accounting policy described below is used consistently during the interim period and for the comparative figures.
Consolidated financial statements The consolidated financial statements include Arla Foods amba (parent company) and the subsidiary enterprises in which the parent company, directly or indirectly, holds more than 50% of the voting rights or otherwise maintains control. Enterprises with joint control are considered joint ventures. Enterprises in which the Group exercises significant but not controlling influence are considered associated enterprises. Significant influence is typically attained by holding or having at one's disposal,
directly or indirectly, in excess of 20 per cent but less than 50 per cent of the voting rights in an enterprise. For acquisitions of enterprises and when signing new partnership agreements, an assessment is made whether to classify the acquired enterprise as a subsidiary, joint venture or associated enterprise. This assessment is made on the basis of executed agreements for acquiring ownership or voting rights in the enterprise and on the basis of executed shareholder agreements, etc., which will establish the actual control of the enterprise. In determining the scope of the influence, the assessment takes into account potential voting rights as they exist on the reporting date.
The consolidated financial statements are prepared as a compi-lation of the parent company’s and the individual subsidiaries' financial statements prepared under the Group’s accounting policy. Intragroup income and costs are eliminated from the financial statements as are shareholdings, etc., internal balances and dividends. Realised and unrealised profits and losses from transactions between joint ventures and associated enterprises are eliminated in proportion to the Group's ownership interest in the enterprise. Unrealised losses are eliminated to the extent that there is no evidence of impairment.
Minority interestsItems from subsidiary enterprises are fully recognised in the consolidated financial statements. Minority interests’ shares of the
results for the year and of the equity in the subsidiaries not wholly owned are recognised as part of the consolidated results, respectively, equity, but are listed separately.
On initial recognition, minority inter-ests are measured at either the fair value of the ownership share or the proportional share of the fair value of the acquired enterprises’ identified assets, liabilities and contingent liabilities. The measure-ment of minority interest is selected on a transactional basis and disclosure is made in the note pertaining to business combina-tions.
Translation of transactions and monetary items in foreign currenciesFor each of the reporting enter-prises in the Group, a functional currency is established, which is the currency that is used in the primary financial environment in which the individual reporting enterprise operates. Transactions in currencies other than the functional currency are transactions in foreign currencies.
On initial recognition, transactions in foreign currencies are translated into the functional currency at the transaction date rate. Foreign exchange rate differences arising between the exchange rates at the transaction date and the payment date are recognised in the income statement under financial items. Receivables, liabilities and other monetary items in foreign currencies are translated into the
functional currency at the exchange rate on the reporting date. The difference between the rate of exchange at the reporting date and the date the receivable or liability was incurred, or the rate specified in the last annual report, is recognised in the income statement under financial items.
Translation of investments in joint ventures and associated enterprises in foreign currenciesOn recognition of associated enterprises or joint ventures using a functional currency other than Danish kroner (DKK) in the consolidated financial statements and to the extent that this method does not provide a materially different view of the foreign exchange rate on the transaction date, the share of the results for the year is translated at the average exchange rate for the individual months, and the share of equity incl. goodwill is translated at the foreign exchange rates at the reporting date. When translating the share of foreign enterprises' equity at 1 January into foreign exchange rates at the reporting date and in connection with translation of the share of the results for the year from average rates to the foreign exchange rates at the reporting date, exchange rates differences are recognised under comprehensive income in a special reserve for foreign exchange rate adjustments under equity.
On partial divestment of associated enterprises and joint ventures, the proportional portion of the
As mentioned in the 2011 Annual Report, beginning in 2012 Arla is presenting its consolidated financial statements and annual financial statements in accordance with the International Financial Reporting Standards (IFRS) as approved by the EU, supplemented by Danish financial reporting standards. The Half-year Report is presented in accordance with IAS 34 “Interim financial reporting” as approved by the EU.
This half-year report is Arla Foods’ first report after the transition to IFRS. For this reason this interim report contains a full description of both the new accounting policy (section 1.1); estimates and uncertainties (section 1.2); and describes the accounting effect of the transition to IFRS (section 1.3).
The notes and accounting policy sections are divided into areas that describe the various parts of the accounts. The notes also include both tables with figures and a brief review with comments on the figures. Those areas are:• Operating profit• Net working capital• Financial items and debt• Other areas, including especially goodwill and business combinations
The accounting policy section starts with a description of the basis of preparation.
The transition date to IFRS was 1 January 2011 for application of the standards that apply as per 31. December 2011. In accordance with IFRS, comparative figures have been restated so that the half-year financial statements are in compliance with the IFRS.

37
Half year rePOrT fOr 2012 NOTeS
cumulative exchange rate adjustment reserve recognised under other comprehensive income is transferred to the results for the year along with any gains or losses related to the divestment. Repayment of outstanding balances considered part of the net investment is not in itself consid-ered partial divestment of the subsidiary enterprise.
EquityEquity consists of:• Capital account, which comprises
the enterprise’s unallocated equity.
• Supplementary payments to members are recognised at a payable from the time the board of representatives approved payment to the members.
• Delivery-based owner certificates established in accordance with art. 19(1)(ii) of the Articles of Association and a related regulation. Individual members’ balances on owner’s certificate can, if relevant, be paid out upon cessation of membership of Arla Foods amba in accordance with the provisions set out in the regulation, including that the board of representatives approves the payment. The account is maintained in DKK and SEK.
• Contributed capital established in 2010 in accordance with art. 19(1)(iii) of the Articles of Association and an accompanying regulation. Individual members’ contributed capital can, if relevant, be paid out upon cessation of membership of Arla Foods amba in accordance with the provisions set out in the regulation, including that the board of representatives approves the payment. The account is maintained in DKK, SEK and EUR.
• Reserve for special items: In 2011, the Board of Representatives decided to transfer the balance in Reserve Fund B of DKK 500 million to a new reserve ’Reserve for special items.’ The enterprises’ reserve for special items may, upon the Board of Director’s proposal, only be applied by the Board of Representatives for the full or partial offsetting of material, extraordinary losses or impairments, cf. art. 19(3) of the Articles of Association.
• Reserve for hedge accounting comprise the fair value of derivative financial instruments classified as and meeting the conditions for hedging future cash
flows and where the hedged transaction has not yet been realised.
• Reserve for exchange adjustments comprise rate differences arisen in the translation of accounts for foreign enterprises at a functional currency other than the presentation currency of the Group, value adjustments relating to assets and liabilities that constitute part of the Group's net investment in such enterprises and value adjustments relating to hedging transactions that hedge the Group's net investment in such enterprises. As at the transition date to IFRS, the Group—in accordance with IFRS 1—has decided to set this reserve at zero, which means that only foreign exchange rate adjustments after 1 January 2011 will be separated as a special reserve under equity.
Non-impairment clauseUnder the Article of Associations, no payments may take place to Arla Foods amba that impair the sum of the enterprise’s capital account and equity accounts prescribed by law, including equity accounts prescribed by IFRS. The non-impairment clause is assessed on the basis of the arla Group's most recent annual report presented under IFRS.
Cash flow statementThe consolidated cash flow statement is presented according to the indirect method based on the consolidated income statement. The cash flow statement shows the cash flows by operating, investing and financing activities as well as how these cash flows have affected cash and cash equivalents.• Cash flows from operating
activities are measured as the Group's portion of the results for the year adjusted for operating items with no effect on the cash flows.
• Cash flows from investing activities comprise payments made in connection with the acquisition and divestment of intangible and property, plant and equipment, enterprises and activities as well as other non-current assets. The effect on the cash flow from the acquisition and divestment of enterprises are shown separately under cash flows from investment activities. Acquired enterprises’ cash flows are recognised as at the date of
acquisition, and divested enterprises’ cash flows are recognised up until the date of divestment.
• Cash flows from financing activities comprise the raising and repayment of current and non-current liabilities to credit institutions, mortgage banks, payments to members relating to the previous fiscal year and payments from equity.
Cash and cash equivalents comprise cash and cash equivalents as well as exchange listed debt securities for which there are only insignificant risk of changes in value and that can readily be converted to cash and cash equivalents. Additionally, the remaining life from the date of acquisition will be less than three months.
Cash flows in foreign currencies other than the functional currency are translated at average exchange rates to the extent these do not deviate significantly from the transaction date rates.
Operating profit
RevenueRevenue is recognised in the income statement when delivery and risk have been transferred to the buyer and if the income can be measured reliably and is expected to be received. Revenue comprises invoiced sales for the year, less sales rebates, cash discounts, and VAT and duties.
Revenue per business group split by geographic markets and product categories is based on the Group’s internal financial management.
Production costsProduction costs comprises the purchase of goods (including the purchase of milk from members) and direct and indirect costs (including depreciations and impairments of manufacturing plants, etc. as well as payroll costs) related to the revenues for the year. The purchase of milk from members is recognised at the on-account prices for the accounting period and therefore does not constitute supplementary payments.
Research and development costsResearch and development comprise direct costs, payroll costs and depreciations and impairments that, directly or indirectly, can be attributed to the Group’s develop-ment activities.
Capitalisation of product develop-ment costs will only take place if the criteria are met. Development projects that are clearly defined and identified and where the technical utilisation, sufficient resources and a potential market or development opportunities can be documented, and where the Group intends to manufacture, market or use the product commercially, are recognised under intangible assets. Normally, these criteria are met late in the development phase.
Product development costs that meet the criterion for recognition in the balance sheet are measured at cost, incl. indirectly incurred costs. Borrowing costs from specific and general borrowings that concern the development of development projects and where the project is commenced after the transition to IFRS are also recognised under the cost.
Product development costs that do not meet the criterion for capitalisation in the balance sheet and research costs are recognised in the income statement on an ongoing basis.
Sales and distribution costsCosts incurred for the sale and distribution of goods sold over the course of the year and for promotional campaigns, etc. during the year, are recognised as sales and distribution costs. Costs relating to sales staff, impairments of amounts receivables, costs relating to sponsorships, advertising and exhibits and depreciation and impairments are also recognised as sales and distribution costs.
Administrative and joint costsAdministration and joint costs comprise costs incurred over the course of the year relating to management and administration, including costs relating to administrative personnel, office premises and office costs as well as depreciations and impairments.

38
arla fOODS
Other operating income and other operating costsOther operating income and costs comprise accounting items secondary to the Group's principal activities. These items comprise gains and losses related to the divestment of intangible and property, plant and equipment, etc.
Net working capital
InventoriesInventories are measured at cost according to the FIFO method. Where the cost exceeds the net recoverable amount, the amount is written down to this lower amount. The net realisable value is established taking into account the inventories’ negotiability, market-ability and estimate of the sales price, less completion costs and costs incurred to execute the sale.
The cost of raw materials and consumables as well as commercial goods includes the purchase price plus delivery costs. The on-account price for Arla Goods amba’s members is used as the purchase price for member-delivered milk that is recognised in the inventories.
The cost of goods in progress and manufactured goods consist of raw materials and consumables’ purchase price plus processing costs and other costs that are, directly or indirectly, attributable to the individual goods. Indirect produc-tion costs include costs relating to indirect materials and wages as well as depreciation of production plants, etc.
Trade receivablesTrade receivables are recognised at amortised cost, less impairments as provision for losses measured on the basis of an individual assess-ment or impairment in groups at portfolio level. Major receivables are assessed on an individual basis.
If there are no objective signs of value impairment, an assessment is made at portfolio level of receiva-bles in equivalent markets on the basis of the receivables’ age and maturity profile as well as historical record of losses. Impairments are measured as the difference between the carrying amount and the present value of anticipated cash flows. Amortised cost substantially corresponds to nominal values.
Trade payablesTrade payables are measured at amortised cost, which usually corresponds to the nominal amounts.
Net interest-bearing debt and related financial items
Financial income and financial costsInterest income and costs as well as capital gains and losses, etc. are recognised in the income statement at the amounts that can be attributed to the fiscal year.
Additionally, financial items comprise realised and unrealised value adjustments of securities and foreign currencies, amortisation of financial assets and liabilities as well as the interest portion of financial lease payments. Additionally, realised and unrealised gains and losses on derivative financial instruments are included that are not classified as hedging contracts.
Borrowing costs from general borrowing or loans that directly relate to the acquisition, construc-tion or development of qualified assets are attributed to the cost of such assets, when the acquisition, construction or the development of the asset is commenced after the transition to IFRS.
Securities (short-term) Short-term securities consist primarily of listed Danish bonds, which are continuously monitored, measured and reported at fair value in accordance with the Group’s investment policy. On initial recognition, securities are measured at fair value plus transaction costs at the trade date, and subsequently they are measured at fair value. Changes in the fair value are recognised in the income statement under financials.
Cash and cash equivalentsCash and cash equivalents consist of readily available cash and deposits in banks. Cash and cash equivalents are stated in the foreign currency translated to the foreign exchange rate at the reporting date. Cash in the cash flow statement is cash and cash equivalents as well as exchange listed bonds for which there are only insignificant risks of changes in value.
Non-current liabilitiesPayable to mortgage banks and credit institutions, etc. as well as issued bonds are recognised related to borrowings at fair value, less incurred transaction costs. In subsequent periods, the financial liabilities are recognised at amortised cost, corresponding to the capitalised value applying the effective interest approach. Correspondingly, the difference between the proceeds and the nominal value are recognised in the income statement as financial income or costs over the life of the loan.
Additionally, the capitalised residual lease obligation on financial leases is recognised under payables to credit institutions. The leasing payment’s interest portion is recognised over the lease agreement’s life in the income statement.
LeasingLease contracts are divided into financial leasing and operational leasing in the accounts. Leasing of property, plant and equipment where the Group retains all the material risks and benefits associated with the ownership is classified as financial leasing. All other lease agreements are classified as operational leasing.
On initial recognition, financial leasing is recognised in the balance sheet at the lowest value of the fair value or present value of the future leasing payments. When computing the present value, the discount rate represents the lease agreement's implicit interest rate or an approximated value for this.
Finance leases are depreciated subsequently like the Group's other property, plant and equipment.
Operational lease payments are recognised in the income statement on a straight-line basis over the lease agreement’s life.
Derivative financial instrumentsIn acquiring financial instruments, Management assesses whether the instrument will be an effective hedge for recognised assets and liabilities, expected cash flows or financial investments. The effectiveness of recognised hedging instruments is assessed at least
every quarter, and any ineffective-ness is recognised in the income statement.
Derivative financial instruments are recognised from the trade date and measured in the balance sheet at fair value. Positive and negative fair values of the derivative financial instruments are recognised as separate items in the balance sheet. Offsetting of positive and negative values is only performed when the Group has the right and the intention to settle multiple financial instruments net. The fair value is determined on the basis of current market data and generally recognised valuation methods.
Fair value hedgingChanges in fair value of derivative financial instruments, which are classified as and meeting the criteria for hedging the fair value of recognised assets and liabilities, are recognised together with changes in the value of the hedged asset or the hedged liability with respect to the portion that is hedged.
Cash flow hedgingChanges in the fair value of derivative financial instruments that are classified as and meeting the conditions for hedging future cash flows, and that effectively hedge changes for future cash flows are recognised under other comprehen-sive income in a special reserve for hedging transactions under equity, until the hedged cash flows affect the income statement. Income and costs relating to such hedges are transferred from other comprehen-sive income when the hedged cash flows are realised and recognised under the same accounting item as the hedged item.
If the hedging instrument no longer meets the criteria for hedge accounting, the hedge will cease from that point onward. When the hedged cash flows affect the statement of income, the cumula-tive value change recognised in other comprehensive income is transferred to the statement of income.
If the hedged cash flows are no longer expected to be realised, the cumulative value change is immediately transferred to the statement of income.

39
Half year rePOrT fOr 2012 NOTeS
Net investment hedgingChanges to the fair value of derivative financial instruments that are used to hedge net investments in foreign subsidiary and associated enterprises as well as joint ventures, and that effectively hedge against foreign exchange rate changes in these enterprises, are recognised in other comprehensive income under a special reserve for foreign exchange rate adjustments.
Other derivative financial instrumentsChanges to the fair value of derivative financial instruments that do not meet the conditions for treatment as hedging instruments, are recognised on a continuing basis in the income statement under financial income and financial costs.
Other areas
Intangible assetsGoodwillOn initial recognition, goodwill is recognised at cost as described under ‘Business combinations.” At the transition to IFRS, the carrying amount for goodwill on 1 January 2011 is considered the new cost for goodwill under IFRS. Goodwill is subsequently measured at cost less any accumulated impairment losses. The carrying amount of goodwill is allocated to the Group’s cash flow generating entities that follow the management structure and internal financial management.
Licenses and trademarks, etc.A license is an authorisation used the material for which a license is granted. A trademark is a character-istic or mark used by an enterprise to indicate that the products or services with which the trademark is shown originate from a unique source, and it is used to differentiate the enterprise’s products or services from those of other enterprises.
Licenses and trademarks, etc. are amortised applying the straight-line approach, however with a maximum of 20 years.
IT developmentIT development is the use of studies or other knowledge to plan or design the development of new or significantly improved IT processes, systems or services before they are used commercially. For IT develop-ment, primarily external costs are
recognised that are incurred for the establishment of the Group's IT systems.
IT development is depreciated on a straight-line basis over five to eight years.
Property, plant and equipmentProperty, plant and equipment are measured at cost less accumulated depreciation and impairments. Plants under construction, land and decommissioned plants are not depreciated.
Cost priceThe cost price comprises the acquisition price as well as costs directed associated with the acquisition price until such time as the asset in entered into use. The cost price also includes added costs for dismantling and disposal of the asset as well as re-establishment to the extent the related expected costs are recognised as a provision. For self-constructed assets, the cost price comprises direct and indirect costs relating to materials, components, payroll, etc. and the borrowing costs from specific and general borrowing that directly concerns the construction of assets whose construction is commenced after the transition to IFRS.
Subsequent costs are recognised under the carrying amount of the asset when it is likely that incurring the cost will result in financial benefits for the Group. The parts that are replaced are eliminated from the statement of financial position and the carrying amount is transferred to the statement of income. Other costs for, e.g. general repair and maintenance, are recognised in the statement of income when incurred.
The cost price of a combined asset is divided into separate components, which are depreciated individually if the useful life of the asset of the individual components are different. DepreciationProperty, plant and equipment are depreciated on a straight-line basis from the time of acquisition or entry into use based on an assessment of the anticipated useful life. The estimated useful lives are as follows:• Office buildings—50 years• Production buildings—20–30 years• Technical facilities and machinery
—5–20 years
• Other fixtures and fittings, tools and equipment—3–7 years
The depreciation base is measured taking into account the residual value of the asset and reduced by the impairments made. The residual value is determined at the date of acquisition and is revalued annually. Depreciation ceases when the carrying amount is lower than the residual value. Changes during the depreciation period or residual value are treated as changes to the accounting estimates.
Depreciations, to the extent they do not form part of the cost price for self-constructed assets, are recognised in the statement of income as cost of production, sale and distribution costs as well as administrative and joint costs.
Gains and losses are defined as the difference between the sales price, less costs to sell and the carrying value at the time of sale.
Other non-current assetsInterests in joint ventures and associated enterprisesInterests in joint ventures and associated enterprises are recognised in the statement of financial position according to the equity method with the propor-tional share of the enterprises’ net assets calculated in accordance with the Group’s accounting policy. Goodwill relating to joint ventures and associated enterprises is recognised under, respectively, “Investments in joint ventures” and “Investments in associates.”
Joint ventures and associates with a negative equity value are measured at zero and any receivable from these enterprises are depreciated at the Group's portion of the negative equity value to the extent it is deemed to be uncollectible. If the negative equity value exceeds the receivable, the remaining amount is recognised under provisions to the extent the Group has a legal or constructive obligation to cover the negative balance.
The proportional share of the results after tax for joint ventures and associated enterprises are recognised in the Group's income statement.
Other securities and equity interests, etc. Other securities and equity interests, etc. available for sale are measured at fair value at the reporting date. Changes in the fair value are recognised in equity. The fair value of listed securities is recognised as current sales prices at the reporting date. Assets for which there is no active market are recognised at cost, unless a reliable valuation model is available.
Other securities under non-current assets primarily consist of bonds, where the Group intends to hold the securities to maturity. These are measured at fair value with value adjustment of shareholders’ interests (fair value option). Other bonds are classified as current assets.
ImpairmentGoodwill, intangible assets with an indefinable useful life and current development projects are impairment tested at least once annually, initially before the end of the acquisition year.
The carrying value of goodwill is impairment tested together with the other non-current assets in the cash flow generating entity to which the goodwill is allocated.
The carrying value of other non-current assets is valued annually for signs of impairment. An impairment test is carried out for individual assets or groups of assets when there are signs that their value may be impaired.
The assets are depreciated to the lower value of the recoverable value and the carrying value.
The recoverable amount for goodwill is recognised as the present value of the expected future net cash flows from the enterprises or activities to which the goodwill is linked.
The recoverable amount for other non-current assets is the highest value of the asset’s value in use and the market value (fair value), less expected disposal costs. The value in use is established as the present value of the expected future net cash flows from the use of the asset or the cash flow generating entity of which the asset is part.

40
arla fOODS
Impairment of goodwill is recognised on a separate line in the income statement and is not reversed.
An impairment loss of other non-current assets is recognised in the income statement under, respectively, production, sales and distribution as well as administrative and joint costs. Impairments made are reversed to the extent that the assumptions and estimates that led to the impairment have changed. An impairment loss is reversed only to the extent that the asset's carrying amount does not exceed the carrying amount that would have been determined, net of deprecia-tion or amortisation, if no impairment loss had been recognised.
Pension liabilities and similar non-current liabilities The Group has entered post-em-ployment pension plan agreements with a significant number of its employees. The post-employment pension plan agreements also cover the defined contribution plan agreements.
Defined contribution plansFor defined contribution plans, the Group pays fixed contributions to independent pension enterprises. The Group has no obligation to make additional payments.
Defined benefit plansDefined benefit plans are character-ised by the Group’s obligation to pay a specific payment as at the date the employee is pensioned, dependent on for example the employee's seniority and final salary.
The liability relating to defined benefit plans is measured annually by actuarial computation on the basis of assumptions regarding future developments in interest, inflation and average useful life, etc.
Costs for the year relating to defined benefit plans are based on actuarial computations.
The actuarially computed present values less the fair value of any plan assets are recognised in the statement of financial position under provisions for pension liabilities.
If the actuarial assumptions change, gains and losses are recognised as a result of this in other comprehen-sive income. When benefits relating to employees’ previous employment in the enterprise change, a change is made to the actuarial computation of the present value (historical cost). Historical costs are charged immediately to the extent the employees have already earned the right to the changed benefit.
Otherwise, it is recognised on an ongoing basis in the statement of income over the period the employees earn the right to the changed benefit.
The provision covers defined benefit plans primarily in the United Kingdom, Germany and Sweden.
ProvisionsProvisions comprise, among other things, insurance-related provisions, liabilities related to restructurings, onerous contracts and insurance policies, etc.
Provisions are recognised when the Group has a present legal or constructive obligation as a result of a past event and it is likely that economic benefits will be required to settle the obligation.
Provisions are measured at their net realisable value or their fair value on the basis of a best estimate of the expenses necessary at the reporting date to settle the obligation.
In measuring provisions, discounting of the costs necessary to settle the obligations is performed, if this has a material effect on the measure-ment of the obligation. A pre-tax discounting factor is used that reflects the community’s general interest level and the specific risks related to the obligation. The fiscal year’s change in the discount component is recognised under financial costs.
Costs relating to restructurings are recognised as liabilities when a detailed, formal plan for the restructuring is published no later than the reporting date for the persons affected by the plan. For acquisitions of enterprises, provisions for restructurings are recognised in the acquired enterprise only in the computation of goodwill when, at the acquisition
date, an obligation exists for the acquired enterprise.
A provision for onerous contracts is recognised when the expected benefits to be derived by the group from a contract are lower than the unavoidable cost of meeting its obligations under the contract.
Insurance provisions are recognised on the basis of the risk relating to future payments of losses, injuries or damages that have already occurred. Insurance provisions primarily cover provisions relating to occupational injuries.
TaxTax in the income statementTaxable income is assessed according to the national rules and regulations that apply to the enterprises. Tax is assessed on the basis of cooperation or corporate taxation. Cooperation taxation is based on capital while corporate taxation is based on the enterprise’s income for the year.
Tax for the year consists of the current tax for the year and changes in deferred tax for the year. The tax charged that relates to earnings for the year is recognised in the statement of income. The tax charged that relates to earnings and costs recognised in the equity is recognised directly in equity. There is proportional allocation of tax across jointly taxed enterprises.
Current and deferred taxesCurrent tax payables and receivables are recognised in the statement of financial position as tax, calculated on the taxable income for the year, adjusted for any tax from previous years' taxable income as well as for paid on-account taxes.
Deferred tax and related adjust-ments for year are calculated applying the balance-sheet liability method as the tax base of temporary differences between carrying amounts and the tax base of assets and liabilities.
Deferred tax assets, including the tax base of tax loss carry-forwards, are recognised under other non-current assets at the value at which they are expected to be used, either by elimination in the tax of future earnings or by offsets in deferred tax payables in enterprises
within the same legal tax entity or jurisdiction.
Deferred tax is measured on the basis of the tax rules and tax rates in the respective countries effective under the legislation at the reporting date when the deferred tax is expected to be realised.
Changes in deferred tax assets and liabilities as a result of changes in the tax rate are recognised in the comprehensive income for the year.
Other receivablesReceivables are recognised at amortised cost less depreciations for potential losses. Amortised cost substantially corresponds to nominal values.
Other liabilitiesPayables to joint ventures and associated enterprises as well as other payables are measured at amortised cost, which usually corresponds to the nominal amounts.
PrepaymentsPrepayments under assets comprise incurred expenses relating to subsequent fiscal years, including prepaid rent and insurance costs, etc. Prepayments are recognised at cost.
Prepayments recognised under liabilities comprise, among other things, payments received relating to income in subsequent years. Prepayments are measured at amortised cost, which usually corresponds to their nominal value.
Business combinationsRecognition date and considerationsNewly acquired enterprises are recognised in the consolidated financial statements as at the date of acquisition. The acquisition date is the point in time when Arla obtains actual control of the acquired enterprise.
The purchase consideration for an enterprise consists of the fair value of the agreed-upon consideration of transferred assets, liabilities incurred and equity instruments issued. Costs directly attributable to the acquisition are recognised in the statement of income as they are incurred. If an agreement relating to a business combination requires that the purchase consideration be adjusted in connection with future

41
Half year rePOrT fOr 2012 NOTeS
events or the performance of certain obligations, this portion of the purchase consideration is recognised at fair value as at the date of acquisition.
Changes in estimates relating to conditional purchase considerations are recognised in the results for the year.
Purchase methodIn connection with mergers and purchases of enterprises in which Arla Foods amba gain control of the acquired enterprise, the purchase method is applied according to which assets, liabilities and contingent liabilities of the newly acquired enterprises are measured at their fair value at the date of acquisition.
Identifiable intangible assets are recognised if they are separable or arise from a contractual right. The tax effect of the performed fair value adjustments of assets and liabilities are taken into account.
Positive balances between the purchase remuneration of the acquired interest, the value of minority interests in the acquired enterprise and the fair value of previously acquired capital interests, on the one hand, and the fair value of the acquired assets, liabilities and contingent liabilities on the other, are recognised under intangible assets as goodwill. Goodwill is not amortised but is tested at least annually for impairment. The initial test is performed before the end of the acquisition year. In connection with the acquisition, goodwill is attributed to the cash flow generating entities that will subsequently for the basis for impairment tests.
Negative balances (negative goodwill) are recognised in the results for the year at the time of acquisition.
If, at the time of acquisition, there is uncertainty relating to the identification or measurement of acquired assets, liabilities or contingent liabilities or the determination of the purchase consideration, initial recognition takes place on the basis of their preliminarily determined value. If, subsequently, it is found that identification or measurement of the purchase consideration,
acquired assets, liabilities or contingent liabilities was incorrect upon initial recognition, the statement is adjusted retrospec-tively, including goodwill, until 12 months after the acquisition and the comparative figures are adjusted. After this point in time, goodwill is not adjusted.
DivestmentProfits or losses in connection with the divestment or winding down of subsidiary or associated enterprises are measured as the difference between the divestment sum or the winding down sum and the carrying amount of the net assets at the time of divestment, including goodwill and costs relating to divestment or winding down. Profits and losses are recognised in the statement of income under proceeds related to the divestment of enterprises, etc.
Assets held for saleAssets held for sale comprise non-current assets and divestment groups held for sale. Divestment groups are groups of assets that must be divested together in case of a divestment or similar action in a single transaction. Liabilities related to assets held for sale are liabilities directly linked to these assets that will be transferred as part of the transaction. Assets are classified as “held for sale” when their carrying value will be recovered primarily through a divestment within 12 months in accordance with a formal plan instead of through continued use.
Assets and divestment groups held for sale are measured at the lower of the carrying value at the classification date as “held for sale” of the fair value, less costs to sell. Assets are not depreciated or amortised as at the time they are classified as “held for sale.”
Impairments that arise at the initial classification as “held for sale” and any profit or loss in connection with subsequent measurement at the lower value of the carrying value or fair value, less costs to sell, are recognised in the statement of income under the items to which they pertain. Gains and losses are disclosed in the notes.
Assets and related liabilities are shown on separate lines in the statement of financial position, and the principal items are specified in the notes. Comparative figures in the statement of financial position are not adjusted.
Government subsidiesGovernment subsidies comprise subsidies and financing of development projects as well as investment subsidies, etc. Public subsidies are not recognised until there is reasonable certainty that the subsidies will be received. Subsidies for costs, etc. recognised directly in the statement of income are recognised as other operating income. Subsidies from the EU and other government bodies relating to assets and development projects recognised in the statement of financial position are deducted from the acquisition sum. Forgivable subsidies are recognised as liabilities until it is highly likely that the conditions for cancellation are met.
Financial ratios
Net interest-bearing debtCurrent interest-bearing liabilities —Securities, cash and cash equivalents and other interest-bearing assets + Non-current liabilities. Net interest-bearing liabilities cannot be derived directly from the balance sheet.
Net working capital:Inventories + Trade receivables – Trade payables
Leverage:Net interest-bearing
liabilities, including pension liabilities
EBITDA
Interest cover:EBITDA
Interest costs, net
Solvency ratio:Equity
Statement of financial position, sum
Organic growth:Growth in revenues adjusted for acquisitions, divestments, foreign exchange rate changes as well as changes in the accounting policy.
Performance price:Average on-account price paid out (standardised at 4.2% fat/3.4% protein) + results for the year translated to DKK per kg. member milk
EBITDA = Earnings before interest, taxes, depreciation, and amortisa-tion.
1.2. EsTiMATEs AND UNcERTAiNTiEs
In preparing the interim financial statements, Management makes various estimates and assumptions, which will form the basis for the presentation, recognition and measurement of the Group’s assets and liabilities. The most important accounting estimates and assess-ments for the interim report 2012 Half-year Report are the same as the ones made in the preparation of the consolidated financial statements at 31 December 2011. The estimates and assumptions made about future events are based on previous experiences and other factors, which are assessed by Management as being reasonable, but which by the nature are uncertain. The assumptions may be incomplete or imprecise, and unexpected events or circumstances may arise.
Sometimes it is necessary to change precious estimates based on changes in the circumstances on which they were based or if new information has come to light or because of subsequent events. Changes in accounting estimates are recognised in the reporting period during which the change occurs and also in future reporting period, if the change affects both the period during which it occurred and subsequent reporting periods.

42
ARLA FOODS
Description of changes to accounting policy in connection with the transition to IFRS
1. Goodwillisnolongeramortisedin the income statement. Instead, the Group performs annual impairment tests and testswhenthereareindicationsof a need for impairments. Goodwill is also tested at the transitiontoIFRS.Untilthispointintime,goodwillhasbeenamortisedonastraight-linebasisoveritseconomiclife,butnolonger than 20 years. At the transitiontoIFRS,theGrouphasexercisedtheexemptionprovision of IFRS 1, which provides the opportunity to use the carrying value of goodwill as the new cost price in the openingbalancesheetasat1January 2011.
2. Previously,pensionliabilitieswererecognisedbyapplyingthecorridor approach. In its transitiontoIFRS,Arlahasdecided to recognise the pension liabilityfullyinthebalancesheetwith all future actuarial gains and losses directly under comprehensive income. Pension liabilitiesremainrecognisedunderIAS19but,unlikepreviously, include taxes related to the pension plan.
3. UnderIAS1,minorityinterestsmustbeincludedaspartoftheequity and as part of the results fortheyear.UndertheDanishFinancial Statements Act, minority interests placed as separated items not included in equity and the results for the year. The recognised minority as at 1 January 2011 has also increasedbyDKK37millionasa
result of the changed extent of the consolidationofsubsidiaries.4. Expected supplementary
payments are regarded as dividends, which in accordance withIAS1areclassifiedunderequityuntilapprovedbytheboardofrepresentatives.
5. ExpectedpaymentstoretiredmembersarepresentedunderequityuntilapprovedbytheBoardofRepresentatives.
6. Restructuring costs, previously recognised as part of the purchasepriceallocationinconnectionwithbusinesscombinations,arerecognisedinthe income statement under IFRS as they are incurred, which reduced the previously recognised goodwill.
7. Negativegoodwillinnolongerrecognisedinthebalancesheet,butisrecognisedasincomeimmediately in the income
statement. The recognised negativegoodwillisreversedover the equity as at 1 January 2011.
8. Expected supplementary payments are regarded as dividends and are therefore not included in the cost price in the inventory.
9. Putoptionsforpurchasesofputoptionsforpurchasesofminorityitems are recognised under IFRS asaliabilityinthebalancesheet.Theliabilityismeasuredonanongoingbasistofairvaluewithvalue adjustments in the income statement.
10. Other adjustments contain, amongotherthings,transactioncoststhathavebeenrecognisedpreviously as part of the purchasepriceforbusinesscombinationsaswellasvalueadjustmentsoffinancialassetsavailableforsale.
1.3. DESCRIPTION OF THE ACCOUNTING EFFECT OF THE TRANSITION TO IFRS
Theaccountingpolicydescribedinsection1.1hasbeenappliedtothepresentedfinancialfigures,i.e.the
figuresfortheperiodasat30June2012,theopeningfinancialpositionas at 1 January 2011 and compara-tivefiguresasat30June2011,respectively,at31December2011.Theopeningfinancialpositionat1January 2011 was prepared as if
thesepoliciesandinterpretationshadalwaysbeenapplied,withtheexceptionofthespecialprovisionsrelatingtothetransitionandentryintoforcedescribedinthefollowing.
IAS1regardingpresentationof
comprehensive income is early adopted.
Theconsolidatedeffectintheincomestatements,balancesheetandcashflowsisshownintheoverviewbelowwithexplanatorynotes:
EFFECT OF TRANSITION TO IFRS 1 JANUARy 2011 30 JUNE 2011 31 DECEmbER 2011
(mDKK) ASSETS LIAbILITIES EqUITyPROFIT FOR ThE PERIOD ASSETS LIAbILITIES EqUITy
PROFIT FOR ThE PERIOD ASSETS LIAbILITIES EqUITy
IN ACCORDANCE wITH THE DANISH FINANCIAl STATEmENTS ACT 30,097 21,517 8,580 506 32,492 23,177 9,315 1,332 34,903 25.575 9,328
Goodwill 1 126 126 126 252 252 252
Pensionliabilities 2 305 -305 6 299 -299 11 758 -758
Minority interest 3 -153 153 -166 166 -168 168
Supplementary payments 4 -1,031 1,031 -491 491
Membersretiring 5 -56 56 -20 20
Restructuring costs 6 -57 -57 -57
Negativegoodwill 7 -117 117 -21 -96 96 -108 -11 11
Inventories 8 -35 -35 -35 -35 -2 -37 -37
Putoptionsforthepurchaseofnon-controllingitems 9 35 -35 35 -35 35 -35
Other adjustments 10 11 -11 -3 18 -18 -42 -34 41 -75
Taxeffectoftheaboveitems 11 82 82 -2 80 80 13 209 -9 218
Total adjustments 47 -1,006 1,053 106 171 90 81 67 333 135 198
In accordance with IFRS 30,144 20,511 9,633 612 32,663 23,267 9,396 1,399 35.236 25,710 9,526
Other comprehensive income -79 -827
TOTAl COmPREHENSIvE INCOmE 533 572

43
Half year rePOrT fOr 2012 NOTeS
Under the Danish Financial Statements Act, the bond portfolio is measured at fair value with changes made directly in the income statement. Under IFRS, the bond portfolio is classified as financial assets available for sale that are measured at fair value with value adjustments over other comprehensive income. The related financial liabilities were previously measured at fair value with changes in the statement of income. These are now measured at the amortised cost.
11. Deferred tax relating to changes made to the accounting policies is recognised and can largely be attributed pension liabilities.
In the transition to IFRS, Arla has re-estimated the useful life and residual life for the Group’s assets in connection with the breakdown of property, plants and equipment. The changed estimates will only have a minimal effect on depreciations over the coming years. This has not affected the 2011 results.
ReclassificationsIn addition to the change in account-ing policy, the following reclassifica-tions and changes in the presenta-tion form have been implemented with adapted 2011 comparative figures.• The assets are presented as
either non-current or current assets whereas previously they had been classified as property, plant and equipment or current assets.
• Provisions are no longer presented as a separate principal group in the statement of financial position but under non-current and current liabilities.
• Costs related to research and development are reclassified and presented in a separate line in the income statement.
• Under IFRS, investments in financial assets including bonds are classified only as cash and cash equivalents in the cash flow statement if the maturity at the time of acquisition does not exceed three months.
Applied mitigation measuresIn connection with the transition to IFRS, the Group has applied the following mitigation measures in IFRS 1:Borrowing costs In accordance with IFRS 1, Arla has omitted recognising borrowing costs for qualified assets, if construction was commenced before 1 January 2011.
Cumulative foreign exchange rate differences relating to investments in foreign enterprisesExchange rate adjustments in the translation of income statement and balance sheet for foreign entities are recognised as previously under other comprehensive income under a special reserve for exchange rate adjustments in the equity. As at 1 January 2011, in accordance with IFRS 1, the Group has decided to set this reserve at zero, so that only foreign exchange rate adjustments after 1 January 2011 will be separated under a special reserve under equity.
Business combinationsIn accordance with the mitigation options specified in IFRS 1, Arla Foods has decided to implement IFRS 3 prospectively for business combinations executed after the transition date. The carrying value of goodwill as at 1 January 2011 under the Group’s previous accounting policy is considered the new cost price for good will in the opening financial position. Value impairment testing of goodwill at the time of transition has not given rise to impairment of the recognised goodwill, since the recoverable amount exceeds the carrying amount of the goodwill.
NOTE 2. OPERATiNG PROfiT
NOTE 2.1. REvENUE 1. hAlf-yEAR 2012 1. HAlF-yEAR 2012 1. HAlF-yEAR 2011 fUll yEAR 2011
(mDKK) ORGANIC GROWTH
Revenue split by Business group/market
consumer:
United Kingdom 7.0% 6,951 6,166 12,751
Sweden -0.9% 5,796 5,177 10,668
finland 10.1% 1,189 1,084 2,250
Denmark 4.1% 3,403 3,268 6,766
Germany 20.0% 2,858 1,687 4,443
Netherlands -3.0% 759 795 1,574
Core markets 4.4% 20,956 18,177 38,452
Growth markets 19.0% 2,311 1,865 3,786
Value markets -3.2% 1,993 2,051 4,014
Others n/a 4,651 4,570 8,641
Total revenue 2.8% 29,911 26,663 54,893
(continues)
This note focusses on the Group’s performance. Among the specifications, there are disclosures about the split of revenue by business groups and product categories. Organic growth for revenues is defined as the increase in revenues adjusted for the influence of acquisitions and mergers as well as foreign exchange.
The note also contains disclosures about total costs relating to milk, which is the biggest cost item in Arla's financial statements by far. The note details weighing from owners as well as other contract suppliers. The total cost is the paid on-account milk price. Supplementary payments arise as part of the Group’s distribution of profit and therefore are not included in the costs.

44
arla fOODS
financial review - revenuesRevenue has increased by 12.2%, of which 2.8% is organic growth. The remaining growth was primarily attributable to the acquisitions and mergers executed over the course of 2011.
Core markets still represent 70% of total revenues. The markets were stagnant but were lifted by executed price increases in the first half-year 2012, which maintain the organic growth of 4.4%. The emerging markets led by Russia, the Middle East and North Africa have realised organic revenue growth of 19% driven by increases in both quantities and prices. Other revenue is primarily related to whey activities in Arla Foods Ingredients (AFI) as well as trading. The trading share fell somewhat compared to last year as a result of greater marketing of value-added products, which generate higher earnings.
The distribution of revenue across product categories shows an increase in all product categories. Fresh products is the biggest product category. It contains primarily drinking milk, cream and
yoghurt. The volumes for drinking milk and cooking are increasing, which is especially a result of the executed mergers and acquisitions in 2011 in Germany and Sweden. Cheese is primarily divided into yellow cheese and spread cheese, but especially the volumes for white cheese is on the rise. For butter and mixed products the growth is also primarily owing to mergers and acquisitions in 2011. However, generally, the biggest growth is in private label products—and branded products are still under pressure.
financial review - costsTotal costs for milk as an item covers both the on-account price of milk weighed-in from owners and the cost for milk from other suppliers. Total milk costs have risen by 9.8%, while revenue have increased roughly equivalently. The current price for the Arla listing (on-account price) for milk rose in the last six months of 2011 and then declined again in the first half year 2012. In the first six months of 2012, the average current price stood at DKK 2.47 compared to DKK 2.54 for the first half year 2011.
The weighing-in of milk in Sweden and Germany has increased as a result of the mergers with Hansa and Milko in 2011. The weighing-in in each country is controlled by milk quotas and therefore only rises or falls within the general quota range unless changes take place in the structure, such as in the case of the mergers in 2011. The weighing-in from other suppliers is primarily derived from the United Kingdom.
Other costs are managed tightly. As part of the effort to secure a robust cost position, efficiency improve-ment programmes have been launched:1. A smooth and more efficient
organisation will be created by clarifying roles and responsibili-ties. Dual functions will be eliminated, which will result in a reduction of the number of jobs.
2. For Consumer Denmark, the volume will be increased as earnings are maintained within the fresh milk market.
3. Logistics will be optimised for Consumer Sweden and the costs will thereby be reduced.
4. For Global Procurement, savings will be made by exploiting economies of scale as well as reducing costs across categories.
5. In what is an initiative for the longer term, Operational Excellence will identify new, more efficient solutions for Arla’s locations of operation.
All these projects have been launched and the effort to attain targeted sustained savings of DKK 500 million is well on its way. However, the results from changes made are not expected to materialise until 2013.
NOTE 2.1. REvENUE (continued) 1. HAlF-yEAR 2012 1. HAlF-yEAR 2011 fUll yEAR 2011
(mDKK)
Revenue split by product category
Fresh dairy products 12,296 10,607 22,370
Cheese 7,123 6,295 13,206
Butter and spreads 4,140 3,563 7,614
Other 6,352 6,198 11,703
Total revenue 29,911 26,663 54,893
NOTE 2.2. OMKOsTNiNGER 1. HAlF-yEAR 2012 1. HAlF-yEAR 2011 fUll yEAR 2011
(mDKK)
cost of raw milk 14,026 12,769 27,390
Inflow of raw milk:
Owners in Denmark 2,242 2,174 4,320
Owners in Sweden 1,068 914 1,819
Owners in Germany 245 124 369
Other 1,448 1,340 2,733
Total million kg milk weighed in by the group 5,003 4,552 9,241
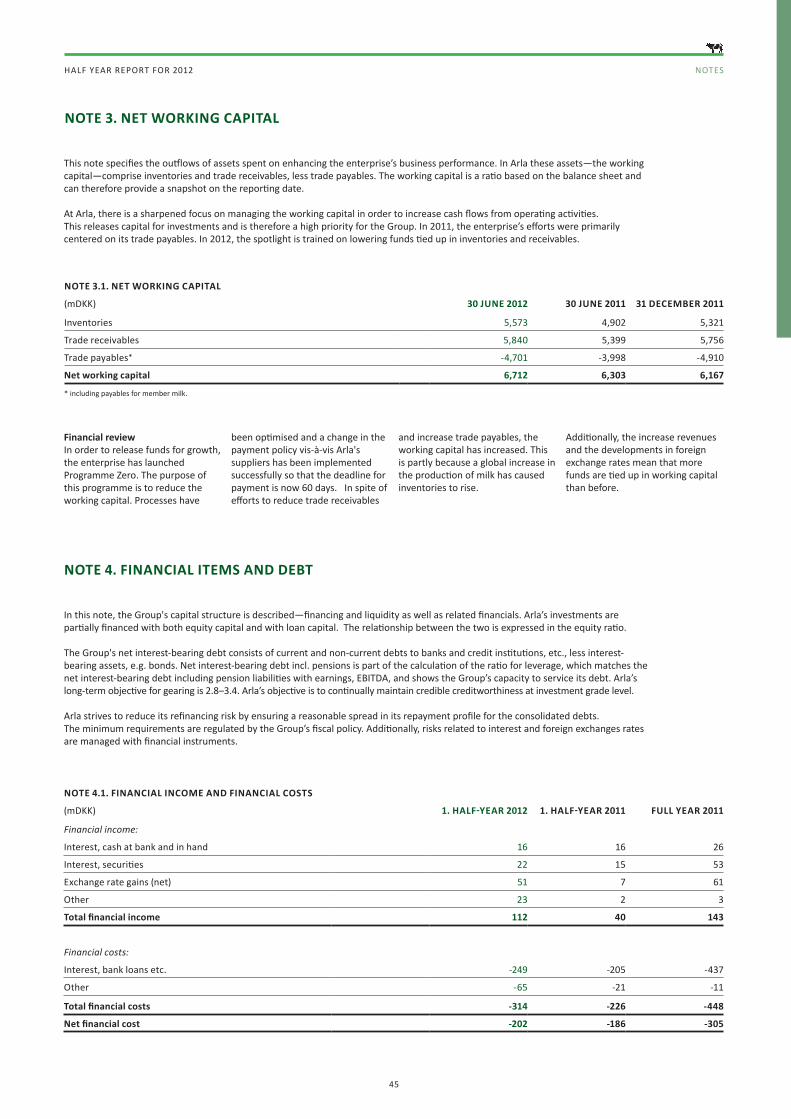
45
Half year rePOrT fOr 2012 NOTeS
NOTE 3. NET wORKING CAPITAl
financial reviewIn order to release funds for growth, the enterprise has launched Programme Zero. The purpose of this programme is to reduce the working capital. Processes have
been optimised and a change in the payment policy vis-à-vis Arla's suppliers has been implemented successfully so that the deadline for payment is now 60 days. In spite of efforts to reduce trade receivables
and increase trade payables, the working capital has increased. This is partly because a global increase in the production of milk has caused inventories to rise.
Additionally, the increase revenues and the developments in foreign exchange rates mean that more funds are tied up in working capital than before.
NOTE 3.1. NET wORKING CAPITAl
(mDKK) 30 JuNE 2012 30 JuNE 2011 31 DECEMbER 2011
Inventories 5,573 4,902 5,321
Trade receivables 5,840 5,399 5,756
Trade payables* -4,701 -3,998 -4,910
Net working capital 6,712 6,303 6,167
* including payables for member milk.
This note specifies the outflows of assets spent on enhancing the enterprise’s business performance. In Arla these assets—the working capital—comprise inventories and trade receivables, less trade payables. The working capital is a ratio based on the balance sheet and can therefore provide a snapshot on the reporting date.
At Arla, there is a sharpened focus on managing the working capital in order to increase cash flows from operating activities. This releases capital for investments and is therefore a high priority for the Group. In 2011, the enterprise’s efforts were primarily centered on its trade payables. In 2012, the spotlight is trained on lowering funds tied up in inventories and receivables.
NOTE 4. fiNANciAl iTEMs AND DEBT
NOTE 4.1. fiNANciAl iNcOME AND fiNANciAl cOsTs
(mDKK) 1. HAlF-yEAR 2012 1. HAlF-yEAR 2011 fUll yEAR 2011
Financial income:
Interest, cash at bank and in hand 16 16 26
Interest, securities 22 15 53
Exchange rate gains (net) 51 7 61
Other 23 2 3
Total financial income 112 40 143
Financial costs:
Interest, bank loans etc. -249 -205 -437
Other -65 -21 -11
Total financial costs -314 -226 -448
Net financial cost -202 -186 -305
In this note, the Group's capital structure is described—financing and liquidity as well as related financials. Arla’s investments are partially financed with both equity capital and with loan capital. The relationship between the two is expressed in the equity ratio.
The Group's net interest-bearing debt consists of current and non-current debts to banks and credit institutions, etc., less interest-bearing assets, e.g. bonds. Net interest-bearing debt incl. pensions is part of the calculation of the ratio for leverage, which matches the net interest-bearing debt including pension liabilities with earnings, EBITDA, and shows the Group’s capacity to service its debt. Arla’s long-term objective for gearing is 2.8–3.4. Arla’s objective is to continually maintain credible creditworthiness at investment grade level.
Arla strives to reduce its refinancing risk by ensuring a reasonable spread in its repayment profile for the consolidated debts. The minimum requirements are regulated by the Group’s fiscal policy. Additionally, risks related to interest and foreign exchanges rates are managed with financial instruments.

46
arla fOODS
NOTE 4.2. NET INTEREST-bEARING DEbT
(mDKK) 30 JuNE 2012 30 JuNE 2011 31 DECEMbER 2011
Securities and cash funds -4,504 -4,484 -4,592
Other interest-bearing assets -388 -301 -493
Short-term liabilities 6,750 6,319 5,948
Net short-term liabilities 1,858 1,534 863
Long-term liabilities 11,451 8,837 9,157
Net interest-bearing debt excl. pensions 13,309 10,371 10,020
Pensions 2,645 1,713 2,223
Net interest-bearing debt incl. pensions 15,954 12,084 12,243
NOTE 4.3. lOANS ObTAINED / REPAID
(mDKK) lOAN, NOMiNAl MATURiTy fixED/vARiABlE
iNTEREsT 30 JuNE 2012
Obtained DKK, 1. half-year 2012 300 2013 variable 301
Obtained EUR, 1. half-year 2012 193 2013 variable 194
Obtained DKK, 1. half-year 2012 500 2015 variable 501
Obtained EUR, 1. half-year 2012 193 2015 variable 194
Obtained DKK, 1. half-year 2012 350 2017 variable 350
Obtained EUR, 1. half-year 2012 193 2017 variable 194
There is no repayment of loans in the first half of 2012.
(mDKK) lOAN, NOMiNAl MATURiTy fixED/vARiABlE
iNTEREsT 30 JuNE 2011
Obtained DKK, 1. half-year 2011 666 2038 variable 666
Obtained DKK, 1. half-year 2011 648 2038 variable 648
Obtained SEK, 1. half-year 2011 1,150 2016 fixed 932
Obtained SEK, 1. half-year 2011 350 2016 variable 284
Repaid DKK, 1. half-year 2011 1,000 n/a fixed 1,000
Repaid DKK, 1. half-year 2011 127 n/a variable 127
Repaid DKK, 1. half-year 2011 110 n/a variable 110
(mDKK) lOAN, NOMiNAl MATURiTy fixED/vARiABlE
iNTEREsT 31 DECEMbER
2011
Repaid SEK, 2. half-year 2011 350 n/a variable 288
There is no loans obtained in the second half of 2011.

47
Half year rePOrT fOr 2012 NOTeS
NOTE 4.5. lIquIDITy RESERvES
(mDKK) 30 JuNE 2012 30 JuNE 2011 31 DECEMbER 2011
Cash refunds 480 381 504
Securities (free cash flow) 140 9 138
Unutilised committed loan facilities 63 1,333 1,177
Unutilised other loan facilities 2,740 4,256 3,359
Total 3,423 5,979 5,178
NOTE 4.4. NET INTEREST-bEARING DEbT, MATuRITy (NuMbER OF yEARS AFTER THE bAlANCE SHEET DATE)
(mDKK)
30 June 2012 Total 0-1 1-2 2-3 3-5 5-7 7-10 10+
DKK 7,126 266 -93 357 326 378 508 5,384
EUR 1,550 103 557 -7 558 352 -13 -
GBP 2,040 474 - - 1,566 - - -
SEK 2,207 904 15 - 1,269 7 - 12
Other 386 382 - 3 - - - 1
Total 13,309 2,129 479 353 3,719 737 495 5,397
30 June 2011 Total 0-1 1-2 2-3 3-5 5-7 7-10 10+
DKK 6,009 1 39 86 155 315 1,263 4,150
EUR 1,002 46 8 576 361 7 4 0
GBP 426 79 13 303 29 2 0 0
SEK 2,657 1,416 15 0 1,214 0 0 12
Other 277 -6 1 278 0 1 0 3
Total 10,371 1,536 76 1,243 1,759 325 1,267 4,165
31 December 2011 Total 0-1 1-2 2-3 3-5 5-7 7-10 10+
DKK 5,756 -227 87 87 232 299 1,465 3,813
EUR 887 -63 8 574 15 353 0 0
GBP 554 54 14 486 0 0 0 0
SEK 2,439 1,126 20 0 1,281 0 0 12
Other 384 69 1 312 0 1 1 0
Total 10,020 959 130 1,459 1,528 653 1,466 3,825
financial reviewThe net financials totalled DKK - 202 million compared to DKK -186 million in the first half year 2011. Interest cost levels on loans are higher but there are some rate gains. The higher interest cost levels on loans are primarily attributable to interest rate hedges and higher debt levels. The average interest rate for the half year stood at 3.2%, compared to 3.1% for the first half year 2011.
The Group’s debts rose toward the end of the half year with the raising of DKK 1.7 billion in new loans for the investment in China. These loans were obtained in late July and were not charged to the interest in the reporting period. The loans were obtained in DKK and EUR at floating interest rates. Some of the debt has been converted to fixed rate via interest rate swaps. The Group’s net interest-bearing debt incl. pensions increased from DKK 12,084 million to DKK 15,954 million, which is primarily attributable to an increase in the
pension debt in the United Kingdom as a result of the transition to IFRS and a lower discount rate, the investment in China and a generally high investment level.
The Group’s gearing has increased due to the new loans for invest-ments and has reached 4.5. This is above the Group’s long-term target. The equity ratio was also affected by the transition to IFRS, which has increased the recognised pension liabilities and by the investments. At 30 June 2012, the equity ratio stood at 24%.
The Group’s cash resources have been reduced from DKK 5,178 million as at 31 December 2011 to DKK 3,423 million as at 30 June 2012. The reduction took place as part of an effort to adjust the facilities' levels to a continued comfortable level but also taking into account the banks' enhanced capital requirements for undrawn credit facilities and related increased costs for the enterprise.

48
arla fOODS
NOTE 5.1. GOODwIll
(mDKK) 1. HAlF-yEAR 2012 1. HAlF-yEAR 2011 fUll yEAR 2011
Cost at 1 January 3,892 3,744 3,744
Opening adjustment during measurement period 20 - -
Exchange rate adjustments 89 -102 61
Additions - - 107
Cost at 30 June 4,001 3,642 3,912
Amortisation and impairment at 1 January 0 0 0
Amortisation and impairment at 30 June 0 0 0
Carrying amount at 30 June 4,001 3,642 3,912
NOTE 5.2. buSINESS COMbINATIONS
(mDKK)1. HAlF-yEAR 2011hANsA Milch AG
1. HAlF-yEAR 2011OThER
2. HAlF-yEAR 2011AllGäUlAND
2. HAlF-yEAR 2011MilKO
Intangible assets 130 47 4 20
Property, plant and equipment 415 39 137 131
Other assets 325 63 380 230
Provisions -33 -1 -80 -160
Liabilities -444 -40 -407 -211
Total acquired net assets 393 108 34 10
Goodwill 0 38 0 90
Purchase price 393 146 34 100
Cash in acquired company 0 0 -28 0
Issued capital -330 0 0 -51
Other payments -28 -4 -34 -49
Cash consideration transferred 35 142 -28 0
NOTE 5. OTHER AREAS
statement
Goodwill is largely unchanged compared to year-end 2011.
Hansa Milch was 100% merged into Arla on 1 April 2011. Arla paid DKK 35 mio. and issued DKK 116 mio. of contributed capital. Allgäuland and Milko was taken in 100% by 1 November 2011. The purchase price was DKK 34 mio. for Allgäuland. Arla paid DKK 100 mio. and issued DKK 51 mio. of contributed capital in the merger with Milko. The goodwill
recognised for Milko is expected to be deductable for income tax purposes. Other acquisitions consists of Boxholm mejeri, Sundsvall mejeri and Faurholt & Thrane.
The purchase price allocation for Milko has been adjusted in relation to the preliminary statement prepared for the 2011 annual Report. The adjustments include the adjustment of the value for trademarks as well as property, plant and equipment in connection with the dairy in Grådö that was
sold conditionally in the approval from the competition authorities. Additionally, impairment was performed to the expected sales price, less costs to sell for part of the acquired cheese storage facilities.
There were no impairment losses in respect of goodwill during the reporting period. A test was performed in connection with the transition to IFRS, which did not give rise to impairments.
There have not been any business combinations in the first half year 2012. The mergers that have been described were not carried out before 30 June 2012 and will not be recognised until the competition authorities have approved them.
The investment in China of DKK 1,750 million is not related to a subsidiary enterprise but has been recognised as an associated enterprise.
This note details specifications of goodwill as well mergers and acquisitions.

49
Half year rePOrT fOr 2012 NOTeS
financial highlights
(mDKK)1. HAlF-yEAR
20121. HAlF-yEAR
2011fUll yEAR
2011
Performance price
DKK per kg cooperative owner milk 2.64 2.74 2.81
SEK per kg cooperative owner milk 3.32 3.73 3.75
EUR-cent per kg cooperative owner milk 34.7 36.6 37.4
Inflow of raw milk:
Owners in Denmark 2,242 2,174 4,320
Owners in Sweden 1,068 914 1,819
Owners in Germany 245 124 369
Other 1,448 1,340 2,733
Total million kg milk weighed in by the group 5,003 4,552 9,241
Key figures
Net revenue 29,911 26,663 54,893
Operating profit 669 715 1,723
Net financials -202 -186 -305
Net profit for the year 513 612 1,399
Total assets 38,319 32,569 35,146
Total fixed assets 21,545 17,109 18,741
Total current assets 16,774 15,460 16,405
Equity 9,127 9,396 9,526
Total long-term liabilities 14,580 10,880 11,715
Total short-term liabilities 14,612 12,293 13,905
Cash flow from operating activities 818 138 2,301
Cash flow from investing activities -3,283 -1,024 -2,482
Cash flows from financing activities 2,432 784 245
Financials ratios
leverage 4.5 3.5 3.5
Interest cover 8.9 8.3 9.9
Solvency ratio 24% 29% 27%

50
arla fOODS
ARlA fOODs UNiTED KiNGDOMArla Foods UK plc 4 Savannah Way,Leeds Valley Park,Leeds, LS10 1 AB,englandTel. +44 113 382 7000Fax +44 113 382 7030www.arlafoods.co.ukRegistered in England no: 3487778
ARlA fOODs DANMARKArla Foods amba Sønderhøj 14,DK-8260 Viby J.Telefon +45 89 38 10 00Telefax +45 86 28 16 91E-post [email protected]: 25 31 37 63