half-year financial report - groupe psa · in latin america, group's sales grew by 8.5%, with...
TRANSCRIPT

20
17HALF-YEAR FINANCIAL
REPORT


2017 Interim results
CONTENTS
I. MANAGEMENT AND SUPERVISORY BODIES
AT 30 JUNE 2017 2
II. INTERIM MANAGEMENT REPORT 3 1. The Group’s operations ...................................................................................................................... 3
2. Analysis of consolidated interim operating results ............................................................................. 4
3. Financial position and cash ................................................................................................................. 7
4. Risk factors and uncertainties ............................................................................................................ 8
5. Related party transactions .................................................................................................................. 8
III. CONDENSED INTERIM CONSOLIDATED FINANCIAL STATEMENTS AT 30 JUNE 2017 9
Interim Consolidated Statements of Income .......................................................................................... 10
Interim Consolidated Comprehensive Income ....................................................................................... 12
Interim Consolidated Balance Sheets .................................................................................................... 14
Interim Consolidated Statements of Cash Flows ................................................................................... 16
Interim Consolidated Statement of Changes in Equity .......................................................................... 18
Notes to the Interim Consolidated Financial Statements ....................................................................... 19
IV. PERSONS RESPONSIBLES FOR THE 2017 INTERIM FINANCIAL REPORT 41
V. STATUTORY AUDITORS’ REVIEW REPORT ON THE 2017 HALF-YEARLY FINANCIAL INFORMATION 42
PSA Group Half-Year Financial Report 2017 - 1

I. MANAGEMENT AND SUPERVISORY BODIES AT 30 JUNE 2017
Supervisory Board
CHAIRMAN
Mr Louis GALLOIS OTHER SUPERVISORY BOARD MEMBERS
Mr Jack AZOULAY (appointed on the proposal of the French Government, appointed as Vice-Chairman pursuant to the Master Agreement) (resigning member, from June 19, 2017)
ETABLISSEMENTS PEUGEOT FRERES, represented by Mrs Marie-Hélène PEUGEOT RONCORONI (appointed as Vice-Chairman pursuant to the Master Agreement)
DONGFENG MOTOR (HONG KONG) INTERNATIONAL CO. LTD., represented by Mr. M.ZHU Yanfeng, up to June 24, 2017 (appointed as Vice-Chairman pursuant to the Master Agreement)
Mr Geoffroy ROUX DE BÉZIEUX (Senior Independent Member)
Mrs Catherine BRADLEY
Mrs Pamela KNAPP
Mr Jean-François KONDRATIUK (employee representative)
Mrs Helle KRISTOFFERSEN
Mr LIU Weidong (resigning member, from June 24, 2017)
FFP, represented by Robert PEUGEOT
Mr Henri Philippe REICHSTUL
Mrs Bénédicte JUYAUX (employee shareholder representative)
Mrs Florence VERZELEN (resigning member, from June 24, 2017) NON-VOTING ADVISORS
Mr Frédéric BANZET
Mr Aymeric DUCROCQ (resigning advisor from June 24, 2017)
Mr WEI Wenqing (resigning advisor, from June 23, 2017)
Managing Board
CHAIRMAN Mr Carlos TAVARES OTHER MEMBERS OF THE MANAGING BOARD
Mr Jean-Baptiste CHASSELOUP DE CHATILLON
Mr Maxime PICAT
Mr Jean-Christophe QUEMARD
2 - PSA Group Half-Year Financial Report 2017
II. INTERIM MANAGEMENT REPORT 1. THE GROUP'S OPERATIONS
1.1. Overview of sales activities
Push to Pass product offensive launched: global sales up 2.3% at the end of June 2017 • 1,580,000 units sold in the first half of 2017 • Sales increase in Latin America, Middle East and Africa, Eurasia and India-Pacific regions • In China, specific action plans implemented for each JV by Groupe PSA and its partners • Market share gains for all new models, including in Europe: PEUGEOT 3008 and 5008 SUV and CITROËN C3 • DS 7 CROSSBACK World premiere, first vehicle of DS second generation • Strengthened leadership in the light commercial vehicles segment: global sales up 3.8%
Groupe PSA continued its product offensive launched in 2016 as part of its strategic plan for profitable growth "Push to Pass": 31 of the 121 launches presented in the plan will take place before the end of 2017 in the six regions in which the Group operates.
The new PEUGEOT 3008 SUV, which has won 28 awards, including the prestigious "Car of The Year" 2017, has registered 205,000 orders since its launch, and 114,900 sales in the first half of the year. Launched in March 2017, the new PEUGEOT 5008 SUV has already recorded 21,400 sales.
The new CITROËN C3 registered 120,000 sales in the first half of the year, increasing C3 orders by 68% since the beginning of the year. A total of almost 160,000 sales has now been recorded for this new model since its launch. The appeal of this model is confirmed by the 25+ awards received and a client rating of 4.7 stars (out of 5) on Citroën Advisor.
In the LCV segment, the new PEUGEOT Expert and CITROËN Jumpy, have strengthened PSA leadership in Europe even further, and with the PEUGEOT Traveller and CITROËN SpaceTourer PC versions, provide powerful levers for the Group to gain greater market shares outside its historical territories.
The DS 7 CROSSBACK La Première limited edition, launched at the end of February, can be reserved online.
The offensive will continue in the second half of 2017 with the commercial launch of the new PEUGEOT 308 from September and two new SUV models for CITROËN : C3 Aircross in Europe and C5 Aircross in China. The commercial launch of the DS 7 CROSSBACK SUV will start in October in the dedicated DS network in Europe.
In Europe, Groupe PSA recorded a 4% increase in registrations and a sales volume of 1,036,000 vehicles in the first half of 2017, a fall of 1.9%.
The PEUGEOT 2008 SUV recorded a 10% increase in deliveries and is now ranked number 2 in its segment. The new PEUGEOT 3008 SUV has made spectacular progress and reached the podium of its category.
CITROËN recorded its best volume of registrations in Europe for six years, with a 5.6% increase, one point above market volume.
On the LCV market, with the new PEUGEOT Expert and CITROËN Jumpy, the Group's market share increased by 1.2 points to 20.4%. This increase was also driven by the PEUGEOT Partner and CITROËN Berlingo which are ranked 1st and 3rd, respectively, in their segment and are the best-selling small vans in Europe.
DS Automobiles continues its transformation by developing its network, which now includes 116 dedicated sales points in Europe on the eve of the arrival of the DS 7 CROSSBACK. In the first half of 2017, five limited editions were launched as well as the DS 7 CROSSBACK La Première with a conquest rate of 60% since reservations opened.
In China and South East Asia, in a fiercely competitive context, Groupe PSA changed its economic and commercial business model with respect to the network and partners of the two joint ventures DPCA and CAPSA. As part of this change, on 7 June, Groupe PSA signed an agreement strengthening its collaboration with ChangAn Automobile to accelerate the development of the DS brand in China.
In Vietnam, to accelerate the development of its activities, in the 2nd half of the year, the Group, along with its partner THACO, will launch the local assembly and marketing of two new SUVs.
In the Middle East & Africa, Groupe PSA continued its profitable growth totalling 277,900 sales, with growth of sales in Morocco (+5%) and Turkey (+5%) in particular. Groupe PSA also consolidated its position in Iran with the creation of two JVs which are now operational. The start of local production of the PEUGEOT 2008 SUV and its pre-sales marketing have been a huge success.
Groupe PSA continued its product offensive in this region with the successful launches of the new CITROËN C3 and renewal of the C-Elysée, the new PEUGEOT 3008 SUV and the new 301. Unveiled in June 2017, the new PEUGEOT Pick Up signals the brand's return to this strategic segment. It will be marketed in Q3 2017.
DS Automobiles continued its development in the region, particularly in Iran and accelerated the construction of its network to commercialize the DS 7 CROSSBACK at the start of 2018.
PSA Group Half-Year Financial Report 2017 - 3

In Latin America, Group's sales grew by 8.5%, with 96,300 vehicles sold in an increasingly competitive environment.
PEUGEOT sales were up 5.2%, in particular thanks to the launch of the new PEUGEOT 301 in Argentina, Mexico and Chile in Q2. Things look very promising for the new 3008 SUV recently launched in Mexico, Brazil and Chile. It will be sold in Argentina by the end of the year.
CITROËN sales increased by 14.7% in the region. This growth was driven in particular by Argentina where registrations for the brand increased by 33%.
The DS brand continued its growth in the region with a 48.6% rise in sales. In a few months time, it will open four new DS STORES to commercialize the DS 7 CROSSBACK.
In Eurasia, Groupe PSA sales increased by 26.4% thanks to the dynamism of the PEUGEOT (+41.1%) and CITROËN (+10.5%) brands, in particular in Ukraine where the market is experiencing a significant rebound. While waiting for the launch of the new generation PEUGEOT Expert and Traveller and the CITROËN Jumpy and SpaceTourer in Russia in the second half of the year, the Group's LCV sales increased by 18%. These launches will be completed by the new PEUGEOT 408, manufactured in Kaluga and to be launched in July, and the new PEUGEOT 3008 SUV launched in Russia on 1 July, reinforcing the up-market strategy of the PEUGEOT brand in the region.
Groupe PSA continued its development in the Eurasia region with the signature in Uzbekistan of a Joint Venture agreement with SC Uzavtosanoat for the production of LCVs from 2019.
The India-Pacific region was marked by Groupe PSA's good performance in Japan (+11.1%). Growth in the region is driven by the CITROËN brand (+52.8%), in particular thanks to the new C4 Picasso, and the C4 Cactus in Korea and Japan. The new PEUGEOT 3008 SUV was hugely successful in Korea and Japan with more than 2,300 orders in four months. With the opening in Nagoya of a new DS STORE, the DS brand now has two DS STORES and one DS SALON in Japan.
1.2. Consolidated worldwide sales
The consolidated worldwide sales by brand, by geographical area and by model are available on the PSA Group website (www.groupe-psa.com).
2. ANALYSIS OF CONSOLIDATED INTERIM OPERATING RESULTS The Group's operations are organised around three main business segments described in Note 4 to the consolidated financial statements at 30 June 2017. Subsequent events are presented in Note 17 to the financial statements.
2.1. Group profit (loss) for the period
The consolidated profit for the period came to €1,474 million, an increase of €91 million and the profit for the period attributable to owners of the parent represented €1,256 million, up €44 million.
(in million euros) 30 June 2016 30 June 2017 Change
Revenue 27,779 29,165 +1,386
Recurring operating income 1,830 2,041 +211
As a % of Revenue 6.6% 7.0%
Non-recurring operating income and expenses (207) (112) +95
Operating income (loss) 1,623 1,929 +306
Net financial income (expense) (150) (121) +29
Income taxes (310) (446) -136
Share in net earnings of companies at equity 149 112 -37
Profit (loss) from operations held for sale or to be continued in partnership* 71 0 -71
Consolidated profit (loss) for the period 1,383 1,474 +91
Profit (loss) for the period attributable to owners of the parent 1,212 1,256 +44* Including “Other expenses related to the non-transferred financing of operations to be continued in partnership”.
4 - PSA Group Half-Year Financial Report 2017

2.2. Group Revenue
The table below shows consolidated revenue by division:
(in million euros) 30 June 2016 30 June 2017 Change
Automotive 19,190 19,887 +697
Faurecia 9,532 10,295 +763
Other businesses and eliminations* (943) (1,017) -74
Group Revenue 27,779 29,165 +1,386
* Including the activities of Banque PSA Finance not covered by the partnership signed with Santander Consumer Finance
Automotive revenues were up 3.6% compared to the first half of 2016, mainly thanks to the favourable effect of product mix (+4.9%) that more than compensates the negative impact of adverse exchange rate changes (-1.1%). At constant exchange rates, Group revenues were up 8.2% compared to the first half of 2015, year of reference of Groupe PSA strategic plan of profitable growth Push to Pass.
2.3. Group Recurring Operating Income (loss)
The following table shows Recurring Operating Income (loss) by business segment
(in million euros) 30 June 2016 30 June 2017 Change
Automotive 1,303 1,442 +139
Faurecia 490 587 +97
Other businesses and eliminations* 37 12 -25
Group Recurring Operating Income (loss) 1,830 2,041 +211
* Including the activities of Banque PSA Finance not covered by the partnership signed with Santander Consumer Finance
In the first half of 2017 the Automotive recurring operating margin, which corresponds to the ratio of the Automotive recurring operating income to the Automotive revenues stood at 7.3% compared to 6.8% in the first half of 2016. Group recurring operating margin stood at 7.0% compared to 6.6% in the first half of 2016.
The 10.7% increase in the Automotive recurring operating income was due to the company's improved performance (+€345 million), despite an unfavourable operating environment (-€206 million):
- the negative effect of the Automotive division’s operating environment stemmed from a (€255) million effect of "foreign exchange and others", associated essentially with the weakening of the pound sterling as well as higher raw material and other external costs amounting to (€129) million. These effects were partially offset by stronger markets totalling +€178 million;
- the improved performance of the Automotive business was due to a very positive product mix effect amounting to +€456 million as well as the price and product enrichment effect of +€41 million and to lower production and fixed costs amounting to +€214 million. These effects were partially offset by changes in market share and country mix (€92 million), as well as the increase of research and development costs (-€87 million) and other effects (-€187 million) including mainly the impact of inventory reduction in the independent network for -€225 million.
Faurecia’s recurring operating income was €587 million, up €97 million.
2.4. Other items contributing to Group profit (loss) for the period
Non-recurring operating income and expenses amounted to an expense of €112 million and primarily included Automotive division restructuring costs totalling €109 million – mainly in France for €58 million, in Spain for €29 million and in the rest of Europe for €12 million and in Latin America for €7 million – and of Faurecia for €31 million.
The Group's net financial expenses stood at €(121) million compared to €(150) million in the first half of 2016. Net financial income and expenses are set out in Note 10 to the consolidated financial statements at 30 June 2017. The Income tax expense amounted to €(446) million in the first half of 2017 compared with €(310) million in the first half of 2016. See Note 12 to the consolidated financial statements at 30 June 2017. The share in net earnings from companies at equity amounted to €112 million in the first half of 2017 compared to €149 million in the first half of 2016. The contribution of the Dongfeng joint ventures (DPCA and DPCS) was negative at €(25) million, down by €120 million.
PSA Group Half-Year Financial Report 2017 - 5

CAPSA’s contribution was null in the first half of 2017, versus €(7) million in the first half of 2016. The contribution from the joint ventures under the partnership between Banque PSA Finance and Santander Consumer Finance amounted to €103 million. This contribution is described in Note 9 to the consolidated financial statements at 30 June 2017.
The net income, Group share of €1,256 million was up €44 million. Earnings per share came to €1.44 per share compared to €1.51 per share in the first half of 2016.
2.5. Banque PSA Finance
The results (at 100%) of finance companies are the following :
(in million euros) 30 June 2016 30 June 2017 Change
Revenue 737 710 -27
Net banking revenue 537 543 +6
Cost of risk* 0.15% 0.25%
Recurring operating income 297 312 +15
Penetration rate 29.3% 29.3% -
Number of new contracts (leasing and financing) 400,338 419,500 +19,162
*As a percentage of net average net outstandings
2.6. Faurecia
The results of Faurecia are the following :
(in million euros) 30 June 2016 30 June 2017 Change
Revenue 9,532 10,295 +763
Recurring operating income 490 587 +97
As a % of revenue 5.1% 5.7%
Non-recurring operating income (expense) (66) (32) +34
Operating income (loss) 424 555 +131
Net financial income (expense) (105) (65) +40
Consolidated profit (loss) for the period 284 364 +80
Free cash flow 212 93 -119
Net financial position (end 2016) (475) (619) -144
More detailed information about Faurecia is provided in its half-year report, which can be downloaded from its website at www.faurecia.com.
2.7. Outlook
Market outlook For 2017, the Group expects the automotive market to grow by about 3% in Europe, and 5% in China, Latin America and Russia.
Operational outlook improved The objectives of the Push to Pass plan are to:
- deliver over 4.5% Automotive recurring operating margin1 on average in 2016-2018, and target over 6% by 2021;
- deliver 10% Group revenue growth by 20182 vs 2015, and target additional 15% by 20212.
1 Recurring operating income related to revenue 2 At constant (2015) exchange rates
6 - PSA Group Half-Year Financial Report 2017

3. FINANCIAL POSITION AND CASH
3.1. Net financial position and financial security of manufacturing and sales companies
The net financial position of manufacturing and sales companies are set out and described in Note 10 to the Group’s consolidated financial statements at 30 June 2017. The net financial position of manufacturing and sales companies at 30 June 2017 consisted of net cash of €7,631 million, and grew by €818 million compared to 31 December 2016. In this positive net cash position, Faurecia has a net debt of €619 million at 30 June 2017, compared to a net debt of €475 million at the end of December 2016.
The Group continued to actively manage its debt in the first half of 2017. In order to extend the average maturity of its debt, Peugeot S.A. issued a bond of 600 M€ bond maturing in March 2024 and, in May, a tap bond of 100 M€ with the same maturity. In addition, the European International Bank (EIB) granted a seven-year loan of 250 M€ to PSA Automobiles SA for the financing research and development investments on future emission requirements.
Liquidity reserves for the manufacturing and sales companies amounted to €18,817 million at 30 June 2017, versus €16,974 million at 31 December 2016, with €14,617 million in cash and cash equivalents, financial investments and current & non-current financial assets, and €4,200 million in undrawn lines of credit (see Note 10.3 to the consolidated financial statements at 30 June 2017).
3.2. Free cash flow from manufacturing and sales operations
Details of the free cash flow of manufacturing and sales companies can be found in Note 14 to the consolidated financial statements at 30 June 2017. The free cash flow generated over the period stood at €1,116 million, €93 million of which was contributed by Faurecia. The free cash flow over the period mainly stemmed from:
- €3,251 million in cash flows generated by recurring operations;
- €(324) million in cash flows related to restructuring plans;
- €120 million improvement in the working capital requirement, including €1,385 million in trade payables, €(914) million in trade receivables and €(453) million in inventories;
- (€1,931) million in capitalised capital expenditure and research & development, including Faurecia's share which represented €(592) million in the first semester 2017 and of which €(129) million in exceptional investments/asset disposals. Total research and development expenses incurred increased during the first half of 2017 compared to the first half of 2016 and are presented in Note 5 to the consolidated financial statements at 30 June 2017.
New vehicle inventory of the Group and of the independent dealer network:
(in thousands of new vehicles) 30 June 2017 30 June 2016 30 June 2015
The Group 119 139 148
Independent dealer network 255 260 243
TOTAL 374 399 391
Excluding Free Cash Flow, the changes in net financial position represented €(298) million. These are mainly related to dividends paid to Group shareholders in the amount of €(431) million as well as the dividends paid to Faurecia minority shareholders for €(86) million and to the exercise of warrants in the amount of €288 million.
3.3. Liquidity and funding of finance companies
The liquidity and funding of finance companies are discussed in Note 11 to the consolidated financial statements at 30 June 2017.
PSA Group Half-Year Financial Report 2017 - 7

4. FACTORS AND UNCERTAINTIES Main risk factors specific to the Group and its business The Group operates in a profoundly changing environment not only in terms of technology, but also as regards modes of consumption and new entrants into the automotive industry. It is therefore exposed to risks that, if materialised, could have a significant adverse effect on its business, financial position, results or outlook. PSA Group pays close attention to ensuring that the risks inherent in its business lines are effectively managed across its various businesses. The Group's various operating units identify and assess risks and evaluate the related internal controls on an ongoing basis, in France and abroad, with annual reporting to the Executive Committee. (Faurecia has its own process). The principal specific risk factors to which the Group may be exposed are described in depth in the 2016 Registration Document (Chapter 1.4) that was published on April, 3rd 2017, and include notably:
• Operational risks
They include risks related to the Group's economic and geopolitical environment, particularly in the United Kingdom where the Group is exposed to free trade agreements and currency movements (in the first half of 2017, Group sales in the UK represented up to 108,000 vehicles). A one point gross change in the pound sterling euro exchange rate has an impact of around €25 million on the Automotive recurring operating income. The long-term impact of the UK's exit from the European Union will depend on the exit terms and their consequences, which are not currently known. There are also risks related to the development, launch and sale of new vehicles (for example petrol/diesel mix), risks related to the emergence of new business models driven by new forms of mobility, customer and dealer risks, raw material risks, supplier risks, industrial risks, environmental risks, workplace health and safety risks, risks associated with cooperation agreements, risks associated with the strategic partnership with Dongfeng and information system risks.
• Financial market risks
The Group is exposed to liquidity risk, interest rate risk, exchange rate risk, counterparty risk, credit risk and other market risks related in particular to fluctuations in commodity prices. Note 11.7 to the 2016 consolidated financial statements and Note 10.2 to the consolidated financial statements at 30 June 2017 provide information on risk management, which is primarily carried out by Corporate Finance, identified risks and the Group policies designed to manage them.
• Risks related to Banque PSA Finance
These include activity risk, credit risk, liquidity risk, counterparty risk, as well as concentration risk and operational risk. (See Note 12.5 to the consolidated financial statements at 31 December 2016).
• Legal and contractual risks
These risks include notably: legal and arbitration proceedings, legal risks associated with anti-competition litigation, regulatory risks, financial covenants, risks related to pension and other post-retirement benefit obligations, risks related to intellectual property rights and off-balance sheet commitments. (See Note 15 to the consolidated financial statements at 30 June 2017).
• Risks related to the acquisition of Opel/Vauxhall
The completion of the acquisition of General Motors Opel/Vauxhall subsidiary is subject to a range of conditions being satisfied relating in particular to the implementation of certain preliminary reorganisations of the Opel/Vauxhall group and the obtaining of the antitrust and financial regulatory/authorisations. There are also risks associated with the separation of Opel/Vauxhall from the General Motors group, and the synergies or targets anticipated as a result of this acquisition might not be achieved (for more information, see Note 1 to the consolidated financial statements at 30 June 2017).
5. RELATED PARTY TRANSACTIONS The Group’s related party transactions are described in Notes 16 and 9.5 to the consolidated financial statements at 30 June 2017. Related parties are companies subject to significant influence consolidated by the equity method, members of the managing bodies and shareholders holding more than 10% of Peugeot S.A. capital.
8 - PSA Group Half-Year Financial Report 2017

III. CONDENSED INTERIM CONSOLIDATED FINANCIAL STATEMENTS AT 30 JUNE 2017
Contents
Interim Consolidated Statements of Income ..................................................................................... 10
Interim Consolidated Comprehensive Income .................................................................................. 12
Interim Consolidated Balance Sheets ................................................................................................ 14
Interim Consolidated Statements of Cash Flows ............................................................................... 16
Interim Consolidated Statement of Changes in Equity ...................................................................... 18
Notes to the Interim Consolidated Financial Statements .................................................................. 19
PSA Group Half-Year Financial Report 2017 - 9

INTERIM CONSOLIDATED STATEMENTS OF INCOME
(in million euros) Notes
Manufacturing and sales
companiesFinance
companies Eliminations Total
Continuing operations
Sales and revenue 29,089 87 (11) 29,165
Cost of goods and services sold (23,430) (59) 11 (23,478)
Selling, general and administrative expenses (2,606) (13) - (2,619)
Research and development expenses 5.1 (1,027) - - (1,027)
Recurring operating income (loss) 2,026 15 - 2,041
Non-recurring operating income 5.2 92 - - 92
Non-recurring operating expenses 5.2 (204) - - (204)
Operating income (loss) 1,914 15 - 1,929
Financial income 78 1 - 79
Financial expenses (199) (1) - (200)
Net financial income (expense) 10.1 (121) - - (121)
Income (loss) before tax of fully consolidated companies
1,793 15 - 1,808
Current taxes (301) (11) - (312)
Deferred taxes (139) 5 - (134)
Income taxes12
(440) (6) - (446)
Share in net earnings of companies at equity 9.3 (1) 113 - 112
Other expenses related to the non-transferred financing of operations to be continued in partnership - - - -
Consolidated profit (loss) from continuing operations
1,352 122 - 1,474
Attributable to equity holders of the parent 1,137 119 - 1,256
Operations held for sale or to be continued in partnership
Profit (loss) from operations held for sale or to be continued in partnership - - - -
Consolidated profit (loss) for the period 1,352 122 - 1,474
Attributable to equity holders of the parent 1,137 119 - 1,256
Attributable to minority interests 215 3 - 218
(in euros)
1.44
1.44
1.39
1.39
First-half 2017
Basic earnings per €1 par value share of continuing operations - attributable to equity holders of the parent (Note 13.2.A)
Basic earnings per €1 par value share - attributable to equity holders of the parent (Note 13.2.A)
Diluted earnings per €1 par value share of continuing operations - attributable to equity holders of the parent (Note 13.2.B)
Diluted earnings per €1 par value share - attributable to equity holders of the parent (Note 13.2.B)
10 - PSA Group Half-Year Financial Report 2017

Manufacturing and sales
companiesFinance
companies Eliminations Total
Manufacturing and sales
companiesFinance
companies Eliminations Total
27,684 102 (7) 27,779 53,884 161 (15) 54,030
(22,320) (62) 7 (22,375) (43,599) (125) 15 (43,709)
(2,599) (33) - (2,632) (5,136) (35) - (5,171)
(942) - - (942) (1,915) - - (1,915)
1,823 7 - 1,830 3,234 1 - 3,235
32 - - 32 117 - - 117
(239) - - (239) (741) - - (741)
1,616 7 - 1,623 2,610 1 - 2,611
191 4 - 195 298 4 - 302
(345) - - (345) (570) - - (570)
(154) 4 - (150) (272) 4 - (268)
1,462 11 - 1,473 2,338 5 - 2,343
(190) (4) - (194) (588) (8) - (596)
(109) (7) - (116) 90 (11) - 79
(299) (11) - (310) (498) (19) - (517)
62 87 - 149 (67) 195 - 128
- (11) - (11) - (10) - (10)
1,225 76 - 1,301 1,773 171 - 1,944
1,055 75 - 1,130 1,358 167 - 1,525
47 35 - 82 174 31 - 205
1,272 111 - 1,383 1,947 202 - 2,149
1,102 110 - 1,212 1,532 198 - 1,730
170 1 - 171 415 4 - 419
1.41 1.90
1.51 2.16
1.32 1.70
1.41 1.93
2016First-half 2016
PSA Group Half-Year Financial Report 2017 - 11

INTERIM CONSOLIDATED COMPREHENSIVE INCOME
(in million euros)Before tax
Income tax benefit
(expense)After tax
Consolidated profit (loss) for the period 1,920 (446) 1,474
Items that may be recycled through profit or loss
Fair value adjustments to cash flow hedges 3 3 6
• of which, reclassified to the income statement 13 (2) 11
• of which, recognised in equity during the period (10) 5 (5)
4 - 4
• of which, reclassified to the income statement - - -
• of which, recognised in equity during the period 4 - 4
(259) - (259)
(252) 3 (249)
Items that may not be recycled through profit or loss
Actuarial gains and losses on pension obligations 108 (33) 75
Total other components of comprehensive income (144) (30) (174)
• of which, companies at equity (62) - (62)
Consolidated comprehensive income 1,776 (476) 1,300
• of which, attributable to equity holders of the parent 1,144
• of which, attributable to minority interests 156
First-half 2017
Gains and losses from remeasurement at fair value of available-for-sale financial assets
Exchange differences on translating foreign operations
Total other components of comprehensive income that may be recycledthrough profit or loss
The consolidated comprehensive income corresponds to all changes in equity resulting from transactions with third parties other than shareholders.
12 - PSA Group Half-Year Financial Report 2017

Before taxIncome tax
benefit (expense)
After tax Before taxIncome tax
benefit (expense)
After tax
1,693 (310) 1,383 2,666 (517) 2,149
67 (24) 43 53 (19) 34
59 (16) 43 63 (10) 53
8 (8) - (10) (9) (19)
7 (1) 6 11 (2) 9
7 (1) 6 - - -
- - - 11 (2) 9
(106) - (106) (52) - (52)
(32) (25) (57) 12 (21) (9)
(139) 62 (77) 37 (1) 36
(171) 37 (134) 49 (22) 27
(95) - (95) (78) - (78)
1,522 (273) 1,249 2,715 (539) 2,176
1,120 1,762
129 414
First-half 2016 2016
PSA Group Half-Year Financial Report 2017 - 13
INTERIM CONSOLIDATED BALANCE SHEETS
ASSETS
(in million euros) Notes
Manufacturing and sales
companiesFinance
companies Eliminations Total
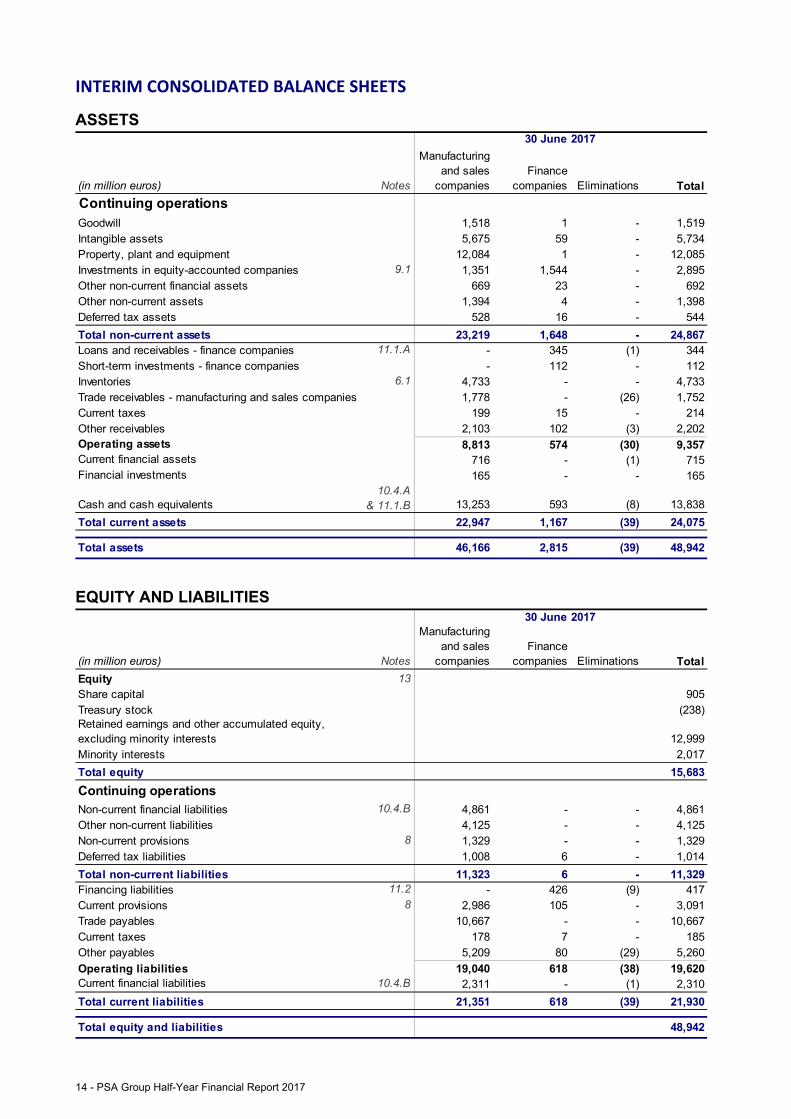
Continuing operationsGoodwill 1,518 1 - 1,519Intangible assets 5,675 59 - 5,734Property, plant and equipment 12,084 1 - 12,085Investments in equity-accounted companies 9.1 1,351 1,544 - 2,895Other non-current financial assets 669 23 - 692Other non-current assets 1,394 4 - 1,398Deferred tax assets 528 16 - 544
Total non-current assets 23,219 1,648 - 24,867Loans and receivables - finance companies 11.1.A - 345 (1) 344Short-term investments - finance companies - 112 - 112Inventories 6.1 4,733 - - 4,733Trade receivables - manufacturing and sales companies 1,778 - (26) 1,752Current taxes 199 15 - 214Other receivables 2,103 102 (3) 2,202Operating assets 8,813 574 (30) 9,357Current financial assets 716 - (1) 715Financial investments 165 - - 165
Cash and cash equivalents10.4.A
& 11.1.B 13,253 593 (8) 13,838
Total current assets 22,947 1,167 (39) 24,075
Total assets 46,166 2,815 (39) 48,942
30 June 2017
EQUITY AND LIABILITIES
(in million euros) Notes
Manufacturing and sales
companiesFinance
companies Eliminations Total
Equity 13Share capital 905Treasury stock (238)Retained earnings and other accumulated equity, excluding minority interests 12,999Minority interests 2,017
Total equity 15,683
Continuing operationsNon-current financial liabilities 10.4.B 4,861 - - 4,861Other non-current liabilities 4,125 - - 4,125Non-current provisions 8 1,329 - - 1,329Deferred tax liabilities 1,008 6 - 1,014
Total non-current liabilities 11,323 6 - 11,329Financing liabilities 11.2 - 426 (9) 417Current provisions 8 2,986 105 - 3,091Trade payables 10,667 - - 10,667Current taxes 178 7 - 185Other payables 5,209 80 (29) 5,260
Operating liabilities 19,040 618 (38) 19,620Current financial liabilities 10.4.B 2,311 - (1) 2,310
Total current liabilities 21,351 618 (39) 21,930
Total equity and liabilities 48,942
30 June 2017
14 - PSA Group Half-Year Financial Report 2017

(in million euros) Notes
Manufacturing and sales
companiesFinance
companies Eliminations Total
Continuing operationsGoodwill 1,513 1 - 1,514Intangible assets 5,393 61 - 5,454Property, plant and equipment 11,291 2 - 11,293Investments in equity-accounted companies 9.1 1,487 1,527 - 3,014Other non-current financial assets 685 37 - 722Other non-current assets 1,368 7 - 1,375Deferred tax assets 574 19 - 593
Total non-current assets 22,311 1,654 - 23,965Loans and receivables - finance companies 11.1.A - 346 - 346Short-term investments - finance companies - 103 - 103Inventories 6.1 4,347 - - 4,347Trade receivables - manufacturing and sales companies 1,560 - (19) 1,541Current taxes 148 16 - 164Other receivables 1,763 92 (4) 1,851Operating assets 7,818 557 (23) 8,352Current financial assets 629 - (1) 628Financial investments 110 - - 110
Cash and cash equivalents10.4.A
& 11.1.B 11,576 530 (8) 12,098
Total current assets 20,133 1,087 (32) 21,188
Total assets 42,444 2,741 (32) 45,153
31 December 2016
(in million euros) Notes
Manufacturing and sales
companiesFinance
companies Eliminations Total
Equity 13Share capital 860Treasury stock (238)Retained earnings and other accumulated equity, excluding minority interests 12,035Minority interests 1,961
Total equity 14,618
Continuing operationsNon-current financial liabilities 10.4.B 4,526 - - 4,526Other non-current liabilities 3,288 - - 3,288Non-current provisions 8 1,429 - - 1,429Deferred tax liabilities 880 15 - 895
Total non-current liabilities 10,123 15 - 10,138Financing liabilities 11.2 - 430 (9) 421Current provisions 8 3,249 125 - 3,374Trade payables 9,352 - - 9,352Current taxes 169 3 - 172Other payables 5,366 74 (23) 5,417
Operating liabilities 18,136 632 (32) 18,736Current financial liabilities 10.4.B 1,661 - - 1,661
Total current liabilities 19,797 632 (32) 20,397
Total equity and liabilities 45,153
31 December 2016
PSA Group Half-Year Financial Report 2017 - 15

INTERIM CONSOLIDATED STATEMENTS OF CASH FLOWS
(in million euros) Notes
Manufacturing and sales
companiesFinance
companies Eliminations TotalConsolidated profit (loss) from continuing operations 1,352 122 - 1,474Other expenses related to the non-transferred financing of operations to be continued in partnership - - - -Adjustments for non-cash items: • Depreciation, amortisation and impairment 1,349 7 - 1,356 • Provisions (215) (20) - (235) • Changes in deferred tax 139 (5) - 134 • (Gains) losses on disposals and other (54) (1) - (55)Share in net (earnings) losses of companies at equity, net of dividends received 226 (30) - 196Revaluation adjustments taken to equity and hedges of debt (48) (17) - (65)Change in carrying amount of leased vehicles 178 - - 178
Funds from operations 2,927 56 - 2,983Changes in working capital 6.2 120 5 - 125Net cash from (used in) operating activities of
continuing operations (1) 3,047 61 - 3,108
11 1 - 12Capital increase and acquisitions of consolidated companies and equity investments (235) 4 - (231)Proceeds from disposals of property, plant and equipment and of intangible assets 95 7 - 102Investments in property, plant and equipment (2) (1,044) - - (1,044)Investments in intangible assets (3) (821) (11) - (832)Change in amounts payable on fixed assets (36) - - (36)Other 99 2 - 101Net cash from (used in) investing activities of continuing operations
(1,931) 3 - (1,928)
Dividends paid: • To Peugeot S.A. shareholders (431) - - (431) • Intragroup - - - - • Net amounts received from (paid to) operations to be continued in partnership - - - - • To minority shareholders of subsidiaries (86) - - (86)Proceeds from issuance of shares 288 - - 288(Purchases) sales of treasury stock - - - -Changes in other financial assets and liabilities 10.2.B 898 - (1) 897Other - - - -
Net cash from (used in) financing activities of continuing operations
669 - (1) 668
Net cash related to the non-transferred debt of finance companies to be continued in partnership 14.2
- - - -
Net cash from the transferred assets and liabilities of operations held for sale or to be continued in partnership 14.2
- - - -
Effect of changes in exchange rates (58) (1) - (59)
1,727 63 (1) 1,789
Net cash and cash equivalents at beginning of period 11,464 530 (8) 11,986
Net cash and cash equivalents of continuing operations at end of period
14.1 13,191 593 (9) 13,775
(1) Excluding flows related to the non-transferred debt of finance companies to be continued in partnership.(2) Of which for the manufacturing and sales activities, €310 million (€231 million in first-half 2016 and €666 million in 2016) forAutomotive Equipment Division and €735 million (€714 million in first-half 2016 and €1,440 million in 2016) for the AutomotiveDivision.(3) Of which for the manufacturing and sales activities, €37 million (€39 million in first-half 2016 and €78 million in 2016) forAutomotive Division, excluding research and development.
First-half 2017
Increase (decrease) in cash from continuing operations held for sale or to be continued in partnership
Proceeds from disposals of shares in consolidated companies and in equity investments
16 - PSA Group Half-Year Financial Report 2017

Manufacturing and sales
companiesFinance
companies Eliminations Total
Manufacturing and sales
companiesFinance
companies Eliminations Total
1,225 76 - 1,301 1,773 171 - 1,944
- 11 - 11 - 11 - 11
1,206 8 - 1,214 2,477 20 - 2,497(240) (10) - (250) (31) (28) - (59)
104 1 - 105 (93) 5 - (88)(2) (5) - (7) (139) (7) - (146)
213 (12) - 201 355 (102) - 25355 - - 55 76 (1) - 75
237 - - 237 48 - - 48
2,798 69 - 2,867 4,466 69 - 4,535389 838 (74) 1,153 471 1,287 177 1,935
3,187 907 (74) 4,020 4,937 1,356 177 6,470
(2) 43 - 41 608 202 - 810
(98) (17) - (115) (349) (71) - (420)
79 - - 79 242 1 - 243(946) (1) - (947) (2,106) (1) - (2,107)(722) (4) - (726) (1,449) (18) - (1,467)
117 - - 117 237 - - 23712 - 14 26 144 - 10 154
(1,560) 21 14 (1,525) (2,673) 113 10 (2,550)
- - - - - - - -219 (219) - - 434 (434) - -
- 51 - 51 - 120 - 120(81) (5) - (86) (123) (11) - (134)
8 - - 8 332 (5) - 327- - - - - - - -
(1,049) - (104) (1,153) (1,548) - (443) (1,991)- - - - - - (4) (4)
(903) (173) (104) (1,180) (905) (330) (447) (1,682)
- (2,258) 175 (2,083) - (2,615) 305 (2,310)
(78) 1,201 (11) 1,112 (255) 1,097 1 843
(95) 10 - (85) (93) 16 - (77)
551 (292) - 259 1,011 (363) 46 694
10,453 893 (54) 11,292 10,453 893 (54) 11,292
11,004 601 (54) 11,551 11,464 530 (8) 11,986
2016First-half 2016
PSA Group Half-Year Financial Report 2017 - 17

INTERIM CONSOLIDATED STATEMENT OF CHANGES IN EQUITY
At 31 December 2015 808 (238) 10,090 (28) 9 (82) (4) 10,555 1,664 12,219
Income and expenses recognised in equity for the period
- - 1,212 44 6 (52) (90) 1,120 129 1,249
Measurement of stock options and performance share grants
- - 6 - - - - 6 4 10
Effect of changes in scope of consolidation and other
- - (10) - - - - (10) 4 (6)
Issuance of shares 2 - 12 - - - - 14 8 22
Purchases and sales of treasury stock
- - (11) - - - - (11) (13) (24)
Dividends paid by other Group companies
- - - - - - - - (123) (123)
At 30 June 2016 810 (238) 11,299 16 15 (134) (94) 11,674 1,673 13,347
Income and expenses recognised in equity for the period
- - 518 (10) 3 103 28 642 285 927
Measurement of stock options and performance share grants
- - 24 - - - - 24 6 30
Redemption of convertible bonds - - (4) - - - - (4) (5) (9)
Effect of changes in scope of consolidation and other
- - 6 - - - - 6 5 11
Issuance of shares 50 - 266 - - - - 316 7 323
Purchases and sales of treasury stock
- - (1) - - - - (1) - (1)
Dividends paid by other Group companies
- - - - - - - - (10) (10)
At 31 December 2016 860 (238) 12,108 6 18 (31) (66) 12,657 1,961 14,618
Income and expenses recognised in equity for the period
- - 1,256 (1) 4 65 (180) 1,144 156 1,300
Measurement of stock options and performance share grants
- - 14 - - - - 14 6 20
Effect of changes in scope of consolidation and other
- - 13 - - - - 13 28 41
Issuance of shares 45 - 243 - - - - 288 - 288
Purchases and sales of treasury stock
- - (19) - - - - (19) (21) (40)
Dividends paid by Peugeot S.A. - - (431) - - - - (431) - (431)
Dividends paid by other Group companies
- - - - - - - - (113) (113)
At 30 June 2017 905 (238) 13,184 5 22 34 (246) 13,666 2,017 15,683
Equity -Minority
interestsTotal
equityCash flow
hedges
Available-for-sale
financial assets
Actuarial gains and losses on
pension obligations
Translation adjust-ments(in million euros)
Share capital
Treasury stock
Retained earnings excluding
revaluations
Revaluations - excluding minority interests
Equity -Attributable
to equity holders of the parent
18 - PSA Group Half-Year Financial Report 2017

NOTES TO THE INTERIM CONSOLIDATED FINANCIAL STATEMENTS Six months ended 30 June 2016
Note 1 - Specific Events of the Period ................................................................................................ 20
Note 2 - Accounting Policies .............................................................................................................. 20
Note 3 - Scope of Consolidation ........................................................................................................ 21
Note 4 - Segment Information ........................................................................................................... 22
Note 5 - Operating Income ................................................................................................................ 24
Note 6 - Requirements in Working Capital of Manufacturing and Sales Companies ........................ 25
Note 7 - Employee Benefits Expense ................................................................................................. 26
Note 8 - Current and Non-Current Provisions ................................................................................... 27
Note 9 - Investments in Equity-Accounted Companies ..................................................................... 28
Note 10 - Financing and Financial Instruments – Manufacturing and Sales Companies .................. 32
Note 11 - Financing and Financial Instruments – Finance Companies .............................................. 35
Note 12 - Income Taxes ..................................................................................................................... 36
Note 13 - Equity and Earnings per Share ........................................................................................... 37
Note 14 - Notes to the Consolidated Statements of Cash Flows ....................................................... 39
Note 15 - Contingent Liabilities ......................................................................................................... 40
Note 16 - Related Parties Transactions .............................................................................................. 40
Note 17 - Subsequent Events ............................................................................................................. 40
PSA Group Half-Year Financial Report 2017 - 19

Preliminary note The interim consolidated financial statements for the six months ended 30 June 2017 and related notes were approved by the Managing Board of Peugeot S.A. on 20 July 2017 with the exception of Note 17 which takes into account events that occurred in the period up to the Supervisory Board meeting on 25 July 2017.
NOTE 1 - SPECIFIC EVENTS OF THE PERIOD
1.1. OPEL
On 6 March 2017 General Motors Co. and PSA Group announced an agreement under which GM’s Opel/Vauxhall subsidiary and GM Financial’s European operations1 will join the PSA Group in a transaction valuing these activities at €1.3 billion and €0.9 billion, respectively. The transaction value for PSA, including Opel/Vauxhall and 50% of GM Financial’s European operations, will be €1.8 billion. The transaction includes all of Opel/Vauxhall’s automotive operations, comprising Opel and Vauxhall brands, six assembly and five component-manufacturing facilities, one engineering center (Rüsselsheim, Deutschland).Opel/Vauxhall will also continue to benefit from intellectual property licenses from GM until its vehicles progressively convert to PSA platforms over the coming years. PSA, together with BNP Paribas, will also acquire all of GM Financial’s European operations through a newly formed 50:50 joint venture that will be fully consolidated by BNP Paribas and accounted under the equity method by PSA. All of Opel/Vauxhall’s European and U.K. pension plans, funded and unfunded, with the exception of the German Actives Plan and selected smaller plans will remain with GM. The obligations with respect to the German Actives Plan and these smaller plans of Opel/Vauxhall will be transferred to PSA. GM will pay PSA €3.0 billion for full settlement of transferred pension obligations. The transaction is subject to various closing conditions, including regulatory approvals and reorganizations. On 5 July 2017, EU antitrust authorities approved the proposed acquisition which is expected to close before the end of 2017. Therefore, this transaction had no impact on the interim financial statements. 1.2. INDIA
On 25 January 2017, the PSA Group and the CK Birla Group sign joint-venture agreements to produce and sell vehicles and components in India by 2020. The partnership entails two joint-venture agreements between the PSA Group and the CK Birla Group companies. As part of the first agreement, the PSA Group will hold a majority stake in the joint-venture company being set-up with HMFCL for the assembly and distribution of PSA passenger cars in India, giving exclusive control to the PSA Group. As per the second agreement, a 50:50 joint-venture is being set-up between the PSA Group and AVTEC Ltd for manufacture and supply of powertrains and will be accounted at equity. The manufacturing sites for both vehicle assembly and powertrains will be based in the state of Tamil Nadu. The initial manufacturing capacity will be set at about 100,000 vehicles per year.
NOTE 2 - ACCOUNTING POLICIES
2.1. STANDARDS APPLIED
The PSA Group’s condensed interim financial statements for the six months ended 30 June 2017 have been prepared in accordance with IAS 34 – Interim Financial Reporting, which provides for the presentation of a selected number of explanatory notes. These condensed interim consolidated financial statements should be read and understood in conjunction with the 2016 consolidated financial statements.
The interim consolidated financial statements for the period ended 30 June 2017 for the PSA Group have been prepared using the same accounting policies as those used for the financial year ended 31 December 2016.
The PSA Group's consolidated financial statements for the year ended 31 December 2016 and for the half-year ended 30 June 2017 were prepared in accordance with International Financial Reporting Standards (IFRS), adopted for use in 1 Jointly with BNP PARIBAS.
20 - PSA Group Half-Year Financial Report 2017

the European Union. They also comply with International Financial Reporting Standards (IFRS) adopted by the IASB and IFRS Interpretation Committee interpretations, inasmuch as the provision of IAS 39 unadopted by the European Union does not affect the PSA Group’s financial statements.
With regard to IFRS 15, the Group continued to analyse its contracts, and does not expect to observe a significant effect on its revenue, other than impacts previously described for the Automotive Equipment Division (see Note 1.1 to the 2016 consolidated financial statements). Moreover, analyses of the prospective impact of the implementation of IFRS 16 (applicable from 1 January 2019, subject to adoption by the European Union) and IFRS 9 (applicable from 1 January 2018) are underway.
2.2. USE OF ESTIMATES AND ASSUMPTIONS
The preparation of financial statements in accordance with IFRS requires management to make estimates and assumptions in order to determine the reported amounts of certain assets, liabilities, income and expense items, as well as certain amounts disclosed in the notes to the financial statements relating to contingent assets and liabilities.
The estimates and assumptions used are those deemed by management to be the most pertinent and accurate in view of the Group's circumstances and past experience. Estimates and assumptions are reviewed periodically.
Nevertheless, given the uncertainty inherent in any projections, actual results may differ from initial estimates.
The points for attention used in the preparation of the 2017 interim financial statements are the same as those used for the 2016 annual financial statements.
NOTE 3 - SCOPE OF CONSOLIDATION
The Group consists of the Peugeot S.A. holding company, listed on Euronext, and its affiliates. Subsidiaries are consolidated in accordance with Note 2.1 of the consolidated financial statements for 2016.
The Group's operations are organised around three main segments (see Note 4): • The Automotive division, covering the design, manufacture and sale of passenger cars and light commercial
vehicles under the Peugeot, Citroën and DS brands, as well as the new spare parts distribution and mobility businesses;
• The Automotive Equipment division, corresponding to the Faurecia group. Peugeot S.A. holds 46.33% of Faurecia’s capital and 63.06% of its voting rights. The exercise of the dilutive instruments issued by Faurecia would have no impact on the Group’s exclusive control;
• The Finance division, corresponding to the Banque PSA Finance group, which provides retail financing to customers of the Peugeot, Citroën and DS brands and wholesale financing to the brands' dealer networks. Banque PSA Finance is classified as a financial institution. In 2014, Banque PSA Finance and Santander Consumer Finance signed a framework agreement for the establishment of a partnership. This partnership covers most Banque PSA Finance's business through entities controlled jointly with Santander, accounted at equity (see Note 9.4 C).
The Group’s other activities are housed under “Other businesses”, which notably includes the Peugeot S.A. holding company.
30 June 2017 31 December 2016
Fully consolidated companies
Manufacturing and sales companies 282 278
Finance companies 17 18
299 296
Joint operations
Manufacturing and sales companies 3 3
Companies at equity
Manufacturing and sales companies 50 50
Finance companies 29 29
79 79
Consolidated companies 381 378
There was no significant change in the scope of consolidation during the half-year.
PSA Group Half-Year Financial Report 2017 - 21

NOTE 4 - SEGMENT INFORMATION
In accordance with IFRS 8 – Operating Segments, segment information is presented in line with the indicators used internally by management to measure the performance of the Group's different business segments. The Group's main performance indicator is recurring operating income. The definition of operating sectors is provided in Note 3. For internal reporting, the Finance division’s full data is given, before the impact of IFRS 5. The “Reconciliation” column provides a link with the presentation given in the consolidated income statement.
BUSINESS SEGMENTS The balances for each segment shown in the table below are on a stand-alone basis. All intersegment transactions are eliminated and, for the purposes of reconciliation with the Group's financial statements, are shown under the heading "Eliminations and unallocated" together with unallocated amounts. Faurecia and Banque PSA Finance publish consolidated financial statements and segment information for these two businesses is therefore presented down to the level of net profit. For the other segments, as cash positions and taxes are managed jointly in some countries, only operating income, share in net earnings of equity-accounted companies and profit (loss) from operations held for sale or to be continued in partnership are presented by segment. All intersegment commercial transactions are carried out on an arm's length.
First-half 2017 Automotive
(in million euros) Automotive equipment Other 100% Reconciliation
Sales and revenue• third parties 19,886 9,202 1 644 (568) - 29,165• intragroup, intersegment 1 1,093 48 66 - (1,208) -
Total (2) 19,887 10,295 49 710 (568) (1,208) 29,165
Recurring operating income (loss) 1,442 587 2 312 (297) (5) 2,041Non-recurring operating income 69 3 20 - - - 92Restructuring costs (109) (31) - - - - (140)
(60) - - - - - (60)
- (4) - - - - (4)Operating income (loss) 1,342 555 22 312 (297) (5) 1,929
Net financial income (expense) (65) - - (56) (121)Income taxes expense (144) (102) 96 (296) (446)
(24) 18 5 10 103 - 112
- - - - - - -
364 220 (98) 1,474
- - - - -
364 220 (98) 1,474
1,340 525 - 17 (6) 1,876
Impairment loss on CGUs, provisions for onerous contracts and other
Other non-recurring operating expenses
Share in net earnings of companies at equity
Consolidated profit (loss) from continuing operations
Eliminations and
unallocated (1)
Other expenses related to the non-transferred financing of operations to be continued in partnership
Finance companies
(2) of which a turnover of €19,129 million for manufacturer's activity of the Automotive division.
Profit (loss) from operations held for sale or to be continued in partnership
Consolidated profit (loss) for the period
Capital expenditure (excluding sales with a buyback commitment)(1) The "Eliminations and unallocated" column includes eliminations of intersector sales between the Finance companies and the other sectors (€55 million).
In the first-half of 2017, on a fully consolidated basis, Banque PSA Finance (Finance Companies segment) generated net banking revenue of €543 million. Net provision expense (cost of risk) amounted to €28 million in the first-half 2017. In the first-half of 2017, according to the IFRS standards, Banque PSA Finance (Finance Companies segment) reported net banking revenue of €31 million. Net provision expense (cost of risk) amounted to €3 million in the first-half 2017.
22 - PSA Group Half-Year Financial Report 2017

First-half 2016 Automotive
(in million euros) Automotive equipment Other 100% Reconciliation
Sales and revenue• third parties 19,190 8,494 - 657 (562) - 27,779• intragroup, intersegment - 1,038 56 80 - (1,174) -
Total (2) 19,190 9,532 56 737 (562) (1,174) 27,779
Recurring operating income (loss) 1,303 490 33 297 (290) (3) 1,830Non-recurring operating income 29 3 - - - - 32Restructuring costs (107) (59) (1) - - - (167)
(5) - - - - - (5)
(29) (10) (28) (2) 2 - (67)Operating income (loss) 1,191 424 4 295 (288) (3) 1,623
Net financial income (expense) (3) (105) (3) 7 (49) (150)Income taxes expense (95) (109) 98 (204) (310)
45 13 4 7 80 - 149
- - - - (11) - (11)
237 190 (114) 1,301
- 47 - - 35 82
284 190 (79) 1,383
1,250 417 - 11 (5) 1,673
Impairment loss on CGUs, provisions for onerous contracts and other
Other non-recurring operating expenses
Share in net earnings of companies at equityOther expenses related to the non-transferred financing of operations to be continued in partnership
Consolidated profit (loss) from continuing operations
Finance companies
Profit (loss) from operations held for sale or to be continued in partnership
Consolidated profit (loss) for the period
Capital expenditure (excluding sales with a buyback commitment)(1) The "Eliminations and unallocated" column includes eliminations of intersector sales between the Finance companies and the other sectors (€73 million).(2) of which a turnover of €18,764 million for manufacturer's activity of the Automotive division.
Eliminations and
unallocated (1)
In the first-half of 2016, on a fully consolidated basis, Banque PSA Finance (Finance Companies segment) generated net banking revenue of €537 million. Net provision expense (cost of risk) amounted to €16 million in the first-half 2016. In the first-half of 2016, after application of IFRS 5, Banque PSA Finance (Finance Companies segment) reported net banking revenue of €40 million. 2016 Automotive
(in million euros) Automotive equipment Other 100% Reconciliation
Sales and revenue• third parties 37,065 16,819 - 1,263 (1,117) - 54,030• intragroup, intersegment 1 1,891 112 142 - (2,146) -
Total (2) 37,066 18,710 112 1,405 (1,117) (2,146) 54,030
Recurring operating income (loss) 2,225 970 39 571 (570) - 3,235Non-recurring operating income 109 7 1 - - - 117Restructuring costs (456) (90) (1) - - - (547)
(143) - - - - - (143)
- (23) (28) (2) 2 - (51)Operating income (loss) 1,735 864 11 569 (568) - 2,611
Net financial income (expense) (163) (10) 14 (109) (268)Income taxes expense (189) (206) 187 (309) (517)
(93) 20 6 15 180 - 128
- - - - (10) - (10)
532 368 (197) 1,944
- 174 - - 31 - 205
706 368 (166) 2,149
2,481 1,074 - 39 (20) - 3,574
Finance companies
Other non-recurring operating expenses
Share in net earnings of companies at equityOther expenses related to the non-transferred financing of operations to be continued in partnership
Consolidated profit (loss) from continuing operationsProfit (loss) from operations held for sale or to be continued in partnership
(2) of which a turnover of €35,948 million for manufacturer's activity of the Automotive division.
Eliminations and
unallocated (1)
Consolidated profit (loss) for the period
Capital expenditure (excluding sales with a buyback commitment)(1) The "Eliminations and unallocated" column includes eliminations of intersector sales between the Finance companies and the other sectors (€127 million).
Impairment loss on CGUs, provisions for onerous contracts and other
In 2016, on a fully consolidated basis, Banque PSA Finance (Finance Companies segment) generated net banking revenue of €1,026 million. Net provision expense (cost of risk) for the year amounted to €52 million. In 2016, after application of IFRS 5, Banque PSA Finance (Finance Companies segment) reported net banking revenue of €161 million. Net provision expense (cost of risk) for the year amounted to €5 million.
PSA Group Half-Year Financial Report 2017 - 23

NOTE 5 - OPERATING INCOME
5.1. RESEARCH AND DEVELOPMENT EXPENSES
(in million euros) First-half 2017 First-half 2016 2016
Total expenditure (1) (1,346) (1,176) (2,361)
Capitalised development expenditure (2) 743 633 1,267
Non-capitalised expenditure (603) (543) (1,094)
Amortisation of capitalised development expenditure (424) (399) (821)
Total (1,027) (942) (1,915)
(1) of which Faurecia -€230 million (-€213 million in first-half 2016 and -€437 million in 2016).(2) In addition to this expenditure, borrowing costs are capitalised pursuant to IAS 23 - Borrowing Costs . 5.2. NON-RECURRING OPERATING INCOME AND EXPENSES
(in million euros) Notes First-half 2017 First-half 2016 2016
Net gains on disposals of real estate assets 64 21 101
5.2.A.(1) 5 10 10Other non-recurring operating income (excluding Automotive Division) 23 1 6
Total non-recurring operating income 92 32 117
5.2.A.(1) (60) (34) (143)
Restructuring costs 5.2.B (140) (167) (547)Other non-recurring operating expenses (excluding Automotive Division) (4) (38) (51)
(204) (239) (741)Total non-recurring operating expenses
Reversal of impairment loss on Automotive Division CGUs and other assets and provisions for Automotive Division onerous contracts
Impairment loss on Automotive Division CGUs and other assets and provisions for Automotive Division onerous contracts
A. Impairment test on CGUs, provisions for onerous contracts and other depreciations
(1) Impairment test on Automotive division CGUs and provisions for Automotive Division onerous contracts
The assets of the Automotive division CGU, as well as the Russia and Latin America CGUs and the Vehicle CGUs, were tested for impairment as of 31 December 2016.
Automotive division CGU There were no indications of impairment losses on this CGU during the half-year. Vehicle CGUs and other automotive assets For assets dedicated to the Vehicle CGUs, further to the tests conducted on sensitive CGUs, impairment of €56 million was recognised during the half-year. (2) Impairment test on Faurecia group CGUs and other assets Faurecia group CGUs and Faurecia CGU at PSA Group There were no indications that the Faurecia CGUs might be impaired at 30 June 2017 and therefore no impairment tests were performed at that date. The market value of Faurecia securities at 30 June 2017 covers the value of Faurecia's net assets in the Groupe PSA’s financial statements.
24 - PSA Group Half-Year Financial Report 2017

B. Restructuring costs Restructuring costs consist mainly of workforce reductions.
(in million euros) First-half 2017 First-half 2016 2016
Automotive Division (109) (107) (456)
Automotive Equipment Division (31) (59) (90)
Other businesses - (1) (1)
Total (140) (167) (547)
Automotive division Automotive division restructuring costs amounted to €109 million in the first-half 2017. They mainly include restructuring costs in France for €58 million concerning in particular the cost of the improving of its industrial capacities for €31 million, in Spain for €29 million, in other European countries for €12 million and in South America for €7 million. Automotive Equipment division (Faurecia group) In the first-half 2017, Faurecia group restructuring costs totalled €31 million, mainly in Europe.
NOTE 6 - REQUIREMENTS IN WORKING CAPITAL OF MANUFACTURING AND SALES COMPANIES
6.1. INVENTORIES
(in million euros) 30 June 2017 30 June 2016 31 December 2016
Raw materials and supplies 754 698 667
Semi-finished products and work-in-progress 1,132 952 918
Goods for resale and used vehicles 655 575 801Finished products and replacement parts 2,192 2,322 1,961
Total 4,733 4,547 4,347
• of which at cost 5,124 4,950 4,774
• of which allowances (391) (403) (427)
6.2. CHANGE IN WORKING CAPITAL REQUIREMENTS OF MANUFACTURING AND SALES COMPANIES
(in million euros) 30 June 2017 30 June 2016 2016
(Increase) decrease in inventories (453) (610) (365)
(Increase) decrease in trade receivables (914) (170) 291
Increase (decrease) in trade payables 1,385 1,030 389
Change in income taxes (56) (217) 4
Other changes 158 356 152
120 389 471
Net cash flows with Groupe PSA finance companies 9 165 (38)
Total 129 554 433
PSA Group Half-Year Financial Report 2017 - 25

NOTE 7 - EMPLOYEE BENEFITS EXPENSE
7.1. PENSIONS
A. Assumptions
The rates used to calculate the Group’s pension obligation on the balance sheet date are as follows:
Euro zone United-Kingdom
Discount Rate
June 2017 1.90 % 2.75 %
December 2016 1.50 % 2.80 %
June 2016 1.25 % 2.90 %
Inflation Rate
June 2017 1.80 % 3.25 %
December 2016 1.80 % 3.25 %
June 2016 1.80 % 2.95 % The impact of changes in assumptions is reported under the consolidated comprehensive income. B. Analysis at 30 June 2017
(in million euros) FranceUnited
Kingdom Other Total FranceUnited
Kingdom Other Total
Present value of projected benefit obligation (1,537) (2,040) (660) (4,237) (1,620) (2,098) (695) (4,413)
Fair value of external funds 891 2,714 256 3,861 899 2,777 270 3,946
Net (liability) asset recognised in the balance sheet before minimum funding requirement (IFRIC 14)
(646) 674 (404) (376) (721) 679 (425) (467)
Minimum funding requirement liability (IFRIC 14) - (39) - (39) - (39) - (39)
Net (liability) asset recognised in the balance sheet (646) 635 (404) (415) (721) 640 (425) (506)
Of which, liability (Note 8) (670) (41) (424) (1,135) (747) (63) (425) (1,235)
Of which, asset 24 676 20 720 26 703 - 729
Of which, unfunded plans 0.0 % 0.0 % 9.6 % 1.5 % 0.0 % 0.0 % 9.6 % 1.5 %
30 June 2017 31 December 2016
7.2. SHARE-BASED PAYMENT
A. Peugeot S.A. performance share plans
(1) Performance share plan 2015
A performance share plan was established in 2015. At the end of the vesting period on 31 March 2017, 2,019,000 treasury stocks were delivered to French tax resident beneficiaries. As of 30 June 2017, 371,266 shares were potentially attributable to foreign residents; the relevant vesting period ends on 31 March 2019. The personnel expenses associated with this plan, measured in accordance with IFRS 2, was €3.7 million for the first-half 2017, excluding payroll taxes. (2) Performance share plan 2016
A performance share plan was established in 2016 (see Note 6.2.B.(1).(b) to the 2016 consolidated financial statements). As of 30 June 2017, 1,839,070 shares were potentially attributable to the beneficiaries of the plan. The personnel expenses associated with this plan, measured in accordance with IFRS 2, was €3.1 million for the first-half 2017, excluding payroll taxes.
26 - PSA Group Half-Year Financial Report 2017

(3) Performance share plan 2017
Following the authorisation given by the Extraordinary Shareholders’ Meeting of 27 April 2016 and the Supervisory Board at its meeting of 27 April 2016, the Peugeot S.A. Managing Board adopted a performance share plan effective at 10 April 2017, subject to performance conditions. This plan covers a maximum total of 2,693,000 shares. The allocation of performance shares is subject to a condition of presence within the Group at the end of the vesting period. The final acquisition is subject to two performance conditions, namely the Automotive Division’s average recurring operating margin over the period from 2017 to 2019, and growth in consolidated revenue at constant exchange rates between 2016 and 2019. In light of the objectives, the shares will vest in two equal parts subject to presence within the company at 14 April 2020 and 14 April 2021. As of 30 June 2017, 2,138,629 shares are potentially attributable to the beneficiaries of the plan. The personnel expenses associated with this plan, measured in accordance with IFRS 2, was €2 million for the first-half 2017, excluding payroll taxes.
B. Faurecia performance share plan At 30 June 2017, two performance share plans were in force, implemented by the Board of Directors at its meetings of dated 23 July 2015 and 25 July 2016. The personnel expenses associated with this plan, measured in accordance with IFRS 2, was €11 million for the first-half 2017, excluding payroll taxes. The performance conditions of the plan awarded by the Board at its meeting of 24 July 2013 have been met; the corresponding 947,050 shares will be allocated in July 2017. The performance conditions of the plan awarded by the Board at its meeting of 28 July 2014 have been met; the corresponding 767,780 shares will be allocated in July 2018.
NOTE 8 - CURRENT AND NON-CURRENT PROVISIONS
(in million euros)31 December
2016 Additions
Releases (used
provisions)
Releases (unused
provisions)
Recognised in equity
during the period
Change in scope of
consolidation and other 30 June 2017
Pensions (Note 7.1) 1,235 42 (44) - (104) 6 1,135
Other employee benefit obligations and other 194 13 (10) - - (3) 194
Total non-current provisions 1,429 55 (54) - (104) 3 1,329
Warranties 924 299 (235) (49) - (10) 929
Commercial and tax claims and litigations 648 44 (30) (32) - (32) 598
Restructuring plans (1) 996 83 (289) (4) - 10 796
Long-term and operating contract losses 442 137 (168) (2) - (1) 408Other 364 78 (15) (51) - (16) 360
Total current provisions 3,374 641 (737) (138) - (49) 3,091
(1) The main additions for restructuring plans in 2017 are discussed in Note 5.2.B.
PSA Group Half-Year Financial Report 2017 - 27
NOTE 9 - INVESTMENTS IN EQUITY-ACCOUNTED COMPANIES
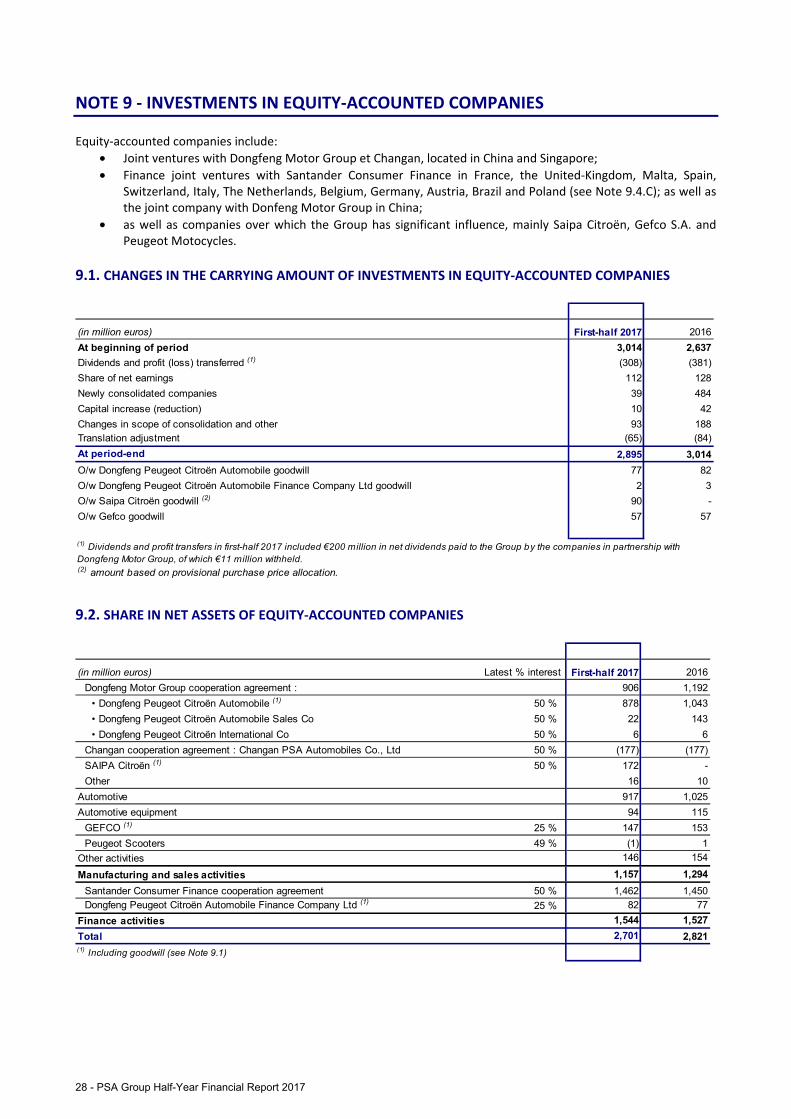
Equity-accounted companies include: • Joint ventures with Dongfeng Motor Group et Changan, located in China and Singapore; • Finance joint ventures with Santander Consumer Finance in France, the United-Kingdom, Malta, Spain,
Switzerland, Italy, The Netherlands, Belgium, Germany, Austria, Brazil and Poland (see Note 9.4.C); as well as the joint company with Donfeng Motor Group in China;
• as well as companies over which the Group has significant influence, mainly Saipa Citroën, Gefco S.A. and Peugeot Motocycles.
9.1. CHANGES IN THE CARRYING AMOUNT OF INVESTMENTS IN EQUITY-ACCOUNTED COMPANIES
(in million euros) First-half 2017 2016
At beginning of period 3,014 2,637
Dividends and profit (loss) transferred (1) (308) (381)
Share of net earnings 112 128
Newly consolidated companies 39 484
Capital increase (reduction) 10 42
Changes in scope of consolidation and other 93 188Translation adjustment (65) (84)
At period-end 2,895 3,014
O/w Dongfeng Peugeot Citroën Automobile goodwill 77 82
O/w Dongfeng Peugeot Citroën Automobile Finance Company Ltd goodwill 2 3
O/w Saipa Citroën goodwill (2) 90 -
O/w Gefco goodwill 57 57
(1) Dividends and profit transfers in first-half 2017 included €200 million in net dividends paid to the Group by the companies in partnership with Dongfeng Motor Group, of which €11 million withheld.(2) amount based on provisional purchase price allocation.
9.2. SHARE IN NET ASSETS OF EQUITY-ACCOUNTED COMPANIES
(in million euros) Latest % interest First-half 2017 2016
Dongfeng Motor Group cooperation agreement : 906 1,192
• Dongfeng Peugeot Citroën Automobile (1) 50 % 878 1,043
• Dongfeng Peugeot Citroën Automobile Sales Co 50 % 22 143
• Dongfeng Peugeot Citroën International Co 50 % 6 6
Changan cooperation agreement : Changan PSA Automobiles Co., Ltd 50 % (177) (177)
SAIPA Citroën (1) 50 % 172 -
Other 16 10
Automotive 917 1,025
Automotive equipment 94 115
GEFCO (1) 25 % 147 153
Peugeot Scooters 49 % (1) 1
Other activities 146 154
Manufacturing and sales activities 1,157 1,294
Santander Consumer Finance cooperation agreement 50 % 1,462 1,450Dongfeng Peugeot Citroën Automobile Finance Company Ltd (1) 25 % 82 77
Finance activities 1,544 1,527
Total 2,701 2,821(1) Including goodwill (see Note 9.1)
28 - PSA Group Half-Year Financial Report 2017

The Group’s share of the net assets of equity-accounted companies breaks down into €2,895 million (€3,014 million at 31 December 2016) related to companies with positive net equity, reported under “Investments in equity-accounted companies”, less €194 million for companies with negative net equity, reported under “Non-current provisions” for €167 million and under “Loan depreciation” for €27 million (€193 million of negative equity at 31 December 2016, reported under “Non-current provisions” for €166 million and under “Loan depreciation” for €27 million). 9.3. SHARE IN NET EARNINGS OF EQUITY-ACCOUNTED COMPANIES
(in million euros) Latest % interest First-half 2017 First-half 2016 2016
Dongfeng Motor Group cooperation agreement : (25) 95 242
• Dongfeng Peugeot Citroën Automobile (1) 50 % (14) 51 129
• Dongfeng Peugeot Citroën Automobile Sales Co 50 % (11) 44 113
Changan cooperation agreement : Changan PSA Automobiles Co., Ltd 50 % - (7) (292)
SAIPA Citroën (1) 50 % - - -
Other 1 (43) (43)
Automotive (24) 45 (93)
Automotive equipment 18 13 20
GEFCO (1) 25 % 8 8 14
Peugeot Scooters 49 % (3) (4) (8)
Other activities 5 4 6
Manufacturing and sales activities (1) 62 (67)
Santander Consumer Finance cooperation agreement 50 % 103 80 181Dongfeng Peugeot Citroën Automobile Finance Company Ltd (1) 25 % 10 7 14
Finance activities 113 87 195
Total 112 149 128(1) Including goodwill (see Note 9.1) 9.4. KEY FINANCIAL DATA OF EQUITY-ACCOUNTED COMPANIES
The detailed data about the equity-accounted companies are the following. A. Dongfeng Motor Group cooperation agreement in the automotive activities Groupe PSA and Dongfeng Motor Group have three joint ventures:
• Dongfeng Peugeot Citroën Automobile (DPCA), based in Wuhan, which is subject to joint control and is qualified for accounting purposes as a joint venture. It manufactures motor vehicles under the Dongfeng Peugeot, Dongfeng Citroën brands in China and Fengshen;
• Dongfeng Peugeot Citroën Automobile Sales Co (DPCS), based in Wuhan, over which the Group has significant influence. It markets in China the vehicles produced by DPCA;
• Dongfeng Peugeot Citroën Automobile International Co (DPCI), based in Singapore, which is subject to joint control and is qualified for accounting purposes as a joint venture. It markets outside China, in the ASEAN zone, the vehicles produced by DPCA.
Another company that will be in charge of joint research and development and subject to joint control is being created.
The amounts below represent the combined financial statements of DPCA and DPCS.
PSA Group Half-Year Financial Report 2017 - 29

Earnings items at 100%
First-half 2017 First-half 2016 2016 First-half 2017 First-half 2016 2016
Sales and revenue 2,140 3,547 7,455 15,801 25,859 54,795
Recurring operating income (loss) (118) 204 524 (894) 1,483 3,858
Operating income (loss) (1) (91) 216 568 (690) 1,573 4,181
Of which depreciation and impairment (160) (151) (299) (1,188) (1,102) (2,202)
Net financial income (loss) 17 26 55 132 186 402
Income taxes 24 (52) (138) 182 (374) (1,015)
Profit (loss) from continuing operations (50) 190 485 (376) 1,385 3,568
Profit (loss) from discontinued operations - - - - - -
Profit (loss) for the period (50) 190 485 (376) 1,385 3,568
(25) 95 242
- - -
Other information
200 249 260
(1) Including the share of net earnings of companies at equity.
Income and expenses recognised in equity, net
Groupe PSA's share in the profit (loss) of the period (Share in net earnings of companies at equity)
Net dividend received from the joint venture(s) by the Groupe PSA
In million euros In million yuans
B. Changan cooperation agreement Since 2011, Groupe PSA and Changan have owned a joint venture known as Changan PSA Automobile (CAPSA), based in Shenzhen, subject to joint control and classified for accounting purposes as a joint venture. It manufactures and markets motor vehicles under the DS brand in China. Earnings items at 100%
First-half 2017 First-half 2016 2016 First-half 2017 First-half 2016 2016
Sales and revenue 59 204 368 438 1,486 2,702
Recurring operating income (loss) 3 2 (22) 22 11 (161)
Operating income (loss) 23 2 (488) 171 12 (3,561)
Of which depreciation and impairment (4) (16) (464) (30) (120) (3,383)
Net financial income (loss) (17) (15) (24) (126) (109) (177)
Income taxes (6) - (72) (45) - (529)
Profit (loss) from continuing operations - (13) (584) - (97) (4,267)
Profit (loss) from discontinued operations - - - - - -
Profit (loss) of the period - (13) (584) - (97) (4,267)
- (7) (292)
- - -
Other information
- - -Net dividend received from the joint venture(s) by the Groupe PSA
Income and expenses recognised in equity, net
Groupe PSA's share in the profit (loss) of the period (Share in net earnings of companies at equity)
In million euros In million yuans
C. Santander agreement and Dongfeng Motor Group agreement in the financing activities The combined financial statements of all the joint ventures with Santander and Dongfeng Motor Group are presented in summary form in the tables below. The scope of the partnership with Santander includes at 30 June 2017 eleven European countries as well as Brazil. For 2016, the scope of the equity-accounted entities is detailed in the Note 2.3.A to the 2016 consolidated financial statements. The partnership with Dongfeng Motor group concerns the financing activities in China.
30 - PSA Group Half-Year Financial Report 2017

Earnings items at 100%
(in million euros) First-half 2017 First-half 2016 2016
Net banking revenue 580 456 1,011
General operating expenses and others (205) (164) (358)
Gross operating income 375 292 653
Cost of risk (23) (15) (37)
Operating income 352 277 616
Income taxes (107) (86) (196)
Profit (losss) for the period 245 191 420
113 86 195
Income and expenses recognised in equity, net 3 (3) (3)
Other information
Dividends paid by companies in partnership 83 75 92
Groupe PSA's share in the profit (loss) of the period (Share in net earnings of companies at equity)
Balance sheet items at 100%
(in million euros) First-half 2017 2016
Customer loans and receivables 24,822 24,670
Other assets 2,800 2,582
Total assets 27,622 27,252
Financing liabilities 19,057 18,992
Other liabilities 5,317 5,061
Equity 3,248 3,199
Total liabilities 27,622 27,252
9.5. TRANSACTIONS WITH EQUITY–ACCOUNTED COMPANIES
Transactions with equity-accounted companies are billed on arm’s length terms. Sale and purchase transactions carried out by the consolidated manufacturing and sales companies with equity-accounted companies are as follows:
(in million euros) First-half 2017 First-half 2016 2016
Sales to manufacturing and sales companies (1) 284 470 857
Sales and assignments to companies in partnership with Santander 2,767 2,800 5,172
Purchases (2) (1,103) (1,084) (2,043)
(2) of which €935 million in purchases from Gefco (€898 million in first-half 2016 and €1,684 million in 2016).
(1) of which €232 million in sales to companies in partnership with Dongfeng Motor Group (€389 million in first-half 2016 and €735 million in 2016)and €12 million in sales to CAPSA (€22 million in first-half 2016 and €33 million in 2016).
Receivables and payables with equity-accounted companies are as follows:
(in million euros) 30 June 201731 December
2016
Long-term loans 49 51
Short-term loans (less than one year) 78 27
Trade receivables 285 315
Trade payables (415) (325)
PSA Group Half-Year Financial Report 2017 - 31
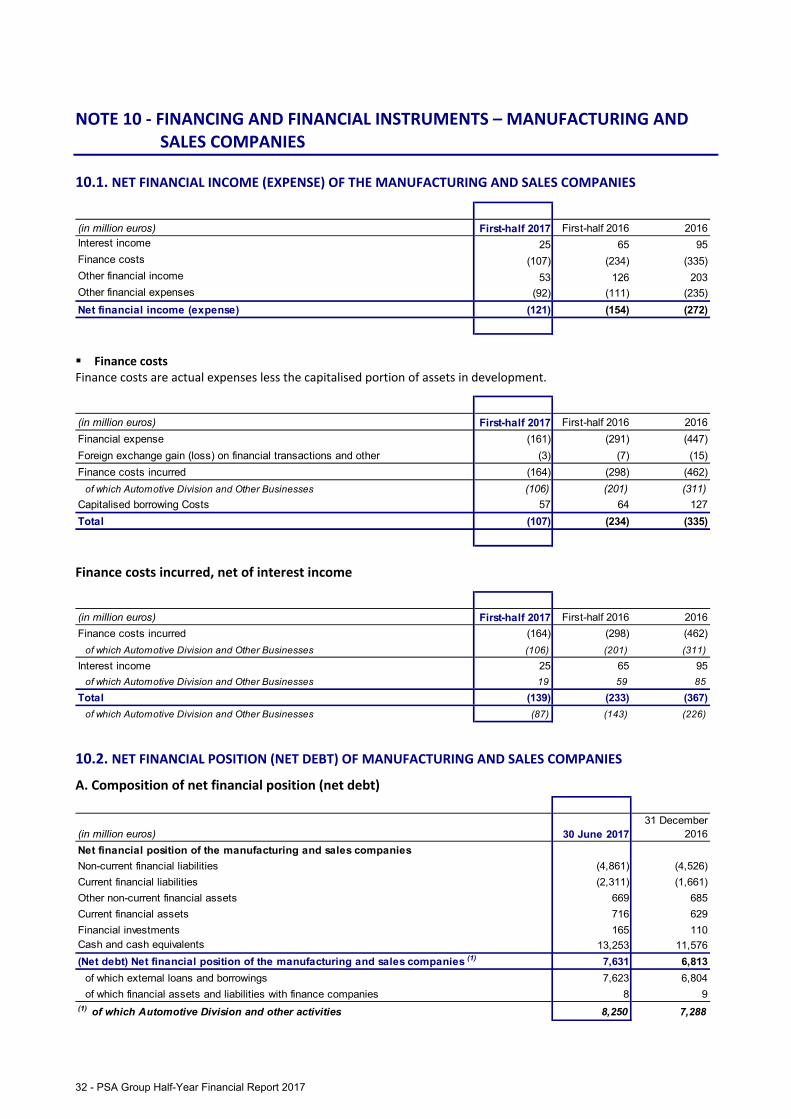
NOTE 10 - FINANCING AND FINANCIAL INSTRUMENTS – MANUFACTURING AND SALES COMPANIES
10.1. NET FINANCIAL INCOME (EXPENSE) OF THE MANUFACTURING AND SALES COMPANIES
(in million euros) First-half 2017 First-half 2016 2016Interest income 25 65 95Finance costs (107) (234) (335)Other financial income 53 126 203Other financial expenses (92) (111) (235)
Net financial income (expense) (121) (154) (272)
Finance costs Finance costs are actual expenses less the capitalised portion of assets in development.
(in million euros) First-half 2017 First-half 2016 2016
Financial expense (161) (291) (447)
Foreign exchange gain (loss) on financial transactions and other (3) (7) (15)
Finance costs incurred (164) (298) (462)
of which Automotive Division and Other Businesses (106) (201) (311)
Capitalised borrowing Costs 57 64 127
Total (107) (234) (335)
Finance costs incurred, net of interest income
(in million euros) First-half 2017 First-half 2016 2016
Finance costs incurred (164) (298) (462)
of which Automotive Division and Other Businesses (106) (201) (311)
Interest income 25 65 95
of which Automotive Division and Other Businesses 19 59 85
Total (139) (233) (367)
of which Automotive Division and Other Businesses (87) (143) (226)
10.2. NET FINANCIAL POSITION (NET DEBT) OF MANUFACTURING AND SALES COMPANIES
A. Composition of net financial position (net debt)
(in million euros) 30 June 201731 December
2016
Net financial position of the manufacturing and sales companies
Non-current financial liabilities (4,861) (4,526)
Current financial liabilities (2,311) (1,661)
Other non-current financial assets 669 685
Current financial assets 716 629
Financial investments 165 110Cash and cash equivalents 13,253 11,576
7,631 6,813
of which external loans and borrowings 7,623 6,804
of which financial assets and liabilities with finance companies 8 9(1) of which Automotive Division and other activities 8,250 7,288
(Net debt) Net financial position of the manufacturing and sales companies (1)
32 - PSA Group Half-Year Financial Report 2017

B. Change in net financial position (net debt)
The Group kept up the proactive refinancing strategy and conservative liquidity policy described in Note 11.7.A to the consolidated financial statements for 2016. Manufacturing and sales companies further improved their net financial position in the first half of 2017. Net cash from operating activities for the first half totalled positive €3,047 million, representing funds from operations of €2,927 million plus the positive impact of a €120 million decrease in working capital. Changes in working capital are discussed in Note 6.2. Investments for the period in property, plant and equipment and intangible assets amounted to €1,806 million. Other financing needs for the period stood at €642 million, including notably the payment of a dividend to the shareholders of Peugeot S.A. in the amount of €431 million. Other cash inflows for the period drive from various right issues for a total amount of €288 million, resulting notably from conversions of equity warrants bonds issued on 29 April 2014.
These various cash inflows and outflows have resulted in an increase of the net financial position in the amount of €887 million which breaks down as follows:
• Cash reserve improved by €1,785 million; • Net debt before cash and cash equivalents increased by €898 million as a result of the following changes:
(in million euros) 30 June 2017 30 June 201631 December
2016
Increase in borrowings 1,003 1,203 1,262
Repayment of borrowings and conversion of bonds (100) (2,023) (2,921)
(Increase) decrease in non-current financial assets 3 8 (70)
(Increase) decrease in current financial assets (134) (198) 160
Increase (decrease) in current financial liabilities 126 (39) 21
898 (1,049) (1,548)Net cash flows with Group finance companies (1) (104) (443)
Total 897 (1,153) (1,991)
Increase in borrowings in the amount of €1,003 million notably includes bonds issues by Peugeot S.A. of €600 million and €100 million on 23 March 2017, as well as the borrowing of €250 million subscribed on 1 March 2017 by PSA Automobiles S.A. to the European Investment Bank (see Note 10.4.C).
Furthermore, the non-cash changes represented a decrease of €69 million in the net financial position of the Group.
10.3. FINANCIAL SECURITY
(in million euros) Note 30 June 201731 December
2016
Cash and cash equivalents 10.4.A 13,253 11,576
Financial investments 165 110Current & non current financial assets 1,199 1,088
Total 14,617 12,774Lines of credit (undrawn) – excluding Faurecia 3,000 3,000Lines of credit (undrawn) – Faurecia 1,200 1,200
Total financial security 18,817 16,974
of which Faurecia 2,834 2,840
€686 million (€585 million at 31 December 2016) and €513 million (€503 million at 31 December 2016) in current and non-current financial assets respectively were included in the calculation of financial security, representing a total of €1,199 million (€1,088 million at 31 December 2016).
PSA Group Half-Year Financial Report 2017 - 33

SYNDICATED LINES OF CREDIT
The Group's manufacturing and sales companies have the following additional borrowing capacity under revolving lines of credit expiring at various dates through to 2021:
(in million euros) 30 June 201731 December
2016
Peugeot S.A. and GIE PSA Trésorerie 3,000 3,000
Faurecia 1,200 1,200
4,200 4,200Undrawn confirmed lines of credit
The €2,000 million tranche of the Peugeot S.A. and GIE PSA Trésorerie facility matures in November 2020. The balance matures in November 2018 for €17 million and in November 2019 for €983 million. This last €1,000 million tranche has a second optional one-year extension (November 2019 to November 2020) on hand’s banks. This credit facility was undrawn at the period-end. The drawing of this facility is subject to the respect of:
• a level of net debt of manufacturing and sales companies of less than of €6 billion; • a ratio of the net debt of manufacturing and sales companies to consolidated equity of less than 1.
The net debt (net financial position) of manufacturing and sales companies is defined and disclosed in Note 10.2. The Group’s equity is that listed under “Total Equity” in liabilities. Both covenants were met at 30 June 2017.
Faurecia’s additional borrowing capacity, other than trough Peugeot S.A., results from a new syndicated line of credit arranged on 15 December 2014. It comprises only one €1,200 million tranche expiring in December 2019. Following the signing of an amendment on 24 June 2016, the maturity of the line was extended to 24 June 2021. This credit facility was undrawn at the period-end. 10.4. BREAKDOWN OF FINANCIAL ASSETS AND FINANCIAL LIABILITIES
A. Cash and cash equivalents Cash and cash equivalents include:
(in million euros) 30 June 201731 December
2016
Mutual fund units and money market securities 9,803 8,389
Cash and current account balances 3,450 3,187
Total - manufacturing and sales companies 13,253 11,576
of which deposits with finance companies (8) (8)
Total 13,245 11,568
B. Breakdown of financial liabilities
(in million euros) Non-current Current Non-current Current
Other bonds 3,840 940 3,706 393
Finance lease liabilities 135 25 143 23
Other long-term borrowings 885 266 674 251
Other short-term financing and overdraft facilities - 1,079 - 981
Derivative instruments and other 1 1 3 13
Total financial liabilities 4,861 2,311 4,526 1,661
Carrying amount at 30 June 2017
Carrying amount at 31 December 2016
Amortised cost or fair value Amortised cost or fair value
34 - PSA Group Half-Year Financial Report 2017

C. Main financing transactions during the first-half 2017 The main transactions during the first-half 2017 were as follows:
Bond issues by manufacturing and sales companies (excluding Faurecia) On 23 March 2017, Peugeot S.A. issued €600 million and €100 million in fixed-rate 2% bonds maturing in March 2024.
On 1 March 2017, PSA Automobiles S.A. obtained a €250 million loan maturing in March 2024, at an annual interest rate of 1.5%, from the European Investment Bank.
D. Financing by the assignment of receivables The Automotive Division and Faurecia meet part of their financing needs by selling receivables to financial institutions. The sale of receivables on its own distribution networks of the Automotive division to finance companies in partnership with Santander amounted to €4,307 million (€4,619 million at 31 December 2016). These receivables were previously financed by subsidiaries of Banque PSA Finance.
The other financings by assignment of receivables are as follows:
(in million euros)Total
receivables sold to
financial institutions
Portion sold but not
derecognised
Total receivables
sold to financial institutions
Portion sold but not
derecognised
Portion financed by third party financial institutions(1) 2,781 99 2,266 83
of which Faurecia group 822 51 864 27
30 June 2017 31 December 2016
(1) The financed portion of the receivab les corresponds to the portion that gives rise to a cash inflow.
NOTE 11 - FINANCING AND FINANCIAL INSTRUMENTS – FINANCE COMPANIES 11.1. CURRENT FINANCIAL ASSETS
A. Loans and receivables - finance companies
(in million euros) 30 June 201731 December
2016
Total net "Retail, Corporate and Equivalent" 292 286
Total net "Corporate Dealers" 53 60
Total 345 346
B. Cash and cash equivalents Cash and cash equivalents amounted to €593 million at 30 June 2017 (€530 million at 31 December 2016), including term loans, ordinary accounts receivable, and central bank deposits.
PSA Group Half-Year Financial Report 2017 - 35

11.2. FINANCING LIABILITIES – FINANCE COMPANIES
(in million euros) 30 June 201731 December
2016
Other debt securities 271 301
Bank borrowings 145 125
416 426
Customer deposits 10 4
426 430
Amounts due to Group manufacturing and sales companies (9) (9)
Total 417 421
Credit lines As of 30 June 2017, the credit lines totalling €307 million are detailed as follows:
• €280 million in undrawn revolving bilateral lines of credit; • €27 million in undrawn various bank lines of credit.
NOTE 12 - INCOME TAXES
Income taxes for the half-year period are calculated on the basis of pre-tax profit by tax jurisdiction, multiplied by the estimated effective tax rate for the full year. The tax impacts of specific transactions are recorded in the period during which the transactions occur. The total unrecognised deferred tax assets on French tax group’s deficits represented €3,801 million at 30 June 2017 (€3,694 million at 31 December 2016). The tax loss carryforwards for the French tax group as at 31 December 2016 amounted to €12,045 million. The theoretical tax expense can be reconciled to the tax expense reported in the consolidated income statement as follows:
(in million euros) 30 June 2017 30 June 2016 2016
Pre-tax profit (loss) from continuing operations 1,808 1,473 2,343
- (17) (16)
Pre-tax profit (loss) from operations to be continued in partnership - 126 248
Income (loss) before tax of fully-consolidated companies 1,808 1,582 2,575
French statutory income tax rate for the period 34.4% 34.4% 34.4%
(622) (545) (887)
Tax effect of the following items :
• Permanent differences (39) 72 114
• Income taxable at reduced rates 47 52 70
• Tax credits 17 35 27• Effect of differences in foreign tax rates and other 67 56 83
Income tax before impairment losses on the French tax group (530) (330) (593)
Effective tax rate applicable to the Group 29.3% 20.8% 23.0%
98 76 76• Other impairment losses (14) (94) (37)
Income tax expense (446) (348) (554)
• of which tax expense on continuing operations (446) (310) (517)
- 6 6
• of which tax expense on operations to be continued in partnership - (44) (43)
• Assets on French tax consolidation deficits of Peugeot S.A. generated during the year
Pre-tax profit (loss) before tax on expenses related to operations to be continued in partnership
Theoretical tax expense for the period based on the French statutory income tax rate
• of which tax expense on expenses related to operations to be continued in partnership
Tax credits include research tax credits that do not meet the definition of government grants.
36 - PSA Group Half-Year Financial Report 2017

NOTE 13 - EQUITY AND EARNINGS PER SHARE
13.1. EQUITY
A. Analysis of share capital
Right issues
Capital increase consecutive to the exercise of equity warrants As part of the capital increases carried out in the first half of 2014, equity warrants were issued to former shareholders, exercisable from the second year. At 30 June 2017, 128,295,194 warrants had been exercised, out of a total of 342,060,365 warrants issued. Their exercise resulted in the delivery of 44,903,318 new shares and a cash inflow of €288 million. The equity warrants (BSA) were exercisable until 29 April 2017. Performance share plans by Peugeot S.A. The performance share plan established in the first-half of 2017 is described in Note 7.2.A. Analysis of share capital
(in euros) 30 June 2017 31 December 2016
859,924,895 808,597,336
Equity warrants conversion 44,903,318 51,327,559
904,828,213 859,924,895
Share capital at beginning of period
Share capital at end of period
Situation at 30 June 2017 Share capital amounted to €904,828,213 at 30 June 2017, divided into shares with a par value of €1 each. It is fully paid-up. Shares may be held in registered or bearer form, at the shareholder’s discretion. Following the capital increases carried out in the first-half of 2017, the stakes of Lions Participation (BPI France) which entered the capital on 19 June 2017, Dongfeng Motor Group and the Peugeot family (FFP and Etablissements Peugeot Frères) each stood at 12.23% (12.86% at 31 December 2016) i.e. 110,622,220 shares each. For Dongfeng Motor Group, this stake accounted for 19.86% of the voting right, including treasury stock, and for 19.73% of the voting rights, excluding treasury stock. For the Peugeot family, this stake accounted for 17.56% of the voting right, including treasury stock, and for 17.45% of the voting rights, excluding treasury stock. For Lion Participation, this stake accounted for 9.93% of the voting right, including treasury stock, and for 9.87% of the voting rights, excluding treasury stock. The share price on 30 June 2017 was €17.47. B. Treasury stock From time to time, the Group may use the buyback authorisations given at Shareholders' Meetings to purchase Peugeot S.A. shares into treasury. No shares were bought back during the first-half of 2017.
Changes in treasury stock are presented in the following table:
(number of shares) 30 June 2017 31 December 2016
At beginning of period 9,113,263 9,113,263
Share buybacks - -
Share cancellations - -
Delivery of treasury shares (2015 performance share plan) (2,019,000) -
At period-end 7,094,263 9,113,263
Allocation
• Shares held for allocation on future share-based plans 4,448,263 4,448,263
• Shares held for allocation on the outstanding performance share plan of June 2015 446,000 2,465,000• Shares held for allocation on the outstanding performance share plan of June 2016 2,200,000 2,200,000
7,094,263 9,113,263 On 10 July 2017, the Management Board decided to allocate 2,693,000 treasury stocks to cover the 2017 performance share plan.
PSA Group Half-Year Financial Report 2017 - 37

13.2. EARNINGS PER SHARE
Basic earnings per share and diluted earnings per share are presented at the foot of the income statements. They are calculated as follows: A. Basic earnings per share – Attributable to equity holders of the parent Basic earnings per share are calculated on the basis of the weighted average number of shares outstanding during the period. The average number of shares outstanding is calculated by taking into account the number of shares issued and cancelled during the period and changes in the number of shares held in treasury stock.
First-half 2017 First-half 2016 2016
1,256 1,130 1,525
1,256 1,212 1,730Average number of €1 par value shares outstanding 875,018,138 803,395,640 802,566,768
1.44 1.41 1.90Basic earnings per €1 par value share (in euros) 1.44 1.51 2.16
Consolidated profit (loss) from continuing operations - attributable to equity holders of the parent (in million euros)
Basic earnings per €1 par value share of continuing operations - attributable to equity holders of the parent (in euros)
Consolidated profit (loss) - attributable to equity holders of the parent (in million euros)
B. Diluted earnings per share - Attributable to equity holders of the parent Diluted earnings per share are calculated by the treasury stock method. This consists of taking into account the exercise of stock options, performance share plans to employees and equity warrants. The performance share plans (see Note 7.2) and the equity warrants had a potentially dilutive effect at 30 June 2017. The following tables show the effects of the calculation:
(1) Effect on the average number of shares
Note First-half 2017 First-half 2016 2016
Average number of €1 par value shares outstanding 875,018,138 803,395,640 802,566,768
Dilutive effect, calculated by the treasury stock method, of:
• Equity warrants 21,706,312 51,996,319 91,404,878
• Performance share plans 7.2.A 4,221,767 2,465,300 4,115,300
900,946,217 857,857,259 898,086,946Diluted average number of shares
(2) Effect of Faurecia dilution on consolidated earnings of continuing operations - attributable to equity
holders of the parent
(in million euros) First-half 2017 First-half 2016 2016
1,256 1,130 1,525
- - -
1,256 1,130 3,541
1.39 1.32 1.70Diluted earnings of continuing operations - attributable to equity holders of the parent per €1 par value share (in euros)
Consolidated profit (loss) from continuing operations (after Faurecia dilution effect)
Consolidated profit (loss) from continuing operations - attributable to equity holders of the parent
Dilutive effect of Faurecia Oceane bond conversions, stock options and performance share grants
38 - PSA Group Half-Year Financial Report 2017

(3) Effect of Faurecia dilution on consolidated earnings - attributable to equity holders of the parent
(in million euros) First-half 2017 First-half 2016 2016
Consolidated profit (loss) - attributable to equity holders of the parent 1,256 1,212 1,730
- - -
Consolidated profit (loss) after Faurecia dilution 1,256 1,212 1,730
1.39 1.41 1.93Diluted earnings attributable to equity holders of the parent per €1 par value share (in euros)
Dilutive effect of Faurecia Oceane bond conversions, stock options and performance share grants
The stock option plans as well as the performance share plans have a potential impact on the total number of Faurecia shares outstanding without affecting the number of shares held by the PSA Group. Consequently, they have potentially a dilutive effect on consolidated profit attributable to the PSA Group. Given the characteristics of Faurecia’s performance share plans, they were not dilutive at 30 June 2017.
NOTE 14 - NOTES TO THE CONSOLIDATED STATEMENTS OF CASH FLOWS
14.1. ANALYSIS OF NET CASH AND CASH EQUIVALENT REPORTED IN THE STATEMENTS OF CASH FLOWS
(in million euros) Notes 30 June 2017 30 June 2016 31 December 2016
Cash and cash equivalents 10.4.A 13,253 11,056 11,576
Payments issued and other (62) (52) (112)
Net cash and cash equivalents - manufacturing and sales companies 13,191 11,004 11,464
Net cash and cash equivalents - finance companies 11.1.B 593 601 530Elimination of intragroup transactions (9) (54) (8)
Total 13,775 11,551 11,986
14.2. DETAIL OF CASH FLOW FROM OPERATIONS TO BE CONTINUED IN PARTNERSHIP
(in million euros) 30 June 2017 30 June 2016 2016
- (11) (11)
- (2,072) (2,299)
- (2,083) (2,310)
Profit (loss) from operations to be continued in partnership - 83 204
Change in assets and liabilities of operations to be continued in partnership - 1,080 759
Net dividends received from operations to be continued in partnership - (51) (120)
- 1,112 843
Other expenses related to the non-transferred financing of operations to be continued in partnershipChange in liabilities related to the financing of operations to be continued in partnershipNet cash related to the non-transferred debt of finance companies to be continued in partnership
Net cash from the transferred assets and liabilities of operations held for sale or to be continued in partnership
14.3. DETAIL OF FREE CASH FLOW FROM MANUFACTURING AND SALES OPERATIONS
(in million euros) 30 June 2017 30 June 2016 2016
Net cash from (used in) operating activities of continuing operations 3,047 3,187 4,937
Net cash from (used in) investing activities of continuing operations (1,931) (1,560) (2,673)
Dividends received from Banque PSA Finance - 219 434
Free Cash Flow 1,116 1,846 2,698
Minus, net cash from non-recurring operating operations (453) (272) 164
Operational Free Cash Flow from manufacturing and sales operations 1,569 2,118 2,534
PSA Group Half-Year Financial Report 2017 - 39

NOTE 15 - CONTINGENT LIABILITIES Other than the risks for which provisions have been set aside (see Note 8), the main contingent liabilities are as follows.
15.1. FAURECIA On 28 April 2017 the European Commission decided to terminate the investigation of certain suppliers of emission control systems initiated on 25 March 2014 based on suspicions of anti-competitive practices in that market. Faurecia was one of the companies covered by this investigation.
On 24 March 2016, two class action suits were filed with the United States District Court for the Eastern District of Michigan against several suppliers of emission control systems following allegations of anti-competitive practices relating to exhaust systems. Damages for an unspecified amount were claimed. Faurecia Emissions Control Technologies US, LLC is one of the companies involved. Faurecia S.A., initially an additional defendant in these proceedings, was excluded from these two class action suits by a decision handed down by the Court of First Instance on 21 March 2017. On 9 November 2016, a third class action suit was also brought before the Court of First Instance.
On 19 May 2017, the Brazilian Competition Authority (CADE) initiated a survey of Faurecia Emissions Control Technologies do Brasil and some of its former employees, alleging anti-competitive practices in the Brazilian emission control market.
In the event that anti-competitive practices are proven, possible sanctions include fines, criminal charges or civil damages. Faurecia is at present unable to predict the consequences of such inquiries including the level of fines or sanctions that could be imposed : therefore, no accruals were accounted for as of June 30th, 2017.
15.2. GEFCO Representations and warranties were made to JSC Russian Railways (RZD) as part of its acquisition of the GEFCO group from Groupe PSA on 5 November 2012. At 30 June 2017, the Group had not identified any material risks associated with these representations and warranties. Under the logistics and transportation service agreements entered into by Groupe PSA and the GEFCO group, Groupe PSA gave guarantees regarding the satisfactory performance of the logistics contracts and a five-year exclusivity clause. An amendment signed in November 2016 supplemented these logistics and transportation service agreements. This amendment, which came into effect on 1 January 2017, extends the exclusivity clause until the end of 2021 and confirms the guarantees regarding the satisfactory performance of the logistics contracts given by Groupe PSA. At 30 June 2017, the Group had not identified any material risks associated with these representations and warranties.
NOTE 16 - RELATED PARTIES TRANSACTIONS
Related parties are companies subject to significant influence accounted at equity, members of the managing bodies and shareholders holding more than 10% of Peugeot S.A. capital.
Transactions with equity-accounted companies are disclosed in Note 9.5. Other than these transactions, there were no significant transactions with other related parties.
NOTE 17 - SUBSEQUENT EVENTS
No events occurred between 30 June 2017 and the 25 July 2017 meeting of the Supervisory Board to review the financial statements that could have a material impact on economic decisions made on the basis of these financial statements, with the exception of the following event.
As of today, Changan has not confirmed the execution of its commitment to fund our joint venture CAPSA.
40 - PSA Group Half-Year Financial Report 2017

IV. PERSONS RESPONSIBLES FOR THE 2017 INTERIM FINANCIAL REPORT
Person Responsible for the 2017 Interim Financial Report
Mr Carlos Tavares
Chairman of the Managing Board
Peugeot S.A.
Statement by the Person Responsible for the 2017 Interim Financial Report
“I hereby declare that, to the best of my knowledge, the condensed interim consolidated financial statements for the past six-
month period included in the interim financial report have been prepared under generally accepted accounting principles and
give a true and fair view of the assets, liabilities, financial position and results of Peugeot S.A. and the companies in the
consolidated group, and that the interim management report on pages 2 to 8 includes a fair review of the material events that
occurred in the first six months of the financial year and their impact on the interim accounts, a description of the main related-
party transactions and a discussion of the principal risks and uncertainties for the remaining six months of the year.”
Carlos Tavares
Chairman of the Peugeot S.A. Managing Board
Person Responsible for Financial Information
Frédéric Brunet
Head of Financial Communication and Investor Relations
Phone: 00 33 (0)1 40 66 42 59
PSA Group Half-Year Financial Report 2017 - 41

V. STATUTORY AUDITORS’ REVIEW REPORT ON THE 2017 HALF-YEARLY FINANCIAL INFORMATION
This is a free translation into English of the statutory auditors' review report on the half-yearly financial information issued in
French and is provided solely for the convenience of English-speaking users. This report includes information relating to the
specific verification of information given in the group’s half-yearly management report. This report should be read in
conjunction with, and construed in accordance with, French law and professional standards applicable in France.
To the Shareholders, In compliance with the assignment entrusted to us by your annual general meeting and in accordance with the requirements of article L. 451-1-2 III of the French monetary and financial code (Code monétaire et financier), we hereby report to you on: • the review of the accompanying condensed half-yearly consolidated financial statements of Peugeot S.A., for the period
from January 1 to June 30, 2017,
• the verification of the information presented in the half-yearly management report.
These condensed half-yearly consolidated financial statements are the responsibility of the Executive Board. Our role is to express a conclusion on these financial statements based on our review.
1. Conclusion on the financial statements
We conducted our review in accordance with professional standards applicable in France. A review of interim financial information consists of making inquiries, primarily of persons responsible for financial and accounting matters, and applying analytical and other review procedures. A review is substantially less in scope than an audit conducted in accordance with professional standards applicable in France and consequently does not enable us to obtain assurance that we would become aware of all significant matters that might be identified in an audit. Accordingly, we do not express an audit opinion. Based on our review, nothing has come to our attention that causes us to believe that the accompanying condensed half-yearly consolidated financial statements are not prepared, in all material respects, in accordance with IAS 34 – standard of the IFRSs as adopted by the European Union applicable to interim financial information.
2. Specific verification
We have also verified the information presented in the half-yearly management report on the condensed half-yearly consolidated financial statements subject to our review.
We have no matters to report as to its fair presentation and consistency with the condensed half-yearly consolidated financial statements.
Courbevoie and Paris-La Défense, July 26, 2017
The statutory auditors
French original signed by
MAZARS ERNST & YOUNG et Autres
Jérôme de Pastors Thierry Blanchetier Ioulia Vermelle Laurent Miannay
42 - PSA Group Half-Year Financial Report 2017

Photo credits:PEUGEOT COMMUNICATION
CITROËN COMMUNICATION / William CROZES / Continental ProductionsMARQUE DS
GROUPE PSA / Communications Department

PEUGEOT S.A.Incorporated in France with issued capital of €904 828 213
Governed by a Managing Board and a Supervisory Board
Registered Offi ce: 75, avenue de la Grande-Armée
75116 Paris – France
R.C.S. Paris B 552 100 554 – Siret 552 100 554 00021
Phone: + 33 (0)1 40 66 55 11 – Fax: + 33 (0)1 40 66 54 14
groupe-psa.com