haitong csi300 index etf 30.06.2015 sent to cs v03 … ultrapower software co ltd 55,300 842,772...
TRANSCRIPT

RESTRICTED
Unaudited Semi-Annual Report 2015
HAITONG ETF SERIES – HAITONG CSI300 INDEX ETF
(A sub-fund of the Haitong ETF series as an
umbrella unit trust under Hong Kong law)
For the period from 1 January 2015 to 30 June 2015
RESTRICTED
HAITONG CSI300 INDEX ETF
(A SUB-FUND OF HAITONG ETF SERIES)
CONTENTS
Pages
MANAGEMENT AND ADMINISTRATION 1 - 2
REPORT OF THE MANAGER TO THE UNITHOLDERS 3
STATEMENT OF FINANCIAL POSITION (UNAUDITED) 4
INVESTMENT PORTFOLIO (UNAUDITED) 5 - 12
STATEMENT OF MOVEMENTS IN INVESTMENT PORTFOLIO (UNAUDITED) 13 - 22
PERFORMANCE TABLE (UNAUDITED) 23
DISTRIBUTION DISCLOSURE (UNAUDITED) 24
UNDERLYING INDEX CONSTITUENT STOCKS DISCLOSURE 25
REPORT ON INVESTMENT OVERWEIGHT (UNAUDITED) 26

RESTRICTED 1
HAITONG CSI300 INDEX ETF
(A SUB-FUND OF HAITONG ETF SERIES)
MANAGEMENT AND ADMINISTRATION
Directors of the Manager
Lo Wai Ho
Poon Mo Yiu
Zhang Xinjun
Zhang Yibin
Yang Jianxin
Manager
Hai Tong Asset Management (HK) Limited
22/F, Li Po Chun Chambers
189 Des Voeux Road Central
Hong Kong
Trustee and Registrar
HSBC Institutional Trust Services (Asia) Limited
1 Queen’s Road Central
Hong Kong
Auditors
Ernst & Young
22/F, CITIC Tower
1 Tim Mei Avenue, Central
Hong Kong
Service Agent
HK Conversion Agency Services Limited
2/F, Infinitus Plaza
199 Des Voeux Road Central
Hong Kong
Custodian
The Hongkong and Shanghai Banking
Corporation Limited
1 Queen’s Road Central
Hong Kong
Legal Advisers to the Manager
King & Wood Mallesons
13/F, Gloucester Tower
The Landmark
15 Queen’s Road Central, Central
Hong Kong
PRC Custodian
HSBC Bank (China) Company Limited
33/F, HSBC Building Shanghai IFC
8 Century Avenue, Pudong
Shanghai 200120, China
RQFII Holder
Haitong International Holdings Limited
22/F, Li Po Chun Chambers
189 Des Voeux Road Central
Hong Kong
Investment Adviser (Terminated on 30 April
2015)
CSOP Asset Management Limited
Suite 2802, Two Exchange Square
8 Connaught Place, Central
Hong Kong
RESTRICTED 2
HAITONG CSI300 INDEX ETF
(A SUB-FUND OF HAITONG ETF SERIES)
MANAGEMENT AND ADMINISTRATION (continued)
Participating Dealers
ABN AMRO Clearing Hong Kong Limited
Level 70, International Commerce Centre
1 Austin Road West, Kowloon
Hong Kong
China Merchants Securities (HK) Co., Limited
48/F, One Exchange Square, Central,
Hong Kong
Credit Suisse Securities (Hong Kong) Limited
6/F, Alexandra House
18 Chater House, Central
Hong Kong
Goldman Sachs (Asia) Securities Limited
68/F Cheung Kong Center,
2 Queen’s Road Central
Hong Kong
Haitong International Securities Company Limited
22/F, Li Po Chun Chambers,
189 Des Voeux Road Central
Hong Kong
The Hongkong and Shanghai Banking Corporation Limited
1 Queen’s Road Central
Hong Kong
KGI Securities (Hong Kong) Limited
41/F, Central Plaza,
18 Harbour Road, Wanchai,
Hong Kong
Merrill Lynch Far East Limited
15/F, Citibank Tower,
3 Garden Road, Central,
Hong Kong
Nomura International (Hong Kong) Limited
30/F, Two International Finance Centre,
8 Finance Street, Central,
Hong Kong
Standard Chartered Bank (Hong Kong) Limited
32/F, 4-4A Des Veoux Road, Central
Hong Kong
UBS Securities Hong Kong Limited
42/F, One Exchange Square,
8 Connaught Road, Central
Hong Kong

RESTRICTED 3
HAITONG CSI300 INDEX ETF
(A SUB-FUND OF HAITONG ETF SERIES)
REPORT OF THE MANAGER TO THE UNITHOLDERS
Market Review
On macroeconomic level, in the first half of 2015, China's economic operation was stable. China's GDP was up 7.0% from a year earlier. Although in the same period, the global economic recovery was weak, and China import and export declined, but the investment and consumption kept good growth. Many indicators stabilized. The whole economic is steady. We also think that economy needs further consolidation. Combined with the internal and external environment is more complex, we believe that the government would support strongly.
Overall, China's economy has implemented soft landing successfully. Maintaining reasonable growth and keeping further structure adjustment will still be the most important directions in the next period.
In the first half of 2015, the CSI 300 index was up 26.58%, and the valuation has recovered to 14.64x PE (based on expected earnings of 2015).
Portfolio review
In the first half of 2015, Fund’s NAV per unit increased 27.90%. The underlying index returned 26.58% during the same period. The annualized tracking error of the fund is 0.6%.
Market Outlook
In the first half of 2015, the China’s A-share market increased so fast and the volatility of the market was in high level. Currently, the risk of volatility reduces smoothly. The reducing of the A-share market leverage will help the market to keep stable development.
Looking forward to the next period,we still believe that “Growth stabilization and Structure
adjustment” will be the most important theme of China economy. Some grand strategies, just like
"made in China 2025", "Internet +" are worthy of our continued attention. The RMB internationalization, potential establishment of “Shenzhen-Hong Kong stock connect”, the increased quota of QFII,RQFII and QDII and the further discussion of including A share into the MSCI index will still open up more opportunity for the China financial market.
In general, we hold a positive view on the A share market in the next period of 2015.
Hai Tong Asset Management (HK) Limited

RESTRICTED 4
HAITONG CSI300 INDEX ETF
(A SUB-FUND OF HAITONG ETF SERIES)
STATEMENT OF FINANCIAL POSITION (Unaudited)
As at 30 June 2015
(Unaudited) (Audited)
As at 30 June As at 31 December
2015 2014
RMB RMB
ASSETS
Financial assets at fair value through profit or loss 541,306,996 686,583,934
Amounts due from participating dealers - 758,859
Amounts due from a broker 1,441 779,797
Deposit reserve - China Exchange Clearing 168,000 336,000
Prepayments and other receivables 43,963 34,440
Cash and bank balances 33,122,358 126,593,864
––––––––––– –––––––––––
TOTAL ASSETS 574,642,758 815,086,894
══════════ ══════════ LIABILITIES
Amounts due to a participating dealer 23,866,945 1,083,392
Management fee payable 345,693 433,166
Trustee fee payable 84,169 104,688
Tax payable 5,482,617 5,482,617
Redemption payable - 110,747,248
Other payables and accruals 285,762 324,469
––––––––––– –––––––––––
TOTAL LIABILITIES 30,065,186 118,175,580
══════════ ══════════
EQUITY
Net assets value attributable to unitholders 544,577,572 696,911,314
══════════ ══════════
TOTAL LIABILITIES AND EQUITY 574,642,758 815,086,894
══════════ ══════════
Number of units in issue 33,000,000 54,000,000
══════════ ══════════
Net asset value per unit 16.5024 12.9058
══════════ ══════════

HAITONG CSI300 INDEX ETF
(A SUB-FUND OF HAITONG ETF SERIES)
INVESTMENT PORTFOLIO (Unaudited)
As at 30 June 2015
RESTRICTED 5
Fair value % of Net
Holdings RMB Assets
Listed equities
China
Agricultural Bank of China Ltd 1,236,100 4,585,931 0.84
Aier Eye Hospital Group Co Ltd 18,147 585,422 0.11
Air China Ltd 119,600 1,837,056 0.34
Aisino Co Ltd 25,867 1,673,854 0.31
Aluminum Corporation of China Ltd 225,800 2,106,714 0.39
Angang Steel Co Ltd 86,400 630,720 0.12
Anhui Conch Cement Co Ltd 93,604 2,007,806 0.37
Anhui USTC iFLYTEK Co Ltd 39,676 1,386,279 0.25
AVIC Aero-Engine Controls Co Ltd 21,600 716,256 0.13
AVIC Aircraft Co Ltd 62,000 2,701,960 0.50
AVIC Aviation Engine Corporation Plc 27,459 1,459,446 0.27
AVIC Helicopter Co Ltd 10,700 662,865 0.12
AVIC Investment Holdings Co Ltd 104,700 2,423,805 0.44
Bank of Beijing Co Ltd 394,832 5,259,162 0.97
Bank of China Ltd 1,082,700 5,294,403 0.97
Bank of Communications Co Ltd 916,500 7,551,960 1.39
Bank of Nanjing Co Ltd 82,750 1,886,700 0.35
Bank of Ningbo Co Ltd 75,680 1,600,632 0.29
Baoshan Iron & Steel Co Ltd 231,100 2,019,814 0.37
BBMG Corporation 50,600 604,670 0.11
Beijing Zhongchuang Telecom Test Co Ltd 6,900 302,841 0.06
Beijing Capital Co Ltd 45,000 645,750 0.12
Beijing Dabeinong Technology Group Co Ltd 69,800 943,696 0.17
Beijing Enlight Media Co Ltd 20,680 514,932 0.09
Beijing Jingneng Thermal Power Co Ltd 64,600 576,878 0.11
Beijing Orient Landscape & Ecology Co Ltd 21,950 840,685 0.15
Beijing Origin Water Technology Co Ltd 24,900 1,214,871 0.22
Beijing Shiji Information Technology Co Ltd 5,700 740,943 0.14
Beijing SL Pharmaceutical Co Ltd 12,734 721,381 0.13
Beijing Tongrentang Co Ltd 31,919 1,146,211 0.21
Beijing Ultrapower Software Co Ltd 55,300 842,772 0.15
Beijing Yanjing Brewery Co Ltd 65,648 682,739 0.13
Beijing Zhongke Sanhuan High-Tech Co Ltd 39,850 821,308 0.15
Beingmate Baby and Child Food Co Ltd 23,569 457,474 0.08
Beiqi Foton Motor Co Ltd 77,900 687,857 0.13
BlueFocus Communication Group Co Ltd 62,945 995,160 0.18
BOE Technology Group Co Ltd 475,580 2,468,260 0.45
Bright Dairy & Food Co Ltd 29,008 667,184 0.12
BYD Co Ltd 22,106 1,220,914 0.22
Changjiang Securities Co Ltd 154,848 2,160,130 0.40

HAITONG CSI300 INDEX ETF
(A SUB-FUND OF HAITONG ETF SERIES)
INVESTMENT PORTFOLIO (Unaudited) (continued)
As at 30 June 2015
RESTRICTED 6
Fair value % of Net
Holdings RMB Assets
Listed equities (continued)
China (continued)
Chengdu Xingrong Environment Co Ltd (formerly known as Chengdu
Xingrong Investment Co Ltd) 83,601 800,062 0.15
China Avionics Systems Co Ltd (formerly known as China Avic
Electronics Co Ltd) 24,444 853,829 0.16
China Baoan Group Co Ltd 59,540 971,097 0.18
China CAMC Engineering Co Ltd 17,815 530,531 0.10
China CITIC Bank Corporation Ltd 148,838 1,147,541 0.21
China Coal Energy Co Ltd 85,593 977,472 0.18
China Communications Construction Co Ltd 71,300 1,252,028 0.23
China Construction Bank Corporation 447,800 3,192,814 0.59
China COSCO Holdings Co Ltd 142,600 1,779,648 0.33
China CSSC Holdings Ltd 32,148 1,655,622 0.30
China Dongfanghong Spacesat Co Ltd 27,801 1,583,545 0.29
China Eastern Airlines Corporation Ltd 158,600 1,953,952 0.36
China Everbright Bank Co Ltd 929,600 4,982,656 0.91
China First Heavy Industries 121,900 1,476,209 0.27
China Fortune Land Development Co Ltd 49,200 1,498,140 0.27
China Hainan Rubber Industry Group Co Ltd 55,500 542,790 0.10
China International Marine Containers (Group) Co Ltd 40,405 1,305,081 0.24
China International Travel Service Corporation Ltd 18,022 1,194,859 0.22
China Life Insurance Co Ltd 77,753 2,435,224 0.45
China Merchants Bank Co Ltd 773,284 14,475,876 2.66
China Merchants Property Development Co Ltd 59,862 1,894,034 0.35
China Merchants Securities Co Ltd 108,300 2,865,618 0.53
China Minmetals Rare Metal Earth Co Ltd 27,576 705,394 0.13
China Minsheng Banking Co Ltd 1,023,338 10,171,980 1.87
China Molybdenum Co Ltd 29,611 365,992 0.07
China National Chemical Engineering Co Ltd 92,200 901,716 0.17
China Northern Rare Earth (Group) High-Tech Co Ltd 101,550 1,842,117 0.34
China Oilfield Services Ltd 27,841 777,878 0.14
China Pacific Insurance Group Co Ltd 146,665 4,426,350 0.81
China Petroleum & Chemical Corporation 491,100 3,467,166 0.64
China Railway Group Ltd 319,300 4,371,217 0.80
China Railways Construction Corporation 143,900 2,249,157 0.41
China Resources Sanjiu Medical and Pharmaceutical Co Ltd 18,106 550,241 0.10
China Shenhua Energy Co Ltd 92,513 1,928,896 0.35
China Shipbuilding Industry Co Ltd 367,252 5,435,330 1.00
China Shipping Container Lines Co Ltd 148,000 1,406,000 0.26
China South Publishing & Media Group Co Ltd 33,632 770,509 0.14
China Southern Airlines Co Ltd 164,100 2,386,014 0.44
China State Construction Engineering Corporation Ltd 700,800 5,823,648 1.07

HAITONG CSI300 INDEX ETF
(A SUB-FUND OF HAITONG ETF SERIES)
INVESTMENT PORTFOLIO (Unaudited) (continued)
As at 30 June 2015
RESTRICTED 7
Fair value % of Net
Holdings RMB Assets
Listed equities (continued)
China (continued)
China United Network Communications Ltd 395,723 2,900,650 0.53
China Vanke Co Ltd 453,316 6,582,148 1.21
China XD Electric Co Ltd 95,500 978,875 0.18
China Yangtze Power Co Ltd 280,000 4,018,000 0.74
Chinese Universe Publishing & Media Co Ltd 25,700 615,772 0.11
Chongqing Changan Automobile Co Ltd 105,500 2,231,325 0.41
Chongqing Water Group Co Ltd 26,930 289,228 0.05
CITIC Guoan Information Industry Co Ltd 45,900 1,081,863 0.20
CITIC Securities Co Ltd 368,956 9,928,606 1.82
CRRC Corporation Ltd (formerly known as CSR Corporation Ltd) 427,870 7,855,693 1.44
Daqin Railway Co Ltd 277,448 3,895,370 0.72
Datang International Power Generation Co Ltd 140,400 1,120,392 0.21
DHC Software Co Ltd 36,002 1,035,057 0.19
Dongfang Electric Corporation Ltd 55,600 1,138,132 0.21
Dongxu Optoelectronic Technology Co Ltd 78,924 771,877 0.14
Dr Peng Telecom & Media Group Co Ltd 52,000 1,552,720 0.28
East Money Information Co Ltd 55,800 3,520,422 0.65
Everbright Securities Co Ltd 63,700 1,716,715 0.32
Fangda Carbon New Material Co Ltd 48,500 577,635 0.11
FAW Car Co Ltd 37,910 943,201 0.17
Finance Street Holding Co Ltd 111,800 1,579,734 0.29
Foshan Haitian Flavouring & Food Co Ltd 12,494 399,058 0.07
Founder Securities Co Ltd 192,600 2,290,014 0.42
Fuyao Glass Industry Group Co Ltd 65,488 935,169 0.17
Gansu Yasheng Industrial (Group) Co Ltd 72,839 754,612 0.14
GD Power Development Co Ltd 459,100 3,199,927 0.59
Gemdale Corporation 105,000 1,328,250 0.24
Gezhouba Group Co Ltd 128,900 1,506,841 0.28
GF Securities Co Ltd 138,411 3,135,009 0.58
Glodon Software Co Ltd 31,495 736,983 0.14
GoerTek Inc 36,000 1,292,400 0.24
Gousen Securities Co Ltd 57,300 1,437,657 0.26
Great Wall Motor Co Ltd 20,500 876,580 0.16
Gree Electric Appliances Inc of Zhuhai 112,557 7,192,392 1.32
Guangdong Alpha Animation and Culture Co Ltd 21,898 828,839 0.15
Guangdong By-Health Biotechnology Co Ltd 13,600 534,208 0.10
Guangdong Golden Horse Tourism Group Stock Co Ltd 21,000 737,100 0.14
Guanghui Energy Co Ltd 146,720 1,525,888 0.28
Guangshen Railway Co Ltd 158,599 1,303,684 0.24
Guangxi Wuzhou Zhongheng Group Co Ltd 43,058 990,334 0.18
HAITONG CSI300 INDEX ETF
(A SUB-FUND OF HAITONG ETF SERIES)
INVESTMENT PORTFOLIO (Unaudited) (continued)
As at 30 June 2015
RESTRICTED 8
Fair value % of Net
Holdings RMB Assets
Listed equities (continued)
China (continued)
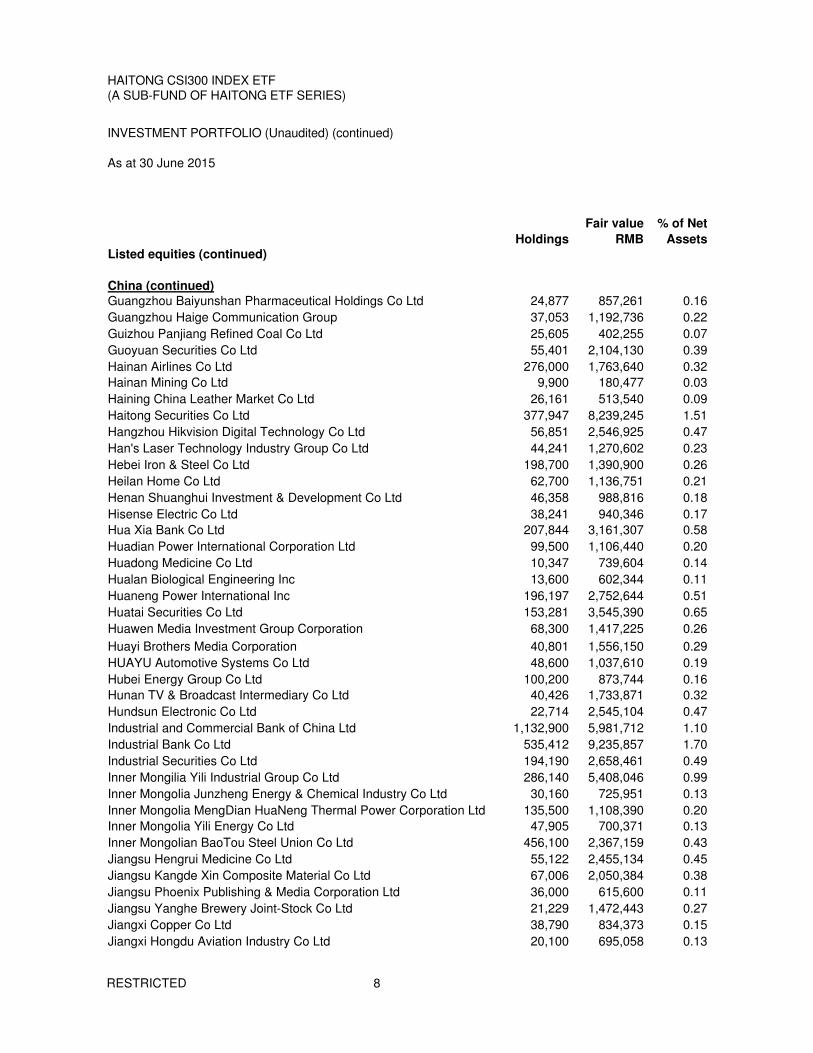
Guangzhou Baiyunshan Pharmaceutical Holdings Co Ltd 24,877 857,261 0.16
Guangzhou Haige Communication Group 37,053 1,192,736 0.22
Guizhou Panjiang Refined Coal Co Ltd 25,605 402,255 0.07
Guoyuan Securities Co Ltd 55,401 2,104,130 0.39
Hainan Airlines Co Ltd 276,000 1,763,640 0.32
Hainan Mining Co Ltd 9,900 180,477 0.03
Haining China Leather Market Co Ltd 26,161 513,540 0.09
Haitong Securities Co Ltd 377,947 8,239,245 1.51
Hangzhou Hikvision Digital Technology Co Ltd 56,851 2,546,925 0.47
Han's Laser Technology Industry Group Co Ltd 44,241 1,270,602 0.23
Hebei Iron & Steel Co Ltd 198,700 1,390,900 0.26
Heilan Home Co Ltd 62,700 1,136,751 0.21
Henan Shuanghui Investment & Development Co Ltd 46,358 988,816 0.18
Hisense Electric Co Ltd 38,241 940,346 0.17
Hua Xia Bank Co Ltd 207,844 3,161,307 0.58
Huadian Power International Corporation Ltd 99,500 1,106,440 0.20
Huadong Medicine Co Ltd 10,347 739,604 0.14
Hualan Biological Engineering Inc 13,600 602,344 0.11
Huaneng Power International Inc 196,197 2,752,644 0.51
Huatai Securities Co Ltd 153,281 3,545,390 0.65
Huawen Media Investment Group Corporation 68,300 1,417,225 0.26
Huayi Brothers Media Corporation 40,801 1,556,150 0.29
HUAYU Automotive Systems Co Ltd 48,600 1,037,610 0.19
Hubei Energy Group Co Ltd 100,200 873,744 0.16
Hunan TV & Broadcast Intermediary Co Ltd 40,426 1,733,871 0.32
Hundsun Electronic Co Ltd 22,714 2,545,104 0.47
Industrial and Commercial Bank of China Ltd 1,132,900 5,981,712 1.10
Industrial Bank Co Ltd 535,412 9,235,857 1.70
Industrial Securities Co Ltd 194,190 2,658,461 0.49
Inner Mongilia Yili Industrial Group Co Ltd 286,140 5,408,046 0.99
Inner Mongolia Junzheng Energy & Chemical Industry Co Ltd 30,160 725,951 0.13
Inner Mongolia MengDian HuaNeng Thermal Power Corporation Ltd 135,500 1,108,390 0.20
Inner Mongolia Yili Energy Co Ltd 47,905 700,371 0.13
Inner Mongolian BaoTou Steel Union Co Ltd 456,100 2,367,159 0.43
Jiangsu Hengrui Medicine Co Ltd 55,122 2,455,134 0.45
Jiangsu Kangde Xin Composite Material Co Ltd 67,006 2,050,384 0.38
Jiangsu Phoenix Publishing & Media Corporation Ltd 36,000 615,600 0.11
Jiangsu Yanghe Brewery Joint-Stock Co Ltd 21,229 1,472,443 0.27
Jiangxi Copper Co Ltd 38,790 834,373 0.15
Jiangxi Hongdu Aviation Industry Co Ltd 20,100 695,058 0.13
HAITONG CSI300 INDEX ETF
(A SUB-FUND OF HAITONG ETF SERIES)
INVESTMENT PORTFOLIO (Unaudited) (continued)
As at 30 June 2015
RESTRICTED 9
Fair value % of Net
Holdings RMB Assets
Listed equities (continued)
China (continued)
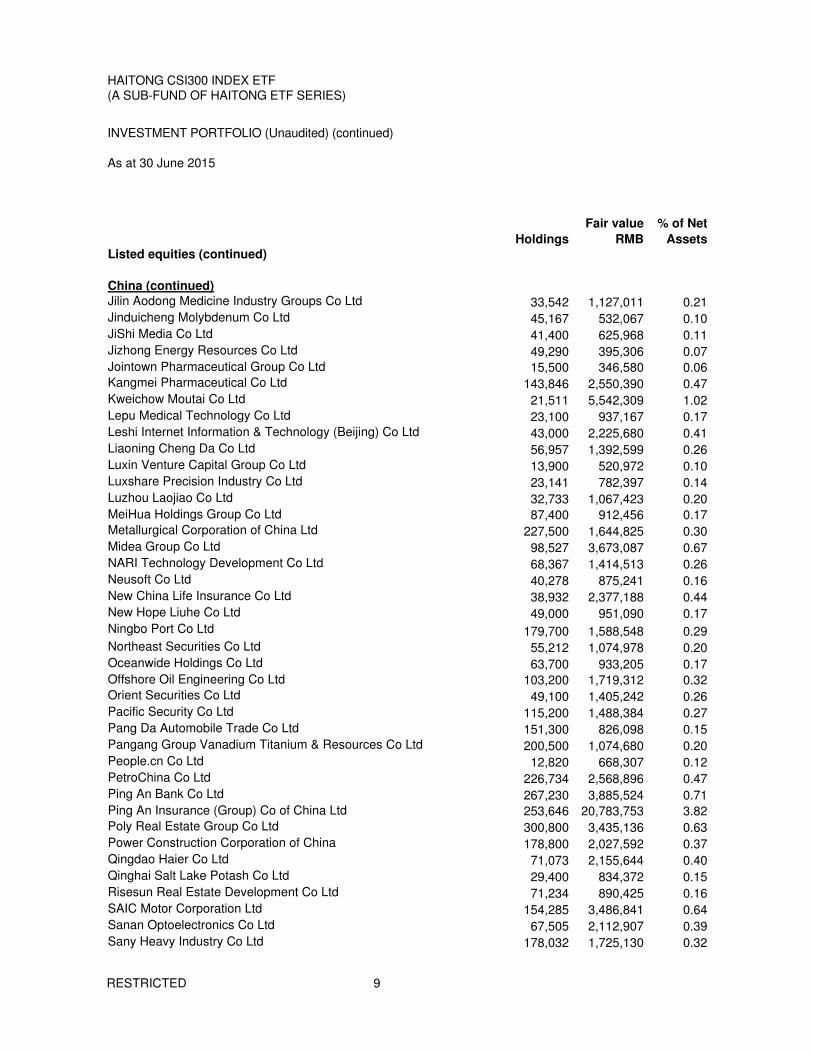
Jilin Aodong Medicine Industry Groups Co Ltd 33,542 1,127,011 0.21
Jinduicheng Molybdenum Co Ltd 45,167 532,067 0.10
JiShi Media Co Ltd 41,400 625,968 0.11
Jizhong Energy Resources Co Ltd 49,290 395,306 0.07
Jointown Pharmaceutical Group Co Ltd 15,500 346,580 0.06
Kangmei Pharmaceutical Co Ltd 143,846 2,550,390 0.47
Kweichow Moutai Co Ltd 21,511 5,542,309 1.02
Lepu Medical Technology Co Ltd 23,100 937,167 0.17
Leshi Internet Information & Technology (Beijing) Co Ltd 43,000 2,225,680 0.41
Liaoning Cheng Da Co Ltd 56,957 1,392,599 0.26
Luxin Venture Capital Group Co Ltd 13,900 520,972 0.10
Luxshare Precision Industry Co Ltd 23,141 782,397 0.14
Luzhou Laojiao Co Ltd 32,733 1,067,423 0.20
MeiHua Holdings Group Co Ltd 87,400 912,456 0.17
Metallurgical Corporation of China Ltd 227,500 1,644,825 0.30
Midea Group Co Ltd 98,527 3,673,087 0.67
NARI Technology Development Co Ltd 68,367 1,414,513 0.26
Neusoft Co Ltd 40,278 875,241 0.16
New China Life Insurance Co Ltd 38,932 2,377,188 0.44
New Hope Liuhe Co Ltd 49,000 951,090 0.17
Ningbo Port Co Ltd 179,700 1,588,548 0.29
Northeast Securities Co Ltd 55,212 1,074,978 0.20
Oceanwide Holdings Co Ltd 63,700 933,205 0.17
Offshore Oil Engineering Co Ltd 103,200 1,719,312 0.32
Orient Securities Co Ltd 49,100 1,405,242 0.26
Pacific Security Co Ltd 115,200 1,488,384 0.27
Pang Da Automobile Trade Co Ltd 151,300 826,098 0.15
Pangang Group Vanadium Titanium & Resources Co Ltd 200,500 1,074,680 0.20
People.cn Co Ltd 12,820 668,307 0.12
PetroChina Co Ltd 226,734 2,568,896 0.47
Ping An Bank Co Ltd 267,230 3,885,524 0.71
Ping An Insurance (Group) Co of China Ltd 253,646 20,783,753 3.82
Poly Real Estate Group Co Ltd 300,800 3,435,136 0.63
Power Construction Corporation of China 178,800 2,027,592 0.37
Qingdao Haier Co Ltd 71,073 2,155,644 0.40
Qinghai Salt Lake Potash Co Ltd 29,400 834,372 0.15
Risesun Real Estate Development Co Ltd 71,234 890,425 0.16
SAIC Motor Corporation Ltd 154,285 3,486,841 0.64
Sanan Optoelectronics Co Ltd 67,505 2,112,907 0.39
Sany Heavy Industry Co Ltd 178,032 1,725,130 0.32
HAITONG CSI300 INDEX ETF
(A SUB-FUND OF HAITONG ETF SERIES)
INVESTMENT PORTFOLIO (Unaudited) (continued)
As at 30 June 2015
RESTRICTED 10
Fair value % of Net
Holdings RMB Assets
Listed equities (continued)
China (continued)
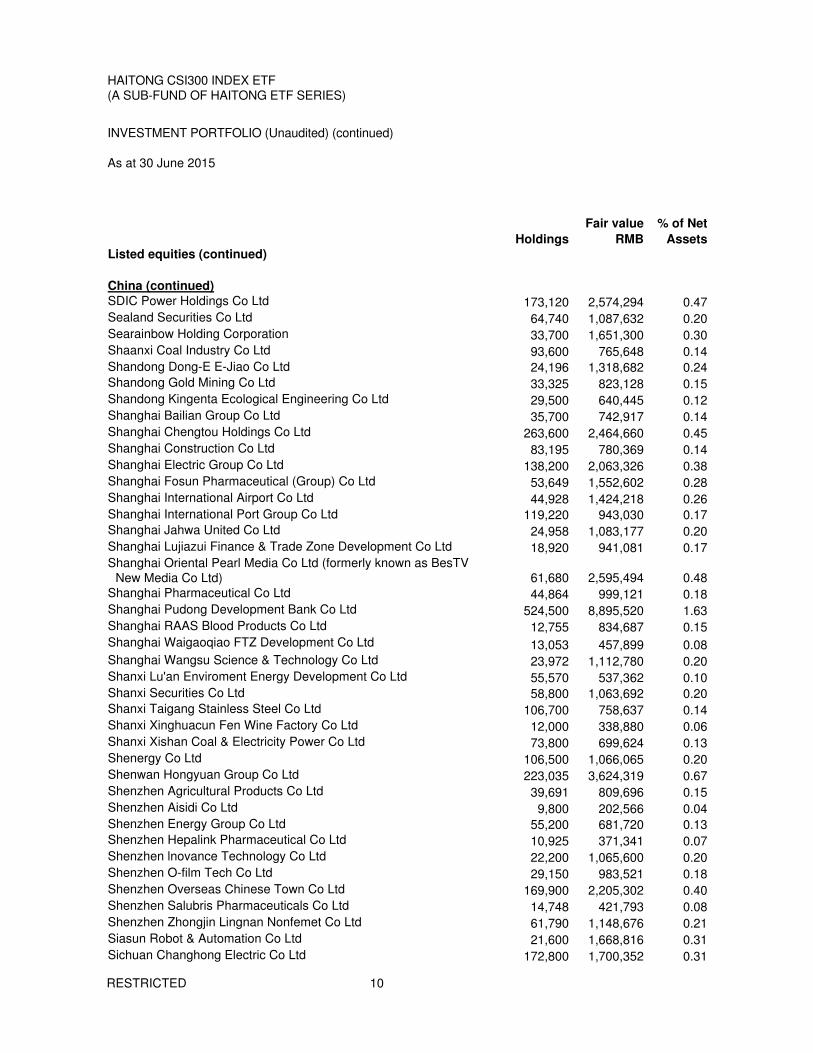
SDIC Power Holdings Co Ltd 173,120 2,574,294 0.47
Sealand Securities Co Ltd 64,740 1,087,632 0.20
Searainbow Holding Corporation 33,700 1,651,300 0.30
Shaanxi Coal Industry Co Ltd 93,600 765,648 0.14
Shandong Dong-E E-Jiao Co Ltd 24,196 1,318,682 0.24
Shandong Gold Mining Co Ltd 33,325 823,128 0.15
Shandong Kingenta Ecological Engineering Co Ltd 29,500 640,445 0.12
Shanghai Bailian Group Co Ltd 35,700 742,917 0.14
Shanghai Chengtou Holdings Co Ltd 263,600 2,464,660 0.45
Shanghai Construction Co Ltd 83,195 780,369 0.14
Shanghai Electric Group Co Ltd 138,200 2,063,326 0.38
Shanghai Fosun Pharmaceutical (Group) Co Ltd 53,649 1,552,602 0.28
Shanghai International Airport Co Ltd 44,928 1,424,218 0.26
Shanghai International Port Group Co Ltd 119,220 943,030 0.17
Shanghai Jahwa United Co Ltd 24,958 1,083,177 0.20
Shanghai Lujiazui Finance & Trade Zone Development Co Ltd 18,920 941,081 0.17
Shanghai Oriental Pearl Media Co Ltd (formerly known as BesTV
New Media Co Ltd) 61,680 2,595,494 0.48
Shanghai Pharmaceutical Co Ltd 44,864 999,121 0.18
Shanghai Pudong Development Bank Co Ltd 524,500 8,895,520 1.63
Shanghai RAAS Blood Products Co Ltd 12,755 834,687 0.15
Shanghai Waigaoqiao FTZ Development Co Ltd 13,053 457,899 0.08
Shanghai Wangsu Science & Technology Co Ltd 23,972 1,112,780 0.20
Shanxi Lu'an Enviroment Energy Development Co Ltd 55,570 537,362 0.10
Shanxi Securities Co Ltd 58,800 1,063,692 0.20
Shanxi Taigang Stainless Steel Co Ltd 106,700 758,637 0.14
Shanxi Xinghuacun Fen Wine Factory Co Ltd 12,000 338,880 0.06
Shanxi Xishan Coal & Electricity Power Co Ltd 73,800 699,624 0.13
Shenergy Co Ltd 106,500 1,066,065 0.20
Shenwan Hongyuan Group Co Ltd 223,035 3,624,319 0.67
Shenzhen Agricultural Products Co Ltd 39,691 809,696 0.15
Shenzhen Aisidi Co Ltd 9,800 202,566 0.04
Shenzhen Energy Group Co Ltd 55,200 681,720 0.13
Shenzhen Hepalink Pharmaceutical Co Ltd 10,925 371,341 0.07
Shenzhen lnovance Technology Co Ltd 22,200 1,065,600 0.20
Shenzhen O-film Tech Co Ltd 29,150 983,521 0.18
Shenzhen Overseas Chinese Town Co Ltd 169,900 2,205,302 0.40
Shenzhen Salubris Pharmaceuticals Co Ltd 14,748 421,793 0.08
Shenzhen Zhongjin Lingnan Nonfemet Co Ltd 61,790 1,148,676 0.21
Siasun Robot & Automation Co Ltd 21,600 1,668,816 0.31
Sichuan Changhong Electric Co Ltd 172,800 1,700,352 0.31

HAITONG CSI300 INDEX ETF
(A SUB-FUND OF HAITONG ETF SERIES)
INVESTMENT PORTFOLIO (Unaudited) (continued)
As at 30 June 2015
RESTRICTED 11
Fair value % of Net
Holdings RMB Assets
Listed equities (continued)
China (continued)
Sichuan Chuantou Energy Co Ltd 102,800 1,286,028 0.24
Sichuan Kelun Pharmaceutic Co Ltd 16,500 660,660 0.12
Sinolink Securities Co Ltd 86,286 2,105,378 0.39
Sinopec Shanghai Petrochemical Co Ltd 102,200 1,096,606 0.20
Soochow Security Co Ltd 62,866 1,286,867 0.24
Sound Environmental Resources Co Ltd 23,419 910,765 0.17
Southwest Securities Co Ltd 65,995 1,296,802 0.24
Spring Airlines Co Ltd 5,800 731,322 0.13
Suning Commerce Group Co Ltd 206,700 3,162,510 0.58
Suzhou Gold Mantis Constructions 44,143 1,244,391 0.23
Tasly Pharmaceutical Group Co Ltd 30,024 1,493,994 0.27
TBEA Co Ltd 120,737 1,788,115 0.33
TCL Corporation 399,000 2,254,350 0.41
Tianjin Port Co Ltd 39,100 586,109 0.11
Tianjin Zhonghuan Semiconductor Co Ltd 42,660 844,241 0.15
Tonghua Dongbao Pharmaceutical Co Ltd 36,880 808,778 0.15
Tongling Nonferrous Metals Group Co Ltd 96,600 815,304 0.15
Tsinghua Tongfang Co Ltd 82,900 1,740,071 0.32
Tsingtao Brewery Co Ltd 16,536 770,412 0.14
Universal Scientific Industrial Co Ltd 9,786 166,460 0.03
WanHua Chemical Group Co Ltd 50,406 1,218,817 0.22
Wanxiang Qianchao Co Ltd 53,760 1,175,194 0.22
Wasu Media Holdings Co Ltd 6,000 214,680 0.04
Weichai Power Co Ltd 56,262 1,781,255 0.33
Weifu High-Technology Co Ltd 27,877 863,908 0.16
Western Mining Co Ltd 88,800 969,696 0.18
Western Securities Co Ltd 52,500 1,489,425 0.27
Wintime Energy Co Ltd 156,840 1,079,059 0.20
Wuhan Iron & Steel Co Ltd 188,500 1,325,155 0.24
Wuliangye Yibin Co Ltd 88,379 2,801,614 0.51
XCMG Construction Machinery Co Ltd 66,300 879,801 0.16
Xiamen C&D Inc 83,258 1,457,848 0.27
Xiamen Tungsten Co Ltd 20,284 512,374 0.09
Xinhu Zhongbao Co Ltd 114,400 883,168 0.16
Xinjiang Goldwind Science & Technology Co Ltd 71,800 1,397,946 0.26
Xinxing Ductile Iron Pipes Co Ltd 113,400 1,469,664 0.27
Xizang Haisco Pharmaceutical Group Co Ltd 9,700 261,900 0.05
XJ Electric Co Ltd 28,450 715,802 0.13
Yangquan Coal Industry Group Co Ltd 55,910 573,078 0.11
Yantai Jereh Oilfield Services Group Co Ltd 25,881 1,147,822 0.21
HAITONG CSI300 INDEX ETF
(A SUB-FUND OF HAITONG ETF SERIES)
INVESTMENT PORTFOLIO (Unaudited) (continued)
As at 30 June 2015
RESTRICTED 12
Fair value % of Net
Holdings RMB Assets
Listed equities (continued)
China (continued)
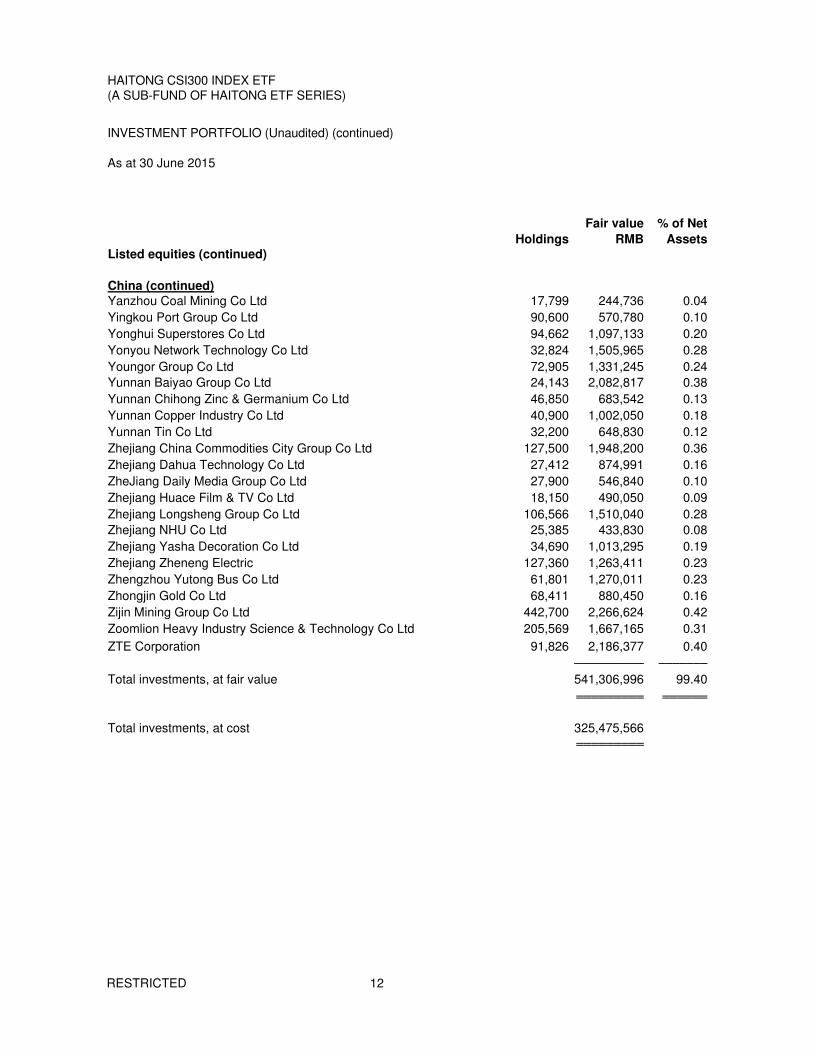
Yanzhou Coal Mining Co Ltd 17,799 244,736 0.04
Yingkou Port Group Co Ltd 90,600 570,780 0.10
Yonghui Superstores Co Ltd 94,662 1,097,133 0.20
Yonyou Network Technology Co Ltd 32,824 1,505,965 0.28
Youngor Group Co Ltd 72,905 1,331,245 0.24
Yunnan Baiyao Group Co Ltd 24,143 2,082,817 0.38
Yunnan Chihong Zinc & Germanium Co Ltd 46,850 683,542 0.13
Yunnan Copper Industry Co Ltd 40,900 1,002,050 0.18
Yunnan Tin Co Ltd 32,200 648,830 0.12
Zhejiang China Commodities City Group Co Ltd 127,500 1,948,200 0.36
Zhejiang Dahua Technology Co Ltd 27,412 874,991 0.16
ZheJiang Daily Media Group Co Ltd 27,900 546,840 0.10
Zhejiang Huace Film & TV Co Ltd 18,150 490,050 0.09
Zhejiang Longsheng Group Co Ltd 106,566 1,510,040 0.28
Zhejiang NHU Co Ltd 25,385 433,830 0.08
Zhejiang Yasha Decoration Co Ltd 34,690 1,013,295 0.19
Zhejiang Zheneng Electric 127,360 1,263,411 0.23
Zhengzhou Yutong Bus Co Ltd 61,801 1,270,011 0.23
Zhongjin Gold Co Ltd 68,411 880,450 0.16
Zijin Mining Group Co Ltd 442,700 2,266,624 0.42
Zoomlion Heavy Industry Science & Technology Co Ltd 205,569 1,667,165 0.31
ZTE Corporation 91,826 2,186,377 0.40
–––––––––– –––––––
Total investments, at fair value 541,306,996 99.40
═════════ ══════
Total investments, at cost 325,475,566
═════════

HAITONG CSI300 INDEX ETF
(A SUB-FUND OF HAITONG ETF SERIES)
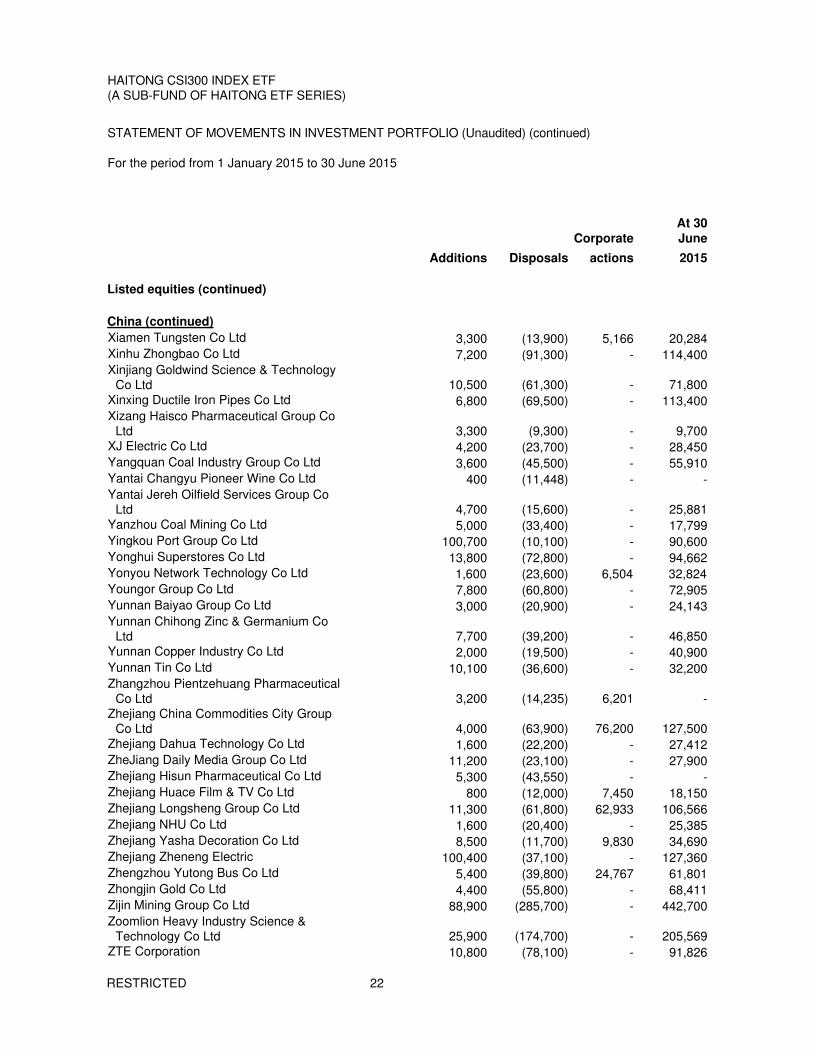
STATEMENT OF MOVEMENTS IN INVESTMENT PORTFOLIO (Unaudited)
For the period from 1 January 2015 to 30 June 2015
RESTRICTED 13
At 30
Corporate June
Additions Disposals actions 2015
Listed equities
China
Agricultural Bank of China Ltd 145,600 (1,010,000) - 1,236,100
Aier Eye Hospital Group Co Ltd 800 (12,600) 7,647 18,147
Air China Ltd 45,300 (63,700) - 119,600
Aisino Co Ltd 3,000 (21,400) - 25,867
Aluminum Corporation of China Ltd 65,400 (135,700) - 225,800
Angang Steel Co Ltd 43,700 (71,300) - 86,400
Anhui Conch Cement Co Ltd 58,700 (78,800) - 93,604
Anhui USTC iFLYTEK Co Ltd 1,600 (24,600) 16,492 39,676
AVIC Aero-Engine Controls Co Ltd 25,300 (3,700) - 21,600
AVIC Aircraft Co Ltd 6,800 (52,600) - 62,000
AVIC Aviation Engine Corporation Plc 1,600 (22,700) - 27,459
AVIC Helicopter Co Ltd 5,600 (6,700) - 10,700
AVIC Investment Holdings Co Ltd 36,200 (54,400) - 104,700
Bank of Beijing Co Ltd 125,900 (241,600) - 394,832
Bank of China Ltd 1,064,300 (525,200) - 1,082,700
Bank of Communications Co Ltd 237,400 (591,600) - 916,500
Bank of Nanjing Co Ltd 11,300 (71,700) - 82,750
Bank of Ningbo Co Ltd 31,500 (35,900) - 75,680
Baoshan Iron & Steel Co Ltd 28,200 (196,400) - 231,100
BBMG Corporation 3,200 (41,200) - 50,600
Beijing Zhongchuang Telecom Test Co
Ltd
3,200 (4,900) - 6,900
Beijing Capital Co Ltd 3,200 (48,300) - 45,000
Beijing Dabeinong Technology Group Co
Ltd
13,500 (30,800) 22,200 69,800
Beijing Enlight Media Co Ltd 1,200 (20,800) 5,280 20,680
Beijing Jingneng Thermal Power Co Ltd 34,400 (54,000) - 64,600
Beijing Orient Landscape & Ecology Co
Ltd
1,200 (11,700) - 21,950
Beijing Origin Water Technology Co Ltd 1,600 (22,900) - 24,900
Beijing Shiji Information Technology Co
Ltd
3,200 (4,900) - 5,700
Beijing SL Pharmaceutical Co Ltd 800 (10,300) - 12,734
Beijing Tongrentang Co Ltd 3,700 (24,300) - 31,919
Beijing Ultrapower Software Co Ltd 61,800 (6,500) - 55,300
Beijing Yanjing Brewery Co Ltd 4,400 (51,700) - 65,648
Beijing Zhongke Sanhuan High-Tech Co
Ltd
5,800 (33,600) - 39,850
Beingmate Baby and Child Food Co Ltd 4,100 (29,300) - 23,569
HAITONG CSI300 INDEX ETF
(A SUB-FUND OF HAITONG ETF SERIES)
STATEMENT OF MOVEMENTS IN INVESTMENT PORTFOLIO (Unaudited) (continued)
For the period from 1 January 2015 to 30 June 2015
RESTRICTED 14
At 30
Corporate June
Additions Disposals actions 2015
Listed equities (continued)
China (continued)
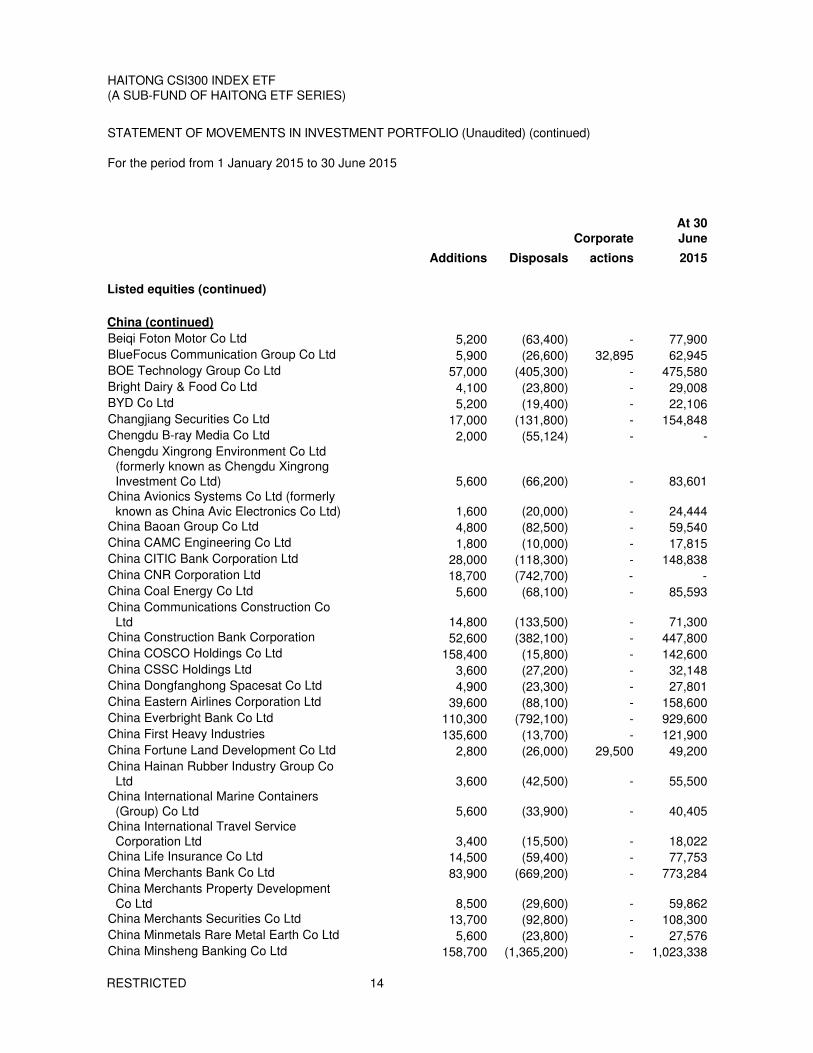
Beiqi Foton Motor Co Ltd 5,200 (63,400) - 77,900
BlueFocus Communication Group Co Ltd 5,900 (26,600) 32,895 62,945
BOE Technology Group Co Ltd 57,000 (405,300) - 475,580
Bright Dairy & Food Co Ltd 4,100 (23,800) - 29,008
BYD Co Ltd 5,200 (19,400) - 22,106
Changjiang Securities Co Ltd 17,000 (131,800) - 154,848
Chengdu B-ray Media Co Ltd 2,000 (55,124) - -
Chengdu Xingrong Environment Co Ltd
(formerly known as Chengdu Xingrong
Investment Co Ltd)
5,600 (66,200) - 83,601
China Avionics Systems Co Ltd (formerly
known as China Avic Electronics Co Ltd)
1,600 (20,000) - 24,444
China Baoan Group Co Ltd 4,800 (82,500) - 59,540
China CAMC Engineering Co Ltd 1,800 (10,000) - 17,815
China CITIC Bank Corporation Ltd 28,000 (118,300) - 148,838
China CNR Corporation Ltd 18,700 (742,700) - -
China Coal Energy Co Ltd 5,600 (68,100) - 85,593
China Communications Construction Co
Ltd
14,800 (133,500) - 71,300
China Construction Bank Corporation 52,600 (382,100) - 447,800
China COSCO Holdings Co Ltd 158,400 (15,800) - 142,600
China CSSC Holdings Ltd 3,600 (27,200) - 32,148
China Dongfanghong Spacesat Co Ltd 4,900 (23,300) - 27,801
China Eastern Airlines Corporation Ltd 39,600 (88,100) - 158,600
China Everbright Bank Co Ltd 110,300 (792,100) - 929,600
China First Heavy Industries 135,600 (13,700) - 121,900
China Fortune Land Development Co Ltd 2,800 (26,000) 29,500 49,200
China Hainan Rubber Industry Group Co
Ltd
3,600 (42,500) - 55,500
China International Marine Containers
(Group) Co Ltd
5,600 (33,900) - 40,405
China International Travel Service
Corporation Ltd
3,400 (15,500) - 18,022
China Life Insurance Co Ltd 14,500 (59,400) - 77,753
China Merchants Bank Co Ltd 83,900 (669,200) - 773,284
China Merchants Property Development
Co Ltd
8,500 (29,600) - 59,862
China Merchants Securities Co Ltd 13,700 (92,800) - 108,300
China Minmetals Rare Metal Earth Co Ltd 5,600 (23,800) - 27,576
China Minsheng Banking Co Ltd 158,700 (1,365,200) - 1,023,338

HAITONG CSI300 INDEX ETF
(A SUB-FUND OF HAITONG ETF SERIES)
STATEMENT OF MOVEMENTS IN INVESTMENT PORTFOLIO (Unaudited) (continued)
For the period from 1 January 2015 to 30 June 2015
RESTRICTED 15
At 30
Corporate June
Additions Disposals actions 2015
Listed equities (continued)
China (continued)
China Molybdenum Co Ltd 19,800 (9,300) - 29,611
China National Chemical Engineering Co
Ltd
6,000 (73,700) - 92,200
China Northern Rare Earth (Group) High-
Tech Co Ltd
7,700 (65,400) 41,350 101,550
China Oilfield Services Ltd 4,900 (23,300) - 27,841
China Pacific Insurance Group Co Ltd 17,900 (125,700) - 146,665
China Petroleum & Chemical Corporation 270,100 (227,800) - 491,100
China Railway Group Ltd 36,900 (271,600) - 319,300
China Railways Construction Corporation 16,200 (122,800) - 143,900
China Resources Sanjiu Medical and
Pharmaceutical Co Ltd
1,200 (14,800) - 18,106
China Shenhua Energy Co Ltd 17,500 (192,500) - 92,513
China Shipbuilding Industry Co Ltd 41,400 (268,900) - 367,252
China Shipping Container Lines Co Ltd 9,600 (119,100) - 148,000
China South Publishing & Media Group
Co Ltd 2,400 (26,900) - 33,632
China Southern Airlines Co Ltd 17,400 (137,000) - 164,100
China State Construction Engineering
Corporation Ltd
86,400 (598,700) - 700,800
China United Network Communications
Ltd
47,600 (337,600) - 395,723
China Vanke Co Ltd 85,200 (395,100) - 453,316
China XD Electric Co Ltd 10,900 (80,500) - 95,500
China Yangtze Power Co Ltd 28,000 (148,200) - 280,000
Chinese Universe Publishing & Media Co
Ltd
17,200 (19,700) - 25,700
Chongqing Changan Automobile Co Ltd 16,100 (89,100) - 105,500
Chongqing Water Group Co Ltd 2,800 (54,300) - 26,930
CITIC Guoan Information Industry Co Ltd 2,800 (33,600) - 45,900
CITIC Securities Co Ltd 39,400 (318,700) - 368,956
CPT Technology Group Co Ltd 800 (27,010) - -
CRRC Corporation Ltd (formerly known
as CSR Corporation Ltd)
267,770 (683,600) - 427,870
Daqin Railway Co Ltd 35,200 (237,100) - 277,448
Datang International Power Generation
Co Ltd
155,500 (15,100) - 140,400
DHC Software Co Ltd 4,500 (29,000) - 36,002
Dongfang Electric Corporation Ltd 30,500 (29,000) - 55,600

HAITONG CSI300 INDEX ETF
(A SUB-FUND OF HAITONG ETF SERIES)
STATEMENT OF MOVEMENTS IN INVESTMENT PORTFOLIO (Unaudited) (continued)
For the period from 1 January 2015 to 30 June 2015
RESTRICTED 16
At 30
Corporate June
Additions Disposals actions 2015
Listed equities (continued)
China (continued)
Dongxu Optoelectronic Technology Co
Ltd 38,200 (51,300) - 78,924
Dr Peng Telecom & Media Group Co Ltd 10,400 (47,100) - 52,000
East Money Information Co Ltd 61,500 (5,700) - 55,800
Everbright Securities Co Ltd 70,900 (7,200) - 63,700
Fangda Carbon New Material Co Ltd 8,100 (40,000) - 48,500
FAW Car Co Ltd 2,400 (30,900) - 37,910
Fiberhome Telecommunication
Technologies Co Ltd 6,200 (41,703) - -
Finance Street Holding Co Ltd 12,200 (94,700) - 111,800
Foshan Haitian Flavouring & Food Co Ltd 3,200 (7,300) 7,064 12,494
Founder Securities Co Ltd 25,200 (163,600) - 192,600
Fuyao Glass Industry Group Co Ltd 7,700 (54,900) - 65,488
Gansu Yasheng Industrial (Group) Co Ltd 4,800 (57,800) - 72,839
GD Power Development Co Ltd 114,900 (352,600) - 459,100
Gemdale Corporation 33,800 (283,000) - 105,000
Gezhouba Group Co Ltd 28,200 (84,600) - 128,900
GF Securities Co Ltd 17,800 (117,900) - 138,411
Glodon Software Co Ltd 6,900 (15,300) 9,798 31,495
GoerTek Inc 4,900 (30,200) - 36,000
Gousen Securities Co Ltd 63,800 (6,500) - 57,300
Great Wall Motor Co Ltd 1,200 (13,400) - 20,500
Gree Electric Appliances Inc of Zhuhai 11,800 (95,100) - 112,557
Guangdong Advertising Co Ltd 4,500 (52,224) 12,208 -
Guangdong Alpha Animation and Culture
Co Ltd 400 (6,000) 10,949 21,898
Guangdong By-Health Biotechnology Co
Ltd 800 (9,800) - 13,600
Guangdong Golden Horse Tourism Group
Stock Co Ltd 23,200 (2,200) - 21,000
Guanghui Energy Co Ltd 17,500 (124,200) - 146,720
Guangshen Railway Co Ltd 10,400 (126,100) - 158,599
Guangxi Wuzhou Zhongheng Group Co
Ltd 2,800 (35,000) - 43,058
Guangzhou Baiyunshan Pharmaceutical
Holdings Co Ltd 1,600 (30,600) - 24,877
Guangzhou Haige Communication Group 4,500 (31,300) - 37,053
Guizhou Panjiang Refined Coal Co Ltd 1,600 (15,600) - 25,605
Guoyuan Securities Co Ltd 13,200 (35,900) - 55,401

HAITONG CSI300 INDEX ETF
(A SUB-FUND OF HAITONG ETF SERIES)
STATEMENT OF MOVEMENTS IN INVESTMENT PORTFOLIO (Unaudited) (continued)
For the period from 1 January 2015 to 30 June 2015
RESTRICTED 17
At 30
Corporate June
Additions Disposals actions 2015
Listed equities (continued)
China (continued)
Hainan Airlines Co Ltd 27,700 (230,100) - 276,000
Hainan Mining Co Ltd 10,600 (700) - 9,900
Haining China Leather Market Co Ltd 1,600 (25,800) - 26,161
Haitong Securities Co Ltd 34,400 (321,900) - 377,947
Hangzhou Hikvision Digital Technology
Co Ltd 5,900 (47,100) - 56,851
Han's Laser Technology Industry Group
Co Ltd 2,400 (27,700) - 44,241
Harbin Pharmaceutical Group Co Ltd - (76,200) - -
Hebei Iron & Steel Co Ltd 22,700 (165,600) - 198,700
Heilan Home Co Ltd 61,900 (54,200) - 62,700
Henan Shuanghui Investment &
Development Co Ltd 3,000 (28,700) 18,519 46,358
Hisense Electric Co Ltd 2,400 (27,700) - 38,241
Hong Yuan Securities Co Ltd - (173,926) - -
Hua Xia Bank Co Ltd 24,500 (177,100) - 207,844
Huadian Power International Corporation
Ltd 61,000 (82,300) - 99,500
Huadong Medicine Co Ltd 4,200 (9,900) - 10,347
Hualan Biological Engineering Inc 800 (11,300) - 13,600
Huaneng Power International Inc 22,900 (166,900) - 196,197
Huatai Securities Co Ltd 28,900 (103,300) - 153,281
Huawen Media Investment Group
Corporation 6,200 (33,300) - 68,300
Huayi Brothers Media Corporation 3,500 (35,900) - 40,801
HUAYU Automotive Systems Co Ltd 5,200 (40,000) - 48,600
Hubei Energy Group Co Ltd - (288,300) - 100,200
Humanwell Healthcare Group Co Ltd 6,600 (45,244) - -
Hunan TV & Broadcast Intermediary Co
Ltd 2,000 (19,500) - 40,426
Hundsun Electronic Co Ltd 2,900 (20,200) - 22,714
Industrial and Commercial Bank of China
Ltd 387,100 (649,400) - 1,132,900
Industrial Bank Co Ltd 77,900 (465,300) - 535,412
Industrial Securities Co Ltd 37,400 (130,800) - 194,190
Inner Mongilia Yili Industrial Group Co Ltd 15,000 (152,800) 170,420 286,140
Inner Mongolia Junzheng Energy &
Chemical Industry Co Ltd 2,000 (52,300) - 30,160
Inner Mongolia MengDian HuaNeng
Thermal Power Corporation Ltd 8,800 (108,800) - 135,500
Inner Mongolia Yili Energy Co Ltd 9,900 (23,400) - 47,905

HAITONG CSI300 INDEX ETF
(A SUB-FUND OF HAITONG ETF SERIES)
STATEMENT OF MOVEMENTS IN INVESTMENT PORTFOLIO (Unaudited) (continued)
For the period from 1 January 2015 to 30 June 2015
RESTRICTED 18
At 30
Corporate June
Additions Disposals actions 2015
Listed equities (continued)
China (continued)
Inner Mongolian BaoTou Steel Union Co
Ltd 118,700 (310,700) - 456,100
Jiangsu Hengrui Medicine Co Ltd 10,000 (29,100) 14,036 55,122
Jiangsu Kangde Xin Composite Material
Co Ltd 15,800 (30,600) 21,106 67,006
Jiangsu Phoenix Publishing & Media
Corporation Ltd 2,400 (27,700) - 36,000
Jiangsu Yanghe Brewery Joint-Stock Co
Ltd 800 (13,600) 6,608 21,229
Jiangxi Copper Co Ltd 2,400 (31,300) - 38,790
Jiangxi Hongdu Aviation Industry Co Ltd 1,200 (16,700) - 20,100
Jilin Aodong Medicine Industry Groups
Co Ltd 2,000 (27,400) - 33,542
Jinduicheng Molybdenum Co Ltd 2,800 (37,100) - 45,167
JiShi Media Co Ltd 2,800 (32,000) - 41,400
Jizhong Energy Resources Co Ltd 7,300 (34,300) 13,890 49,290
Jointown Pharmaceutical Group Co Ltd 4,900 (13,200) - 15,500
Kangmei Pharmaceutical Co Ltd 9,400 (69,300) 79,823 143,846
Kingfa Science & Technology Co Ltd 4,800 (128,450) - -
Kweichow Moutai Co Ltd 2,100 (18,200) - 21,511
Lepu Medical Technology Co Ltd 26,900 (3,800) - 23,100
Leshi Internet Information & Technology
(Beijing) Co Ltd 48,000 (5,000) - 43,000
Liaoning Cheng Da Co Ltd 8,100 (66,700) - 56,957
Luxin Venture Capital Group Co Ltd 6,600 (9,300) - 13,900
Luxshare Precision Industry Co Ltd 5,100 (10,500) 8,547 23,141
Luzhou Laojiao Co Ltd 2,000 (26,100) - 32,733
MeiHua Holdings Group Co Ltd 18,000 (56,100) - 87,400
Metallurgical Corporation of China Ltd 22,400 (189,800) - 227,500
Midea Group Co Ltd 8,500 (83,600) - 98,527
Minmetals Development Co Ltd 1,200 (36,600) - -
NARI Technology Development Co Ltd 7,500 (57,500) - 68,367
Neusoft Co Ltd 5,800 (33,800) - 40,278
New China Life Insurance Co Ltd - (29,300) - 38,932
New Hope Liuhe Co Ltd 23,500 (24,500) - 49,000
Neway Valve Suzhou Co Ltd 400 (12,600) - -
Ningbo Port Co Ltd 11,600 (143,600) - 179,700
Northeast Securities Co Ltd 9,000 (45,500) - 55,212

HAITONG CSI300 INDEX ETF
(A SUB-FUND OF HAITONG ETF SERIES)
STATEMENT OF MOVEMENTS IN INVESTMENT PORTFOLIO (Unaudited) (continued)
For the period from 1 January 2015 to 30 June 2015
RESTRICTED 19
At 30
Corporate June
Additions Disposals actions 2015
Listed equities (continued)
China (continued)
Oceanwide Holdings Co Ltd 70,900 (7,200) - 63,700
Offshore Oil Engineering Co Ltd 26,500 (65,100) - 103,200
Orient Securities Co Ltd 54,800 (5,700) - 49,100
Pacific Security Co Ltd 128,200 (13,000) - 115,200
Pang Da Automobile Trade Co Ltd 29,800 (54,500) 82,800 151,300
Pangang Group Vanadium Titanium &
Resources Co Ltd 13,200 (159,800) - 200,500
People.cn Co Ltd 800 (10,700) - 12,820
PetroChina Co Ltd 78,400 (165,600) - 226,734
Ping An Bank Co Ltd 32,800 (291,900) 64,872 267,230
Ping An Insurance (Group) Co of China
Ltd 60,752 (199,700) - 253,646
Poly Real Estate Group Co Ltd 49,600 (255,700) - 300,800
Power Construction Corporation of China 51,900 (106,200) - 178,800
Qingdao Haier Co Ltd 9,800 (61,000) - 71,073
Qinghai Salt Lake Potash Co Ltd 5,200 (25,200) - 29,400
Risesun Real Estate Development Co Ltd 15,100 (22,900) 32,017 71,234
SAIC Motor Corporation Ltd 17,200 (131,400) - 154,285
Sanan Optoelectronics Co Ltd 12,600 (42,300) - 67,505
Sany Heavy Industry Co Ltd 39,900 (109,200) - 178,032
SDIC Power Holdings Co Ltd 19,000 (120,300) - 173,120
Sealand Securities Co Ltd 26,700 (34,500) - 64,740
Searainbow Holding Corporation 7,500 (28,600) - 33,700
Shaanxi Coal Industry Co Ltd 81,800 (25,700) - 93,600
Shandong Dong-E E-Jiao Co Ltd 2,900 (20,600) - 24,196
Shandong Gold Mining Co Ltd 2,000 (27,400) - 33,325
Shandong Kingenta Ecological
Engineering Co Ltd 3,100 (15,500) 18,600 29,500
Shanghai Bailian Group Co Ltd 2,400 (28,900) - 35,700
Shanghai Chengtou Holdings Co Ltd - (6,600) - 263,600
Shanghai Construction Co Ltd 10,100 (57,400) 22,845 83,195
Shanghai Electric Group Co Ltd 94,700 (73,600) - 138,200
Shanghai Fosun Pharmaceutical (Group)
Co Ltd 7,300 (45,600) - 53,649
Shanghai International Airport Co Ltd 2,800 (36,800) - 44,928
Shanghai International Port Group Co Ltd 26,000 (274,500) - 119,220
HAITONG CSI300 INDEX ETF
(A SUB-FUND OF HAITONG ETF SERIES)
STATEMENT OF MOVEMENTS IN INVESTMENT PORTFOLIO (Unaudited) (continued)
For the period from 1 January 2015 to 30 June 2015
RESTRICTED 20
At 30
Corporate June
Additions Disposals actions 2015
Listed equities (continued)
China (continued)
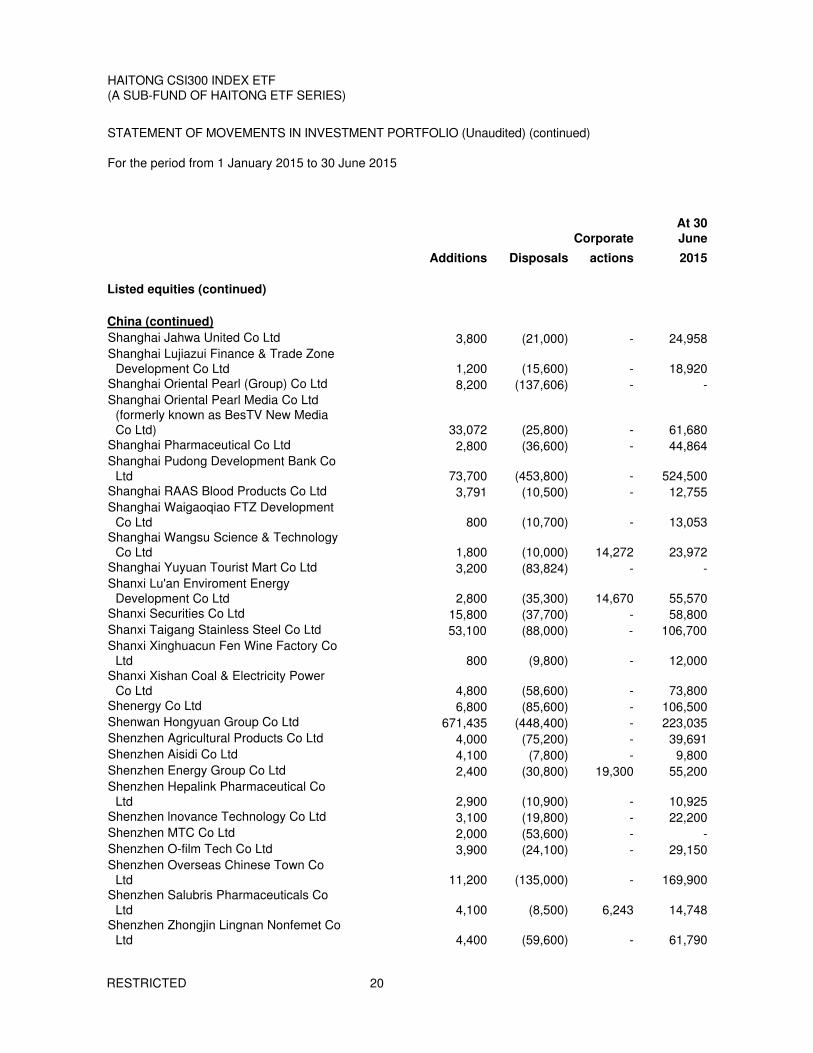
Shanghai Jahwa United Co Ltd 3,800 (21,000) - 24,958
Shanghai Lujiazui Finance & Trade Zone
Development Co Ltd
1,200 (15,600) - 18,920
Shanghai Oriental Pearl (Group) Co Ltd 8,200 (137,606) - -
Shanghai Oriental Pearl Media Co Ltd
(formerly known as BesTV New Media
Co Ltd)
33,072 (25,800) - 61,680
Shanghai Pharmaceutical Co Ltd 2,800 (36,600) - 44,864
Shanghai Pudong Development Bank Co
Ltd
73,700 (453,800) - 524,500
Shanghai RAAS Blood Products Co Ltd 3,791 (10,500) - 12,755
Shanghai Waigaoqiao FTZ Development
Co Ltd
800 (10,700) - 13,053
Shanghai Wangsu Science & Technology
Co Ltd
1,800 (10,000) 14,272 23,972
Shanghai Yuyuan Tourist Mart Co Ltd 3,200 (83,824) - -
Shanxi Lu'an Enviroment Energy
Development Co Ltd
2,800 (35,300) 14,670 55,570
Shanxi Securities Co Ltd 15,800 (37,700) - 58,800
Shanxi Taigang Stainless Steel Co Ltd 53,100 (88,000) - 106,700
Shanxi Xinghuacun Fen Wine Factory Co
Ltd
800 (9,800) - 12,000
Shanxi Xishan Coal & Electricity Power
Co Ltd
4,800 (58,600) - 73,800
Shenergy Co Ltd 6,800 (85,600) - 106,500
Shenwan Hongyuan Group Co Ltd 671,435 (448,400) - 223,035
Shenzhen Agricultural Products Co Ltd 4,000 (75,200) - 39,691
Shenzhen Aisidi Co Ltd 4,100 (7,800) - 9,800
Shenzhen Energy Group Co Ltd 2,400 (30,800) 19,300 55,200
Shenzhen Hepalink Pharmaceutical Co
Ltd
2,900 (10,900) - 10,925
Shenzhen lnovance Technology Co Ltd 3,100 (19,800) - 22,200
Shenzhen MTC Co Ltd 2,000 (53,600) - -
Shenzhen O-film Tech Co Ltd 3,900 (24,100) - 29,150
Shenzhen Overseas Chinese Town Co
Ltd
11,200 (135,000) - 169,900
Shenzhen Salubris Pharmaceuticals Co
Ltd
4,100 (8,500) 6,243 14,748
Shenzhen Zhongjin Lingnan Nonfemet Co
Ltd
4,400 (59,600) - 61,790

HAITONG CSI300 INDEX ETF
(A SUB-FUND OF HAITONG ETF SERIES)
STATEMENT OF MOVEMENTS IN INVESTMENT PORTFOLIO (Unaudited) (continued)
For the period from 1 January 2015 to 30 June 2015
RESTRICTED 21
At 30
Corporate June
Additions Disposals actions 2015
Listed equities (continued)
China (continued)
Shijiazhuang Yiling Pharmaceutical Co
Ltd 4,300 (30,800) 11,500 -
Siasun Robot & Automation Co Ltd 1,600 (24,900) - 21,600
Sichuan Changhong Electric Co Ltd 16,800 (143,500) - 172,800
Sichuan Chuantou Energy Co Ltd 14,400 (44,900) 53,800 102,800
Sichuan Kelun Pharmaceutic Co Ltd 2,700 (14,600) - 16,500
Sinolink Securities Co Ltd 45,900 (84,900) - 86,286
Sinopec Shanghai Petrochemical Co Ltd 6,800 (81,300) - 102,200
Soochow Security Co Ltd 10,800 (53,400) - 62,866
Sound Environmental Resources Co Ltd 2,900 (20,100) - 23,419
Southwest Securities Co Ltd 17,900 (42,300) - 65,995
Spring Airlines Co Ltd 6,200 (400) - 5,800
Suning Commerce Group Co Ltd 25,100 (176,500) - 206,700
Suzhou Gold Mantis Constructions 5,100 (31,600) - 44,143
Tangshan Jidong Cement Co Ltd 1,600 (45,100) - -
Tasly Pharmaceutical Group Co Ltd 4,400 (23,800) - 30,024
TBEA Co Ltd 15,100 (103,600) - 120,737
TCL Corporation 96,000 (308,500) - 399,000
Tianjin Port Co Ltd 43,400 (4,300) - 39,100
Tianjin Zhonghuan Semiconductor Co Ltd 26,400 (45,600) 29,160 42,660
Tonghua Dongbao Pharmaceutical Co
Ltd 5,500 (29,300) 3,980 36,880
Tongling Nonferrous Metals Group Co Ltd 5,700 (17,400) 48,300 96,600
Tsinghua Tongfang Co Ltd 9,100 (68,700) - 82,900
Tsingtao Brewery Co Ltd 3,400 (13,600) - 16,536
Universal Scientific Industrial Co Ltd 2,600 (6,400) 5,543 9,786
WanHua Chemical Group Co Ltd 5,200 (42,800) - 50,406
Wanxiang Qianchao Co Ltd 31,000 (47,800) 10,860 53,760
Wasu Media Holdings Co Ltd 7,600 (4,600) - 6,000
Weichai Power Co Ltd 7,900 (37,700) - 56,262
Weifu High-Technology Co Ltd 4,800 (23,400) - 27,877
Western Mining Co Ltd 10,700 (75,000) - 88,800
Western Securities Co Ltd 40,600 (46,700) 23,200 52,500
Wintime Energy Co Ltd 21,000 (79,200) 42,840 156,840
Wuhan Iron & Steel Co Ltd 209,400 (20,900) - 188,500
Wuliangye Yibin Co Ltd 11,700 (75,600) - 88,379
XCMG Construction Machinery Co Ltd 35,100 (52,000) - 66,300
Xiamen C&D Inc 5,200 (59,600) - 83,258
HAITONG CSI300 INDEX ETF
(A SUB-FUND OF HAITONG ETF SERIES)
STATEMENT OF MOVEMENTS IN INVESTMENT PORTFOLIO (Unaudited) (continued)
For the period from 1 January 2015 to 30 June 2015
RESTRICTED 22
At 30
Corporate June
Additions Disposals actions 2015
Listed equities (continued)
China (continued)
Xiamen Tungsten Co Ltd 3,300 (13,900) 5,166 20,284
Xinhu Zhongbao Co Ltd 7,200 (91,300) - 114,400
Xinjiang Goldwind Science & Technology
Co Ltd 10,500 (61,300) - 71,800
Xinxing Ductile Iron Pipes Co Ltd 6,800 (69,500) - 113,400
Xizang Haisco Pharmaceutical Group Co
Ltd 3,300 (9,300) - 9,700
XJ Electric Co Ltd 4,200 (23,700) - 28,450
Yangquan Coal Industry Group Co Ltd 3,600 (45,500) - 55,910
Yantai Changyu Pioneer Wine Co Ltd 400 (11,448) - -
Yantai Jereh Oilfield Services Group Co
Ltd 4,700 (15,600) - 25,881
Yanzhou Coal Mining Co Ltd 5,000 (33,400) - 17,799
Yingkou Port Group Co Ltd 100,700 (10,100) - 90,600
Yonghui Superstores Co Ltd 13,800 (72,800) - 94,662
Yonyou Network Technology Co Ltd 1,600 (23,600) 6,504 32,824
Youngor Group Co Ltd 7,800 (60,800) - 72,905
Yunnan Baiyao Group Co Ltd 3,000 (20,900) - 24,143
Yunnan Chihong Zinc & Germanium Co
Ltd 7,700 (39,200) - 46,850
Yunnan Copper Industry Co Ltd 2,000 (19,500) - 40,900
Yunnan Tin Co Ltd 10,100 (36,600) - 32,200
Zhangzhou Pientzehuang Pharmaceutical
Co Ltd 3,200 (14,235) 6,201 -
Zhejiang China Commodities City Group
Co Ltd 4,000 (63,900) 76,200 127,500
Zhejiang Dahua Technology Co Ltd 1,600 (22,200) - 27,412
ZheJiang Daily Media Group Co Ltd 11,200 (23,100) - 27,900
Zhejiang Hisun Pharmaceutical Co Ltd 5,300 (43,550) - -
Zhejiang Huace Film & TV Co Ltd 800 (12,000) 7,450 18,150
Zhejiang Longsheng Group Co Ltd 11,300 (61,800) 62,933 106,566
Zhejiang NHU Co Ltd 1,600 (20,400) - 25,385
Zhejiang Yasha Decoration Co Ltd 8,500 (11,700) 9,830 34,690
Zhejiang Zheneng Electric 100,400 (37,100) - 127,360
Zhengzhou Yutong Bus Co Ltd 5,400 (39,800) 24,767 61,801
Zhongjin Gold Co Ltd 4,400 (55,800) - 68,411
Zijin Mining Group Co Ltd 88,900 (285,700) - 442,700
Zoomlion Heavy Industry Science &
Technology Co Ltd 25,900 (174,700) - 205,569
ZTE Corporation 10,800 (78,100) - 91,826
HAITONG CSI300 INDEX ETF
(A SUB-FUND OF HAITONG ETF SERIES)
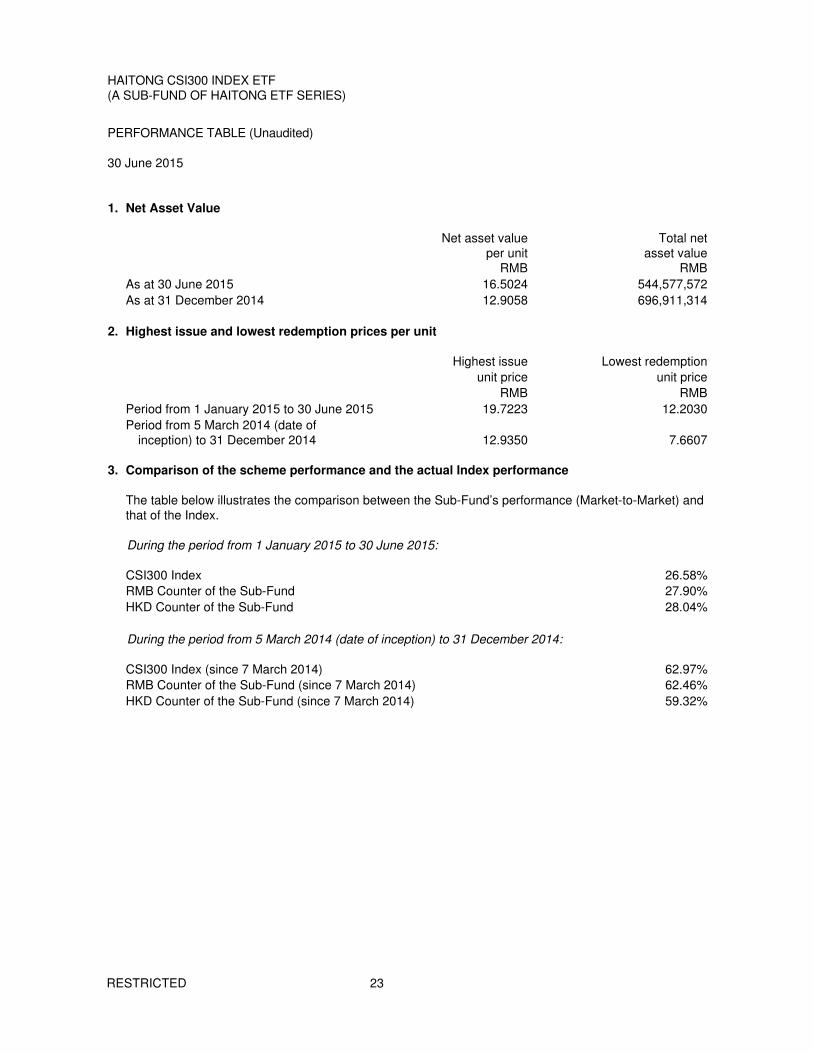
PERFORMANCE TABLE (Unaudited)
30 June 2015
RESTRICTED 23
1. Net Asset Value
Net asset value
per unit
Total net
asset value
RMB RMB
As at 30 June 2015 16.5024 544,577,572
As at 31 December 2014 12.9058 696,911,314
2. Highest issue and lowest redemption prices per unit
Highest issue Lowest redemption
unit price unit price
RMB RMB
Period from 1 January 2015 to 30 June 2015 19.7223 12.2030
Period from 5 March 2014 (date of
inception) to 31 December 2014 12.9350 7.6607
3. Comparison of the scheme performance and the actual Index performance
The table below illustrates the comparison between the Sub-Fund’s performance (Market-to-Market) and
that of the Index.
During the period from 1 January 2015 to 30 June 2015:
CSI300 Index 26.58%
RMB Counter of the Sub-Fund 27.90%
HKD Counter of the Sub-Fund 28.04%
During the period from 5 March 2014 (date of inception) to 31 December 2014:
CSI300 Index (since 7 March 2014) 62.97%
RMB Counter of the Sub-Fund (since 7 March 2014) 62.46%
HKD Counter of the Sub-Fund (since 7 March 2014) 59.32%

HAITONG CSI300 INDEX ETF
(A SUB-FUND OF HAITONG ETF SERIES)
DISTRIBUTION DISCLOSURE (Unaudited)
30 June 2015
RESTRICTED 24
Date of Date of Distribution Total ex-distribution payment per unit distribution RMB RMB
Interim Distribution on 32,500,000 units 30 July 2015 5 August 2015 0.12 3,900,000
––––––––––– 3,900,000 ════════

HAITONG CSI300 INDEX ETF
(A SUB-FUND OF HAITONG ETF SERIES)
UNDERLYING INDEX CONSTITUENT STOCKS DISCLOSURE
30 June 2015
RESTRICTED 25
The underlying index of Haitong CSI300 Index ETF, namely CSI 300 Index, did not have any constituent
stock that accounted for more than 10% of the index as at 30 June 2015.
During the period from 1 January 2015 to 30 June 2015, the CSI 300 Index increased/decreased by 26.58%
while the net asset value per unit of the Sub-Fund increased by 27.90% for RMB Counter and increased
28.04% for HKD Counter respectively.

HAITONG CSI300 INDEX ETF
(A SUB-FUND OF HAITONG ETF SERIES)
REPORT ON INVESTMENT OVERWEIGHT (UNAUDITED)
For the period from 1 January 2015 to 30 June 2015
RESTRICTED 26
Pursuant to the SFC’s Guidelines for Regulating Index Tracking Exchange Trade Funds (the “ETF
Guidelines”), the Sub-Fund’s holding of any such constituent securities may not exceed their respective
weightings in the underlying index, except where the weightings are exceeded as a result of changes in the
composition of the underlying index and the excess is only transitional and temporary in nature.
The Manager and the Trustee have confirmed that the Sub-Fund has complied with this limit during the
period from 1 January 2015 to 30 June 2015.