habitat selection and nesting ecolog y of translocated
TRANSCRIPT

Habitat selection and nesting ecology of translocated Greater Sage-grouse
A Thesis
Submitted to the Faculty of Graduate Studies and Research
In Partial Fulfillment of the Requirements
for the Degree of Masters of Science
In Biology
University of Regina
by
Kayla Lane Balderson
Regina, Saskatchewan
February 16, 2017
Copyright 2017: K.L. Balderson

UNIVERSITY OF REGINA
FACULTY OF GRADUATE STUDIES AND RESEARCH
SUPERVISORY AND EXAMINING COMMITTEE
Kayla Lane Balderson, candidate for the degree of Master of Science in Biology, has presented a thesis titled, Habitat selection and nesting ecology of translocated Greater Sage-grouse, in an oral examination held on January 31, 2017. The following committee members have found the thesis acceptable in form and content, and that the candidate demonstrated satisfactory knowledge of the subject material. External Examiner: Dr. Glen McMaster, Saskatchewan Water Security Agency
Co-Supervisor: Dr. Mark Brigham, Department of Biology
Co-Supervisor: Dr. Stephen Davis, Environment Canada
Committee Member: Dr. Christopher Somers, Department of Biology
Committee Member: *Dr. Axel Moehrenschlager, One-Time Committee Member, Calgary Zoo Society
Chair of Defense: Dr. Maria Velez, Department of Geology *Via videoconference

i
ABSTRACT
Sagebrush ecosystems are one of the most imperiled ecosystems in North America. The
cumulative effects of habitat loss, fragmentation and degradation of the sagebrush ecosystem
threaten the persistence of the Greater Sage-grouse. Sage-grouse depend on healthy, intact areas
of sagebrush habitat throughout the year. In Alberta, the sage-grouse population is estimated to
be only 5% of what it was in 1968. During the spring of 2011 and 2012, 41 sage-grouse were
fitted with GPS transmitters and translocated from stable populations in Montana to active lek
sites in southeast Alberta. I conducted research to improve our understanding of translocation as
a management tool, and how translocated sage-grouse are affected by anthropogenic features. I
examined nesting ecology including the differences in post-release movements between nesting
and non-nesting hens and the extent to which nest success is affected by anthropogenic features.
I also identified habitat that translocated sage-grouse select in relation to anthropogenic and
natural features.
My research documented some of the largest post-release movement distances, rates and
areas ever recorded for grouse after being translocated. Average weekly linear distance travelled
was 56 km and average area traversed was 1944 km2. Non-nesting hens had significantly higher
movement rates than nesting hens. Movement rates of nesting hens decreased during the nest
initiation period, whereas movement rates of non-nesting hens did not decrease until 6 weeks
later. Apparent annual hen survival ranged between 31-72% across the study period. Nest
initiation (53%) and nest success (29%) were low compared to other sage-grouse populations
across their range. Nest success decreased with increasing distance from trees, power lines and
settlements, suggesting that translocated hens are naïve to the release area and do not recognize
the risks that are typically associated with certain anthropogenic features.

ii
Translocated sage-grouse were more likely to be observed, with increasing distance from
all of the anthropogenic features included in the movement models: as far as 3 km from trees and
gas wells, 10 km from buildings and 15 km from settlements, at least 23 km from power lines
and 2.5 km from roads. Interaction models suggest that sage-grouse are avoiding anthropogenic
features because of the disturbance of the features themselves, and not because the features occur
in poor sagebrush habitat.
My results indicate that the effects of power lines, buildings, trees and oil wells (up to 5
km) on the occurrence of sage-grouse were largest, suggesting that these features should be
prioritized for removal. However, it is likely that cumulative effects of some or all anthropogenic
features cause sage-grouse to select habitat further away from these features. The predicted
intensity map I generated could be used to help strategically guide habitat enhancement efforts in
the study area. Habitat enhancements would best be focused in areas where predicted intensity
was high and suitable habitat was present yet no sage-grouse were observed, with the goal of
increasing the likelihood of sage-grouse use within those areas. Future assessments of proposed
developments should consider the construction of all new anthropogenic features as a potential
detriment to habitat quality.

iii
ACKNOWLEDGMENTS
First and foremost, I want to thank my co-supervisors Dr. Mark Brigham, Dr. Stephen
Davis and Dr. Axel Moehrenschlager, and committee member Dr. Chris Somers. It has truly
been an honour to learn from and work with not only such accomplished and well-respected
biologists, but genuinely caring and kind people. I am both a better biologist and a better person
because of all of you. Thank you to Dr. Gavin Simpson for helping me immensely with statistics;
your passion for what you do is inspiring. Thank you to Alberta government biologists Dale
Eslinger and Joel Nicholson for bringing me into their sage-grouse world and for supporting my
interests and subsequent field work. Thank you for the motivation and support to leave my
comfortable Medicine Hat bubble and spread my wings in grad school. Joel, you have been one
of the greatest mentors and friends that I could ask for throughout this process. Thank you for
everything you have done for me.
Thank you to my lab mates: Charlie Bailey, Shelby Bohn, Gabriel Foley, Brandon Klug,
Joe Poissant, Paul Preston, Phil Rose, Andrea Sidler and Jason Unruh for always being there for
me when I needed to vent or needed advice. You all helped keep me sane with your guidance.
This project would not have been possible without the financial support of the NSERC
Industrial Postgraduate Scholarship Program and my industrial partner City of Medicine Hat
Natural Gas and Petroleum Resources. Thank you to Kevin Redden, my industrial supervisor, for
always being supportive of me and my project. I admire you for your professionalism and
confidence. Thank you to Alberta Environment and Sustainable Resource Development and the
Species at Risk fund, Calgary Zoo Centre for Conservation Research, Canadian Wildlife
Federation, LGX Oil and Gas Inc., Nature Saskatchewan, Penn West Petroleum Inc., Spur
Resources Ltd., and TD Friends of the Environment Foundation.
iv
DEDICATION
I would like to dedicate this thesis to my nieces and nephew: Alivia, Avery, Ashlyn,
Alyse, Ashton, and Addison. My hope is that your aunt and uncle will get the chance to take you
onto the prairie during spring sunrises and show you the wonderfully spectacular sage-grouse
dances, and may you get the chance to do the same for your children and grandchildren. May
you always find inspiration, solace and adventure in nature.
I would also like to dedicate this thesis to my best friend, my husband. This thesis would
not exist if you didn’t push me to apply for a sage-grouse job 3 years ago, which I didn’t think I
had a shot at getting. Your belief in me never wavers and I am eternally grateful for everything
you have done for me and everything you have put up with throughout this process. This world
would be a better place if everyone had someone that believes in them the way you believe in
me. I love you and admire you more than you know. I am looking forward to raising our children
in the great outdoors.
Lastly, but definitely not by measure of importance, I dedicate this to my mom, dad and
sister. There are no words to describe how much I appreciate everything you have ever done for
me. Thank you for instilling values of respect for nature and other human beings, patience,
fortitude and kindness in me. Thank you for allowing me to be a science geek and always at least
letting me think that I’m a cool geek. “The only people who truly know your story are the ones
who helped you write it.” – Anonymous

v
TABLE OF CONTENTS
ABSTRACT.....................................................................................................................................i
ACKNOWLEDGMENTS............................................................................................................iii
DEDICATION..............................................................................................................................iv
TABLE OF CONTENTS..............................................................................................................v
LIST OF TABLES.......................................................................................................................vii
LIST OF FIGURES....................................................................................................................viii
1.0 GENERAL INTRODUCTION.............................................................................................11
1.1 Sagebrush Ecology, Degradation and Loss.........................................................................11
1.2. Sagebrush Obligates.............................................................................................................13
1.3. Greater Sage-grouse Population Declines..........................................................................14
1.4. Factors Contributing to Sage-grouse Population Declines...............................................16
1.5 Translocation as a Management Tool..................................................................................18
1.6 Purpose of Research..............................................................................................................19
1.7 Literature Cited.....................................................................................................................21
2.0 POST-RELEASE MOVEMENTS AND NESTING ECOLOGY OF
TRANSLOCATED GREATER SAGE-GROUSE...................................................................26
2.1. Introduction...........................................................................................................................26
2.2. Methods..................................................................................................................................30
2.2.1 Study Area and Translocation...............................................................................30
2.2.2 Habitat Characteristics and Anthropogenic Features.........................................32
2.2.3 Post-release Movements and Apparent Hen Survival.........................................35
2.2.4 Nesting Ecology.......................................................................................................37
2.3. Results....................................................................................................................................39
2.3.1 Nesting Ecology.......................................................................................................39
2.3.2 Post-release Movements and Apparent Hen Survival.........................................39
2.3.3 Nest Initiation and Success.....................................................................................43
2.4. Discussion..............................................................................................................................45
2.4.1 Nesting Ecology.......................................................................................................45

vi
2.4.2 Post-Release Movements and Apparent Hen Survival........................................47
2.4.3 Nest Initiation and Success....................................................................................50
2.5 Summary and Conclusions...................................................................................................53
2.6 Literature Cited.....................................................................................................................57
3.0 HABITAT SELECTION OF GREATER SAGE-GROUSE TRANSLOCATED INTO
SOUTHEAST ALBERTA..........................................................................................................66
3.1 Introduction............................................................................................................................66
3.2 Methods...................................................................................................................................70
3.2.1 Study Area and GPS Data Collection...................................................................70
3.2.2 Habitat Characteristics and Anthropogenic Features........................................73
3.2.3 Statistical Analyses.................................................................................................76
3.3 Results.....................................................................................................................................79
3.3.1 Natural and Anthropogenic Features...................................................................79
3.3.2 Habitat Selection in Relation to Natural and Anthropogenic Features……….81
3.4 Discussion...............................................................................................................................86
3.5 Summary and Conclusions...................................................................................................92
3.6 Literature Cited.....................................................................................................................95
4.0 GENERAL CONCLUSIONS AND MANAGEMENT IMPLICATIONS………….…101
4.1 General Conclusions………………………………………………………………..……..101
4.2 Management Implications…………………………………………………………...……103
5.0 APPENDICES……………………………………………………………………….……104
Appendix 1……………………………………………………………………………..………104
Appendix 2…………………………………………………………………………..…………105

vii
LIST OF TABLES
Table 2.1. Status and fate of translocated sage-grouse hens at the beginning and end of each year
from 2011-2015 in southeast Alberta. The start of each year was considered April 1st to coincide
with the releases and represents one full post-release year.
Table 2.2. The number of GPS-equipped translocated sage-grouse hens, during 2011-2014 that
had first nesting attempts, successful nests and re-nests.
Table 2.3. Model selection results from the logistic regression analysis of the probability of
translocated sage-grouse hatching at least one egg as a function of distance to the nearest tree,
power line, settlement and by sagebrush cover from 2011-2014. AICc is Akaike’s Information
Criteria corrected for small sample size and ΔAICc is the difference in AICc from the top model,
AICc Weight is the Akaike weight. Other single variable models [(oil wells, gas wells, fences,
buildings and roads, nest initiation date, body mass and age (yearling or adult)] performed worse
than the null model.

viii
LIST OF FIGURES
Figure 2.1. Study area and translocated sage-grouse hen GPS locations from 1 May to 15
September 2011-2015 in southeast Alberta, townships 1-1 to 6-7 W4M. This represents the
current range of sage-grouse in Alberta, an area of 42 townships or roughly 3,900 km2.
Figure 2.2. Average movement rates (m/hr) of translocated sage-grouse hens that initiated nests
(top) or did not initiate nests (bottom) from 6-10 April 2012 to 11-15 September 11-15 2012 in
southeast Alberta. Sample sizes given on the left side of the figure represent the number of hens
at the beginning of the post-release period, and sample sizes given on the right side represent the
number of hens at the end of the summer.
Figure 2.3. Average movement rates (m/hr) of post-release translocated sage-grouse nesting
hens (red) and non-nesting hens (blue) from 6-10 April 2012 to 11-15 September 11-15 2012.
Sample sizes given on the left side of the figure represent the number of hens at the beginning of
the post-release period, and sample sizes given on the right side represent the number of hens at
the end of the summer.
Figure 2.4. Timing of nest failure for 15 nests initiated in southeastern Alberta, 2011-2014.
Percentage of nest failures within each of the 4 categories is calculated based on the total number
of nests initiated.
Figure 3.1. Study area, release sites and translocated sage-grouse hen GPS locations from 1 May
to 15 September 2011-2015 in southeast Alberta, townships 1-1 to 6-7 W4M. This represents the
current range of sage-grouse in Alberta, an area of 42 townships or roughly 3,900 km2.

ix
Figure 3.2. Buildings, power lines, paved and gravel roads, trees, gas wells and active and
suspended oil wells located in sage-grouse range in fall 2013 in southeast Alberta.
Figure 3.3. Trails and fences located in sage-grouse range in southeast Alberta in fall 2013 in
southeast Alberta.
Figure 3.4 Contribution to intensity of the effect of elevation, slope, sagebrush cover, distance to
trees, oil wells, gas wells, buildings, settlements, power lines and roads on translocated sage-
grouse locations in southeast Alberta from 2011-2014. Covariates that were right skewed were
either square root or log transformed to stabilize the model fitting process and to improve
interpretation. Effect is the contribution to the fitted intensity by year. The smooths are centered,
so ‘0’ is the average intensity for the reference year (the estimate of the model intercept).
Negative values act to reduce the intensity above the mean and positive values act to increase the
intensity.
Figure 3.5 The effect size of the pair-wise interactions between sagebrush cover (%) and
translocated sage-grouse distance to oil wells, gas wells and power lines (m) in southeast Alberta
from 2011-2014. The pair-wise interactions added 1% to the variance explained between
sagebrush cover and distance to oil wells, gas wells and powerlines.
Figure 3.6 Predicted intensity of translocated Greater Sage-grouse occurrences in Southeast
Alberta derived from the model predictions in Figure 3.4. Warm colors (yellow-red) represent
where sage-grouse are more likely to be observed in the study area. Cool colors (blue) represent

x
where sage-grouse are less likely to be observed in the study area. The map represents
population-level predictions as this is the best unbiased prediction for the likelihood of observing
a bird.

11
1.0 GENERAL INTRODUCTION
1.1 SAGEBRUSH ECOLOGY, DEGRADATION AND LOSS
The sagebrush steppe ecosystem occupies 43 million ha of semi-arid sagebrush-
dominated lands in the intermountain region of western North America (Wisdom et al. 2003).
This vast area composes one of the largest ecosystems on the continent (Centre for Science,
Economics and Environment 2002) and is often referred to as the “sagebrush sea”. Sagebrush is
a woody plant that is adapted to a semi-arid continental climate (McArthur 1992). Sagebrush
occurs from southern British Columbia to southern Saskatchewan, south to northern California
west to Texas, east from the Dakotas to the Cascade Mountains of Oregon and Washington
(McArthur et al. 1981; United States Department of Agriculture 2015). The most broadly
distributed sagebrush species is big sagebrush (Artemisia tridentata); the subspecies basin big
sagebrush (A. tridentata ssp. tridentata), mountain big sagebrush (Artemisia tridendata ssp.
vaseyana), and Wyoming big sagebrush (A. tridendata ssp. wyomingensis) occur over most of
the range of sagebrush (McArthur 1992).
In the Canadian prairies, the dominant sagebrush species is silver sagebrush (Artemisia
cana; Hickman et al. 2013) which ranges from British Columbia to Manitoba (United States
Department of Agriculture 2015). Silver sagebrush occurs on mesic sites that consist of
productive, deep and fertile soils (Thatcher 1959). Silver sagebrush plays an important ecological
role in the Northern Great Plains, including the provision of habitat and forage for wildlife
(Connelly et al. 2000; Knick et al. 2003; Adams et al. 2004, Davies et al. 2011). This plant also
reduces soil erosion (McArthur 1992; Adams et al. 2004).
The loss and degradation of the sagebrush ecosystem has been rapid and widespread,
making it one of the most imperiled ecosystems in North America (Noss et al. 1995; Knick et al.

12
2003). Prior to European settlement, the sagebrush ecosystem covered approximately 63 million
ha in western North America (Miller and Eddleman 2001). To date, more than 50% of
sagebrush-dominated habitats have been lost (Braun et al. 2002) and most of the remaining area
is disturbed by humans (Miller and Eddleman 2001). In Alberta, approximately 43% of the
original 4.7 million ha of dry mixed-grass prairie (where sagebrush occurs) remain intact (Adams
et al. 2005). Many sagebrush communities have undergone significant changes over the last 200
years including alterations in fire and grazing regimes, proliferation of non-native plant species,
and conversion of native rangeland to seeded pastures and cropland (Crawford et al. 2004).
Sagebrush habitats have been degraded by the introduction of non-native grass species,
mainly to facilitate livestock grazing (Knick et al. 2003). This is most pronounced in the United
States where most sagebrush occurs. The estimated area of exotic plant invasion increased from
1.1 million ha in 1985 to 3.2 million ha in 1994 on lands managed by the United States Bureau
of Land Management and represents 30% of sagebrush habitat in the United States (Bureau of
Land Management 1996). By out-competing native grasses, exotic species alter the structure and
composition of sagebrush understory (Knick et al. 2003). As a result, wildlife species that have
evolved in a natural sagebrush ecosystem may be less able, or incapable of meeting survival
and/or reproductive needs.
Many of the remaining areas of sagebrush habitat have been lost and/or fragmented by
infrastructure associated with industrial development and urban expansion. Increasing human
populations require increasing amounts of energy. As a result, thousands of natural gas and oil
wells have been drilled in western North America, requiring the construction of roads, power
lines, compressor stations and pipelines (Braun et al. 2002; Bureau of Land Management 2004).
Assuming that anthropogenic features have a negative effect on the surrounding landscape,

13
Knick et al. (2011), concluded that highways and power lines are negatively affecting
approximately 40% of sagebrush habitat in the western United States. Additionally, the rapid
growth of exurban communities and “ranchettes” outside of metropolitan centres consumes more
land and fragments more habitat than concentrated urban development (Connelly et al. 2004).
1.2 SAGEBRUSH OBLIGATES
The cumulative effects of habitat loss, fragmentation and degradation of the sagebrush
ecosystem threaten the persistence of a number of plant and animal species. More than 350
species of sagebrush-associated plants and animals are of conservation concern (Suring et al.
2005 and Wisdom et al. 2005). Greater sage-grouse (Centrocercus urophasianus), sage thrasher
(Oreoscoptes montanus), sagebrush sparrow (Amphispiza nevadensis), Brewer’s sparrow
(Spizella breweri), pronghorn (Antilocapra americana), sagebrush vole (Lemmiscus curtatus)
and pygmy rabbit (Brachylagus idahoensis) are examples of sagebrush obligates: species
dependent on sagebrush habitats year-round or during the breeding season (Rowland et al. 2006).
All of these species have experienced population declines in North America and have received
federal and/or provincial/state status designations (NatureServe 2013).
One of the most imperiled sagebrush obligates in North America is the Greater Sage-
grouse (hereafter “sage-grouse”), which has experienced population declines ranging from 45%
to 80% across their range (Braun 1998). Sage-grouse are found within the sagebrush steppe
ecosystem of North America and depend on healthy, intact areas of sagebrush habitat throughout
the year for mating, nesting, feeding, brood-rearing and wintering (Patterson 1952; Wallestad
1975; Braun et al. 1977; Connelly et al. 2004; Connelly et al. 2011). Sage-grouse are considered
an umbrella species since management for sage-grouse populations can benefit other species of

14
conservation concern (Rowland et al. 2006; Hanser and Knick 2011). In Canada, sage-grouse
currently occur within a small part of the range of silver sagebrush in the semi-arid mixed-grass
prairies of southeast Alberta and southwest Saskatchewan (Aldridge 2000).
1.3 GREATER SAGE-GROUSE POPULATION DECLINES
In 2000, sage-grouse occupied only 56% of their pre-European settlement distribution
(Schroeder et al. 2004), occurring in 11 states and 2 provinces (Braun et al. 2002). In Canada,
sage-grouse historically occupied approximately 100,000 km2 in Alberta and Saskatchewan
(Aldridge 1998). By 2014, that range was reduced by approximately 90% to 7,370 km2
(Environment Canada 2014). This represents one of the most severe range contractions
throughout the species range (Aldridge 2000). The sage-grouse is listed as Endangered under the
federal Species at Risk Act (Environment Canada 2014) and is also listed as Endangered under
both Alberta’s and Saskatchewan’s Wildlife Act (Alberta Environment and Sustainable Resource
Development 2013; Weiss and Prieto 2014). Since annual surveys began in 1994, the largest
total Canadian population was recorded in 1996 with an estimated 777-1151 birds. The low
population estimate assumes a female-to-male ratio of 2:1 (Environment Canada 2014). The high
population estimate assumes a 2:1 sex ratio and that only 90% of leks are known and only 75%
of males attend leks (Environment Canada 2014). This number declined to approximately 93-138
birds in 2012 (Environment Canada 2014), and then increased to approximately 171-256 birds in
2015 (L. Gardiner; J. Nicholson, personal communication) an overall decrease of 82–92% in just
2 decades (Environment Canada 2014; J. Nicholson, personal communication).
In Alberta, the sage-grouse population has declined at an alarming rate, with the current
population estimated to be only 5% of what it was in 1968. When sage-grouse monitoring in

15
Alberta began in 1968, 613 males (an estimated 1839-2724 total sage-grouse) were counted at
leks. The population hit an all-time low in 2011 and 2012 with 13 males (39-58 total sage-
grouse) recorded (Environment Canada 2014). In 2015, the number of males counted increased
to 35 males (J. Nicholson, personal communication). The number of active leks have decreased
81%, from a high of 21 in 1968 (Environment Canada 2014) to a low of 4 in 2015 (J. Nicholson,
personal communication). There has also been a decrease of 91% in the number of males per
active lek from approximately 29 (range 7-85) in 1968, to a high of 33 (range 2-74) in 1981
followed by a decrease to a low of 3 (range 0-6) males in 2012 (Environment Canada 2014).
Numbers increased to 9 males (range 0-12) per active lek in 2015 (J. Nicholson, personal
communication).
Population declines in Saskatchewan have been similar to those in Alberta, with the
number of males recorded in Saskatchewan decreasing by 98%, from a high of 873 (2619-3880
estimated total sage-grouse) in 1988 to a low of 8 (24-36 total sage-grouse) in 2014
(Environment Canada 2014; J. Karst, personal communication), increasing to 22 males in 2015
(L. Gardiner, personal communication). The number of active leks has decreased by 93%, from a
high of 42 in 1988 to lows of 2-3 during the 2010-2015 period (Environment Canada 2014). The
number of males per active lek dropped 71% from a high of 28.4 in 1971 (Kerwin 1971) to a low
of 1.6 (range 0-3) in 2014 (Environment Canada 2014; J. Karst, personal communication), then
increasing to 7.3 (range 0-15) males per active lek in 2015 (L. Gardiner, personal
communication).

16
1.4 FACTORS CONTRIBUTING TO SAGE-GROUSE POPULATION DECLINES
The reasons for the population decline vary across the range of sage-grouse (Crawford et
al. 2004) and include habitat loss and degradation due to the conversion of sagebrush habitat for
agriculture (Patterson 1952; Braun 1998), increased energy development and predation pressure
(Aldridge et al. 2008; Coates and Delehanty 2010), and drought and disease (Walker and Naugle
2011).
Conversion of sagebrush ecosystems for agriculture has been the primary cause of habitat
loss and fragmentation across the range of sage-grouse (Patterson 1952; Dalke et al. 1963;
Wallestad and Pyrah 1974), with at least 70% of sagebrush-dominated rangeland converted to
agricultural crop production (Braun 1998). Aldridge et al. (2008) found that the probability of
extirpation is most likely in areas with > 25% of the area cultivated for crops. Loss of sagebrush
habitat near leks has resulted in the abandonment of those sites in both Saskatchewan and
Alberta (Dube 1998, McAdam 2003).
Anthropogenic development negatively affects sage-grouse populations through the
avoidance of leks that occur near structures (Holloran 2005), decreased adult survival rates
(Aldridge and Boyce 2007), decreased nest, brood and yearling survival (Braun 1998, Aldridge
2005, Holloran et al. 2010) and increased nest predation (Braun 1998). Anthropogenic features
reduce the total amount of habitat available to sage-grouse by a factor larger than just the
footprint of the features themselves (Gillan et al. 2013). Sage-grouse appear to avoid otherwise
suitable habitat when vertical and/or noise-producing structures are present (e.g., power
distribution and transmission lines, buildings, oil and gas structures and wind turbines; Holloran
2005), likely due in part to perceived predation risk (Dinkins et al. 2014).

17
The mechanisms responsible for the cumulative effects of energy infrastructure that have
contributed to sage-grouse population declines depend on the magnitude and extent of
disturbance (Naugle et al. 2011). In the mid 1980’s, southern Alberta experienced a rapid
increase in oil and gas development (Braun et al. 2002). The negative impacts of oil and gas
infrastructure have been well documented, with avoidance by sage-grouse up to 1.9 km
(Carpenter et al. 2010), decreased rates of nest initiation within 950 m and decreased yearling
survival within 1.6 km of a functioning natural gas well (Holloran et al. 2010). In addition,
Aldridge and Boyce (2007) found that risk of brood failure increased 1.5 times with each well
site visible within 1 km of brood-rearing areas.
Human-altered habitats can influence predation rates by influencing predator community
composition and abundance, as well as the ability of predators to locate nests. Interactions
between changes in habitat and predation can have substantial negative effects including
fragmentation of nesting areas that can result in birds nesting in areas of overall reduced
concealment (i.e., energy development leases and agricultural land) and, subsequently, increased
probability of detection by predators that use visual cues to find nests (Stephens 2004). Habitat
fragmentation can also lead to changes in diversity and density of predators by promoting
survival and reproduction of generalist predators (Coates 2007; Webb et al. 2012). Predators are
often subsidized by anthropogenic sources of food, shelter, and nest substrate which results in
increased predator abundance (Coates 2007).
The primary reason for sage-grouse nest failure is predation, accounting for an average of
94% of the nests lost (Moynahan et al. 2007). Raccoon (Procyon lotor), striped skunk (Mephitis
mephitis) and coyote (Canis latrans) abundance have increased on the prairies in the last century
(Coates 2007) and are predators of both sage-grouse nests and adults (Coates et al. 2008).
18
Common Raven (Corvus corax) numbers have increased 300% in the western United States
since 1980 (Sauer et al. 2008), primarily a result of anthropogenic resource subsidies such as
food (e.g. landfills and road kill) and nest substrate (e.g. transmission towers) (Coates and
Delehanty 2010). Predation by common ravens, American crows (Corvus brachyrhynchos) and
black-billed magpies (Pica hudsonia) can severely reduce sage-grouse reproductive success
(Schroeder and Baydack 2001; Baxter et al. 2008; Coates et al. 2008). Anthropogenic features
used by avian predators such as perches have been linked to increased hunting efficiency
(Holloran and Anderson 2005; Coates and Delehanty 2010).
1.5 TRANSLOCATION AS A MANAGEMENT TOOL
Translocations of sage-grouse have been employed as a management tool to augment
declining populations since the 1930’s (Reese and Connelly 1997). The results of early
translocations were poorly documented, providing minimal guidance to inform subsequent
translocations (Bell 2011). According to Reese and Connelly (1997), all translocation efforts
before 1970 were unsuccessful or else insufficient data were collected to determine success, and
only 3/56 attempts in 7 states and 1 province were considered a success. In the last 2 decades,
however, translocation success has been moderately higher, largely because of better
reintroduction methods (Reese and Connelly 1997; Baxter et al. 2008). Successful translocations
in Utah and California indicate that this process can be an effective management tool to conserve
and augment small declining populations by increasing population size and reproductive output
(Baxter et al. 2008; Bell 2011).
In 2008, Montana Fish, Wildlife and Parks (MFWP) and Alberta Environment and
Sustainable Resource Development (AESRD) initiated a collaborative project to translocate
19
sage-grouse to augment the remaining Alberta population. The rationale was that population
augmentation would act to maintain a population of sage-grouse on the landscape in Alberta until
habitat restoration efforts could be undertaken (Balderson et al. 2013). During the spring of 2011
and 2012, 38 females and 3 males were translocated from stable populations in north-central
Montana (Balderson et al. 2013) to active lek sites in southeast Alberta.
1.6 PURPOSE OF RESEARCH
With approximately 100 sage-grouse left, the Alberta population is on the brink of
extirpation. Resources for land management and species at risk are limited, and habitat
enhancement efforts need to be strategically guided to expedite the recovery of sage-grouse.
Numerous studies have quantified avoidance patterns of anthropogenic features by sage grouse
(Aldridge 2005; Aldridge and Boyce 2007; Holloran and Anderson 2005). Fewer studies have
evaluated the movements of translocated sage-grouse in a landscape dominated by anthropogenic
fragmentation and loss of habitat. Restoration strategies will be necessary to facilitate the
persistence of sagebrush habitats and to improve conditions for remaining sage-grouse
populations and possibly future translocated sage-grouse. My research will help provide
stakeholders and wildlife managers with information useful for developing population recovery
and habitat enhancement strategies.
The primary goal of my research was to examine what habitat translocated sage-grouse
select to provide information that will assist in targeting habitat enhancements that are most
likely to contribute to sage-grouse recovery. I used the Global Position System (GPS) data
obtained from tagged sage-grouse translocated in 2011 and 2012 to examine habitat use in
Alberta. My objectives were to:

20
1) Determine the differences in post-release movements between nesting and non-nesting
hens and use these results to help guide future translocation protocols.
2) Assess the extent to which nest success is affected by anthropogenic features and
compare the nesting ecology of translocated sage-grouse in Alberta with what is known
from other populations throughout the species range.
3) Determine the habitat translocated sage-grouse select in relation to anthropogenic and
natural features (sagebrush cover, trees, elevation, slope, oil and gas wells, roads, power
lines, buildings and settlements) and from these results, recommend habitat enhancement
activities that should contribute to sage grouse recovery.

21
1.7 LITERATURE CITED
Adams, B. W., J. Carlson, T. Milner, T. Hood, B. Cairns, and P. Herzog. 2004. Beneficial grazing management practices for Sage-Grouse (Centrocercus urophasianus) and ecology of silver sagebrush (Artemisia cana). Technical Report, Public Lands and Forests Division, Alberta Sustainable Resource Development, Edmonton, Alberta, Canada.
Adams, B. W., L. Poulin-Klein, D. Moisey, and R. L. McNeil. 2005. Range plant communities and range health assessment guidelines for the dry mixed grass natural subregion of Alberta. Alberta Environment and Sustainable Resource Development. Edmonton, Alberta, Canada.
Alberta Environment and Sustainable Resource Development. 2013. Alberta Greater Sage-grouse Recovery Plan 2013-2018. Alberta Species at Risk Recovery Plan No. 30, Edmonton, Alberta, Canada.
Aldridge, C. L. 1998. Status of the sage grouse (Centrocercus urophasianus urophasianus) in Alberta. Alberta Environmental Protection, Wildlife Management Division, and Alberta Conservation Association, Wildlife Status Report No. 13, Edmonton, Alberta, Canada.
Aldridge, C. L. 2000. Reproduction and habitat use by Sage Grouse (Centrocercus urophasianus) in a northern fringe population. Thesis, University of Regina, Regina, Saskatchewan, Canada.
Aldridge, C. L. 2005. Identifying habitats for the persistence of Greater Sage-Grouse (Centrocercus urophasianus) in Alberta, Canada. Dissertation, University of Alberta, Edmonton, Alberta, Canada.
Aldridge, C. L., and M. S. Boyce. 2007. Linking occurrence and fitness to persistence: habitat-based approach for endangered greater sage-grouse. Ecological Applications 17:508–526.
Aldridge, C. L., S. E. Nielsen, H. L. Beyer, M. S. Boyce, J. W. Connelly, S. T. Knick, and M. A. Schroeder. 2008. Range-wide patterns of greater sage-grouse persistence. Diversity and Distributions 14:983–994.
Balderson, K. L., D. H. Eslinger, and J. T. Nicholson. 2013. Greater Sage-Grouse (Centrocercus urophasianus) Monitoring in Southeast Alberta: 1968-2012. Alberta Species at Risk Report 147, Alberta Environment and Sustainable Resource Development, Fish and Wildlife Division. Edmonton, Alberta, Canada.
Baxter, R. J., J. T. Flinders, and D. L. Mitchell. 2008. Survival, movements, and reproduction of translocated Greater Sage-Grouse in Strawberry Valley, Utah. Journal of Wildlife Management 72:179–186.
Bell, C. B. 2011. Nest site characteristics and nest success of translocated and resident greater sage grouse at Clear Lake National Wildlife Refuge. Thesis, Humboldt State University, Arcata, California, USA.
Braun, C. E. 1998. Sage grouse declines in western North America: what are the problems? Pages 139–156 in. Proceedings of the Western Association of State Fish and Wildlife Agencies. Volume 78.
Braun, C. E., T. E. Britt, and R. O. Wallestad. 1977. Guidelines for maintenance of sage grouse habitats. Wildlife Society Bulletin 5:99–106.
Braun, C., O. Oedekoven, and C. L. Aldridge. 2002. Oil and gas development in western North America: effects on sagebrush steppe avifauna with particular emphasis on sage grouse. Pages 337–349 in. Transactions of the North American Wildlife and Natural Resources Conference. Volume 67.

22
Bureau of Land Management. 1996. Partners against weeds: final action plan for the Bureau of Land Management. <https://archive.org/details/partnersagainstw27unit>. Accessed 29 Sep 2013.
Bureau of Land Management. 2004. Annual Report: Bureau of Land Management: FY 2002: balancing today’s needs for tomorrow’s public lands. Bureau of Land Management. Department of the Interior, Denver, Colorado, USA.
Carpenter, J., C. L. Aldridge, and M. S. Boyce. 2010. Sage-Grouse habitat selection during winter in Alberta. Journal of Wildlife Management 74:1806–1814.
Centre for Science, Economics and Environment. 2002. The state of the nation’s ecosystems: measuring the lands, waters, and living resources of the United States. Cambridge University Press, Cambridge, UK.
Coates, P. S. 2007. Greater Sage-Grouse (Centrocercus urophasianus) nest predation and incubation behavior. Dissertation, Idaho State University, Pocatello, ID, USA.
Coates, P. S., J. W. Connelly, and D. J. Delehanty. 2008. Predators of Greater Sage-Grouse nests identified by video monitoring. Journal of Field Ornithology 79:421–428.
Coates, P. S., and D. J. Delehanty. 2010. Nest predation of Greater Sage-Grouse in relation to microhabitat factors and predators. Journal of Wildlife Management 74:240–248.
Connelly, J., M. A. Schroeder, A. R. Sands, and C. E. Braun. 2000. Guidelines to manage Sage Grouse populations and their habitats. Wildlife Society Bulletin 28:967–985.
Connelly, J. W., S. T. Knick, M. A. Schroeder, and S. J. Stiver. 2004. Conservation assessment of the greater sage-grouse and sagebrush habitats. Western Association of Fish and Wildlife Agencies, Cheyenne, Wyoming, USA.
Connelly, J. W., E. T. Rinkes, and C. E. Braun. 2011. Characteristics of greater sage-grouse habitats: a landscape species at micro and macro scales. Pages 69–83 in S.T. Knick and J.W. Connelly, editors. Greater sage-grouse: ecology and conservation of a landscape species and its habitat. Studies in Avian Biology 38. University of California Press, Berkeley, California, USA.
Crawford, J. A., R. A. Olson, N. E. West, J. C. Mosley, M. A. Schroeder, T. D. Whitson, R. F. Miller, M. A. Gregg, and C. S. Boyd. 2004. Ecology and management of Sage-Grouse and Sage-Grouse habitat. Journal of Range Management 57:2-19.
Dalke, P. D., D. B. Pyrah, D. C. Stanton, J. E. Crawford, and E. F. Schlatterer. 1963. Ecology, productivity, and management of Sage Grouse in Idaho. The Journal of Wildlife Management 27:810-841.
Davies, K. W., C. S. Boyd, J. L. Beck, J. D. Bates, T. J. Svejcar, and M. A. Gregg. 2011. Saving the sagebrush sea: An ecosystem conservation plan for big sagebrush plant communities. Biological Conservation 144:2573–2584.
Dinkins, J. B., M. R. Conover, C. P. Kirol, J. L. Beck, and S. N. Frey. 2014. Greater Sage-Grouse (Centrocercus urophasianus) select habitat based on avian predators, landscape composition, and anthropogenic features. The Condor 116:629–642.
Dube, L. A. 1998. Provincial Sage-Grouse population trend counts April–May 1991. Unpublished Report, Fish and Wildlife Division, Alberta Forestry, Lands and Wildlife, Lethbridge, Alberta, Canada.
Environment Canada. 2014. Amended recovery strategy for the Greater Sage-Grouse (Centrocercus urophasianus urophasianus) in Canada. Species at Risk Act Recovery Strategy Series. Environment Canada, Ottawa, Canada.

23
Gillan, J. K., E. K. Strand, J. W. Karl, K. P. Reese, and T. Laninga. 2013. Using spatial statistics and point-pattern simulations to assess the spatial dependency between greater sage-grouse and anthropogenic features. Wildlife Society Bulletin 37:301–310.
Hanser, S. E., and S. T. Knick. 2011. Greater sage-grouse as an umbrella species for shrubland passerine birds: a multiscale assessment. Pages 475–488 in S.T. Knick and J.W. Connelly, editors. Greater sage-grouse: ecology and conservation of a landscape species and its habitat. Studies in Avian Biology 38. University of California Press, Berkeley, California, USA.
Hickman, L. K., P. A. Desserud, B. W. Adams, and C. C. Gates. 2013. Effects of disturbance on Silver Sagebrush communities in Dry Mixed-Grass Prairie. Ecological Restoration 31:274–282.
Holloran, M. J. 2005. Greater sage-grouse (Centrocercus urophasianus) population response to natural gas field development in western Wyoming. Dissertation, University of Wyoming, Laramie, Wyoming, USA.
Holloran, M. J., and S. H. Anderson. 2005. Spatial distribution of Greater Sage-Grouse nests in relatively contiguous sagebrush habitats. The Condor 107:742–752.
Holloran, M. J., R. C. Kaiser, and W. A. Hubert. 2010. Yearling Greater Sage-Grouse response to energy development in Wyoming. Journal of Wildlife Management 74:65–72.
Kerwin, M. L. 1971. The status, behaviour and ecology of Sage-Grouse in Saskatchewan. Thesis, University of Regina, Regina, Saskatchewan, Canada.
Knick, S. T., D. S. Dobkin, J. T. Rotenberry, M. A. Schroeder, W. M. Vander Haegen, and C. van Riper. 2003. Teetering on the edge or too late? Conservation and research issues for avifauna of sagebrush habitats. The Condor 105:611-643.
Knick, S. T., S. E. Hanser, R. F. Miller, D. A. Pyke, M. J. Wisdom, S. P. Finn, E. T. Rinkes, and C. J. Henny. 2011. Ecological influence and pathways of land use in sagebrush. Studies in Avian Biology 38:203–252.
McAdam, S. 2003. Lek occupancy by greater Sage-Grouse in relation to habitat in southwestern Saskatchewan. Thesis, Royal Roads University, Victoria, British Columbia, Canada.
McArthur, E. D. 1992. Ecology, distribution, and values of sagebrush within the intermountain region. Symposium on Ecology, Management, and Restoration of Intermountain Annual Rangelands Boise, Idaho, USA. <http://www.fs.fed.us/rm/pubs_int/int_gtr313/int_gtr313_347_351.pdf>. Accessed 5 May 2015.
McArthur, E. D., C. L. Pope, and D. C. Freeman. 1981. Chromosomal studies of subgenus Tridentatae of Artemisia: evidence for autopolyploidy. American Journal of Botany 68:589–605.
Miller, R. F., and L. L. Eddleman. 2001. Spatial and temporal changes of sage grouse habitat in the sagebrush biome. Technical Bulletin 151, Oregon State University, Agricultural Experiment Station, Corvallis, Oregon, USA. <http://ir.library.oregonstate.edu/xmlui/handle/1957/20881>. Accessed 18 May 2015.
Moynahan, B. J., M. S. Lindberg, J. J. Rotella, and J. W. Thomas. 2007. Factors affecting nest survival of Greater Sage-Grouse in northcentral Montana. Journal of Wildlife Management 71:1773–1783.
NatureServe 2013. NatureServe Explorer. <http://www.natureserve.org/explorer/>. Accessed 3 Nov 2013.

24
Naugle, D. E., K. E. Doherty, B. L. Walker, M. J. Holloran, and H. E. Copeland. 2011. Energy development and greater sage-grouse. Pages 489-503 in S.T. Knick and J.W. Connelly, editors. Ecology and Conservation of Greater Sage Grouse: a Landscape Species and its Habitats. Studies in Avian Biology. Volume 38. University of California Press, Berkeley, California, USA.
Noss, R. E., E. T. LaRoe III, and J. M. Scott. 1995. Endangered ecosystems of the United States: A preliminary assessment of loss and degradation. U.S. Department of the Interior, National Biological Service, Washington, DC, USA.
Patterson, R. L. 1952. The Sage Grouse in Wyoming. Sage Books, Denver, Colorado, USA. Reese, K. P., and J. W. Connelly. 1997. Translocations of Sage Grouse Centrocercus
urophasianus in North America. Wildlife Biology 235–241. Rowland, M. M., M. J. Wisdom, L. H. Suring, and C. W. Meinke. 2006. Greater sage-grouse as
an umbrella species for sagebrush-associated vertebrates. Biological Conservation 129:323–335.
Sauer, J. R., J. E. Hines, and J. Fallon. 2008. The North American Breeding Bird Survey, Results and Analysis 1966 - 2007. Laurel, Maryland, USA.
Schroeder, M. A., C. L. Aldridge, A. D. Apa, J. R. Bohne, C. E. Braun, S. D. Bunnell, J. W. Connelly, P. A. Deibert, S. C. Gardner, M. A. Hilliard, G. D. Kobriger, S. M. McAdam, C. W. McCarthy, J. J. McCarthy, L. Mitchell, E. V. Rickerson, and S. J. Stiver. 2004. Distribution of Sage-Grouse in North America. The Condor 106:363–376.
Schroeder, M. A., and R. K. Baydack. 2001. Predation and the management of prairie grouse. Wildlife Society Bulletin 29:24–32.
Stephens, S. 2004. Effects of habitat fragmentation on avian nesting success: a review of the evidence at multiple spatial scales. Biological Conservation 115:101–110.
Suring, L. H., M. M. Rowland, and M. J. Wisdom. 2005. Identifying species of conservation concern. Pages 150-162 in Wisdom, M.J., Rowland M.M., Suring L.H, editors. Habitat Threats in the Sagebrush Ecosystem - Methods of Regional Assessment and Applications in the Great Basin. Alliance Communications Group, Lawrence, Kansas, USA.
Thatcher, A. P. 1959. Distribution of sagebrush as related to site differences in Albany County, Wyoming. Journal of Range Management 12:55–61.
United States Department of Agriculture, N. R. C. S. 2015. Artemisia cana, silver sagebrush. <http://plants.usda.gov/core/profile?symbol=ARCA13>. Accessed 15 Jun 2015.
Walker, B. L., and D. E. Naugle. 2011. West Nile virus ecology in sagebrush habitat and impacts on Greater Sage-Grouse populations. Pages 127–143 in S.T. Knick and J.W. Connelly, editors. Ecology and Conservation of Greater Sage Grouse: A Landscape Species and its Habitats. Studies in Avian Biology, Volume 38, University of California Press, Berkeley, California, USA.
Wallestad, R. O. 1975. Life history and habitat requirements of Sage Grouse in central Montana. Department of Fish and Game, Helena, Montana, USA.
Wallestad, R., and D. Pyrah. 1974. Movement and nesting of Sage Grouse hens in central Montana. The Journal of Wildlife Management 38:630-633.
Webb, S. L., C. V. Olson, M. R. Dzialak, S. M. Harju, J. B. Winstead, and D. Lockman. 2012. Landscape features and weather influence nest survival of a ground-nesting bird of conservation concern, the greater sage-grouse, in human-altered environments. Ecological Processes 1:1–15.
Weiss, M. and B. Prieto. 2014. A conservation plan for Greater Sage-Grouse in Saskatchewan.

25
Fish and Wildlife Branch, Regina, Saskatchewan, Canada Wisdom, M. J., M. M. Rowland, L. H. Suring, L. Schueck, C. W. Meinke, and S. T. Knick.
2005. Evaluating species of conservation concern at regional scales. Pages 5–24 in. Wisdom, M.J., Rowland, M.M., Suring L.H., editors. Habitat Threats in the Sagebrush Ecosystem - Methods of Regional Assessment and Applications in the Great Basin. Alliance Communications Group, Lawrence, Kansas, USA.
Wisdom, M. J., M. M. Rowland, L. H. Suring, L. Schueck, C. W. Meinke, B. C. Wales, and S. T. Knick. 2003. Procedures for regional assessment of habitats for species of conservation concern in the sagebrush ecosystem. Unpublished report on file at Pacific Northwest Research Station 1401. <http://citeseerx.ist.psu.edu/viewdoc/download?doi=10.1.1.364.3128&rep=rep1&type=pdf>. Accessed 6 May 2015.

26
2.0 POST-RELEASE MOVEMENTS AND NESTING ECOLOGY OF TRANSLOCATED
GREATER SAGE-GROUSE
2.1 INTRODUCTION
Sagebrush-dominated ecosystems were once a prominent feature of the western North
American landscape, covering at least 60 million ha (Vale 1975) in 16 states and 3 provinces
(Braun et al. 2002). Today, the quantity and quality of the sagebrush ecosystems across western
North America has declined dramatically (Miller and Eddleman 2001; Connelly et al. 2004).
Since European settlement, few sagebrush landscapes remain intact; most have been fragmented,
degraded, or lost due to agriculture, improper livestock grazing, natural resource development,
urban and rural sprawl, invasive plant and animal species, and altered fire regimes (Noss et al.
1995; Miller and Eddleman 2001; Connelly et al. 2004; Brown et al. 2005; Knick et al. 2011).
Estimates for the loss of sagebrush-dominated areas exceed 50% (Baker et al. 1976; Braun
1998).
Greater Sage-grouse occur within the sagebrush steppe ecosystem of western North
America and are considered sagebrush obligates; they depend on healthy, intact sagebrush
habitats throughout the year for breeding sites, nesting, feeding, brood-rearing and wintering
(Patterson 1952; Wallestad 1975; Braun et al. 1977; Connelly et al. 2004; Connelly et al. 2011).
Sage-grouse have experienced population declines ranging from 45% to 80% across their range
(Braun 1998). Sage-grouse currently occupy approximately 56% of their pre-European
settlement range (Schroeder et al. 2004) with many monitored populations declining by
approximately 2% per year since 1965 (Braun 1998; Connelly et al. 2004).

27
Since 1950, the western United States has experienced rapid human population growth,
with 60% of rural counties growing faster than urban counties (Odell et al. 2003; Brown et al.
2005). Urban and rural housing developments scattered throughout large tracts of sagebrush
habitat have impacted wildlife use of this habitat (Braun 1998). Growing human populations
have led to increasing energy demands. Projected growth in United States energy demand is
0.5–1.3% annually (National Petroleum Council 2007), and trends suggest development of
domestic fossil fuel reserves will expand through the first half of the 21st century (Naugle et al.
2011). The infrastructure associated with growing human populations and energy development
(e.g., houses, fences, roads, power lines, well sites, and pipe lines) are contributing to the
fragmentation and loss of sagebrush habitats across western North America.
While fragmentation of sagebrush habitats has been detrimental to some species, certain
predator species have capitalized on the presence of anthropogenic features. These species
include Coyote (Canis latrans), common raven (Corvus corax), American crow (Corvus
brachyrhynchos), black-billed magpie (Pica hudsonia), red fox (Vulpes vulpes), raccoon
(Procyon lotor) and striped skunk (Mephitis mephitis), all of which have been documented as
nest predators of sage-grouse and have the ability to severely reduce reproductive success
(Schroeder and Baydack 2001; Baxter et al. 2008; Coates et al. 2008; Coates and Delehanty
2010). These species are considered generalist predators because of their broad prey-base and
propensity for using anthropogenic features (Gehrt 2004). Abandoned farmsteads and buildings
are common on the prairies as remnants of European settlement (Wishart 2004) and are used
extensively by coyote, red fox, raccoon and skunks (Angelstam 1986; Lariviere et al. 1999;
Lariviere 2004; Marks and Bloomfield 2006). The common raven has been identified as a
principal nest predator of sage-grouse (Coates and Delehanty 2010); their numbers have

28
dramatically increased in the western United States (Sauer et al. 2008) and the Canadian prairies
(Government of Canada 2014), primarily as a result of anthropogenic resource subsidies such as
food (e.g. landfills) and nesting substrate (e.g. transmission towers).
Translocations of animals within their range, or to parts of their former range, have
become a popular tool in wildlife management for species experiencing population declines
including ungulates, gallinaceous birds, raptors and marsupials (Griffith et al. 1989; Wolf et al.
1996). Conservation translocation is the deliberate movement of organisms from one site for
release in another (IUCN/SSC 2013). Current guidelines state that a translocation must intend to
yield a measurable conservation benefit at the levels of a population, species or ecosystem, while
providing benefits outside the scope of the translocated individuals. (IUCN/SSC 2013).
Translocations have varied goals that include bolstering genetic heterogeneity of small
populations, establishing satellite populations to reduce the risk of extirpation or extinction due
to catastrophes, and enhancing the recovery of species after habitat has been restored (Griffith et
al. 1989).
The translocation of sage-grouse has been employed as a management tool to augment
declining populations since the 1930s (Reese and Connelly 1997). The results of early
translocations were poorly documented, providing minimal guidance to inform subsequent
translocations (Bell 2011). All translocation efforts before 1970 were either unsuccessful or there
were insufficient data to determine success (Reese and Connelly 1997). Of the studies with
sufficient data, only 3/56 attempts in 7 states and 1 province after 1970 were considered a
success (Reese and Connelly 1997). In the past 2 decades however, translocation success has
been moderately higher, largely a result of better reintroduction methods including timing of
capture (i.e. season and time of day), rapid transport and release, and choosing appropriate

29
release sites (Reese and Connelly 1997; Baxter et al. 2008). Successful translocations in Utah
and California indicate that this process can be an effective management tool to conserve and
augment small declining populations by increasing population size and reproductive output
(Baxter et al. 2008, Bell 2011). Success estimations are variable (Brichieri-Colombi and
Moehrenschlager 2016), but these translocations were considered a success because of such
outcomes as increased male lek attendance, integration with resident birds, and similar nest
initiation, clutch size, and nest success of translocated hens when compared to resident hens in
other populations which were stable or increasing (Baxter et al. 2008, Bell 2011).
Despite its significance to conservation, few guidelines exist that define a successful
translocation. As a result, translocations can be difficult to evaluate (Fischer and Lindenmayer
2000; Brichieri-Colombi and Moehrenschlager 2016). Recent evaluations of sage-grouse
translocations have focused on site fidelity, survival, and reproduction and compared these
attributes of translocated birds to resident grouse in other populations (Musil et al. 1993; Baxter
et al. 2008). However, reproductive success is highly variable between sage-grouse populations
during the same year and within populations between years making these comparisons difficult
(Schroeder 1997; Sveum et al. 1998). Sage-grouse nest success (percentage of nests that hatch ≥
1 egg) ranges from 15-86% with stable populations having nest success rates at the higher end of
that range (Schroeder et al. 1999). Relatively speaking, lower nest success is associated with
silver sagebrush habitat and fragmented habitats due to lower sagebrush cover (Aldridge 2000).
The population decline of sage-grouse in Alberta has been severe, with the number of
male sage-grouse reaching an all-time low of 13 in 2011 and 2012, down from an estimated 613
males in 1968. As a result of the population decline, 38 females and 3 males were translocated
from stable populations in north-central Montana (Balderson et al. 2013) to active lek sites in

30
southeast Alberta during the spring of 2011 and 2012. The objective was to maintain a
population of sage-grouse on the landscape in Alberta until substantive habitat restoration efforts
could be undertaken (Balderson et al. 2013). In 2015, the sage-grouse population increased to 35
males. This increase could be the result of the translocation, the removal of anthropogenic
features in key sage-grouse habitat, environmental factors presumably amenable to reproductive
success and survival, or a combined result of one or more of the above factors.
The objectives of my research are to determine the differences in post-release movements
between nesting and non-nesting hens as well as assessing the extent to which nest success is
affected by anthropogenic features. I also compare the nesting ecology of translocated sage-
grouse in Alberta with data from other populations throughout the species’ range. I use these
results to help inform future translocation protocols, identify and discuss options for the removal
or mitigation of anthropogenic features and identify areas in which to concentrate habitat
enhancement efforts.
2.2 METHODS
2.2.1 Study Area and Translocation
I conducted my research in the extreme southeast corner of Alberta: township 1, range 1
(49.008°N, 110.08°W) to township 6, range 7 (49.528°N, 110.958°W), west of the 4th meridian
(Figure 2.1.). This represents the current range of sage-grouse in Alberta and is a total area of 42
townships (roughly 3,900 km2) (Alberta Environment and Sustainable Resource Development
2013). The study area is located within the Dry Mixed Grass Natural Subregion of Alberta,
which has the warmest summers, longest growing season and lowest levels of precipitation of
any Natural Subregion in Alberta (Natural Regions Committee 2006). The dominant soils are

31
Brown Chernozems, but Brown Solonetzic soils are also present where saline and sodic
conditions prevail (Natural Regions Committee 2006). Silver sagebrush is the dominant shrub,
pasture sage (A. frigida) is the dominant forb, and common grasses include blue grama
(Bouteloua gracilis), needle and thread (Heterostipa comata) and June grass (Koeleria
macrantha) (Natural Regions Committee 2006). Grazing and dry-land farming are the main
agricultural activities (Natural Regions Committee 2006). Land-use in the study area includes
recreation, ranching, annual crop production and oil and gas development. This area is
predominately provincial Crown land, managed under long-term grazing leases monitored by
Alberta Environment and Parks staff.
On April 21 and 22, 2011, 9 sage-grouse hens were caught and translocated from stable
populations in north-central Montana to active leks in southeast Alberta. During the spring of
2012, 29 hens and 3 males were translocated between April 3 and April 6. Sage-grouse were
captured at night using spotlights and hand-held nets. Hens were weighed and classified as either
yearling or adult based on the condition of the outer primary feathers (Pyle 2001). If the ends of
the outer primaries were frayed and worn, paler brown, pointed, and with more pale markings on
the outer web, the bird was classified as a yearling. If the outer primaries were darker brown with
less pale speckling on the outer edge and have a less-worn, rounded, white edged tip, then the
bird was classified as an adult (Eng 1955). In total, 39 out of the 41 translocated sage-grouse
were fitted with solar-powered Global Positioning System (GPS) platform transmitter terminal
(PTT) telemetry units (North Star Science and Technology, King George, VA, USA). Two hens
were not fitted with transmitters due to minor injuries incurred during capture. The average time
elapsed from when a sage-grouse was captured until it was released was 30 hours ± 4 hours. The

32
telemetry units were programmed to store up to 4 GPS waypoints each day approximately every
6 hours.
Figure 2.1. Study area and translocated sage-grouse hen GPS locations from 1 May to 15
September 2011-2015 in southeast Alberta, townships 1-1 to 6-7 W4M. This represents the
current range of sage-grouse in Alberta, an area of 42 townships or roughly 3,900 km2.
2.2.2 Habitat Characteristics and Anthropogenic Features
Sagebrush
Air-photo interpretation, in conjunction with on-site data, were used to spatially define
the density, distribution and height characteristics of sagebrush using ortho-imagery with 5 m
resolution (Jones et al. 2005). Polygons classified as water (lakes, rivers, streams and water
developments) covered 3% of the study area (Jones et al. 2005) and were excluded from
analysis. Sagebrush polygons were converted to raster using the raster package (Hijmans 2014)
in R 3.1.2 (R Development Core Team 2015). The raster was created using 46 m x 46 m pixels

33
(2116 m2) to reflect the accuracy of the transmitters (area of 26 m radius circle = 2116m2).
Individual sagebrush cover values within each pixel were averaged and used in the analyses.
Trees and Agriculture
Grassland Vegetation Inventory (GVI) data were obtained from Alberta Environment and
Sustainable Resource Development (AESRD). GVI is composed of ecological range sites based
on soil information for areas with native vegetation and areas associated with agricultural,
industrial, and residential developments (Government of Alberta 2010). Within the GVI, trees
are present as both point features (natural tree distribution) and linear features (shelterbelts).
Point features and line segments in the GVI have an accuracy of 5 m in 95% of tested locations
for upland features (Government of Alberta 2010). Using a custom-made “create points on lines”
tool in ArcGIS 10.1 (ESRI ArcGIS Desktop 2012), I digitized point features every 10 m on the
shelterbelts (the approximate distance between trees in the shelterbelts) and combined all tree
data. Also within the GVI, agriculture polygons (including crop and tame pasture) were
rasterized using the same methodology as the sagebrush layer.
Oil and Gas Infrastructure
Data on location and status of oil and gas infrastructure were obtained from the Alberta
Energy Regulator. Active and suspended oil wells were combined, as the same types of above
ground infrastructure (3-5 m high) are typically present for both types of disturbances and both
are contained within the same geographic area. Gas wells were grouped together with drilled and
cased wells and abandoned oil and gas wells as they are all short vertical structure (~1.6 m) and
produce minimal to no noise. Abandoned wells were ground-truthed to determine if above-

34
ground infrastructure was present. If above-ground infrastructure was absent, then the site was
removed from the data set (approximately half of the well sites were removed). If above-ground
infrastructure was present, it was categorized as either an active/suspended well (for higher
vertical structures) or a gas well (for lower vertical structures).
Buildings
I located abandoned buildings by driving roads and trails and recording the location of
any buildings using a hand held GPS and a range finder. I undertook this survey for
approximately 80% of the range of sage-grouse in southeast Alberta. Remaining areas were
assessed for buildings using ortho-imagery obtained from the Counties of Forty Mile and
Cypress. Each building was transformed into a point feature in ArcMap 10.1 (ESRI ArcGIS
Desktop 2012). Locations of active homesteads were obtained from the county offices.
Abandoned buildings (i.e. old sheds) that were on the same property as an active building (i.e.
active residences) were removed to avoid confounding results.
Linear Features
Data on the location of roads and trails were obtained from AESRD as part of the Digital
Integrated Disposition layer (Government of Alberta 2014). Paved and gravel roads were
combined since there are only 2 paved roads within the study area and paved and gravel roads
are likely to have similar low-medium traffic volumes. Two-track trails were kept separate
because of a smaller disturbance size and even lower traffic volumes. I obtained data on the
distribution of fence lines from Alberta Conservation Association (ACA) which collected the
information as part of a project for Pronghorn (Antilocapra americana) conservation (P. Jones,

35
personal communication). Using satellite imagery, fence lines were digitized into ArcMap. A
portion of the area was ground-truthed for fence lines by ACA and the model was deemed to
have 94% accuracy (P. Jones, personal communication). Data on the distribution of power lines
were obtained from Fortis Alberta. One segment of power line owned and operated by private
landowners was digitized into ArcMap (R. Heydlaufe and T. Whiklo, personal communication).
2.2.3 Post-release Movements and Apparent Hen Survival
Only GPS locations with the highest accuracy (<26 m) were included in my analyses.
Three males translocated in 2012 were not included in my analyses due to the small sample size
and the potential for behavioural differences between males and females. For example, when
released, males are more likely to remain on the lek, whereas females may search for nest sites. I
quantified the post-release movements of translocated sage-grouse hens in 2012 by calculating
linear distance travelled (per post-release week and cumulative), distance from release site, area
traversed [100% Minimum Convex Polygons (MCP)] and movement rates (m/hr) using ArcMap
10.1 (ESRI ArcGIS Desktop 2012) and the adehabitatLT package (Calenge 2006) in R 3.1.2 (R
Development Core Team 2015). All means are presented along with standard deviation. Post-
release data from 2011 were not included to avoid potential differences between years and
because the sample size was considerably smaller and GPS transmissions not as consistent. I
included GPS data starting from each hen’s release (3 April to 6 April) until 15 September which
is considered the end of the summer season for sage-grouse in Alberta (Government of Alberta
2009). Although distance travelled and area traversed are metrics more easily compared between
studies, movement rates between GPS locations were also calculated to standardize variation in
sampling intervals produced because of the inability of the transmitters to always send GPS

36
locations for all scheduled attempts (Johnson et al. 2002). The transmitters may not have
acquired or sent locations every 6 hours if the solar panel on the transmitter was not charged as a
result of weather, topography or the bird being under cover. Typically, back-logged location data
was sent out once the transmitter was charged, but this was not always the case. Given this
nature of the GPS data, movement rates are considered a more suitable representation of post-
release movements. Each GPS location was assigned a categorical variable of 0 (non-nesting
hen) or 1 (nesting hen) for movement rate analysis.
Boxplots were created using the ggplot2 package (Wickham 2009) in R 3.1.2 (R
Development Core Team 2015) to illustrate differences in post-release movement rates of hens
that initiated nests versus those that did not. I used the mgcv package (Woods 2011) in R 3.1.2
(R Development Core Team 2015) to develop generalized additive models (GAM) with a
tweedie error distribution to analyze movement rates of nesting and non-nesting hens. A
likelihood ratio test was used to determine if there was a significant difference in movement rates
between the model with a categorical variable that distinguished nesting hens and non-nesting
hens, and the model without the categorical variable. I included individual birds as a random
effect and assessed model residuals for temporal autocorrelation. The mean expected movement
rates for each week were calculated with point-wise confidence intervals for nesting and non-
nesting hens using the mgcv package (Woods 2011) in R 3.1.2 (R Development Core Team
2015).
I visited the location of the last GPS signal sent by a transmitter to confirm mortality
when the transmitters were indicating ambient temperature and there was no sign of activity. I
collected feathers and took photographs of dead grouse and sent them to a wildlife forensic
expert for analysis. Mortalities were considered confirmed when the carcass and/or a damaged

37
transmitter were found. Mortalities were considered unconfirmed if transmitters either stopped
transmitting, birds had the transmitter fall off (this mainly occurred during incubation), or if I
could not find the grouse at the last GPS location. Apparent annual hen survival was determined
by dividing the number hens with active transmitters at the end of each year (March 31st) by the
total number of hens with active transmitters at the start of each year (considered April 1st to
represent one year post-release).
2.2.4 Nesting Ecology
In 2011 and 2012, I visually confirmed nest locations during the first week of incubation
based on the transmitters yielding a cluster of GPS points in the same location during egg-laying.
The nest was re-visited 2-3 days after GPS data indicated that the hen had left her nest and the
status of the nest was recorded as predated, abandoned or successful. Estimates of when egg-
laying and incubation started and ended are likely accurate to within 1-2 days based on the
consistency of GPS data transmitted during incubation. Egg-laying was indicated by the
movement data that demonstrated the hen returning to the same GPS location. Egg-laying was
assumed to occur at a rate of approximately 2 eggs every 3 days (Patterson 1952). The end of
egg-laying and start of incubation was indicated by the hen more consistently remaining on that
GPS location (aside from incubation breaks). When GPS data indicated location points close to
the nest (~100 m) at the end of the incubation period (25-29 days; Schroeder et al. 1999), it was
inferred that the nest was successful. When GPS data indicated location points further away from
the nest before the end of the incubation period, it was inferred that the nest was predated. In
2013 and 2014, given the demonstrated ability of the GPS data to accurately reflect nest

38
initiation and failure, nests were not visually confirmed until GPS data indicated that the nest
was either successful or unsuccessful to reduce disturbance by researchers.
When nests were visually confirmed, clutch sizes were recorded by counting the number
of eggs in the nest. If clutch size could not be confirmed (i.e. the hen did not flush or eggs were
removed during predation), I used the average clutch size of nests from which clutch size could
be confirmed. I estimated nest initiation date by counting back from the start of incubation 1.5
days/egg laid. Incubation length was calculated from the last day of egg-laying up to and
including the hatch date. Nest success was defined as the percent of nests that hatched ≥ 1 egg.
The eggs from one nest in 2014 were collected for the Calgary Zoo’s captive breeding program;
this nest was included in nest initiation calculations but not nest success. The number of nests
within 3.2 km of active leks was determined to help assess if the current development buffer
around sage-grouse leks in Alberta is sufficient. In addition, several studies have determined that
the majority of nests are located within 3.2 km of active leks (Braun et al. 1977). I used ArcMap
10.1 (ESRI ArcGIS Desktop 2012) to quantify the distance from each nest to the nearest lek,
tree, power line, building, settlement, road, gas well, oil well and fence. I determined sagebrush
cover by isolating the polygon in the sagebrush GIS layer developed by Jones et al. (2005) in
which the nest was located in and recording the percent sagebrush cover of that polygon.
Logistic regression (PROC LOGISTIC) was used in SAS Enterprise Guide 4.3 (SAS
Institute Inc. 2010) as an exploratory analysis to assess the impact of nest initiation date, age,
mass of hen and distance to anthropogenic features on the probability of nest success. I used
AICc with a correction for small sample size to rank models (Burnham and Anderson 2000) and
considered the model with the lowest AICc value to be the strongest of those considered. I used
85% confidence intervals to identify informative parameters (Arnold 2010). I took all the single

39
variable models that were better than the null and made them the global model. I then removed
the model with the smallest effect size until the best model explaining variation was revealed.
2.3 RESULTS
2.3.1 Nesting Ecology
Average nest-lek distance was 5.2 km ± 6.0 km (SD) (range 0.3 – 22 km). Of the 22 nests
initiated, 15 (68%) were located within 3.2 km of an active lek. Average laying date of the first
egg was 29 April (range 20 April – 7 May) and average incubation initiation for first nests was
11 May (range 5 May – 18 May). Average clutch size was 7.6 (range 5 – 10). The mean hatching
date for successful first nesting attempts was 7 June (range 4 June – 11 June). Incubation length
for all successful nests was 27 days (range 26 – 28).
2.3.2 Post-release Movements and Apparent Hen Survival
The majority of hens (16/21) travelled ≤ 400 km during the 10-week post-release period
in 2012 (3 hens ≤ 100 km, 3 hens 101-200 km, 4 hens 201-300 km and 6 hens 301-400 km). Five
hens travelled ≥ 400 km (2 hens 401-500 km, 1 hen 501-600 km, 1 hen 601-700 km and 1 hen
1000-1100 km). The mean linear distance travelled/week/hen was 56 km ± 56 (SD), ranging
from weekly averages/hen of 0.10 km-218 km. Average area traversed/hen over the 10 week
post-release period was 1944 km2 ± 3227 km2 (SD) (range 10-14,915 km2). On average hens
moved 11 km ±10 km (SD) (range 0.60-93 km) from the release sites during the 10 week post-
release period.
Variation in movement rates was best explained by nesting status (difference in residual
deviances = 424, p < 0.0001, df = 6) with non-nesting hens having significantly greater

40
movement rates than nesting hens. All hens had large movement rates in the first 2 post-release
weeks (Figure 2.3). Movement rates of nesting hens were as large as 1382 m/hr in week 1
(median = 367 m/hr) and 929 m/hr in week 2 (median = 228 m/hr; Figure 2.3). Movement rates
of non-nesting hens were as large as 1180 m/hr in week 1 (median = 462 m/hr) and 1149 m/hr in
week 2 (median = 400 m/hr; Figure 2.3). Movement rates of nesting hens then decreased in week
3 (median = 28 m/hr, max = 111 m/hr; Figure 2.2 and Figure 2.3). The movement rates of non-
nesting hens did not decrease to the same level as nesting hens until week 9 (median = 54 m/hr,
max = 188 m/hr; Figure 2.2 and Figure 2.3). Movement rates of non-nesting hens appeared to
decrease more continuously than for nesting hens whose movements fluctuated throughout the
post-release period (Figure 2.3).
During the 2011 and 2012 translocations, 7 transmitters did not activate (Table 2.1). Of
the 29 hens with active transmitters, 15 mortalities were confirmed (Table 2.1). After the 2011
translocation, the transmitters of 8 hens were actively transmitting post-release, 2 of those hens
died and 5 were designated as unconfirmed mortalities by April 2012 (Table 2.1). Following the
2012 translocation, 23 sage-grouse actively transmitted GPS signals (including 2 hens from the
2011 translocation), 7 of these died and 4 likely died by the end of April 2013 (Table 2.1).
Of the 15 confirmed hen mortalities, 1 sage-grouse was killed after striking the guy wire
of a communications tower, 67% (10/15) were likely killed by Great Horned Owls (Bubo
virginianus) (G. Court, personal communication) and 20% (3/15) were likely killed by
mammalian predators. The predator of the remaining hen could not be confirmed because only a
few secondary feathers of the sage-grouse were found at the location of the carcass.

41
Figure 2.2. Average movement rates (m/hr) of translocated sage-grouse hens that initiated nests
(top) or did not initiate nests (bottom) from 6-10 April 2012 to 11-15 September 11-15 2012 in
southeast Alberta. Sample sizes given on the left side of the figure represent the number of hens
at the beginning of the post-release period, and sample sizes given on the right side represent the
number of hens at the end of the summer.

42
Figure 2.3. Average movement rates (m/hr) of post-release translocated sage-grouse nesting
hens and non-nesting hens from 6-10 April 2012 to 11-15 September 11-15 2012. Sample sizes
were 11 nesting hens and 9 non-nesting hens at the beginning of the post-release period, and 7
nesting and 6 non-nesting hens at the end of the summer.

43
Table 2.1. Status and fate of translocated sage-grouse hens at the beginning and end of each year
(end of the year in parentheses) from 2011-2015 in southeast Alberta. The start of each year was
considered April 1st to coincide with the releases and represents one full post-release year.
1 Two hens from the 2011 translocation were actively transmitting in 2012 (1 confirmed mortality and 1 unconfirmed mortality
the same year).
2 First apparent survival estimate includes confirmed and unconfirmed mortalities (minimum apparent survival estimate), second
estimate includes only confirmed mortalities (maximum apparent survival estimate).
2.3.3 Nest Initiation and Success
From 2011-2014, 22 nests were initiated by translocated hens (Table 2.2). Of the total
nests initiated, 20 were first nesting attempts and 2 were re-nesting attempts (Table 2.2). Overall
nest initiation was 53% (20 first nesting attempts/38 actively transmitting hens between years;
Table 2.2). Nest initiation was similar in 2011 and 2012 (50%) and 2013 and 2014 (58%; Table
2.3). Overall nest success was 29% (Table 2.2). Five of the successful nests were first nesting-
attempts and 1 successful nest was a re-nest in 2014 (Table 2.2). The majority of nest failures
(n=15) were a result of predation (93%) and 53% of nest failures occurred between day 8 and 21
of incubation (Figure 2.4). Three nests were predated during egg laying; 1 nest during the first
week of incubation, and 3 nests during the last week of incubation.
Although close to the null model, distance to trees, power lines, settlements and
sagebrush cover were the best predictors of a nest hatching ≥ 1 egg (Table 2.3). When the worst
fitting model was removed, the AIC dropped such that the best model explaining variation in
2011 - 2012 9 (8) 8 2 5 13%, 75%2012 - 2013 27 (21) 23 7 4 52%, 70%2013 - 2014 - 12 5 3 33%, 67%2014 - 2015 - 4 1 2 25%, 75%
Year (April as Start and End of Each Year)
Number of Hens with Transmitters
(Activated)
Number of Hens Transmitting at Start of Year 1
Number of Confirmed Mortalities by End of
Year 1Hen Survival 2
Number of Unconfirmed Mortalities by End of
Year 1

44
hatching success of these models is distance to trees (Table 2.3). All other models performed
worse than the null model. The closer a nest was to trees, power lines and settlements, the higher
the probability of hatching (Table 2.3). The greater the amount of sagebrush cover a nest was
located in, the higher the probability of the nest succeeding (Table 2.3). However, these effects
were weak and highly variable since they were approximately 2 units or less than the null model
and 85% confidence intervals barely excluded 0 (Table 2.3).
Table 2.2. The number of GPS-equipped translocated sage-grouse hens, during 2011-2014 that
had first nesting attempts, successful nests and re-nests.
1The eggs from one nest was taken for the Calgary Zoo captive breeding program and is not included in nest success calculations. The hen did re-nest successfully in the wild.
Figure 2.4. Timing of nest failure for 15 nests initiated in southeastern Alberta, 2011-2014.
Percentage of nest failures within each of the 4 categories is calculated based on the total number
of nests initiated.
2011 4 2 (50%) 1 (50%) 0 (0%)2012 22 11 (50%) 1 (9%) 0 (0%)2013 9 4 (44%) 2 (50%) 0 (0%)2014 3 3 (100%)1 1 (33%) 2 (67%)1
Number of GPS-Equipped Hens
First Nesting Attempts (% of Actively Transmitting Hens)
Successful Nests (% of Total First Nesting Attempts)
Re-Nests (% of Total Unsuccessful Nests)
Year
05
101520
1 - 7 8 - 14 15 - 21 22 - 28
Nes
ts Lo
st (%
)
Days After Initation of Incubation

45
Table 2.3. Model selection results from the logistic regression analysis of the probability of
translocated sage-grouse hatching at least one egg as a function of distance to the nearest tree,
power line, settlement and by sagebrush cover from 2011-2014. AICc is Akaike’s Information
Criteria corrected for small sample size and ΔAICc is the difference in AICc from the top model,
AICc Weight is the Akaike weight. Other single variable models [(oil wells, gas wells, fences,
buildings and roads, nest initiation date, body mass and age (yearling or adult)] performed worse
than the null model. The (-) and (+) signs indicate the direction of the effect.
2.4 DISCUSSION
2.4.1 Nesting Ecology
Although some studies show that sage-grouse nests are situated independently of lek
location (Bradbury et al. 1989, Wakkinen et al. 1992), Braun et al. (1977) cite several studies in
which at least 50% of nests were located within 3.2 km of a lek. According to Connelly et al.
(2000) average nest-lek distance varies from 1 to 6 km. Average nest-lek distance in my study
was 5.2 km, with 68% of nests being located within 3.2 km of an active lek. However, the range
Model LogLikelihood K AICc ΔAICc AICc Weight
0.06
Power Lines (-) Sage Brush Cover (+) Trees (-) Settlements
(-)19.255 5 33.3 7.6 0.01
Power Lines (-) Sage Brush Cover (+) Trees (-) 19.389 4 29.9 4.3
0.22
Null 25.127 1 27.3 1.7 0.21
Power Lines (-) Trees (-) 19.824 3 27.2 1.6
0.50Trees (-) 20.962 2 25.6 0

46
varied, with 7 nests located 5-22 km from an active lek. In southeast Alberta, Aldridge (2000)
found a comparable average nest-lek distance of 4.7 km (range 0.42-15km), with only 41% of
nests located within 3.2 km of lek, suggesting that some individuals searched greater distances
for suitable nesting habitat. Autenrieth (1981) suggested that nest-lek distance may also be
inversely correlated with habitat quality, which supports the notion that females must move large
distances to find suitable nesting habitat in southeast Alberta (Aldridge 2000).
Anthropogenic disturbance around leks can increase nest-lek distance and influence nest
initiation rates. Lyon and Anderson (2003) found that mean distance from disturbed leks (<3 km
of natural gas development) to nest sites was greater than distance from undisturbed leks (<3 km
from gas development but isolated from potential disturbance factors by topographic features).
Using the same definition of a disturbed lek, 2/4 active leks in southeast Alberta would be
considered disturbed. Eight nests were located within 3 km of the disturbed lek, 4 of which were
successful (50%) and 7 nests were located within 3 km of the undisturbed lek, 2 of which were
successful (29%). While nest-lek distance may influence the number of hens that initiate nests, it
does not necessarily correlate with nest success. Holloran and Anderson (2005) found that
although the majority of nests were located within 5 km of leks, nest-lek distance and nest
success probabilities were not related. Survival of nests located further from leks may be
influenced by other factors such as weather, climate, the previous year’s productivity, and
harvesting demographics (Moynahan 2004).
Initiation of incubation ranges from late March to mid-May across the sage-grouse
range (Schroeder 1997). The average incubation start date in my study was 11 May. Aldridge
(2000) recorded an average incubation start date of 10 May for native Alberta sage-grouse hens,
supporting the notion that nesting activities occur later in Canada compared to the rest of the

47
species’ range (Aldridge 2000). Average nesting activity dates may be overestimated for my
study, as 2 of the years were release years in which hens may have taken up to 2 weeks to
“settle” and nest. Average incubation length (27 days) and clutch size (7.6) for my study were
within the typical ranges observed throughout sage-grouse range (25-29 days and 6.6-8.2 eggs;
Schroeder et al. 1999). Initiation of incubation, incubation length and clutch size for translocated
hens are all within the documented ranges across sage-grouse range.
2.4.2 Post-Release Movements and Apparent Hen Survival
Average linear distance travelled/week/hen varied greatly during the 10 week post-
release period in 2012, ranging from 9-270 km. The range in distance travelled is a result of
some hens settling down to nest, while others continued to exhibit large movements. The largest
post-release movements were exhibited by one hen that travelled a total of 1019 km in 8 weeks
post-release and at one point was 104 km from the release site. The majority of hens (76%,
16/21) travelled ≤ 400 km during the same time period. Similar variation in individual responses
to translocation have been documented for numerous species including sage-grouse (Musil et al.
1993), Sharp-tailed Grouse (Coates et al. 2006), Chukar Partridge (Alectoris chukar) (Dickens et
al. 2009), Brown Treecreeper (Climacteris picumnus) (Bennett et al. 2012) and Tuamotu
kingfishers (Todiramphus gambieri gertrudae) (Kesler et al. 2012) and is likely a result of
individual differences in behaviour (exploration, boldness, shyness, activity, etc.; Dingemanse et
al. 2003; Bremner-Harrison et al. 2004; McDougall et al. 2006; Watters and Meehan 2007). All
hens exhibited some fidelity to the release-site area, even after large, post-release exploratory
movements. Translocated hens demonstrated fidelity to leks, nesting areas and wintering ranges

48
over the annual cycle and translocated hens were observed flocking with resident hens (T.
Whiklo, personal communication).
Non-nesting hens had significantly greater movement rates than nesting hens. Both
nesting and non-nesting hens had large movement rates in the first 2 weeks post-release, but the
movement rates of nesting hens decreased in week 3, corresponding with nest initiation. Even
after 10 weeks post-release, average distance travelled and movement rates far exceeded post-
release movements recorded in other grouse translocations. Baxter et al. (2008) found an average
linear distance travelled for adult and yearling translocated hens during their first year to be 9.7
km and 13.7, respectively. Musil et al. (1993) recorded translocated hens an average of 5.3 km
from the release site, with a maximum movement of 37 km, and an average home range of nearly
6 km2. Kemink and Kesler (2013) found a median movement rate of approximately 900 m/week
during the first 2 weeks post-release, and approximately 200 m/week after week 9 for
translocated Greater Prairie-chickens (Tympanuchus cupido). Explanations for large post-release
movements include exploring for appropriate habitats and resources, stress, and attempts to
navigate back to the capture site (Kemink 2012). Sage-grouse range in southeast Alberta is
highly fragmented and contains less sagebrush cover compared to the area where the sage-grouse
were captured, possibly inducing stress and the incentive to search for higher quality habitat.
Female grouse are known to make large movements in search of mates or nesting sites
during the breeding season (Gratson 1988; Svedarsky 1988; Small, Holzwart & Rusch, 1993;
Martin et al. 2000) and this may have also contributed to the large post-release movements I
recorded. Hens that were inseminated when captured may have settled down and nested sooner.
If they were not inseminated prior to capture, the stress of being in a new area may have forced
some females to search a larger area for a mate, possibly missing the chance to nest. Another

49
possible explanation for the large post-release movements is natal habitat preference induction;
when dispersers traverse and relocate to areas with habitat similar to natal ranges (Davis and
Stamps 2004; Davis 2008). Other individuals are more likely to accept the conditions at the
release site but might still make smaller movements in an attempt to avoid an area they associate
with a threatening experience such as handling and release (Stamps and Swaisgood 2007).
However, sage-grouse were translocated >300 km and large translocation distances typically
reduce the impetus to home (Vuren et al. 1997; Moehrenschlager and Macdonald 2003).
Managers could mitigate the effects of post-release movements by undertaking certain
techniques during translocations such as a soft release, where individuals are confined for a
certain amount of time at the release site in a predator-proof enclosure and provided with food
and water (Scott and Carpenter 1987). Soft releases have been shown to decrease post-release
dispersal and increase site fidelity and post-release survival (Switzer 1993; Bright and Morris
1994; Attum et al. 2013).
Apparent annual hen survival averaged between 31-72% across the study period, but this
estimate should be interpreted cautiously, as the sample size was small and the number of
confirmed mortalities is likely underestimated (i.e. mortalities are likely to have occurred among
the birds for which I could not confirm death). Annual sage-grouse survival ranges from 25-96%,
depending on location and method of assessment, with most estimates ranging between 30-75%
(Schroeder et al. 1999; Zablan et al. 2003; Connelly et al. 2000; Anthony and Willis 2009;
Sedinger et al. 2011). Of the confirmed mortalities in 2011 and 2012, 78% (7/9) occurred within
16 weeks of release. Musil et al. (1993) also reported low short-term survival for sage-grouse
that were translocated into a nearly extirpated population in Idaho, with 79% (19/24) of deaths
occurring within 3 weeks post-release and low survival to 22 weeks post-release. Large

50
movement rates and increasing distance from release sites have been linked to low survival in
translocations (Kurzejeski and Root 1988; Coates et al. 2006; Spinola et al. 2008) as a result of
increased risk of mortality through collision with fences (Wolfe et al. 2007) and increased
exposure to predators (Yoder 2004). Despite this, survival is one of the most important factors
associated with population persistence and is crucial to translocation success (Johnson and Braun
1999; De Leo et al. 2004). Variation in annual survival rates may be due to variation in predator
densities, predator control during translocation years, site-specific differences in habitat quality
and food sources, weather or unknown reasons (Baxter et al. 2013).
2.4.3 Nest Initiation and Success
Translocated hens had slightly lower nest initiation rates (50%) than post-translocated
hens (one year after release; 58%). The overall nest initiation rate in my study (53%) is low
compared to nest initiation rates across the sage-grouse range, which for resident hens typically
ranges from 55-100% (Connelly et al. 1993; Gregg et al. 1994; Schroeder 1997; Aldridge 2000).
Baxter et al. (2008) reported a low nest initiation rate of 39% during the first year of
translocation Utah, but nest initiation increased to 73% for post-translocated hens. Possible
reasons for the low frequency of nest initiation by translocated hens include the stress associated
with translocation, the timing of capture relative to the start of the nesting season, body
condition, whether the hen had initiated a nest prior to capture, their lack of knowledge of the
release site and weather conditions on the day of release (Musil et al. 1993, Davis 1995, Baxter
et al. 2008). The 2011 translocation occurred 2 weeks later than planned because of poor weather
and there was still snow present in southeast Alberta at the time of release, possibly reducing
nest initiation frequency. Large movements and high frequency of movements during the post-

51
release exploratory phase may also reduce or eliminate the time allocated to nesting (Le Gouar et
al. 2012) and as such, the exploratory phase is often associated with low reproductive success
(Kurzejeski and Root 1988; Moehrenschlager and Macdonald 2003; Letty et al. 2005).
Overall nest success for translocated hens was also low (29%) in comparison to other
resident and translocated populations across sage-grouse range and is likely an impediment to
increasing the population in Alberta. Sage-grouse nest success ranges from 15-86% with stable
populations having higher nest success than declining populations (Schroeder et al. 1999) and
mean nest success is estimated to be 47% (Crawford et al. 2004). One of the only other studies
that have reported nest success ≤ 30% for sage grouse is in a highly fragmented area of
Wyoming that is experiencing population declines largely due to rapid oil and gas development
(Webb et al. 2012). Nest success in Alberta ranged from 46% in 1998-1999 (Aldridge 2000) to
35% from 2001-2003 (Aldridge 2005). Reduced nest success is often related to sage-grouse
population declines (Schroeder 1997, Braun 1998, Schroeder et al. 1999) and is associated with
silver sagebrush habitat and fragmented habitats (Aldridge 2000).
Increased predation rates on sage-grouse are commonly a result of poor quality habitat
and altered predator composition (Schroeder and Baydack 2001; Evans 2004; Coates and
Delehanty 2010). Anthropogenic features act as resource subsidies (i.e. food, shelter and nest
substrate) for generalist predators of sage-grouse by promoting survival and reproduction
(Coates 2007; Webb et al. 2012). For example, power lines have been documented to act as
perch sites which enhance raptor and corvid predation efficiency (Prather and Messmer 2010).
Great Horned Owls are considered generalist predators that use existing structures on the
landscape to nest (i.e. old nests of other generalist avian predators or abandoned buildings)
(Zimmerman et al. 1996; Smith et al. 1999). One of the primary nest predators identified in many

52
studies are Common Raven (Corvus corax) (Holloran and Anderson 2003; Manzer and Hannon
2005; Coates et al. 2008). Habitat alterations and anthropogenic subsidies can contribute to
increased densities of common ravens and corresponding declines in sage-grouse reproductive
success (Coates and Delehanty 2010; Bui et al. 2010). Common Raven populations have
increased dramatically on the Canadian prairies in the past 15 years (Government of Canada
2014) and may be having a negative impact on sage-grouse reproductive success.
I did not find a negative impact of the distance to oil and gas wells on nest success. This
is partly because nests were located far away from oil wells (mean=16 km) and gas wells
(mean=5 km). However, it has been well demonstrated that infrastructure associated with oil and
gas activities has negative impacts on grouse nest-site selection, nest success and chick and
yearling survival (Holloran et al. 2005; Pitman et al. 2005; Aldridge and Boyce 2007; Holloran
et al. 2010; Dzialak et al. 2011). Although the results were weak, I found that nests closer to
power lines, trees and settlements had a higher chance of successfully hatching than nests farther
away. Furthermore, probability of hatching tended to be greater in areas with increased
sagebrush cover. Although small sample sizes may partly explain the weak correlations I found,
hens are known to select nesting habitat with greater and taller sagebrush canopy cover relative
to available habitats (Wallestad and Pyrah 1974; Sveum et al. 1998; Aldridge and Brigham 2002)
and nest success has been positively correlated with increased canopy cover and taller grasses
(Wallestad and Pyrah 1974; Connelly et al. 1991; Gregg et al. 1994). In Alberta, sagebrush
cover used for nesting is limited (5-10%) compared to areas with big sagebrush (15-38%)
(Schroeder et al. 1999; Connelly et al. 2000; Aldridge and Brigham 2002; Connelly et al. 2004).
Hens may recognize the importance of canopy cover and select for additional cover provided by
other shrubs at the nest site itself (Aldridge 2005). Beyond the nest site, where additional shrub

53
cover also reduces the risk of failure, females may not be as capable at recognizing cues at these
scales, possibly creating ecological traps (Donovan and Thompson 2001; Aldridge 2005). Birds
may fail to recognize these ecological traps when the human-altered landscape differed from that
in which the birds evolved (Bock and Jones 2004).
2.5 SUMMARY AND CONCLUSIONS
Translocations can effectively increase population size and boost reproductive output for
small or declining sage-grouse populations (Reese and Connelly 1997). Translocations have
become more successful, better documented, and have become an important management
strategy in small and declining populations in recent years (Bell 2011; Gruber 2012; Baxter et al.
2013). Reese and Connelly (1997) suggested that the success of sage-grouse translocations
should be based on six factors: fidelity to the release area, compatibility of courtship behavior,
integration into the native population, survival, reproductive success and contribution to
population growth. These are measures that have been assessed and can be used to determine if
the Montana-Alberta translocation can be considered a success.
During the 2011-2012 Montana-Alberta translocation, I documented some of the largest
post-release movement distances, rates and areas ever recorded for grouse after being
translocated. Average weekly linear distance travelled was 56 km, average area traversed was
1944 km2 and average distance from release site was 11 km. In 2012, non-nesting hens had
significantly higher movement rates than nesting hens. Movement rates of nesting hens
decreased in week 3, corresponding with nest initiation, and movement rates of non-nesting hens
did not decrease until week 9. Multiple translocated hens were observed flying directly onto leks
upon release and the hens attended active leks in post-release years, suggesting compatibility of

54
courtship behaviour. After extensive post-release movements by almost half of the translocated
hens, hens exhibited year-round fidelity to the release sites and traditional sage-grouse habitat.
Translocated hens were observed flocking with native hens during the winter and brood-rearing
seasons.
Apparent annual hen survival averaged between 31-72% across the study period which
aligns with other reported annual survival estimates for sage-grouse. Of the confirmed
mortalities in release years, 78% occurred within 16 weeks post-release. However, my nest
success and apparent survival estimates should be interpreted cautiously as the sample sizes are
small. Nest initiation (53%) and nest success (29%) were low compared to published data for
both translocated and resident sage-grouse populations. Nest success decreased with increasing
distance from trees, power lines and settlements. Hens did not appear to select nest sites away
from these features, and this could have been driven by the translocated hens being naïve to the
release area and not recognizing certain anthropogenic features as risks. Wildlife managers
should consider translocation strategies aimed at reducing some of the extensive post-release
movements exhibited and increasing nest initiation rates such as capturing later during the
nesting season, artificially inseminating hens prior to release, or conducting a soft release. Some
of these methods, such as artificial insemination, are currently being tested and managers should
communicate and collaborate accordingly. Despite the low nest initiation and nest success, the
population remained steady in 2013 and 2014 and increased by over 100% in 2015, suggesting
that there may have been some recruitment into the population by the translocated sage-grouse,
possibly by hens whose transmitters never activated. Although the application of the measures of
success suggested by Reese and Connelly (1997) to my study should be interpreted cautiously as

55
not all of the factors were quantified, 5/6 of the factors were satisfied and the translocation could
be considered a success.
Protection of sage-grouse nesting habitat within 3.2 km of occupied leks has been a
common management recommendation since the 1970’s (Connelly et al. 2000). Prior to the
Emergency Protection Order issued in 2013 by Environment Canada that places restrictions on
activities on approximately 60% of sage-grouse critical habitat (Environment Canada 2014), this
was also the setback distance for development in Alberta. However, research has suggested that
these recommendations offer limited or unsubstantiated protection to nesting areas (Schroeder et
al. 1999; Aldridge and Brigham 2001) because females may select nest sites independent of lek
location (Bradbury et al. 1989; Wakkinen et al. 1992). The average nest-lek distance in my
study was 5.2 km, with some translocated hens nesting > 10 km from an active lek, suggesting
that setback distances should be increased. Emphasis should be placed on removal of features
that have the potential to act as resource subsidies for Great Horned Owls and corvids, as those
were the most likely predators of adults and nests. Nests tended to have a higher probability of
success closer to some anthropogenic structures. This could be explained partly by the fact that
nest success also corresponded with increasing sagebrush cover, or maybe some of the features
close to nests were not being used by predators. Managers should increase sagebrush cover
where possible because even small increases in cover (5-10%) could be enough to increase sage-
grouse productivity in Alberta (Aldridge and Brigham 2002).
Suggestions for further research include studying the composition of the predator
communities in southeast Alberta to further strategize the removal of anthropogenic features. In
addition, a nest predation study with remote cameras should be conducted to confirm key nest
predators. More rigorous daily and annual survival analyses should be performed to offer better

56
insight into annual survival trends. If future translocations occur, native hens should also be
fitted with transmitters to compare nest site-selection and nest success. In addition, transmitters
with VHF capability should be considered so that hens can be tracked more easily year-round,
especially during the winter when transmissions from the solar-powered transmitters decreased.
With better year-round GPS data, seasonal survival can be better assessed.

57
2.6 LITERATURE CITED
Alberta Environment and Sustainable Resource Development. 2013. Alberta Greater Sage-grouse Recovery Plan 2013-2018. Alberta Species at Risk Recovery Plan No. 30, Edmonton, Alberta, Canada.
Aldridge, C. L. 2000. Reproduction and habitat use by Sage Grouse (Centrocercus urophasianus) in a northern fringe population. Thesis, University of Regina, Regina, Saskatchewan, Canada.
Aldridge, C. L. 2005. Identifying habitats for the persistence of Greater Sage-Grouse (Centrocercus urophasianus) in Alberta, Canada. Dissertation, University of Alberta, Edmonton, Alberta, Canada.
Aldridge, C. L., and M. S. Boyce. 2007. Linking occurrence and fitness to persistence: habitat-based approach for endangered greater sage-grouse. Ecological Applications 17:508–526.
Aldridge, C. L., and R. M. Brigham. 2001. Nesting and reproductive activities of greater sage-grouse in a declining northern fringe population. The Condor 103:537–543.
Aldridge, C. L., and R. M. Brigham. 2002. Sage-Grouse nesting and brood habitat use in southern Canada. The Journal of Wildlife Management 66:433-444.
Angelstam, P. 1986. Predation on ground-nesting birds’ nests in relation to predator densities and habitat edge. Oikos 47:365-373.
Anthony, R. G., and M. J. Willis. 2009. Survival rates of female Greater Sage-Grouse in autumn and winter in southeast Oregon. Journal of Wildlife Management 73:538–545.
Arnold, T. W. 2010. Uninformative parameters and model selection using Akaike’s Information Criterion. Journal of Wildlife Management 74:1175–1178.
Attum, O., C. D. Cutshall, K. Eberly, H. Day, and B. Tietjen. 2013. Is there really no place like home? Movement, site fidelity, and survival probability of translocated and resident turtles. Biodiversity and Conservation 22:3185–3195.
Autenrieth, R. E. 1981. Sage grouse management in Idaho. Idaho Department of Fish and Game, Boise, Idaho, USA.
Baker, M. F., R. L. Eng, J. S. Gashwiler, M. H. Schroeder, and C. E. Braun. 1976. Conservation committee report on effects of alteration of sagebrush communities on the associated avifauna. The Wilson Bulletin 165–171.
Balderson, K. L., D. H. Eslinger, and J. T. Nicholson. 2013. Greater Sage-Grouse (Centrocercus urophasianus) Monitoring in Southeast Alberta: 1968-2012. Alberta Species at Risk Report 147, Alberta Environment and Sustainable Resource Development, Fish and Wildlife Division. Edmonton, Alberta, Canada.
Baxter, R. J., J. T. Flinders, and D. L. Mitchell. 2008. Survival, movements, and reproduction of translocated Greater Sage-Grouse in Strawberry Valley, Utah. Journal of Wildlife Management 72:179–186.
Baxter, R. J., R. T. Larsen, and J. T. Flinders. 2013. Survival of resident and translocated greater sage-grouse in Strawberry Valley, Utah: A 13-year study. The Journal of Wildlife Management 77:802–811.

58
Bell, C. B. 2011. Nest site characteristics and nest success of translocated and resident greater sage grouse at Clear Lake National Wildlife Refuge. Thesis, Humboldt State University, Arcata, California, USA.
Bennett, V. A., V. A. J. Doerr, E. D. Doerr, A. D. Manning, D. B. Lindenmayer, and H.-J. Yoon. 2012. Habitat selection and post-release movement of reintroduced Brown Treecreeper individuals in restored temperate woodland. PLoS ONE 7:e50612.
Bock, C. E., and Z. F. Jones. 2004. Avian habitat evaluation: should counting birds count? Frontiers in Ecology and the Environment 2:403–410.
Bradbury, J. W., R. M. Gibson, C. McCarthy, and S. L. Vehrencamp. 1989. Dispersion of displaying male sage grouse. II. The role of female dispersion. Behavioral Ecology and Sociobiology 24:15–24.
Braun, C. E. 1998. Sage grouse declines in western North America: what are the problems? Pages 139–156 in Proceedings of the Western Association of State Fish and Wildlife Agencies. Volume 78.
Braun, C. E., T. E. Britt, and R. O. Wallestad. 1977. Guidelines for maintenance of sage grouse habitats. Wildlife Society Bulletin 5:99–106.
Braun, C., O. Oedekoven, and C. L. Aldridge. 2002. Oil and gas development in western North America: effects on sagebrush steppe avifauna with particular emphasis on sage grouse. Pages 337–349 in. Transactions of the North American Wildlife and Natural Resources Conference. Volume 67. <http://www.oilandgasbmps.org/docs/GEN094.pdf>. Accessed 11 Apr 2015.
Bremner-Harrison, S., P. A. Prodohl, and R. W. Elwood. 2004. Behavioural trait assessment as a release criterion: boldness predicts early death in a reintroduction programme of captive-bred swift fox (Vulpes velox). Animal Conservation 7:313–320.
Brichieri-Colombi, T.A., and A. Moehrenschlager. 2016. Alignment of threat, effort, and perceived success in North American conservation translocations. Conservation Biology 0:1-14.
Bright, P., and P. Morris. 1994. Animal translocation for conservation: performance of dormice in relation to release methods, origin and season. Journal of Applied Ecology 31:699–708.
Brown, D. G., K. M. Johnson, T. R. Loveland, and D. M. Theobald. 2005. Rural land-use trends in the conterminous United States, 1950-2000. Ecological Applications 15:1851–1863.
Bui, T.-V. D., J. M. Marzluff, and B. Bedrosian. 2010. Common Raven activity in relation to land use in western Wyoming: Implications for Greater Sage-Grouse reproductive success. The Condor 112:65–78.
Burnham, K. P., and D. R. Anderson. 2000. Model selection and multi-model inference: A practical information-theoretic approach. Springer-Verlag, New York, New York, USA.
Calenge, C. 2006. The package adehabitat for the R software: a tool for the analysis of space and habitat use by animals. Ecological Modelling 197:516–519.
Carpenter, J., C. Aldridge, and M. S. Boyce. 2010. Sage-Grouse habitat selection during winter in Alberta. Journal of Wildlife Management 74:1806–1814.
Coates, P. S. 2007. Greater Sage-Grouse (Centrocercus urophasianus) nest predation and incubation behavior. Dissertation, Idaho State University, Pocatello, Idaho, USA.
Coates, P. S., J. W. Connelly, and D. J. Delehanty. 2008. Predators of Greater Sage-Grouse nests identified by video monitoring. Journal of Field Ornithology 79:421–428.

59
Coates, P. S., and D. J. Delehanty. 2006. Effect of capture date on nest-attempt rate of translocated sharp-tailed grouse Tympanuchus phasianellus. Wildlife Biology 12:277–283.
Coates, P. S., and D. J. Delehanty. 2010. Nest predation of greater Sage-Grouse in relation to microhabitat factors and predators. Journal of Wildlife Management 74:240–248.
Coates, P. S., S. J. Stiver, and D. J. Delehanty. 2006. Using Sharp-Tailed Grouse movement patterns to guide release-site selection. Wildlife Society Bulletin 34:1376–1382.
Connelly, J., M. A. Schroeder, A. R. Sands, and C. E. Braun. 2000. Guidelines to manage Sage Grouse populations and their habitats. Wildlife Society Bulletin 28:967–985.
Connelly, J. W., R. A. Fischer, A. D. Apa, K. P. Reese, and W. L. Wakkinen. 1993. Renesting by Sage Grouse in southeast Idaho. The Condor 95:1041–1043.
Connelly, J. W., S. T. Knick, M. A. Schroeder, and S. J. Stiver. 2004. Conservation assessment of the greater sage-grouse and sagebrush habitats. Western Association of Fish and Wildlife Agencies, Cheyenne, Wyoming, USA.
Connelly, J. W., K. P. Reese, W. L. Wakkinen, M. D. Robertson, and R. A. Fischer. 1994. Sage grouse ecology report. Idaho Department of Fish and Game, Boise, Idaho, USA.
Connelly, J. W., W. L. Wakkinen, A. D. Apa, and K. P. Reese. 1991. Sage Grouse use of nest sites in southeast Idaho. The Journal of Wildlife Management 55:521-524.
Crawford, J. A., R. A. Olson, N. E. West, J. C. Mosley, M. A. Schroeder, T. D. Whitson, R. F. Miller, M. A. Gregg, and C. S. Boyd. 2004. Ecology and management of Sage-Grouse and Sage-Grouse habitat. Journal of Range Management 57:2-19.
Davis, J. M. 2008. Patterns of variation in the influence of natal experience on habitat choice. The Quarterly Review of Biology 83:363–380.
Davis, J. M., and J. A. Stamps. 2004. The effect of natal experience on habitat preferences. Trends in Ecology & Evolution 19:411–416.
De Leo, G. A., S. Focardi, M. Gatto, and I. M. Cattadori. 2004. The decline of the grey partridge in Europe: comparing demographies in traditional and modern agricultural landscapes. Ecological Modelling 177:313–335.
Dickens, M. J., D. J. Delehanty, and L. M. Romero. 2009. Stress and translocation: alterations in the stress physiology of translocated birds. Proceedings of the Royal Society B: Biological Sciences 276:2051–2056.
Dingemanse, N. J., C. Both, A. J. Van Noordwijk, A. L. Rutten, and P. J. Drent. 2003. Natal dispersal and personalities in great tits (Parus major). Proceedings of the Royal Society of London B: Biological Sciences 270:741–747.
Dinkins, J. B., M. R. Conover, C. P. Kirol, and J. L. Beck. 2012. Greater Sage-Grouse (Centrocercus urophasianus) select nest sites and brood sites away from avian predators. The Auk 129:600–610.
Doherty, K. E., D. E. Naugle, B. L. Walker, and J. M. Graham. 2008. Greater Sage-Grouse winter habitat selection and energy development. Journal of Wildlife Management 72:187–195.
Donovan, T. M., and F. R. Thompson. 2001. Modeling The Ecological Trap Hypothesis: A Habitat and Demographic Analysis for Migrant Songbirds. Ecological Applications 11:871-882.
Dzialak, M. R., C. V. Olson, S. M. Harju, S. L. Webb, J. P. Mudd, J. B. Winstead, and L. D. Hayden-Wing. 2011. Identifying and prioritizing Greater Sage-Grouse nesting and brood-rearing habitat for conservation in human-modified landscapes. PLoS ONE 6:e26273.

60
Eng, R.L. 1955. A method for obtaining sage grouse age and sex ratios from wings. The Journal of Wildlife Management 19:267-272.
ESRI ArcGIS Desktop. 2012. Environmental Systems Research Institute, Redlands, California, USA.
Evans, K. L. 2004. The potential for interactions between predation and habitat change to cause population declines of farmland birds. Ibis 146:1–13.
Fischer, J., and D. B. Lindenmayer. 2000. An assessment of the published results of animal relocations. Biological Conservation 96:1–11.
Gehrt, H. D. 2004. Ecology and management of Striped Skunks, Raccoons and Coyotes in urban landscapes. Pages 81–104 in Fascione, N., A. Delach, and M.E. Smith, editors. People and Predators: From Conflict to Coexistence. Island Press, Washington, DC, USA.
Gillan, J. K., E. K. Strand, J. W. Karl, K. P. Reese, and T. Laninga. 2013. Using spatial statistics and point-pattern simulations to assess the spatial dependency between greater sage-grouse and anthropogenic features. Wildlife Society Bulletin 37:301–310.
Government of Alberta. 2009. Draft land use standards to achieve Sage Grouse recovery and conservation (new developments). Fish and Wildlife Division, Alberta Sustainable Resource Development., Edmonton, Alberta, Canada.
Government of Alberta. 2010. Grassland Vegetation Inventory (GVI) Specifications. 5th Edition, Alberta Sustainable Resource Development, Government of Alberta., Edmonton, Alberta, Canada.
Government of Alberta. 2014. Digital Integrated Disposition Layer. Base Data provided by the Government of Alberta and Alberta Data Partnerships Ltd. under the Alberta Open Government Licence of November 2014.
Government of Canada, E. C. 2014. Breeding Bird Survey Results - Environment Canada. <http://www.ec.gc.ca/ron-bbs/P001/A001/?lang=e>. Accessed 20 Apr 2015.
Gregg, M. A., J. A. Crawford, M. S. Drut, and A. K. DeLong. 1994. Vegetational cover and predation of Sage Grouse nests in Oregon. The Journal of Wildlife Management 58:162-166.
Griffith, B., J. M. Scott, J. W. Carpenter, and C. Reed. 1989. Translocation as a species conservation tool: status and strategy. Science 245:477–480.
Hijmans, R. J. 2014. Raster: raster: Geographic data analysis and modeling. R package version 2.3-12.
Holloran, M. J. 2005. Greater sage-grouse (Centrocercus urophasianus) population response to natural gas field development in western Wyoming. Dissertation, University of Wyoming, Laramie, Wyoming, USA.
Holloran, M. J., and S. H. Anderson. 2003. Direct identification of northern sage-grouse, Centrocercus urophasianus, nest predators using remote sensing cameras. The Canadian Field-Naturalist 117:308–310.
Holloran, M. J., and S. H. Anderson. 2005. Spatial distribution of Greater Sage-Grouse nests in relatively contiguous sagebrush habitats. The Condor 107:742–752.
Holloran, M. J., B. J. Heath, A. G. Lyon, S. J. Slater, J. L. Kuipers, and S. H. Anderson. 2005. Greater sage-grouse nesting habitat selection and success in Wyoming. Journal of Wildlife Management 69:638–649.
Holloran, M. J., R. C. Kaiser, and W. A. Hubert. 2010. Yearling Greater Sage-Grouse response to energy development in Wyoming. Journal of Wildlife Management 74:65–72.

61
IUCN/SSC. 2013. Guidelines for reintroductions and other conservation translocations. Version 1.0. Gland, Switzerland: IUCN Species Survival Commission.
Johnson, C. J., K. L. Parker, D. C. Heard, and M. P. Gillingham. 2002. Movement parameters of ungulates and scale-specific responses to the environment. Journal of Animal Ecology 71:225–235.
Johnson, K. H., and C. E. Braun. 1999. Viability and conservation of an exploited Sage Grouse population. Conservation Biology 13:77–84.
Jones, P. F., R. Penniket, L. Fent, J. Nicholson, and B. Adams. 2005. Silver sagebrush community associations in southeast Alberta, Canada. Rangeland Ecology & Management 58:400–405.
Kemink, K. M. 2012. Survival, habitat use, and movement of resident and translocated greater prairie-chickens. Thesis, University of Missouri, Columbia, Missouri, USA.
Kemink, K. M., and D. C. Kesler. 2013. Using movement ecology to inform translocation efforts: a case study with an endangered lekking bird species: Movement ecology informs translocation efforts. Animal Conservation 16:449–457.
Kesler, D. C., A. S. Cox, G. Albar, A. Gouni, J. Mejeur, and C. Plasse. 2012. Translocation of Tuamotu kingfishers, post-release exploratory behavior and harvest effects on the donor population. Pacific Science 66:467–480.
Kilgo, J. C., H. S. Ray, C. Ruth, and K. V. Miller. 2010. Can Coyotes affect Deer populations in southeast North America? Journal of Wildlife Management 74:929–933.
Knick, S. T., S. E. Hanser, R. F. Miller, D. A. Pyke, M. J. Wisdom, S. P. Finn, E. T. Rinkes, and C. J. Henny. 2011. Ecological influence and pathways of land use in sagebrush. Studies in Avian Biology 38:203–252.
Kurzejeski, E. W., and B. G. Root. 1988. Survival of reintroduced Ruffed Grouse in North Missouri. The Journal of Wildlife Management 52:248-252.
Lariviere, S. 2004. Range Expansion of Raccoons in the Canadian Prairies: Review of Hypotheses. Wildlife Society Bulletin 32:955–963.
Lariviere, S., L. R. Walton, and F. Messier. 1999. Selection of Striped Skunks (Mephitis mephitis) of farmsteads and buildings as denning sites. American Midland Naturalist 142:96–101.
Le Gouar, P., J. B. Mihoub, and F. Sarrazin. 2012. Dispersal and habitat selection: behavioural and spatial constraints for animal translocations in J.G. Ewen, D.P. Armstrong, K.A. Parker, and P.J. Seddon, editors. Reintroduction Biology, Integrating Science and Management. Blackwell Publishing, Oxford, UK.
Letty, J., J. Letty, J. Aubineau, and S. Marchandeau. 2005. Effect of storage conditions on dispersal and short-term survival of translocated wild rabbits Oryctolagus cuniculus. Wildlife Biology 11:249–255.
Linnell, J. D. C., R. Aanes, J. E. Swenson, J. Odden, and M. E. Smith. 1997. Translocation of carnivores as a method for managing problem animals: a review. Biodiversity & Conservation 6:1245–1257.
Lyon, A. G., and S. H. Anderson. 2003. Potential gas development impacts on Sage Grouse nest initiation and movement. Wildlife Society Bulletin 31:486–491.
Manzer, D. L., and S. J. Hannon. 2005. Relating grouse nest success and corvid density to habitat: a multi-scale approach. The Journal of Wildlife Management 69:110–123.

62
Marks, C. A., and T. A. Bloomfield. 2006. Home-range size and selection of natal den and diurnal shelter sites by urban red foxes (Vulpes vulpes) in Melbourne. Wildlife Research 33:339–347.
Mathews, S. R., P. S. Coates, M. L. Casazza, and D. J. Delehanty. 2014. Using artificial insemination to promote fertilization of translocated female Columbian sharp-tailed grouse. 29th Western Agencies Sage and Columbian Sharp-tailed Grouse Workshop. Elko, Nevada, USA.
McDougall, P. T., D. Réale, D. Sol, and S. M. Reader. 2006. Wildlife conservation and animal temperament: causes and consequences of evolutionary change for captive, reintroduced, and wild populations. Animal Conservation 9:39–48.
Merton, D. V., C. Reed, and D. Crouchley. 1999. Recovery strategies and techniques for three free-living, critically-endangered New Zealand birds: kakapo (Strigops habroptilus), black stilit (Himantopus novaezelandiae) and takahe (Porphyrio mantelli). Pages 151–162 in. Linking Zoo and Field Research to Advance Conservation. Cincinnati Zoo, Cincinnati, Ohio, USA.
Miller, R. F., and L. L. Eddleman. 2001. Spatial and temporal changes of sage grouse habitat in the sagebrush biome. Technical Bulletin 151, Oregon State University, Agricultural Experiment Station, Corvallis, Oregon, USA. <http://ir.library.oregonstate.edu/xmlui/handle/1957/20881>. Accessed 18 May 2015.
Miller, R. F., S. T. Knick, D. A. Pyke, C. W. Meinke, S. E. Hanser, M. J. Wisdom, A. L. Hild, S. T. Knick, and J. W. Connelly. 2011. Pages 145-184 in S.T. Knick and J.W. Connelly, editors. Characteristics of sagebrush habitats and limitations to long-term conservation. Greater sage-grouse: ecology and conservation of a landscape species and its habitats. Studies in Avian Biology 38. University of California Press, Berkeley, California, USA.
Moehrenschlager, A., and D. W. Macdonald. 2003. Movement and survival parameters of translocated and resident swift foxes Vulpes velox. Animal Conservation 6:199–206.
Moynahan, B. J. 2004. Landscape-scale factors affecting population dynamics of Greater Sage-Grouse (Centrocercus urophasianus) in north-central Montana. Dissertation, University of Montana, Missoula, Montana, USA.
Moynahan, B. J., M. S. Lindberg, J. J. Rotella, and J. W. Thomas. 2007. Factors affecting nest survival of Greater Sage-Grouse in northcentral Montana. Journal of Wildlife Management 71:1773–1783.
Moynahan, B. J., M. S. Lindberg, and J. W. Thomas. 2006. Factors contributing to process variance in annual survival of female greater sage-grouse in Montana. Ecological Applications 16:1529–1538.
Musil, D. D., J. W. Connelly, and K. P. Reese. 1993. Movements, survival, and reproduction of sage grouse translocated into central Idaho. The Journal of wildlife management 57:85–91.
Musil, D. D., K. P. Reese, and J. W. Connelly. 1994. Nesting and summer habitat use by translocated sage grouse (Centrocercus urophasianus) in central Idaho. Western North American Naturalist 54:228–233.
National Petroleum Council. 2007. Facing the hard truths about energy: a comprehensive view to 2030 of global oil and natural gas. <http://www.npchardtruthsreport.org>. Accessed 15 June 2015.
Natural Regions Committee. 2006. Natural Regions and Subregions of Alberta. Natural Regions Committee, Edmonton, Alberta, Canada.

63
Naugle, D. E., K. E. Doherty, B. L. Walker, M. J. Holloran, and H. E. Copeland. 2011. Energy development and greater sage-grouse. Pages 489-503 in S.T. Knick and J.W. Connelly, editors. Ecology and Conservation of Greater Sage Grouse: a Landscape Species and its Habitats. Studies in Avian Biology. Volume 38. University of California Press, Berkeley, California, USA.
Noss, R. E., E. T. LaRoe III, and J. M. Scott. 1995. Endangered ecosystems of the United States: a preliminary assessment of loss and degradation. U.S. Department of the Interior, National Biological Service, Washington, DC, USA.
Odell, E., D. Theoblad, and R. Knight. 2003. Incorporating ecology into land use planning: the songbirds’ case for clustered development. Journal of the American Planning Association. 69:72–82.
Patterson, R. L. 1952. The Sage Grouse in Wyoming. Sage Books, Denver, Colorado, USA. Pitman, J. C., C. A. Hagen, R. J. Robel, T. M. Loughin, and R. D. Applegate. 2005. Location and
success of lesser prairie-chicken nests in relation to vegetation and human disturbance. Journal of Wildlife Management 69:1259–1269.
Popham, G. P., and R. J. Gutiérrez. 2003. Greater sage-grouse Centrocercus urophasianus nesting success and habitat use in northeastern California. Wildlife Biology 9:327–334.
Prather, P. R., and T. A. Messmer. 2010. Raptor and corvid response to power distribution line perch deterrents in Utah. Journal of Wildlife Management 74:796–800.
Pyle, P. 1997. Identification Guide to North American Birds, Part 1. Slate Creek Press, Bolinas, California. 732 pp.
R Development Core Team. 2015. R: a language and environment for statistical computing. R Foundation for Statistical Computing, Vienna, Austria. <www.R-project.org>.
Read, M. A., G. C. Grigg, S. R. Irwin, D. Shanahan, and C. E. Franklin. 2007. Satellite tracking reveals long distance coastal travel and homing by translocated estuarine Crocodiles, Crocodylus porosus. PLoS ONE 2:e949.
Reese, K. P., and J. W. Connelly. 1997. Translocations of Sage Grouse Centrocercus urophasianus in North America. Wildlife Biology 3:235–241.
Santana, E. M. 2010. Food habits and anthropogenic supplementation in the diet of Coyotes (Canis latrans) along an urban-rural gradient. Thesis, Auburn University, Auburn, Alabama, USA.
SAS Institute Inc. 2010. SAS Institute, Cary, North Carolina, USA. Sauer, J. R., J. E. Hines, and J. Fallon. 2008. The North American Breeding Bird Survey, Results
and Analysis 1966 - 2007. Laurel, Maryland, USA. Schroeder, M. A. 1997. Unusually high reproductive effort by Sage Grouse in a fragmented
habitat in north-central Washington. The Condor 99:933-941. Schroeder, M. A., C. L. Aldridge, A. D. Apa, J. R. Bohne, C. E. Braun, S. D. Bunnell, J. W.
Connelly, P. A. Deibert, S. C. Gardner, M. A. Hilliard, G. D. Kobriger, S. M. McAdam, C. W. McCarthy, J. J. McCarthy, L. Mitchell, E. V. Rickerson, and S. J. Stiver. 2004. Distribution of Sage-Grouse in North America. The Condor 106:363–376.
Schroeder, M. A., and R. K. Baydack. 2001. Predation and the management of prairie grouse. Wildlife Society Bulletin 29:24–32.
Scott, J. M., and J. W. Carpenter. 1987. Release of captive-reared or translocated endangered birds: what do we need to know? The Auk 104:544–545.
Sedinger, B. S., J. S. Sedinger, S. Espinosa, M. T. Atamian, and E. J. Blomberg. 2011. Spatial-temporal variation in survival of harvested Greater Sage-grouse. Pages 317-328 in

64
Sandercock, B.K., K. Martin, and G. Segelbacher, editors. Studies in Avian Biology No. 39., University of California Press, Berkeley, California, USA.
Smith, D. G., T. Bosakowski, and A. Devine. 1999. Nest Site Selection by Urban and Rural Great Horned Owls in the Northeast. Journal of Field Ornithology 70:535–542.
Spinola, R. M., T. L. Serfass, and R. P. Brooks. 2008. Survival and post-release movements of river otters translocated to western New York. Northeastern Naturalist 15:13–24.
Stamps, J. A., and R. R. Swaisgood. 2007. Someplace like home: Experience, habitat selection and conservation biology. Applied Animal Behaviour Science 102:392–409.
Stephens, S. 2004. Effects of habitat fragmentation on avian nesting success: a review of the evidence at multiple spatial scales. Biological Conservation 115:101–110.
Sveum, C. M., W. D. Edge, and J. A. Crawford. 1998. Nesting habitat selection by Sage Grouse in south-central Washington. Journal of Range Management 51:265-269.
Switzer, P. V. 1993. Site fidelity in predictable and unpredictable habitats. Evolutionary Ecology 7:533–555.
Tsoar, A., R. Nathan, Y. Bartan, A. Vyssotski, G. Dell’Omo, and N. Ulanovsky. 2011. Large-scale navigational map in a mammal. Proceedings of the National Academy of Sciences 108:E718–E724.
Vuren, D. V., A. J. Kuenzi, I. Loredo, and M. L. Morrison. 1997. Translocation as a nonlethal alternative for managing California Ground Squirrels. The Journal of Wildlife Management 61:351.
Wakkinen, W. L., K. P. Reese, and J. W. Connelly. 1992. Sage Grouse nest locations in relation to leks. The Journal of Wildlife Management 56:381-383.
Wallestad, R. O. 1975. Life history and habitat requirements of Sage Grouse in central Montana. Department of Fish and Game, Helena, Montana, USA.
Wallestad, R., and D. Pyrah. 1974. Movement and nesting of Sage Grouse hens in central Montana. The Journal of Wildlife Management 38:630-633.
Watters, J. V., and C. L. Meehan. 2007. Different strokes: Can managing behavioral types increase post-release success? Applied Animal Behaviour Science 102:364–379.
Webb, S. L., C. V. Olson, M. R. Dzialak, S. M. Harju, J. B. Winstead, and D. Lockman. 2012. Landscape features and weather influence nest survival of a ground-nesting bird of conservation concern, the greater sage-grouse, in human-altered environments. Ecological Processes 1:1–15.
Wickham, H. 2009. GGplot2: elegant graphics for data analysis. Springer New York. Wishart, D. J. 2004. Agriculture. Pages 25–29 in Ed. Wishart, D.J. Lincoln, editors.
Encyclopedia of the Great Plains: A Project of the Center for Great Plains Studies. University of Nebraska Press, Lincoln, Nebraska, USA.
Wolf, C. M., B. Griffith, C. Reed, and S. A. Temple. 1996. Avian and Mammalian Translocations: Update and Reanalysis of 1987 Survey Data. Conservation Biology 10:1142–1154.
Wolfe, D. H., Donald H. Wolfe, Michael A. Patten, Eyal Shochat, and Christin L. Pruett. 2007. Causes and Patterns of Mortality in Lesser Prairie-chickens Tympanuchus pallidicinctus and Implications for Management. Wildlife Biology 13:95–104.
Woods, S. N. 2011. Fast stable restricted maximum likelihood and marginal likelihood estimation of semiparametric generalized linear models. Journal of the Royal Statistical Society (B) 73:3–36.

65
Yoder, J. M. 2004. The cost of dispersal: predation as a function of movement and site familiarity in ruffed grouse. Behavioral Ecology 15:469–476.
Zablan, M. A., C. E. Braun, and G. C. White. 2003. Estimation of Greater Sage-Grouse Survival in North Park, Colorado. The Journal of Wildlife Management 67:144.
Zimmerman, G., P. Stapp, and B. V. Horne. 1996. Seasonal Variation in the Diet of Great Horned Owls (Bubo virginianus) on Shortgrass Prairie. American Midland Naturalist 136:149.

66
3.0 HABITAT SELECTION OF GREATER SAGE-GROUSE TRANSLOCATED INTO
SOUTHEAST ALBERTA
3.1 INTRODUCTION
Sagebrush ecosystems have been dramatically altered since European settlement of the
North American Great Plains began (Vale 2002; Leu and Hanser 2011). Once covering
approximately 60 million ha in western North America, the sagebrush steppe was formerly a
dominant feature of the landscape in 16 U.S. states and 3 Canadian provinces (Miller and
Eddleman 2001; Braun et al. 2002). Few sagebrush landscapes remain intact as a result of habitat
loss, fragmentation and alteration due to agriculture, livestock overgrazing, energy development,
urban and rural sprawl, invasive plant and animal species and altered fire regimes (Noss et al.
1995; Miller and Eddleman 2000; Knick et al. 2003; Connelly et al. 2004; Brown et al. 2005;
Miller et al. 2011). It is estimated that 50–60% of native sagebrush steppe has either exotic
grasses in the understory or has been converted completely to non-native annual grasslands
(West 2000).
Sage-grouse are strongly associated with sagebrush habitats throughout the Great Plains
and intermountain region of western North America (Aldridge 2000). Sage-grouse depend on
sagebrush for food and cover year round and require large, contiguous tracts of sagebrush habitat
for all seasonal requirements including lekking, nesting and summer use (Connelly et al. 2000;
Connelly et al. 2004; Dalke et al. 1963). Historically, sage-grouse occurred in British Columbia,
Alberta, Saskatchewan and at least 16 U.S. states, but have now been extirpated from British
Columbia and 5 states (Braun 1998; Schroeder et al. 1999). The loss of native prairie and
subsequent sagebrush habitat in Canada’s sage-grouse range is particularly severe, where

67
approximately 60-80% of native prairie has been lost in Alberta and Saskatchewan (Samson and
Knopf 1994).
In Alberta, sage-grouse were historically abundant throughout the southeast portion of the
province, occupying as much as 49,000 km2 in the early 1900’s (Aldridge 2000). The current
distribution of sage-grouse has been reduced to 4,000 km2, less than 10% of their historic range
(Braun et al. 2002). This habitat loss is the result of agricultural conversion and ranching
activities. Large scale human immigration began with the arrival of the Canadian Pacific
Railway in 1883 and, between 1901 and 1931, several million hectares of mixed-grass prairie
were either cultivated for cropland or over-grazed by cattle in Alberta (Adams et al. 2004; Lyle
and Taylor 2007; Adams et al. 2013). Remnants of European settlement in southern Alberta
remain in the form of abandoned buildings and farmsteads.
Remaining sage-grouse habitat in Alberta has been further fragmented by oil and gas
development and associated infrastructure such as roads, trails, power lines and pipelines. With
its shale rock geology, southeast Alberta has similar characteristics to the Bakken oilfield that
covers approximately 500,000 km2 in Montana, North Dakota, Manitoba and Saskatchewan. The
Bakken oil formation is the largest onshore sedimentary basin in the United States and one of the
most productive energy reserves in North America (Zander et al. 2011). Records suggest that oil
and gas exploration in Alberta’s sage-grouse range began as early as 1940 (Braun et al. 2002). In
the 1980’s, the discovery of large oil reserves near the town of Manyberries, Alberta which was
in the middle of sage-grouse range, resulted in intensive oil extraction activities in an area known
today as the Manyberries oilfield (Braun et al. 2002).
The cumulative effects of anthropogenic features on the landscape can be described as
having both a physical footprint and an ecological footprint (Leu and Hanser 2011). The physical

68
footprint of an anthropogenic feature is the amount of area occupied by the feature (Leu et al.
2008). In sage-grouse range, examples of physical footprints include land used for agricultural
purposes and urban and rural development. According to Leu et al. (2008), agriculture and
human populated areas are the most common anthropogenic features in the western United
States, covering 12% of the land area. The ecological footprint occurs where the physical
footprint influences broader ecological processes beyond its specific physical location (Leu and
Hanser 2011). For example, in fragmented habitats, anthropogenic features that are beneficial to
predator survival (perching points, nest and den substrate, etc.) can increase the range and
population size of synanthropic predators, such as the Common Raven (Corvus corax). These
supplemented predators can negatively affect sage-grouse populations (Webb et al. 2012; Coates
et al. 2008).
Avoidance of anthropogenic features by sage-grouse is well documented and has been
shown to reduce the amount of habitat available to sage-grouse by a factor larger than just the
physical footprint of the features (Aldridge and Brigham 2003; Holloran 2005; Doherty et al.
2008; Carpenter et al. 2010; Gillan et al. 2013). Sage-grouse avoid oil and gas infrastructure by
up to 1.9 km during winter in Alberta (Carpenter et al. 2010) and avoid buildings by 150-300 m
and power lines by up to 600 m (Gillan et al. 2013). In a synthesis evaluating the impacts of
anthropogenic development on prairie grouse, Hagen (2010) found that the presence of power
lines had the largest measurable effect on displacement by grouse, followed by roads. Sage-
grouse typically only avoid paved highways (Hanser et al. 2011), although the causal factor in
this relationship could be the higher frequency of traffic on paved roads.
Sage-grouse may continue to occupy habitats in developed areas because of site fidelity
or because they represent the only remnants of suitable habitat (Hagen 2010). However, these

69
areas could act as ecological sinks if altered predator communities increase mortality risk
(Holloran 2005; Aldridge and Boyce 2007; Hagen et al. 2009). Habitat sinks may occur when
birds continue to populate an area but do not recognize novel risks in landscapes such as
anthropogenic features (Remeš 2000). Reduced chick survival and annual adult survival have
been documented in sage-grouse occupying areas around energy development sites (Kaiser 2006;
Aldridge and Boyce 2007; Holloran et al. 2010). For example, Holloran et al. (2010) found
decreased rates of nest initiation within 950 m and decreased yearling survival within 1.6 km of a
functioning natural gas well. According to Aldridge and Boyce (2007), there is evidence that the
Manyberries oilfield in Alberta acts as a habitat sink and poses a significant threat to sage-
grouse, with broods being at an increased risk of mortality for each oil well within 1 km due to
increased predation risk. If prairie grouse occupy habitats containing anthropogenic features,
their fitness may be compromised, and their contribution to the longevity of the population is
uncertain (Hagen 2010).
Habitat prioritization for species of conservation concern is an important and urgent
management concern (Fedy et al. 2014). Wisdom et al. (2011) found that areas in which sage-
grouse have been extirpated have 27 times the human density, 3 times more area in agriculture,
were 60% closer to highways and had 25% higher density of roads, in contrast to the current
species range. In Alberta, where one of the most severe sage-grouse population declines has
occurred, the remaining habitat is highly fragmented by agriculture, farmsteads, abandoned
buildings, energy development and associated infrastructure such as power lines and roads. This
presents a challenging scenario for wildlife and land managers in southeast Alberta.
The number of male sage-grouse in Alberta reached a low of 13 males in 2011 and 2012,
down from an estimated 613 males in 1968. As a result of the population decline, during the

70
spring of 2011 and 2012, 41 sage-grouse (38 females and 3 males) were translocated from stable
populations in north-central Montana (Balderson et al. 2013) to active lek sites in southeast
Alberta. The rationale was that population augmentation would act to maintain a population of
sage-grouse on the landscape in Alberta until habitat restoration efforts could be undertaken
(Balderson et al. 2013). As a result of the translocation, ongoing habitat enhancements being
conducted, and environmental factors, the sage-grouse population increased to 35 males in 2015.
Despite the population increase, sage-grouse continue to be at risk of extirpation from Alberta if
habitat enhancements do not continue.
The objectives of my research described in this chapter were to characterize the habitat
translocated sage-grouse selected in relation to anthropogenic and natural features (sagebrush
cover, trees, elevation, slope, oil and gas wells, roads, power lines, buildings and settlements)
and from these results, recommend habitat enhancement activities that should best contribute to
sage-grouse recovery.
3.2 METHODS
3.2.1 Study Area and GPS Data Collection
The study area is the extreme southeast corner of Alberta: township 1, range 1 (49.008°N,
110.08°W) to township 6, range 7 (49.528°N, 110.958°W), west of the 4th meridian (Figure 3.1).
This represents all of the current range of sage-grouse in Alberta and is a total area of 42
townships (roughly 3,900 km2) (Alberta Environment and Sustainable Resource Development
2013). The study area is located within the Dry Mixed Grass Natural Subregion of Alberta,
which has the warmest summers, longest growing season and lowest levels of precipitation of
any Natural Subregion in Alberta (Natural Regions Committee 2006). The dominant soils are

71
Brown Chernozems, but Brown Solonetzic soils are also present where saline and sodic
conditions prevail (Natural Regions Committee 2006). Silver sagebrush is the dominant shrub,
pasture sage (A. frigida) is the dominant forb, and common grasses include blue grama
(Bouteloua gracilis), needle and thread (Heterostipa comata) and June grass (Koeleria
macrantha) (Natural Regions Committee 2006). Grazing and dry-land farming are the main
agricultural activities (Natural Regions Committee 2006). Land-use in the study area includes
recreation, ranching, annual crop production and oil and gas development. This area is
predominately provincial Crown land, managed under long-term grazing leases monitored by
Alberta Environment and Parks staff.
On April 21 and 22, 2011, 9 sage-grouse hens were caught and translocated from stable
populations in north-central Montana to active leks in southeast Alberta. During the spring of
2012, 29 hens and 3 males were translocated between April 3 and April 6. Sage-grouse were
captured at night using spotlights and hand-held nets. In total, 39 out of the 41 translocated sage-
grouse were fitted with solar-powered Global Positioning System (GPS) platform transmitter
terminal (PTT) telemetry units (North Star Science and Technology, King George, VA, USA).
Two hens were not fitted with transmitters due to minor injuries they incurred during capture.
The average time elapsed from when a sage-grouse was captured until it was released was 29
hours and 59 minutes ± 4 hours. The telemetry units were programmed to store up to 4 GPS
waypoints each day approximately every 6 hours.
I assessed summer habitat selection because that is when the transmission of GPS
locations was at its highest. GPS transmissions decreased from early fall to early spring because
of fewer daylight hours. I used hen location data between 1 May and 15 September from 2011-
2014. May 1 was chosen as a start date as it is close to the mean nest initiation date and was

72
therefore considered a good approximation for when post-release movements decreased enough
for some hens to become acclimatized and nest. September 15 was chosen as an end date for
analyses, as the transmission of GPS locations decreased shortly after this date and it is the
beginning of what is defined as the winter season for sage-grouse in Alberta (Government of
Alberta 2009). Location data for nesting hens and brood-rearing hens were excluded from
analyses due to behavioural differences and the small sample size of brood-rearing hens. For all
nesting hens, location data <26 m of the nest location during the incubation period was removed.
For nesting hens with unsuccessful nests, location data was included after the date of nest loss, as
determined by the GPS data. Locations with >6 hours between them were removed as this was
considered missing data with too large of a time gap to predict movements. After these data were
removed, 5567 GPS locations from 21 hens remained (Figure 3.1).
Figure 3.1. Study area, release sites and translocated sage-grouse hen GPS locations from 1 May
to 15 September 2011-2015 in southeast Alberta, townships 1-1 to 6-7 W4M. This represents the
current range of sage-grouse in Alberta, an area of 42 townships or roughly 3,900 km2.

73
3.2.2 Habitat Characteristics and Anthropogenic Features
Terrain
Digital Elevation Model (DEM) spatial data were obtained from Alberta Environment
and Sustainable Resource Development (AESRD). The DEM was developed from the most
recent satellite imagery with 10 m resolution. The DEM was rasterized using maptools (Bivand
and Lewin-Koh 2014), spatstat (Baddeley and Turner 2005) and raster packages (Hijmans 2014)
in R 3.1.2 (R Development Core Team 2009). From the DEM raster, a slope raster was created
using the raster package (Hijmans 2014). Given the size of the study area and the fact that pixels
are square rather than circular, the raster was created using 46 m x 46 m pixels (2116 m2) to
approximately reflect the accuracy of the transmitters (area of 26 m radius circle = 2116m2).
Individual values within each pixel were averaged.
Sagebrush
To assess sagebrush cover, I used data from the sagebrush model created for southeast
Alberta by Jones et al. (2005). Air photo interpretation, in conjunction with on-site data, were
used to spatially define density, distribution and height characteristics using imagery with 5 m
resolution (Jones et al. 2005). Polygons classified as water (lakes, rivers, streams and water
developments) covered 3% of the study area (Jones et al. 2005) and were excluded from
analysis. Sagebrush polygons were converted to a raster layer using the raster package (Hijmans
2014). Sagebrush polygons were rasterized using the same methodology as the terrain layer.
74
Trees and Agriculture
Grassland Vegetation Inventory (GVI) data were also obtained from AESRD. GVI is
comprised of ecological range sites based on soil information for areas with native vegetation
and areas associated with agricultural, industrial, and residential developments (Government of
Alberta 2010). Within the GVI, trees are present as both point features (natural tree distribution)
and linear features (shelterbelts). Point features and line segments in the GVI have an accuracy
of 5 m in 95% of tested locations for upland features (Government of Alberta 2010). Using a
custom-made “create points on lines” tool in ArcGIS 10.1 (ESRI ArcGIS Desktop 2012), I
digitized point features every 10 m on the shelterbelts and combined all tree data. Also within the
GVI, agriculture polygons (including crop and tame pasture) were rasterized using the same
methodology as for the terrain and sagebrush layers.
Oil and Gas Infrastructure
Data about locations and status of oil and gas infrastructure were obtained from the
Alberta Energy Regulator. Active and suspended oil wells were combined, as the same types of
above ground infrastructure (3-5 m high) are typically present for both types of disturbances.
Active wells produce noise, however the active and suspended wells are contained within the
same geographic area so no difference in habitat selection by sage-grouse was assumed to have
occurred. Gas well sites were grouped together with drilled and cased well sites and abandoned
oil and gas well sites, as they are all of lower vertical height (~1.6 m) and produce minimal to no
noise. Abandoned well sites were ground-truthed to determine if any above-ground infrastructure
was present. If above-ground infrastructure was absent, then the site was removed from the data
set (approximately 50% of well sites were removed). If above-ground infrastructure was present,

75
it was categorized as either an active/suspended well site (for higher vertical structures) or a gas
well (for lower vertical structures).
Buildings
I documented abandoned buildings by driving roads and trails and recording the location
of any buildings using a hand held GPS and a range finder. I undertook this survey for
approximately 80% of the Alberta range of sage-grouse. Remaining areas were assessed for
buildings on the landscape using ortho-imagery obtained from the Counties of Forty Mile and
Cypress. Each building was transformed into a point feature in ArcMap 10.1 (ESRI ArcGIS
Desktop 2012). Locations of active homesteads were obtained from county offices. Abandoned
buildings that were in the same yard as an active building were removed from the dataset so as to
not confound the results.
Linear Features
Data on the location of roads and trails were obtained from AESRD as part of the Digital
Integrated Disposition layer (Government of Alberta 2014). Paved and gravel roads were
combined since there are only 2 paved roads within the study area and paved and gravel roads
are likely to have similar low-medium traffic volumes. Two-track trails were kept separate
because of a smaller disturbance size and even lower traffic volumes. I obtained data on the
distribution of fence lines from Alberta Conservation Association (ACA) which collected the
information as part of a project for Pronghorn (Antilocapra americana) conservation (P. Jones,
personal communication). Using satellite imagery, fence lines were digitized into ArcMap. A
portion of the area was ground-truthed for fence lines by ACA and the model was deemed to

76
have 94% accuracy (P. Jones, personal communication). Data on the distribution of power lines
were obtained from Fortis Alberta. One segment of power line owned and operated by private
landowners was digitized into ArcMap (R. Heydlaufe and T. Whiklo, personal communication).
3.2.3 Statistical Analyses
One of the most common methods to quantitatively assess wildlife habitat selection is
through the use of Resource Selection Functions (RSF’s). RSF’s use logistic regression
techniques to compare the environmental conditions at used locations where it is known that the
animal was present with available locations elsewhere in the study area. This is sometimes
referred to as ‘used-available’ data (Manly et al. 2002). New methods that incorporate habitat
selection and animal movements are becoming more common to help address the problems that
arise from estimating resource selection from used-available data. When building RSF’s, non-use
points are often randomly distributed across the study area, which can be misleading if some
random points fall in areas that would never be used by the study species. As well, with coarse
GPS data (i.e. ≤ 4 locations/day) as is the case for this study, there is an increased risk of
designating locations as unused that may have actually been used.
Another type of analysis based on use-availability designs can be derived from a
weighted regression (Lele and Keim 2006) where slope parameters obtained during logistic
regression are similar to those of a weighted distribution approach (Warton and Aarts 2013).
Aarts et al. (2012) demonstrated that the weighted distribution likelihood is identical to a Poisson
point process likelihood, and concluded that an RSF actually models the intensity of observations
rather than a relative probability of use across the landscape. Following from this, available
points should not be viewed as true zeroes, but rather as pseudo-absences used as a

77
computational trick to approximate an integral in the Poisson point process likelihood function
(Warton and Shepherd 2010).
Point process models are becoming a more widely used approach to model location data
with the advantage that they offer a basis for choosing the number and location of pseudo-
absences (Warton and Aarts 2013). I fitted an Inhomogeneous Poisson Point Process (IPPP)
using the mgcv package (Wood 2006, Wood 2011) in R 3.1.2 (R Development Core Team 2009)
to directly model the resource selection decisions that sage-grouse made. A Homogenous
Poisson Point Process assumes constant intensity (or rate of occurrence) across the landscape,
whereas the IPPP allows the intensity surface to vary across the landscape. In other words, how
the expected counts of sage-grouse varied across the study area were modelled based on the
values of the covariates. This allowed me to directly model the resource selection decisions that
sage-grouse made. Only GPS locations with the highest accuracy (<26 m) were included in my
analyses. Three males translocated in 2012 were not included in my analyses due to the small
sample size and the potential for behavioural differences with hens in terms of life cycles and
resource use. For example, when released, males are more likely to remain on the lek, whereas
females may search for nest sites.
The IPPP was fitted as a Generalized Additive Model (GAM) using the mgcv package
(Wood 2006, Wood 2011) in R 3.1.2 (R Development Core Team 2009) following the
methodology of Warton and Aarts (2013) using quadrature points and a pseudo-likelihood trick
described by Baddeley and Turner (2005). A movement model was built because the GPS data
are a time series of spatial locations and not conditionally independent. Movement variables
included in the models were time of day and year, distance from last GPS location, direction of
movement and slope aspect which were modelled as both sin(ϴ) and cos(ϴ) following the

78
methodology of Warton and Aarts (2013). A correlation analysis was performed to ensure that
highly correlated features were not included in the model together. Anthropogenic and natural
features included in the model were oil wells (active and suspended), gas wells (active gas,
abandoned oil and gas, drilled and cased), power lines, roads (paved and gravel), settlements (>1
house/building/farmstead), buildings (1 house/building/farmstead), sagebrush cover, trees,
elevation and slope. Anthropogenic and natural features were modelled as spline functions as it
was anticipated that the effects of the distance from GPS locations to features would be non-
linear. I also fit a model with pair-wise interactions between sagebrush cover and each of power
lines, oil and gas wells to account for whether habitat quality can offset the anthropogenic
disturbance associated with these features.
The distance between consecutive GPS locations was typically < 6 km (95% of GPS
locations), therefore a 6-km radius buffer around each GPS location was established to
accurately reflect the distances moved. Following the methodology of Warton and Aarts (2013),
48 pseudo-absence points were placed within each buffer along 6 linear spokes (8 points per
spoke) radiating outward from the GPS location at 60° angles. The distance and direction from
every GPS location and pseudo-absence point to each covariate was calculated and the results
were graphed. Sage-grouse individuals were included as a random effect to account for possible
clustering in the data due to differences in movement rates/behaviours between individuals. Year
was included as a categorical variable because the rate of occurrence varied between release and
non-release years. The smoothness of spline terms was determined using the Generalized Cross
Validation criterion (Wood 2004) with a degrees of freedom penalty of γ=1.4.
From the model predictions, maps were created to provide a visual reference for where
the translocated sage-grouse were most likely to be observed in the study area. The map

79
represents population-level predictions as this is the best unbiased prediction for the likelihood of
observing a bird.
3.3 RESULTS
3.3.1 Natural and Anthropogenic Features
I incorporated 1596 km of trails, 3536 km of fence lines, 765 km of paved and gravel
roads, 437 km of power lines, 269 active and suspended oil wells, 373 gas wells and 6729 trees
and 69 buildings into my models (Figure 3.2). Trails and fences were not included in the final
analysis because their densities on the landscape were too high and sage-grouse would be
unlikely to be able to select any habitat away from them (Figure 3.3). Cropland was not included
in the model as it was highly correlated with settlements (R > 0.7) and was confined to the
northwest corner of the study area. Settlements were more distributed throughout the study area
and therefore more relevant to the analysis. All other features had correlation coefficients below
0.7 and could be included in the models together. Elevation ranges from a low of approximately
815 m in the Milk River floodplains near the 49th parallel to a high of approximately 1275 m in
the north-central part of the study area in township 6 range 4 (Jones et al. 2005). Slope ranged
from 0-8° and sagebrush cover ranged from 0-100% with an average of 16%.

80
Figure 3.2. Buildings, power lines, paved and gravel roads, trees, gas wells and active and
suspended oil wells located in sage-grouse range in fall 2013 in southeast Alberta.
Figure 3.3. Trails and fences located in sage-grouse range in southeast Alberta in fall 2013 in
southeast Alberta.

81
3.3.2 Habitat Selection in Relation to Natural and Anthropogenic Features
Translocated sage-grouse had a higher rate of occurrence with increasing sagebrush cover and
decreasing elevation and slope (Figure 3.4). Sage-grouse were less likely to be found at distances of up
to approximately 5 km from oil wells, but after 5 km were less likely to be found with increasing
distance from oil wells (Figure 3.4). Sage-grouse were less likely to be found closer to power lines,
buildings, trees, gas wells, settlements and roads (Figure 3.4). The effect size of the pair-wise
interactions between sagebrush and power lines, gas wells and oil wells added only 1% to the variance
explained (Figure 3.5). The predicted intensity map of translocated sage-grouse occurrences, derived
from the individual model predictions, shows that sage-grouse are predicted to most likely be observed
in the northwest and central parts of the study area (Figure 3.6).

82

83
Figure 3.4 Contribution to intensity of the effect of elevation, slope, sagebrush cover, distance to trees, oil wells, gas wells, buildings,
settlements, power lines and roads on translocated sage-grouse locations in southeast Alberta from 2011-2014. Covariates that were
right skewed were either square root or log transformed to stabilize the model fitting process and to improve interpretation. Effect is
the contribution to the fitted intensity by year. The smooths are centered, so ‘0’ is the average intensity for the reference year (the
estimate of the model intercept). Negative values act to reduce the intensity above the mean and positive values act to increase the
intensity.

84
Figure 3.5 The effect size of the pair-wise interactions between sagebrush cover (%) and translocated sage-grouse distance to oil
wells, gas wells and power lines (m) in southeast Alberta from 2011-2014. The pair-wise interactions added 1% to the variance
explained between sagebrush cover and distance to oil wells, gas wells and powerlines.

85
Figure 3.6 Predicted intensity of translocated Greater Sage-grouse occurrences in Southeast
Alberta derived from the model predictions in Figure 3.4. Warm colors (yellow-red) represent
where sage-grouse are more likely to be observed in the study area. Cool colors (blue) represent
where sage-grouse are less likely to be observed in the study area. The map represents
population-level predictions as this is the best unbiased prediction for the likelihood of observing
a bird.
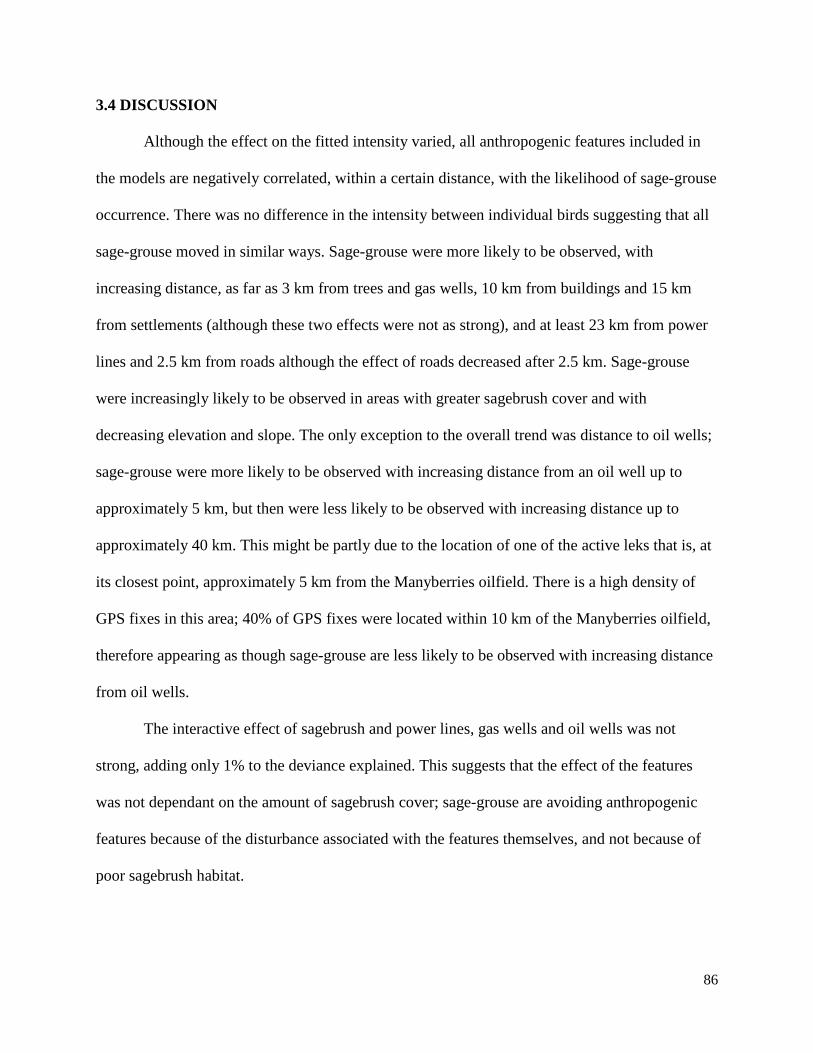
86
3.4 DISCUSSION
Although the effect on the fitted intensity varied, all anthropogenic features included in
the models are negatively correlated, within a certain distance, with the likelihood of sage-grouse
occurrence. There was no difference in the intensity between individual birds suggesting that all
sage-grouse moved in similar ways. Sage-grouse were more likely to be observed, with
increasing distance, as far as 3 km from trees and gas wells, 10 km from buildings and 15 km
from settlements (although these two effects were not as strong), and at least 23 km from power
lines and 2.5 km from roads although the effect of roads decreased after 2.5 km. Sage-grouse
were increasingly likely to be observed in areas with greater sagebrush cover and with
decreasing elevation and slope. The only exception to the overall trend was distance to oil wells;
sage-grouse were more likely to be observed with increasing distance from an oil well up to
approximately 5 km, but then were less likely to be observed with increasing distance up to
approximately 40 km. This might be partly due to the location of one of the active leks that is, at
its closest point, approximately 5 km from the Manyberries oilfield. There is a high density of
GPS fixes in this area; 40% of GPS fixes were located within 10 km of the Manyberries oilfield,
therefore appearing as though sage-grouse are less likely to be observed with increasing distance
from oil wells.
The interactive effect of sagebrush and power lines, gas wells and oil wells was not
strong, adding only 1% to the deviance explained. This suggests that the effect of the features
was not dependant on the amount of sagebrush cover; sage-grouse are avoiding anthropogenic
features because of the disturbance associated with the features themselves, and not because of
poor sagebrush habitat.

87
As expected, the predicted intensity of sage-grouse occurrence in areas surrounding
active leks and release sites was high. The predicted intensity map I generated could be used to
help strategically guide habitat enhancement efforts in the study area. Appendix 1 overlays the
high intensity predictions with the anthropogenic features present in the study site to further help
guide these decisions. Appendix 2 outlines the number of anthropogenic features within each
sage-grouse hen’s home range. Habitat enhancements would best be focused in areas where
predicted intensity was high and suitable habitat was present yet no sage-grouse were observed,
with the goal of increasing the likelihood of sage-grouse use within those areas. For example, the
model predicts a high likelihood of translocated sage-grouse occurrence along the Milk River
Ridge (southwest corner of the study area) and around Pakowki Lake (west side of study area).
However, there are no recently recorded sage-grouse observations in these areas. There are at
least five historical and recently abandoned leks that are located in areas of high likelihood of
occurrences, including areas surrounding Pakowki Lake that could be potential targets for habitat
enhancements.
Although the effects of buildings and settlements on the likelihood of translocated sage-
grouse being observed were not as strong as other anthropogenic features in the models, sage-
grouse were more likely to be observed, with increasing distance, as far as 10 km from buildings
and 15 km from settlements. Sage-grouse were also less likely to be observed within 2.5 km of
roads, although the effect of roads decreased after 2.5 km. Proximity to anthropogenic structures
such as dwellings can reduce the use of suitable habitat (Hagen 2003). Although roads appeared
to have minimal impact on prairie-chicken habitat use (Hagen 2003), the noise and disturbance
associated with roads has been shown to alter nest site selection, habitat use, and persistence at
leks (Lyon and Anderson 2003; Holloran 2005; Pitman et al. 2005; Hagen et al. 2011). If suitable

88
nesting habitat is removed by anthropogenic features such as roads, and reproductive success is
negatively affected by this displacement, lek persistence and patch occupancy may also
subsequently diminish (Hagen et al. 2011).
Translocated sage-grouse in Alberta were more likely to be observed with increasing
distance from power lines, as far as 23 km. Power lines have often been associated with the loss
of large amounts of usable habitat, with many species of prairie grouse avoiding power lines in
general as well as during the reproductive season (Ellis 1985; Braun 1998; Hagen 2003; Pitman
et al. 2005; Johnson et al. 2011). In Oklahoma, Lesser and Greater Prairie-Chickens
(Tympanuchus cupidoboth) both avoided power lines by at least 100 m and Lesser Prairie-
Chickens also avoided highways by 100 m (Pruett et al. 2009). Both species of prairie-chickens
crossed power lines less often than expected if birds moved randomly and the home ranges of
Lesser Prairie-Chickens overlapped power lines less often than would be expected by chance
(Pruett et al. 2009). Pruett et al. (2009) also suggested that new power lines could lead to
avoidance of previously suitable habitat and would act as barriers to movement, thereby
increasing fragmentation in an already fragmented landscape. Avoidance of tall structures such
as power lines may result from individual grouse having experienced predation attempts or the
visual recognition of a predator perching on these features (Hagen et al. 2011). Perching on
power lines increases a raptor’s range of vision, presumably allowing for greater efficiency in
detecting prey (Hall et al. 1981; Steenhof et al. 1993). Anthropogenic features act as resource
subsidies (i.e. food, shelter and nest substrate) for predators of sage-grouse by promoting
survival and reproduction (Coates 2007; Webb et al. 2012). An increased abundance of raptors as
a result of the presence of anthropogenic subsidies may result in higher than normal predation

89
rates (Coates 2007). Power lines also directly cause sage-grouse mortality; accounting for 3-5%
of known mortalities (Hagen et al. 2007; Wolfe et al. 2007; Pruett et al. 2009).
Translocated sage-grouse in Alberta were more likely to be observed, with increasing
distance, as far as 3 km from gas wells and 5 km from oil wells. In the Powder River Basin of
Montana and Wyoming, Doherty et al. (2008) found that sage-grouse avoided natural gas
development in otherwise suitable winter habitat and were 1.3 times more likely to occupy
habitats that lacked natural gas wells within a 4 km2 area, compared to areas that had the
maximum density of 12 wells/4 km2 allowed. In southeast Alberta, Carpenter et al. (2010) found
that sage-grouse did not use areas in winter within 1,200 m of an oil or gas well, and found
limited selection for habitat between 1,200 m and 1,900 m from wells. Avoidance of energy
development by sage-grouse in Alberta has likely resulted in substantial loss of functional winter
and brood-rearing habitat (Aldridge and Boyce 2007; Carpenter et al. 2010). Broods selected
heterogeneous habitats with high levels of vegetative productivity and sagebrush while avoiding
human developments, cultivated cropland, and high densities of oil wells in southeast Alberta
(Aldridge and Boyce 2007). In addition, chick mortality was more likely to occur in proximity to
oil and gas developments (Aldridge and Boyce 2007). Habitat connectivity between winter and
other life stages (i.e. nesting and brood-rearing) is crucial because if important seasonal habitats
are no longer used as a result of high densities of anthropogenic features, there are likely to be
negative effects on demographic rates (Holloran 2005; Aldridge and Boyce 2007; Doherty et al.
2008).
In addition to decreasing the amount of usable habitat, anthropogenic features can have
negative effects on lek attendance by male sage-grouse. Johnson et al. (2011) analyzed lek count
data from across the North American range of sage-grouse and found that counts tended to be

90
lower for leks that were within 20 km of a highway or within 18 km of a communication tower.
The trend in male numbers was depressed for leks within 5 km of active oil or gas wells and leks
with more than 160 wells within 18 km (Johnson et al. 2011). Proximity to power lines also have
a negative effect on lek persistence (Walker et al. 2007) and natural gas developments within 3-5
km of an active lek can lead to dramatic declines in breeding populations (Holloran 2005).
According to Holloran (2005), leks heavily impacted by development typically become inactive
within 3-4 years, and energy development within 6 km of lek can decrease male attendance.
In southeast Alberta the observed effects of energy development on lek attendance has
been recorded since lek monitoring began in 1968. The number of male sage-grouse displaying
at lek sites decreased from approximately 520 males to 200-300 after an increase in oil and gas
development in the early 1980’s (Aldridge 2000). Dubé (1987) reported that of 12 leks in which
travelled roads or pipelines passed within 1.2 km, 4 were abandoned. Similar population declines
were recorded in the early 1990’s when there was another increase in oil development and the
number of male sage-grouse counted fell from 241 males in 1991 to 70 males in 1994 (Aldridge
2000). In 1991, decreased activity at 6 leks was attributed to oil and gas activity; all of these leks
have now been abandoned (Balderson et al. 2013). Currently, there are 103 km of paved roads
within 18 km of active leks in southeast Alberta. One active lek is within 5 km of active oil and
gas wells and there are approximately 190 active oil and gas wells operating within 18 km of
active leks. The amount of paved roads and oil and gas wells exceed the numbers reported by
Johnson et al. (2011) in his analysis of the range-wide correlations of anthropogenic features and
lek trends. There was no difference observed in my study between nest initiation and nest
success at the lek/release site that is located within 5 km of the Manyberries oilfield, and the
lek/release site that is located further away from the oilfield. Despite this, there has been research

91
that has demonstrated the negative effects of oil and gas development in southeast Alberta on
sage-grouse habitat selection and chick survival (Aldridge and Boyce 2007; Carpenter et al.
2010).
I found that sage-grouse were also less likely to be located within 3 km of trees. Trees
were common in the study area around agricultural land and buildings, mainly as shelterbelts.
Trembling Aspen (Populus tremuloides) was also present in the study area, mostly confined to
riparian areas, moist soils, and farmsteads/shelterbelts. Once restricted to the Aspen Parkland
regions of the prairie provinces, aspen has moved into the grasslands as a result of fire
suppression and the extirpation of bison over the past 150 years (Manitoba Forestry Association
2011). In moist soils that can support it, the tenacity of aspen makes it one of the most persistent
threats to native prairie as the shade provided by the trees eliminates many grass species
dependent on high levels of sunlight for survival (Manitoba Forestry Association 2011). In
addition to contributing to habitat loss and fragmentation, predators of sage-grouse have been
observed nesting in aspen trees in southeast Alberta (T. Whiklo, personal communication). Tree
encroachment is a serious problem in the United States portion of sage-grouse range. With
approximately 90% of conifer encroachment in the western U.S. occurring in sagebrush habitats,
conifer encroachment has been identified as a key threat leading to sagebrush habitat loss and
fragmentation (Davies et al. 2011; Miller et al. 2011; Knick et al. 2013). Land managers in
Alberta should consider removing aspen trees in key sage-grouse habitat, as they provide
subsidies for predators and degrade sagebrush habitat.
92
3.5 SUMMARY AND CONCLUSIONS
I used an Inhomogeneous Poisson Point Process incorporating habitat selection and
animal movements to assess how translocated sage-grouse selected habitat in relation to
anthropogenic features. Poisson point process models are becoming a widely used approach to
model location data because they offer a basis for choosing the number and location of pseudo-
absences (Warton and Aarts 2013). I modelled how the expected observations of sage-grouse
varied across the study area, based on the distance to anthropogenic features, allowing me to
directly model selection decisions made by sage-grouse.
There are techniques to check the predictive ability of Poisson point process models, but
there were issues with applying them to my data as I had a relatively small number of individual
birds and the data are spatio-temporal. Checking assumptions of Poisson point models is
something that has only recently been discussed in the literature. However, I performed GAM
theory to apply regularization during fitting and controlled the degree of shrinkage with
additional model parameters. This regularization has been shown to perform feature selection
appropriately by recovering the covariates with known effects and ignoring those of random
predictors with appropriate error rate. In addition, the predictive surface map that was generated
qualitatively recovered the pattern in the kernel density plot of the observations using the chosen
covariates. When new translocation data becomes available, it is recommended to test the model
to predict for new observations.
I found that translocated sage-grouse are less likely to be found closer to anthropogenic
features including: gas wells, power lines, roads, buildings, settlements, trees, and oil wells up to
a distance of approximately 5 km. More than 5 km from an oil well, sage-grouse were less likely
to be observed. Sage-grouse were more likely to be observed in areas with greater sagebrush

93
cover and in areas of lower elevation and having a low slope. The effect size of the interactions
between sagebrush and power lines, gas wells and oil wells was small, adding only 1% to the
deviance explained, suggesting that sage-grouse are avoiding anthropogenic features because of
the disturbance of the features themselves, and not because the features occur in poor sagebrush
habitat.
The effects of roads, settlements and gas wells on the occurrence of sage-grouse were
smaller than the effects of power lines, buildings, trees and oil wells (up to 5 km), suggesting that
the latter features should be prioritized for removal. However, it is likely the cumulative effects
of some or all of these features that force sage-grouse to use habitat away from these features.
Coates (2007) found that power lines, well sites and roads can have the greatest impact on prairie
grouse. Power lines should be buried to remove the aboveground vertical structure that can act as
resource subsidies for predators, especially in important seasonal habitats (i.e. in proximity to
active leks). Suspended oil and gas well sites should be removed and lease sites reclaimed in key
seasonal habitats. Abandoned buildings should also be removed in key seasonal habitats, or at
least mitigated (i.e. boarding up windows) to decrease the ability of predators to use them. Aspen
encroachment should be controlled to reduce the amount of habitat loss and degradation.
Although threats to sage-grouse vary with location, the cumulative effects of human
activity generally have a negative effect throughout the species’ range (Johnson et al. 2011).
However, these authors conclude that no single issue is responsible for the population decline
and no single recovery action may be enough to reverse the decline. The removal of structures in
areas with a low density of anthropogenic features may return more usable habitat than the
removal of features within areas of high feature density. Future assessments of proposed
developments should consider the construction of all new anthropogenic features as a potential

94
detriment to habitat quality. Conservation planning should carefully consider the proximity and
density of anthropogenic features important to seasonal ranges when prioritizing areas for habitat
enhancements.
Suggestions for further research include increasing our understanding of how sagebrush
density and anthropogenic feature density affects habitat selection at multiple scales at multiple
levels of disturbance. If future translocations occur and more reliable year-round location data
are obtained, habitat selection in relation to anthropogenic features during all life stages
(breeding, nesting, brood-rearing and wintering) should be analyzed.

95
3.6 LITERATURE CITED
Aarts, G., J. Fieberg, and J. Matthiopoulos. 2012. Comparative interpretation of count, presence-absence and point methods for species distribution models: Species distribution as spatial point process. Methods in Ecology and Evolution 3:177–187.
Adams, B. W., J. Carlson, T. Milner, T. Hood, B. Cairns, and P. Herzog. 2004. Beneficial grazing management practices for Sage-Grouse (Centrocercus urophasianus) and ecology of silver sagebrush (Artemisia cana). Technical Report, Public Lands and Forests Division, Alberta Sustainable Resource Development, Edmonton, AB, Canada. Publication Number T/049.
Adams, B. W., J. Richman, L. Poulin-Klein, K. France, D. Moisey, and R. L. McNeil. 2013. Rangeland plant communities for the Dry Mixedgrass Natural Subregion of Alberta. Second Approximation. Rangeland Management Branch, Policy Division, Alberta Environment and Sustainable Resource Development, Lethbridge, AB, Canada. Publication Number T/040.
Alberta Conservation Association. 2012. MULTISAR (2012) Program Report. <http://www.ab-conservation.com/go/default/index.cfm/programs/program-reports/2011-2012/wildlife/multisar/>. Accessed 17 Jul 2015.
Alberta Environment and Sustainable Resource Development. 2013. Alberta Greater Sage-grouse Recovery Plan 2013-2018. Alberta Species at Risk Recovery Plan No. 30. Edmonton, Alberta, Canada.
Aldridge, C. L. 2000. Reproduction and habitat use by Sage Grouse (Centrocercus urophasianus) in a northern fringe population. Thesis, University of Regina, Regina, Saskatchewan, Canada.
Aldridge, C. L. 2005. Identifying habitats for the persistence of Greater Sage-Grouse (Centrocercus urophasianus) in Alberta, Canada. <http://www.nrel.colostate.edu/assets/nrel_files/labs/aldridge-lab/publications/AldridgePhdThesis.pdf>. Accessed 21 Oct 2014.
Aldridge, C. L., and M. S. Boyce. 2007. Linking occurrence and fitness to persistence: habitat-based approach for endangered greater sage-grouse. Ecological Applications 17:508–526.
Aldridge, C. L., and R. M. Brigham. 2003. Distribution, abundance, and status of the Greater Sage-Grouse, Centrocercus urophasianus, in Canada. Canadian Field-Naturalist 117:25–34.
Atamian, M. T., J. S. Sedinger, J. S. Heaton, and E. J. Blomberg. 2010. Landscape-Level Assessment of Brood Rearing Habitat for Greater Sage-Grouse in Nevada. Journal of Wildlife Management 74:1533–1543.
Baddeley, A., and R. Turner. 2005. Spatstat: an R package for analyzing spatial point patterns. Journal of statistical software 12(6):1–42.
Balderson, K. L., D. H. Eslinger, and J. T. Nicholson. 2013. Greater Sage-Grouse (Centrocercus urophasianus) Monitoring in Southeast Alberta: 1968-2012. Alberta Species at Risk Report 147, Edmonton, Alberta, Canada. Alberta Environment and Sustainable Resource Development, Fish and Wildlife Division.
Baruch-Mordo, S., J. S. Evans, J. P. Severson, D. E. Naugle, J. D. Maestas, J. M. Kiesecker, M. J. Falkowski, C. A. Hagen, and K. P. Reese. 2013. Saving sage-grouse from the trees: A proactive solution to reducing a key threat to a candidate species. Biological Conservation 167:233–241.

96
Bivand, R., and N. Lewin-Koh. 2014. Maptools: Tools for reading and handling spatial objects. R package version 0.8-30. <http://CRAN.R-project.org/package=maptools>.
Braun, C. E. 1998. Sage grouse declines in western North America: what are the problems? Pages 139–156 in. Proceedings of the Western Association of State Fish and Wildlife Agencies. Volume 78.
Braun, C. E., O. O. Oedekoven, and C. L. Aldridge. 2002. Oil and gas development in western North America: effects on sagebrush steppe avifauna with particular emphasis on sage grouse. Pages 337–349 in. Transactions of the North American Wildlife and Natural Resources Conference. Volume 67. <http://www.oilandgasbmps.org/docs/GEN094.pdf>. Accessed 8 May 2015.
Brown, D. G., K. M. Johnson, T. R. Loveland, and D. M. Theobald. 2005. Rural land-use trends in the conterminous United States, 1950-2000. Ecological Applications 1851–1863.
Carpenter, J., C.L. Aldridge, and M. S. Boyce. 2010. Sage-Grouse Habitat Selection During Winter in Alberta. Journal of Wildlife Management 74:1806–1814.
Casazza, M. L., P. S. Coates, and C. T. Overton. 2011. Linking habitat selection and brood success in Greater Sage-Grouse. Pages 151–167 in. Ecology, Conservation and Management of Grouse. Volume in Sandercock, B.K., K. Martin, Segelbacher, G., editors. Studies in Avian Biology no. 39. University of California Press, Berkeley, California, USA.
Coates, P. S. 2007. Greater Sage-Grouse (Centrocercus urophasianus) nest predation and incubation behavior. Idaho State University. <http://grazingforgrouse.com/sites/default/files/Coates%202007_0.pdf>. Accessed 12 Apr 2015.
Coates, P. S., J. W. Connelly, and D. J. Delehanty. 2008. Predators of Greater Sage-Grouse Nests Identified by Video Monitoring. Journal of Field Ornithology 79:421–428.
Connelly, J. W., S. T. Knick, M. A. Schroeder, and S. J. Stiver. 2004. Conservation assessment of the greater sage-grouse and sagebrush habitats. Western Association of Fish and Wildlife Agencies, Cheyenne, Wyoming, USA.
Connelly, J. W., M. A. Schroeder, A. R. Sands, and C. E. Braun. 2000. Guidelines to Manage Sage Grouse Populations and Their Habitats. Wildlife Society Bulletin 28:967–985.
Dalke, P. D., D. B. Pyrah, D. C. Stanton, J. E. Crawford, and E. F. Schlatterer. 1963. Ecology, Productivity, and Management of Sage Grouse in Idaho. The Journal of Wildlife Management 27:810.
Davies, K. W., C. S. Boyd, J. L. Beck, J. D. Bates, T. J. Svejcar, and M. A. Gregg. 2011. Saving the sagebrush sea: An ecosystem conservation plan for big sagebrush plant communities. Biological Conservation 144:2573–2584.
Doherty, K. E., D. E. Naugle, and J. S. Evans. 2010. A Currency for Offsetting Energy Development Impacts: Horse-Trading Sage-Grouse on the Open Market. A. M. Merenlender, editor. PLoS ONE 5:e10339.
Doherty, K. E., D. E. Naugle, B. L. Walker, and J. M. Graham. 2008. Greater Sage-Grouse Winter Habitat Selection and Energy Development. Journal of Wildlife Management 72:187–195.
Dubé, L. A. 1987. Provincial sage grouse population trend counts April 27-May 1, 1987. Unpublished Report, Alberta Forestry, Lands and Wildlife, Fish and Wildlife Division, Lethbridge, AB, Canada.

97
Ellis, K. L. 1985. Distribution and habitat selection of breeding male Sage Grouse in northeastern Utah. Thesis, Brigham Young University, Provo, Utah, USA.
Environment Canada. 2014. Amended Recovery Strategy for the Greater Sage-Grouse (Centrocercus urophasianus urophasianus) in Canada. Species at Risk Act Recovery Strategy Series, Ottawa, Ontario, Canada. <http://www.sararegistry.gc.ca/virtual_sara/files/plans/amended_rs_sage_grouse_e_final.pdf>.
ESRI ArcGIS Desktop. 2012. Environmental Systems Research Institute, Redlands, California, USA.
Fedy, B. C., K. E. Doherty, C. L. Aldridge, M. O’Donnell, J. L. Beck, B. Bedrosian, D. Gummer, M. J. Holloran, G. D. Johnson, N. W. Kaczor, C. P. Kirol, C. A. Mandich, D. Marshall, G. Mckee, C. Olson, A. C. Pratt, C. C. Swanson, and B. L. Walker. 2014. Habitat prioritization across large landscapes, multiple seasons, and novel areas: An example using greater sage-grouse in Wyoming: Wyoming Sage-Grouse Habitat Prioritization. Wildlife Monographs 190:1–39.
Gillan, J. K., E. K. Strand, J. W. Karl, K. P. Reese, and T. Laninga. 2013. Using spatial statistics and point-pattern simulations to assess the spatial dependency between greater sage-grouse and anthropogenic features. Wildlife Society Bulletin 37:301–310.
Government of Alberta. 2009. Draft Land Use Standards to Acheive Sage Grouse Recovery and Conservation (new developments). Fish and Wildlife Division, Alberta Sustainable Resource Development., Edmonton, Alberta, Canada.
Government of Alberta. 2010. Grassland Vegetation Inventory (GVI) Specifications. 5th Edition, Alberta Sustainable Resource Development, Government of Alberta. Edmonton, Alberta, Canada.
Grant, T. A., E. Madden, and G. B. Berkey. 2004. Tree and shrub invasion in northern mixed-grass prairie: implications for breeding grassland birds. Wildlife Society Bulletin 32:807–818.
Hagen, C. A. 2003. A demographic analysis of Lesser Prairie-Chicken populations in southwestern Kansas: Survival, population viability, and habitat use. Dissertation, Kansas State University, Manhattan, Kansas, USA.
Hagen, C. A. 2010. Impacts of energy development on prairie grouse ecology: a research synthesis. Pages 96–103 in. Transactions of North American Wildlife and Natural Resource Conference. Volume 75.
Hagen, C. A., J. C. Pitman, T. M. Loughin, B. K. Sandercock, R. J. Robel, and R. D. Applegate. 2011. Impacts of anthropogenic features on habitat use by Lesser Prairie-Chickens. Pages Pages 63–75 in Sandercock, B.K., K. Martin, and G. Segelbacher, editors. in. Ecology, Conservation and management of grouse. Volume Studies in Avian Biology (no. 39). University of California Press, Berkeley, California, USA.
Hagen, C. A., J. C. Pitman, R. J. Robel, and T. M. Loughin. 2007. Niche Partitioning by Lesser Prairie-chicken Tympanuchus pallidicinctus and Ring-necked Pheasant Phasianus colchicus in Southwestern Kansas. Wildlife biology 13.
Hagen, C. A., B. K. Sandercock, J. C. Pitman, R. J. Robel, and R. D. Applegate. 2009. Spatial Variation in Lesser Prairie-Chicken Demography: A Sensitivity Analysis of Population Dynamics and Management Alternatives. The Journal of Wildlife Management 73:1325–1332.

98
Hall, T. R., W. E. Howard, and R. E. Marsh. 1981. Raptor use of artificial perches. Wildlife Society Bulletin 9:296–298.
Hijmans, R. J. 2014. Raster: raster: Geographic data analysis and modeling. R package version 2.3-12. <http://CRAN.R-project.org/package=raster>.
Holloran, M. J. 2005. Greater sage-grouse (Centrocercus urophasianus) population response to natural gas field development in western Wyoming. Thesis, University of Wyoming, Laramie, Wyoming, USA.
Holloran, M. J., R. C. Kaiser, and W. A. Hubert. 2010. Yearling Greater Sage-Grouse Response to Energy Development in Wyoming. Journal of Wildlife Management 74:65–72.
Johnson, D. H., M. J. Holloran, J. W. Connelly, S. E. Hanser, C. L. Amundson, and S. T. Knick. 2011. Influences of environmental and anthropogenic features on Greater Sage-Grouse populations, 1997-2007. Pages 407–450 in S.T. Knick and J.W. Connelly (editors). in. Ecology and Conservation of Greater Sage Grouse: A Landscape Species and its Habitats. Volume Studies in Avian Biology (38). University of California Press, Berkeley, California, USA.
Jones, P. F., R. Penniket, L. Fent, J. Nicholson, and B. Adams. 2005. Silver sagebrush community associations in southeast Alberta, Canada. Rangeland Ecology & Management 58:400–405.
Kaiser, R. C. 2006. Recruitment by greater sage-grouse in association with natural gas development in Western Wyoming. Thesis, University of Wyoming, Laramie, Wyoming, USA.
Knick, S. T., D. S. Dobkin, J. T. Rotenberry, M. A. Schroeder, W. M. Vander Haegen, and C. van Riper. 2003. Teetering on the edge or too late? Conservation and research issues for avifauna of sagebrush habitats. The Condor 105:611.
Knick, S. T., S. E. Hanser, and K. L. Preston. 2013. Modeling ecological minimum requirements for distribution of greater sage-grouse leks: implications for population connectivity across their western range, U.S.A. Ecology and Evolution 3:1539–1551.
Lele, S. R., and J. L. Keim. 2006. Weighted distributions and estimation of resource selection probability functions. Ecology 87:3021–3028.
Leonard, K. M., K. P. Reese, and J. W. Connelly. 2000. Distribution, movements and habitats of sage grouse Centrocercus urophasianus on the upper Snak River Plain of Idaho: changes from the 1950s to the 1990s. Wildlife Biology 6:265–270.
Leu, M., and S. E. Hanser. 2011. Influences of the human footprint on sagebrush landscape patterns: implications for sage-grouse conservation. Pages 253-271 in S.T. Knick and J.W. Connelly (editors). Greater Sage-Grouse: ecology and conservation of a landscape species and its habitats. Studies in Avian Biology (38), University of California Press, Berkeley, California, USA.
Leu, M., S. E. Hanser, and S. T. Knick. 2008. The human footprint in the west: a large-scale analysis of anthropogenic impacts. Ecological Applications 18:1119–1139.
Lyle, D., and J. Taylor. 2007. The History of Agriculture. The Canadian Encyclopedia. Historica Foundation. http://www.thecanadianencyclopedia.ca/en/article/history-of-agriculture/. Accessed 18 May 2015.
Lyon, A. G., and S. H. Anderson. 2003. Potential Gas Development Impacts on Sage Grouse Nest Initiation and Movement. Wildlife Society Bulletin 31:486–491.

99
Manitoba Forestry Association. 2011. Aspen management on Manitoba’s native prairie. <http://www.thinktrees.org/my_folders/Envirothon_Theme_Resources_2011/AspenManagementBMPs.pdf>.
Manly, B. F. J., L. L. McDonald, D. L. Thomas, T. L. McDonald, and W. P. Erickson. 2002. Resource selection by animals: statistical analysis and design for field studies. Second edition. Second. Kluwer Press, Boston, Massachusetts, USA.
Miller, R. F., and L. Eddleman. 2000. Spatial and temporal changes of sage grouse habitat in the sagebrush biome. Technical Bulletin 151. Oregon State University Agricultural Experiment Station, Corvalis, Oregon, USA.
Miller, R. F., and L. L. Eddleman. 2001. Spatial and temporal changes of sage grouse habitat in the sagebrush biome. Technical Bulletin 151, Oregon State University, Agricultural Experiment Station, Corvallis, Oregon, USA. <http://ir.library.oregonstate.edu/xmlui/handle/1957/20881>. Accessed 18 May 2015.
Miller, R. F., S. T. Knick, D. A. Pyke, C. W. Meinke, S. E. Hanser, M. J. Wisdom, A. L. Hild, S. T. Knick, and J. W. Connelly. 2011. Characteristics of sagebrush habitats and limitations to long-term conservation. Greater sage-grouse: ecology and conservation of a landscape species and its habitats. Studies in Avian Biology 38:145–184.
Natural Regions Committee. 2006. Natural Regions and Subregions of Alberta. Natural Regions Committee, Edmonton, Alberta, Canada.
Noss, R. E., E. T. LaRoe III, and J. M. Scott. 1995. Endangered Ecosystems of the United States: A preliminary assessment of loss and degradation. U.S. Department of the Interior, National Biological Service., Washington, DC, USA.
Patten, M. A., D. H. Wolfe, E. Shochat, and S. K. Sherrod. 2005. Habitat fragmentation, rapid evolution and population persistence. Evolutionary Ecology Research 7:235–249.
Patterson, R. L. 1952. The Sage Grouse in Wyoming. Sage Books, Denver, Colorado, USA. Pitman, J. C., C. A. Hagen, R. J. Robel, T. M. Loughin, and R. D. Applegate. 2005. Location and
success of lesser prairie-chicken nests in relation to vegetation and human disturbance. Journal of Wildlife Management 69:1259–1269.
Pruett, C. L., M. A. Patten, and D. H. Wolfe. 2009. Avoidance Behavior by Prairie Grouse: Implications for Development of Wind Energy. Conservation Biology 23:1253–1259.
R Development Core Team. 2009. R: a language and environment for statistical computing. R Foundation for Statistical Computing, Vienna, Austria. <www.R-project.org>.
Remeš, V. 2000. How Can Maladaptive Habitat Choice Generate Source-Sink Population Dynamics? Oikos 91:579–582.
Samson, F., and F. Knopf. 1994. Prairie Conservation in North America. BioScience 44(6):418–421.
Schroeder, M. A., C. L. Aldridge, A. D. Apa, J. R. Bohne, C. E. Braun, S. D. Bunnell, J. W. Connelly, P. A. Deibert, S. C. Gardner, M. A. Hilliard, G. D. Kobriger, S. M. McAdam, C. W. McCarthy, J. J. McCarthy, L. Mitchell, E. V. Rickerson, and S. J. Stiver. 2004. Distribution of Sage-Grouse in North America. The Condor 106:363–376.
Schroeder, M. A., J. R. Young, and C. E. Braun. 1999. Sage grouse (Centrocercus urophasianus). Pages 1–28 in. A. Poole and F. Gill, editors. The Birds of North America. Volume 425. Philadelphia, Pennsylvania, USA.
Steenhof, K., M. N. Kochert, and J. A. Roppe. 1993. Nesting by Raptors and Common Ravens on Electrical Transmission Line Towers. The Journal of Wildlife Management 57:271.

100
Stevens, B. S. 2011. Impacts of fences on greater sage-grouse in Idaho: collision, mitigation, and spatial ecology. Thesis, University of Idaho, Moscow, Idaho, USA.
Stevens, B. S., D. E. Naugle, B. Dennis, J. W. Connelly, T. Griffiths, and K. P. Reese. 2013. Mapping sage-grouse fence-collision risk: Spatially explicit models for targeting conservation implementation: Spatially Explicit Collision Models. Wildlife Society Bulletin 37:409–415.
Stevens, B. S., K. P. Reese, J. W. Connelly, and D. D. Musil. 2012. Greater sage-grouse and fences: Does marking reduce collisions? Wildlife Society Bulletin 36:297–303.
Vale, T. R. 2002. The pre-European landscape of the United States: pristine or humanized? Page Pages 1–39 in T.R. Value (editor). Fire, native peoples, and the natural landscape. Island Press, Washington, DC, USA.
Walker, B. L., D. E. Naugle, and K. E. Doherty. 2007. Greater Sage-Grouse Population Response to Energy Development and Habitat Loss. Journal of Wildlife Management 71:2644–2654.
Warton, D., and G. Aarts. 2013. Advancing our thinking in presence-only and used-available analysis. B. Manly (editor). Journal of Animal Ecology 82:1125–1134.
Warton, D. I., and L. C. Shepherd. 2010. Poisson point process models solve the “pseudo-absence problem” for presence-only data in ecology. The Annals of Applied Statistics 4:1383–1402.
Webb, S. L., C. V. Olson, M. R. Dzialak, S. M. Harju, J. B. Winstead, and D. Lockman. 2012. Landscape features and weather influence nest survival of a ground-nesting bird of conservation concern, the greater sage-grouse, in human-altered environments. Ecological Processes 1:1–15.
West, N. E. 2000. Synecology and disturbance regimes of sagebrush steppe ecosystems. Pages 15–26 in P.G. Entwistle, A.M. DeBolt, J.H. Kaltenecker, and K.S. Steenhof (compilers), Proceedings: sagebrush steppe ecosystems symposium. USDI Bureau of Land Management Publication BLM/ID/PT_001001 + 1150, Boise, Idaho, USA.
Wisdom, M. J., C. W. Meinke, S. T. Knick, and M. A. Schroeder. 2011. Factors associated with extirpation of Sage-Grouse. Pages 451-472 in S.T. Knick and J.W. Connelly (editors). Greater sage-grouse: ecology and conservation of a landscape species and its habitat. Studies in Avian Biology (volume 38). University of California Press, Berkeley, California, USA.
Wolfe, D. H., M. A. Patten, E. Shochat, and C. L. Pruett. 2007. Causes and Patterns of Mortality in Lesser Prairie-chickens Tympanuchus pallidicinctus and Implications for Management. Wildlife biology 13.
Wood, S. N. 2004. Stable and efficient multiple smoothing parameter estimation for generalized additive models. Journal of the American Statistical Association 99:673–686.
Wood, S. N. 2006. Generalized Additive Models: An Introduction with R. With R. Chapman and Hall/CRC.
Woods, S. N. 2011. Fast stable restricted maximum likelihood and marginal likelihood estimation of semiparametric generalized linear models. Journal of the Royal Statistical Society (B) 73:3–36.
Zander, D., R. Seale, and D. J. Snyder. 2011. Well completion strategy and optimization in a North Dakota Bakken oilfield. Muscat, Oman.

101
4.0 GENERAL CONCLUSIONS AND MANAGEMENT IMPLICATIONS
4.1 GENERAL CONLUSIONS
The population decline of sage-grouse in Alberta has been severe, with the number of
male sage-grouse reaching an all-time low of 13 in 2011 and 2012, down from an estimated 613
males in 1968. It is imperative that the ecology of translocated sage-grouse continue to be
studied, and that habitat enhancements occur in conjunction with population augmentation
efforts in order to help sustain the population of sage-grouse in Alberta.
My objectives were a) to determine the differences in post-release movements between
nesting and non-nesting hens and use these results to help guide future translocation protocols; b)
to assess the extent to which nest success is affected by anthropogenic and natural features and to
compare the nesting ecology of translocated sage-grouse in Alberta with other populations
throughout the species’ range; and c) to determine where translocated sage-grouse select habitat
in relation to anthropogenic and natural features and from these results, recommend habitat
enhancement activities that could contribute to sage grouse recovery.
In Chapter 2, I described the post-release movements of translocated hens, and compared
the movements between nesting hens and non-nesting hens. I also described key aspects of
nesting ecology of the translocated sage-grouse and compared results to other populations
throughout North America. I found that the majority of sage-grouse had large post-release
movement distances, rates and areas when compared to other grouse translocations. Average
linear distance travelled/week/hen varied greatly during the 10 week post-release period in 2012,
ranging from 9-270 km. Average weekly linear distance travelled was 56 km and average area

102
traversed was 1944 km2. The largest post-release movements were exhibited by one hen that
travelled a total of 1019 km 8 weeks post-release. The majority of hens (76%, 16/21) travelled ≤
400 km during the same time period. Non-nesting hens had significantly higher movement rates
than nesting hens and 50% of hens did not nest during the release years. Movement rates of
nesting hens decreased in week 3 corresponding with nest initiation, while movement rates of
non-nesting hens did not decrease until week 9. Apparent average annual hen survival ranged
between 31-72% across the study period. Nest initiation across the study years (53%) and nest
success (29%) were low compared other sage-grouse populations across their range. Nest
success decreased with increasing distance from trees, power lines and settlements, suggesting
that translocated hens are naïve to the release area and do not recognize the potential risks
associated with certain anthropogenic features. Caution must be used when interpreting survival
and nest success rates as sample sizes were small.
In Chapter 3, I described where sage-grouse are likely to be observed on the landscape in
relation to anthropogenic and natural features. My results indicated that the effects of power
lines, buildings, trees and oil wells (up to 5 km) on the predicted occurrence of sage-grouse were
largest, suggesting that these features should be prioritized for removal. However, it is likely the
cumulative effects of some or all anthropogenic features that force sage-grouse to use habitat
away from features. The predicted intensity map generated from the model results could be used
to help strategically guide habitat enhancement efforts in the study area.
103
4.2 MANAGEMENT IMPLICATIONS
Based on my results, several recommendations can be made for land managers faced with
decisions regarding translocated sage-grouse conservation:
1) Given that translocated sage-grouse in my study had a higher average nest-lek
distance than resident birds in a previous study, as well as most populations
throughout their range, efforts should be made to enhance nesting habitat surrounding
leks, decrease predation risk and increase nest success by removing anthropogenic
features based on proximity to active leks, while not being restricted to the standard
3.2 km protection surrounding leks. For example, power lines should be buried
underground whenever possible in key nesting habitat.
2) Wildlife managers should consider different translocation strategies to decrease post-
release movement rates and increase the likelihood that more translocated hens will
nest, such as soft releases, capturing sage-grouse later in the breeding season or
artificially inseminating hens prior to release. Artificial insemination could also allow
for significant improvements in genetic diversity as multiple wild males could be
used to inseminate related hens, producing diverse offspring.
3) The predicted intensity map that I generated could be used to help strategically guide
habitat enhancement efforts in the study area. Habitat enhancements would best be
focused in areas where predicted intensity was high and suitable habitat was present
yet sage-grouse have not been observed, with the goal of increasing the likelihood of
sage-grouse use within those areas.
4) Future assessments of proposed developments should consider the construction of all
new anthropogenic features as a potential detriment to habitat quality.

104
5.0 APPENDICES
Appendix 1: Predicted intensity of translocated Greater Sage-grouse occurrences in Southeast
Alberta derived from the model predictions in Figure 3.4 overlayed with the anthropogenic
features that were included in the movement analysis. The warm colors (yellow-red) represent
where sage-grouse are more likely to be observed in the study area. The map represents
population-level predictions as this is the best unbiased prediction for the likelihood of observing
a bird.

105
Appendix 2: Kilometres of paved/gravel roads and power lines and the number of buildings,
trees, settlements, oil wells and gas wells in individual Greater Sage-grouse hen home ranges
(100% MCP’s) in southeast Alberta.
Greater Sage-grouse Hen ID Paved and Gravel Roads (km) Power Lines (km) Buildings Trees Settlements Oil wells Gas Wells106248 119 4 8 279 13 12 18106250 29 35 1 1 2 52 32106252 122 17 6 414 6 36 29106254 314 298 29 540 68 266 218106256 55 0 2 114 2 0 0106258 418 291 25 1860 61 265 179106259 12 0 0 8 0 0 2106261 291 151 10 1334 31 87 56106262 141 144 12 25 1 205 94106265 151 43 4 684 15 0 2106267 252 178 19 1167 42 169 182106269 41 51 1 14 1 125 56106270 86 68 7 160 13 16 25106271 295 270 23 924 42 263 218106274 258 263 21 458 51 266 150106276 54 14 4 120 3 0 0106279 286 235 26 677 41 265 154106280 263 156 16 1447 36 113 78106282 109 15 6 774 11 1 0106285 307 169 18 1349 37 131 74