habitat of the egyptian vulture (neophron percnopterus) in...
TRANSCRIPT

Habitat of tHe egyptian vulture (NeophroN percNopterus) in bulgaria and greece (2003-2014)
tecHnical report under action a5
life+ project “tHe return of tHe neopHron”
life10 nat/bg/000152
prepared by bSpb, HoS, WWf-greece, rSpb
july 2016
1 www.LifeNeophron.eu1 www.LifeNeophron.eu
AUTHORS:
Vladimir Dobrev1, Steffen Oppel2, Volen Arkumarev1, Victoria Saravia3, Anastasios Bounas3, Aris Manolopoulos3, Elzbieta Kret4, Georgi S. Popgeorgiev1 & Stoyan C. Nikolov1
1. Bulgarian Society for Protection of Birds/BirdLife Bulgaria, Yavorov complex, bl. 71, vh. 4, PO box 50, 1111 Sofia, Bulgaria
2. Royal Society for the Protection of Birds/BirdLife UK, Centre for Conservation ScienceSandy, Bedfordshire, UK
3. WWF Greece, 21 Lambessi, Gr 117 43 Athens, Greece
4. Hellenic Ornithological Society/ BirdLife Greece, Themistokleous 80, GR-10681 Athens, Greece
RECOMMENDED CITATION:
Dobrev, V., Oppel, S., Arkumarev, V., Saravia, V., Bounas, A, Manolopoulos, A., Kret, E., Popgeorgiev, G.S. & Nikolov, S.C. 2016. Habitat of the Egyptian vulture (Neophron percnopterus) in Bulgaria and Greece (2003-2014). Technical report under action A5 of the LIFE+ project “The Return of the Neophron” (LIFE10 NAT/BG/000152). BSPB, Sofia. 42 p.
ABOUT THE PROJECT
This fact sheet was prepared under the frames of action C5 of the LIFE+ project “The Return of the Neophron” (LIFE10 NAT/BG/000152, www.LifeNeophron.eu) funded by the European Union and co-funded by the “A. G. Leventis Foundation” and the MAVA Fondation pour la Nature, and implemented by the Bulgarian Society for the Protection of Birds (BirdLife Bulgaria), the Hellenic Ornithological Society (BirdLife Greece), the World Wide Fund for Nature – WWF Greece and the Royal Society for the Protection of Birds (BirdLife UK).

2 www.LifeNeophron.eu
CONTENTS
Summary .......................................................................................................................................................... 3
List of abbreviations ......................................................................................................................................... 3
Introduction ..................................................................................................................................................... 4
Methods ......................................................................................................................................................... 5
Nest monitoring .................................................................................................................................... 5
Nest site and breeding cliff charactersitics ........................................................................................... 5
Landscape characteristics around the nests ......................................................................................... 6
Environmental variables affecting territory occupancy and breeding success ..................................... 7
Model construction and assessment of variable importance .............................................................. 8
Results .............................................................................................................................................................. 9
Egyptian vulture nest site and breeding cliff characteristics ................................................................ 9
Landscape features and composition around Egyptian vulture nests ................................................ 10
Relationship between territory occupancy and environmental factors ............................................. 14
Relationship between breeding success and environmental factors ................................................. 18
Discussion ....................................................................................................................................................... 21
Egyptian vulture nest site and breeding cliff characteristics .............................................................. 21
Egyptian vulture habitat in Bulgaria and Greece ................................................................................ 22
Territory occupancy and breeding success are affected by a wide range of environmental variables 23
Effect of disturbance ........................................................................................................................... 24
Conclusions .................................................................................................................................................... 24
Acknowledgements ........................................................................................................................................ 24
Annexes .......................................................................................................................................................... 30

3 www.LifeNeophron.eu
SUmmARy
Vultures are declining throughout the world because of a large number of threats such as poisoning, electrocution, collision with man-made structures, direct persecution, changes in habitat and food availability. However, quantifying which of these factors has the greatest influence on demographic parameters such as territory occupancy and breeding success is challenging. The species with the most precarious conservation status in Europe is the Egyptian Vulture Neophron percnopterus, and we collated territory and nest monitoring data from Bulgaria and Greece to understand the relative influence of various environmental factors on population declines.
We monitored occupancy in a total of 87 different territories and breeding performance of 376 territorial pairs between 2003 – 2014, with an overall territory occupancy rate of 69% and a mean productivity of 0.80 fledglings per occupied territory. We examined which of 48 different environmental variables were most influential in explaining variation in territory occupancy and breeding success using algorithmic random forest models. Territory occupancy was best explained by food availability, geographic structure, and nesting opportunities, while breeding success was best explained by the number of adjacent villages, topography, and nesting opportunities.
Both models had reasonably good discriminative ability (AUC for territory occupancy = 0.852, AUC for breeding success = 0.737). Territory occupancy and breeding success were affected by a wide range of environmental variables, each of which had a small effect.
Additionally, in several buffer zones (1 km, 5 km and 30 km) the physical characteristics of 110 nests in 84 Egyptian vulture territories in Bulgaria and Greece were investigated, and a GIS tools were used to describe the landscape features and composition in Egyptian vulture territories. We found that 74% of the Egyptian vulture nests are situated in caves while only 26% are situated on cliff ledges, and the majority of the nests are up to 10 m in height. The mean height of the cliffs that the species occupy is 32.05m and can range between 6m and 340m in height. Additionally the length of the breeding cliffs vary from 5m to 5300 m with a mean length of 371.09 m. The landscape composition consists of variety of habitats but mostly forests, arable lands and pastures, both in Bulgaria and Greece.
We recommend a complex management aiming at adoption of large-scale landscape conservation programs that retain or restore historical small-scale farming practices which may benefit vultures and other biodiversity.
LIST Of ABBREVIATIONS
AUC - Receiver-operated characteristic curve
BG - Bulgaria
CLC – Corine Land Cover
EV – Egyptian vulture
GIS - Geographic information system
GR - Greece
NDVI - Normalised Difference Vegetation Index
PPI - Primary productivity index

4 www.LifeNeophron.eu
INTRODUCTION
Many raptor species around the world are declining, and avian scavengers like vultures are among the most threatened raptor species (Thiollay 2006, Virani et al. 2011, Chaudhary et al. 2012, Ogada et al. 2012). Many different threats exist for vultures around the world, ranging from poisoning by the veterinary drug Diclofenac (Green et al. 2004, Oaks et al. 2004, Galligan et al. 2014), poison bait targeted at livestock predators (Hernández and Margalida 2008, 2009, Mateo-Tomás et al. 2012, Skartsi et al. 2014), electrocution at electrical infrastructure (Donázar et al. 2002, Boshoff et al. 2011, Angelov et al. 2013), collision with man-made structures (Carrete et al. 2009; de Lucas et al. 2012), to direct persecution (Thiollay 2006; Margalida et al. 2008). In addition to threats causing direct mortality of birds, changes in agricultural practices, landscape composition, and sanitary regulations are known to have more subtle effects on vulture populations, for example by altering food availability and thus leading to lower reproductive output or lower survival probability (Carrete et al. 2007, Donázar et al. 2010, Margalida et al. 2014). Understanding the relative influence of these threats on declining populations is important to develop effective conservation management actions.
Among the four vulture species that breed in Europe, the EV (Neophron percnopterus) is the smallest species with the most precarious conservation status. While a few local populations in western Europe are currently stable or increasing (García-Ripollés et al. 2006, Lieury et al. 2015), the EV population in Eastern Europe has been declining at a rate of ~7% per year for several decades (Velevski et al. 2015). Territory abandonment and declines in productivity in Spain have been related to changes in diet availability and diversity (Margalida et al. 2012), poison use, and a complex mixture of various landscape factors affecting habitat suitability (Carrete et al. 2007, Hernández and Margalida 2009, Olea and Mateo-Tomás 2011). For the Balkan population, however, the causes of population declines are still speculative and considerable uncertainty exists as to which conservation management actions might be effective to halt population declines (Grubač et al. 2014, Velevski et al. 2014). While several potential causes leading to population declines are known (Skartsi et al. 2014, Velevski et al. 2015), there has been no comprehensive study to date to understand the factors affecting which territories are abandoned and how productivity is affected that could be used for conservation management. A very general habitat description for BG and GR exists and it covers grassland, rocky and forest habitats (Kurtev et al. 2008, Iankov 2007, Xiroutachis et al. in prep), but so far there is no explicit description and analysis of the habitats in the breeding areas.
For the Balkan population of EV, several sources of mortality have been identified, for example electrocution and natural mortality on migration (Angelov et al. 2013, Oppel et al. 2015), direct persecution on wintering areas (Arkumarev et al. 2014, Oppel et al. 2015), poisoning on breeding areas (Skartsi et al. 2014, Kret et al. 2016, Saravia et al. 2016), and the collection of adult birds and eggs by poachers (Kurtev et al. 2008). In addition, considerable changes in land use, livestock, animal and waste disposal practices have occurred in BG and GR over the past decades following the abandonment of socialist farming structures and the adoption of EU regulations, and it is plausible that such changes may have affected the suitability of areas for breeding vultures (Carrete et al. 2007, Kurtev et al. 2008, Carrete et al. 2009, Kamp et al. 2011, Xirouchakis in prep.) or affected available diet with consequences for productivity (Margalida et al. 2012). Although changes in diet over the past seven years were small and unlikely to have had a major influence on population dynamics (Velevski et al. 2014, Dobrev et al. 2016), a robust assessment of all factors influencing territory occupancy and productivity is needed to inform conservation management.
Because of the large number of potential direct and indirect threats that may affect vulture presence and productivity, previous analyses of territory occupancy had to resort to various multivariate analytical procedures (Carrete et al. 2007, Krüger et al. 2015), many of which are known to be suboptimal and may potentially yield biased inference regarding the actual importance of certain variables (Grömping 2009, Fernández-Delgado et al. 2014, Galipaud et al. 2014). Indeed, previous landscape analyses of the factors affecting territory abandonment and breeding success in vultures had relatively low predictive capability (Carrete et al. 2007, Olea and Mateo-Tomás 2011, Krüger et al. 2015). Here we used a powerful machine-learning algorithm that can evaluate the relative importance of many predictor variables simultaneously to explore whether any of a wide range of landscape variables has a sufficiently large effect on territory

5 www.LifeNeophron.eu
occupancy or breeding success to warrant conservation management in BG and GR. This study is the first comprehensive analysis of a large number of potential factors affecting the conservation status of EV in Eastern Europe, and provides a thorough assessment of the generality of the analytical models on which inference and management recommendations will be based. Moreover, it provides an explicit description of the nest-sites and landscape composition in the breeding territories in BG and GR, which can be further used for effective conservation of the species in these two countries, holding about 60% of the EV population in the Balkans.
Although Arkumarev (2014) provides a robust analyse of the nest site exposition and nest type preferences of the species in BG, still nothing is known for GR. On the other hand a description and composition analyse of the main land cover types in the EV territories on the Balkans does not exists except for some general habitat descriptions for BG (Iankov 2007, Kurtev et al. 2008). Increased knowledge on the nest site preferences and on the landscape features and composition would help to better understanding and identifying variety of factors affecting the survival and the persistence of the species in the breeding grounds and thus building an appropriate conservation strategy towards the species (Carrete et al. 2007).
mETHODS
Nest monitoring
All known EV nests in BG were monitored every year in the period 2003 – 2014, and in GR between 2010 – 2014. Each breeding territory was visited multiple times per breeding season to confirm if the territory was occupied, and to count the number of raised fledglings (Velevski et al. 2015, Dobrev et al. 2016). A territory was considered occupied if a pair or a single bird was observed with territorial or nest building behaviour at the beginning of the breeding season (March/April). All territories were visited again in May to confirm which of the pairs were breeding, in June and July to confirm the number of hatchlings and in August to confirm the number of fledged juveniles. Survey efforts were generally many hours in duration, and because multiple surveys were carried out in each territory in each year we do not account for imperfect detection because the probability of missing an occupied territory would have been extremely small (Olea and Mateo-Tomás 2011).
Because pairs can use different nest sites within the same territory in different years (Kurtev et al. 2008), we considered the territory as the unit of replication in all analyses, rather than individual nest sites, to avoid pseudo-replication. EV can lay 1-3 eggs but generally raises up to two fledglings. However, the processes determining whether a pair raises one or two fledglings may be fundamentally different from the processes determining whether a pair raises any fledglings or none, and preliminary explorations indicated that none of our environmental variables were able to accurately differentiate between pairs raising one or two fledglings. Hence, for the purpose of this analysis the data on the number of fledglings was reduced to ‘breeding success’, which considered pairs successful if they raised any fledglings, and unsuccessful if not. The breeding success was measured as the proportion of all territories occupied by two adult birds that resulted in at least one fledgling, which accounts for incomplete breeding propensity.
Nest site and breeding cliff charactersitics
Microhabitat characteristics such as nest type, exposition, nest height, height of the cliff, height from the nest to the top of the cliff, cliff exposition and length were defined in order to reveal the preferences of the species towards the microhabitat. We used data for the EV nests between 2005 – 2014 for BG and between 2003 – 2014 for GR. Descriptive statistics were calculated (StatSoft 2004).
For each EV nest the exposition towards the four cardinal points and the four secondary points were identified. A radar graphic was used to identify prefered nest expositions (Fisher 1995). For the purpose of the analyse

6 www.LifeNeophron.eu
nests with eastern and southeastern exposition were grouped; nests with northern and northwestern exposition were grouped; nests with western, southwestern and southern exposition were grouped.
Breeding niches were grouped in 2 – caves and ledges. Caves include deep and shallow holes in the cliffs and ledges include open rocky ledges.
Additionaly to identify the preferences towards the height and the position of the nests on the breeding cliffs, all nests were grouped as follows:
- nest situated up to 10 m height
- nest situated between 11 and 20 m height
- nest situated between 21 and 30 m height
- nest situated over 31 m height
The same groups were created to identify the preferences of the species towards the height of the cliff:
- nest situated on small sized cliffs –up to 10 m height
- nest situated on middle sized cliffs - between 11 and 20 m in height
- nest situated on big sized cliffs – between 21 and 30 m in height
- nest situated on very big sized cliffs - over 31 m in height
Landscape characteristics around the nests
To build detailed descriptive statistics of landscape composition and configuration around EV nests, we implemented GIS analysis within 1 km, 5 km and within 30 km buffer around each nests occupied in the period 2006-2014 for BG and within 30 km buffer for GR in the period 2010-2014. This analysis was performed with ArcGIS 10.2 (ESRI 2014) based on Land Parcels Identification System for BG (MAF 2015) and GR (Hellenic Mapping and Cadastral Organization). Due to the less number of territories of the species in GR and the shorter study period we only calculated the landscape composition in a larger scale for GR. The polygons (patches) within the buffers were dissolved to aggregate bourdering polygons for each buffer range (1 km, 5 km and 30 km) over all territories. Then polygons were converted from single part to multi part to calculate the total number of patches for a given landscape feature. A descriptive statistic was calculated. Additionaly 2 clusters were created for BG – Northern BG and Southern BG following the same steps in order to compare differences in the territories on a regional level. All GIS procedures were performed for 1 km and 5 km buffer and descriptive statistics were calculated.

7 www.LifeNeophron.eu
Nest and productivity monitoring in BG and GR.
Environmental variables affecting territory occupancy and breeding success
We collected information on variables influencing the physical environment, food availability, human disturbance, and intra- and interspecific biological interactions for each territory from a variety of remote sensing and local resources (Annex 1). To characterise the environmental conditions of EV territories, we used a 5 km radius around the nest, and we refer to this circular area as ‘territory’ for the purpose of this analysis. A larger radius, which may have been warranted given that EV can travel >20 km during foraging excursions and can have fairly large home-ranges (Carrete et al. 2007, López-López et al. 2014), was considered impractical for our study due to the large overlap in territories and the effort required in obtaining relevant data (Annex 1) across such spatial scales.
We first measured several physical variables that have been associated with territory occupancy or nest success in past studies (Liberatori and Penteriani 2001, Carrete et al. 2007, Olea and Mateo-Tomás 2011), such as cliff height, aspect, and the precise location of the nest on the cliff (Annex 1). Cliff height was measured using a tape measure attached to a rope connecting the top and the bottom of the cliff in a straight line. The location of all reliable food sources, such as slaughterhouses, rubbish dumps, vulture restaurants, chicken farms, and other places with regular food available for vultures were mapped using handheld GPS devices or satellite images. Because wind turbines can cause mortality of adults and lead to nest or territory abandonment (Carrete et al. 2009), the location of all wind turbines in the study area was recorded. Then, a GIS (ArcGIS 186 10, ESRI, Redlands, California) was used to measure the distance from vulture nests to food sources and count the number of food sources and wind turbines within each territory.
Monitoring data of EV and other raptors were used to create indicator variables reflecting the potential

8 www.LifeNeophron.eu
for intra-and interspecific interactions. Specifically, monitoring data were used to assess the number of alternative nesting sites in the same territory as an index of territory quality. We also determined whether an active Griffon Vulture Gyps fulvus, Peregrine Falcon Falco peregrinus, Eagle Owl Bubo bubo or Raven Corax corax nest existed within the territory. These species were chosen because they are known to interact with EV and may affect occupancy or breeding success (Margalida et al. 2003, Bertran and Margalida 2004, Brambilla et al. 2004).
Relief variables such as elevation, slope, and ruggedness of the landscape (expressed as the standard deviation of elevation over the territory) were derived from a digital elevation model with 25 m resolution for BG (EEA 2013) and 30 m for GR (Hellenic Mapping and Cadastral Organization).
Land use was expressed as the proportion of the territory that was covered in major land use categories, such as grassland, agricultural areas, forest, and water (Annex 1). The land use coverage was calculated from global remote sensing products (GlobCover 2009) that ascertained consistence across the geographic regions in our analysis (Arino et al. 2012). In addition to the proportional coverage of certain land use types, we also used the GlobCover2009 data to calculate metrics characterising the patchiness of the landscape, such as the number of distinct land use patches, the total length of habitat edges, and a habitat diversity index based on the number and extent of different habitat patches (Rotenberry and Wiens 1980, Nikolov 2010, Cord and Rodder 2011). We further considered the PPI, a metric that uses the maximum monthly values of NDVI within each territory to assess the primary productivity of an area as a general metric that may reflect food availability for opportunistic raptors (Seoane et al. 2003; Carrete et al. 2007). This index was derived from monthly averages of NDVI obtained from remote sensing (TERRA-MODIS, http://reverb.echo.nasa.gov) at a spatial resolution of 1192 m. Basic geographic variables such as the length of the road network were extracted from standard topographic maps (Annex 1).
We also contacted relevant authorities to obtain variables relating to food availability and human pressures within each territory. The number of livestock as a measure of food abundance was obtained from official records from the Bulgarian Ministry of Agriculture and Foods and the Greek Payment Authority of Common Agricultural Policy Aid Schemes (OPEKEPE in Greek) supervised by the Hellenic Ministry of Rural Development and Foods (Annex 1). The number of human inhabitants and human settlements was provided by the National Statistics Institute of Bulgaria and the Hellenic Statistical Authority to evaluate human disturbance, an important factor in the distribution of vultures (Grubb and King 1991, Richardson and Miller 1997, Krüger et al. 2015). Since poisoning is a potentially important driver of population declines in the Balkans (Velevski et al. 2015), we obtained official records of all poisoning incidents in the last 10 years in the study area (Skartsi et al. 2014).
Model construction and assessment of variable importance
We analysed the influence of environmental variables on three demographic processes that are relevant for conservation: (1) whether formerly occupied EV territories were abandoned at any time and were no longer occupied in 2013 and 2014 (hereafter referred to as territory abandonment); (2) whether territories were occupied on an annual basis (hereafter referred to as occupancy); and (3) whether pairs bred successfully given that a pair occupied a territory (hereafter referred to as breeding success). Our measure of breeding success encompasses pairs that may not have initiated a nesting attempt, and is therefore an overall metric that accounts for incomplete breeding propensity.
Previous landscape analyses of the factors affecting territory abandonment and breeding success in vultures used a variety of different statistical models to predict occupancy or abandonment, but most models had relatively low predictive capability (Carrete et al. 2007, Olea and Mateo-Tomás 2011, Krüger et al. 2015). Here we used a powerful random forest algorithm to relate occupancy and breeding success to the landscape and nest variables to identify which variables had the greatest influence and determine the direction and size of effects. A random forest is a machine learning algorithm based on classification or regression trees

9 www.LifeNeophron.eu
that can accommodate a large number of predictor variables and yields highly accurate predictions (Breiman 2001, Cutler et al. 2007, Hochachka et al. 2007). We used a random forest model based on a conditional inference framework to account for correlated predictors and for missing data (Hothorn et al. 2006b, Strobl et al. 2008, Hapfelmeier et al. 2012). We fitted this model in a regression framework with the R package ‘party’ (Hothorn et al. 2006a) and evaluated the discriminatory ability of the model using the area under the AUC calculated with the package ‘PresenceAbsence’ (Freeman and Moisen 2008) in R 3.1.1 (R Development Core Team 2014).
To assess which variables had the greatest influence on our response variables, we used a permutation procedure that assesses the loss in predictive accuracy (based on AUC) of the random forest model after randomly permuting a given variable (Strobl et al. 2007, Janitza et al. 2013, Hapfelmeier et al. 2014). We implemented this assessment using the R function ‘varimpAUC’ with 100 permutations per variable and present results as relative variable importance, with the most important variable (greatest reduction in AUC after permutation) assigned a value of 100%.
Because a random forest is a non-parametric algorithm, the direction and size of effects by given variables cannot be expressed with numeric parameter estimates. For the most important variables we therefore produced partial dependence plots which show the direction and magnitude of the effect of an environmental variable on territory abandonment, annual occupancy, and breeding success after accounting for the effects of all other variables in the model (Cutler et al. 2007, Strobl et al. 2008).
RESUlTS
Egyptian vulture nest site and breeding cliff characteristics
The physical characteristics of 110 nests in 84 EV territories in BG and GR were investigated. Most (74%) of the EV nests were situated in caves while 26% were situated on cliff ledges. Of all nest which exposition was identified (n=99), those with southwest exposition represent 26.3%, followed by those with west exposition (17.2%) and with south and east exposition (16.2%). Nests with southeast exposition represent 10.1% . The north and the northwest exposition are at the bottom of the list with 7.1% (Fig. 1).
The nest height on the breeding cliff was measured in 98 nests and most of them (53%) were situated up to 10 m height, 30% - between 11 and 20 m, 12% - between 21 and 30 m, and 5% - over 31 m (Fig. 2).
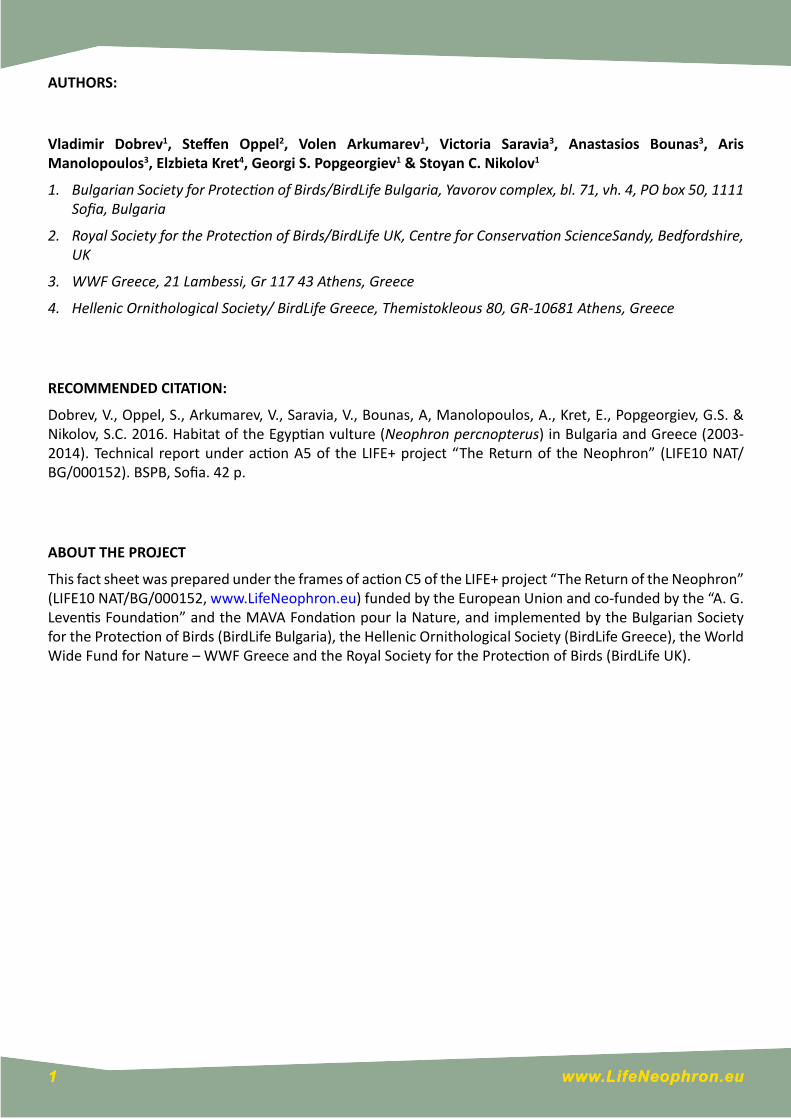
According to the height of the breeding cliff, 30% of all nest (n=98) were located in cliffs with height between 21 and 30 m, followed by cliffs with height over 31 m (29%) and cliffs with height between 11 and 20 m(27%). The least occupie cliffs were with height between 1 and 10 m (Fig. 3).
Figure 1. Expositions of EV nests in BG and GR between 2003 and 2014. N – north, E – east, S – south, W – west.
Figure 2. EV nest height (numbers are in %) in BG and GR between 2003 and 2014 (n=98).
10 www.LifeNeophron.eu
Figure 3. EV nesting cliff height (numbers are in %) in BG and GR between 2003 and 2014 (n = 98).
The mean height of the nests of the EV in BG and GR was 16.45 m (ranging from 2.5 m to 315 m). The mean height of the cliffs that the species occupy was 32.05m (ranging between 6 m and 340m) and the length of the breeding cliffs varied from 5m to 5300 m with a mean length of 371.09 m (Tab. 1).
Table 1. Descriptive statistics for EV nests and breeding cliffs in BG and GR between 2003 and 2014.
variable Mean Minimum Maximum St.dev.Height_nest 16.4543 2.500000 315.000 32.2846Height_cliff_above_nest 13.9726 0.900000 70.000 13.2374Height_cliff 32.0477 6.000000 340.000 38.3508Length_cliff 371.0909 5.000000 5300.000 780.3501
Landscape features and composition around Egyptian vulture nests
Bulgaria
• 1 km buffer zone around the nest
A total of 31 land cover classes are identified in 1 km radius around EV nests in BG (n = 67 nests; Annex 2.1). Out of them, with the highest cover were forests (62%), shrubs and grasses (9.8%), and arrable lands (6.7%) (Fig. 4). In terms of landscape configuration, shrubs and grasses were the most fragmented land cover class represented by 20% of all patches (n = 1,958 patches), followed by pastures and meadows (15%) and forests ( 11%) (Annex 2.1).
The number of land cover classes around EV nests in southern (n = 44 nests) and northern BG (n = 23 nests) was similar: 25 land cover classes in northern part of the country versus 26 in the south (Annex 2.5). In both regions the largest areas were covered by forests ( 68.7% in the south and 50.7% in the north), followed shrubs and grasses (7%) and pastures and meadows ( 5.8%) in the south, and arable lands (15.6%) and shrubs and grasses (14.4%) in the north (Fig. 5 & 6).
In both northern and southern BG, the most fragmented land cover class is the shrub and grassland territories with 20 % and 21% of the patches respectively, followed by the pastures and meadows (16%) in the south and forests (14%) in the north (Annex 2.5).

11 www.LifeNeophron.eu
Figure 4. Landscape composition (in %) within 1 km radius around EV nests in BG.
Figure 5. Landscape composition (in %) within 1 km radius around EV nests in northern BG.
Figure 6. Landscape composition (in %) within 1 km radius, southern BG.
12 www.LifeNeophron.eu
• 5 km buffer around the nest
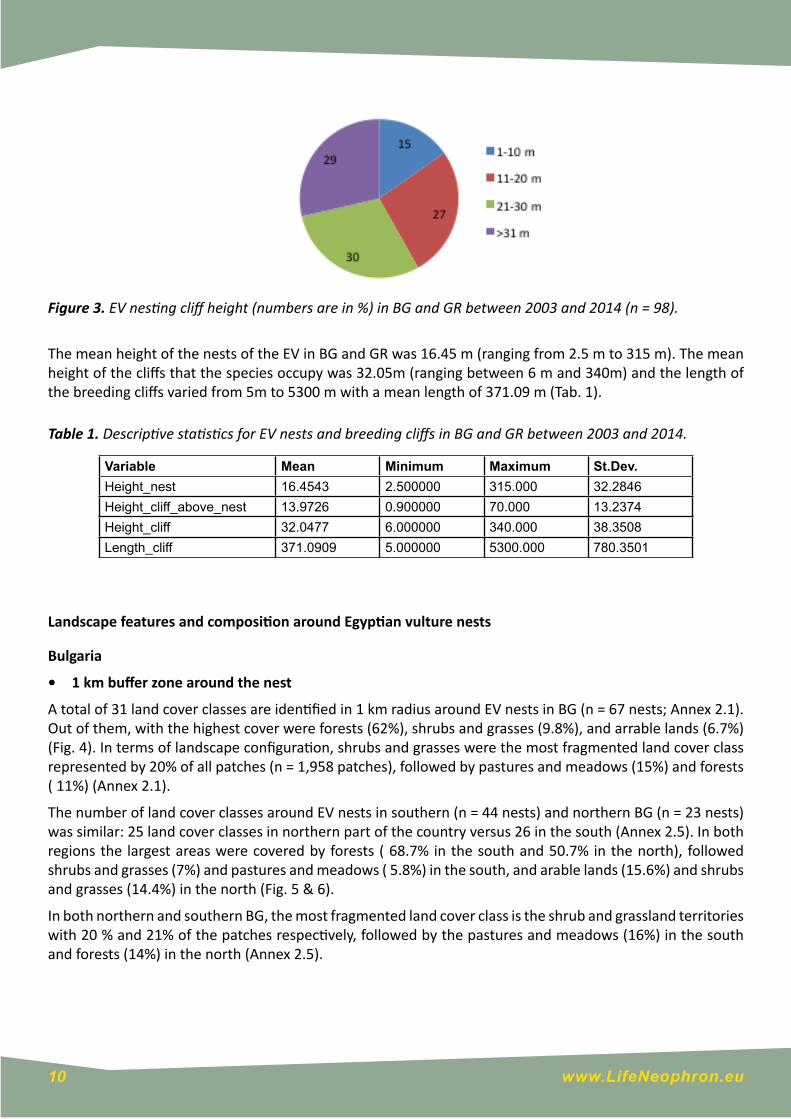
A total of 36 land cover classes were identified within 5 km radius around EV nests in BG (n = 67 nests, Annex 2.2). Out of them forested areas were with the largest cover (48.9%), followed by arrable lands (16.7%) and shrubs and grassland territories (9%) (Fig. 7). Even with small cover, the built up areas outside settlements were the most fragmented landscape class representing 27% of all patches (n = 29,719 patches), followed by shrubs and grasslands (17%), pastures and meadows (14%), and arrable lands (7%)(Annex 2.2).
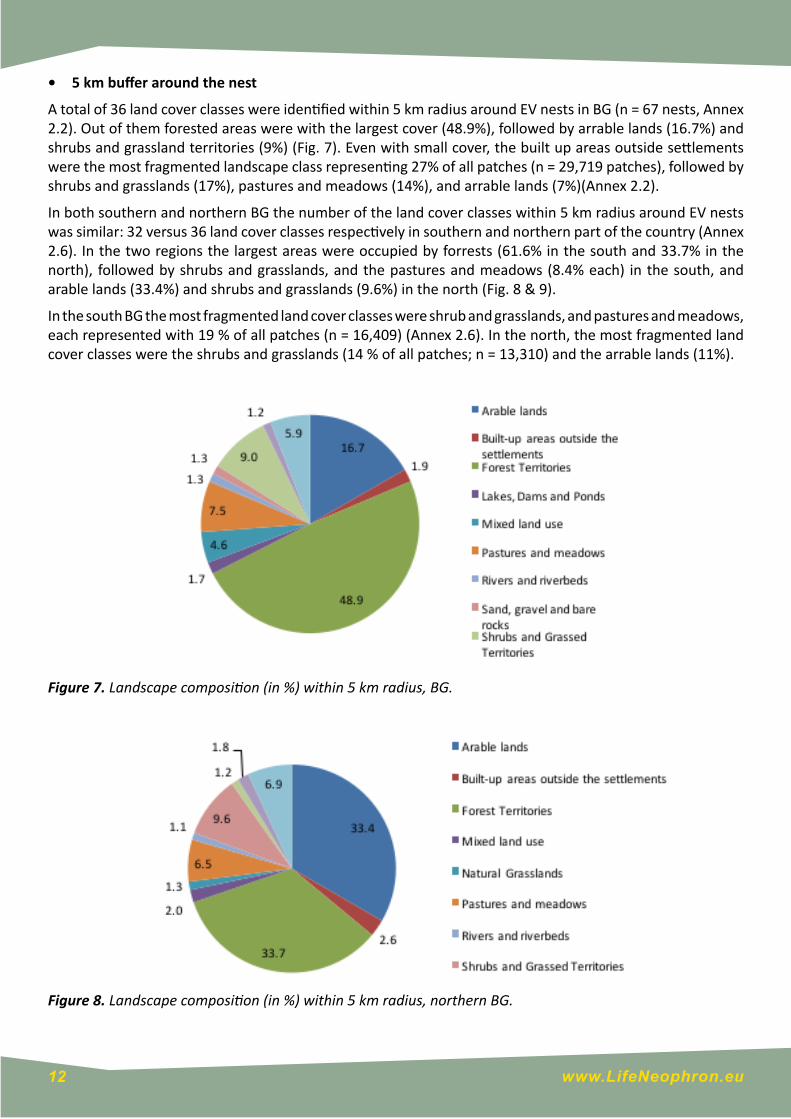
In both southern and northern BG the number of the land cover classes within 5 km radius around EV nests was similar: 32 versus 36 land cover classes respectively in southern and northern part of the country (Annex 2.6). In the two regions the largest areas were occupied by forrests (61.6% in the south and 33.7% in the north), followed by shrubs and grasslands, and the pastures and meadows (8.4% each) in the south, and arable lands (33.4%) and shrubs and grasslands (9.6%) in the north (Fig. 8 & 9).
In the south BG the most fragmented land cover classes were shrub and grasslands, and pastures and meadows, each represented with 19 % of all patches (n = 16,409) (Annex 2.6). In the north, the most fragmented land cover classes were the shrubs and grasslands (14 % of all patches; n = 13,310) and the arrable lands (11%).
Figure 7. Landscape composition (in %) within 5 km radius, BG.
Figure 8. Landscape composition (in %) within 5 km radius, northern BG.

13 www.LifeNeophron.eu
Figure 9. Landscape composition (in %) within 5 km radius, southern BG.
• 30 km buffer around the nest
A total of 40 land cover classes were identified within 30 km radius around EV nests in BG (n = 67 nests, Annex 2.3). Forests covered the largest area (39.2%; n = 30,754 km2), followed by arrable lands (28%). Other important land covers were pastures and meadows (7.4%), shrubs and grasslands (7.3%) and territories with mixed land use (4.8%) (Fig. 10). Of the largest land covers, pastures and meadows, and shrub and grassland territories were the most fargmented, represented respectively with 10% and 15% of all patches (Annex 2.3).
Figure 10. Coverage of landscape features (in %) in 30 km radius, BG.

14 www.LifeNeophron.eu
Greece
• 30 km buffer around the nest
A total of 19 land cover classes were identified within 30 km radius around EV nests in GR (Annex 2.4). Arrable lands covered the largest area (31.5%; n =6,066 km2), followed by forests (25.7%) and forage land cover (20.8%) (Fig. 11). Arrable lands were the most fragmented land cover class, with 47% of all patches, followed by the other large landscape features – forage land with 12% and forestry with 10% of all patches. (Annex 2.4).
Figure 11. Coverage of landscape features (in %) in 30 km radius, GR.
Relationship between territory occupancy and environmental factors
We used data from 87 different territories that were monitored in up to 12 years between 2003 and 2014, resulting in 766 territory-year combinations for which reliable information on the occupancy status was available. Because not all monitoring efforts were sufficiently intensive to assess reproductive output, our assessment of factors influencing breeding success was based on 373 territory-year combinations occupied by a pair from 66 territories.
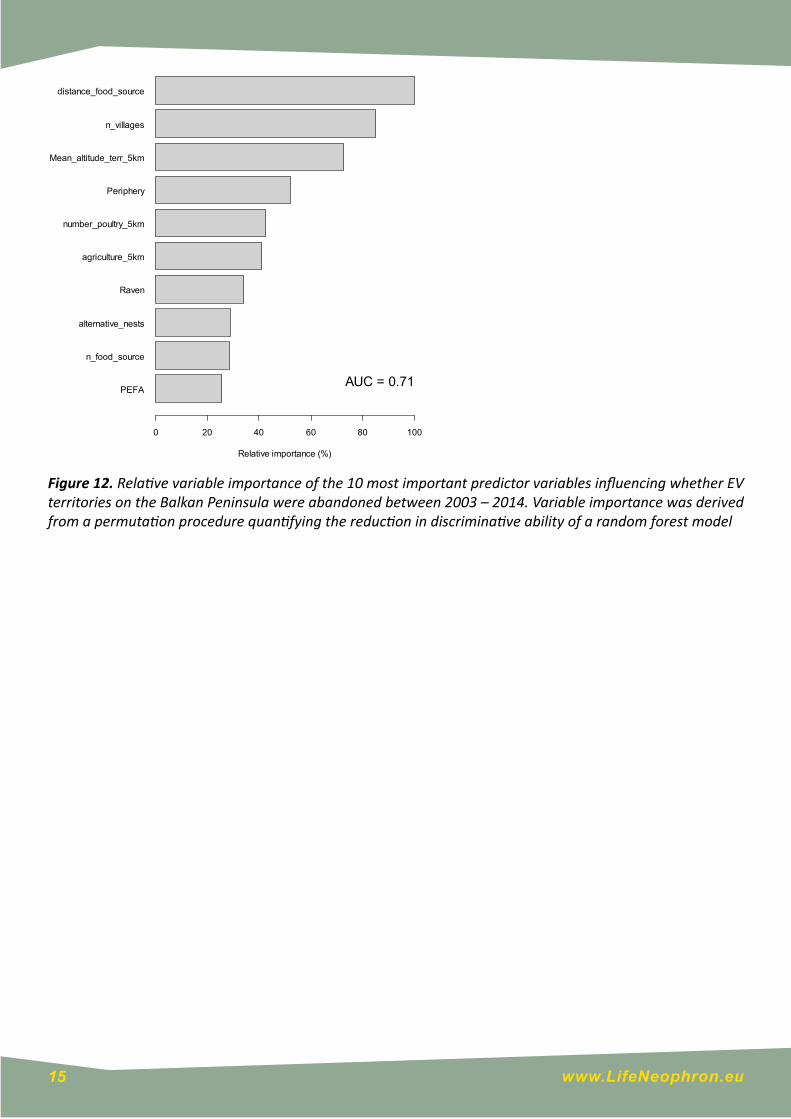
Of the 87 originally occupied territories that were monitored during our study, 43 had been abandoned by 2014 (49%). The model examining the influence of environmental variables on territory abandonment had reasonable discriminative ability (AUC = 0.710 ± 0.056), and indicated that territories that were closer to a reliable food source, within the core distribution region, and at lower elevation were more likely to have persisted until 2014 (Figs. 12 and 13). Territories were also more likely to have persisted if they had a larger number of villages within a 5 km radius around the nest (Fig. 12).
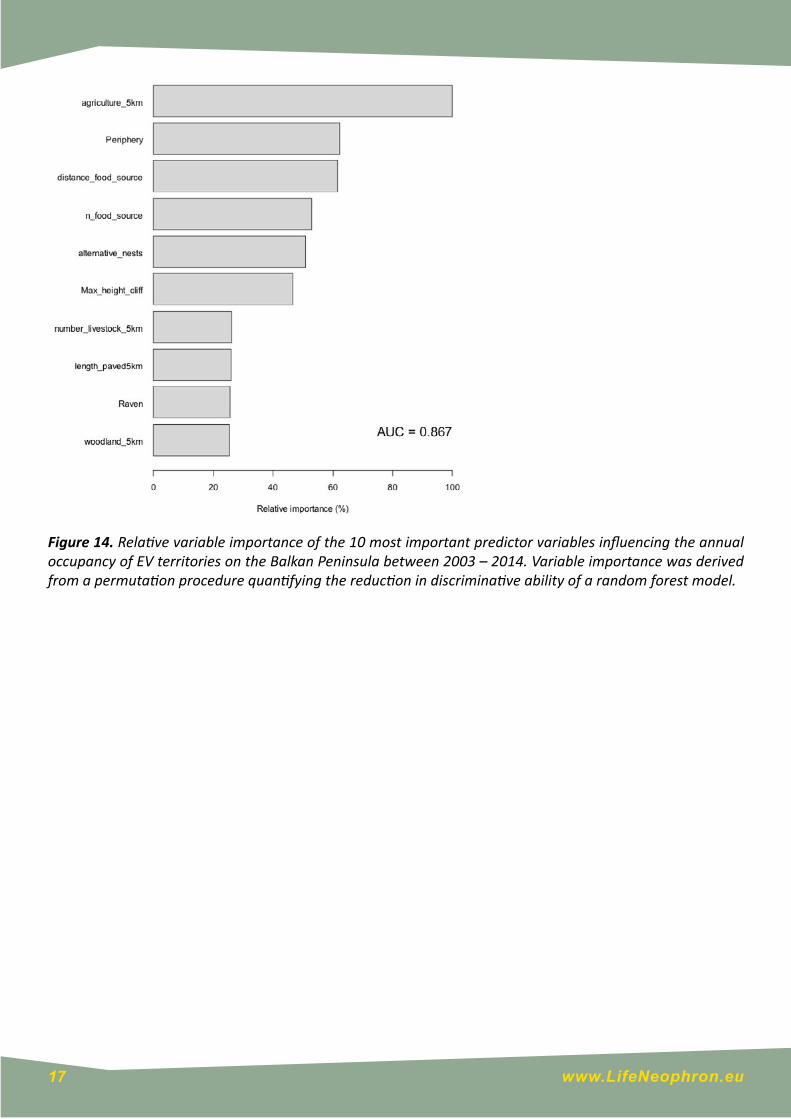
Annual occupancy ranged from 100% of all monitored territories in 2003 (n = 17) to 47% of all monitored territories in 2014 (n = 71). Of the 766 territories monitored during the study period, 529 (69%) were occupied by at least one bird, and 497 (64.9%) were occupied by two birds. The model examining the influence of environmental variables on annual occupancy had good discriminative ability (AUC = 0.867 ± 0.008), and indicated that variables relating to food availability, geographic structure, and nesting opportunities were the most influential in distinguishing between occupied and unoccupied territories (Fig. 14). Ten variables achieved a relative variable importance of >25%, but no single variable reduced the discriminative ability of the model by >0.03 AUC units when randomly permuted (Annex 1). Consequently, the change in predicted probability of occupancy was relatively small across the scale of even the most important variables (Fig. 15)
15 www.LifeNeophron.eu
PEFA
n_food_source
alternative_nests
Raven
agriculture_5km
number_poultry_5km
Periphery
Mean_altitude_terr_5km
n_villages
distance_food_source
Relative importance (%)
0 20 40 60 80 100
AUC = 0.71
Figure 12. Relative variable importance of the 10 most important predictor variables influencing whether EV territories on the Balkan Peninsula were abandoned between 2003 – 2014. Variable importance was derived from a permutation procedure quantifying the reduction in discriminative ability of a random forest model

16 www.LifeNeophron.eu
Figure 13. Predicted relationships between the 4 most influential environmental variables and the proportion of territories that were predicted to persist until 2014 if all other variables were held at their actual values.
17 www.LifeNeophron.eu
Figure 14. Relative variable importance of the 10 most important predictor variables influencing the annual occupancy of EV territories on the Balkan Peninsula between 2003 – 2014. Variable importance was derived from a permutation procedure quantifying the reduction in discriminative ability of a random forest model.

18 www.LifeNeophron.eu
Figure 15. Predicted relationships between the 6 most influential environmental variables and the proportion of territories that were predicted to be occupied if all other variables were held at their actual values.
Relationship between breeding success and environmental factors
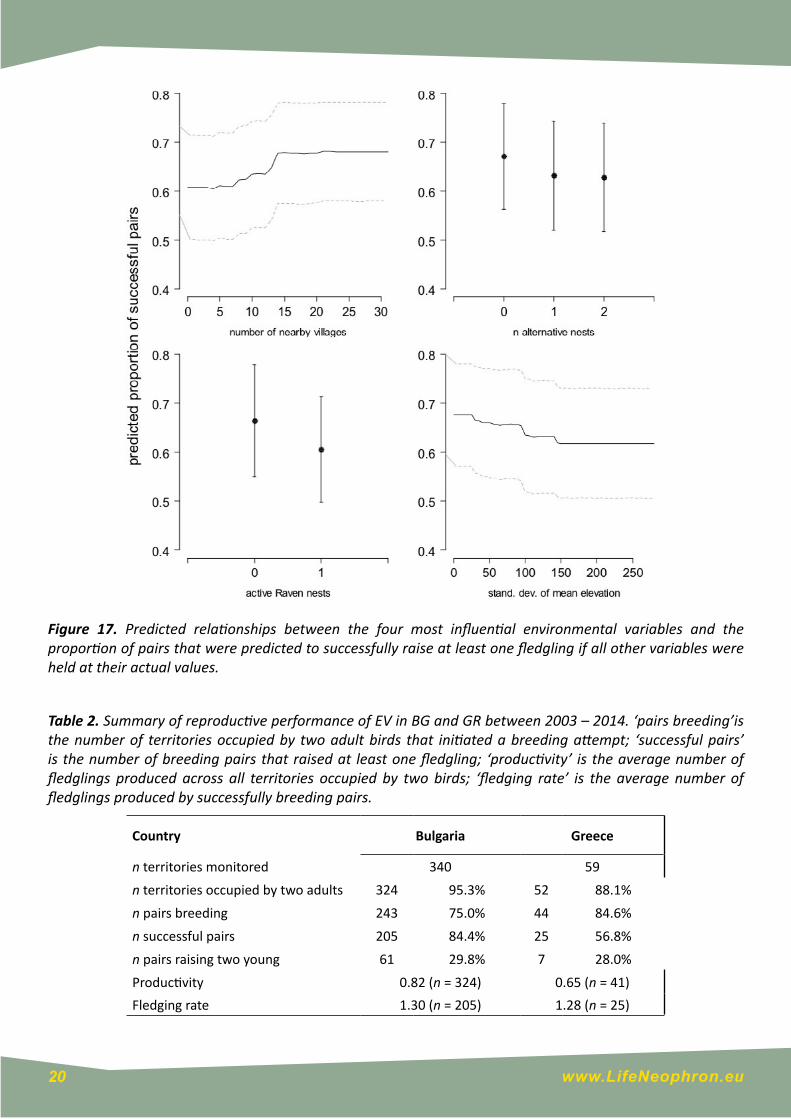
Of 399 territory-year combinations for which occupancy and breeding status information was available, 23 (5.8%) were only occupied by a single bird and in three further territories the final outcome could not be determined, and these territories were therefore excluded from calculations of breeding success. No breeding attempt was discovered in 89 occupied territories (23.7%, Table 2), and breeding success ranged from a minimum of 46.5% (in 2005) to a maximum of 76.5% (in 2008). Overall productivity (number of fledglings per occupied territory) was 0.79 (± 0.73 s.d), and the average number of fledglings per successful pair was 1.30 (± 0.46 s.d.) and ranged from 1.19 (in 2010) to 1.50 (in 2006; Table 2). The model examining the influence of environmental variables on breeding success had a reasonable discriminative ability (AUC = 0.737 ± 0.026). The variables with the greatest explanatory power related to disturbance, topography, and nesting opportunities (Fig. 16, Annex 1). Similar to the model describing occupancy, seven variables achieved a relative variable importance of >50%, but no single variable reduced the discriminative ability of the model by >0.02 AUC units when randomly permuted (Annex 1). Consequently, the increase in predicted breeding success was relatively small across the scale of even the most important variables (Fig. 17)

19 www.LifeNeophron.eu
Figure 16. Relative variable importance of the 10 most important predictor variables influencing the breeding success of EV on the Balkan Peninsula between 2003 – 2014. Variable importance was derived from a permutation procedure quantifying the reduction in discriminative ability of a random forest model.
20 www.LifeNeophron.eu
Figure 17. Predicted relationships between the four most influential environmental variables and the proportion of pairs that were predicted to successfully raise at least one fledgling if all other variables were held at their actual values.
Table 2. Summary of reproductive performance of EV in BG and GR between 2003 – 2014. ‘pairs breeding’is the number of territories occupied by two adult birds that initiated a breeding attempt; ‘successful pairs’ is the number of breeding pairs that raised at least one fledgling; ‘productivity’ is the average number of fledglings produced across all territories occupied by two birds; ‘fledging rate’ is the average number of fledglings produced by successfully breeding pairs.
Country Bulgaria Greece
n territories monitored 340 59
n territories occupied by two adults 324 95.3% 52 88.1%
n pairs breeding 243 75.0% 44 84.6%
n successful pairs 205 84.4% 25 56.8%
n pairs raising two young 61 29.8% 7 28.0%
Productivity 0.82 (n = 324) 0.65 (n = 41)
Fledging rate 1.30 (n = 205) 1.28 (n = 25)

21 www.LifeNeophron.eu
DISCUSSION
Egyptian vulture nest site and breeding cliff characteristics
The EV is a typical cliff nesting species and occupies caves, holes or cliff ledges (Ferguson-Lees & Christie 2006). We found that the majority of the nests that we studied are built in caves. This is in accordance to another study in northeastern GR where 71% of the pairs occupy caves and 29% occupy ledges (Vlachos et al. 1998). Caves and deep holes are more protected than the cliff ledges and may favor the incubation during bad weather conditions too. It is known that in the Griffon vulture the breeding success is influenced by the position of the nest on the breeding cliff and those on open ledges are the least successful (Lopez-Lopez et al. 2004).
Our results show that nests with southwestern exposition are the most preferred, followed by nests with western, southern and eastern exposition showing almost similar results. A study from BG shows that EV breeding in nests with eastern and southeastern exposition are most likely to raise chicks (Arkumarev 2014). At the same time results from our study support the results from other studies across the range of the species, and confirm that the Balkan population of the species has no different preferences towards the exposition and the type of the nest. Hence, there is no difference between the Balkan and other poulations of the species on this aspect of the breeding biology (Abuladze & Shergalin 1998; Liberatori & Penteriani 2001; Sara & Di Vittorio 2003). Most probably the preferences of the species towards “warm” expositions is due to a specific microhabitat and climatic conditions such as temperature, humidity, sunlight, etc. Nest with southwestern and southern expositions are warmer than the other and most probably favor the incubation, especially in cases of food shortage and worse weather conditions. In such cases sometimes both birds are foraging to restore the energy loss and thus eggs or chicks could be left longer without attendance.
The majority of the EV nests are chosen and built up to 10 m height, and almost all of the nests of the species in BG and GR can be found at no more than 30 m height. At the same time the nests are distributed more or less equally on cliffs with different size and height. Most probably building nests in the lower part of the cliffs, no matter the size, helps the species to avoid competition with other cliff nesting species, and on the other hand to protect its territory successfully towards intruders. The EV is disturbed and has lower breeding success when shares the breeding cliff with Griffon vultures (Carlon 1998). Except for the griffons, the raven is also a great competitor of the EV especially in the breeding cliffs. A study in the Eastern Rhodopes proves the raven as the main competitor of the species and most probably could compromise the breeding success (Dobrev 2010). Its foraging ability are suspected to cause breeding failures in the Bearded vulture in the Pyrenees (Margalida et al. 2003).
The EV on the Balkans is rapidly declining and it is exposed to many limiting factors with either natural or human induced origin (Velevski et al. 2015). And while some natural drivers of decreased breeding performance and/or mortality in the EV are difficult to be measured and controlled, human induced factors such as disturbance or/ and direct persecution, infrastructure and other activities can be solved. The disturbance in the vicinity of the nest of the EV is proved to have a negative impact on the breeding performance reducing the breeding success of the species especially in cases where the nest is more accessible and closer to a human settlement or area with intensive human activities (Carrete et al. 2007, Zuberogoitia et al. 2008, Inigo et al. 2009, Zuberogoitia et al. 2014). Different conservation approaches exist and have been tested in different species to migitate human impact especially in sensitive species such as the EV and the Imperial Eagle (Demerdzhiev et al. 2014, Zuberogoitia et al. 2014, Dobrev et al. 2016, 2016).
In small populations such as the Balkan population of the EV (Velevski et al. 2015) conservation measures to migitate limiting factors could play a positive role for the breeding success and the survival rate of the individuals, and because of the small population size, they can be individually orientated.
A conservation management strategies on a territory level can be the first step, sumarizing threats and suggesting decisions, especially on issues such as disturbance and lack of food. On the second hand, those nests which are more exposed to human disturbance can be guarded and artificially fed. Additionally a video

22 www.LifeNeophron.eu
surveillance and prohibition of activities such as climbing, para gliding, other extreme sports and any human activities, can be applied simultaneously (Demerdzhiev et al. 2014, Zuberogoitia et al. 2014, Dobrev et al. 2016, 2016).
Egyptian vulture habitat in Bulgaria and Greece
Over most of its‘ range, the species nests in montane open country, lowlands with canyons or plateaus, often in arid and mountainous regions, but also along beaches, river sand-banks and wetland edges, and frequently near human habitations: thus desert edge, the African Sahel, high rocky plains and ravines, steppe and other grasslands, open savannah(but not closed woodland), cultivation, rubbish dumps, harbors and villages (Ferguson-Lees & Christie 2001). Results from our study on the landscape features and composition in 1 km, 5 km and 30 km radius around EV nests in BG and GR show that there is no difference in the composition and the structure of the landscape features in the EV territories on a macro and micro level. A typical cliff nesting species the EV in BG and GR usually breeds along river valleys in mountainous regions which can explain the high percentage of forests in the Egyptian vulture habitat. More over especially in BG most of the nests are found in protected areas and natural parks with preserved forest habitats (Kurtev et al. 2007). The high proportion of natural habitats such as the shrubs and pastures is directly linked with the food availability of the species and that type of habitats are closely related to the diet of the species and the territory occupancy. Moreover the EV is an opportunistic scavenger and except for the carcasses, the species feed on small prey, usually abundant in shrub and grassland habitats (Dobrev et al. 2016). The high proportion of the arable lands is a consequence of the anthropogenic pressure, the lack of natural habitats, high habitat fragmentation and reduced habitat diversity, and where food availability seems to be low and the illegal use of poison to control predators is a common practice (Carrete et al. 2007, Skartsi et al. 2014). This is especially valid for the north of BG where the proportion of the arable lands is higher than in the Rhodopes and only several pairs of the species persist.
Our results show that heterogeneity of the landscape features in southern BG is greater than in the north even though the most fragmented features both in the north and in the south are the natural habitats – shrubs and grasslands. This is a main difference between the two surviving clusters of the species in BG – the core area in the south, and the periphery in the north of BG (Velevski et al. 2014). In northern BG in contrast to the south, most of the habitats are homogenous arable lands, hereafter a lesser diversity of habitats and a decreased area of natural habitats important for the EV as a foraging area. The decreased food availability due to habitat loss could induce a greater mortality in the EV. Birds will be forced to cover a greater distances to find food or to use alternatives such as dump sites, road kills or preys in agricultural landscape where the probability of poisoning is higher (Skartsi et al. 2014). Hence, the habitat in the EV territories is linked with the quality of the territory and the heterogeneous habitats usually offers better breeding and foraging opportunities. In addition, higher-quality territories are usually occupied more consistently than those of poorer quality (Carrete et al. 2007 ), and will therefore attract conspecific recruits in their vicinity. The persistence and attraction of high-quality territories is the possible underlying mechanism behind the cluster formation in EVterritories in the Balkans (Velevski et al. 2015). This is the case with the core area in the south of BG and the periphery of the population in northern BG. EV are known for their high natal philopatry (Carrete et al. 2007 , Grande et al. 2009 ), which may explain the persistence of remote territories. However, increasingly isolated clusters in the periphery with few pairs face higher extinction probability in comparison to the pairs in the core area due to demographic, environmental, and potentially genetic stochasticity (Velevski et al. 2015).
The EV in BG and GR survives in areas where natural habitats such as shrubs and grasslands dominate together with a greater diversity of habitats and heterogeneity. A key factor for conservation of the species in the remaining clusters in the Balkans is the sustainment of the natural habitats important for the species – pastures, shrubs and grasslands where the availability of food is higher. Forest habitats are the dominant ladnscape feature in the EV territories in BG and GR. In most of the cases the teritories of the speies in both countries are covered by protected areas where the conservation of the habitat is a baseline in the

23 www.LifeNeophron.eu
management plan of the protected area. This is the case with the majority of the territories in GR and BG. In most of these protected areas forest habitats are a priorty for conservation and were the reason to establish the protected area itself. So generally the forests coverage in EV territories have helped for the establishment of protected areas around . More conservation efforts can be addressed to help development of conservation management plans for protected areas and IBAs where the species occur . And since forest habitats cover large area in EV territories more cooperation with Forest agencies should be enforced, especially in areas where nests of the species are outside protected areas. This is especially valid if nests are close to forests under intensive forestry management and where forestry activities can cause disturbance of the nest or/and destruction of the habitat in the vicinity of the nest. An agri-environmental measure for the EV in BG exists aiming conversion of arable lands into pastures in order to ensure favorable habitat for the species. Together with the agri-environmental measure, another tool applied to support the species’ survival is subsidizing livestock breeders. There is a direct link between the livestock breeders and the EV, and the sustainment of the natural habitats on the other hand.
Territory occupancy and breeding success are affected by a wide range of environmental variables
Territory occupancy and breeding success of EV on the Balkan Peninsula are affected by a wide range of environmental variables relating to topography, nest and food availability, and disturbance, each of which has a small effect that may not be the same across political boundaries. As a consequence, simple approaches to modify habitats or manage resources based on a small number of environmental variables are unlikely to be effective conservation management approaches that will considerably slow the decline of the species.
During the 12 years of monitoring covered here, almost 50% of EV territories were abandoned, despite reproductive output being generally similar to other western Palaearctic populations (Liberatori and Penteriani 2001, Donázar et al. 2002, García-Ripollés et al. 2006, Lieury et al. 2015). We found that territory abandonment was only partially predictable, and that territories closer to the core population centre and within close proximity to a reliable food source were the most likely territories to persist. The most influential variables are all consistent with the conditions in the Eastern Rhodopes, which is the remaining stronghold of the species on the Balkan Peninsula (Velevski et al. 2015). The lack of very strong drivers that can plausibly explain territory abandonment may indicate that population declines could be partly caused by adult and juvenile mortality away from breeding grounds. EV may suffer considerable mortality during migration (Grande et al. 2009, Angelov et al. 2013, Oppel et al. 2015), and some territory abandonment could be a consequence of random mortality outside the breeding season. Alternatively, territory abandonment could also result from mortality during the breeding season that is poorly captured by the environmental variables available for our analysis, for example the illegal use of poison (Skartsi et al. 2014), the direct persecution of raptors, or accidental mortality in wind turbines (Carrete et al. 2009).
Territory abandonment in EV has previously been described as a consequence of various landscape factors (Carrete et al. 2007, Hernández and Margalida 2009, Olea and Mateo-Tomás 2011), and our analysis supports these findings. We found that the most influential variables affecting annual occupancy related to food availability and the availability of suitable nesting sites. Probability of occupancy was higher if the surrounding landscape had fewer areas dedicated to agriculture, which is consistent with the pattern observed in Spain (Carrete et al. 2007). This apparent negative effect of agriculture might be a consequence of the relatively low abundance of suitable prey items found in agricultural areas (Nikolov 2010; Dobrev et al. 2016), regular disturbance by agricultural activities, or the widespread use and misuse of agro-chemicals that could lead to secondary poisoning (Gradinarov and Difova 2014; Skartsi et al. 2014). Similarly, the number of reliable food sources within a 5 km radius and the distance to the nearest reliable food source both had a positive influence on occupancy, because they increase availability and accessibility of food and may thus favour the selection of territories (López-López et al. 2014). Territories were also more likely to be occupied if they contained higher cliffs with a larger number of alternative nest sites, which reflects the availability of suitable nesting substrate for individual birds to select (Liberatori and Penteriani 2001, Donázar et al. 2002, Mateo-

24 www.LifeNeophron.eu
Tomás et al. 2010).
Effect of disturbance
Human disturbance has been recognised as a prominent factor for territory abandonment of vultures (Carrete et al. 2007, Zuberogoitia et al. 2014, Krüger et al. 2015). We found little evidence that factors associated with human pressure influenced the occupancy of territories, and found that both territory persistence and breeding success actually increased with an increasing number of villages in a 5 km radius around the nest. Although the number of settlements and human disturbance have been shown to explain territory abandonment of vultures in South Africa (Krüger et al. 2015) and decrease breeding success in Spain (Zuberogoitia et al. 2014), a larger number of villages may be reflective of traditional rural landscapes with many small livestock farms that are a more suitable cultural landscape than larger and increasingly urbanised human population centres. Because many small villages have been abandoned in BG, the attraction of remaining small livestock herds which can act as local food sources may be stronger than the repelling nature of human disturbance. EV are frequently observed feeding on scraps in small farm yards, and the remains of small-scale livestock farming in rural villages can likely be used by vultures to feed chicks and therefore increase breeding success. However, we found some evidence that disturbance by another cliff-nesting species, the Common Raven, may reduce breeding success of EV. Ravens are known for their aggressive and klepto-parasitic abilities, and can reduce breeding success of raptors (Bertran and Margalida 2004, Brambilla et al. 2004). Because neither of the most important variables explaining breeding success had a very strong effect, and neither is amenable to management, designing efficient conservation management to increase the productivity of EVs on the Balkan peninsula will be challenging (Oppel et al. 2016).
Conclusions
In conclusion, EV in BG and GR are affected by a broad suite of landscape variables that influence the availability of food and nesting sites, but the complex interaction between a large number of different factors renders it unlikely that targeted action to manage certain aspects of the landscape will have immediate and substantial success in reverting population declines. We recommend a thorough evaluation of existing management techniques, and advocate for the conservation of traditional rural farming landscapes with many small livestock holders, relatively few areas devoted to agriculture, and many small feeding stations where animal carcasses are regularly disposed of to replicate the historical patchy spatio-temporal distribution of prey.
On a territory level the EV generally suffers anthropogenic pressure linked mostly with disturbance and direct persecution. However a combination of individually targeted conservation actions can potentially have a positive effect on the breeding parameters and the survival rates o the species in the breeding grounds. On the other hand, a management plans and agrienvironmental measures to support the main habitats of the speies would help the conservation of the habitats and the persistence of the high-quality territories of the EV on the Balkans.
ACkNOwLEDGEMENTS
We acknowledge the support of colleagues helping to monitor territories and obtaining datasets needed from public bodies, in particular Ivaylo Angelov, Saniye Mumun, Dobromir Dobrev, Tsvetomira Angelova, Theodora Skartsi, Antonios Venetakis, Antonia Galanaki, Giannis Chondros, Dimitris Vavylis, Lavrentis Sidiropoulos . This work was initiated and financially supported by the LIFE+ project “The Return of the Neophron” (LIFE10 NAT/BG/000152) funded by the European Union and co-funded by the A.G. Leventis Foundation and MAVA Foundation.

25 www.LifeNeophron.eu
REfERENCES
Abuladze, A., Shergalin, J. 1998. The Egyptian vulture (Neophron percnopterus) in the former USSR. – In: Chancellor, R. D., Meyburg, B., Ferrer, J. J. (Eds). Holarctic birds of prey. Adenex-World Working Group on Birds of prey and Owls. Calamonte: IGRAEX C.B., pp. 183-195.
Angelov, I, Hashim, I, Oppel S (2013) Persistent electrocution mortality of Egyptian Vultures Neophron percnopterus over 28 years in East Africa. Bird Conserv Int 23:1-6
Arino O et al. (2012) Global land cover map for 2009 (GlobCover 2009). In. European Space Agency (ESA) & Université catholique de Louvain (UCL)
Arkumarev, V. 2014. Breeding parameters in the Egyptian vulture in Bulgaria. University of Plovdiv, Bulgaria, Diploma thesis, 70pp.
Arkumarev V, Dobrev V, Abebe YD, Popgeorgiev G, Nikolov SC (2014) Congregations of wintering Egyptian Vultures Neophron percnopterus in Afar, Ethiopia: present status and implications for conservation. Ostrich 85:139-145
Bertran J, Margalida A (2004) Interactive behaviour between Bearded Vultures Gypaetus barbatus and Common Ravens Corvus corax in the nesting sites: predation risk and kleptoparasitism. Ardeola 51:269-274
Boshoff AF, Minnie JC, Tambling CJ, Michael MD (2011) The impact of power line-related mortality on the Cape Vulture Gyps coprotheres in a part of its range, with an emphasis on electrocution. Bird Conserv Int 21:311-327
Brambilla M, Rubolini D, Guidali F (2004) Rock climbing and Raven Corvus corax occurrence depress breeding success of cliff-nesting Peregrines Falco peregrinus. Ardeola 51:425-430
Breiman L (2001) Random forests. Mach Learn 45:5-32
Carlon, J. 1998. Resurgence of Egyptian Vultures in western Pyrenees, and relationship with Griffon Vultures. British Birds 91:409-416.
Carrete M et al. (2007) Habitat, human pressure, and social behavior: Partialling out factors affecting large-scale territory extinction in an endangered vulture. Biol Conserv 136:143-154
Carrete M, Sánchez-Zapata JA, Benítez JR, Lobón M, Donázar JA (2009) Large scale risk-assessment of wind-farms on population viability of a globally endangered long-lived raptor. Biol Conserv 142:2954-2961
Chaudhary A et al. (2012) Population trends of critically endangered Gyps vultures in the lowlands of Nepal. Bird Conserv Int 22:270-278
Cord A, Rodder D (2011) Inclusion of habitat availability in species distribution models through multi-temporal remote-sensing data? Ecol Appl 21:3285-3298
Cutler DR et al. (2007) Random Forests for classification in ecology. Ecology 88:2783-2792
de Lucas M, Ferrer M, Bechard MJ, Muñoz AR (2012) Griffon vulture mortality at wind farms in southern Spain: Distribution of fatalities and active mitigation measures. Biol Conserv 147:184-189
Demerdzhiev, D., Stoychev, S., Dobrev, D., Spasov, S. & Terziev, N. 2014. Conservation measures undertaken to improve the population status of eastern imperial eagle (Aquila heliaca) in Bulgaria. Slovac Raptor Journal 8: 27-39.
Dobrev 2010. Behavior of the Egyptian vulture in the pre-laying period. University of Plovdiv, Bulgaria. Diploma thesis, 56pp.
Dobrev, V., Kret, E., Skartsi, T., Saravia, V., Bounas, A., Oppel, S. & Nikolov, S.C. 2016. Nest-guarding of the Egyptian vulture (Neophron percnopterus) in Bulgaria and Greece (2012-2015). Technical report under action C5 of the LIFE+ project “The Return of the Neophron” (LIFE10 NAT/BG/000152). BSPB, Sofia. 13 p.
26 www.LifeNeophron.eu
Dobrev, V., Kret, E., Skartsi, T., Saravia, V., Bounas, A., Oppel, S. & Nikolov, S.C. 2016. Individual supplementary feeding of the Egyptian vulture (Neophron percnopterus) in Bulgaria and Greece (2012-2015). Technical report under action C4 of the LIFE+ project “The Return of the Neophron” (LIFE10 NAT/BG/000152). BSPB, Sofia. 12 p.
Dobrev V et al. (2016) Diet is not related to productivity but to territory occupancy in a declining population of Egyptian Vultures Neophron percnopterus. Bird Conserv Int in press
Donázar JA, Cortés-Avizanda A, Carrete M (2010) Dietary shifts in two vultures after the demise of supplementary feeding stations: consequences of the EU sanitary legislation. Eur J Wildl Res 56:613-621
Donázar JA, Palacios CJ, Gangoso L, Ceballos O, González MJ, Hiraldo F (2002) Conservation status and limiting factors in the endangered population of Egyptian vulture (Neophron percnopterus) in the Canary Islands. Biol Conserv 107:89-97
European Environment Agency (EEA) 2013. Digital Elevation Model over Europe (EU-DEM). Copernicus programme, European Comission, DG Enterprice and Industry, www.eea.europa.eu.
ESRI 2011. ArcGIS Desktop: Release 10. Redlands, CA: Environmental Systems Research Institute
Fernández-Delgado M, Cernadas E, Barro S, Amorim D (2014) Do we need hundreds of classifiers to solve real world classification problems? J Mach Learn Res 15:3133-3181
Fisher, N.I. 1995. Statistical Analysis of Circular Data. Cambridge University Press, Cambridge.
Freeman EA, Moisen G (2008) PresenceAbsence: An R package for presence absence analysis. Journal of Statistical Software 23:1-31
Galipaud M, Gillingham MAF, David M, Dechaume-Moncharmont F-X (2014) Ecologists overestimate the importance of predictor variables in model averaging: a plea for cautious interpretations. Meth Ecol Evol 5:983–991
Galligan TH et al. (2014) Have population declines in Egyptian Vulture and Red-headed Vulture in India slowed since the 2006 ban on veterinary diclofenac? Bird Conserv Int in press:1-10
García-Ripollés C, López-López P, Penteriani V (2006) Population size and breeding performance of Egyptian vultures (Neophron percnopterus) in Eastern Iberian Peninsula. J Raptor Res 40:217-221
Gradinarov D, Difova E (2014) Use of pesticides, chemicals and poisons in the region of Rusenski Lom Nature Park. Bulgarian Society for the Protection of Birds, Sofia, Bulgaria, 1-13
Grande JM et al. (2009) Survival in a long-lived territorial migrant: effects of life-history traits and ecological conditions in wintering and breeding areas. Oikos 118:580-590
Green RE et al. (2004) Diclofenac poisoning as a cause of vulture population declines across the Indian subcontinent. J Appl Ecol 41:793-800
Grömping U (2009) Variable importance assessment in regression: Linear regression versus Random Forest. Am Stat 63:308-319
Grubač B, Velevski M, Avukatov V (2014) Long-term population decrease and recent breeding performance of the Egyptian Vulture Neophron percnopterus in Macedonia. North-West J Zool 10:25-32
Grubb TG, King RM (1991) Assessing human disturbance of breeding Bald Eagles with classification tree models. J Wildl Manag 55:500-511
Hapfelmeier A, Hothorn T, Ulm K (2012) Recursive partitioning on incomplete data using surrogate decisions and multiple imputation. Comput Stat Data An 56:1552-1565
Hapfelmeier A, Hothorn T, Ulm K, Strobl C (2014) A new variable importance measure for random forests with missing data. Statistics and Computing 24:21-34

27 www.LifeNeophron.eu
Hernández M, Margalida A (2008) Pesticide abuse in Europe: effects on the Cinereous vulture (Aegypius monachus) population in Spain. Ecotoxicology 17:264-272
Hernández M, Margalida A (2009) Poison-related mortality effects in the endangered Egyptian vulture (Neophron percnopterus) population in Spain. Eur J Wildl Res 55:415-423
Hochachka WM et al. (2007) Data-mining discovery of pattern and process in ecological systems. J Wildl Manag 71:2427-2437
Hothorn T, Hornik K, Zeileis A (2006a) party: A Laboratory for Recursive Part(y)itioning. Available at: http://CRAN.R-project.org/, accessed
Hothorn T, Hornik K, Zeileis A (2006b) Unbiased recursive partitioning: A conditional inference framework. J Comput Graph Stat 15:651-674
Iankov P. (Ed.) 2007. Atlas of breeding birds inBulgaria. Sofia, Bulgaria (Bulgarian Society for the Protection of Birds). 679 p.
Janitza S, Strobl C, Boulesteix A-L (2013) An AUC-based permutation variable importance measure for r
andom forests. BMC Bioinformatics 14:119
Kamp J, Urazaliev R, Donald PF, Hölzel N (2011) Post-Soviet agricultural change predicts future declines after recent recovery in Eurasian steppe bird populations. Biol Conserv 144:2607-2614
Kret, E., Saravia, V., Dobrev, V., Popgeorgiev & Nikolov S. C. 2016. Assessment of major threats in Natura 2000 sites for the Egyptian Vulture (Neophron percnopterus) in Bulgaria and Greece (2012-2015). Fact sheet under action A3 of the LIFE+ project “The Return of the Neophron” (LIFE10 NAT/BG/000152). WWF Greece, Athens. 8 p. Available at: http://lifeneophron.eu/files/docs/1459798853_643.pdf
Krüger SC, Simmons RE, Amar A (2015) Anthropogenic activities influence the abandonment of Bearded Vulture (Gypaetus barbatus) territories in southern Africa. The Condor 117:94-107
Kurtev, M., Angelov, I. & Iankov, P. 2008. Action plan for the conservation of the Egyptian vulture in Bulgaria. Sofia, BSPB. 76 p.
Kurtev, M., Vatev, I. & Demerdzhiev, D. 2015. Egyptian vulture. In: Golemanski, V. (ed.) Red Data Book of Republic of Bulgaria. Second Edn. Vol. 2. Animals. BAS & MOEW, Sofia. 383 p.
Liberatori F, Penteriani V (2001) A long-term analysis of the declining population of the Egyptian vulture in the Italian peninsula: distribution, habitat preference, productivity and conservation implications. Biol Conserv 101:381-389
Lieury N, Gallardo M, Ponchon C, Besnard A, Millon A (2015) Relative contribution of local demography and immigration in the recovery of a geographically-isolated population of the endangered Egyptian vulture. Biol Conserv 191:349-356
Lopez-Lopez, P., Garcia-Ripolles, C., Verdejo, J. 2004. Population status and reproductive performance of Eurasian Griffons (Gyps fulvus) in Eastern Spain. Journal of Raptor Research, 38(4): 350-356.
López-López P, García-Ripollés C, Urios V (2014) Food predictability determines space use of endangered vultures: implications for management of supplementary feeding. Ecol Appl 24:938-949
Ministry of Agriculture and Food (MAF) 2015. A guide of identification of colourful ortophoto maps during production of land covers of the country with physical blocks. Ministry of Agriculture and Food, An identification guide.
Margalida A, Benitez JR, Sanchez-Zapata JA, ÁVila E, Arenas R, DonÁZar JA (2012) Long-term relationship between diet breadth and breeding success in a declining population of Egyptian Vultures Neophron percnopterus. Ibis 154:184-188
Margalida A, Colomer MÀ, Oro D (2014) Man-induced activities modify demographic parameters in a long-

28 www.LifeNeophron.eu
lived species: effects of poisoning and health policies. Ecol Appl 24:436-444
Margalida A, Garcia D, Bertran J, Heredia R (2003) Breeding biology and success of the Bearded Vulture Gypaetus barbatus in the eastern Pyrenees. Ibis 145:244-252
Margalida A, Heredia R, Razin M, Hernández M (2008) Sources of variation in mortality of the Bearded Vulture Gypaetus barbatus in Europe. Bird Conserv Int 18:1-10
Mateo-Tomás P, Olea PP, Fombellida I (2010) Status of the Endangered Egyptian vulture Neophron percnopterus in the Cantabrian Mountains, Spain, and assessment of threats. Oryx 44:434-440
Mateo-Tomás P, Olea PP, Sánchez-Barbudo IS, Mateo R (2012) Alleviating human–wildlife conflicts: identifying the causes and mapping the risk of illegal poisoning of wild fauna. J Appl Ecol 49:376-385
Nikolov SC (2010) Effects of land abandonment and changing habitat structure on avian assemblages in upland pastures of Bulgaria. Bird Conserv Int 20:200-213
Oaks JL et al. (2004) Diclofenac residues as the cause of vulture population decline in Pakistan. Nature 427:630-633
Ogada DL, Keesing F, Virani MZ (2012) Dropping dead: causes and consequences of vulture population declines worldwide. Ann N Y Acad Sci 1249:57-71
Olea PP, Mateo-Tomás P (2011) Spatially explicit estimation of occupancy, detection probability and survey effort needed to inform conservation planning. Div Distrib 17:714-724
Oppel S et al. (2016) Assessing the effectiveness of intensive conservation actions: Does guarding and feeding increase productivity and survival of Egyptian Vultures in the Balkans? Biol Conserv 198:157-164.
Oppel S et al. (2015) High juvenile mortality during migration in a declining population of a long-distance migratory raptor. Ibis 157:545-557
R Development Core Team (2014) R: a language and environment for statistical computing. Available at: http://www.R-project.org/, accessed 10 June 2014
Richardson CT, Miller CK (1997) Recommendations for protecting raptors from human disturbance: a review. Wildl Soc Bull 25:634-638
Rotenberry JT, Wiens JA (1980) Habitat structure, patchiness, and avian communities in North American steppe vegetation: a multivariate analysis. Ecology 61:1228-1250
Sara, M., Di Vittorio, M. 2003. Factors influencing the distribution, abundance and nest-site selection of an endangered Egyptian vulture (Neophron percnopterus) population in Sicily. Animal Conservation, 6: 317-328.
Saravia, V., Kret, E., Dobrev, V. & Nikolov S. C. 2016. Assessment of mortality causes for the Egyptian Vulture (Neophron percnopterus) in Bulgaria and Greece (1997-2015). Fact sheet under action A1 of the LIFE+ project “The Return of the Neophron” (LIFE10 AT/BG/000152). HOS, Athens. 6 p. Available at: http://lifeneophron.eu/files/docs/1458633848_518.pdf
Seoane J, Viñuela J, Dıaz-Delgado R, Bustamante J (2003) The effects of land use and climate on red kite distribution in the Iberian peninsula. Biol Conserv 111:401-414
Skartsi T., Dobrev V., Oppel S., Kafetzis A., Kret E., Karampatsa R., Saravia V., Bounas T., Vavylis D., Sidiropoulos L., Arkumarev V., Dyulgerova S. & Nikolov S. C. (2014) Assessment of the illegal use of poison in Natura 2000 sites for the Egyptian Vulture in Greece and Bulgaria during the period 2003-2012. Technical report under action A3 of the LIFE+ project “The Return of the Neophron” (LIFE10 NAT/BG/000152). WWF Greece, Athens. 75 p.
StatSoft 2004. STATISTICA (data analysis software system), version 7.www.statsoft.com.
Strobl C, Boulesteix A-L, Kneib T, Augustin T, Zeileis A (2008) Conditional variable importance for random forests. BMC Bioinformatics 9:307
29 www.LifeNeophron.eu
Strobl C, Boulesteix A-L, Zeileis A, Hothorn T (2007) Bias in random forest variable importance measures: Illustrations, sources and a solution. BMC Bioinformatics 8:25-45
Thiollay J-M (2006) The decline of raptors in West Africa: long-term assessment and the role of protected areas. Ibis 148:240-254
Velevski M, Grubac B, Tomovic L (2014) Population viability analysis of the Egyptian Vulture Neophron percnopterus in Macedonia and implications for its conservation. Acta Zool Bulg 66:43-58
Velevski M et al. (2015) Population decline and range contraction of the Egyptian Vulture Neophron percnopterus on the Balkan Peninsula. Bird Conserv Int 25:440 - 450
Virani MZ, Kendall C, Njoroge P, Thomsett S (2011) Major declines in the abundance of vultures and other scavenging raptors in and around the Masai Mara ecosystem, Kenya. Biol Conserv 144:746-752
Vlachos, C.G., Papageorgiou, N.K., Bakaloudis, D.E. 1998. Effects of the Feeding Station Establishment on the Egyptian Vulture Neophron percnopterus in Dadia Forest, North Eastern Greece. - In: Chancellor, R. D., Meyburg B. U., Ferrero, J.J. (Eds.). Holarctic Birds of Prey, Proceedings of an International Conference. ADENEX-WWGBP, Mérida & Berlin, pp. 197-207.
Xirouchakis, S. (in prep.). National Action Plan for the Egyptian Vulture in Greece. Hellenic Ornithological Society, Athens.
Zuberogoitia, I., Zabala J.,Martinez J.A.,Martinez J.E., Azkona A. 2008. Effect of human activities on Egyptian vulture breeding success. Animal Conservation, 11: 313-320.
Zuberogoitia I, Zabala J, Martínez JE, González-Oreja JA, López-López P (2014) Effective conservation measures to mitigate the impact of human disturbances on the endangered Egyptian vulture. Anim Conserv 17:410-418
30 www.LifeNeophron.eu
ANNExES
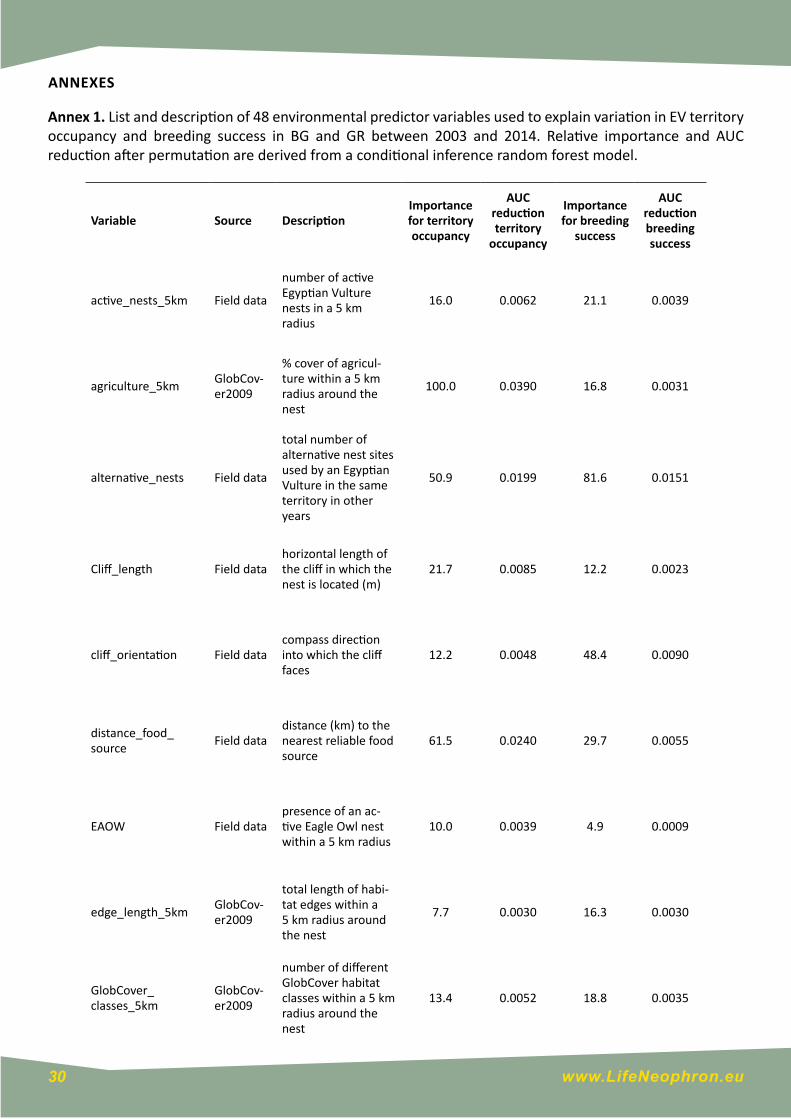
Annex 1. List and description of 48 environmental predictor variables used to explain variation in EV territory occupancy and breeding success in BG and GR between 2003 and 2014. Relative importance and AUC reduction after permutation are derived from a conditional inference random forest model.
Variable Source DescriptionImportance for territory occupancy
AUC reduction territory
occupancy
Importance for breeding
success
AUC reduction breeding success
active_nests_5km Field data
number of active Egyptian Vulture nests in a 5 km radius
16.0 0.0062 21.1 0.0039
agriculture_5kmGlobCov-er2009
% cover of agricul-ture within a 5 km radius around the nest
100.0 0.0390 16.8 0.0031
alternative_nests Field data
total number of alternative nest sites used by an Egyptian Vulture in the same territory in other years
50.9 0.0199 81.6 0.0151
Cliff_length Field datahorizontal length of the cliff in which the nest is located (m)
21.7 0.0085 12.2 0.0023
cliff_orientation Field datacompass direction into which the cliff faces
12.2 0.0048 48.4 0.0090
distance_food_source
Field datadistance (km) to the nearest reliable food source
61.5 0.0240 29.7 0.0055
EAOW Field datapresence of an ac-tive Eagle Owl nest within a 5 km radius
10.0 0.0039 4.9 0.0009
edge_length_5kmGlobCov-er2009
total length of habi-tat edges within a 5 km radius around the nest
7.7 0.0030 16.3 0.0030
GlobCover_classes_5km
GlobCov-er2009
number of different GlobCover habitat classes within a 5 km radius around the nest
13.4 0.0052 18.8 0.0035
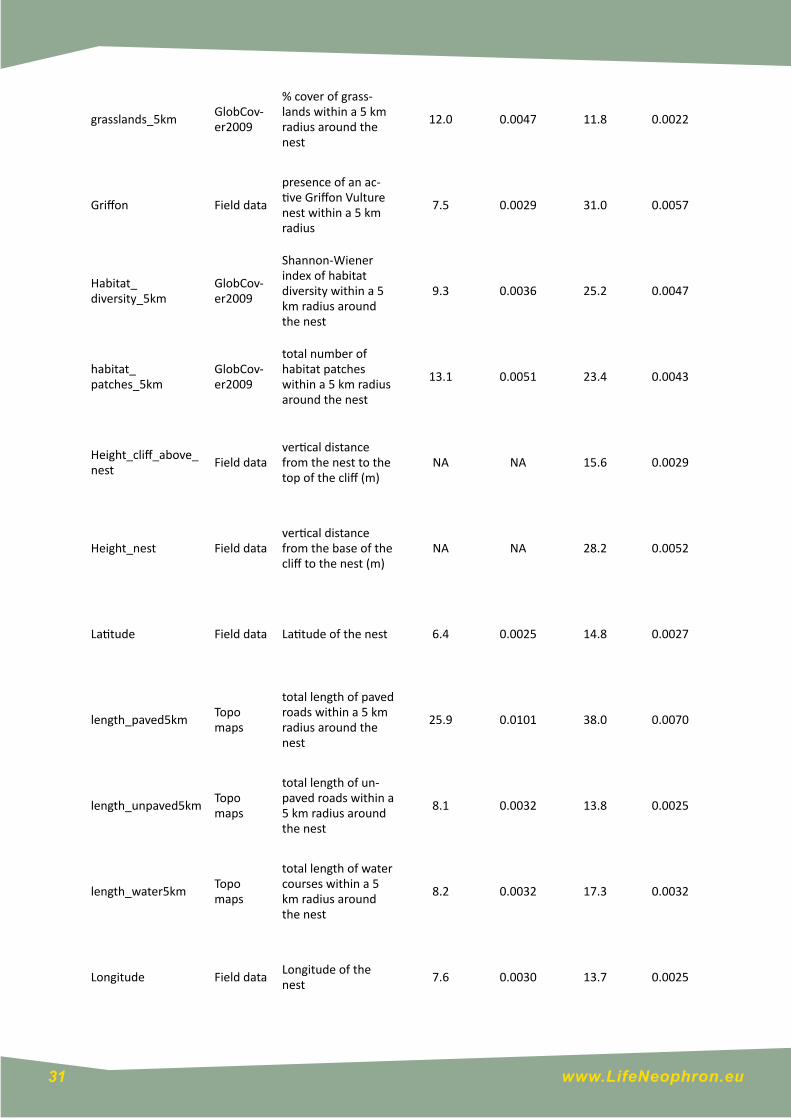
31 www.LifeNeophron.eu
grasslands_5kmGlobCov-er2009
% cover of grass-lands within a 5 km radius around the nest
12.0 0.0047 11.8 0.0022
Griffon Field data
presence of an ac-tive Griffon Vulture nest within a 5 km radius
7.5 0.0029 31.0 0.0057
Habitat_diversity_5km
GlobCov-er2009
Shannon-Wiener index of habitat diversity within a 5 km radius around the nest
9.3 0.0036 25.2 0.0047
habitat_patches_5km
GlobCov-er2009
total number of habitat patches within a 5 km radius around the nest
13.1 0.0051 23.4 0.0043
Height_cliff_above_nest
Field datavertical distance from the nest to the top of the cliff (m)
NA NA 15.6 0.0029
Height_nest Field datavertical distance from the base of the cliff to the nest (m)
NA NA 28.2 0.0052
Latitude Field data Latitude of the nest 6.4 0.0025 14.8 0.0027
length_paved5kmTopo maps
total length of paved roads within a 5 km radius around the nest
25.9 0.0101 38.0 0.0070
length_unpaved5kmTopo maps
total length of un-paved roads within a 5 km radius around the nest
8.1 0.0032 13.8 0.0025
length_water5kmTopo maps
total length of water courses within a 5 km radius around the nest
8.2 0.0032 17.3 0.0032
Longitude Field dataLongitude of the nest
7.6 0.0030 13.7 0.0025

32 www.LifeNeophron.eu
Max_height_cliff Field datamaximum height of the nesting cliff (m)
46.5 0.0182 18.4 0.0034
Mean_altitude_terr_5km
Digital elevation model
mean elevation of the territory (m above sea leavel)
11.6 0.0045 30.3 0.0056
Mean_slope_5kmDigital elevation model
mean slope of the terrain across the territory
17.1 0.0067 32.1 0.0059
n_food_source Field datanumber of reliable food sources in a 5 km radius
52.9 0.0207 26.3 0.0049
n_livestock_ownerAuthori-ties
number of livestock owners in a 5 km radius
11.5 0.0045 -1.0 -0.0002
n_villages GIS layersnumber of villages within a 5 km radius around the nest
21.6 0.0084 100.0 0.0185
n_wind_turb Field datanumber of wind turbines in a 20 km radius
11.1 0.0043 5.1 0.0009
Nest_orientation Field datacompass direction into which the nest entrance faces
NA NA 18.2 0.0034
Nest_type Field datanest type: cave, ledge,
NA NA 13.7 0.0025
number_livestock_2km
Authori-ties
number of livestock animals in a 2 km radius
22.7 0.0089 39.7 0.0073
number_livestock_5km
Authori-ties
number of livestock animals in a 5 km radius
26.1 0.0102 16.3 0.0030

33 www.LifeNeophron.eu
Number_of_people_in_nearest_village
Authori-ties
number of human inhabitants in the nearest village
10.6 0.0041 10.7 0.0020
number_poultry_2km
Authori-ties
number of poultry animals in a 2 km radius
1.5 0.0006 5.7 0.0010
number_poultry_5km
Authori-ties
number of poultry animals in a 5 km radius
1.0 0.0004 41.4 0.0077
open_ground_5kmGlobCov-er2009
% cover of unveg-etated soil within a 5 km radius around the nest
19.4 0.0076 33.4 0.0062
PEFA Field data
presence of an ac-tive Peregrine Falcon nest within a 5 km radius
14.2 0.0055 27.0 0.0050
PeripheryVelevski et al. 2015
whether the nest was located in the population core (Eastern Rhodopes) or in the periphery (elsewhere in BG or GR).
62.2 0.0243 8.1 0.0015
Poisoning_5kmSkartsi et al. 2014
number of known poisoning incidents reported in the past 10 years within a 5 km radius
8.0 0.0031 1.9 0.0004
PPI_5kmGlobCover 2009
primary productivity index derived from the normalised dif-ference vegetation index within a 5 km radius
17.7 0.0069 51.3 0.0095
Raven Field datapresence of an ac-tive Eagle Owl nest within a 5 km radius
25.6 0.0100 67.8 0.0125
SD_altitude_terr_5km
Digital elevation model
topographical rug-gedness expressed as standard devia-tion of mean eleva-tion in the territory
16.9 0.0066 61.5 0.0114
SD_slope_5kmDigital elevation model
topographical rug-gedness expressed as standard devia-tion of mean slope of the territory
18.1 0.0071 58.6 0.0108

34 www.LifeNeophron.eu
shrubland_5kmGlobCov-er2009
% cover of shrub and intermediate suc-cession vegetation within a 5 km radius around the nest
14.9 0.0058 21.8 0.0040
Total_people_5kmAuthori-ties
total number of human inhabitants within a 5 km radius around the nest
8.7 0.0034 13.7 0.0025
type_food_source Field data
type of the nearest reliable food source (e.g. slaughterhouse, feeding station, rub-bish dump etc.)
17.6 0.0069 18.0 0.0033
urban_5kmGlobCov-er2009
% cover of urban habitats within a 5 km radius around the nest
5.4 0.0021 18.5 0.0034
water_5kmGlobCov-er2009
% cover of open water bodies within a 5 km radius around the nest
5.2 0.0020 21.2 0.0039
woodland_5kmGlobCov-er2009
% cover of forest and tree plantations within a 5 km radius around the nest
25.4 0.0099 29.0 0.0054

35 www.LifeNeophron.eu
Annex 2. Land cover features and composition around Egyptian vulture nests, Bulgaria and Greece in 1 km, 5 km and 30 km radius. The polygons within the buffers were dissolved to aggregate bourdering polygons for each buffer range over all territories. Then polygons were converted from single part to multi part to calculate the total number of patches for a given landscape feature.
Annex 2.1. Land cover features and composition in 1 km buffer around Egyptian vulture nests, BulgariaLa
ndsc
ape
feau
ture
sN
umbe
r of p
atch
esPa
tche
s co
vera
ge in
%A
rea
size
in h
aA
rea
size
in %
Ave
rage
are
a si
ze_h
aM
inim
al a
rea
size
_ha
Max
imal
are
a si
ze_h
aSt
anda
rt d
evia
tion
Ara
ble
land
s10
96
1184
.96.
710
.90.
099
.518
.3A
reas
for S
port
and
Rec
reat
ion
10
2.3
0.0
2.3
2.3
2.3
0.0
Are
as w
ith o
ther
/ n
on a
gric
ultu
ral /
pur
pose
20
13.1
0.1
6.6
0.8
12.3
8.1
Are
as w
ith P
oor V
eget
atio
n11
160
.20.
35.
50.
225
.67.
8Bu
ilt-u
p ar
eas
outs
ide
the
sett
lem
ents
367
1917
9.1
1.0
0.5
0.0
13.6
1.3
Chan
nels
10
0.1
0.0
0.1
0.1
0.1
0.0
Fiel
d ro
ads,
live
stoc
k tr
eks
and
open
ings
533
36.4
0.2
0.7
0.0
6.2
1.1
Fore
st M
eado
ws
and
Past
ures
201
133.
10.
86.
70.
061
.614
.8Fo
rest
Ter
rito
ries
215
1110
943.
562
.050
.90.
090
9.8
105.
3G
ullie
s, R
avin
es a
nd G
roov
es26
111
3.8
0.6
4.4
0.0
66.3
12.9
Lake
s, D
ams
and
Pond
s22
132
0.6
1.8
14.6
0.0
146.
935
.4La
ndfil
l and
Tai
lings
10
0.9
0.0
0.9
0.9
0.9
0.0
Mix
ed la
nd u
se80
444
2.0
2.5
5.5
0.0
44.8
8.4
Nak
ed a
nd e
rode
d te
rrai
n1
00.
40.
00.
40.
40.
40.
0N
atur
al G
rass
land
s25
112
5.2
0.7
5.0
0.0
35.6
8.8
Nea
r Urb
an a
reas
10
1.2
0.0
1.2
1.2
1.2
0.0
Orc
hard
s1
01.
90.
01.
91.
91.
90.
0Pa
stur
es a
nd m
eado
ws
292
1598
2.9
5.6
3.4
0.0
56.4
6.1
Pere
nnia
ls (p
eren
nial
cro
ps)
30
2.9
0.0
1.0
0.7
1.2
0.2
Qua
rrie
s, o
pen
pits
and
Lan
dslip
20
4.6
0.0
2.3
2.0
2.6
0.4
Railw
ay li
nes
and
adja
cent
terr
itorie
s6
019
.50.
13.
31.
45.
11.
5Ri
vers
and
rive
rbed
s33
241
5.2
2.4
12.6
0.0
54.0
12.2
Sand
, gra
vel a
nd b
are
rock
s89
553
1.0
3.0
6.0
0.0
54.3
9.5
Shru
bs a
nd G
rass
ed T
erri
tori
es39
620
1723
.39.
84.
40.
014
0.6
12.8
Smal
l-sca
le n
on-a
gric
ultu
ral a
reas
181
0.6
0.0
0.0
0.0
0.1
0.0
Surf
aced
road
s an
d ne
ighb
orin
g te
rrito
ries
533
96.6
0.5
1.8
0.0
9.4
1.9
Tran
spor
t Inf
rast
ruct
ure
40
0.5
0.0
0.1
0.1
0.3
0.1
Urb
an S
truc
ture
s8
012
5.7
0.7
15.7
0.1
49.4
20.3
Vin
es11
123
.50.
12.
10.
17.
32.
2W
etla
nds
10
8.0
0.0
8.0
8.0
8.0
0.0
Yard
s10
65
153.
40.
91.
40.
019
.62.
8

36 www.LifeNeophron.eu
Annex 2.2. Land cover features and composition in 5 km buffer around Egyptian vulture nests, BulgariaLa
ndsc
ape
feau
ture
sN
umbe
r of p
atch
esPat
ches
cov
erag
e in
%A
rea
size
in h
aA
rea
size
in %
Ave
rage
are
a si
ze_h
aM
inim
al a
rea
size
_ha
Max
imal
are
a si
ze_h
aSt
anda
rt d
evia
tion
Ara
ble
land
s30
704
986
0886
.328
.028
.00.
037
11.4
83.2
Are
as fo
r Spo
rt a
nd R
ecre
atio
n41
80
2199
.70.
15.
30.
022
1.3
18.9
Are
as w
ith o
ther
/ n
on a
gric
ultu
ral /
pur
pose
202
047
51.1
0.2
23.5
0.0
1262
.096
.6A
reas
with
Poo
r Veg
etat
ion
1378
012
937.
20.
49.
40.
032
7.1
23.4
Bord
er w
ater
are
as9
041
6.6
0.0
46.3
0.4
314.
910
2.2
Brow
nfie
lds
270
144.
60.
05.
40.
236
.19.
5Bu
ilt-u
p ar
eas
outs
ide
the
sett
lem
ents
1118
4632
6705
5.5
2.2
0.6
0.0
789.
94.
7Ch
anne
ls22
211
7006
.70.
23.
20.
069
.45.
4Fi
eld
road
s, li
vest
ock
trek
s an
d op
enin
gs12
757
413
840.
10.
51.
10.
054
.82.
2Fo
rest
Mea
dow
s an
d Pa
stur
es61
70
3430
.90.
15.
60.
110
52.0
45.5
Fore
st T
erri
tori
es11
227
312
0481
6.5
39.2
107.
30.
085
056.
011
15.7
Gro
up L
ine
Obj
ects
(Gor
ge)
280
023
37.4
0.1
8.3
0.1
149.
516
.9G
ullie
s, R
avin
es a
nd G
roov
es48
441
2445
4.9
0.8
5.0
0.0
153.
38.
6La
kes,
Dam
s an
d Po
nds
3985
125
777.
20.
86.
50.
020
83.7
63.4
Land
fill a
nd T
ailin
gs50
00
2369
.20.
14.
70.
020
9.0
15.8
Mix
ed la
nd u
se16
800
514
9075
.44.
88.
90.
051
9.0
17.5
Nak
ed a
nd e
rode
d te
rrai
n28
40
3889
.40.
113
.70.
015
93.6
96.8
Nat
ural
Gra
ssla
nds
1811
116
633.
60.
59.
20.
129
2.7
18.6
Nea
r Urb
an a
reas
1920
110
363.
80.
35.
40.
033
4.5
16.7
Orc
hard
s21
401
9135
.20.
34.
30.
093
.18.
4O
ther
per
enni
als
475
017
30.1
0.1
3.6
0.0
40.9
5.4
Oth
er T
errit
orie
s3
09.
10.
03.
00.
18.
74.
9Pa
stur
es a
nd m
eado
ws
3592
110
2287
14.4
7.4
6.4
0.0
4769
.731
.4Pe
renn
ials
(per
enni
al c
rops
)36
941
1265
4.7
0.4
3.4
0.0
126.
88.
1Q
uarr
ies,
ope
n pi
ts a
nd L
ands
lip27
90
3233
.40.
111
.60.
022
4.1
20.5
Railw
ay li
nes
and
adja
cent
terr
itorie
s20
00
3976
.90.
119
.90.
028
2.2
30.6
Rive
rs a
nd ri
verb
eds
1343
027
916.
10.
920
.80.
099
1.7
52.3
Sand
, gra
vel a
nd b
are
rock
s17
751
2292
3.6
0.7
12.9
0.0
1044
9.9
248.
5Se
ttle
men
ts (f
amily
gar
dens
)24
037
.60.
01.
60.
212
.82.
5Sh
rubs
and
Gra
ssed
Ter
rito
ries
5407
215
2235
14.6
7.3
4.1
0.0
708.
114
.0Sm
all-s
cale
non
-agr
icul
tura
l are
as81
882
314.
20.
00.
00.
01.
30.
1Su
rfac
ed ro
ads
and
neig
hbor
ing
terr
itorie
s18
401
2937
6.9
1.0
16.0
0.0
6743
.922
1.8
Tran
spor
t Inf
rast
ruct
ure
336
085
.90.
00.
30.
09.
40.
7U
ncul
tivat
ed A
reas
260
180.
30.
06.
90.
265
.013
.2U
rban
Str
uctu
res
2193
123
816.
40.
810
.90.
024
96.1
72.2
Urb
aniz
ed T
errit
orie
s1
00.
80.
00.
80.
80.
80.
0V
ines
3890
125
889.
70.
86.
70.
023
0.8
14.1
Wat
er a
reas
and
wet
land
s90
029
6.8
0.0
3.3
0.0
30.9
5.9
Wet
land
s38
70
1911
.00.
14.
90.
011
6.9
10.5
Yard
s32
665
947
307.
51.
51.
40.
015
9.0
2.4

37 www.LifeNeophron.eu
Annex 2.3. Land cover features and composition in 30 km buffer around Egyptian vulture nests, Bulgaria
Land
scap
e fe
autu
res
Num
ber o
f pat
ches
Patc
hes
cove
rage
in %
Are
a si
ze in
ha
Are
a si
ze in
%A
vera
ge a
rea
size
_ha
Min
imal
are
a si
ze_h
aM
axim
al a
rea
size
_ha
Stan
dart
dev
iati
onA
rabl
e la
nds
2150
744
191.
216
.720
.684
4.9
0.0
56.2
Are
as fo
r Spo
rt a
nd R
ecre
atio
n31
053
.30.
01.
76.
00.
11.
4A
reas
with
oth
er /
non
agr
icul
tura
l / p
urpo
se16
042
8.0
0.2
26.7
123.
80.
438
.7A
reas
with
Poo
r Veg
etat
ion
151
111
20.0
0.4
7.4
138.
60.
115
.3Br
ownf
ield
s4
020
.90.
05.
218
.30.
18.
7Bu
ilt-u
p ar
eas
outs
ide
the
sett
lem
ents
8122
2750
38.6
1.9
0.6
336.
60.
04.
2Ch
anne
ls63
016
3.9
0.1
2.6
30.3
0.0
4.6
Fiel
d ro
ads,
live
stoc
k tr
eks
and
open
ings
1040
396
2.8
0.4
0.9
24.4
0.0
1.8
Fore
st M
eado
ws
and
Past
ures
960
321.
90.
13.
480
.20.
09.
3Fo
rest
Ter
rito
ries
1217
412
9305
.848
.910
6.2
6054
.50.
047
1.8
Gro
up L
ine
Obj
ects
(Gor
ge)
130
397.
80.
230
.611
9.9
0.5
38.4
Gul
lies,
Rav
ines
and
Gro
oves
452
218
99.4
0.7
4.2
86.1
0.0
8.3
Lake
s, D
ams
and
Pond
s45
82
4604
.21.
710
.114
62.6
0.0
87.0
Land
fill a
nd T
ailin
gs20
051
0.3
0.2
25.5
168.
50.
246
.0M
ixed
land
use
1798
612
101.
54.
66.
714
8.1
0.0
10.6
Nak
ed a
nd e
rode
d te
rrai
n19
013
0.1
0.0
6.8
47.3
0.3
12.8
Nat
ural
Gra
ssla
nds
237
119
25.0
0.7
8.1
211.
90.
017
.2N
ear U
rban
are
as18
021
9.6
0.1
12.2
46.3
0.4
17.9
Orc
hard
s12
00
478.
80.
24.
048
.90.
16.
7O
ther
per
enni
als
170
81.2
0.0
4.8
24.2
0.2
6.9
Past
ures
and
mea
dow
s41
1414
1994
2.3
7.5
4.8
251.
30.
011
.8Pe
renn
ials
(per
enni
al c
rops
)15
81
763.
30.
34.
879
.30.
011
.1Q
uarr
ies,
ope
n pi
ts a
nd L
ands
lip29
036
6.0
0.1
12.6
102.
50.
620
.8Ra
ilway
line
s an
d ad
jace
nt te
rrito
ries
470
432.
20.
29.
237
.70.
19.
4Ri
vers
and
rive
rbed
s13
90
3454
.21.
324
.946
1.8
0.1
53.2
Sand
, gra
vel a
nd b
are
rock
s38
81
3348
.91.
38.
619
6.1
0.0
21.5
Shru
bs a
nd G
rass
ed T
erri
tori
es49
6617
2370
6.7
9.0
4.8
534.
10.
016
.5Sm
all-s
cale
non
-agr
icul
tura
l are
as68
62
24.7
0.0
0.0
0.3
0.0
0.0
Surf
aced
road
s an
d ne
ighb
orin
g te
rrito
ries
246
123
78.8
0.9
9.7
164.
70.
022
.4Tr
ansp
ort I
nfra
stru
ctur
e34
06.
50.
00.
20.
70.
00.
2U
rban
Str
uctu
res
153
111
53.3
0.4
7.5
279.
60.
027
.1U
rban
ized
Ter
ritor
ies
10
0.8
0.0
0.8
0.8
0.8
0.0
Vin
es27
51
1395
.90.
55.
176
.70.
011
.1W
ater
are
as a
nd w
etla
nds
60
58.5
0.0
9.7
30.9
3.0
10.9
Wet
land
s25
026
9.7
0.1
10.8
61.4
0.1
17.2
Yard
s24
108
3175
.51.
21.
371
.20.
02.
3

38 www.LifeNeophron.eu
Annex 2.4. Land cover features and composition in 30 km buffer around Egyptian vulture nests, Greece
Land
scap
e fe
autu
res
Num
ber o
f pat
ches
Patc
hes
cove
rage
in %
Are
a si
ze in
ha
Are
a si
ze in
%A
vera
ge a
rea
size
_ha
Min
imal
are
a si
ze_h
aM
axim
al a
rea
size
_ha
Stan
dart
dev
iati
onA
rabl
e la
nd19
448
4719
0918
.131
.59.
80.
094
6.1
32.6
Ara
ble
land
(mix
ed)
3389
830
941.
85.
19.
10.
010
1.7
10.2
Fora
ge la
nd48
4912
1258
96.6
20.8
26.0
0.0
967.
764
.0Fo
rage
land
(mix
ed)
280
132
07.4
0.5
11.5
0.0
135.
514
.2Fo
rest
ry40
2110
1559
17.5
25.7
39.3
0.0
930.
796
.3Fo
rest
ry (m
ixed
)4
038
.20.
09.
53.
220
.98.
1G
razi
ng c
apac
ity la
nds
1148
353
979.
98.
947
.40.
095
8.0
85.6
Not
Elig
ible
Are
as (P
EF)
254
144
43.8
0.7
17.6
0.1
257.
532
.1O
live
culti
vatio
ns68
92
1672
.30.
32.
40.
066
.85.
1O
live
culti
vatio
ns (m
ixed
)56
01
3015
.00.
55.
40.
231
.14.
9O
ther
2695
714
742.
52.
45.
50.
045
9.6
18.0
Perm
anen
t cul
tivat
ions
572
114
60.1
0.2
2.6
0.0
105.
06.
0Pe
rman
ent c
ultiv
atio
ns (m
ixed
)41
01
2698
.20.
46.
60.
198
.09.
6Ro
ads
- Wat
er b
odie
s76
42
4374
.90.
75.
70.
072
4.9
35.7
Urb
an a
reas
1678
473
35.6
1.2
4.4
0.0
159.
68.
3U
rban
are
as (m
ixed
)71
034
1.2
0.1
4.8
0.0
21.9
3.8
Vin
eyar
ds21
71
367.
80.
11.
70.
055
.04.
2V
iney
ards
(mix
ed)
106
039
5.1
0.1
3.7
0.0
28.8
4.1
Was
tela
nds
123
062
5.9
0.1
5.1
0.1
71.6
8.6

39 www.LifeNeophron.eu
Annex 2.5. Land cover features and composition in 1 km buffer around Egyptian vulture nests, Northern versus Southern Bulgaria
Nor
ther
n Bu
lgar
ia la
ndsc
ape
feat
ures
Num
ber o
f pat
ches
Patc
hes
cove
rage
in %
Are
a si
ze in
ha
Are
a si
ze in
%A
vera
ge a
rea
size
_ha
Min
imal
are
a si
ze_h
aM
axim
al a
rea
size
_ha
Stan
dart
dev
iati
onA
rabl
e la
nds
6914
1020
.64
15.6
14.7
90.
0399
.53
21.5
4A
reas
wit
h ot
her /
non
agr
icul
tura
l / p
urpo
se2
013
.15
0.2
6.57
0.83
12.3
18.
12Bu
ilt-u
p ar
eas
outs
ide
the
sett
lem
ents
5311
87.9
31.
31.
660.
0113
.62
2.72
Chan
nels
10
0.08
0.0
0.08
0.08
0.08
0.00
Fiel
d ro
ads,
live
stoc
k tr
eks
and
open
ings
184
9.17
0.1
0.51
0.02
2.92
0.79
Fore
st M
eado
ws
and
Past
ures
51
39.5
70.
67.
910.
9232
.34
13.7
1Fo
rest
Ter
rito
ries
7114
3322
.94
50.7
46.8
00.
0130
2.41
77.0
3G
ullie
s, R
avin
es a
nd G
roov
es5
184
.75
1.3
16.9
50.
1066
.30
27.9
4La
kes,
Dam
s an
d Po
nds
20
3.19
0.0
1.60
0.19
3.00
1.99
Mix
ed la
nd u
se7
151
.04
0.8
7.29
0.05
23.2
69.
25N
aked
and
ero
ded
terr
ain
10
0.41
0.0
0.41
0.41
0.41
0.00
Nat
ural
Gra
ssla
nds
112
100.
361.
59.
120.
0135
.60
11.3
8O
rcha
rds
10
1.86
0.0
1.86
1.86
1.86
0.00
Past
ures
and
mea
dow
s61
1233
9.09
5.2
5.56
0.01
56.4
49.
21Pe
renn
ials
(per
enni
al c
rops
)3
12.
870.
00.
960.
711.
150.
23Q
uarr
ies,
ope
n pi
ts a
nd L
ands
lip1
02.
010.
02.
012.
012.
010.
00Ra
ilway
line
s an
d ad
jace
nt te
rrit
orie
s5
117
.55
0.3
3.51
1.38
5.11
1.54
Rive
rs a
nd ri
verb
eds
173
173.
802.
710
.22
0.01
26.6
49.
79Sa
nd, g
rave
l and
bar
e ro
cks
112
95.5
91.
58.
690.
6622
.82
7.50
Shru
bs a
nd G
rass
ed T
erri
tori
es10
621
945.
0214
.48.
920.
0114
0.58
22.8
0Sm
all-
scal
e no
n-ag
ricu
ltur
al a
reas
10
0.06
0.0
0.06
0.06
0.06
0.00
Surf
aced
road
s an
d ne
ighb
orin
g te
rrit
orie
s20
445
.16
0.7
2.26
0.01
9.38
2.03
Tran
spor
t Inf
rast
ruct
ure
41
0.50
0.0
0.12
0.07
0.25
0.09
Urb
an S
truc
ture
s4
112
0.31
1.8
30.0
82.
1749
.36
20.2
4V
ines
20
0.29
0.0
0.15
0.09
0.21
0.08
Yard
s21
478
.82
1.2
3.75
0.01
19.6
15.
73

40 www.LifeNeophron.eu
Sout
hern
Bul
gari
a la
ndsc
ape
feat
ures
Num
ber o
f pat
ches
Patc
hes
cove
rage
in %
Are
a si
ze in
ha
Are
a si
ze in
%A
vera
ge a
rea
size
_ha
Min
imal
are
a si
ze_h
aM
axim
al a
rea
size
_ha
Stan
dart
dev
iati
onA
rabl
e la
nds
403
164.
251.
54.
110.
0234
.19
6.86
Are
as fo
r Spo
rt a
nd R
ecre
atio
n1
02.
260.
02.
262.
262.
260.
00A
reas
wit
h Po
or V
eget
atio
n11
160
.19
0.5
5.47
0.21
25.6
07.
84Bu
ilt-u
p ar
eas
outs
ide
the
sett
lem
ents
314
2291
.14
0.8
0.29
0.01
3.93
0.59
Fiel
d ro
ads,
live
stoc
k tr
eks
and
open
ings
352
27.2
60.
20.
780.
016.
221.
27Fo
rest
Mea
dow
s an
d Pa
stur
es15
193
.54
0.8
6.24
0.01
61.5
915
.56
Fore
st T
erri
tori
es14
410
7620
.60
68.7
52.9
20.
0190
9.78
116.
99G
ullie
s, R
avin
es a
nd G
roov
es21
129
.09
0.3
1.39
0.01
7.81
1.98
Lake
s, D
ams
and
Pond
s20
131
7.39
2.9
15.8
70.
0314
6.91
36.9
1La
ndfi
ll an
d Ta
iling
s1
00.
940.
00.
940.
940.
940.
00M
ixed
land
use
735
390.
953.
55.
360.
0144
.83
8.37
Nat
ural
Gra
ssla
nds
141
24.8
00.
21.
770.
0115
.64
4.08
Nea
r Urb
an a
reas
10
1.24
0.0
1.24
1.24
1.24
0.00
Past
ures
and
mea
dow
s23
116
643.
775.
82.
790.
0136
.66
4.77
Qua
rrie
s, o
pen
pits
and
Lan
dslip
10
2.64
0.0
2.64
2.64
2.64
0.00
Railw
ay li
nes
and
adja
cent
terr
itor
ies
10
1.95
0.0
1.95
1.95
1.95
0.00
Rive
rs a
nd ri
verb
eds
161
241.
452.
215
.09
1.11
53.9
714
.18
Sand
, gra
vel a
nd b
are
rock
s78
543
5.43
3.9
5.58
0.01
54.3
29.
68Sh
rubs
and
Gra
ssed
Ter
rito
ries
290
2077
8.26
7.0
2.68
0.01
47.5
45.
04Sm
all-
scal
e no
n-ag
ricu
ltur
al a
reas
171
0.59
0.0
0.03
0.01
0.09
0.02
Surf
aced
road
s an
d ne
ighb
orin
g te
rrit
orie
s33
251
.45
0.5
1.56
0.01
6.82
1.81
Urb
an S
truc
ture
s4
05.
440.
01.
360.
064.
362.
01V
ines
91
23.1
60.
22.
570.
587.
322.
22W
etla
nds
10
8.02
0.1
8.02
8.02
8.02
0.00
Yard
s85
674
.61
0.7
0.88
0.01
3.88
0.77

41 www.LifeNeophron.eu
Annex 2.6. Land cover features and composition in 5 km buffer around Egyptian vulture nests, Northern versus Southern Bulgaria
Nor
ther
n Bu
lgar
ia la
ndsc
ape
feat
ures
Num
ber o
f pat
ches
Patc
hes
cove
rage
in %
Are
a si
ze in
ha
Are
a si
ze in
%A
vera
ge a
rea
size
_ha
Max
imal
are
a si
ze_h
aM
inim
al a
rea
size
_ha
Stan
dart
dev
iati
onA
rabl
e la
nds
1474
1140
2.99
33.4
0.27
8.45
0.00
0.66
Are
as fo
r Spo
rt a
nd R
ecre
atio
n24
00.
450.
00.
020.
060.
000.
01A
reas
wit
h ot
her /
non
agr
icul
tura
l / p
urpo
se10
03.
830.
30.
381.
240.
010.
45A
reas
wit
h Po
or V
eget
atio
n48
04.
120.
30.
090.
550.
000.
11Br
ownf
ield
s4
00.
210.
00.
050.
180.
000.
09Bu
ilt-u
p ar
eas
outs
ide
the
sett
lem
ents
4724
3531
.99
2.6
0.01
3.37
0.00
0.05
Chan
nels
530
1.47
0.1
0.03
0.30
0.00
0.05
Fiel
d ro
ads,
live
stoc
k tr
eks
and
open
ings
579
46.
140.
50.
010.
240.
000.
02Fo
rest
Mea
dow
s an
d Pa
stur
es9
00.
540.
00.
060.
320.
000.
10Fo
rest
Ter
rito
ries
512
440
7.48
33.7
0.80
46.5
30.
003.
57G
roup
Lin
e O
bjec
ts (G
orge
)12
03.
920.
30.
331.
200.
010.
39G
ullie
s, R
avin
es a
nd G
roov
es13
51
8.18
0.7
0.06
0.86
0.00
0.11
Lake
s, D
ams
and
Pond
s77
14.
040.
30.
051.
100.
000.
14La
ndfi
ll an
d Ta
iling
s12
04.
310.
40.
361.
680.
010.
57M
ixed
land
use
245
223
.66
2.0
0.10
0.86
0.00
0.13
Nak
ed a
nd e
rode
d te
rrai
n9
01.
100.
10.
120.
470.
000.
17N
atur
al G
rass
land
s14
71
15.6
61.
30.
112.
120.
000.
21N
ear U
rban
are
as14
02.
150.
20.
150.
460.
000.
19O
rcha
rds
721
3.35
0.3
0.05
0.28
0.00
0.06
Oth
er p
eren
nial
s14
00.
770.
10.
050.
240.
000.
07Pa
stur
es a
nd m
eado
ws
925
778
.58
6.5
0.08
2.51
0.00
0.20
Pere
nnia
ls (p
eren
nial
cro
ps)
921
6.94
0.6
0.08
0.79
0.00
0.14
Qua
rrie
s, o
pen
pits
and
Lan
dslip
200
3.43
0.3
0.17
1.03
0.01
0.24
Railw
ay li
nes
and
adja
cent
terr
itor
ies
360
3.85
0.3
0.11
0.38
0.00
0.10
Rive
rs a
nd ri
verb
eds
911
13.4
81.
10.
151.
160.
000.
20Sa
nd, g
rave
l and
bar
e ro
cks
951
7.92
0.7
0.08
1.75
0.00
0.19
Shru
bs a
nd G
rass
ed T
erri
tori
es17
9814
115.
739.
60.
065.
340.
000.
23Sm
all-
scal
e no
n-ag
ricu
ltur
al a
reas
309
20.
090.
00.
000.
000.
000.
00Su
rfac
ed ro
ads
and
neig
hbor
ing
terr
itor
ies
143
114
.02
1.2
0.10
1.65
0.00
0.23
Tran
spor
t Inf
rast
ruct
ure
340
0.06
0.0
0.00
0.01
0.00
0.00
Urb
an S
truc
ture
s75
19.
630.
80.
132.
800.
000.
38U
rban
ized
Ter
rito
ries
10
0.01
0.0
0.01
0.01
0.01
0.00
Vin
es69
14.
150.
30.
060.
400.
000.
09W
ater
are
as a
nd w
etla
nds
60
0.58
0.0
0.10
0.31
0.03
0.11
Wet
land
s17
01.
850.
20.
110.
600.
010.
16Ya
rds
1425
1121
.14
1.8
0.01
0.71
0.00
0.03

42 www.LifeNeophron.eu
Sout
hern
Bul
gari
a la
ndsc
ape
feat
ures
Num
ber o
f pat
ches
Patc
hes
cove
rage
in %
Are
a si
ze in
ha
Are
a si
ze in
%A
vera
ge a
rea
size
_ha
Max
imal
are
a si
ze_h
aM
inim
al a
rea
size
_ha
Stan
dart
dev
iati
onA
rabl
e la
nds
676
438
.92
2.7
0.06
0.66
0.00
0.09
Are
as fo
r Spo
rt a
nd R
ecre
atio
n7
00.
090.
00.
010.
020.
000.
01A
reas
wit
h ot
her /
non
agr
icul
tura
l / p
urpo
se6
00.
450.
00.
080.
230.
000.
10A
reas
wit
h Po
or V
eget
atio
n10
31
7.08
0.5
0.07
1.39
0.00
0.17
Built
-up
area
s ou
tsid
e th
e se
ttle
men
ts33
9821
18.3
91.
30.
010.
530.
000.
01Ch
anne
ls10
00.
170.
00.
020.
050.
000.
02Fi
eld
road
s, li
vest
ock
trek
s an
d op
enin
gs46
13
3.49
0.2
0.01
0.14
0.00
0.01
Fore
st M
eado
ws
and
Past
ures
871
2.68
0.2
0.03
0.80
0.00
0.09
Fore
st T
erri
tori
es70
54
885.
5861
.61.
2660
.54
0.00
5.40
Gro
up L
ine
Obj
ects
(Gor
ge)
10
0.06
0.0
0.06
0.06
0.06
0.00
Gul
lies,
Rav
ines
and
Gro
oves
317
210
.82
0.8
0.03
0.58
0.00
0.07
Lake
s, D
ams
and
Pond
s38
12
42.0
02.
90.
1114
.63
0.00
0.95
Land
fill
and
Taili
ngs
80
0.80
0.1
0.10
0.40
0.00
0.15
Mix
ed la
nd u
se15
539
97.3
66.
80.
061.
480.
000.
10N
aked
and
ero
ded
terr
ain
100
0.20
0.0
0.02
0.09
0.00
0.03
Nat
ural
Gra
ssla
nds
901
3.59
0.3
0.04
0.58
0.00
0.08
Nea
r Urb
an a
reas
40
0.05
0.0
0.01
0.03
0.00
0.01
Orc
hard
s48
01.
440.
10.
030.
490.
000.
07O
ther
per
enni
als
30
0.05
0.0
0.02
0.03
0.00
0.01
Past
ures
and
mea
dow
s31
8919
120.
848.
40.
041.
220.
000.
07Pe
renn
ials
(per
enni
al c
rops
)66
00.
700.
00.
010.
100.
000.
02Q
uarr
ies,
ope
n pi
ts a
nd L
ands
lip9
00.
230.
00.
030.
060.
010.
02Ra
ilway
line
s an
d ad
jace
nt te
rrit
orie
s11
00.
470.
00.
040.
150.
000.
05Ri
vers
and
rive
rbed
s48
021
.06
1.5
0.44
4.62
0.00
0.84
Sand
, gra
vel a
nd b
are
rock
s29
32
25.5
71.
80.
091.
960.
000.
22Sh
rubs
and
Gra
ssed
Ter
rito
ries
3168
1912
1.34
8.4
0.04
1.93
0.00
0.11
Smal
l-sc
ale
non-
agri
cult
ural
are
as37
72
0.16
0.0
0.00
0.00
0.00
0.00
Surf
aced
road
s an
d ne
ighb
orin
g te
rrit
orie
s10
31
9.76
0.7
0.09
1.02
0.00
0.22
Urb
an S
truc
ture
s78
01.
910.
10.
020.
490.
000.
06V
ines
206
19.
810.
70.
050.
770.
000.
12W
etla
nds
80
0.85
0.1
0.11
0.61
0.00
0.21
Yard
s98
56
10.6
10.
70.
010.
120.
000.
01