habib canadian bank basel ii pillar 3 supplemental … note to readers basel ii pillar 3...
TRANSCRIPT

Habib Canadian Bank
Basel II Pillar 3 Supplemental
Disclosures
for 2013
March, 2014

2
Abbreviations & acronyms used:
ICAAP – the Internal Capital Adequacy Assessment Process
HCB – Habib Canadian Bank
HBZ – the parent of HCB - Habib Bank AG, Zurich
Group – the HBZ Group
SM – the senior management of HCB
BD – the Board of Directors of HCB
CRO (Credit) – the designated Chief Risk Officer (Credit)
RM – the Risk Management
IA – the Internal Audit of HCB (administered by HBZ)
IAS or IFRS – International Accounting Standard or International Financial Reporting Standards
Basel II - the Basel II framework: International Convergence of Capital Measurement and Capital Standards:
A Revised Framework – Comprehensive Version (June 2006).
BCAR – Capital adequacy ratio
CAR – OSFI Guideline ‘Capital Adequacy Requirement (CAR), Simpler Approaches
IFRS(s) –International Financial Reporting Standards (‘IFRSs’)
ME – the month end
QE – the quarter end
YE – the year end
3
Contents Note to Readers ......................................................................................................................................... 4
1. Introduction .......................................................................................................................................... 5
2. Scope of Application .......................................................................................................................... 7
3. Scope of Basel II permissions .......................................................................................................... 9
4. Forward Looking Statements.......................................................................................................... 10
5. Capital Adequacy ............................................................................................................................. 12
5.1. Capital management .................................................................................................................... 12
5.2. Regulatory capital structure and assessment .......................................................................... 14
5.3. Regulatory Capital - Interim transitional and all-in capital Basel III Pillar 3 disclosures .... 17
5.4. Capital requirements for risks ..................................................................................................... 21
6. Credit risk: general disclosures ...................................................................................................... 23
6.1. General qualitative disclosures .................................................................................................. 23
6.2. Quantative disclosures ................................................................................................................ 23
7. Credit risk: Disclosures for Portfolios subject to the Standardized Approach ......................... 37
8. Credit Risk Mitigation ....................................................................................................................... 41
9. Derivatives ......................................................................................................................................... 45
10. Market Risk and Interest Rate Risk in the Banking Book ...................................................... 48
11. Operational Risk ........................................................................................................................... 51
12. Remuneration ............................................................................................................................... 52

4
Note to Readers
Basel II Pillar 3 Supplemental Disclosures for 2013
(Q1, Q2, Q3 and Q4, 2013)
This document is prepared in accordance with OSFI expectations (OSFI letters dated July 13,
2011 on Implementation of disclosures for Basel II Pillar 3 enhancements and revisions, June
14, 2012 on Basel Pillar 3 public disclosures, and OSFI Advisory on Public Capital Disclosure
Requirements related to Basel III Pillar 3 issued in March, 2013) on inclusion full qualitative and
quantative disclosures applicable to Habib Canadian Bank as required on a quarterly basis.

5
1. Introduction
Since 2008 Habib Canadian Bank (‘HCB’ or ‘Bank’) operates under the Basel II capital
framework (“Basel II”), Simpler Approach (based on the revised international capital adequacy
standards as recommended by the Basel Committee on Banking Supervision in 2004) in
accordance with the Office of the Superintendent of Financial Institutions Canada (‘OSFI’)
Guideline on Capital Adequacy Requirements (CAR)* that is based on the capital requirements
set by the Basel III framework (2010-2011).
*Note: Canada, as a member of the Basel Committee on Banking Supervision, participated in
the development of the framework, Basel II: International Convergence of Capital Measurement
and Capital Standards (‘Basel II’): A Revised Framework – Comprehensive Version (June
2006). The domestic guidance CAR A was based on the Basel II framework. It also
encompassed and updated relevant parts of the 1988 Basel Accord and reflects changes to the
Basel II framework / Basel III framework that have occurred since its implementation [OSFI
issued a new Capital Adequacy Requirements guidance (CAR) 2013, effective Q1, 2013].
Basel III (or the Third Basel Accord) is a global, voluntary regulatory standard on bank capital
adequacy, stress testing and market liquidity risk. It was agreed upon by the members of the
Basel Committee on Banking Supervision in 2010–11, and was scheduled to be introduced from
2013 until 2015; however, changes from 1 April 2013 extended implementation until 31 March
2018. The third installment of the Basel Accords (known as Basel I, Basel II) was developed in
response to the deficiencies in financial regulation revealed by the late-2000s financial crisis.
Basel III was supposed to strengthen bank capital requirements by increasing bank liquidity and
decreasing bank leverage. Unlike Basel I and Basel II which are primarily related to the required
level of bank loss reserves that must be held by banks for various classes of loans and other
investments and assets that they have, Basel III is primarily related to the risks for the banks of
a “run on the bank” [“banking panic”] by requiring differing levels of reserves for different forms
of bank deposits and other borrowings. Therefore, Basel III rules do not for the most part
supersede the guidelines known as Basel I and Basel II but work alongside them.
The Basel II / Basel III framework consists of three pillars each of them concentrating on a
different aspect of banking regulation.
— Pillar 1 makes recommendations for calculation of minimum capital requirements.
— Pillar 2 discusses the key principles of supervisory review and risk management guidance.
— Pillar 3 complements the first two pillars of Basel II by requiring a range of disclosures on
capital and risk assessment processes, aimed at encouraging and reinforcing market discipline.

6
The Basel II Pillar 3 Supplemental Disclosures for 2013 year (‘Pillar 3 Disclosures for 2013’)
have been prepared in accordance with requirements of the OSFI Advisory on Pillar 3
Disclosure Requirements (November 2007), related OSFI guidelines and letters and the Bank’s
internal policy on Basel II Pillar 3 Disclosures, and can be found on the Bank’s website
www.habibcanadian.com .
Note: HCB is a part of Habib Bank Zurich AG Group (‘HBZ’) which prepares its own regulatory
Basel II reports and Basel II Pillar 3 disclosures in accordance with Swiss regulatory
requirements. The scope of the Basel II Pillar 3 Disclosures relates only to the HCB business
and Basel II Pillar 3 Disclosure requirements in Canada.

7
2. Scope of Application
The Pillar 3 Supplemental Disclosures for 2013 are additional summarized qualitative and
quantitative financial information prepared in accordance with disclosure requirements under the
OSFI’s Pillar 3 Disclosure Requirements and are consistent with Basel II / Basel III and IFRSs.
The publication of this document fulfills a key requirement of the Basel II / Basel III Framework,
encouraging market discipline by allowing market participants to assess increased disclosure
surrounding both the risk management framework and the capital adequacy of the Bank.
The disclosures produced within this document have been prepared in accordance with
minimum disclosure requirements interpreted by OSFI and established under the OSFI Advisory
on Pillar 3 Disclosure Requirements (November 2007), OSFI Advisory on Public Capital
Disclosure Requirements related to Basel III Pillar 3 issued in March, 2013, and related OSFI
guidelines and letters; and should be read along with the Bank’s Annual Report (audited) for
2013.
Note: The disclosure requirements in relation to remuneration (Section 12) was implemented
with the 2012 fiscal year-end, and the frequency of remuneration disclosures is made only on an
annual basis1.
Comparison with the financial information (audited) for 2013
The Pillar 3 Disclosures for 2013 have been prepared in accordance with regulatory capital
adequacy concepts and rules, rather than in accordance with International Financial Reporting
Standards (‘IFRS’). Therefore, some information in the Pillar 3 Disclosures is not directly
comparable with the financial information in the Bank’s Annual Report (audited) for 2013.
This is most pronounced for the credit risk disclosures, where credit exposure is defined as the
amount at risk that is calculated by the Bank under specified Basel II – Simpler Approach
parameters. This differs from similar information in the Bank’s Annual Report (audited) for 2013,
which was mainly reported at the balance sheet date and therefore does not reflect the
likelihood of future drawings of committed credit lines.
The Pillar 3 Disclosures along with the Bank’s financial information are presented in Canadian
dollars, which is the Bank’s functional currency. Except as otherwise indicated, financial
information presented in Canadian dollars had been rounded to the nearest thousand.
1 In accordance with the OSFI letter on Implementation of Basel II Pillar 3 Disclosure Requirements for Remuneration, dated
December 1, 2011

8
The preparation of the Pillar 3 Disclosures along with the Bank’s financial statements in
conformity with IFRSs requires management to make judgements, estimates and assumptions
that affect the application of accounting policies and the reported amounts of assets, liabilities,
income and expenses. Actual results may differ from these estimates. Estimates and underlying
assumptions are reviewed on an ongoing basis. Revisions to accounting estimates are
recognized in the period in which the estimate is revised and in any future periods affected.
Information about significant areas of estimation uncertainty and critical judgements in applying
accounting policies that have the most significant effect on the amounts recognized in the
financial statements are described in respective notes of the Bank’s Annual Report (audited) for
2013 fiscal year.
Significant subsidiaries
The Bank has no subsidiaries or entities for consolidation.
Verification
The Pillar 3 Disclosures are not required to be subjected to external audit. Instead, the
disclosures are verified and approved through internal reporting procedures.

9
3. Scope of Basel II permissions
Credit risk capital requirements
Basel II applies three approaches of increasing sophistication to the calculation of Pillar 1 credit
risk capital requirements. The most basic level, the standardized approach, requires banks to
use external credit ratings to determine the risk weightings applied to rated counterparties.
Other counterparties are grouped into broad categories and standardized risk weightings are
applied to these categories. The next level, the internal ratings-based (‘IRB’) foundation
approach, allows banks to calculate their credit risk capital requirements on the basis of their
internal assessment of counterparty’s probability of default (‘PD’), but subjects their quantified
estimates of exposure at default (‘EAD’) and loss given default (‘LGD’) to standard supervisory
parameters. Finally, the IRB advanced approach allows banks to use their own internal
assessment in both determining PD and quantifying EAD and LGD.
The Bank is applying the standardized (‘Simpler’) approach.
Market risk capital requirement
Market risk is the risk that movements in market risk factors, including foreign exchange,
commodity prices, interest rates, credit spread and equity prices will reduce the income or the
value of the portfolios. The market risk capital requirement is measured using internal models,
where approved, or the standardized approach.
The Bank has adopted the standardized approach in determining its market risk capital
requirement.
Operational risk capital requirement
Basel II includes capital requirements for operational risk, again utilizing three levels of
sophistication. The capital required under the basic indicator approach is a simple percentage of
gross revenues, whereas under the standardized approach, it is one of three different
percentages of gross revenues allocated to each of eight defined business lines. Both these
approaches use an average of the last three financial years’ revenues. Finally, the advanced
measurement approach uses banks’ own statistical analysis and modeling of operational risk
data to determine capital requirements.
The Bank has adopted the basic indicator approach in determining its operational risk capital
requirement.

10
4. Forward Looking Statements
This document includes or may include certain forward looking statements with respect to the
business, strategy and plans of Habib Canadian Bank (‘HCB’) and its current goals and
expectations relating to its future financial condition and performance.
Statements that are not historical facts, including statements about HCB or its directors' and / or
management’s beliefs and expectations, are forward looking statements. Words such as
‘believes’, ‘anticipates’, ‘estimates’, ‘expects’, ‘intends’, ‘aims’, ‘potential’, ’will’, ‘would’, ‘could’,
‘considered’, ‘likely’, ‘estimate’ and variations of these words and similar future or conditional
expressions are intended to identify forward looking statements but are not the exclusive means
of identifying such statements. By their nature, forward looking statements involve risk and
uncertainty because they relate to events and depend upon circumstances that will occur in the
future.
Examples of such forward looking statements include, but are not limited to, projections or
expectations of the HCB’s future financial position including profit attributable to shareholders,
provisions, economic profit, dividends, capital structure, expenditures or any other financial
items or ratios; statements of plans, objectives or goals of the Bank or its management including
in respect of certain synergy targets; statements about the future business and economic
environments in Canada and elsewhere including future trends in interest rates, foreign
exchange rates, credit and equity market levels and demographic developments; statements
about, competition, regulation, disposals and consolidation or technological developments in the
financial services industry; and statements of assumptions underlying such statements.
Factors that could cause actual business, strategy, plans and / or results to differ materially from
the plans, objectives, expectations, estimates and intentions expressed in such forward looking
statements made by the Bank or on its behalf include, but are not limited to: general economic
and business conditions in Canada and internationally; inflation, deflation, interest rates and
policies of the Bank of Canada and other G8 central banks; fluctuations in exchange rates,
stock markets and currencies; the ability to access sufficient funding to meet the Bank’s liquidity
needs; changes to the Bank’s creditworthiness; the ability to derive cost savings and other
benefits; changing demographic developments including mortality and changing customer
behavior including consumer spending, saving and borrowing habits; changes to borrower or
counterparty credit quality; technological changes; natural and other disasters, adverse weather
and similar contingencies outside the Bank’s control; inadequate or failed internal or external
processes, people and systems; terrorist acts and other acts of war or hostility and responses to
those acts, geopolitical, pandemic or other such events; changes in laws, regulations, taxation,
accounting standards or practices; regulatory capital or liquidity requirements and similar
contingencies outside the Bank’s control; the policies and actions of governmental or regulatory
authorities in Canada, Swiss, or elsewhere; the ability to attract and retain senior management
and other employees; requirements or limitations imposed on the Bank as a result of Habib

11
Bank AG Zurich investment in the Bank; the extent of any future impairment charges or write-
offs caused by depressed asset valuations; market related trends and developments; exposure
to regulatory scrutiny, legal proceedings or complaints; changes in competition and pricing
environments; the inability to hedge certain risks economically; the adequacy of loss provisions /
allowances; the actions of competitors; and the success of the Bank in managing the risks of the
foregoing.
HCB may also make or disclose written and / or oral forward looking statements in reports filed
with or furnished to the Office of the Superintendent of Financial Institutions Canada (‘OSFI’),
Bank annual reviews, announcements, proxy statements, circulars, prospectuses, press
releases and other written materials and in oral statements made by the directors, officers or
employees of HCB to third parties, including financial analysts. Except as required by any
applicable law or regulation, the forward looking statements contained in this document are
made as of the date hereof, and HCB expressly disclaims any obligation or undertaking to
release publicly any updates or revisions to any forward looking statements contained in this
document to reflect any change in HCB’s expectations with regard thereto or any change in
events, conditions or circumstances on which any such statement is based.

12
5. Capital Adequacy
5.1. Capital management
The Bank’s approach to capital management is driven by its strategic and organizational
requirements, taking into account the regulatory, economic and business environment in which
it operates. It is the Bank’s objective to maintain a strong capital base to support the
development of its business and to meet regulatory capital requirements at all times. To achieve
this, the Bank’s policy is to hold an additional capital above the regulatory minimum as a buffer
above the minimum capital required by the OSFI (i.e. the HCB minimum BCAR level was 12%).
This buffer may be re-examined in the future.
Since July, 2011, the HBZ Group’s requirement with respect to the HCB’s internal regulatory
target minimum of BCAR is set to be not less than 11.2%.
The policy on capital management is underpinned by a capital management framework, which
enables Bank to manage its capital in a consistent and aligned manner. The framework, which
is approved by the Bank’s Board of Directors, incorporates a number of different capital
measures including capital requirements to support future business plans and risk appetite,
allocated capital, ICAAP (‘Internal Capital Adequacy Assessment Process’) and regulatory
capital.
Internal Capital Adequacy Process ("ICAAP"):
In October 2010, OSFI issued a Guideline E-19, Internal Capital Adequacy Assessment
Process (ICAAP) for Deposit-Taking Institutions, to outline their expectations with respect to an
institution's internal capital adequacy process as described in Part 3 of the Basel II Framework.
It is OSFI's expectation that every federally regulated financial institution ("FRFI"), including
Canadian subsidiaries of foreign banks, will put into place an ICAAP that covers the operations
from the top level regulated entity in Canada. In all instances, the ICAAP should reflect the
FRFI's own circumstances, and not just those of a related group.
The Bank developed its own detailed Internal Capital Adequacy Process document in
accordance with OSFI expectations that covers the following six main components:
(i) Board and senior management oversight;
(ii) Sound capital assessment and planning;
(iii) Comprehensive assessment of risks;

13
(iv) Stress testing;
(v) Monitoring and reporting; and
(vi) Internal control review.
The responsibility for overall capital allocation principles and decisions rests with the Bank’s
Board of Directors. The Board of Directors monitors total capital against all material risks
identified with respect to the Bank’s business lines.
Through the internal governance processes, the Bank’s senior management is responsible for
the investment and capital allocation decisions and assessments, and ensures that returns on
investment are adequate after taking account of capital (capital vs. risk) requirements. The
strategy is to allocate capital to business lines on the basis of their economic profit generation,
and regulatory and economic capital requirements.
The Bank prepares its business ‘baseline’ forecasts (by months) including capital forecasts
within its Annual Budget and Capital planning process.

14
5.2. Regulatory capital structure and assessment
The three primary considerations for defining the consolidated capital of an institution for
purposes of measuring capital adequacy are:
o its permanence
o its being free of mandatory fixed charges against earnings
o its subordinated legal position to the rights of depositors and other creditors of the
institution
Basel II Capital structure in 2012:
Total (‘regulatory’, or ‘eligible’) capital comprised three tiers [in 2012]. Tier 1 (core capital)
comprised the highest quality capital elements. Tier 2 elements (supplementary capital) fall
short in meeting either of the first two capital properties listed above, but contribute to the overall
strength of a company as a going concern. The definition of tier 2 capital differentiates between
what are referred to as hybrid (tier 2A) and limited life (tier 2B) instruments. Tier 3 capital was
used only to meet market risk capital requirements.
The capital elements comprising the three tiers, as well as the various limits, restrictions and
deductions to which they were subject, were described in chapter 2 of the OSFI Guideline on
Capital Adequacy Requirements (CAR) - CAR A.
Within the Bank (since 2008), the Total regulatory (eligible) capital comprised:
o Tier 1 (core capital) comprises only Common shareholders' equity (defined as common
shares, contributed surplus, and retained earnings).
o Tier 2 is nil
o Tier 3 is nil
Total regulatory capital was calculated and reported under IFRSs.
Regulatory ratios were calculated by dividing Tier 1 and Total capital by risk-weighted assets2
("RWA").
The calculation of RWAs was determined by OSFI-prescribed rules relating to on-balance sheet
and off-balance sheet exposures and included an amount for the market risk exposure
associated with trading portfolios. In addition, OSFI formally established risk-based capital
2 In the Bank’s Annual Report (audited) for 2012 fiscal year, the ‘RWAs’ are referred as ‘risk-adjusted assets’ (‘RAA’).

15
targets for deposit-taking institutions. These targets were a Tier 1 capital ratio of 7% and a
Total capital ratio of 10%.
In addition to the Tier 1 and Total capital ratios, Canadian banks are required to ensure that
their assets-to-capital multiple (‘ACM’), which is calculated by dividing gross-adjusted assets by
Total capital, does not exceed a prescribed level.
The table 1A below provides the regulatory capital and ratios for the year ended December 31,
2012 and comparative information for the prior period.
Table1A: Regulatory capital – Basel II
December 31, December 31, December 31, 2012 2011 2010
Capital structure and ratios: Tier 1 capital:
Common shares $ 15,000 $ 15,000 $ 15,000 Retained earnings 1,973 1,329 1,047
Total Tier 1 capital 16,973 16,329 16,047 Tier 2 capital: - - - Tier 3 capital: - - -
Total regulatory (eligible) capital 16,973 16,329 16,047 Risk-weighted assets 81,279 88,568 69,962 Capital ratios:
Tier 1 Ratio 20.88% 18.44% 22.94%
Total Ratio 20.88% 18.44% 22.94%
Total assets (on- and off- balance sheet) $ 139,201 $ 161,922 $ 142,874
Assets-to-capital multiple 8.20 9.92 8.90
Basel III Capital structure in 2013 [effective Q1, 2013]:
Effective Q1, 2013, the OSFI’s regulatory capital guidelines under Basel III allow for two tiers of
capital. As at March 31, 2013, Common Equity Tier 1 (“CET1”) capital includes common shares,
retained earnings and accumulated other comprehensive income. The Bank currently does not
hold any additional Tier 1 or Tier 2 capital instruments. Therefore, the Bank’s CET1 is equal to
its Tier 1 and Total regulatory capital, and were calculated and reported under IFRSs.
Regulatory ratios were calculated by dividing CET1, Tier 1 and Total capital by risk-weighted
assets3 ("RWA").
3 Please note that in the Bank’s Annual Report (audited) for 2012 fiscal year, the ‘RWAs’ are referred as ‘risk-adjusted assets’
(‘RAA’).

16
The calculation of RWAs is determined by OSFI-prescribed rules relating to on-balance sheet
and off-balance sheet exposures and included an amount for the market risk exposure
associated with trading portfolios. In addition, OSFI formally established risk-based capital
targets for deposit-taking institutions: a target CET1 ratio is of 7% and a target Total capital ratio
of 10.5%.
In addition to the capital ratios, Canadian banks are required to ensure that their assets-to-
capital multiple (‘ACM’), which is calculated by dividing gross-adjusted assets by Total capital,
does not exceed a prescribed level.
The table 1B below provides the regulatory capital and ratios for Q1, Q2, Q3, and Q4, 2013 and
Q4, 2012.
Table1B: Regulatory capital for Q1, Q2, Q3, and Q4, 2013 and Q4, 2012 – Basel III
December 31 September 30, 2013 2013
Capital structure and ratios: Common Equity Tier 1 (CET1) capital:
Common shares $ 15,000 $ 15,000 Retained earnings 2,288 2,264
CET1 capital 17,288 17,264 Tier 1 capital: 17,288 17,264 Tier 2 capital: - - -
Total (eligible) capital 17,288 17,264 Risk-weighted assets 84,143 83,748 Capital ratios:
CET1 Ratio 20.55% 20.61% Tier 1 Ratio 20.55% 20.61%
Total Ratio 20.55% 20.61%
Total assets (on- and off- balance sheet) $ 163,545 $ 155,893
Assets-to-capital multiple 9.46 9.03

17
June 30, March 31, December 31, 2013 2013 2012
Capital structure and ratios: Common Equity Tier 1 (CET1) capital:
Common shares $ 15,000 $ 15,000 $ 15,000 Retained earnings 2,225 2,082 1,973
CET1 capital 17,225 17,082 16,973 Tier 1 capital: 17,225 17,082 16,973 Tier 2 capital: - - -
Total (eligible) capital 17,225 17,082 16,973 Risk-weighted assets 79,701 81,270 81,279 Capital ratios:
CET1 Ratio 21.61% 21.02% 20.88% Tier 1 Ratio 21.61% 21.02% 20.88%
Total Ratio 21.61% 21.02% 20.88%
Total assets (on- and off- balance sheet) $ 138,043 $ 135,285 $ 139,201
Assets-to-capital multiple 8.01 7.92 8.20
The Bank is in compliance with the imposed regulatory capital requirements to which it is
subject.
5.3. Regulatory Capital - Interim transitional and all-in capital Basel III Pillar 3
disclosures
The Table 1C summarizes the Bank's interim transitional and all-in capital Basel III Pillar 3
disclosures.
Table1C-Q4: Regulatory capital – Interim Disclosures for Q4 2013– Basel III
In 000’s CAD All-in Basis Transitional Basis
Common Equity Tier 1 Capital: Instruments and Reserves and Regulatory Adjustments
1 Common shares 15,000 15,000 7 Retained Earnings 2,288 2,288
3 Accumulated Other Comprehensive Income - -
5 Common shares issued by subsidiaries and held by third parties - -
28 Regulatory adjustments applied to Common Equity Tier 1 (CET1) - -
29 Common Equity Tier 1 Capital 17,288 17,288
Additional Tier 1 Capital: Instruments and Regulatory Adjustments
30 Directly issued qualifying Additional Tier 1 instruments - -
33 Directly issued capital instruments subject to phase out from Additional Tier 1 - -
34 Additional Tier 1 instruments issued by subsidiaries and held by third parties - -
35 of which: instruments issued by subsidiaries subject to phase out - -
43 Regulatory adjustments applied to Additional Tier 1 - -
44 Additional Tier 1 Capital (AT1) - -

18
45 Tier 1 Capital (T1=CET1+ AT1) 17,288 17,288
Tier 2 Capital: Instruments and Provisions and Regulatory Adjustments
46 Directly issued qualifying Tier 2 instruments - -
47 Directly issued capital instruments subject to phase out from Tier 2 - -
48 Tier 2 instruments issued by subsidiaries and held by third parties - -
49 of which: instruments issued by subsidiaries subject to phase out - -
50 Provisions - -
57 Regulatory adjustments applied to Tier 2 - -
58 Tier 2 Capital (T2) - -
59 Total Capital (TC = T1 + T2) 17,288 17,288
60 Total risk weighted-assets 84,143 84,143
Capital Ratios
61 CET1 20.55% 20.55%
62 Tier 1 20.55% 20.55% 63 Total Capital 20.55% 20.55% OSFI Target Ratios
69 CET1 7.0% 3.5%
70 Tier 1 n/a 4.5%
71 Total Capital n/a 8.0%
Capital Instruments Subject To Phase Out Arrangements
80 Current cap on CET1 instruments subject to phase out arrangements n/a -
81 Amount excluded from CET1 due to cap (excess over cap after redemptions and maturities) n/a -
82 Current cap on ATI instruments subject to phase out arrangements n/a -
83 Amount excluded from AT1 due to cap (excess over cap after redemptions and maturities) n/a -
84 Current cap on T2 instruments subject to phase out arrangements n/a -
85 Amount excluded from T2due to cap (excess over cap after redemptions and maturities) n/a -
Table1C-Q3: Regulatory capital – Interim Disclosures for Q3 2013– Basel III
In 000’s CAD All-in Basis Transitional Basis
Common Equity Tier 1 Capital: Instruments and Reserves and Regulatory Adjustments
1 Common shares 15,000 15,000 7 Retained Earnings 2,264
2,264
3 Accumulated Other Comprehensive Income - -
5 Common shares issued by subsidiaries and held by third parties - -
28 Regulatory adjustments applied to Common Equity Tier 1 (CET1) - -
29 Common Equity Tier 1 Capital 17,264 17,264
Additional Tier 1 Capital: Instruments and Regulatory Adjustments
30 Directly issued qualifying Additional Tier 1 instruments - -
33 Directly issued capital instruments subject to phase out from Additional Tier 1 - -
34 Additional Tier 1 instruments issued by subsidiaries and held by third parties - -
35 of which: instruments issued by subsidiaries subject to phase out - -
43 Regulatory adjustments applied to Additional Tier 1 - -
44 Additional Tier 1 Capital (AT1) - -
45 Tier 1 Capital (T1=CET1+ AT1) 17,264 17,264
Tier 2 Capital: Instruments and Provisions and Regulatory Adjustments
46 Directly issued qualifying Tier 2 instruments - -
47 Directly issued capital instruments subject to phase out from Tier 2 - -
48 Tier 2 instruments issued by subsidiaries and held by third parties - -
49 of which: instruments issued by subsidiaries subject to phase out - -
50 Provisions - -
57 Regulatory adjustments applied to Tier 2 - -
58 Tier 2 Capital (T2) - -
59 Total Capital (TC = T1 + T2) 17,264 17,264
60 Total risk weighted-assets 83,748 83,748
Capital Ratios

19
61 CET1 20.61% 20.61% 62 Tier 1 20.61% 20.61% 63 Total Capital 20.61% 20.61% OSFI Target Ratios
69 CET1 7.0% 3.5%
70 Tier 1 n/a 4.5%
71 Total Capital n/a 8.0%
Capital Instruments Subject To Phase Out Arrangements
80 Current cap on CET1 instruments subject to phase out arrangements n/a -
81 Amount excluded from CET1 due to cap (excess over cap after redemptions and maturities) n/a -
82 Current cap on ATI instruments subject to phase out arrangements n/a -
83 Amount excluded from AT1 due to cap (excess over cap after redemptions and maturities) n/a -
84 Current cap on T2 instruments subject to phase out arrangements n/a -
85 Amount excluded from T2due to cap (excess over cap after redemptions and maturities) n/a -
Table1C-Q2: Regulatory capital – Interim Disclosures for Q2 2013– Basel III
In 000’s CAD All-in Basis Transitional Basis
Common Equity Tier 1 Capital: Instruments and Reserves and Regulatory Adjustments
1 Common shares 15,000 15,000 7 Retained Earnings 2,225
2,225
3 Accumulated Other Comprehensive Income - -
5 Common shares issued by subsidiaries and held by third parties - -
28 Regulatory adjustments applied to Common Equity Tier 1 (CET1) - -
29 Common Equity Tier 1 Capital 17,225 17,225
Additional Tier 1 Capital: Instruments and Regulatory Adjustments
30 Directly issued qualifying Additional Tier 1 instruments - -
33 Directly issued capital instruments subject to phase out from Additional Tier 1 - -
34 Additional Tier 1 instruments issued by subsidiaries and held by third parties - -
35 of which: instruments issued by subsidiaries subject to phase out - -
43 Regulatory adjustments applied to Additional Tier 1 - -
44 Additional Tier 1 Capital (AT1) - -
45 Tier 1 Capital (T1=CET1+ AT1) 17,225 17,225
Tier 2 Capital: Instruments and Provisions and Regulatory Adjustments
46 Directly issued qualifying Tier 2 instruments - -
47 Directly issued capital instruments subject to phase out from Tier 2 - -
48 Tier 2 instruments issued by subsidiaries and held by third parties - -
49 of which: instruments issued by subsidiaries subject to phase out - -
50 Provisions - -
57 Regulatory adjustments applied to Tier 2 - -
58 Tier 2 Capital (T2) - -
59 Total Capital (TC = T1 + T2) 17,225 17,225
60 Total risk weighted-assets 79,701 79,701
Capital Ratios
61 CET1 21.61% 21.61%
62 Tier 1 21.61% 21.61%
63 Total Capital 21.61% 21.61%
OSFI Target Ratios
69 CET1 7.0% 3.5%
70 Tier 1 n/a 4.5%
71 Total Capital n/a 8.0%
Capital Instruments Subject To Phase Out Arrangements
80 Current cap on CET1 instruments subject to phase out arrangements n/a -
81 Amount excluded from CET1 due to cap (excess over cap after redemptions and maturities) n/a -
82 Current cap on ATI instruments subject to phase out arrangements n/a -
83 Amount excluded from AT1 due to cap (excess over cap after redemptions and maturities) n/a -
84 Current cap on T2 instruments subject to phase out arrangements n/a -
85 Amount excluded from T2due to cap (excess over cap after redemptions and maturities) n/a -

20
Table1C-Q1: Regulatory capital – Interim Disclosures for Q1 2013 – Basel III
In 000’s CAD All-in Basis Transitional Basis
Common Equity Tier 1 Capital: Instruments and Reserves and Regulatory Adjustments
1 Common shares 15,000 15,000 7 Retained Earnings 2,082
2,082
3 Accumulated Other Comprehensive Income - -
5 Common shares issued by subsidiaries and held by third parties - -
28 Regulatory adjustments applied to Common Equity Tier 1 (CET1) - -
29 Common Equity Tier 1 Capital 17,082 17,082
Additional Tier 1 Capital: Instruments and Regulatory Adjustments
30 Directly issued qualifying Additional Tier 1 instruments - -
33 Directly issued capital instruments subject to phase out from Additional Tier 1 - -
34 Additional Tier 1 instruments issued by subsidiaries and held by third parties - -
35 of which: instruments issued by subsidiaries subject to phase out - -
43 Regulatory adjustments applied to Additional Tier 1 - -
44 Additional Tier 1 Capital (AT1) - -
45 Tier 1 Capital (T1=CET1+ AT1) 17,082 17,082
Tier 2 Capital: Instruments and Provisions and Regulatory Adjustments
46 Directly issued qualifying Tier 2 instruments - -
47 Directly issued capital instruments subject to phase out from Tier 2 - -
48 Tier 2 instruments issued by subsidiaries and held by third parties - -
49 of which: instruments issued by subsidiaries subject to phase out - -
50 Provisions - -
57 Regulatory adjustments applied to Tier 2 - -
58 Tier 2 Capital (T2) - -
59 Total Capital (TC = T1 + T2) 17,082 17,082
60 Total risk weighted-assets 81,270 81,270
Capital Ratios
61 CET1 21.02% 21.02% 62 Tier 1 21.02% 21.02% 63 Total Capital 21.02% 21.02% OSFI Target Ratios
69 CET1 7.0% 3.5%
70 Tier 1 n/a 4.5%
71 Total Capital n/a 8.0%
Capital Instruments Subject To Phase Out Arrangements
80 Current cap on CET1 instruments subject to phase out arrangements n/a -
81 Amount excluded from CET1 due to cap (excess over cap after redemptions and maturities) n/a -
82 Current cap on ATI instruments subject to phase out arrangements n/a -
83 Amount excluded from AT1 due to cap (excess over cap after redemptions and maturities) n/a -
84 Current cap on T2 instruments subject to phase out arrangements n/a -
85 Amount excluded from T2due to cap (excess over cap after redemptions and maturities) n/a -

21
5.4. Capital requirements for risks
Table2: Risk-weighted assets - by risk type and regulatory capital requirements
2013 Quarterly – Basel III:
December 31, 2013 September 30, 2013 RWAs Capital required
* RWAs Capital required
*
Credit risk $ 75,768 $ 7,956 $ 75,473 $ 7,925 Market risk $ - $ - $ - $ - Operational risk $ 8,375 $ 879 $ 8,275 $ 869
Total $ 84,143 $ 8,835 $ 83,748 $ 8,794 Total Capital $ 17,288 $ 17,264 Surplus $ 8,453 $ 8,470 Total Capital ratio % 20.55 % 20.61
*Capital required for credit risk is the regulatory capital charge, calculated as 10,5% of RWAs
June 30, 2013 March 31, 2013 RWAs Capital required
* RWAs Capital required
*
Credit risk $ 71,538 $ 7,512 $ 73,245 $ 7,691 Market risk $ - $ - $ - $ - Operational risk $ 8,163 $ 653 $ 8,025 $ 642
Total $ 79,701 $ 8,165 $ 81,270 $ 8,333 Total Capital $ 17,225 $ 17,082 Surplus $ 9,060 $ 8,749 Total Capital ratio % 21.61 % 21.02
*Capital required for credit risk is the regulatory capital charge, calculated as 10,5% of RWAs
2012 Year-end – Basel II:
December 31, 2012 December 31, 2011 RWAs Capital required
* RWAs Capital required
*
Credit risk $ 73,441 $ 7,344 $ 81,418 $ 8,142 Market risk $ - $ - $ - $ - Operational risk $ 7,838 $ 627 $ 7,150 $ 572
Total $ 81,279 $ 7,971 $ 88,568 $ 8,714 Total regulatory capital $ 16,973 $ 16,329 Surplus $ 9,002 $ 7,615 BCAR % 22.88 % 18.44
*Capital required for credit risk is the regulatory capital charge, calculated as 10% of RWAs
22
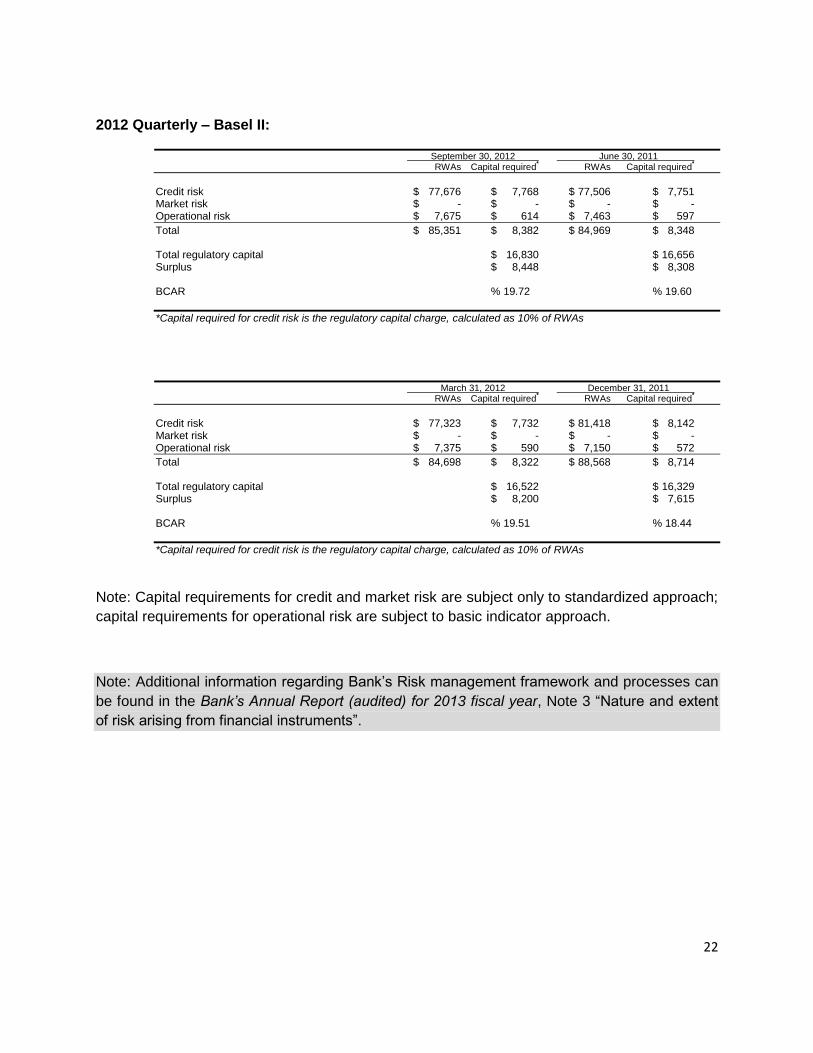
2012 Quarterly – Basel II:
September 30, 2012 June 30, 2011 RWAs Capital required
* RWAs Capital required
*
Credit risk $ 77,676 $ 7,768 $ 77,506 $ 7,751 Market risk $ - $ - $ - $ - Operational risk $ 7,675 $ 614 $ 7,463 $ 597
Total $ 85,351 $ 8,382 $ 84,969 $ 8,348 Total regulatory capital $ 16,830 $ 16,656 Surplus $ 8,448 $ 8,308 BCAR % 19.72 % 19.60
*Capital required for credit risk is the regulatory capital charge, calculated as 10% of RWAs
March 31, 2012 December 31, 2011 RWAs Capital required
* RWAs Capital required
*
Credit risk $ 77,323 $ 7,732 $ 81,418 $ 8,142 Market risk $ - $ - $ - $ - Operational risk $ 7,375 $ 590 $ 7,150 $ 572
Total $ 84,698 $ 8,322 $ 88,568 $ 8,714 Total regulatory capital $ 16,522 $ 16,329 Surplus $ 8,200 $ 7,615 BCAR % 19.51 % 18.44
*Capital required for credit risk is the regulatory capital charge, calculated as 10% of RWAs
Note: Capital requirements for credit and market risk are subject only to standardized approach;
capital requirements for operational risk are subject to basic indicator approach.
Note: Additional information regarding Bank’s Risk management framework and processes can
be found in the Bank’s Annual Report (audited) for 2013 fiscal year, Note 3 “Nature and extent
of risk arising from financial instruments”.

23
6. Credit risk: general disclosures
6.1. General qualitative disclosures
Qualitative disclosures with respect to definitions of past due and impaired (for accounting
purposes), description of approaches followed for specific and general allowances, and
discussion of the credit risk management policy are present in the Bank’s Annual Report
(audited) for 2013 fiscal year, Notes 1a (vii) “Identification and measurement of impairment”, 1c
“Loans and advances”, 3a “Credit risk”, and 5 “Past due and impaired assets and allowance for
impairment”.
6.2. Quantative disclosures
Quantitative disclosures with respect to
total gross credit risk exposures* broken down by major types of credit exposure,
geographic distribution of exposures of exposures broken down in significant areas by
major types of credit exposure,
industry distribution broken down by major types of credit exposure,
disclosure on amount of impaired loans and past due loans, specific and collective
allowances, charges for specific allowances and charge-offs during the period, and
reconciliation of charges in the allowances for loan impairment
are presented below.
*Exposure represents gross exposure at default before allowances and credit risk mitigation.
Total Gross Credit Exposure - Counterparty type distribution broken down by major
types of credit exposure (for each quarter-end during 2013 and comparative data for
2012 year):

24
2013:
Standardized Drawn ExposureCommitments
(Undrawn)OTC Derivatives*
Other Off
Balance Sheet
Items
Total RWAs
Bank $101,936 - $6 $53 $101,995 $25,228
Sovereign - - - - - -
Corporate $43,879 $7,012 $40 $4,373 $55,304 $44,924
Retail Residential Mortgages $12,089 $1,282 - - $13,371 $4,295
Other Retail $207 $48 - - $255 $123
Total Gross Credit Exposure $158,111 $8,342 $46 $4,426 $170,925 $74,570
Reconciliation to Statements of Financial Position
Other Assets (not included in Standardized) $1,508 $1,198
Total Assets subject to credit risk $159,619
Less Allowance for impairment
Less Collective Allowance $500
Total Assets $159,119 Total RWAs $75,768
*includes replacement values
December 31, 2013
Standardized Drawn ExposureCommitments
(Undrawn)OTC Derivatives*
Other Off
Balance Sheet
Items
Total RWAs
Bank $95,250 - $8 $52 $95,310 $24,763
Sovereign - - - - - -
Corporate $44,548 $5,891 $32 $3,700 $54,171 $45,493
Retail Residential Mortgages $11,339 $1,116 - - $12,455 $4,029
Other Retail $192 $39 - - $231 $119
Total Gross Credit Exposure $151,329 $7,046 $40 $3,752 $162,167 $74,404
Reconciliation to Statements of Financial Position
Other Assets (not included in Standardized) $1,312 $1,069
Total Assets subject to credit risk $152,641
Less Allowance for impairment
Less Collective Allowance $500
Total Assets $152,141 Total RWAs $75,473
*includes replacement values
September 30, 2013

25
Standardized Drawn ExposureCommitments
(Undrawn)OTC Derivatives*
Other Off
Balance Sheet
Items
Total RWAs
Bank $79,045 - $5 $53 $79,103 $22,051
Sovereign - - - - - -
Corporate $43,886 $5,719 $51 $3,458 $53,114 $44,643
Retail Residential Mortgages $10,814 $1,308 - - $12,122 $3,857
Other Retail $180 $37 - - $217 $111
Total Gross Credit Exposure $133,925 $7,064 $56 $3,511 $144,556 $70,662
Reconciliation to Statements of Financial Position
Other Assets (not included in Standardized) $1,107 $876
Total Assets subject to credit risk $135,032
Less Allowance for impairment
Less Collective Allowance $500
Total Assets $134,532 Total RWAs $71,538
*includes replacement values
June 30, 2013
Standardized Drawn ExposureCommitments
(Undrawn)OTC Derivatives*
Other Off
Balance Sheet
Items
Total RWAs
Bank $72,919 - $57 $51 $73,027 $21,582
Sovereign - - - - - -
Corporate $45,470 $5,861 $11 $5,380 $56,722 $46,760
Retail Residential Mortgages $10,609 $1,602 - - $12,211 $3,806
Other Retail $195 $36 - - $231 $123
Total Gross Credit Exposure $129,193 $7,499 $68 $5,431 $142,191 $72,271
Reconciliation to Statements of Financial Position
Other Assets (not included in Standardized) $1,236 $974
Total Assets subject to credit risk $130,429
Less Allowance for impairment $75
Less Collective Allowance $500
Total Assets $129,854 Total RWAs $73,245
*includes replacement values
March 31, 2013

26
2012:
Standardized Drawn ExposureCommitments
(Undrawn)OTC Derivatives*
Other Off
Balance Sheet
Items
Total RWAs
Bank $78,350 - $8 $119 $78,477 $21,376
Sovereign - - - - - -
Corporate $46,681 $6,736 $16 $3,242 $56,675 $47,423
Retail Residential Mortgages $9,763 $2,916 - - $12,679 $3,613
Other Retail $207 $36 - - $243 $132
Total Gross Credit Exposure $135,001 $9,688 $24 $3,361 $148,074 $72,544
Reconciliation to Statements of Financial Position
Other Assets (not included in Standardized) $1,415 $897
Total Assets subject to credit risk $136,416
Less Allowance for impairment $75
Less Collective Allowance $500
Total Assets $135,841 Total RWAs $73,441
*includes replacement values
December 31, 2012
Standardized Drawn ExposureCommitments
(Undrawn)OTC Derivatives*
Other Off
Balance Sheet
Items
Total RWAs
Bank $76,513 - $16 $49 $76,578 $20,907
Sovereign - - - - - -
Corporate $52,524 $7,429 $17 $2,458 $62,428 $52,583
Retail Residential Mortgages $9,758 - - - $9,758 $3,392
Other Retail $217 $37 - - $254 $139
Total Gross Credit Exposure $139,012 $7,466 $33 $2,507 $149,018 $77,021
Reconciliation to Statements of Financial Position
Other Assets (not included in Standardized) $943 $655
Total Assets subject to credit risk $139,955
Less Collective Allowance $537
Total Assets $139,418 Total RWAs $77,676
*includes replacement values
September 30, 2012

27
Standardized Drawn ExposureCommitments
(Undrawn)OTC Derivatives*
Other Off
Balance Sheet
Items
Total RWAs
Bank $74,304 - $57 $51 $74,412 $19,890
Sovereign - - - - - -
Corporate $53,777 $6,860 $25 $2,662 $63,324 $53,541
Retail Residential Mortgages $9,701 - - - $9,701 $3,395
Other Retail $204 $84 - - $288 $140
Total Gross Credit Exposure $137,986 $6,944 $82 $2,713 $147,725 $76,966
Reconciliation to Statements of Financial Position
Other Assets (not included in Standardized) $837 $540
Total Assets subject to credit risk $138,823
Less Collective Allowance $540
Total Assets $138,283 Total RWAs $77,506
*includes replacement values
June 30, 2012
Standardized Drawn ExposureCommitments
(Undrawn)OTC Derivatives*
Other Off
Balance Sheet
Items
Total RWAs
Bank $81,994 - $65 $536 $82,595 $24,215
Sovereign - - - - - -
Corporate $49,159 $8,587 $16 $2,744 $60,506 $49,517
Retail Residential Mortgages $8,307 - - - $8,307 $2,907
Other Retail $267 $74 - - $341 $181
Total Gross Credit Exposure $139,727 $8,661 $81 $3,280 $151,749 $76,820
Reconciliation to Statements of Financial Position
Other Assets (not included in Standardized) $843 $503
Total Assets subject to credit risk $140,570
Less Collective Allowance $500
Total Assets $140,070 Total RWAs $77,323
*includes replacement values
March 31, 2012
Note: Statements of Financial Position for September 30, June 30, and March 31 of 2012 and 2013 are not audited.

28
Geographic distribution of exposures broken down by major types of credit exposure:
2013:
Geographic Distibution of
ExposuresDrawn Exposure
Commitments
(Undrawn)OTC Derivatives*
Other Off Balance
Sheet ItemsTotal (%)
Canada: $139,710 $8,342 $40 $4,373 $152,465 89.20%
Ontario $136,211 $8,106 $40 $4,373 $148,730 87.01%
British Columbia 514 $236 - - $750 0.44%
Quebec $2,985 - - - $2,985 1.75%
USA $9,054 - - - $9,054 5.30%
Other $9,347 - $6 $53 $9,406 5.50%
Total Gross Credit Exposure $158,111 $8,342 $46 $4,426 $170,925 100%
*includes replacement values
December 31, 2013
Geographic Distibution of
ExposuresDrawn Exposure
Commitments
(Undrawn)OTC Derivatives*
Other Off Balance
Sheet ItemsTotal (%)
Canada: $133,970 $7,046 $32 $3,700 $144,748 89.26%
Ontario $130,704 $6,556 $32 $3,700 $140,992 86.94%
British Columbia 262 $488 - - $750 0.46%
Quebec $3,004 2 - - $3,006 1.85%
USA $7,052 - - - $7,052 4.35%
Other $10,307 - $8 $52 $10,367 6.39%
Total Gross Credit Exposure $151,329 $7,046 $40 $3,752 $162,167 100%
*includes replacement values
September 30, 2013
Geographic Distibution of
ExposuresDrawn Exposure
Commitments
(Undrawn)OTC Derivatives*
Other Off Balance
Sheet ItemsTotal (%)
Canada: $117,527 $7,064 $51 $3,458 $128,100 88.62%
Ontario $114,836 $6,314 $51 $3,458 $124,659 86.24%
British Columbia - $750 - - $750 0.52%
Quebec $2,691 - - - $2,691 1.86%
USA $5,719 - - - $5,719 3.96%
Other $10,679 - $5 $53 $10,737 7.43%
Total Gross Credit Exposure $133,925 $7,064 $56 $3,511 $144,556 100%
*includes replacement values
June 30, 2013

29
Geographic Distibution of
ExposuresDrawn Exposure
Commitments
(Undrawn)OTC Derivatives*
Other Off Balance
Sheet ItemsTotal (%)
Canada: $111,336 $7,499 $11 $5,380 $124,226 87.37%
Ontario $108,619 $6,749 $11 $5,380 $120,759 84.93%
British Columbia - $750 - - $750 0.53%
Quebec $2,717 - - - $2,717 1.91%
USA $4,769 - - - $4,769 3.35%
Other $13,088 - $57 $51 $13,196 9.28%
Total Gross Credit Exposure $129,193 $7,499 $68 $5,431 $142,191 100%
*includes replacement values
March 31, 2013
2012:
Geographic Distibution of
ExposuresDrawn Exposure
Commitments
(Undrawn)OTC Derivatives*
Other Off Balance
Sheet ItemsTotal (%)
Canada: $121,141 $9,688 $16 $3,243 $134,088 90.55%
Ontario $118,447 $7,780 $16 $3,243 $129,486 87.45%
British Columbia - $1,880 - - $1,880 1.27%
Quebec $2,694 $28 - - $2,722 1.84%
USA $3,574 - - - $3,574 2.41%
Other $10,286 - $8 $118 $10,412 7.03%
Total Gross Credit Exposure $135,001 $9,688 $24 $3,361 $148,074 100%
*includes replacement values
December 31, 2012
Geographic Distibution of
ExposuresDrawn Exposure
Commitments
(Undrawn)OTC Derivatives*
Other Off Balance
Sheet ItemsTotal (%)
Canada: $117,626 $7,466 $17 $2,458 $127,567 85.61%
Ontario $114,899 $5,540 $17 $2,458 $122,914 82.48%
British Columbia - $1,910 - - $1,910 1.28%
Quebec $2,727 $16 - - $2,743 1.84%
USA $10,567 - - - $10,567 7.09%
Other $10,819 - $16 $49 $10,884 7.30%
Total Gross Credit Exposure $139,012 $7,466 $33 $2,507 $149,018 100%
*includes replacement values
September 30, 2012
Geographic Distibution of
ExposuresDrawn Exposure
Commitments
(Undrawn)OTC Derivatives*
Other Off Balance
Sheet ItemsTotal (%)
Canada: $126,768 $6,944 $25 $2,662 $136,399 92.33%
Ontario $122,861 $6,021 $25 $2,662 $131,569 89.06%
British Columbia $989 $921 - - $1,910 1.29%
Quebec $2,918 $2 - - $2,920 1.98%
USA $1,825 - - - $1,825 1.24%
Other $9,393 - $57 $51 $9,501 6.43%
Total Gross Credit Exposure $137,986 $6,944 $82 $2,713 $147,725 100%
*includes replacement values
June 30, 2012

30
Geographic Distibution of
ExposuresDrawn Exposure
Commitments
(Undrawn)OTC Derivatives*
Other Off Balance
Sheet ItemsTotal (%)
Canada: $123,723 $8,661 $16 $2,744 $135,144 89.06%
Ontario $116,485 $7,290 $16 $2,744 $126,535 83.38%
British Columbia $4,233 $1,371 - - $5,604 3.69%
Quebec $3,005 - - - $3,005 1.98%
USA $1,489 - - - $1,489 0.98%
Other $14,515 - $65 $536 $15,116 9.96%
Total Gross Credit Exposure $139,727 $8,661 $81 $3,280 $151,749 100%
*includes replacement values
March 31, 2012
Industry (and Collective allowance) distribution of exposures broken down by major
types of credit exposure:
Reconciliation of changes in the allowances for impairment is presented in the Bank’s
Annual Report (audited) for 2013 fiscal year, Notes 3 “Nature and extent of risk arising from
financial instruments”, 4 “Exposure to credit risk”, and 5 “Past due and impaired assets and
allowance for impairment”.
2013:
Standardized exposure by IndustryDrawn
Exposure
Commitments
(Undrawn)OTC Derivatives*
Other Off Balance
Sheet ItemsTotal (%)
Collective
Allowance
Specific
Allowance
Bank $101,936 - $6 $53 $101,995 59.67% $52 -
Financial Services $101,936 - $6 $53 $101,995 59.67% $52 -
Corporate $43,879 $7,013 $40 $4,373 $55,305 32.36% $380 -
Capital Goods $55 $320 - - $375 0.22% - -
Communications - - - - - - - -
Metal & Mining $5,412 $199 - - $5,611 3.28% $46 -
Real Estate $17,647 $470 - $2,527 $20,644 12.08% $161 -
Resources & Basic Materials - - - - $0 0.00% - -
Retail & Wholesale $7,644 $4,370 9 814 $12,837 7.51% $59 -
Services $11,633 $47 - $500 $12,180 7.13% $106 -
Transportation - - - - $0 0.00% - -
Other $1,488 $1,607 $31 532 $3,658 2.14% $8 -
Retail Residential Mortgages $12,089 $1,281 - - $13,370 7.82% $65 -
Other Retail $207 $48 - - $255 0.15% $3 -
Total Gross Credit Exposure $158,111 $8,342 $46 $4,426 $170,925 100% $500 -
*includes replacement values
December 31, 2013
Note: At December 31, 2013, the Bank had neither past due nor individually impaired
assets.

31
Standardized exposure by IndustryDrawn
Exposure
Commitments
(Undrawn)OTC Derivatives*
Other Off Balance
Sheet ItemsTotal (%)
Collective
Allowance
Specific
Allowance
Bank $95,250 - $8 $52 $95,310 58.77% $58 -
Financial Services $95,250 - $8 $52 $95,310 58.77% $58 -
Corporate $44,549 $5,891 $32 $3,700 $54,172 33.41% $378 -
Capital Goods $94 $306 - 53 $453 0.28% 1 -
Communications - - - - - - - -
Metal & Mining $5,634 $113 - - $5,747 3.54% $46 -
Real Estate $17,601 $455 - $1,935 $19,991 12.33% $152 -
Resources & Basic Materials - 361 - - $361 0.22% - -
Retail & Wholesale $7,632 $3,004 - 726 $11,362 7.01% $57 -
Services $11,943 $60 - $470 $12,473 7.69% $103 -
Transportation - - - - $0 0.00% - -
Other $1,645 $1,592 $32 516 $3,785 2.33% $19 -
Retail Residential Mortgages $11,339 $1,116 - - $12,455 7.68% $62 -
Other Retail $191 $39 - - $230 0.14% $2 -
Total Gross Credit Exposure $151,329 $7,046 $40 $3,752 $162,167 100% $500 -
*includes replacement values
September 30, 2013
Note: At September 30, 2013, the Bank had neither past due nor individually impaired
assets.
Standardized exposure by IndustryDrawn
Exposure
Commitments
(Undrawn)OTC Derivatives*
Other Off Balance
Sheet ItemsTotal (%)
Collective
Allowance
Specific
Allowance
Bank $79,045 - $5 $53 $79,103 54.72% $61 -
Financial Services $79,045 - $5 $53 $79,103 54.72% $61 -
Corporate $43,886 $5,719 $51 $3,458 $53,114 36.74% $380 -
Capital Goods $49 $331 - - $380 0.26% - -
Communications - - - - - - - -
Metal & Mining $4,248 $489 - - $4,737 3.28% $39 -
Real Estate $18,057 $238 - $1,935 $20,230 13.99% $159 -
Resources & Basic Materials - 369 - - $369 0.26% - -
Retail & Wholesale $7,747 $2,715 23 623 $11,108 7.68% $59 -
Services $12,052 $48 - $374 $12,474 8.63% $106 -
Transportation - - - - $0 0.00% - -
Other $1,733 $1,529 $28 526 $3,816 2.64% $17 -
Retail Residential Mortgages $10,814 $1,308 - - $12,122 8.39% $58 -
Other Retail $180 $37 - - $217 0.15% $1 -
Total Gross Credit Exposure $133,925 $7,064 $56 $3,511 $144,556 100% $500 -
*includes replacement values
June 30, 2013
Note: At June 30, 2013, the Bank had neither past due nor individually impaired assets.

32
Standardized exposure by IndustryDrawn
Exposure
Commitments
(Undrawn)OTC Derivatives*
Other Off Balance
Sheet ItemsTotal (%)
Collective
Allowance
Specific
Allowance
Bank $72,919 - $57 $51 $73,027 51.36% $71 $75
Financial Services $72,919 - $57 $51 $73,027 51.36% $71 $75
Corporate $45,470 $5,861 $11 $5,380 $56,722 39.89% $372 -
Capital Goods $69 $299 - - $368 0.26% - -
Communications - - - - - - - -
Metal & Mining $4,434 $305 - - $4,739 3.33% $36 -
Real Estate $18,808 $271 - $2,137 $21,216 14.92% $161 -
Resources & Basic Materials - 355 - - $355 0.25% - -
Retail & Wholesale $6,619 $2,764 7 2,328 $11,718 8.24% $49 -
Services $12,562 $22 - $406 $12,990 9.14% $108 -
Transportation - - - - $0 0.00% - -
Other $2,978 $1,845 $4 509 $5,336 3.75% $18 -
Retail Residential Mortgages $10,609 $1,602 - - $12,211 8.59% $56 -
Other Retail $195 $36 - - $231 0.16% $1 -
Total Gross Credit Exposure $129,193 $7,499 $68 $5,431 $142,191 100% $500 $75
*includes replacement values
March 31, 2013
Note: The Bank's past due and individually impaired assets included only receivable
accounted for at amortized cost under a letter of credit ("LC") that was due for one payment
in the amount of $496 that had been stopped by a court order issued against the LC issuing
bank. The allowance for the impairment of the receivable amounted to $75 as of March 31,
2013.
In May, 2013, the receivable amount of $496 was received in full from the LC issuing bank
and the allowance for the impairment of $75 was reversed.
2012:
Note: The Bank's past due and individually impaired assets included only receivable
accounted for at amortized cost under a letter of credit ("LC") that was due for one payment
in the amount of $496 that had been stopped by a court order issued against the LC issuing
bank. The allowance for the impairment of the receivable amounted to $75 as of
December 31, 2012 (2011 - nil).
In May, 2013, the receivable amount of $496 was received in full from the LC issuing bank
and the allowance for the impairment of $75 was reversed.

33
Standardized exposure by IndustryDrawn
Exposure
Commitments
(Undrawn)OTC Derivatives*
Other Off Balance
Sheet ItemsTotal (%)
Collective
Allowance
Specific
Allowance
Bank $78,350 - $8 $119 $78,477 53.00% $60 $75
Financial Services $78,350 - $8 $119 $78,477 53.00% $60 $75
Corporate $46,681 $6,736 $16 $3,242 $56,675 38.27% $388 -
Capital Goods $41 $323 - - $364 0.25% - -
Communications - - 1 - 1 0 - -
Metal & Mining $4,571 $37 - - $4,608 3.11% $37 -
Real Estate $18,969 $451 - $1,367 $20,787 14.04% $163 -
Resources & Basic Materials - $348 - - $348 0.24% - -
Retail & Wholesale $7,671 $2,648 - 973 $11,292 7.63% $62 -
Services $12,589 $109 - $405 $13,103 8.85% $107 -
Transportation - - - - $0 0.00% - -
Other $2,840 $2,820 $15 497 $6,172 4.17% $19 -
Retail Residential Mortgages $9,763 $2,916 - - $12,679 8.56% $51 -
Other Retail $207 $36 - - $243 0.16% $1 -
Total Gross Credit Exposure $135,001 $9,688 $24 $3,361 $148,074 100% $500 $75
*includes replacement values
December 31, 2012
Note: At September 30, June 30, and March 31 of 2012, the Bank had neither past due nor
individually impaired assets.
Standardized exposure by IndustryDrawn
Exposure
Commitments
(Undrawn)OTC Derivatives*
Other Off Balance
Sheet ItemsTotal (%)
Collective
Allowance
Bank $76,513 - $16 $49 $76,578 51.39% $58
Financial Services $76,513 - $16 $49 $76,578 51.39% $58
Corporate $52,524 $7,429 $17 $2,458 $62,428 41.89% $425
Capital Goods $107 $312 - - $419 0.28% $1
Communications - - - - - - -
Metal & Mining $3,479 $2 - - $3,481 2.34% $29
Real Estate $21,196 $261 - $1,405 $22,862 15.34% $182
Resources & Basic Materials $74 $270 - - $344 0.23% $1
Retail & Wholesale $9,198 $1,088 - 157 $10,443 7.01% $67
Services $15,281 $45 - $404 $15,730 10.56% $130
Transportation - - - - $0 0.00% -
Other $3,189 $5,451 $17 492 $9,149 6.14% $15
Retail Residential Mortgages $9,758 - - - $9,758 6.55% $53
Other Retail $217 $37 - - $254 0.17% $1
Total Gross Credit Exposure $139,012 $7,466 $33 $2,507 $149,018 100% $537
*includes replacement values
September 30, 2012

34
Standardized exposure by IndustryDrawn
Exposure
Commitments
(Undrawn)OTC Derivatives*
Other Off Balance
Sheet ItemsTotal (%)
Collective
Allowance
Bank $74,304 - $57 $51 $74,412 50.37% $52
Financial Services $74,304 - $57 $51 $74,412 50.37% $52
Corporate $53,777 $6,860 $25 $2,662 $63,324 42.87% $434
Capital Goods $44 $323 - 18 $385 0.26% -
Communications - - 2 - 2 0 -
Metal & Mining $3,582 $35 - 191 $3,808 2.58% $29
Real Estate $21,557 $255 - $1,486 $23,298 15.77% $186
Resources & Basic Materials $308 $48 - - $356 0.24% $3
Retail & Wholesale $9,062 $857 $4 51 $9,974 6.75% $66
Services $13,338 $30 - $407 $13,775 9.32% $111
Transportation 53 $37 - - $90 0.06% -
Other $5,833 $5,275 $19 509 $11,636 7.88% $39
Retail Residential Mortgages $9,701 - - - $9,701 6.57% $53
Other Retail $204 $84 - - $288 0.19% $1
Total Gross Credit Exposure $137,986 $6,944 $82 $2,713 $147,725 100% $540
*includes replacement values
June 30, 2012
Standardized exposure by IndustryDrawn
Exposure
Commitments
(Undrawn)OTC Derivatives*
Other Off Balance
Sheet ItemsTotal (%)
Collective
Allowance
Bank $81,994 - $65 $536 $82,595 54.43% $74
Financial Services $81,994 - $65 $536 $82,595 54.43% $74
Corporate $49,159 $8,587 $16 $2,744 $60,506 39.87% $378
Capital Goods $65 $325 - - $390 0.26% $0
Communications - - - - - - -
Metal & Mining $3,070 $252 - - $3,322 2.19% $25
Real Estate $18,795 $258 - $1,712 $20,765 13.68% $161
Resources & Basic Materials $460 $79 - - $539 0.36% $4
Retail & Wholesale $6,830 $2,061 - 128 $9,019 5.94% $48
Services $9,365 $25 - $405 $9,795 6.45% $77
Transportation - $90 - - $90 0.06% -
Other $10,574 $5,497 $16 499 $16,586 10.93% $63
Retail Residential Mortgages $8,307 - - - $8,307 5.47% $46
Other Retail $267 $74 - - $341 0.22% $2
Total Gross Credit Exposure $139,727 $8,661 $81 $3,280 $151,749 100% $500
*includes replacement values
March 31, 2012

35
Residual contractual maturity breakdown of the whole portfolio broken down by major
types of credit exposure:
2013:
Residual Contractual Maturity Breakdown Drawn ExposureCommitments
(Undrawn)OTC Derivatives*
Other Off
Balance Sheet
Items
Total
Within 1 year $117,662 $8,342 $46 $4,426 $130,476
1 - 5 year $40,449 - - - $40,449
Greater than 5 year - - - - -
No specific maturity - - - - -
Total Gross Credit Exposure $158,111 $8,342 $46 $4,426 $170,925
*includes replacement values
December 31, 2013
Residual Contractual Maturity Breakdown Drawn ExposureCommitments
(Undrawn)OTC Derivatives*
Other Off
Balance Sheet
Items
Total
Within 1 year $112,286 $7,046 $40 $3,752 $123,124
1 - 5 year $39,043 - - - $39,043
Greater than 5 year - - - - -
No specific maturity - - - - -
Total Gross Credit Exposure $151,329 $7,046 $40 $3,752 $162,167
*includes replacement values
September 30, 2013
Residual Contractual Maturity Breakdown Drawn ExposureCommitments
(Undrawn)OTC Derivatives*
Other Off
Balance Sheet
Items
Total
Within 1 year $93,023 $7,064 $56 $3,511 $103,654
1 - 5 year $40,902 - - - $40,902
Greater than 5 year - - - - -
No specific maturity - - - - -
Total Gross Credit Exposure $133,925 $7,064 $56 $3,511 $144,556
*includes replacement values
June 30, 2013
Residual Contractual Maturity Breakdown Drawn ExposureCommitments
(Undrawn)OTC Derivatives*
Other Off
Balance Sheet
Items
Total
Within 1 year $88,291 $7,499 $68 $5,431 $101,289
1 - 5 year $40,902 - - - $40,902
Greater than 5 year - - - - -
No specific maturity - - - - -
Total Gross Credit Exposure $129,193 $7,499 $68 $5,431 $142,191
*includes replacement values
March 31, 2013

36
2012:
Residual Contractual Maturity Breakdown Drawn ExposureCommitments
(Undrawn)OTC Derivatives*
Other Off
Balance Sheet
Items
Total
Within 1 year $94,099 $9,688 $24 $3,361 $107,172
1 - 5 year $40,902 - - - $40,902
Greater than 5 year - - - - -
No specific maturity - - - - -
Total Gross Credit Exposure $135,001 $9,688 $24 $3,361 $148,074
*includes replacement values
December 31, 2012
Residual Contractual Maturity Breakdown Drawn ExposureCommitments
(Undrawn)OTC Derivatives*
Other Off
Balance Sheet
Items
Total
Within 1 year $93,984 $7,466 $33 $2,507 $103,990
1 - 5 year $45,028 - - - $45,028
Greater than 5 year - - - - -
No specific maturity - - - - -
Total Gross Credit Exposure $139,012 $7,466 $33 $2,507 $149,018
*includes replacement values
September 30, 2012
Residual Contractual Maturity Breakdown Drawn ExposureCommitments
(Undrawn)OTC Derivatives*
Other Off
Balance Sheet
Items
Total
Within 1 year $94,967 $6,944 $82 $2,713 $104,706
1 - 5 year $43,019 - - - $43,019
Greater than 5 year - - - - -
No specific maturity - - - - -
Total Gross Credit Exposure $137,986 $6,944 $82 $2,713 $147,725
*includes replacement values
June 30, 2012
Residual Contractual Maturity Breakdown Drawn ExposureCommitments
(Undrawn)OTC Derivatives*
Other Off
Balance Sheet
Items
Total
Within 1 year $104,290 $8,661 $81 $3,280 $116,312
1 - 5 year $35,437 - - - $35,437
Greater than 5 year - - - - -
No specific maturity - - - - -
Total Gross Credit Exposure $139,727 $8,661 $81 $3,280 $151,749
*includes replacement values
March 31, 2012

37
7. Credit risk: Disclosures for Portfolios subject to the Standardized
Approach
The External Credit Assessment Institution (ECAI) used by the Bank is Standard and Poor’s
(‘S&P’). S&P Ratings are recognized by the OSFI as an eligible ECAI and are used to assess
the credit quality of all exposure classes, where applicable, using the credit quality assessment
scale that is set out by the OSFI in the OSFI Guideline ‘Capital Adequacy Requirement (CAR) –
Simpler Approaches’.
The Bank currently uses S&P to rate exposure classes (claims) for deposit taking institutions
(‘DTIs ‘) and banks and daily alerts of rating changes from S&P are used to update existing
ratings as appropriate. All Bank’s corporate credit exposures are unrated.
In accordance with the OSFI CAR Guideline, the risk weight applied to a claim on a bank is
dependent on the credit assessment of the sovereign in the bank’s country of incorporation. The
bank risk weight is one notch less favorable than that which applies to its sovereign of
incorporation. The following risk weights apply to claims on DTIs and banks:
Credit assessment of
Sovereign AAA to AA- A+ to A- BBB+ to BBB- BB+ to B- Below B- Unrated
DTI/Bank Risk Weight
(Sovereign Credit
quality step 1 plus
notch)
20% 50% 100% 100% 150% 100%
The information below sets out the distribution of standardized exposures (bank’s outstandings
after risk mitigation subject to standardized approach) across credit quality steps for exposure
classes (claims) for DTIs and banks.
2013:
Standardized - Bank's Outstandings Risk Weight Drawn ExposureCommitments
(Undrawn)OTC Derivatives*
Other Off
Balance Sheet
Items
Total RWAs
Bank
Sovereign Credit quality step 1 plus notch 20% $95,963 - $6 - $95,969 $19,202
Sovereign Credit quality step 1 plus notch 50% - - - - -
Sovereign Credit quality step 1 plus notch 100% $5,973 - - $53 $6,026 $6,026
Sovereign Credit quality step 1 plus notch 150% - - - - - -
Unrated 100% - - - - - -
Total Bank exposure $101,936 - $6 $53 $101,995 $25,228
Corporate - all unrated 100% $43,879 $7,012 $40 $4,373 $55,304 $44,924
Retail Residential Mortgages - all unrated 35% $12,089 $1,282 - - $13,371 $4,295
Other Retail - all unrated 75% $207 $48 - - $255 $123
Total Gross Credit Exposure $158,111 $8,342 $46 $4,426 $170,925 $74,570
*includes replacement values
December 31, 2013

38
Standardized - Bank's Outstandings Risk Weight Drawn ExposureCommitments
(Undrawn)OTC Derivatives*
Other Off
Balance Sheet
Items
Total RWAs
Bank
Sovereign Credit quality step 1 plus notch 20% $88,182 - $8 - $88,190 $17,643
Sovereign Credit quality step 1 plus notch 50% - - - - -
Sovereign Credit quality step 1 plus notch 100% $7,068 - - $52 $7,120 $7,120
Sovereign Credit quality step 1 plus notch 150% - - - - - -
Unrated 100% - - - - - -
Total Bank exposure $95,250 - $8 $52 $95,310 $24,763
Corporate - all unrated 100% $44,548 $5,891 $32 $3,700 $54,171 $45,493
Retail Residential Mortgages - all unrated 35% $11,339 $1,116 - - $12,455 $4,029
Other Retail - all unrated 75% $192 $39 - - $231 $119
Total Gross Credit Exposure $151,329 $7,046 $40 $3,752 $162,167 $74,404
*includes replacement values
September 30, 2013
Standardized - Bank's Outstandings Risk Weight Drawn ExposureCommitments
(Undrawn)OTC Derivatives*
Other Off
Balance Sheet
Items
Total RWAs
Bank
Sovereign Credit quality step 1 plus notch 20% $71,326 - $5 - $71,331 $14,279
Sovereign Credit quality step 1 plus notch 50% - - - - -
Sovereign Credit quality step 1 plus notch 100% $7,719 - - $53 $7,772 $7,772
Sovereign Credit quality step 1 plus notch 150% - - - - - -
Unrated 100% - - - - - -
Total Bank exposure $79,045 - $5 $53 $79,103 $22,051
Corporate - all unrated 100% $43,886 $5,719 $51 $3,458 $53,114 $44,643
Retail Residential Mortgages - all unrated 35% $10,814 $1,308 - - $12,122 $3,857
Other Retail - all unrated 75% $180 $37 - - $217 $111
Total Gross Credit Exposure $133,925 $7,064 $56 $3,511 $144,556 $70,662
*includes replacement values
June 30, 2013
Standardized - Bank's Outstandings Risk Weight Drawn ExposureCommitments
(Undrawn)OTC Derivatives*
Other Off
Balance Sheet
Items
Total RWAs
Bank
Sovereign Credit quality step 1 plus notch 20% $64,440 - $57 - $64,497 $12,911
Sovereign Credit quality step 1 plus notch 50% - - - - -
Sovereign Credit quality step 1 plus notch 100% $7,973 - - $51 $8,024 $8,024
Sovereign Credit quality step 1 plus notch 150% $506 - - - $506 $647
Unrated 100% - - - - - -
Total Bank exposure $72,919 - $57 $51 $73,027 $21,582
Corporate - all unrated 100% $45,470 $5,861 $11 $5,380 $56,722 $46,760
Retail Residential Mortgages - all unrated 35% $10,609 $1,602 - - $12,211 $3,806
Other Retail - all unrated 75% $195 $36 - - $231 $123
Total Gross Credit Exposure $129,193 $7,499 $68 $5,431 $142,191 $72,271
*includes replacement values
March 31, 2013
Note: This analysis excludes corporate exposures as all corporate exposures are unrated with a
risk weight of 100%. Residential mortgages and other retail items are unrated because the
credit quality step methodology does not apply.
39
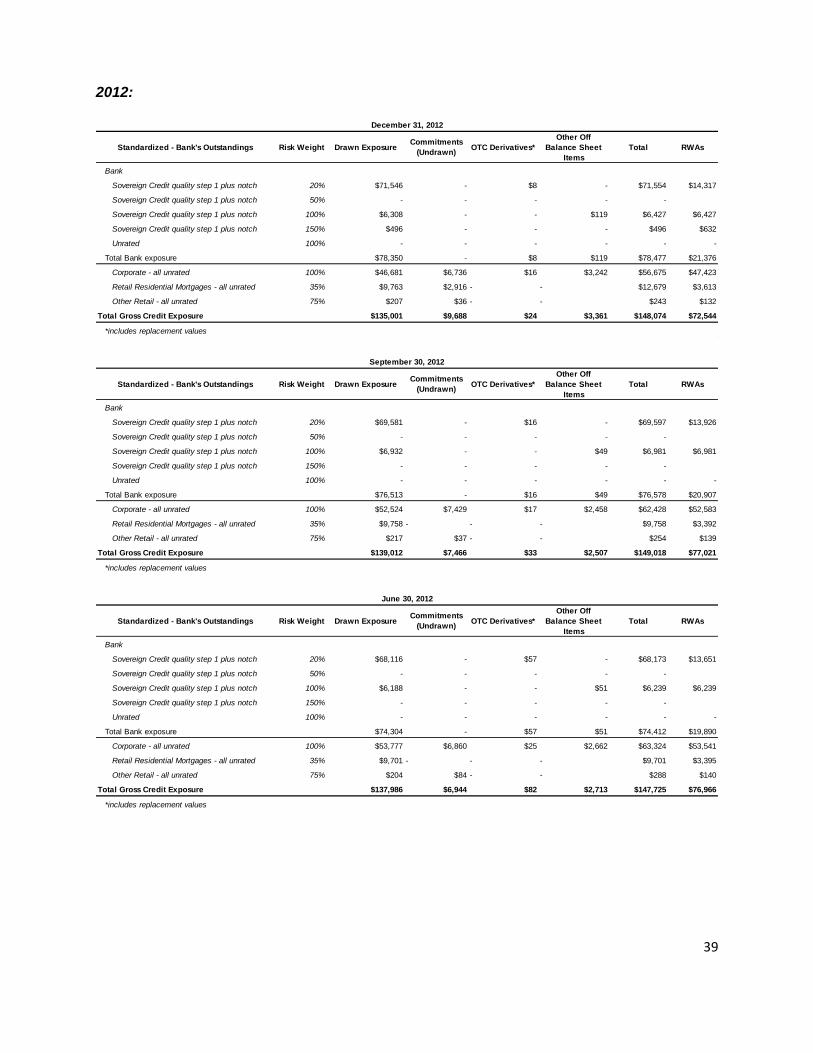
2012:
Standardized - Bank's Outstandings Risk Weight Drawn ExposureCommitments
(Undrawn)OTC Derivatives*
Other Off
Balance Sheet
Items
Total RWAs
Bank
Sovereign Credit quality step 1 plus notch 20% $71,546 - $8 - $71,554 $14,317
Sovereign Credit quality step 1 plus notch 50% - - - - -
Sovereign Credit quality step 1 plus notch 100% $6,308 - - $119 $6,427 $6,427
Sovereign Credit quality step 1 plus notch 150% $496 - - - $496 $632
Unrated 100% - - - - - -
Total Bank exposure $78,350 - $8 $119 $78,477 $21,376
Corporate - all unrated 100% $46,681 $6,736 $16 $3,242 $56,675 $47,423
Retail Residential Mortgages - all unrated 35% $9,763 $2,916 - - $12,679 $3,613
Other Retail - all unrated 75% $207 $36 - - $243 $132
Total Gross Credit Exposure $135,001 $9,688 $24 $3,361 $148,074 $72,544
*includes replacement values
December 31, 2012
Standardized - Bank's Outstandings Risk Weight Drawn ExposureCommitments
(Undrawn)OTC Derivatives*
Other Off
Balance Sheet
Items
Total RWAs
Bank
Sovereign Credit quality step 1 plus notch 20% $69,581 - $16 - $69,597 $13,926
Sovereign Credit quality step 1 plus notch 50% - - - - -
Sovereign Credit quality step 1 plus notch 100% $6,932 - - $49 $6,981 $6,981
Sovereign Credit quality step 1 plus notch 150% - - - - -
Unrated 100% - - - - - -
Total Bank exposure $76,513 - $16 $49 $76,578 $20,907
Corporate - all unrated 100% $52,524 $7,429 $17 $2,458 $62,428 $52,583
Retail Residential Mortgages - all unrated 35% $9,758 - - - $9,758 $3,392
Other Retail - all unrated 75% $217 $37 - - $254 $139
Total Gross Credit Exposure $139,012 $7,466 $33 $2,507 $149,018 $77,021
*includes replacement values
September 30, 2012
Standardized - Bank's Outstandings Risk Weight Drawn ExposureCommitments
(Undrawn)OTC Derivatives*
Other Off
Balance Sheet
Items
Total RWAs
Bank
Sovereign Credit quality step 1 plus notch 20% $68,116 - $57 - $68,173 $13,651
Sovereign Credit quality step 1 plus notch 50% - - - - -
Sovereign Credit quality step 1 plus notch 100% $6,188 - - $51 $6,239 $6,239
Sovereign Credit quality step 1 plus notch 150% - - - - -
Unrated 100% - - - - - -
Total Bank exposure $74,304 - $57 $51 $74,412 $19,890
Corporate - all unrated 100% $53,777 $6,860 $25 $2,662 $63,324 $53,541
Retail Residential Mortgages - all unrated 35% $9,701 - - - $9,701 $3,395
Other Retail - all unrated 75% $204 $84 - - $288 $140
Total Gross Credit Exposure $137,986 $6,944 $82 $2,713 $147,725 $76,966
*includes replacement values
June 30, 2012

40
Standardized - Bank's Outstandings Risk Weight Drawn ExposureCommitments
(Undrawn)OTC Derivatives*
Other Off
Balance Sheet
Items
Total RWAs
Bank
Sovereign Credit quality step 1 plus notch 20% $72,445 - $65 - $72,510 $14,519
Sovereign Credit quality step 1 plus notch 50% - - - - -
Sovereign Credit quality step 1 plus notch 100% $9,549 - - $536 $10,085 $9,696
Sovereign Credit quality step 1 plus notch 150% - - - - -
Unrated 100% - - - - - -
Total Bank exposure $81,994 - $65 $536 $82,595 $24,215
Corporate - all unrated 100% $49,159 $8,587 $16 $2,744 $60,506 $49,517
Retail Residential Mortgages - all unrated 35% $8,307 - - - $8,307 $2,907
Other Retail - all unrated 75% $267 $74 - - $341 $181
Total Gross Credit Exposure $139,727 $8,661 $81 $3,280 $151,749 $76,820
*includes replacement values
March 31, 2012
Note: This analysis excludes corporate exposures as all corporate exposures are unrated with a
risk weight of 100%. Residential mortgages and other retail items are unrated because the
credit quality step methodology does not apply.

41
8. Credit Risk Mitigation
Risk mitigation: The Bank’s approach when granting credit facilities is to do so on the basis of capacity to repay
rather than place primary reliance on credit risk mitigants. Depending on a customer’s standing
and the type of product, facilities may be provided unsecured.
Mitigation of credit risk is nevertheless a key aspect of effective risk management and takes
many forms.
The Bank’s general policy is to promote the use of credit risk mitigation, justified by commercial
prudence and good practice as well as capital efficiency. Specific, detailed policies cover the
acceptability, structuring and terms of various types of business with regard to the availability of
credit risk mitigation, for example in the form of collateral security. These policies, together with
the determination of suitable valuation parameters, are subject to regular review to ensure that
they are supported by empirical evidence and continue to fulfill their intended purpose.
The most common method of mitigating credit risk is to take collateral.
Collateral and other security enhancements: The Bank holds collateral against business and personal loans in the form of mortgage interest
over property, cash and term deposits, other security over assets, and guarantees. Guarantees
from third parties can arise where the Bank extends facilities without the benefit of any
alternative form of security.
Policies and procedures administer the protection of the Bank’s position from the start of a
customer relationship, for instance in requiring standard terms and conditions or specifically
agreed documentation permitting the offset of credit balances against debt obligations, and
through controls over the integrity, current valuation and, if necessary, realization of collateral
security.
Estimates of fair value are based on the value of collateral assessed at the time of borrowing,
and generally are not updated, except when a loan is renewed or individually assessed as
impaired.
An estimate of the fair value of collateral (main types) and other security enhancements held
against business and personal loans is presented in the Bank’s Annual Report (audited) for
2013 fiscal year, Note 4 “Exposure to credit risk”.

42
Risk concentrations within the mitigation taken:
The Bank follows prudent practices to mitigate risk concentrations under the collateral obtained.
The Bank’s loan portfolio (consisting of personal line of credit, business line of credit, personal
loan, business loan, commercial mortgage loan facility, and residential mortgage loan facility) is
primarily secured by tangible securities.
Tangible securities consist of bank’s first charge on commercial and / or residential property to
the maximum of loan to value of 75%, bank guarantees, and cash collateral. The bank further
mitigates the concentration risk by obtaining first charge on borrowers’ assets (commercial
loans), subordination and postponement of shareholders and related party claims (commercial
loans), personal guarantees of borrowers / directors (commercial and personal loans and
residential mortgages), and through comprehensive insurance on properties with the Bank
noted as loss payee (commercial and residential mortgages).
As at December 31, 2013, the Bank’s credit facilities secured against industrial buildings
concluded to 21.6% (2012 - 23.6%) of the grand total of primary collateral of the credit risk
portfolio. However, this collateral concentration is mitigated by additional securities such as first
charge on borrowers’ (corporate) assets, personal guarantees of beneficial shareholders,
subordination and postponement of shareholders and related party loans, and comprehensive
insurance of properties with the Bank noted as loss payee.
Overall risk concentrations within the mitigations taken are considered as low given the tangible
and intangible securities obtained by the Bank.
The following information gives details of the exposure (on- and / or off-balance sheet netting
is not applicable) covered by eligible financial collateral and by guarantees / credit derivatives
(as per Basel II requirement, the tables exclude other types of collateral mentioned above).
2013:
Standardized Drawn ExposureCommitments
(Undrawn)
OTC
Derivatives
*
Other Off
Balance Sheet
Items
Total
Eligible
Financial
Collateral**
Credit
Derivatives /
Guarantees**
Bank $101,936 - $6 $53 $101,995 - -
Sovereign - - - - - - -
Corporate $43,879 $7,012 $40 $4,373 $55,304 $4,478 -
Retail Residential Mortgages $12,089 $1,282 - - $13,371 $74 -
Other Retail $207 $48 - - $255 $56 -
Total Gross Credit Exposure $158,111 $8,342 $46 $4,426 $170,925 $4,608 -
*includes replacement values
**Exposures covered under Standardized (Simple) Approach (by cash and bank guarantees)
December 31, 2013

43
Standardized Drawn ExposureCommitments
(Undrawn)
OTC
Derivatives
*
Other Off
Balance Sheet
Items
Total
Eligible
Financial
Collateral**
Credit
Derivatives /
Guarantees**
Bank $95,250 - $8 $52 $95,310 - -
Sovereign - - - - - - -
Corporate $44,548 $5,891 $32 $3,700 $54,171 $3,637 -
Retail Residential Mortgages $11,339 $1,116 - - $12,455 $51 -
Other Retail $192 $39 - - $231 $44 -
Total Gross Credit Exposure $151,329 $7,046 $40 $3,752 $162,167 $3,732 -
*includes replacement values
**Exposures covered under Standardized (Simple) Approach (by cash and bank guarantees)
September 30, 2013
Standardized Drawn ExposureCommitments
(Undrawn)
OTC
Derivatives
*
Other Off
Balance Sheet
Items
Total
Eligible
Financial
Collateral**
Credit
Derivatives /
Guarantees**
Bank $79,045 - $5 $53 $79,103 - -
Sovereign - - - - - - -
Corporate $43,886 $5,719 $51 $3,458 $53,114 $3,776 -
Retail Residential Mortgages $10,814 $1,308 - - $12,122 $62 -
Other Retail $180 $37 - - $217 $44 -
Total Gross Credit Exposure $133,925 $7,064 $56 $3,511 $144,556 $3,882 -
*includes replacement values
**Exposures covered under Standardized (Simple) Approach (by cash and bank guarantees)
June 30, 2013
Standardized Drawn ExposureCommitments
(Undrawn)
OTC
Derivatives
*
Other Off
Balance Sheet
Items
Total
Eligible
Financial
Collateral**
Credit
Derivatives /
Guarantees**
Bank $72,919 - $57 $51 $73,027 - -
Sovereign - - - - - - -
Corporate $45,470 $5,861 $11 $5,380 $56,722 $3,743 -
Retail Residential Mortgages $10,609 $1,602 - - $12,211 $61 -
Other Retail $195 $36 - - $231 $42 -
Total Gross Credit Exposure $129,193 $7,499 $68 $5,431 $142,191 $3,846 -
*includes replacement values
**Exposures covered under Standardized (Simple) Approach (by cash and bank guarantees)
March 31, 2013
2012:
Standardized Drawn ExposureCommitments
(Undrawn)
OTC
Derivatives
*
Other Off
Balance Sheet
Items
Total
Eligible
Financial
Collateral**
Credit
Derivatives /
Guarantees**
Bank $78,350 - $8 $119 $78,477 - -
Sovereign - - - - - - -
Corporate $46,681 $6,736 $16 $3,242 $56,675 $3,876 -
Retail Residential Mortgages $9,763 $2,916 - - $12,679 $29 -
Other Retail $207 $36 - - $243 $42 -
Total Gross Credit Exposure $135,001 $9,688 $24 $3,361 $148,074 $3,947 -
*includes replacement values
**Exposures covered under Standardized (Simple) Approach (by cash and bank guarantees)
December 31, 2012

44
Standardized Drawn ExposureCommitments
(Undrawn)
OTC
Derivatives
*
Other Off
Balance Sheet
Items
Total
Eligible
Financial
Collateral**
Credit
Derivatives /
Guarantees**
Bank $76,513 - $16 $49 $76,578 - -
Sovereign - - - - - - -
Corporate $52,524 $7,429 $17 $2,458 $62,428 $4,034 -
Retail Residential Mortgages $9,758 - - - $9,758 $73 -
Other Retail $217 $37 - - $254 $42 -
Total Gross Credit Exposure $139,012 $7,466 $33 $2,507 $149,018 $4,149 -
*includes replacement values
**Exposures covered under Standardized (Simple) Approach (by cash and bank guarantees)
September 30, 2012
Standardized Drawn ExposureCommitments
(Undrawn)
OTC
Derivatives
*
Other Off
Balance Sheet
Items
Total
Eligible
Financial
Collateral**
Credit
Derivatives /
Guarantees**
Bank $74,304 - $57 $51 $74,412 - -
Sovereign - - - - - - -
Corporate $53,777 $6,860 $25 $2,662 $63,324 $4,389 -
Retail Residential Mortgages $9,701 - - - $9,701 - -
Other Retail $204 $84 - - $288 $35 -
Total Gross Credit Exposure $137,986 $6,944 $82 $2,713 $147,725 $4,424 -
*includes replacement values
**Exposures covered under Standardized (Simple) Approach (by cash and bank guarantees)
June 30, 2012
Standardized Drawn ExposureCommitments
(Undrawn)
OTC
Derivatives
*
Other Off
Balance Sheet
Items
Total
Eligible
Financial
Collateral**
Credit
Derivatives /
Guarantees**
Bank $81,994 - $65 $536 $82,595 - -
Sovereign - - - - - - -
Corporate $49,159 $8,587 $16 $2,744 $60,506 $4,447 -
Retail Residential Mortgages $8,307 - - - $8,307 - -
Other Retail $267 $74 - - $341 $45 -
Total Gross Credit Exposure $139,727 $8,661 $81 $3,280 $151,749 $4,492 -
*includes replacement values
**Exposures covered under Standardized (Simple) Approach (by cash and bank guarantees)
March 31, 2012

45
9. Derivatives
All of the Bank's derivative contracts are OTC foreign exchange forward transactions that are
privately negotiated between the Bank and the counterparty to the contract.
Foreign exchange forwards are contracts in which one party contracts with another to exchange
a specified amount of one currency for a specified amount of a second currency at a future date
or range of dates.
All derivative instruments were originated in Canada with maturities of six months or less.
The Bank does not engage in other types of derivative products.
The tables below provide an analysis of the Bank's derivative portfolio and related credit
exposure:
2013:
(a) Fair value of derivative financial instruments:
December 31, 2013 December 31, 2012
Favourable Unfavourable Favourable Unfavourable
Foreign exchange
forward contracts $ 46 $ 40 $ 24 $ 19
September 30, 2013 June 30, 2013 March 31, 2013 Favourable Unfavourable Favourable Unfavourable Favourable Unfavourable
Foreign exchange
forward contracts $ 40 $ 40 $ 56 $ 40 $ 68 $ 58
(b) Notional principal and credit exposure:
Foreign exchange forward contracts
December 31, 2013 December 31,2012
Notional amount* $ 7,527 $ 5,499 Current replacement cost** 46 24 Credit risk equivalent*** 120 84 Risk-adjusted balance**** 45 24

46
Foreign exchange forward contracts
September 30, June 30, March 31, 2013 2013 2013
Notional amount* $ 5,231 $ 12,335 $ 10,502 Current replacement cost** 40 56 68 Credit risk equivalent*** 98 184 188 RWAs**** 79 79 60
2012:
(a) Fair value of derivative financial instruments:
December 31, 2012 December 31, 2011
Favourable Unfavourable Favourable Unfavourable
Foreign exchange
forward contracts $ 24 $ 19 $ 76 $ 66
September 30, 2012 June 30, 2012 March 31, 2012 Favourable Unfavourable Favourable Unfavourable Favourable Unfavourable
Foreign exchange
forward contracts $ 33 $ 26 $ 82 $ 72 $ 81 $ 72
(b) Notional principal and credit exposure:
Foreign exchange forward contracts
December 31, 2012 December 31,2011
Notional amount* $ 5,499 $ 10,935 Current replacement cost** 24 76 Credit risk equivalent*** 84 201 Risk-adjusted balance**** 24 69
Foreign exchange forward contracts
September 30, June 30, March 31, 2012 2012 2012
Notional amount* $ 6,422 $ 14,737 $ 16,929 Current replacement cost** 33 82 81 Credit risk equivalent*** 96 250 253 RWAs**** 22 75 54
*The Notional amount is not recorded as an asset or liability as it represents the face amount of the contract to which a rate or price
is applied to determine the amount of cash flows to be exchanged. Notional principal amounts do not represent the potential gain or
loss associated with market risk and are not indicative of the credit risk associated with derivative financial instruments.

47
**Current replacement cost represents the cost of replacing all contracts that have a favourable fair value, using current market
rates. It represents in effect the unrealized gains on the Bank's derivative instruments. Replacement cost disclosed in the table
above represents the net amount of the asset and liability to a specific counterparty where the Bank has a legally enforceable right
to offset the amount owed to the Bank with the amount owed by the Bank and the Bank intends either to settle on a net basis or to
realize the asset and settle the liability simultaneously.
***Credit risk equivalent represents the total replacement cost plus an amount representing the potential future credit exposure, as
outlined in the Capital Adequacy Guideline of the Superintendent.
**** RWAs (‘risk-adjusted balance’) represents the credit risk equivalent, weighted based on the creditworthiness of the
counterparty, as prescribed by the Superintendent.
For qualitative and quantative disclosures refer to the Bank’s Annual Report (audited) for 2013
fiscal year, Note 1(n) “Derivative instruments – accounting policy”, Note 3 “Nature and extent of
risk arising from financial instruments”, Note 4 “Exposure to credit risk”, Note 13 “Fair value of
financial instruments”, and Note 14 “Derivative financial instruments”.

48
10. Market Risk and Interest Rate Risk in the Banking Book
Market risk is a risk of loss due to changes in interest and foreign currency rates. The Bank
manages these risks through specific policies that are approved by the Board.
In determining its market risk capital requirements, the Bank has adopted the standardized
approach. At December 31, 2013 and 2012, the Bank had immaterial levels of its open currency
position and its capital requirements were nil.
For qualitative and quantative disclosures refer to the Bank’s Annual Report (audited) for 2013
fiscal year, Note 1(a) “Financial assets and liabilities”, Note 1 (f) Foreign currency transactions,
Note 3 “Nature and extent of risk arising from financial instruments”, and Note 12 “Interest rate
sensitivity”.
The following tables summarize balance sheet assets, liabilities and shareholder's equity to
arrive at the Bank's interest rate gap based on the earlier of contractual repricing and maturity
dates (as of March 31, June 30, September 30 of 2013 and 2012, unaudited).
2013:
Floating Within 3 3 months 1 to 5 Non-rate
Rate months to 1 year years sensitive Total
Assets
Cash resources $84,943 $2,329 - - $1,211 $88,483
Loans $61,174 - $262 $1,683 ($500) $62,619
Other assets - - - - 1,039 $1,039
Total $146,117 $2,329 $262 $1,683 $1,750 $152,141
Liabilities & Shareholder's Equity
Deposits $24,884 $34,358 $31,966 $7,222 $34,144 $132,574
Other Liabilities - - - - $2,303 $2,303
Shareholder's Equity - - - - $17,264 $17,264
Total $24,884 $34,358 $31,966 $7,222 $53,711 $152,141
Total gap $121,233 ($32,029) ($31,704) ($5,539) ($51,961) $0
September 30, 2013
As at September 30, 2013, a one percentage point change in the market interest rate over a one-year period would have an impact
of approximately $193 on net interest income over the next year.

49
Floating Within 3 3 months 1 to 5 Non-rate
Rate months to 1 year years sensitive Total
Assets
Cash resources $68,372 $2,231 - - $1,031 $71,634
Loans $60,839 - $0 $1,695 ($500) $62,034
Other assets - - - - 864 $864
Total $129,211 $2,231 $0 $1,695 $1,395 $134,532
Liabilities & Shareholder's Equity
Deposits $23,920 $18,467 $33,058 $6,757 $33,573 $115,775
Other Liabilities - - - - $1,532 $1,532
Shareholder's Equity - - - - $17,225 $17,225
Total $23,920 $18,467 $33,058 $6,757 $52,330 $134,532
Total gap $105,291 ($16,236) ($33,058) ($5,062) ($50,935) $0
June 30, 2013
As at June 30, 2013, a one percentage point change in the market interest rate over a one-year period would have an impact of
approximately $227 on net interest income over the next year.
Floating Within 3 3 months 1 to 5 Non-rate
Rate months to 1 year years sensitive Total
Assets
Cash resources $59,841 $2,151 - - $2,737 $64,729
Loans $62,892 - $129 $1,706 ($575) $64,152
Other assets - - - - 973 $973
Total $122,733 $2,151 $129 $1,706 $3,135 $129,854
Liabilities & Shareholder's Equity
Deposits $22,575 $39,892 $14,305 $5,421 $29,268 $111,461
Other Liabilities - - - - $1,311 $1,311
Shareholder's Equity - - - - $17,082 $17,082
Total $22,575 $39,892 $14,305 $5,421 $47,661 $129,854
Total gap $100,158 ($37,741) ($14,176) ($3,715) ($44,526) $0
March 31, 2013
As at March 31, 2013, a one percentage point change in the market interest rate over a one-year period would have an impact of
approximately $119 on net interest income over the next year.
2012:
Floating Within 3 3 months 1 to 5 Non-rate
Rate months to 1 year years sensitive Total
Assets
Cash resources $65,831 $2,205 - - $1,850 $69,886
Loans $67,651 - $0 $1,730 ($537) $68,844
Other assets - - - - $688 $688
Total $133,482 $2,205 $0 $1,730 $2,001 $139,418
Liabilities & Shareholder's Equity
Deposits $25,783 $31,613 $28,842 $4,687 $29,623 $120,548
Other Liabilities - - - - $2,040 $2,040
Shareholder's Equity - - - - $16,830 $16,830
Total $25,783 $31,613 $28,842 $4,687 $48,493 $139,418
Total gap $107,699 ($29,408) ($28,842) ($2,957) ($46,492) $0
September 30, 2012

50
As at September 30, 2012, a one percentage point change in the market interest rate over a one-year period would have an impact
of approximately $139 on net interest income over the next year.
Floating Within 3 3 months 1 to 5 Non-rate
Rate months to 1 year years sensitive Total
Assets
Cash resources $65,051 $2,372 - - $995 $68,418
Loans $68,042 - $0 $1,741 ($540) $69,243
Other assets - - - - $622 $622
Total $133,093 $2,372 $0 $1,741 $1,077 $138,283
Liabilities & Shareholder's Equity
Deposits $26,273 $27,014 $31,956 $3,824 $31,219 $120,286
Other Liabilities - - - - $1,341 $1,341
Shareholder's Equity - - - - $16,656 $16,656
Total $26,273 $27,014 $31,956 $3,824 $49,216 $138,283
Total gap $106,820 ($24,642) ($31,956) ($2,083) ($48,139) $0
June 30, 2012
As at June 30, 2012, a one percentage point change in the market interest rate over a one-year period would have an impact of
approximately $204 on net interest income over the next year.
Floating Within 3 3 months 1 to 5 Non-rate
Rate months to 1 year years sensitive Total
Assets
Cash resources $68,889 $3,170 - - $714 $72,773
Loans $65,011 - $2,201 - ($500) $66,712
Other assets - - - - $585 $585
Total $133,900 $3,170 $2,201 -$ $799 $140,070
Liabilities & Shareholder's Equity
Deposits $20,789 $25,323 $33,272 $3,408 $39,476 $122,268
Other Liabilities - - - - $1,280 $1,280
Shareholder's Equity - - - - $16,522 $16,522
Total $20,789 $25,323 $33,272 $3,408 $57,278 $140,070
Total gap $113,111 ($22,153) ($31,071) ($3,408) ($56,479) $0
March 31, 2012
As at March 31, 2012, a one percentage point change in the market interest rate over a one-year period would have an impact of
approximately $156 on net interest income over the next year.

51
11. Operational Risk
The Bank has adopted the basic indicator approach in determining its operational risk capital
requirement.
For qualitative and quantative disclosures refer to the Bank’s Annual Report (audited) for 2013
fiscal year, Note 3(d) “Operational risk”, and Table 2 (Section 5.3) “Risk-weighted assets - by
risk type and regulatory capital requirements” above.

52
12. Remuneration
The Bank’s remuneration policy and compensation structure for senior management including
salaries and annual performance objective assessments is overseen by the Bank’s Board of
Directors (the “Board”) who meets at least four times annually and in 2013 met four times.
Senior management includes the Chief Executive Officer, Chief Financial Officer, Chief Risk
Officer and Chief Compliance Officer. The Bank has no other material risk takers.
Salaries vary by seniority and level of staff. Pay levels, based on market rates in Canada, and
annual increases, effective from January 1, and are approved by Habib Bank AG Zurich (the
Parent”).
The Board establishes performance assessment criteria annually for senior management based
on specific performance objectives that are structured to incentivize senior management to meet
strategic business objectives in a manner that is compliant with the Board’s approved risk
appetite and applicable governing legislation.
Senior management’s performance against the established criteria is assessed, and a weighting
applied, on the extent of the achievement or non-achievement of the objectives.
The senior management (and all employees) of the Bank participate in the Bank’s group benefit
plan (which provides certain health care, life insurance and other benefits) as well as the Bank’s
pension plan.
Key management personnel compensation for the year 2013 was $1,066 (2012 - $929). This
includes all short- and long-term wages and benefits, including directors’ fees and the amount
allocated to the Bank by the Parent (HBZ).
[End of the document]
March, 2014