h. chen and j. lu proceedings of meetings on acoustics · proceedings of meetings on acoustics,...
TRANSCRIPT
Proceedings of Meetings on Acoustics
Volume 14, 2011 http://acousticalsociety.org/
162nd MeetingAcoustical Society of America
San Diego, California 31 October - 4 November 2011
Session 3pBA: Biomedical Ultrasound/Bioresponse to Vibration
3pBA4. Estimation of two-dimensional strain rate based on high frame rate ultrasoundimaging method
Hong Chen and Jian-yu Lu*
*Corresponding author’s address: Bioengineering, The University of Toledo, Toledo, Ohio 43606, [email protected]
Current SR estimation methods that use speckle tracking technique are based on conventional delay-and-sum (D&S)imaging method with multiple transmissions, which causes skewed image of moving object resulting in inaccurate SR. To overcome the problem, a method to combine high frame rate imaging method (HFR) with speckle tracking technique wasproposed. Using only one or a few transmissions for each image; the new method can obtain a snapshot of moving targets, avoiding the skewing problem in D&S method that uses 91 transmissions. Studies, with simulated and experimental echodata respectively, were performed to verify the method. The new method is compared with D&S imaging method alsousing one transmission so that the skewing problem existing for D&S with multiple transmissions can be avoided. Bothplane wave (PW) and limited diffraction beam (LDB) were studied for the HFR imaging method. Results show that thenew method has comparable velocity errors and SR accuracy with the D&S method when using one transmission. More-over, the new method can measure high velocity in application such as blood flow measurement. Using a full view of theheart image, SR can be localized and then estimated.
Published by the Acoustical Society of America through the American Institute of Physics
H. Chen and J. Lu
© 2012 Acoustical Society of America [DOI: 10.1121/1.3681323]Received 15 Dec 2011; published 13 Jan 2012Proceedings of Meetings on Acoustics, Vol. 14, 020001 (2012) Page 1

1. Introduction Strain and strain rate can provide important diagnosis information about the tissue deformation and deformation rate, especially for heart disease diagnosis. To date, a lot of researches on extracting information of tissue health condition from strain and strain rate imaging have been accomplished. Two main techniques are at present used for strain and strain rate imaging. Tissue Doppler technique is one of the most prevalent methods1. The Doppler technique has been developed originally to measure the blood flow velocity; nevertheless, it can also be utilized to detect the slower tissue movement by filtering out the high speed component. However, the biggest limitation with Doppler method is that the detected strain and strain rate is angle-dependent, in which only the parameters along the axial direction is obtained. Thus, the strain rate in lateral direction, which is also informative, is ignored during diagnosis. To overcome this angle dependent limitation caused by the inherent shortcoming of Doppler method, two dimensional (2D) speckle tracking was introduced to calculate tissue strain and strain rate firstly by Robinson et al.2, and then further researched by Trahey et al.3. This technique utilizes the property of pattern uniqueness of speckles produced by the tissue inhomogeneity4. Since the speckle tracking technique calculates speckle displacement both in axial and lateral directions in a B-mode image, final strain and strain rate are angle independent. The problem existing for speckle tracking technique is that the accuracy of calculated strain and strain rate are lower when it is applied to analyze fast moving object, such as heart. That is caused by the skewed B-mode images generated by delay-and-sum (D&S) imaging method, which requires multiple transmissions to get one image.
To make full use of the angle independent advantage of speckle tracking technique and avoid the skewed image problem, a new method is proposed by combining 2D speckle tracking technique with high frame rate (HFR) imaging method of one transmission developed in our lab5,6. With only one transmission, the frame rate can achieve as high as about 6000 frames per second if imaging depth is at 120 mm. This paper conducts both simulation and experiment studies to verify the new method. Because D&S with multiple transmissions have obvious disadvantages of skewing problem and low detectable velocity for moving objects due to long echo acquisition time, the comparison study in this paper is restricted only to D&S with one transmission. To obtain the image using one transmission for D&S method, dynamic focusing is applied to all points throughout imaging area. This paper is organized as follows. Theoretical preliminary is given in Section 2. Sections 3 and 4 give the simulation and experimental designs and results, respectively. Discussion and conclusion are given in section 5 and 6.
2. Theoretical preliminary
2.1 Speckle tracking technique For speckle tracking technique, a 2D kernel region including interested speckles
at the center is first defined as a rectangular region (see Figure 1). Height and width of the kernel region depend on axial and lateral resolutions, assuring to include the whole interested speckles. A search region is then defined by centering the 2D kernel region. The height and width of search region depend on the velocity of moving targeted object.
H. Chen and J. Lu
Proceedings of Meetings on Acoustics, Vol. 14, 020001 (2012) Page 2

After kernel and search regions are manually defined, block match method is used to find out matched speckle in the next frame of image by searching the same speckle through the whole search region. Sum of absolute difference (SAD) given in Eq. (1) is utilized as a similarity measure for block matching.
���
�
�
�����
1
0
1
0
'))((, )(
N
i
M
jjmilji xxSAD Eq. (1)
Where jix , and is pixel value in the 2D kernel of the image with stationary
speckles; '))(( jmilx �� is the corresponding pixel value in a searching block of search region,
with l and m indicating the axial and lateral shifts; N and M are the height and width of 2D kernel region that are 32 and 200 respectively. The height and width of search region are 1200 and 800 respectively. The height and width of images analyzed in simulation and experiment studies are 6666 and 1066, respectively.
Figure 1. Block matching procedure for speckle tracking in two consecutive images.
After searching the whole search region in the consecutive image with block matching algorithm, the block in next image having smallest SAD is taken as the moved 2D kernel including interested speckle. The coordinate values of both original and moved speckles’ centers are recorded for the calculation of strain and strain rate.
H. Chen and J. Lu
Proceedings of Meetings on Acoustics, Vol. 14, 020001 (2012) Page 3

2.2 Strain rate calculation Strain and strain rate give the respective deformation and deformation rate of a
material, which is human tissue here. The strain calculation is given by Eq. (2) and illustrated in Figure 2.
00
0
LL
LLL �
��
�� Eq. (2)
Where � denotes strain; L is the material length after deformation; 0L is the original material length; L� is the length change.
Figure 2. Length change of a bar for strain and strain rate calculation.
A tissue segment can be either shortened or elongated, causing the strain to be negative and positive respectively. There is no unit for strain value. From strain value, strain rate can be derived by Eq. (3). So once the strain curve is drawn, strain rate curve can be easily obtained by differentiating strain value with respect to time. Strain rate means the deformation rate of a material, which if applied to assessment of human tissue, gives the information of whether the tissue is still in good condition or not functioning normally.
dtd�� � Eq. (3)
Where � denotes strain rate; t is time.
3. Simulation study and results
3.1 Simulation study conditions Simulation study is conducted to first verify the new method which is compared
with speckle tracking based on D&S with single transmission. Plane wave is utilized in the simulation because only one transmission is applied for imaging and all the imaging area needs be “illuminated” by ultrasound wave. One thing needs to be noticed is that limited diffraction beam is the same as plane wave when using only one transmission along the axial direction, without steering the transmission beam7,8. Two point scatterers are assumed at two different depths in the simulation study. They are initially at (0, 15 mm) and (-4.0, 70.0 mm). The reason for selecting two point scatterers at the depths of 15
H. Chen and J. Lu
Proceedings of Meetings on Acoustics, Vol. 14, 020001 (2012) Page 4

mm and 70 mm are that we want to mimic the measurement of longitudinal strain and strain rate of the heart tissue. The two point scatterers are assumed at two ends of a segment of tissue. The imaging area and point scatterer positions are given in Figure 3. The final reconstructed image has a width equal to 19.2 mm which is the width of transducer, and the depth is selected as 120 mm which is the usual imaging range. 1D phased array transducer is assumed for simulation study. It has 2.5 MHz center frequency, about 58% of two-way fractional bandwidth, and 128 elements (19.2 mm by 14 mm aperture size).
Figure 3. Imaging area in simulation study and the positions of two point scatterers.
As shown in Figure 3, point scatterer 1 is assumed moving at a constant speed of 0.5 m/s along the axial direction, and point scatterer 2 is assumed moving at a constant speed of 1.0 m/s along the direction rotating counterclockwise 30 degrees from axial direction. The movements of two point scatterers are virtually captured at 11 moments with time step of 0.001 s (or 1 ms) from the initial status (frame 0). Here, the image frame rate is set to be 1000 frames per second (1/0.001 s). With 1000 frames per second, the maximum detectable velocity is 121.5 m/s. Obviously, none of human tissue can move in that fast speed, so it is reasonable to assume frame rate to be 1000 frames per second.
3.2 Simulation results 11 consecutive echo data sets are automatically captured by HFR system. The 11 images reconstructed from dynamic focusing D&S method and from high frame imaging method are shown in Figure 4 (a) and (b) respectively. Image on the left most shows the initial state of two point scatterers and the trajectory of the two point scatterers are clearly seen in both Figure 4 (a) and (b).
H. Chen and J. Lu
Proceedings of Meetings on Acoustics, Vol. 14, 020001 (2012) Page 5

Figure 4. 11 consecutive images captured each time 1 ms elapsed, which are reconstructed from simulated echo data with one transmission. In (a), images are
reconstructed from the D&S method. In (b), images are reconstructed from HFR method.
Velocities of point scatterer 1 and 2 for 10 image frames at 10 image-capturing moments except starting moment are calculated by dividing the displacement between the original and new position over the time span. Results based on images from D&S and HFR methods are given in Figure 5. Velocity estimation error is also calculated based on the assumption that speckles 1 and 2 moving constantly at 0.5 m/s and 1.0 m/s respectively. Measured strain is given in Figure 6. By calculating the derivative of strain with respect to time, estimated strain rate is given in Figure 7.
(a) (b)
Figure 5. Measured velocities and velocity errors of point scatterer (speckle) 1 and 2 in simulation study. The exact moving velocities for Speckle 1 and 2 are 0.5 and 1 m/s respectively. (a) gives the velocity based on images from D&S method. (b) gives the velocity based on images from HFR method.
H. Chen and J. Lu
Proceedings of Meetings on Acoustics, Vol. 14, 020001 (2012) Page 6

(a) (b)
Figure 6. Estimated 2D strain based on (a) D&S method and (b) HFR method in simulation study.
(a) (b)
Figure 7. Estimated 2D strain rate based on (a) D&S method and (b) HFR method in simulation study.
4. Experimental study
4.1 Experiment conditions To further verify the new method of measuring strain and strain rate, experiments
are designed. Homemade HFR imaging system is used to acquire echo data7. Two glass beads are immersed into water in a water tank to mimic two point scatterers. The experiment settings are shown in Figure 8. The transducer is tilted at 30 degrees to get the oblique movement of point scatterer because the motor controlling glass bead movement can only move in horizontal direction.
H. Chen and J. Lu
Proceedings of Meetings on Acoustics, Vol. 14, 020001 (2012) Page 7
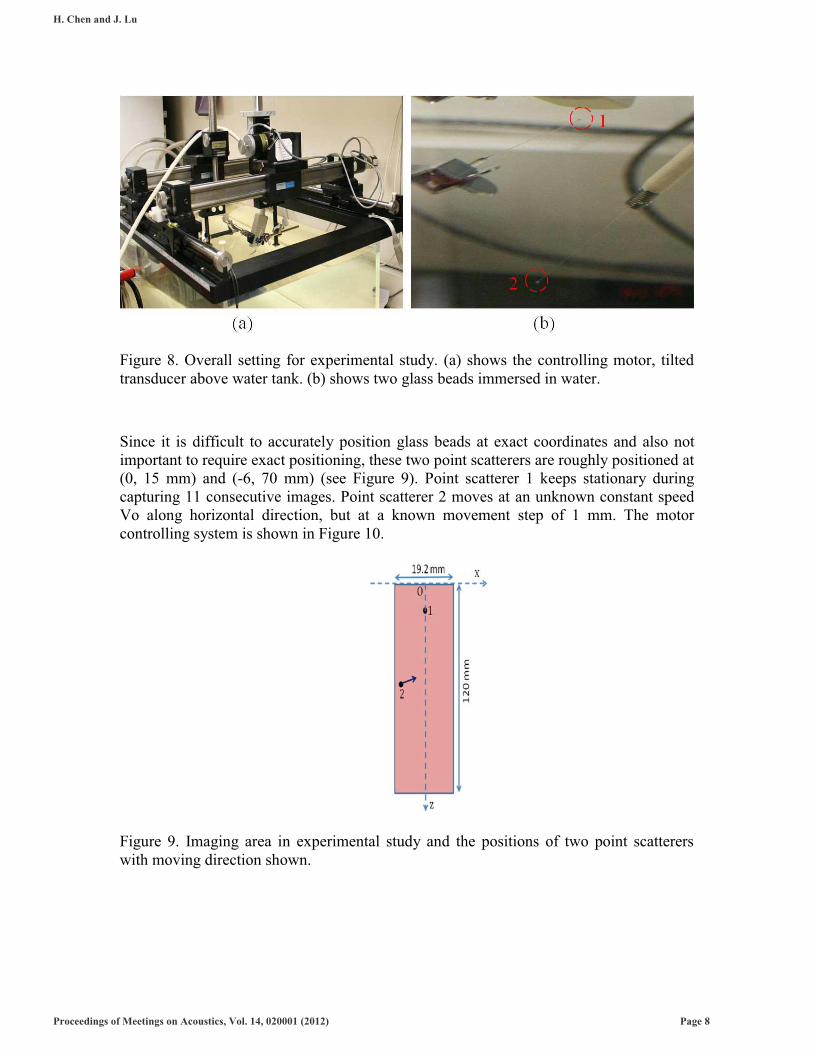
Figure 8. Overall setting for experimental study. (a) shows the controlling motor, tilted transducer above water tank. (b) shows two glass beads immersed in water.
Since it is difficult to accurately position glass beads at exact coordinates and also not important to require exact positioning, these two point scatterers are roughly positioned at (0, 15 mm) and (-6, 70 mm) (see Figure 9). Point scatterer 1 keeps stationary during capturing 11 consecutive images. Point scatterer 2 moves at an unknown constant speed Vo along horizontal direction, but at a known movement step of 1 mm. The motor controlling system is shown in Figure 10.
Figure 9. Imaging area in experimental study and the positions of two point scatterers with moving direction shown.
H. Chen and J. Lu
Proceedings of Meetings on Acoustics, Vol. 14, 020001 (2012) Page 8

Figure 10. Motor controlling system. (a) shows the software for controlling motor movement and sending triggers for HFR system. (b) shows the counter for counting trigger number.
The motor controlling system is connected with HFR system7. By setting the motor movement step as 1 mm, the motor controlling system sends trigger to HFR system (see Figure 11), to capture moving point scatterers each time the motor moves 1 mm in horizontal direction.
Figure 11. High frame imaging system7. (a) shows the software used for acquiring echo data. (b) shows the console on the system.
4.2 Experiment results Based on acquired experimental echo data via homemade high frame imaging system, 11 consecutive images reconstructed from D&S and HFR methods are shown in Figure 12. From the result, we can see point scatterer 1 is stationary and point scatterer 2
H. Chen and J. Lu
Proceedings of Meetings on Acoustics, Vol. 14, 020001 (2012) Page 9

moves at the designed trajectory. Estimated moving velocity (V) of point scatter 2 is divided by motor moving velocity (Vo) to obtain relative moving speed which is used for assessing velocity estimation accuracy. The estimated relative moving velocity of point scatterer 2 is shown in Figure 13. Because point scatterer 1 is assumed stationary, its velocities at frames from 1 to 10 are all zeros. The velocity calculations are conducted only for 10 images frames except frame 0 captured the starting moment. Figure 14 shows the estimated strain based on D&S and HFR methods.
Figure 12. 11 consecutive images based on experimental echo data acquired at 11 moments when motor moves 1 mm horizontally. Only one transmission is used to generate echo. Images in (a) are reconstructed with D&S method. Images in (b) are reconstructed with HFR method.
(a) (b)
Figure 13. Estimated moving step of two point scatterers (speckles) in experimental study. The exact value of relative moving velocity for Speckle 2 is 1 m/s. (a) is based on D&S method. (b) is based on HFR method.
H. Chen and J. Lu
Proceedings of Meetings on Acoustics, Vol. 14, 020001 (2012) Page 10

(a) (b)
Figure 14. Estimated 2D strain based on (a) D&S method and (b) HFR method in experimental study.
5. DISCUSSION In both simulation and experimental study, the quality of image reconstructed with the HFR method is almost the same as D&S method if only judged by human eyes. Moreover, HFR method reconstructs images in Fourier domain with fast Fourier transform, so the computation efficiency of HFR method will be superior to D&S method, especially when 3D image is reconstructed.5,6 In the simulation study, velocity estimation based on high frame imaging method is accurate, having 2.80% as the highest error for speckle 1 and 3.99% for speckle 2. The results are comparable with that of the conventional D&S method. In the experimental study, estimated relative moving velocity of speckle 2 has the highest error of 9.4 % for both D&S and high frame imaging methods, which means the new method combining speckle tracking with the high frame imaging method is effective to capture and assess motion.
About strain estimation in simulation study, the values are all positive because the virtual segment defined by two point scatterers are elongating based on the movement assumption. Since we assume that two speckles move at constant speeds and time interval between two consecutive images are the same, the length change of virtual tissue segment accumulate linearly. Strain estimation in experimental study has all negative values because the virtual tissue segment is shortening, which is apparently shown in Figure 9. By observing Eq. (2) and Eq. (3), it is easy to get that the accuracy of strain and strain rate estimation completely depends on the accuracy of displacement estimation which is directly given in experimental study and indirectly given by calculating the accuracy of velocity for simulation study. Therefore, small displacement error or velocity error ensures an accurate estimation of strain and strain rate with the proposed method.
H. Chen and J. Lu
Proceedings of Meetings on Acoustics, Vol. 14, 020001 (2012) Page 11

6. Conclusion This paper proposes a new method, combining speckle tracking technique and
HFR method, to measure strain and strain rate of human tissue. Through simulation and experimental studies by comparing the new method with the method based on the conventional D&S method, it is proven that the new method is effective and efficient to measure 2D strain and strain rate of fast moving objects. The snapshot of moving object in imaging area also assures object’s shape is not skewed and thus assures the accuracy of strain and strain rate imaging. If the proposed method is used for heart tissue assessment, it will provide full and accurate information of heart tissue elasticity, which is helpful for doctors. In the future, the method also has a potential for measuring blood flow velocity due to its capability of measuring quickly moving object.
References 1 H. Kanai, H. Hasegawa, N. Chubachi, Y. Koiwa, and M. Tanaka, "Noninvasive
evaluation of local myocardial thickening and its color-coded imaging," IEEE Transactions on Ultrasonics, Ferroelectrics, and Frequency Control, vol. 44, pp. 752-768, 1997.
2 D. E. Robinson, F. Chen, and L. S. Wilson, "Measurement of velocity of propagation from ultrasonic pulse-echo data," Ultrasound in Medicine & Biology, vol. 8, pp. 413-20, 1982.
3 G. E. Trahey, J. W. Allison, and O. T. von Ramm, "Angle Independent Ultrasonic Detection of Blood Flow," IEEE Transactions on Biomedical Engineering, vol. 34, pp. 965-967, 1987.
4 K. Kaluzynski, C. Xunchang, S. Y. Emelianov, A. R. Skovoroda, and M. O'Donnell, "Strain rate imaging using two-dimensional speckle tracking," IEEE Transactions on Ultrasonics, Ferroelectrics, and Frequency Control, vol. 48, pp. 1111-1123, 2001.
5 Jian-yu Lu, "2D and 3D high frame rate imaging with limited diffraction beams," IEEE Transactions on Ultrasonics Ferroelectrics and Frequency Control, vol. 44, pp. 839-856, Jul 1997.
6 Jian-yu Lu, "Experimental study of high frame rate imaging with limited diffraction beams," IEEE Transactions on Ultrasonics, Ferroelectrics, and Frequency Control, vol. 45, no. 1, pp. 84-97, January 1998.
7 Jian-yu Lu, Jiqi Cheng, and Jing Wang, "High frame rate imaging system for limited diffraction array beam imaging with square-wave aperture weightings," IEEE Transactions on Ultrasonics, Ferroelectrics, and Frequency Control, vol. 53, no. 10, pp. 1796-1812, October 2006.
8 Jian-yu Lu, "Designing limited diffraction beams," IEEE Transactions on Ultrasonics, Ferroelectrics, and Frequency Control, vol. 44, pp. 181-93, 1997.
H. Chen and J. Lu
Proceedings of Meetings on Acoustics, Vol. 14, 020001 (2012) Page 12