gwlap community acid sulfate soil monitoring august 2009
TRANSCRIPT
GWLAP Community Acid Sulfate Soil Monitoring August 2009 to April 2015
Author: Regina Durbridge
Community acid sulfate soil monitoring results for 5 of the original 51 community monitored sites which incorporates results from the first 2 years of the project for these sites.
An initiative funded by the Goolwa to Wellington Local Action Planning Association Inc. (GWLAP)
1 GWLAP Community Acid Sulfate Soil Monitoring, August 2009-April 2015
1. Introduction This project continues monitoring acid sulfate soils at five of the original Lower Lakes Community Acid Sulfate Soil Monitoring sites, which were monitored by community every three months over two years between August 2009 & June 2011. A further twelve round rounds of monitoring have taken place since June 2011, with a shift from surveys being conducted three monthly to an annual survey in autumn 2014. The data for these five sites from the original monitoring have been incorporated into this publication. See publication “GWLAP – Community Acid Sulfate Soil Monitoring Project 2009-2011” on the GWLAP website. The original project was part of the Lower Lakes Bioremediation and Revegetation Project funded by the South Australian Department of Environment and Natural Resources, as part of the South Australian Government’s $610 million Murray Futures program funded by Australian Government’s Water for the Future. The Lower Lakes Community Acid Sulfate Soil Monitoring project was initiated by community to map and monitor acid sulfate soils in the Lower Lakes South Australia. Project methodology was adapted from SA MDB NRM Acid Sulfate Soil monitoring method, and specifically adapted for community monitoring of acid sulfate soils in the Lower Lakes, with support and training provided by Dr. Mark Thomas and Dr. Rob Fitzpatrick from the CSIRO and managed by the Goolwa to Wellington Local Action Planning Association Inc. (GWLAP).
Acknowledgments: We would like to acknowledge Dr. Mark Thomas & Dr. Rob Fitzpatrick (CSIRO) for the training and especially Carole Richardson (GWLAP) for engaging the community and managing the initial project. Acknowledgements to Stephen Stewart and Wendy Conaghty from the Signal Point Riverine Environment Group for their continued assistance and to all the participating landholders for continued access to their properties for this project.
Disclaimer: The Goolwa to Wellington Local Action Planning Association Inc. and its employees do not warrant or make any representation regarding the use, or results of the use, of the information contained herein as regards to its correctness, accuracy, reliability, currency or otherwise. The Goolwa to Wellington Local Action Planning Association Inc. and its employees expressly disclaim all liability or responsibility to any person using the information or advice contained in this document.
Copyright: © Goolwa to Wellington LAP This work is copyright. Unless permitted under the Copyright Act 1968 (Cwlth), no part may be reproduced by any process without prior written permission from The Goolwa to Wellington Local Action Planning Association Inc. Requests and inquiries concerning reproduction and rights should be addressed to the Goolwa to Wellington LAP Association, Program Manager, PO Box 674, Strathalbyn, S.A., 5255
2 GWLAP Community Acid Sulfate Soil Monitoring, August 2009-April 2015
Contents 1. Introduction ....................................................................................................................................................... 1
Disclaimer:.................................................................................................................................................................. 1
Copyright: ................................................................................................................................................................... 1
Contents ..................................................................................................................................................................... 2
List of Figures.............................................................................................................................................................. 2
2. Background ........................................................................................................................................................ 3
3. Study site ........................................................................................................................................................... 4
4. Methods ............................................................................................................................................................. 4
4. Results Format ................................................................................................................................................... 5
5. Community Collected Results ............................................................................................................................. 6
5.1 BSD – Currency Creek ......................................................................................................................................... 7
5.2 BNH – Boggy Lake............................................................................................................................................... 8
5.3 DLG – Dunn’s Lagoon.......................................................................................................................................... 9
5.4 GES – Rumply Point, Lake Albert .......................................................................................................................10
5.5 NNS – Narrung Narrows ....................................................................................................................................11
List of Figures Figure 1. pH Scale ............................................................................................................................................................................................................ 3 Figure 2. Characteristic red staining of sulfuric soil ......................................................................................................................................................... 3 Figure 3. Dunn’s Lagoon Clayton Bay, February 2009 ..................................................................................................................................................... 3 Figure 4. Lower Lakes Community Acid Sulfate Soil Monitoring sites ............................................................................................................................. 4 Figure 5. Original method of soil samples extraction ...................................................................................................................................................... 5 Figure 6. Soil samples in chiptrays. ................................................................................................................................................................................. 5 Figure 7. Community developed soil extractor for deeper ............................................................................................................................................. 5 Figure 8. Soil samples being removed from deeper water .............................................................................................................................................. 5 Figure 9. Sample Soil pH Graph ....................................................................................................................................................................................... 6 Figure 10. BSD Soil pH Graph Site 1. E 0301140 N 6072856 ..................................................................................................................................... 7 Figure 11. BSD Soil pH Graph Site 2. E 0301141 N 6072860 ...................................................................................................................................... 7 Figure 12. BSD Soil pH Graph Site 3. E 0301131 N 6072914 ...................................................................................................................................... 7 Figure 13. BSD Soil pH Graph Site 4. E 0301132 N 6072947 ....................................................................................................................................... 7 Figure 14. Site 1 – BSD – Currency Creek, August 2009 .................................................................................................................................................. 7 Figure 15. Site 1 – BSD – Currency Creek, April 2015 ...................................................................................................................................................... 7 Figure 16. BNH Soil pH Graph Site 1. E 0335071 N 6090586 ...................................................................................................................................... 8 Figure 17. BNH Soil pH Graph Site 2. E 0335053 N 6090658 ......................................................................................................................................... 8 Figure 18. BNH Soil pH Graph Site 2B. 0335052 N 6090699 ....................................................................................................................................... 8 Figure 19. BNH Soil pH Graph Site 3. E 0335035 N 6090731 ..................................................................................................................................... 8 Figure 20. Site 1 – BNH – Boggy Lake, May 2010 ............................................................................................................................................................ 8 Figure 21. Site 1 – BNH – Boggy Lake, April 2015 ............................................................................................................................................................ 8 Figure 22. DLG Soil pH Graph Site 3. E 0312768 N 6070396 ...................................................................................................................................... 9 Figure 23. DLG Soil pH Graph Site 4. E 0312784 N 6070199 ..................................................................................................................................... 9 Figure 24. Site 1 – DLG – Dunn’s Lagoon, August 2009 ................................................................................................................................................... 9 Figure 25. Site 1 – DLG – Dunn’s Lagoon, April 2015 ....................................................................................................................................................... 9 Figure 26. GES Soil pH Graph Site 3. E 0338748 N 6056097 .................................................................................................................................... 10 Figure 27. GES – Rumply Point, August 2009 ................................................................................................................................................................ 10 Figure 28. Site 1 – GES – Rumply Point, March 2015 .................................................................................................................................................... 10 Figure 29. NNS Soil pH Graph Site 1. E 0341588 N 6064518 .................................................................................................................................... 11 Figure 30. NNS Soil pH Graph Site 2. E 0341548 N 6064455 .................................................................................................................................... 11 Figure 31. NNS Soil pH Graph Site 3. E 0341496 N 6064315 ................................................................................................................................... 11 Figure 32. NNS Soil pH Graph Site 4. E 0341685 N 6064779 .................................................................................................................................... 11 Figure 33. Site 1 – NNS – Narrung Narrows, November 2009 ....................................................................................................................................... 11 Figure 34. Site 1 – NNS – Narrung Narrows, March 2015 ............................................................................................................................................. 11
3 GWLAP Community Acid Sulfate Soil Monitoring, August 2009-April 2015
Background The recent drought in the Murray Darling Basin caused a severe reduction of freshwater inflows from the River Murray to the Lower Lakes, causing water levels to fall from a typical pre-drought water level of +0.7 m AHD to the (mid 2009) levels of; -0.8 m AHD Goolwa Channel, -0.6 m AHD Lake Alexandrina and -0.5 m AHD in Lake Albert. The lowering of lake water levels, combined with the shallow fringing depths of the Lakes, had incrementally exposed large areas of the lake bed shorelines with water receding up to 500 metres at some locations, and with this the potential for a large production of acid.
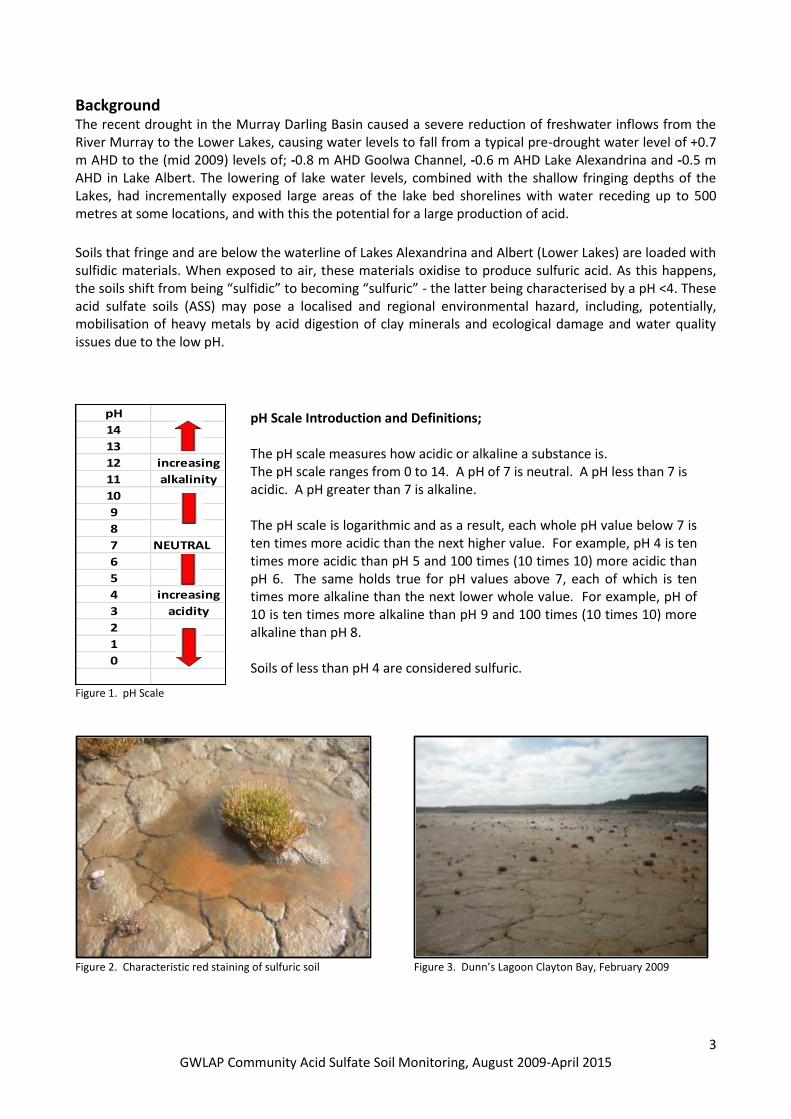
Soils that fringe and are below the waterline of Lakes Alexandrina and Albert (Lower Lakes) are loaded with sulfidic materials. When exposed to air, these materials oxidise to produce sulfuric acid. As this happens, the soils shift from being “sulfidic” to becoming “sulfuric” - the latter being characterised by a pH <4. These acid sulfate soils (ASS) may pose a localised and regional environmental hazard, including, potentially, mobilisation of heavy metals by acid digestion of clay minerals and ecological damage and water quality issues due to the low pH.
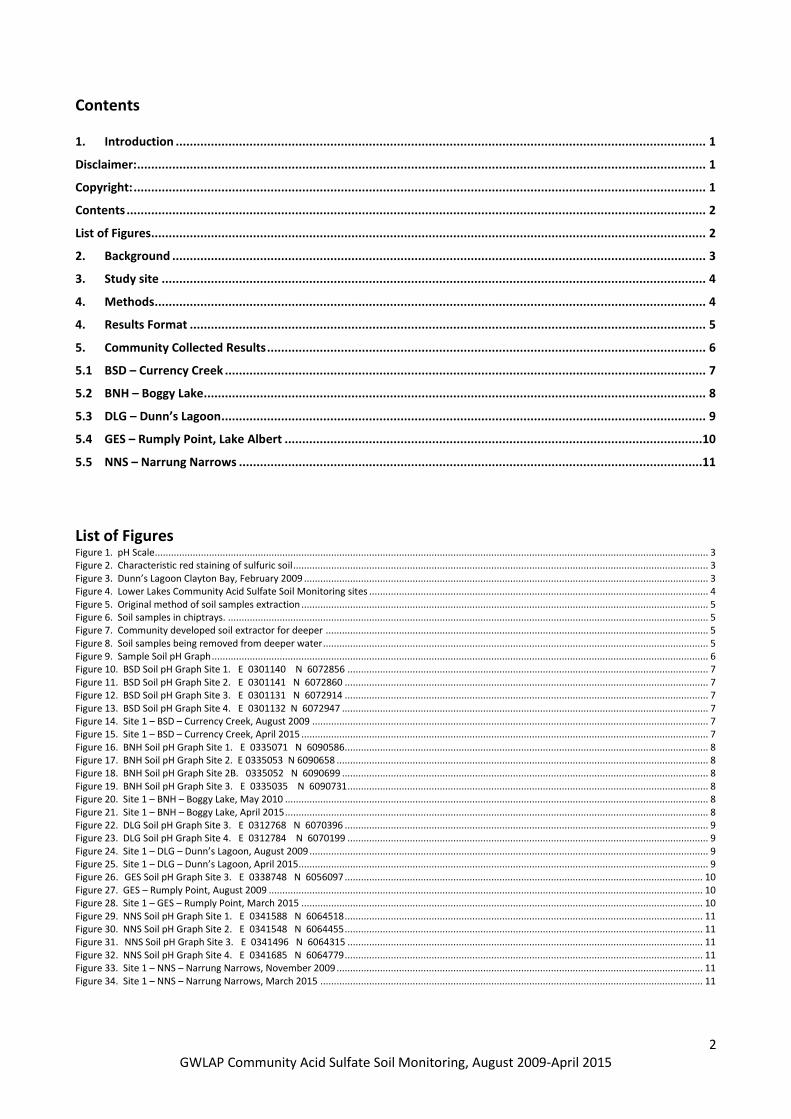
Figure 1. pH Scale
Figure 2. Characteristic red staining of sulfuric soil Figure 3. Dunn’s Lagoon Clayton Bay, February 2009
pH
14
13
12 increasing
11 alkalinity
10
9
8
7 NEUTRAL
6
5
4 increasing
3 acidity
2
1
0
pH Scale Introduction and Definitions; The pH scale measures how acidic or alkaline a substance is. The pH scale ranges from 0 to 14. A pH of 7 is neutral. A pH less than 7 is acidic. A pH greater than 7 is alkaline. The pH scale is logarithmic and as a result, each whole pH value below 7 is ten times more acidic than the next higher value. For example, pH 4 is ten times more acidic than pH 5 and 100 times (10 times 10) more acidic than pH 6. The same holds true for pH values above 7, each of which is ten times more alkaline than the next lower whole value. For example, pH of 10 is ten times more alkaline than pH 9 and 100 times (10 times 10) more alkaline than pH 8. Soils of less than pH 4 are considered sulfuric.
4 GWLAP Community Acid Sulfate Soil Monitoring, August 2009-April 2015
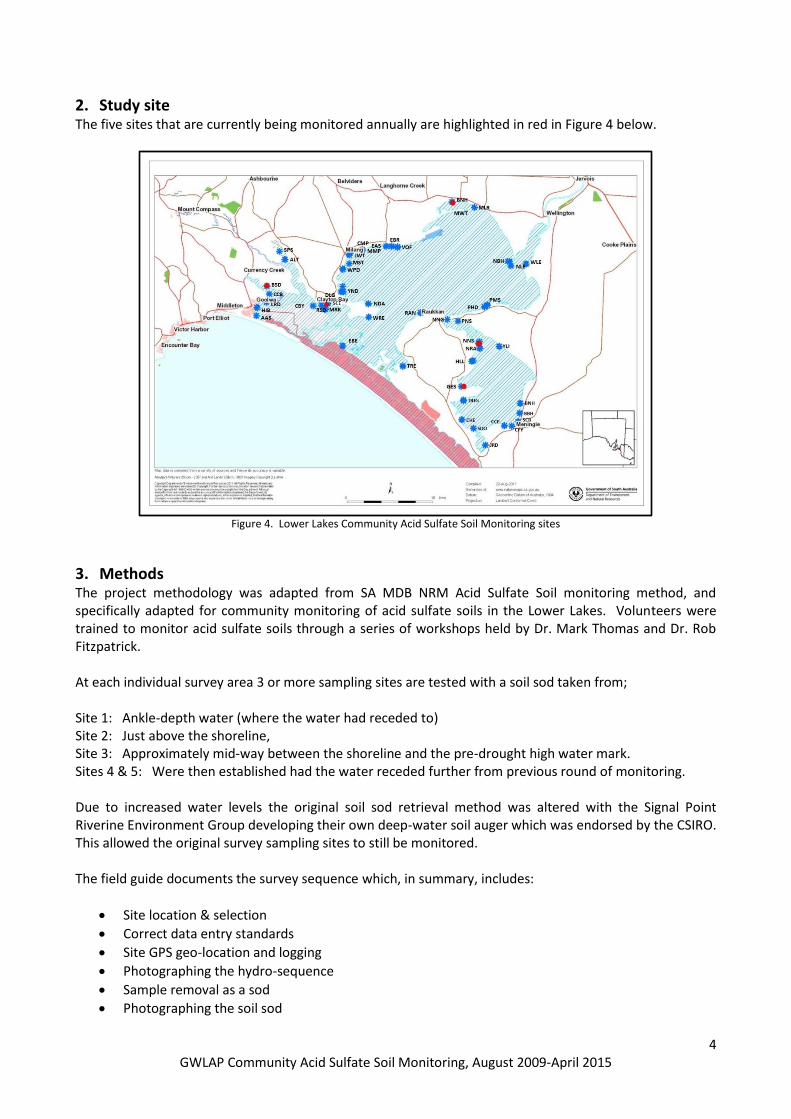
2. Study site The five sites that are currently being monitored annually are highlighted in red in Figure 4 below.
Figure 4. Lower Lakes Community Acid Sulfate Soil Monitoring sites
3. Methods The project methodology was adapted from SA MDB NRM Acid Sulfate Soil monitoring method, and specifically adapted for community monitoring of acid sulfate soils in the Lower Lakes. Volunteers were trained to monitor acid sulfate soils through a series of workshops held by Dr. Mark Thomas and Dr. Rob Fitzpatrick. At each individual survey area 3 or more sampling sites are tested with a soil sod taken from; Site 1: Ankle-depth water (where the water had receded to) Site 2: Just above the shoreline, Site 3: Approximately mid-way between the shoreline and the pre-drought high water mark. Sites 4 & 5: Were then established had the water receded further from previous round of monitoring. Due to increased water levels the original soil sod retrieval method was altered with the Signal Point Riverine Environment Group developing their own deep-water soil auger which was endorsed by the CSIRO. This allowed the original survey sampling sites to still be monitored. The field guide documents the survey sequence which, in summary, includes:
Site location & selection
Correct data entry standards
Site GPS geo-location and logging
Photographing the hydro-sequence
Sample removal as a sod
Photographing the soil sod
5 GWLAP Community Acid Sulfate Soil Monitoring, August 2009-April 2015
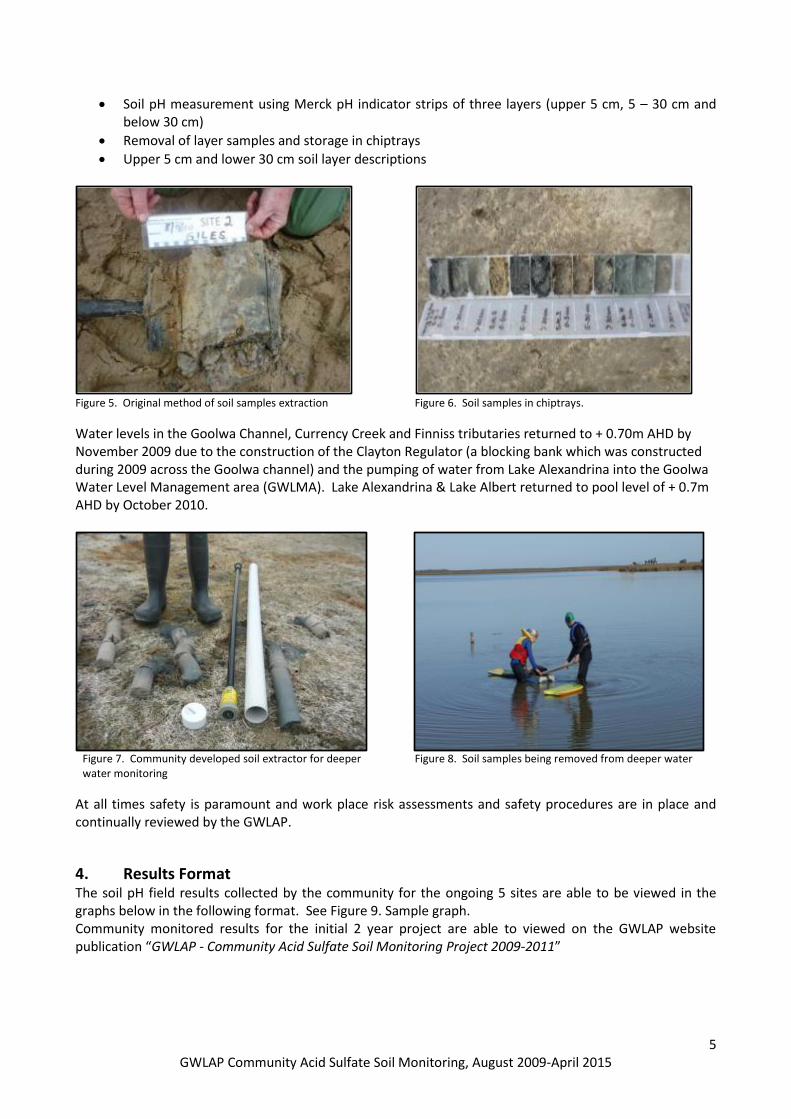
Soil pH measurement using Merck pH indicator strips of three layers (upper 5 cm, 5 – 30 cm and below 30 cm)
Removal of layer samples and storage in chiptrays
Upper 5 cm and lower 30 cm soil layer descriptions
Figure 5. Original method of soil samples extraction Figure 6. Soil samples in chiptrays.
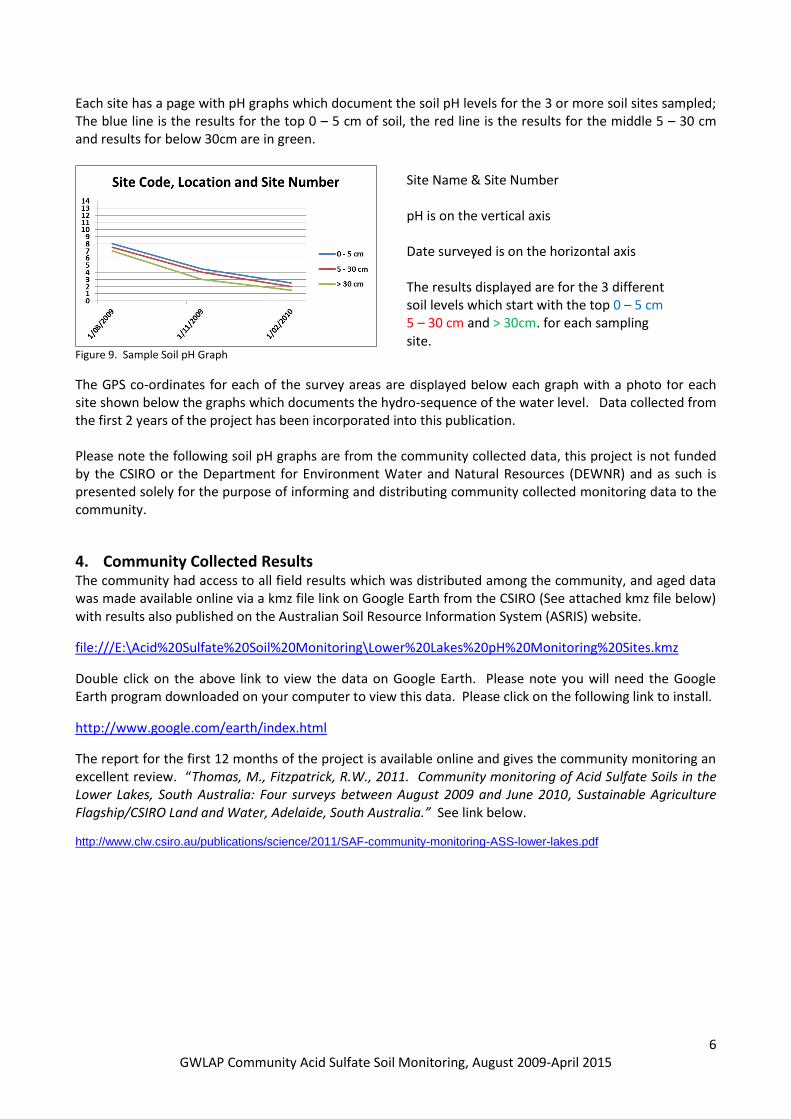
Water levels in the Goolwa Channel, Currency Creek and Finniss tributaries returned to + 0.70m AHD by November 2009 due to the construction of the Clayton Regulator (a blocking bank which was constructed during 2009 across the Goolwa channel) and the pumping of water from Lake Alexandrina into the Goolwa Water Level Management area (GWLMA). Lake Alexandrina & Lake Albert returned to pool level of + 0.7m AHD by October 2010.
Figure 7. Community developed soil extractor for deeper water monitoring
Figure 8. Soil samples being removed from deeper water
At all times safety is paramount and work place risk assessments and safety procedures are in place and continually reviewed by the GWLAP.
4. Results Format The soil pH field results collected by the community for the ongoing 5 sites are able to be viewed in the graphs below in the following format. See Figure 9. Sample graph. Community monitored results for the initial 2 year project are able to viewed on the GWLAP website publication “GWLAP - Community Acid Sulfate Soil Monitoring Project 2009-2011”
6 GWLAP Community Acid Sulfate Soil Monitoring, August 2009-April 2015
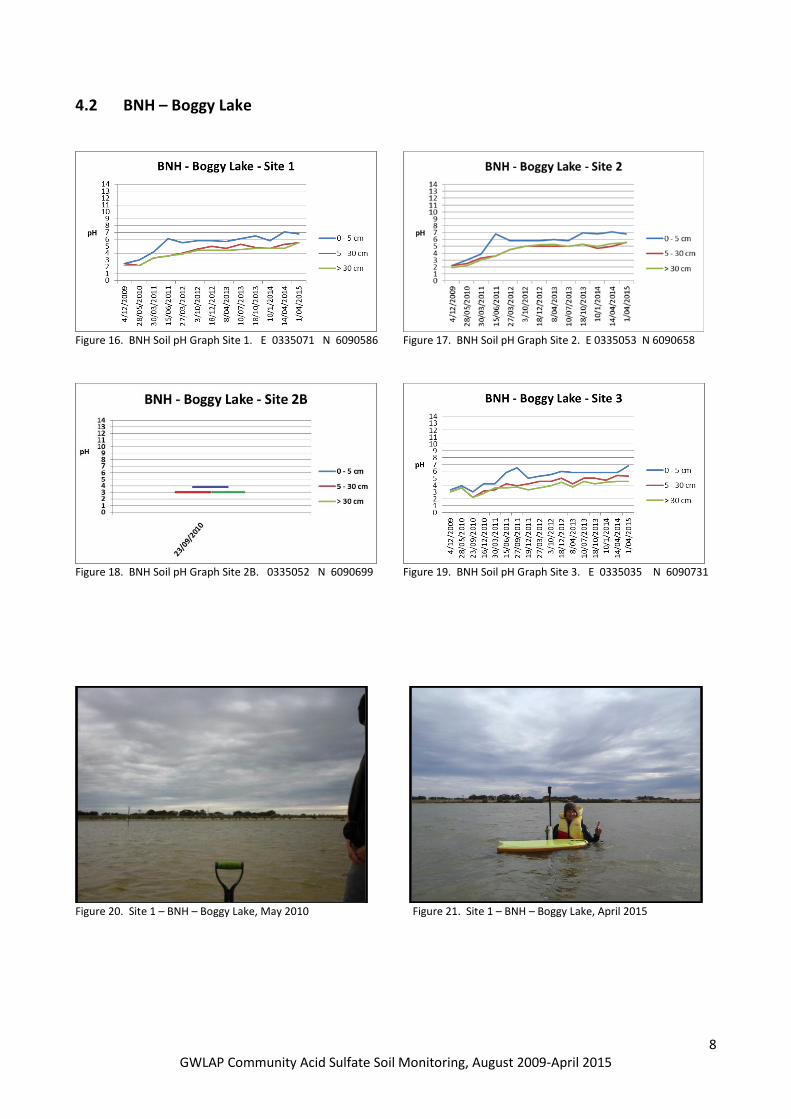
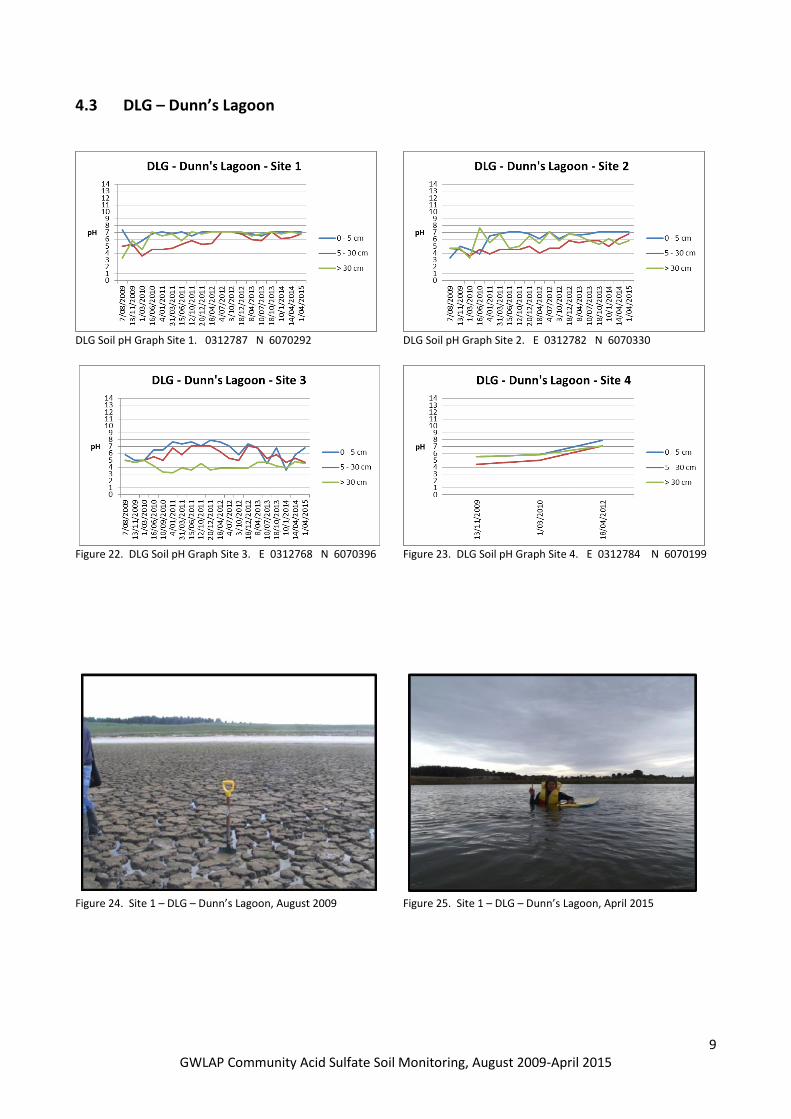
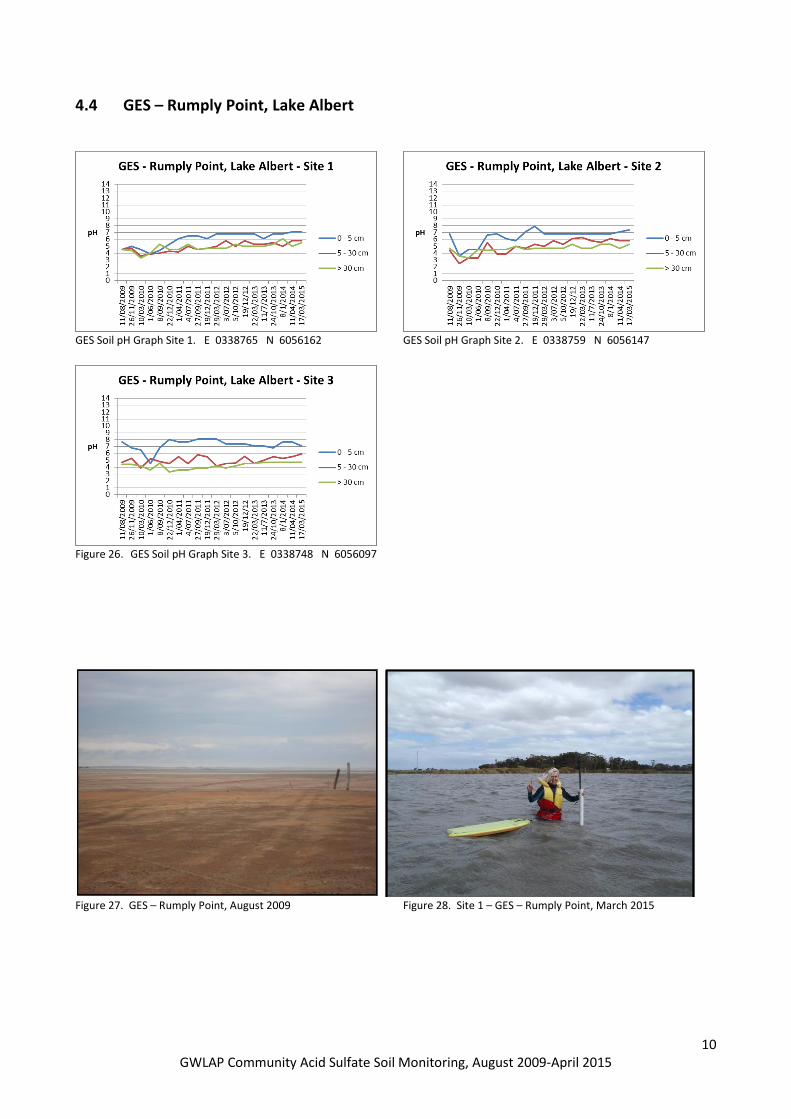
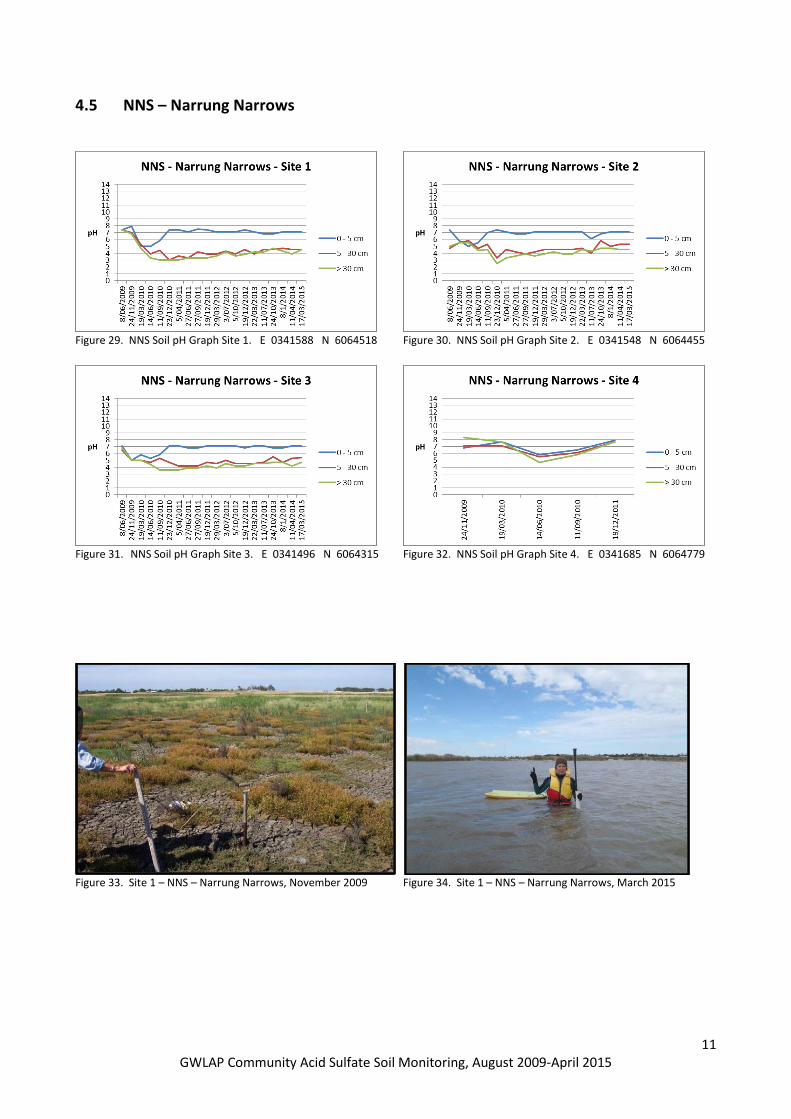
Each site has a page with pH graphs which document the soil pH levels for the 3 or more soil sites sampled; The blue line is the results for the top 0 – 5 cm of soil, the red line is the results for the middle 5 – 30 cm and results for below 30cm are in green.
Figure 9. Sample Soil pH Graph
The GPS co-ordinates for each of the survey areas are displayed below each graph with a photo for each site shown below the graphs which documents the hydro-sequence of the water level. Data collected from the first 2 years of the project has been incorporated into this publication. Please note the following soil pH graphs are from the community collected data, this project is not funded by the CSIRO or the Department for Environment Water and Natural Resources (DEWNR) and as such is presented solely for the purpose of informing and distributing community collected monitoring data to the community.
4. Community Collected Results The community had access to all field results which was distributed among the community, and aged data was made available online via a kmz file link on Google Earth from the CSIRO (See attached kmz file below) with results also published on the Australian Soil Resource Information System (ASRIS) website.
file:///E:\Acid%20Sulfate%20Soil%20Monitoring\Lower%20Lakes%20pH%20Monitoring%20Sites.kmz
Double click on the above link to view the data on Google Earth. Please note you will need the Google Earth program downloaded on your computer to view this data. Please click on the following link to install.
http://www.google.com/earth/index.html
The report for the first 12 months of the project is available online and gives the community monitoring an excellent review. “Thomas, M., Fitzpatrick, R.W., 2011. Community monitoring of Acid Sulfate Soils in the Lower Lakes, South Australia: Four surveys between August 2009 and June 2010, Sustainable Agriculture Flagship/CSIRO Land and Water, Adelaide, South Australia.” See link below.
http://www.clw.csiro.au/publications/science/2011/SAF-community-monitoring-ASS-lower-lakes.pdf
Site Name & Site Number pH is on the vertical axis Date surveyed is on the horizontal axis The results displayed are for the 3 different soil levels which start with the top 0 – 5 cm 5 – 30 cm and > 30cm. for each sampling site.
7 GWLAP Community Acid Sulfate Soil Monitoring, August 2009-April 2015
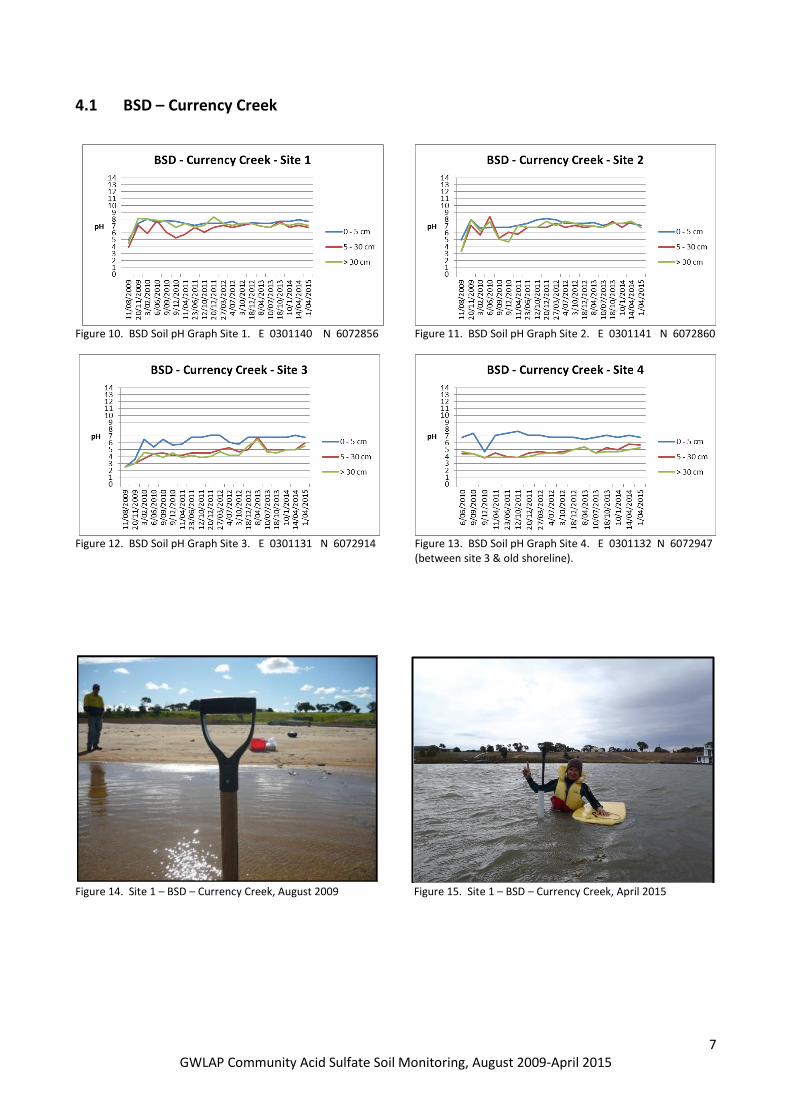
4.1 BSD – Currency Creek
Figure 10. BSD Soil pH Graph Site 1. E 0301140 N 6072856
Figure 11. BSD Soil pH Graph Site 2. E 0301141 N 6072860
Figure 12. BSD Soil pH Graph Site 3. E 0301131 N 6072914
Figure 13. BSD Soil pH Graph Site 4. E 0301132 N 6072947 (between site 3 & old shoreline).
Figure 14. Site 1 – BSD – Currency Creek, August 2009
Figure 15. Site 1 – BSD – Currency Creek, April 2015
8 GWLAP Community Acid Sulfate Soil Monitoring, August 2009-April 2015
4.2 BNH – Boggy Lake
Figure 16. BNH Soil pH Graph Site 1. E 0335071 N 6090586
Figure 17. BNH Soil pH Graph Site 2. E 0335053 N 6090658
Figure 18. BNH Soil pH Graph Site 2B. 0335052 N 6090699
Figure 19. BNH Soil pH Graph Site 3. E 0335035 N 6090731
Figure 20. Site 1 – BNH – Boggy Lake, May 2010 Figure 21. Site 1 – BNH – Boggy Lake, April 2015
9 GWLAP Community Acid Sulfate Soil Monitoring, August 2009-April 2015
4.3 DLG – Dunn’s Lagoon
DLG Soil pH Graph Site 1. 0312787 N 6070292
DLG Soil pH Graph Site 2. E 0312782 N 6070330
Figure 22. DLG Soil pH Graph Site 3. E 0312768 N 6070396
Figure 23. DLG Soil pH Graph Site 4. E 0312784 N 6070199
Figure 24. Site 1 – DLG – Dunn’s Lagoon, August 2009
Figure 25. Site 1 – DLG – Dunn’s Lagoon, April 2015
10 GWLAP Community Acid Sulfate Soil Monitoring, August 2009-April 2015
4.4 GES – Rumply Point, Lake Albert
GES Soil pH Graph Site 1. E 0338765 N 6056162
GES Soil pH Graph Site 2. E 0338759 N 6056147
Figure 26. GES Soil pH Graph Site 3. E 0338748 N 6056097
Figure 27. GES – Rumply Point, August 2009
Figure 28. Site 1 – GES – Rumply Point, March 2015
11 GWLAP Community Acid Sulfate Soil Monitoring, August 2009-April 2015
4.5 NNS – Narrung Narrows
Figure 29. NNS Soil pH Graph Site 1. E 0341588 N 6064518
Figure 30. NNS Soil pH Graph Site 2. E 0341548 N 6064455
Figure 31. NNS Soil pH Graph Site 3. E 0341496 N 6064315
Figure 32. NNS Soil pH Graph Site 4. E 0341685 N 6064779
Figure 33. Site 1 – NNS – Narrung Narrows, November 2009 Figure 34. Site 1 – NNS – Narrung Narrows, March 2015