gut content and pigment analysis in the …david.cowles/theses/mclarty_thesis...gut content and...
TRANSCRIPT

GUT CONTENT AND PIGMENT ANALYSIS IN THE MARINE ISOPOD
PENTIDOTEA RESECATA
by
SHELLEY J. MCLARTY
A THESIS
submitted to
WALLA WALLA UNIVERSITY
in partial fulfillment of
the requirements for the
degree of
MASTER OF SCIENCE
September 2015


iii
ABSTRACT
The marine isopod Pentidotea resecata lives on eelgrass (Zostera marina) along
the west coast of North America. These green animals closely match their eelgrass
substrate in color, suggesting that these isopods may obtain their green color at least
partly from the eelgrass. This suggestion is further supported by evidence that the isopods
feed on eelgrass, including the presence of large sections of whole eelgrass cells within
the lumen of the isopod hindgut. These eelgrass cells contain chloroplasts and at least
some functional chlorophyll, as indicated by chlorophyll fluorescence. Chlorophyll
pigments can also be extracted from isopod tissue; however, most of the pigment present
is actually pheophytin, a degradation product of chlorophyll. Diatoms are also frequently
found within the contents of the gut, and most likely represent the source of chlorophyll c
found within the isopod. Thus these isopods contain photosynthetic machinery within the
lumen of their hindgut in the form of whole eelgrass cells and diatoms.

iv
TABLE OF CONTENTS
Page
LIST OF TABLES ........................................................................................................... vi
LIST OF FIGURES ........................................................................................................ vii
INTRODUCTION..............................................................................................................1
Photosymbiotic Associations .........................................................................................1
Sacoglossan Model ..................................................................................................1
Crustacean Models ..................................................................................................3
Potential Photosynthesis in Pentidotea resecata ...........................................................5
MATERIALS AND METHODS ....................................................................................12 Sample Collection Site .................................................................................................12
Experiments with Eelgrass ...........................................................................................12
Eelgrass Collection and Maintenance ...................................................................12
Eelgrass Microscopy ..............................................................................................12
Chlorophyll Extraction from Eelgrass ...................................................................14
Spectrophotometric Procedure for Chlorophyll Determination ............................15
Experiments with Isopods ............................................................................................17
Animal Collection and Care ..................................................................................17
Isopod Microscopic Analysis .................................................................................18
Isopod Tissue Sample Preparation ........................................................................18
Isopod Pigment Analysis ........................................................................................20
Statistical Analysis of Pigment Data............................................................................20
RESULTS .........................................................................................................................22 Experiments with Eelgrass ...........................................................................................22
Eelgrass Microscopy ..............................................................................................22
Eelgrass Pigment Analysis .....................................................................................22
Experiments with Isopods ............................................................................................28
Isopod Digestive System Anatomy .........................................................................28
Isopod Hindgut Contents .......................................................................................28
Fluorescence Microscopy of Isopod Tissue and Gut Content ...............................32
Isopod Pigment Analysis ........................................................................................32
Statistical Analysis of Pigment Data............................................................................36
DISCUSSION ...................................................................................................................41 Digestive System of Pentidotea resecata ....................................................................41
Photosynthetic Gut Contents........................................................................................45
Photosynthetic Pigments within Pentidotea resecata ..................................................47
Summary ......................................................................................................................51

v
ACKNOWLEDGEMENTS ............................................................................................52
LITERATURE CITED ...................................................................................................53
APPENDIX .......................................................................................................................56 Observations on the Natural History and Behavior of Pentidotea resecata ................56
Reproduction and Development .............................................................................56
Size and Molting Pattern .......................................................................................61
Cannibalism and Parasitism ..................................................................................61
Variation in Prevalence and Appearance of Adults ..............................................63
Dietary Fidelity ......................................................................................................66
vi
LIST OF TABLES
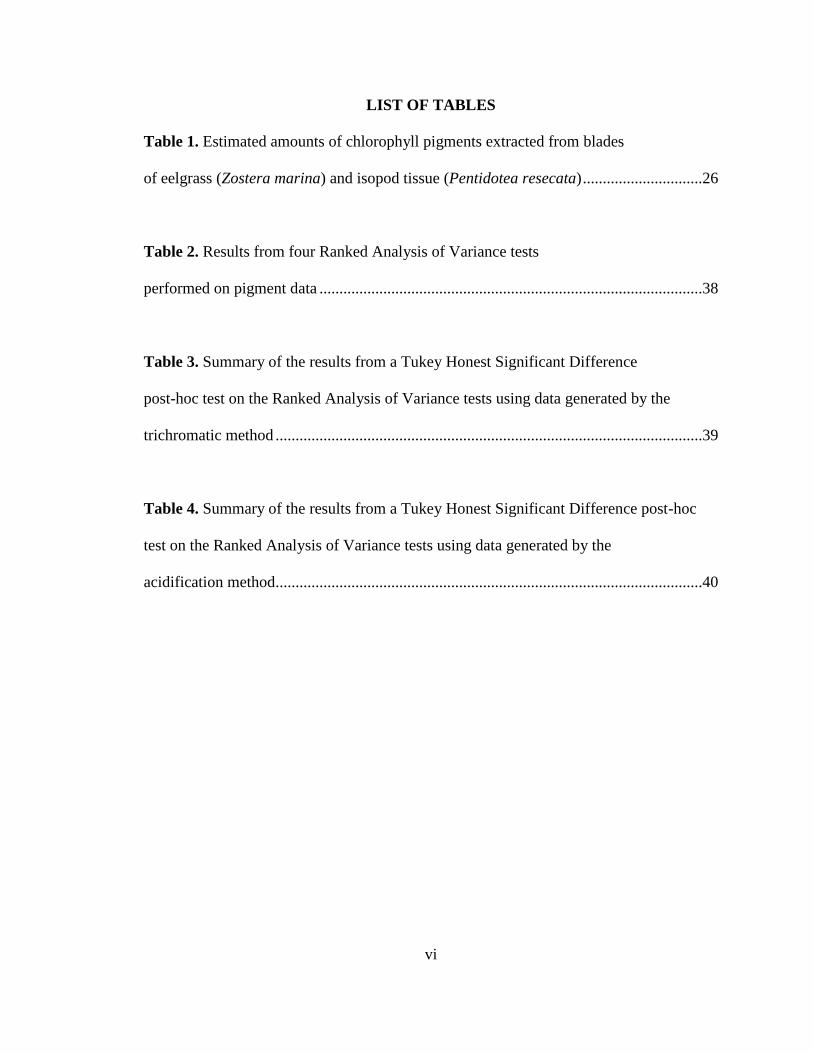
Table 1. Estimated amounts of chlorophyll pigments extracted from blades
of eelgrass (Zostera marina) and isopod tissue (Pentidotea resecata) ..............................26
Table 2. Results from four Ranked Analysis of Variance tests
performed on pigment data ................................................................................................38
Table 3. Summary of the results from a Tukey Honest Significant Difference
post-hoc test on the Ranked Analysis of Variance tests using data generated by the
trichromatic method ...........................................................................................................39
Table 4. Summary of the results from a Tukey Honest Significant Difference post-hoc
test on the Ranked Analysis of Variance tests using data generated by the
acidification method...........................................................................................................40

vii
LIST OF FIGURES
Figure 1. Photograph of two eelgrass isopods (Pentidotea resecata) .................................6
Figure 2. Diagram of the digestive system of Pentidotea resecata ....................................7
Figure 3. Map of collection site for eelgrass (Zostera marina)
and isopod (Pentidotea resecata) samples in Padilla Bay, WA ........................................13
Figure 4. Dorsal view of the digestive system of Pentidotea resecata
following the removal of the dorsal exoskeleton ...............................................................19
Figure 5. Whole eelgrass cells containing chloroplasts as seen in
blades of eelgrass and inside the hindgut of P. resecata ...................................................23
Figure 6. Chlorophyll fluorescence in an eelgrass blade .................................................24
Figure 7. Absorption spectrum of eelgrass extract ..........................................................25
Figure 8. Boxplot of estimated amounts of chlorophyll pigments from
eelgrass blades based on absorption data ...........................................................................27
Figure 9. Filter-apparatus within the isopod stomach .......................................................29

viii
Figure 10. Comparison of two digestive glands from one animal ....................................30
Figure 11. Comparison of the appearance of the hindgut to that of a
digestive gland from the same animal ...............................................................................31
Figure 12. Diatom found within the hindgut of P. resecata .............................................33
Figure 13. Chlorophyll fluorescence within the hindgut of P. resecata ...........................34
Figure 14. Comparison of absorption spectra of an isopod tissue extract
to that of an eelgrass extract...............................................................................................35
Figure 15. Boxplot of estimated amounts of chlorophyll pigments
from isopod tissue extracts based on absorption data ........................................................37
Figure 16. Yellow lipid-like droplets found within the digestive glands
of some isopods..................................................................................................................44

1
INTRODUCTION
Photosymbiotic Associations
A variety of organisms form photosymbiotic associations in which a non-
photosynthetic organism houses a photosynthetic organism (Clark 1992). A classic
example of such can be found in coral reef communities where dinoflagellates
(unicellular algae often referred to as zooxanthellae) live within the gastrodermis of the
coral animal. This sustained physical association permits the transfer of metabolites from
the alga to the animal and vice versa, and may help sustain coral reefs in nutrient-poor
waters (Muscatine & Porter 1977). These dinoflagellates are members of the genus
Symbiodinium and have been found in a variety of organisms other than corals including
anemones, coronate jellyfish, hydrozoans, sponges, bivalves, and gastropods (Baker
2003).
Sacoglossan Model
Perhaps the best-known photosymbiotic association in a complex (triploblastic)
animal has been observed in mollusks. In a phenomenon termed “kleptoplasty”, some
marine, opisthobranch gastropods from the order Sacoglossa obtain chloroplasts from
their algal diet and sequester the plastids within the epithelium lining their digestive
system (Clark 1992). The chloroplasts continue to photosynthesize for some time within
the slug and thereby appear to contribute more than just green camouflage to the animal
host. In fact, the kleptoplastic sacoglossan Elysia chlorotica can survive up to nine
months in the absence of food if provided with light and CO2 (Green et al. 2000). Elysia

2
timida, another kleptoplastic species, exhibits greater survival and less decrease in size if
starved while on a 12 h light-dark cycle than if maintained in continuous darkness
without food (Casalduero & Muniain 2008). Given that the chloroplasts are sequestered
within epithelial cells of the slug’s digestive system, this long survival time most likely
indicates that the slug is benefitting metabolically from the photosynthate produced by
the chloroplasts. Under optimal lighting, the slugs spread out their parapodia or cerata,
increasing chloroplast exposure to light and further demonstrating the animals’
dependence on light (Clark 1992).
One of the most astounding features of this association is the duration over which the
captured chloroplasts retain their functionality, i.e. continue to photosynthesize. In E.
chlorotica, the thylakoid membranes retain their capacity for photosynthetic electron
transport (PET) for more than six months inside the slug (Green et al. 2000). The high-
energy process of photosynthesis damages chloroplasts, and so for the thylakoids to
remain functional, these damaged proteins must be repaired or replaced. Green and
colleagues (Green et al. 2000) found that several thylakoid polypeptides, including a
Rubisco peptide, are actively translated inside the slug, indicating de novo protein
synthesis in the animal. Most of the chloroplast proteins are actually encoded by the algal
nuclear genome, not the plastid genome. This should make plastid repair very difficult, if
not impossible for the slug. E. chlorotica appears to have overcome that challenge due to
horizontal gene transfer of the necessary genes from algal nuclear DNA to the slug
chromosomes (Pierce et al. 1996, Hanten & Pierce 2001, Rumpho et al. 2008, Schwartz
et al. 2014, Pierce et al. 2015).

3
Crustacean Models
Not all photosymbiotic associations are as intimate as that between the sea slug
and its algal prey, in which the chloroplast is sequestered within animal cells. In some
cases, the association could be as simple as the presence of intact cells or chloroplasts
within the lumen of the animal’s digestive system. However, even such a simple scenario
would bring the chloroplast into close enough association with the animal that the animal
might benefit metabolically if the chloroplast continued to photosynthesize during its stay
in the animal’s gut.
In a pattern similar to kleptoplasty in sacoglossans, Daphnia obtusa accumulates
plastids of two morphologies, referred to as dark and light, within the endocytes of its
midgut. The plastids are generally larger than its mitochondria and contain stacks of
thylakoid membranes. Both types of plastids are bounded by a single membrane; but the
dark plastids are more prevalent, enclose an electron-dense stroma, and occasionally
include a pyrenoid. These features suggest either a cyanobacterial or green algal origin
for the plastids, since cyanobacterial chloroplasts are bound by a single membrane, but
lack a pyrenoid body whereas the chloroplasts in green algae are bound by a double
membrane and can contain pyrenoid bodies. The lighter plastids may simply be senescent
dark plastids (Chang & Jenkins 2000).
Another species of Daphnia, D. magna, feeds on the colonial green alga
Sphaerocystis schroeteri. However, in contrast to the above example, D. magna species
does not sequester plastids within cells of its digestive system. Instead, 90% of the
ingested algae remain whole and viable following their passage through the animal’s

4
digestive system. The algae absorb nutrients such as phosphorus that are present in the
animal’s gut. These nutrients appear to fuel an increase in carbon fixation by the algae.
The net result is that grazing by D. magna actually increases algal growth. This
relationship allows S. schroeteri to bloom when most other phytoplankton are in decline
due to low nutrient availability (Porter 1976).
In the previous example, it appeared that the Daphnia gained comparatively little
from the phytoplankton, given how much of the algae passed through the gut without any
apparent digestion occurring. Porter (Porter 1976) suggested that perhaps the gelatinous
sheath encasing the algal cells provides at least limited nutritive value to the crustacean
(Porter 1976). However, greater metabolic benefit has been suggested for another
phytoplankton-consuming crustatcean, the copepod Acanthocyclops vernalis.
Respirometry experiments indicate that the phytoplankton continues to produce oxygen
for at least 24 h after being ingested by the copepod. As in Daphnia magna, much of the
phytoplankton is not digested during its stay in the copepod’s gut and appears intact and
viable upon its exit. It is possible that the copepod benefits from gases and/or
photosynthate produced by the algae. This association has been referred to as a
nonobligatory mutualistic symbiosis, with the phytoplankton likely benefiting from
nutrients present in the animal’s gut and the animal gaining an additional source of
oxygen while having carbon dioxide removed from its tissues (Epp & Lewis 1981).

5
Potential Photosynthesis in Pentidotea resecata
Pentidotea resecata (Stimpson 1857) (Isopoda: Valvifera) (Figure I) is found
along the west coast of North America from Baja California to southeast Alaska (Jones
1971). Though abundant in the summer, their populations disappear over the course of
the fall and winter for unknown reasons only to reappear the following spring and
summer. This isopod is dorsoventrally flattened with seven free pereonites and can be
identified based on its concave pleotelson. Like other valviverans, its uropods form a
ventral valve over the pleopods. The pleotelson consists of two free pleonites and one
partially-free pleonite attached to the telson. The palp of the maxilliped is composed of
five articles (Kozloff 1996). These isopods can grow up to 64 mm long from the front
edge of the cephalon to the tip of the telson, but most of the adult isopods collected from
eelgrass beds in Padilla Bay, WA from June through August of 2014 were between 30-50
mm long (Cowles 2015).
P. resecata lives and feeds on either eelgrass (Zostera marina) or brown kelp such
as Macrocystsis pyrifera. Isopods found on eelgrass are green, whereas those found on
kelp are brown. The coloration of the isopod is influenced by the degree of
chromatophore expansion, cuticle color, and general body color (Lee & Gilchrist 1972).
Lee and Gilchrist (Lee & Gilchrist 1972) stated that brown isopods get their color from a
dark yellow body surrounded by a green endocuticle and red exocuticle, whereas the
green isopods have a light yellow body covered by a bright green endo- and exocuticle.
They also noted a visible difference in chromatophore appearance between the green and

6
Figure 1. Two eelgrass isopods (Pentidotea resecata) collected from eelgrass beds in
Padilla Bay, WA. The concave telson with a sharp point on each side is one of the easiest
ways to identify this species of isopod.

7
brown animals. The differences in appearance, diet, and habitat, along with a lack of
evidence for the ability of this isopod to change color, suggests that exchange of
individuals between green and brown populations is highly unlikely to occur (Lee &
Gilchrist 1972).
These observations suggest that the isopod’s coloration may depend upon its diet.
This is further supported by a small study in which green isopods taken from an eelgrass
bed progressively lost their green coloration when starved for 17 days (Cowles et al.
2011). The same study obtained absorption spectra characteristic of chlorophyll a, b, and
c from isopod tissue, and respirometry work indicated that the isopods were consuming
less oxygen in the light than in the dark. Taken together these findings suggest the
possibility of photosynthesis occurring within the isopod. Lee and Gilchrist (Lee &
Gilchrist 1972) observed that the gut contents of Pentidotea resecata often contained
undigested plant material. These undigested plant cells may receive enough light to
photosynthesize within the isopod’s gut.
The isopod digestive system consists of a mouth, esophagus, stomach, digestive
glands (which form the hepatopancreas or midgut), hindgut, and anus (Figure 2). The
isopod stomach is divided into two regions (dorsal and ventral) by the presence of a set of
filters. The dorsal region of the stomach connects to the hindgut, whereas the ventral
region containing the filters directs the fluid component to the digestive glands of the
hepatopancreas (Wägele 1992).
Isopods feed by a combination of mandible activity and suction generated by
muscle lining the esophagus and stomach. Large particulate matter travels through the

8
Figure 2. Diagram of the digestive system of Pentidotea resecata created as a composite
of a trace of a photograph and observations of multiple isopods. The various parts are
indicated using the following abbreviations: stomach (s), digestive glands of the
hepatopancreas (hp), hindgut (hg).
s
hp
hg

9
dorsal stomach and to the anterior hindgut for storage. Ingested liquids and very fine
particles are passed through two filters in the ventral stomach to the digestive glands of
the hepatopancreas. Some of the digestive enzymes secreted by the hepatopancreas also
pass through a valve into the stomach and hindgut to facilitate further digestion of the
chyme there. Material from the dorsal stomach and hindgut can also be moved back into
the ventral stomach and pressed through the filters into the digestive glands. Particulate
matter that is too large to pass through the filters is returned to the hindgut, enclosed by a
peritrophic membrane, and expelled as fecal pellets (Holdich & Ratcliffe 1970, Wägele
1992).
The entire length of the digestive system, with the exception of the digestive
glands, is lined by chitinized cuticle (intima). Since chitin is relatively impermeable, it
has generally been assumed that most nutrient absorption occurs within the digestive
glands, whereas the hindgut has been assigned osmoregulatory and storage roles.
However, electron microscope studies of the hindgut have revealed the presence of
electron dense bodies within the intima and the development of infoldings in the apical
plasma membrane following feeding on carbohydrates and proteins. These changes
suggest that the hindgut cuticle in certain species is actually permeable to some
macromolecules, at least following a period of food deprivation (Hryniewiecka-Szyfter &
Storch 1986). If P. resecata contains photosynthesizing chloroplasts within its digestive
system, a similar increase in the permeability of its gut epithelium could enable the
isopod to absorb photosynthate produced by the chloroplasts.

10
Photosynthesis depends upon the presence of light-absorbing pigments, most
notably, chlorophylls. Tissue from P. resecata has previously been examined for the
presence of carotenoid pigments, including several carotenes and xanthophylls (Lee &
Gilchrist 1972). All of the isolated pigments were present in the cuticle of green isopods,
but only -carotene and xanthophylls were found in the gut diverticula. The major
xanthophyll present was lutein. Lee and Gilchrist (Lee & Gilchrist 1972) also noted the
presence of a green, water-soluble carotenoprotein pigment with strong absorption at
400-500 nm, but they lacked sufficient material to determine the pigment’s identity other
than that it contained canthaxanthin and lutein. They did not isolate chlorophyll over the
course of their pigment analysis, but neither did they look for it specifically. Moreover,
the majority of their samples were taken from brown isopods.
The bright color of green P. resecata closely matches that of its eelgrass substrate.
Observations that the isopods gradually lose their bright green color when removed from
eelgrass (Cowles et al. 2011) suggest that the source of the eelgrass isopod’s bright green
color is the eelgrass itself. As a plant, eelgrass contains both chlorophyll and carotenoid
pigments within the thylakoid membrane of its chloroplasts. Both types of pigments are
non-covalently linked to proteins and absorb the light energy that fuels photosynthesis.
The carotenoids have an additional function of photoprotection in which they help
dissipate excess light energy that could otherwise cause oxidative damage to the
chloroplasts (Young 1991). Most of the chlorophyll in plants, such as eelgrass, consists of
chlorophyll a, which is present both in the reaction center complexes and in conjunction

11
with chlorophyll b as part of light-harvesting antennae to the reaction centers (Green &
Durnford 1996).
The goal of this study was to further clarify the source of the green isopod’s
coloration by verifying the presence of eelgrass cells, whole chloroplasts, and functional
chlorophyll pigments and identifying their location within P. resecata. The presence of
functional copies of such photosynthetic elements would suggest that this isopod contains
the machinery needed to perform photosynthesis. The location of each of these
photosynthetic elements would provide information regarding the potential metabolic
benefit to the animal of harboring photosynthetic material. Since the animal would obtain
these elements through its diet, the results from this study include a detailed description
of the digestive system of Pentidotea resecata.
12
MATERIALS AND METHODS
Sample Collection Site
All samples of eelgrass (Zostera marina) and isopods (Pentidotea resecata) were
collected from near the boat launch at March Point, in southern Padilla Bay, WA (Figure
3; 48 29’ 50” N, 122 33’ 23” W).
Experiments with Eelgrass
Eelgrass Collection and Maintenance
Samples of eelgrass (Zostera marina) collected from Padilla Bay were transported
in buckets of seawater taken from the bay to Rosario Beach Marine Laboratory for study.
At the laboratory, the eelgrass was maintained in indoor, running seawater tanks, exposed
only to fluorescent ceiling lights.
Eelgrass Microscopy
I began by acquainting myself with the appearance of eelgrass cells and
chloroplasts. Using a Nikon Eclipse E200® compound light microscope, I examined 14
blades of fresh eelgrass for chloroplasts and recorded their size and appearance under
400x and 1000x magnification. I used an ocular micrometer to measure the dimensions of
the cells. The ocular micrometer was calibrated using a stage micrometer.
I also looked for chlorophyll fluorescence in eelgrass using two different dichroic
edge filters. I secured a short-pass filter (Edmund Optics 47-288) to a white LED
incident-light illuminator and a long-pass filter (Edmund Optics 64-701) to the objective
13
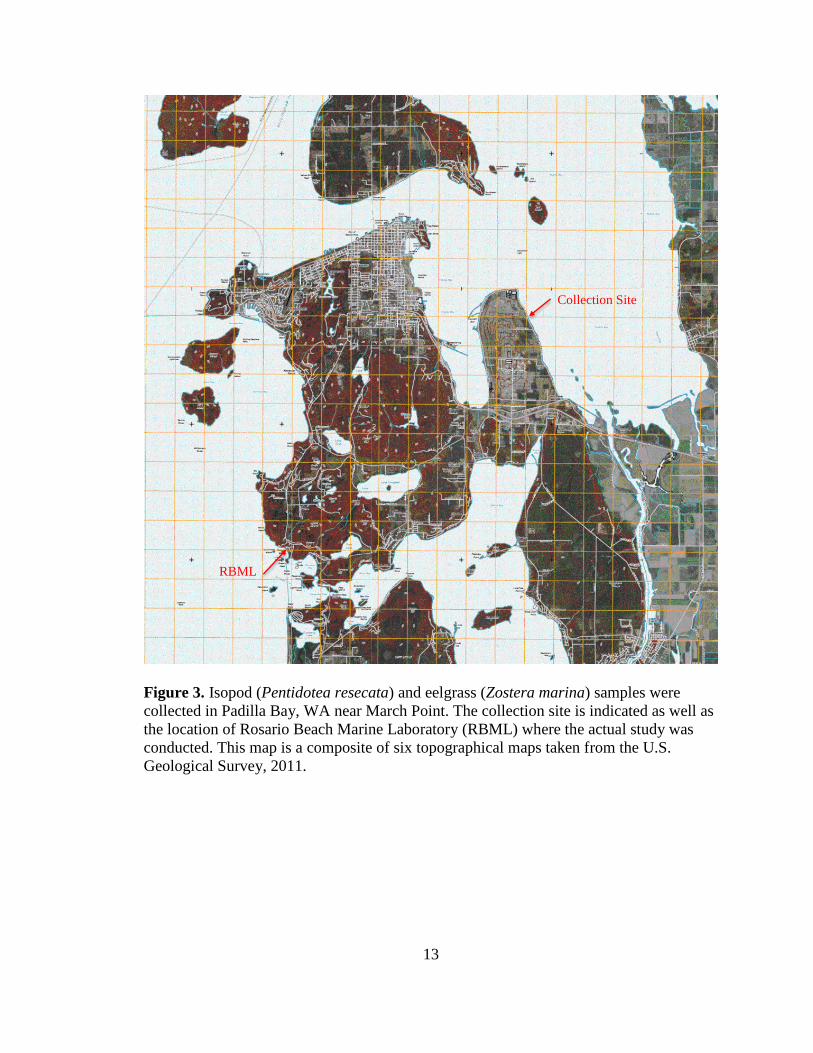
Figure 3. Isopod (Pentidotea resecata) and eelgrass (Zostera marina) samples were
collected in Padilla Bay, WA near March Point. The collection site is indicated as well as
the location of Rosario Beach Marine Laboratory (RBML) where the actual study was
conducted. This map is a composite of six topographical maps taken from the U.S.
Geological Survey, 2011.
Collection Site
RBML
14
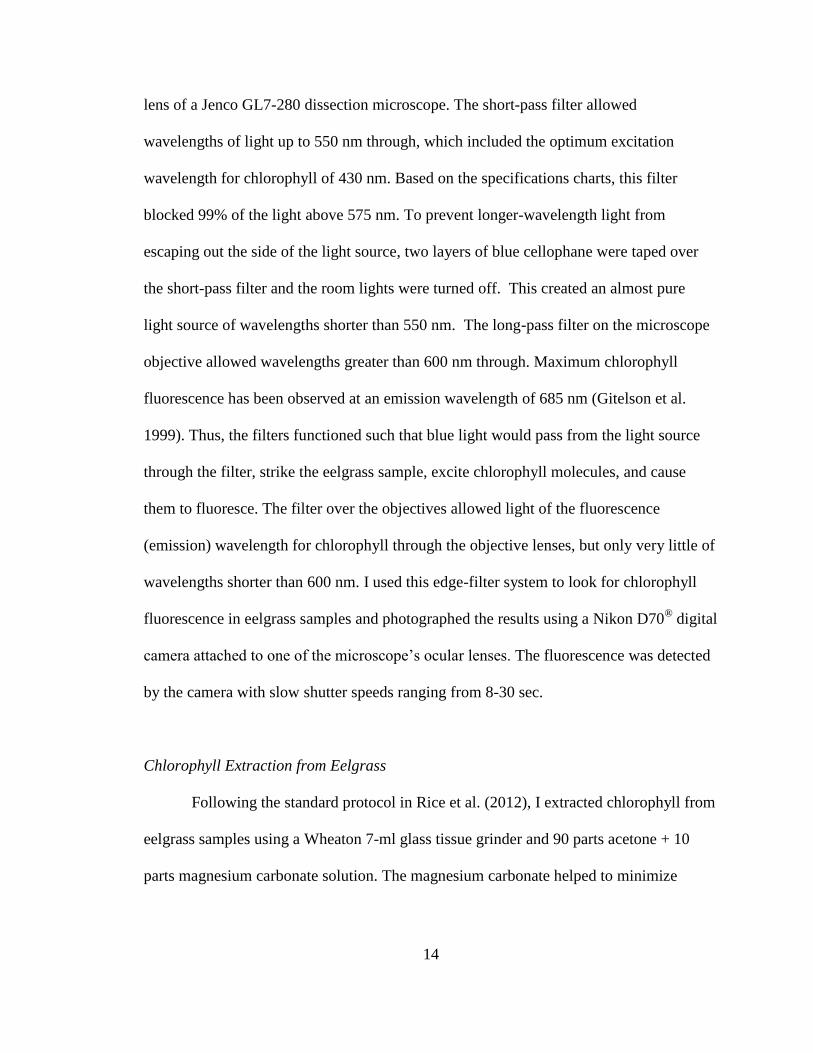
lens of a Jenco GL7-280 dissection microscope. The short-pass filter allowed
wavelengths of light up to 550 nm through, which included the optimum excitation
wavelength for chlorophyll of 430 nm. Based on the specifications charts, this filter
blocked 99% of the light above 575 nm. To prevent longer-wavelength light from
escaping out the side of the light source, two layers of blue cellophane were taped over
the short-pass filter and the room lights were turned off. This created an almost pure
light source of wavelengths shorter than 550 nm. The long-pass filter on the microscope
objective allowed wavelengths greater than 600 nm through. Maximum chlorophyll
fluorescence has been observed at an emission wavelength of 685 nm (Gitelson et al.
1999). Thus, the filters functioned such that blue light would pass from the light source
through the filter, strike the eelgrass sample, excite chlorophyll molecules, and cause
them to fluoresce. The filter over the objectives allowed light of the fluorescence
(emission) wavelength for chlorophyll through the objective lenses, but only very little of
wavelengths shorter than 600 nm. I used this edge-filter system to look for chlorophyll
fluorescence in eelgrass samples and photographed the results using a Nikon D70® digital
camera attached to one of the microscope’s ocular lenses. The fluorescence was detected
by the camera with slow shutter speeds ranging from 8-30 sec.
Chlorophyll Extraction from Eelgrass
Following the standard protocol in Rice et al. (2012), I extracted chlorophyll from
eelgrass samples using a Wheaton 7-ml glass tissue grinder and 90 parts acetone + 10
parts magnesium carbonate solution. The magnesium carbonate helped to minimize

15
chlorophyll degradation. This procedure was performed in the dark using a headlamp
with a red filter to minimize degradation of the chlorophyll. First, I ground a 4 cm-long,
pre-weighed strip of eelgrass in a tissue grinder with 2 mL of acetone solution. The
extract was transferred to an acetone-resistant 15 mL screw-cap centrifuge tube. I then
rinsed the tissue grinder twice with 1 mL acetone solution and added each 1-mL rinse to
the centrifuge tube. Lastly, I adjusted the final extract volume to 5 mL by adding acetone
solution. The centrifuge tube was kept on ice in the dark for at least 2 h to allow for
thorough extraction of the chlorophyll. I then centrifuged the tube for 20 min at 3,000
rpm and 4C. After centrifuging, I poured the supernatant containing the extracted
chlorophyll into a clean 15-mL screw-cap centrifuge tube. The samples were tested
immediately for the presence of chlorophyll, according to the procedures described
below. They were maintained on ice and in the dark when not in use.
Spectrophotometric Procedure for Chlorophyll Determination
I tested for the presence of chlorophyll by measuring the absorbance of 2 mL
aliquots of extract in either quartz or UV BRAND (acetone-resistant) cuvettes using a
Beckman DU 520 UV/Vis spectrophotometer. I obtained a complete absorbance
spectrum from 400-760 nm for seven samples. For chlorophyll determination, I employed
two different protocols and then compared the results between the two. Both methods
were conducted on 18 samples of chlorophyll extract from fresh eelgrass blades.
The trichromatic method (Rice et al., 2012) determined the relative amounts of
chlorophyll a, b, and c based on the absorbance at 664, 647, and 630 nm, respectively.

16
Each value was first corrected for turbidity by subtracting the absorbance at 750 nm. I
calculated the amount of each pigment in each sample (g pigment/g sample) using
standard equations (Rice et al. 2012); however I substituted the mass of the sample for
the sample volume.
The acidification protocol was used to distinguish between chlorophyll a and
pheophytin a, an inactive degradation product of chlorophyll (Rice et al. 2012).
Chlorophyll a can be converted to pheophytin a through the addition of acid.
Acidification removes the magnesium ion from the middle of chlorophyll’s porphyrin
ring, replacing it with two protons and in the process slightly altering the absorption
spectrum. The effect of acidification on a given extract’s absorption spectrum can be used
to estimate the relative amount of chlorophyll that was present in the original sample,
versus that which had already degraded to pheophytin. This is done by calculating an
acidification ratio based on the absorbance at 664 nm before the addition of acid and at
665 nm after the addition of hydrochloric acid. Pure chlorophyll a has an acidification
ratio of 1.70 when using 90% acetone. Pure pheophytin a has an acidification ratio of 1.0
(Rice et al. 2012).
I carried out this protocol in the dark using a headlamp with a red filter to
minimize unintentional degradation of chlorophyll a to pheophytin a. First I transferred 2
mL of extract to a cuvette. I recorded the absorbance at 750 and 664 nm. Then I acidified
the extract in the cuvette with 66.6 L of 0.1M HCl. I gently tapped the cuvette for 90 s
and then recorded the absorbance at 750 and 665 nm. The absorbance at 750 nm was
used to correct for any background turbidity. I used the absorbance at 664 and 665 nm to

17
calculate the acidification ratio for each sample. The absorbance values from the
acidification method were also used to calculate the relative amounts of chlorophyll and
pheophytin in each eelgrass sample (g pigment/g sample) according to a standard
equation (Rice et al. 2012) in which I substituted the sample mass for sample volume.
Finally, I used the proportion of pheophytin a to chlorophyll a in the acidified
samples to estimate how much of the chlorophyll a as calculated in the trichromatic
method was actually functional chlorophyll a and how much was probably degraded to
pheophytin a.
Experiments with Isopods
Animal Collection and Care
Green Pentidotea resecata were collected from March Point (Figure 3) during
low tide by dragging a 6-foot seine over the eelgrass beds and scooping up the disturbed
isopods. The forty-nine individuals used in this study were collected on four different
dates: June 25, July 14, August 7, and August 11, 2014. The mass and length from the
front of the cephalon to the tip of the telson was measured and recorded for each isopod.
The isopods were maintained in either outdoor seawater tanks exposed to ambient
sunlight or in indoor seawater tanks exposed only to artificial, fluorescent light. Eelgrass
was kept in both tanks with the isopods. Some isopods were kept in individual containers,
and others were kept as groups in the tanks. The animals’ exoskeleton was gently brushed
every 2-3 days with a small, soft toothbrush to minimize diatom growth. The isopods
were anesthetized using carbonated saltwater prior to dissection or tissue extraction. The

18
carbonated saltwater was made by adding 29.5 g table salt to 1 L seltzer water. Isopods
placed into this carbonated saltwater became inactive and unresponsive after 30-60 min.
Isopod Microscopic Analysis
I dissected 25 adult isopods by cutting transversely across the posterior end of the
dorsal pleon, then making two long cuts dorsally along each side of the exoskeleton from
the telson to the head. I then used forceps to carefully remove the dorsal exoskeleton and
expose the isopod digestive system (Figure 4). I examined and photographed the
digestive system using a Nikon D70® digital camera attached to the ocular lens of a
Jenco GL7-280® dissecting microscope. I then carefully removed the entire digestive
system onto a slide for examination under either a Nikon Eclipse E100 or Nikon Eclipse
E200 compound microscope at 40-1000x. I used the compound microscope to check for
the presence of green plant cells and chloroplasts within each section of the digestive
system (stomach, hepatopancreas, and hindgut, Figure 2). I also checked for fluorescence
on the isopod’s cuticle, in its digestive system, and in gut contents using the edge filter
system described above for eelgrass.
Isopod Tissue Sample Preparation
The isopod tissue extraction and spectrophotometry were performed in the dark
using a headlamp with a red filter. I generated whole-body isopod extracts by grinding an
entire isopod with 2 mL acetone solution in a tissue grinder. The extract was transferred

19
Figure 4. Dorsal view of the isopod digestive system after the removal of the dorsal
exoskeleton (s = stomach, hp = digestive gland of the hepatopancreas, hg = hindgut).
Note that the hindgut forms a long tube attached directly to the stomach. The digestive
glands of the hepatopancreas are tan-colored and most visible on either side of the
hindgut. This isopod measured 51 mm long.
s hg
hp
dorsal cuticle
anus uropods

20
to an acetone-resistant 15 mL screw-cap centrifuge tube. I then rinsed the tissue grinder
twice with 1 mL acetone solution and added each rinse to the centrifuge tube. Lastly, I
adjusted the final extract volume to 5 mL by adding acetone solution. The centrifuge tube
was kept on ice in the dark for at least 2 h to allow for thorough extraction of the
chlorophyll. I then centrifuged the tube for 20 min at 3,000 rpm and 4C. After
centrifuging, I poured the supernatant into a clean 15-mL screw-cap centrifuge tube.
Isopod Pigment Analysis
I followed the same procedures for analyzing the isopod tissue extracts as I used
to look for chlorophyll in the eelgrass extracts. For five isopod samples I obtained a
complete absorption spectrum from 400-760 nm. The trichromatic method (Rice et al.
2012) was used to estimate relative amounts of chlorophyll a, b, and c, and the
acidification method was used to estimate the how much of the chlorophyll present in the
animal extract was already degraded to pheophytin. For the acidification method of
chlorophyll determination (Rice et al. 2012), I acidified 2 mL of tissue extract with 66.6
L of 0.1M HCl. The same two sets of equations were used to calculate g pigment/g
sample from both the acidification and trichromatic absorption data, just as had been
done for the eelgrass extracts. These data were collected from 16 isopod samples.
Statistical Analysis of Pigment Data
I compared the acidification ratios from the isopod extracts to those from the
eelgrass using a two-tailed t-test for unequal variance, since a Bartlett’s test indicated

21
unequal variance. I calculated the percent of total extracted chlorophyll for each pigment
type in the both trichromatic and acidification methods separately for each sample. The
percentages were then transformed using an arcsine transformation. I tested the data for
equal variance and normal distribution using a Bartlett’s test and Shapiro-Wilkes test,
respectively, in R studio. I then ranked the data and performed a two-way Analysis of
Variance (ANOVA) on the ranked data, followed by a Tukey Honest Significant
Differences post-hoc test. The ANOVAs were used to compare the mean amount of each
pigment type extracted from eelgrass and isopod samples in both the trichromatic and
acidification methods and to compare the relative amount of each pigment type based on
the ranked percentage data. The results were four separate ANOVAs. Since two of the
ANOVAs were based on the same data set, I did a Bonferonii correction by dividing the
critical p-value () by two. Thus the p-value for each test needed to be smaller than 0.025
for the test result to be considered statistically significant.

22
RESULTS
Experiments with Eelgrass
Eelgrass Microscopy
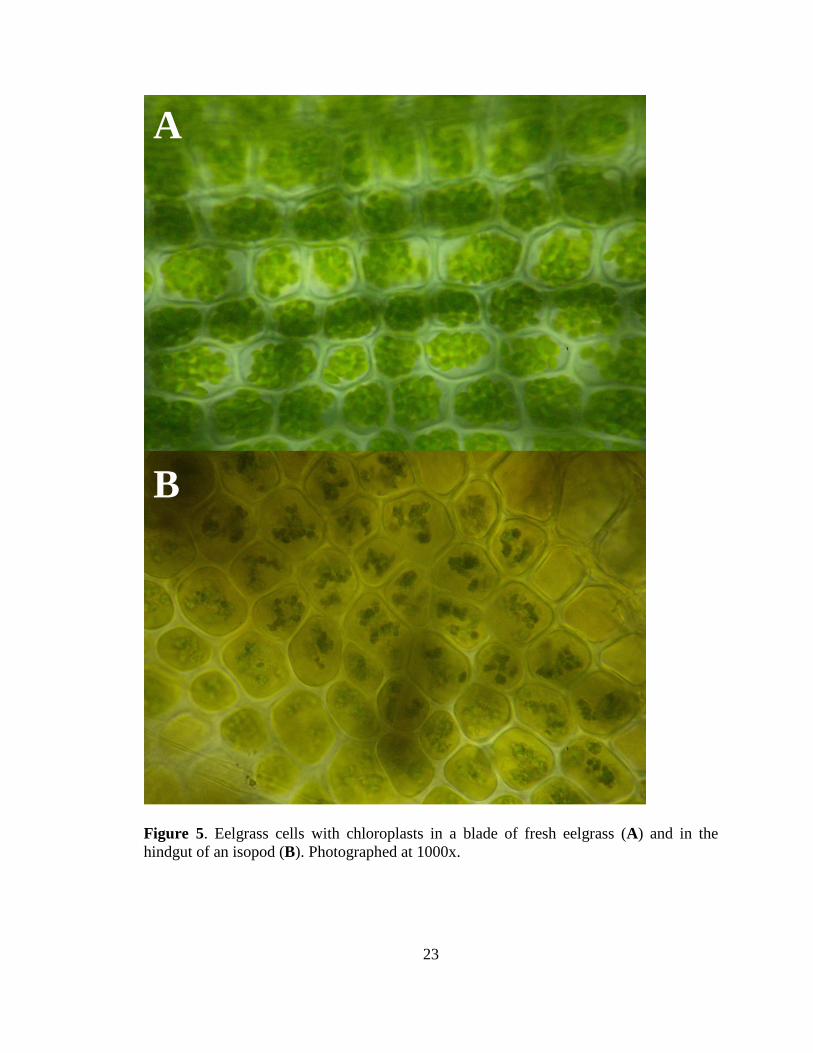
Individual cells were clearly visible when viewing eelgrass blades under the light
microscope (Figure 5A). The eelgrass cells ranged in diameter from 15-28 m. The cells
were filled with green disc-shaped organelles that were 2-5 m in diameter. Individual
thylakoid stacks were not visible within the organelles, yet their size, color, and location
supported their identification as chloroplasts.
All the living eelgrass blades examined appeared pink when photographed in the
dark using the light filters meant to detect pink chlorophyll fluorescence. Portions of the
eelgrass blades that appeared dead (brown) exhibited less color when viewed under the
filters (Figure 6).
Eelgrass Pigment Analysis
The chlorophyll extracts from eelgrass blades exhibited absorption spectra
characteristic of chlorophyll a with two strong peaks, one between 430-460 nm and the
other around 664 nm (Figure 7). The amounts of pigment extracted from eelgrass can be
seen in Table 1A and Figure 8. The trichromatic method showed that most of the
chlorophyll present in the eelgrass extracts was chlorophyll a (73%) and b (25%), with
chlorophyll c making up less than 2% of the extracted chlorophylls. Denaturation by
acidification of eelgrass chlorophyll extracts with 0.1M HCl caused a decrease in
absorbance overall and a shift in the peaks that resulted in acidification ratios between 1.1
23
Figure 5. Eelgrass cells with chloroplasts in a blade of fresh eelgrass (A) and in the
hindgut of an isopod (B). Photographed at 1000x.
A
B

24
Figure 6. An eelgrass blade under normal lighting (A) and under filters meant to detect
pink chlorophyll a fluorescence (B). The portion of the blade in the left side of the photo
appeared unhealthy as indicated by the brown color and contrasted strongly with the rest
of the blade, which appeared healthy. This contrast was apparent both under normal
lighting and when checking for chlorophyll fluorescence using the edge filter setup.
Photographed at 10x.
A
B

Figure 7. Absorption spectrum of fresh eelgrass before and after acidification with 0.1M HCl. The pre-acidification extract
had a peak at 663 nm. This peak shifted to the right (665 nm) and exhibited a decrease in absorbance following acidification.
The three vertical lines indicate the wavelengths tested in the trichromatic method (630, 647, and 664 nm). The acidification
protocol compared absorbance at 664 and 665 nm.
25

Table 1. A comparison of the amount of chlorophyll pigments extracted from eelgrass and isopod tissue. The trichromatic
method was used to determine relative amounts of chlorophyll a, b, and c based on the absorbance at 664, 647, and 630 nm,
respectively. The acidification method was used to determine how much of the extracted chlorophyll a was actually
pheophytin a, a degradation product of chlorophyll. The percentage of pheophytin obtained from the acidification method was
used to correct the amount of chlorophyll a as determined by the trichromatic method to a more realistic estimate of the
amount of actual chlorophyll a present. The results were obtained from 18 blades of eelgrass and 16 isopod samples.
Trichromatic Method Acidification Method
A. EELGRASS SAMPLES Chlorophyll a Chlorophyll b Chlorophyll c Chlorophyll a Pheophytin a
Mean Extracted Pigment
(g pigment/g blade) 611 214 16 352 437
Percent of Total Extracted Pigments 72.6 25.5 1.9 44.6 55.4
Actual Chlorophyll a
(g pigment/g blade) 273
Trichromatic Method Acidification Method
B. ISOPOD SAMPLES Chlorophyll a Chlorophyll b Chlorophyll c Chlorophyll a Pheophytin a
Mean Extracted Pigment
(g pigment/g isopod tissue) 12.8 0.7 2.8 1.3 15.4
Percent of Total Extracted Pigments 78.4 4.3 17.3 7.5 92.5
Corrected Chlorophyll a
(g pigment/g isopod tissue) 0.96
26

27
Figure 8. Boxplot of estimated amount of photosynthetic pigment extracted from
eelgrass blades based on corrected absorption data (Rice et al. 2012; chl = chlorophyll,
phy = pheophytin). The shaded boxes represent data gathered using the trichromatic
method. The empty boxes represent data from the acidification method. The crossbar in
each box represents the median of 18 samples. Box height represents the interquartile
range, and the error bars represent the data that fall within 1.5x the interquartile range.
Data that lie outside that range are shown by the small circles.
28
and 1.7, with a mean acidification ratio of 1.3. These acidification results suggested that
roughly 55% (range 36-85%) of the eelgrass extracts consisted of pheophytin a. Thus,
while the trichromatic method indicated that 1 g of eelgrass contained 611 g of
chlorophyll a, the low acidification ratio suggested that in actuality, functional
chlorophyll a only accounted for 273 g of the extracted eelgrass pigment after the
extraction procedure. The remaining 338 g most likely consisted of chlorophyll a which
had already degraded to pheophytin a.
Experiments with Isopods
Isopod Digestive System Anatomy
The complete digestive system of Pentidotea resecata can be seen in Figure 4.
Near the junction of the stomach, hepatopancreas, and hindgut lay a filter apparatus
(Figure 9), which filters materials moving from the stomach to the digestive glands of the
hepatopancreas (Wägele 1992). The hepatopancreas consisted of up to six digestive
glands surrounding the hindgut. These glands varied in length relative to the hindgut in
different animals and often bulged with brownish fluid (Figure 10). The hindgut, which is
chitinized in crustaceans, formed a long tube with a striated appearance under the light
microscope (Figure 11) and exited ventrally into the valve formed by the uropods.
Isopod Hindgut Contents
The hindgut of the isopods frequently contained large fragments of eelgrass
blades containing whole plant cells. These cells contained dark oval organelles ~2 m in

29
Figure 9. Filter apparatus within the stomach, shown at 40x (A) and 100x (B). This
secondary filter, the clatri setarum posteriores (Csp), is visible as the dark “V” in the
photograph. It screens the entrance to the digestive glands of the hepatopancreas so that
only fine particles can pass through.
A
B
Anterior
Anterior
Posterior
Posterior
Csp
Csp

30
Figure 10. Comparison of two digestive glands from one animal’s hepatopancreas. One
digestive gland is empty and the other bulges with brownish liquid. Photographed at
100x.
Full
Empty

31
Figure 11. Comparison of the glandular appearance of a digestive gland of the
hepatopancreas with the striated appearance of the hindgut. Photographed at 40x.
Hindgut
Midgut

32
diameter (Figure 5B). The isopods also contained a variety of diatoms within their gut. A
long, pennate diatom can be faintly seen in the bottom left of Figure 5B and a brown,
spherical diatom is shown in Figure 12. The gut contents also occasionally contained
parts of other isopods, such as part of a pereopod or the palp of a maxilliped.
Fluorescence Microscopy of Isopod Tissue and Gut Content
Isopod tissue appeared pink under the microscope filter setup meant to detect pink
chlorophyll fluorescence. When viewing the gut, more color was visible in sections of
hindgut containing ingested matter than in sections that were empty (Figure 13).
Isopod Pigment Analysis
The absorption spectra of isopod tissue extracts exhibited two rounded peaks near
430 nm and 650 nm (Figure 14). The trichromatic method indicated that most of the
extracted chlorophyll pigments were chlorophyll a (78%) and c (17%), with chlorophyll
b constituting only 4% of the extracted chlorophylls (Table 1B). Overall, the isopod
tissue contained much less pigment, as was evident both in appearance (the extract was
much lighter in color) and as indicated by the absorbance data. On average, 1 g of
eelgrass contained 51 times as much extractable pigment (chlorophyll and pheophytin
pigments combined) compared to isopod tissue based on the yields calculated from the
trichromatic method.
Acidification of the isopod extracts with 0.1M HCl resulted in acidification ratios
of 1.0-1.1. These acidification ratios are significantly different from those obtained from

33
Figure 12. An example of a diatom found within the hindgut of Pentidotea resecata. This
diatom measured 28 m in diameter and was photographed at 400x.

34
Figure 13. Isopod hindgut under normal lighting (A) and under filters meant to detect
chlorophyll a fluorescence (B). The portions of the hindgut containing more ingested
material exhibited greater fluorescence as indicated by the pink color.
A
B
Empty
Full
Empty
Full
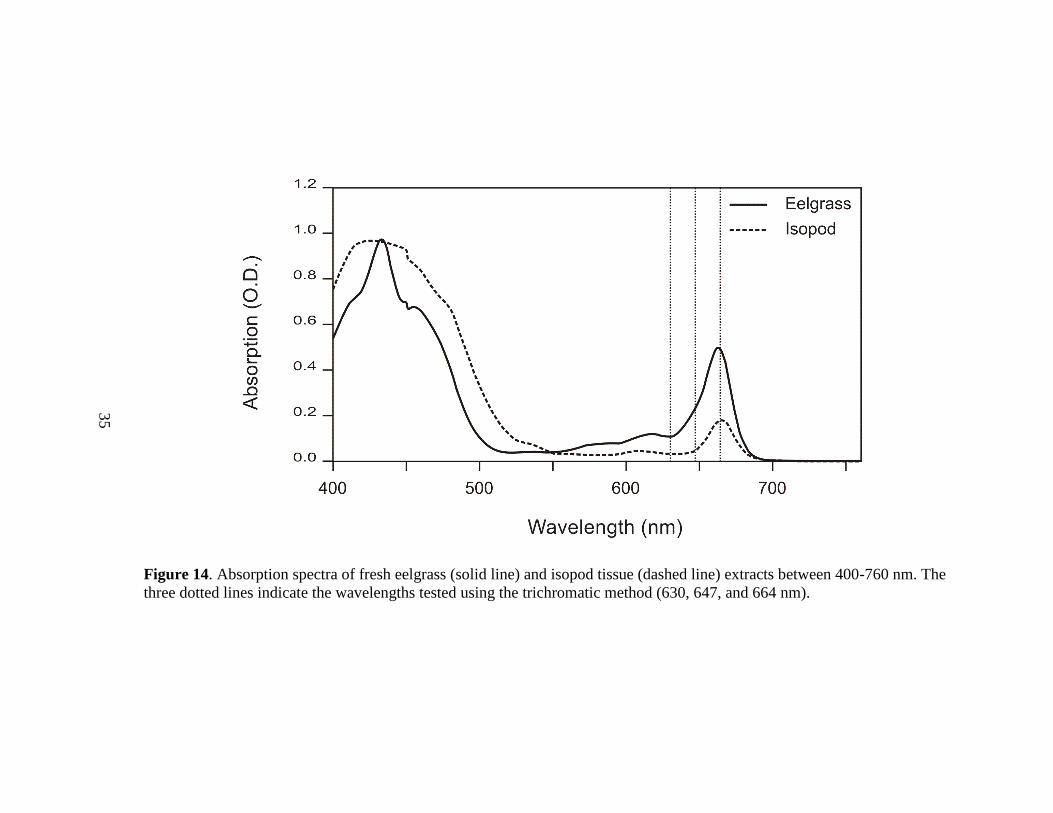
Figure 14. Absorption spectra of fresh eelgrass (solid line) and isopod tissue (dashed line) extracts between 400-760 nm. The
three dotted lines indicate the wavelengths tested using the trichromatic method (630, 647, and 664 nm).
35

36
eelgrass chlorophyll extracts (p=6.65E-06, d.f. =32). The trichromatic method indicated
that 12.8 g of chlorophyll a could be extracted from 1 g isopod tissue (Figure 15).
However, comparison with the acidification results suggested that 92% of the extracted
chlorophyll a was actually already degraded to pheophytin a. Thus, less than 1 g
functional chlorophyll a was extracted from 1 g of isopod tissue (Table 1B).
Statistical Analysis of Pigment Data
The four Ranked Analysis of Variance (ANOVA) tests performed on the pigment
data yielded significant p-values for both differences between samples (eelgrass and
isopod) and differences between relative amounts of pigment (chlorophyll a, b, c and
pheophytin a) in a given sample (Table 2). There was one exception in that the ANOVA
did not indicate a significant difference between eelgrass and isopod pigment percentages
from the acidification method. Post-hoc tests also revealed highly significant differences
between nearly all of the variables compared (Tables 3 and 4).

37
Figure 15. Relative amounts of photosynthetic pigments extracted from isopod tissue
extracts. Amounts were estimated based on corrected absorption data. Shaded boxes
represent data from the trichromatic method, while empty boxes represent data gathered
following the acidification protocol (chl = chlorophyll, phy = pheophytin). The crossbar
in each box represents the median of 16 samples. Box height represents the interquartile
range, and the error bars represent the data points that fall within 1.5x the interquartile
range. Outliers are represented by small circles.

Table 2. The results from four Ranked Analysis of Variance tests performed on pigment data using R. For each data collection
method (trichromatic and acidification), a test was done on both the raw pigment data (untransformed) and on the percentage
data, which were transformed using an arcsine transformation (percentage). Due to a Bonferroni correction, p-values must be
< 0.025 to be considered statistically significant. Sample refers to comparisons between eelgrass and isopods. Pigment refers to
comparisons between chlorophyll a, b, c and pheophytin a within the same organism.
Trichromatic Method
Acidification Method
Ranked ANOVA
Untransformed
Percentage
Untransformed
Percentage
d.f. (sample)
1
1
1
1
d.f. (pigment) 2 2 1 1
p-value (sample) 2.00E-16 0.00998 6.32E-16 1
p-value (pigment) 2.00E-16 <2E-16 0.00358 2.48E-13
p-value (interaction) 2.99E-13 <2E-16 0.01963 4.02E-12
38

Table 3. Summary of the results from a Tukey Honest Significant Difference post-hoc test on the Ranked Analysis of Variance
performed on pigment data generated using the trichromatic method. Part A shows the results using the untransformed pigment
data (TRI). Part B shows the results from transformed percentage data (TRIP). Due to a Bonferroni correction, p-values must
be < 0.025 before being considered statistically significant. Significant p-values are indicated by bolded font. Key to label
abbreviations: eel = eelgrass, iso = isopod, chl = chlorophyll.
A. TRI TukeyHSD eel chl a eel chl b eel chl c iso chl a iso chl b iso chl c
eel chl a
eel chl b 0.0000017
eel chl c <1E-7 <E-7
iso chl a <1E-7 <1E-7 0.2923706
iso chl b <1E-7 <1E-7 <1E-7 <1E-7
iso chl c <1E-7 <1E-7 <1E-7 0.0000002 0.0002966
B. TRIP TukeyHSD eel chl a eel chl b eel chl c iso chl a iso chl b iso chl c
eel chl a
eel chl b <1E-7
eel chl c <1E-7 <1E-7
iso chl a 0.0774679 <1E-7 <1E-7
iso chl b <1E-7 <1E-7 0.0112135 <1E-7
iso chl c <1E-7 0.0027535 0.0057557 <1E-7 <1E-7
39

Table 4. Summary of the results from a Tukey Honest Significant Difference post-hoc test on the Ranked Analysis of Variance
performed on pigment data generated using the acidification method. Part A shows the results using the untransformed
pigment data (ACID). Part B shows the results from transformed percentage data (ACIDP). Due to a Bonferroni correction, p-
values must be < 0.025 before being considered statistically significant. Significant p-values are indicated by bolded font. Key
to label abbreviations: eel = eelgrass, iso = isopod, chl = chlorophyll, phy = pheophytin.
A. ACID TukeyHSD eel chl a eel phy a iso chl a iso phy a
eel chl a
eel phy a 0.9437181
iso chl a <1E-7 <1E-7
iso phy a 0.0000075 0.0000009 0.0017105
B. ACIDP TukeyHSD eel chl a eel phy a iso chl a iso phy a
eel chl a
eel phy a 0.8264386
iso chl a 0.0000006 <1E-7
iso phy a <1E-7 0.0000006 <1E-7
40

41
DISCUSSION
The purpose of this study was to establish whether the eelgrass isopod, Pentidotea
resecata, contains the machinery needed to perform photosynthesis, i.e. intact
chloroplasts and functional chlorophyll, in a location and condition that may potentially
benefit the animal. Since the isopod would presumably obtain such elements from its
diet, I examined the digestive system of P. resecata for whole plant cells with intact
chloroplasts and tested for chlorophyll in animal tissue extracts.
Digestive System of Pentidotea resecata
The isopod digestive system consists of a mouth, esophagus, stomach,
hepatopancreas, hindgut, and anus. The mouth, esophagus, and stomach are located
within the cephalothorax of Pentidotea resecata and may extend into the first pereonite.
The isopod stomach is divided into two regions by the presence of a set of filters (Wägele
1992). The dorsal region of the stomach connects to the hindgut, whereas the ventral
region containing the filters directs the fluid component to the digestive glands of the
hepatopancreas. Both filters consist of setae that overlay channels formed by
invaginations in the wall of the stomach. The primary filter is located more anteriorly and
its setae cover the dorsal entrance to the filter channels. The secondary filter, shown in
Figure 9, consists of finer setae that cover the ducts leading to the digestive glands. This
filter is the clatri setarum posteriores. These filters restrict the size of ingested material
that is allowed to pass into the digestive glands.

42
The digestive glands that make up the hepatopancreas are the only parts of the
isopod digestive system that are not lined with chitinized cuticle (Hryniewiecka-Szyfter
& Storch 1986), and thus bring isopod digestive epithelium into direct contact with the
gut contents. Over the course of my dissections, I counted three pairs (six total) of
digestive glands in each animal. Most isopod species have two to three pairs, but some
species, including some Valviferans, are known to have up to four pairs (Wägele 1992).
There was great variation in the length and structural integrity of the glands. In
some animals I was easily able to find and remove six separate glands. In others, the
glands appeared to be already partially disintegrated within the animal, and it was nearly
impossible to separate them from each other without tearing them. These differences in
length and structural integrity may be related to the nutritional status of the individual. A
study of an Antarctic marine isopod (Natatolana obtusata) found that the digestive glands
increased in mass and length after intensive feeding (Storch et al. 2002). However, this
species is a scavenger, and so it befits it to feed voraciously when food is present so that
it may have energy stores in times of scarcity. In contrast, P. resecata feeds on the very
substrate on which it is found, and so does not appear to risk starvation as long as the
eelgrass beds are in good condition. Thus, a more detailed study would be required for
any correlation to be drawn between the condition of the digestive glands and the
nutritional status of individual P. resecata.
Another possibility for the variability in the structure of the digestive glands could
be that they deteriorate as the animal ages. Most of the dissections were conducted near
the end of the summer. This species seems to disappear in the fall (Lee & Gilchrist 1972)

43
as indicated by failed attempts to collect animals at times other than during the summer
months. This “disappearance” of the species could be due to the adult generation dying
off after breeding. The small, newly released isopods are quite small, and would be very
difficult to collect without the use of a plankton net. Thus, it could be that adult animals
cease feeding at the end of the summer, and as a result their digestive glands begin to
deteriorate.
The digestive glands are surrounded by a network of myocytes (Wägele 1992),
and the cross-sectional, radial arrangement of microtubules in the myocytes may
contribute to the “constrictions” seen in the empty gland of Figure 10. Other glands
within the same animal bulged with brownish fluid. The gland epithelium consists of two
alternating cell types: large alpha cells and smaller beta cells. The alpha cells are believed
to function in absorption and secretion, whereas the beta cells appear to serve as storage
sites for lipid droplets and glycogen (Storch & Lehnert-Mortitz 1980, Wägele 1992). I
did not find any plant cells or chloroplasts within the digestive glands. Plant cells and
chloroplasts may have been too large to pass through the filters in the ventral stomach
and into the digestive glands. The digestive glands of one animal did contain a large
number of what appeared to be yellow lipid droplets (Figures 10 and 16).
The hindgut of the isopod forms a long tube extending from the stomach to the
anus, which exits ventrally into the valve formed by the uropods (Figure 4). The anterior
portion of the hindgut may be enlarged following feeding as it often serves as a storage
chamber for food. Like the stomach, the inner surface of the hindgut is lined with
chitinized cuticle. It is surrounded by an inner layer of circular muscles and outer layer of

44
Figure 16. Digestive gland tissue from two different isopods filled with many yellow
droplets. Photographed at 100x (A) and 400x (B).

45
longitudinal muscles which work together to move material up or down the gut by
peristalsis (Wägele 1992). Under the light microscope, the hindgut had a striated
appearance, perhaps due to the presence of these outer, longitudinal muscles (Figure 11).
In addition to food storage and passage, the hindgut may also play a role in
osmoregulation (Holdich & Ratcliffe 1970) and the absorption of some macromolecules
(Hryniewiecka-Szyfter & Storch 1986).
Photosynthetic Gut Contents
Dissection of the digestive system of Pentidotea resecata frequently revealed the
presence of large chunks of whole plant cells containing chloroplasts within the lumen of
the hindgut. These cells were easily identified based on their similarity in size and
appearance to the eelgrass cells (Figure 5). The large size of these cells likely prevented
them from passing through the filters into the digestive glands. If these plant cells were
able to photosynthesize within the hindgut of the isopod, then the cells would likely
release oxygen into the lumen and could potentially also release some of the
photosynthate. More work would need to be conducted to determine whether this was
occurring and if it was occurring, whether the isopod could actually absorb the
photosynthetic products through the cuticle layer lining the hindgut. I did not find
evidence of isolated chloroplasts within the digestive glands or in any other isopod gut
tissue. The filters within the isopod stomach likely restrict the passage of material into the
digestive glands to particles smaller than the size of whole chloroplasts. However,

46
regurgitation of hindgut contents into the stomach could facilitate animal uptake of
photosynthate, which would likely pass through the filters into the digestive glands.
At least some of the photosynthetic material within the isopod’s hindgut
contained un-degraded chlorophyll as indicated by the fluorescence under the light filters
(Figure 13). Portions of the hindgut containing ingested material exhibited stronger pink
color than did empty sections of the hindgut. While some of the color could be due to
light reflecting off the subject, comparison with the eelgrass results support the
interpretation that the pink color actually represented chlorophyll fluorescence. The
strong difference in the amount of color visible through the light filters when viewing
brown, decaying portions of eelgrass compared to greener portions of an eelgrass blade
indicated that the edge-filter setup was sensitive enough to detect chlorophyll
fluorescence (Figure 6).
The pink color was not limited to just the digestive system of the isopod. The
isopod’s cuticle and hemolymph also appeared pink when viewed under the edge filters.
The pink color of the cuticle could be partly the result of light reflecting off the animal’s
shiny surface, but it was more likely due to the presence of diatoms growing on the
animal’s exoskeleton. The animals were brushed with a small toothbrush to try to prevent
diatom growth on their exoskeleton, but this method was unsuccessful in completely
eliminating diatoms from the exoskeleton. They were especially difficult to remove from
the small spaces between joints/hinges in the exoskeleton, such as between the edges of
the pereonites.

47
Diatoms photosynthesize using chlorophyll a and c (Green & Durnford 1996).
Thus, some of the apparent chlorophyll fluorescence could be due to the presence of
diatoms growing on the animal’s surface, as also attested to by the detection of
chlorophyll c by the trichromatic method (Figure 15/Table 1B). Since the isopods
frequently contained diatoms within their gut as well, some of the fluorescence found in
the animal’s gut could also be due to the presence of diatoms. The diatom Fragilariopsis
kerguelensis has been noted to survive passage through the digestive system of several
copepods (Jansen & Balthmann 2007). Thus the presence of viable diatoms within the gut
of P. resecata could contribute fluorescing chlorophyll. Nonetheless, the relative
abundance of eelgrass material within the hindgut, compared to that of diatoms, would
implicate the eelgrass cells as a strong contributor to the apparent chlorophyll
fluorescence.
Photosynthetic Pigments within Pentidotea resecata
I used spectrophotometry to test for the presence of functional chlorophyll
pigments in isopod tissue extracts. The two rounded absorption peaks near 430 and 665
nm seen in these extracts (Figure 14) overlap the ranges of the peaks seen in the
absorption spectrum of fresh eelgrass extract containing chlorophyll, but the peaks from
the isopod tissue extract were much broader. Furthermore, the second peak (at 665 nm)
was much shorter than the corresponding eelgrass peak and was shifted slightly to the
right. A chlorophyll extract from fresh eelgrass showed a peak at 663 nm, whereas the
isopod extract exhibited a peak at 665 nm. This shift of only a couple nm was notable
48
since it is used to distinguish between chlorophyll a and one of its degradation products,
pheophytin a. Chlorophyll can be degraded to pheophytin by the addition of acid.
Differences between the peaks in the eelgrass and isopod absorption spectra paralleled
the changes in the eelgrass chlorophyll absorption spectrum that were generated by
acidification. This comparison demonstrates that while the isopod may contain some
chlorophyll pigments, greater than 90% of the chlorophyll within the isopod has already
been degraded to pheophytin. These data were strongly supported by the significant
difference in the acidification ratios generated from eelgrass and isopod extracts. Some of
the ratios generated from eelgrass extracts were as high as 1.7, indicative of pure
chlorophyll a. In contrast, all of the acidification ratios from isopod extracts were
between 1.0-1.1, indicating the presence of primarily pheophytin rather than chlorophyll.
These results were further supported by the statistically significant difference between the
percentages of chlorophyll and pheophytin from the two organisms (Table 4B).
The lower absorbance of the isopod tissue extracts at 664 nm compared to that of
eelgrass (Figure 14) indicated that the pigments were also less concentrated in the isopod
extract than in the eelgrass blade. A blade of eelgrass contained 241-968 g pigment/g
plant, whereas isopod extracts contained only 1-20 g pigment/g isopod tissue (Table 1).
These results were to be expected since as a photoautotroph, eelgrass depends upon the
presence of photosynthetic pigments for its ability to generate energy from sunlight. In
contrast, the heterotrophic isopod does not produce such photosynthetic pigments and so
would obtain them only through its diet. Thus one could expect the pigments to be less
concentrated within isopod tissue. This was further supported by the ANOVAs on both

49
the trichromatic (TRI) and acidification (ACID) data, which showed that the two samples
differed significantly in the amount of extractable chlorophyll pigments (Table 2, Table
3A, and Table 4A).
The composition of the pigments also differed between the isopod and eelgrass
extracts. In addition to the lower proportion of chlorophyll a, the isopod extracts also had
a significantly lower proportion of chlorophyll b and a significantly higher proportion of
chlorophyll c compared to those found in the eelgrass extracts (Table 3B). The two
primary chlorophyll molecules in higher plants are chlorophyll a and b (Green &
Durnford 1996). Thus, as expected, the eelgrass extract contained more chlorophyll b
than chlorophyll c. However, the opposite was true in the case of the isopod tissue
extracts. The fact that the proportions of chlorophyll molecules in the isopod extract were
different from those in the eelgrass extract suggested that the isopod obtained a
substantial portion of its chlorophyll molecules from a source other than eelgrass.
Diatoms contain chlorophyll a and c (Green & Durnford 1996), and constitute the most
likely source of elevated chlorophyll c levels in isopod tissue extracts. This explanation is
further supported by the presence of diatoms both on the exoskeleton and within the
hindgut of the isopods.
One of the motivating factors for this study was that the presence of functional
photosynthetic machinery could suggest the possibility of photosynthesis occurring
within the isopod, and potentially benefitting the isopod metabolically. While I found
whole plant cells containing chloroplasts within the lumen of the isopod’s hindgut, I did
not find plant cells or chloroplasts within the digestive glands of the hepatopancreas. If

50
the plant cells were photosynthesizing within the hindgut of the isopod, such
photosynthesis would be unlikely to contribute much to the metabolic demands of the
animal, except perhaps as an extra oxygen source. Most of the chlorophyll pigment
present in the isopod was degraded by the end of the extraction procedure; however,
isopod tissue exhibited fluorescence characteristic of chlorophyll a. Thus, while it is
possible and probable that the isopod contains some functional chlorophyll due to its
eelgrass diet, it is unlikely that significant amounts of photosynthesis are occurring within
the animal.
The isopod’s eelgrass diet may benefit it in another way. During dissections, I
noticed that the hemolymph was bright green and even exhibited small amounts of
fluorescence when viewed under the edge filters. Furthermore, the cuticle of green P.
resecata appeared rather transparent when removed from the animal. Lee and Gilchrist
(Lee & Gilchrist 1972) ascribed the difference in color between green and brown isopods
to differences in cuticle composition, noting that the green isopods had a yellow body
covered by a green endo- and exocuticle. However, my observations indicated that the
bright green hemolymph may be the primary difference responsible for the isopod’s
green coloration. Loss of hemolymph during dissection resulted in an immediate loss of
coloration, even when the body was still covered by cuticle. Since the isopod’s coloration
closely matches that of its eelgrass substrate, concentrating chlorophyll, or, more likely,
degraded chlorophyll (i.e. pheophytin) within its hemolymph may serve an adaptive
function of camouflage for these isopods.

51
Summary
The marine isopod Pentidotea resecata can be found living on eelgrass along the
west coast of North America. The green coloration of these individuals closely matches
that of their eelgrass substrate. These isopods feed on eelgrass, and large chunks of whole
eelgrass cells containing chloroplasts are frequently found within the lumen of their
hindgut. Chlorophyll pigments can be extracted from isopod tissue, but only in very small
concentrations. Some of the chlorophyll appears functional, as evidenced by fluorescence
characteristic of chlorophyll a. However, greater than 90% of the extracted chlorophyll
pigments appear to be rapidly degraded to pheophytin.

52
ACKNOWLEDGEMENTS
I would like to thank David Cowles, my major professor, for overseeing this work
and providing advice and technical support. I am indebted to Joanna Cowles for her
assistance in collecting, transporting, and caring for the isopods. I would also like to
thank my committee members, Jim Nestler and Kirt Onthank, for their assistance in
planning the project, troubleshooting equipment failures, and reviewing this thesis.
Rosario Beach Marine Laboratory provided facilities and equipment for this study. Mark
Olson at the Padilla Bay National Research Reserve provided isopod samples for
preliminary study. This project was funded in part by a student research fellowship
through the American Microscopical Society and by a Walla Walla University faculty
grant to David Cowles.

53
LITERATURE CITED
Baker AC 2003. Flexibility and specificity in coral-algal symbiosis: diversity, ecology,
and biogeography of Symbiodinium. Annu. Rev. Ecol. Evol. Syst. 34: 661–689.
Casalduero GF & Muniain C 2008. The role of kleptoplasts in the survival rates of Elysia
timida (Risso, 1818): (Sacoglossa: Opisthobranchia) during periods of food
shortage. J. Exp. Mar. Biol. Ecol. 357: 181–187.
Chang N & Jenkins DG 2000. Plastid endosymbionts in the freshwater crustacean
Daphnia obtusa. J. Crust. Biol. 20: 231–238.
Clark KB 1992. Plant-like animals and animal-like plants: Symbiotic coevolution of
ascoglossan (=sacoglossan) mollusks, their algal prey, and algal plastids. In:Algae
and Symbiosis. Reisser W, ed., pp. 515–530. Biopress Ltd., Bristol, UK.
Cowles JM 2015. Does photosynthesis take place in the gut of Pentidotea resecata?
Walla Walla University, College Place, WA.
Cowles JM, Sullivan N, Cowles DL, & Stone G 2011. Is the isopod Pentidotea resecata
photosynthetic? Seattle, WA.
Epp RW & Lewis WMJ 1981. Photosynthesis in copepods. Science 214: 1349–1350.
Gitelson AA, Buschmann C, & Lichtenthaler HK 1999. The chlorophyll fluorescence
ratio F735/F700 as an accurate measure of the chlorophyll content in plants.
Remote Sens. Environ. 69: 296–302.
Green BR & Durnford DG 1996. The chlorophyll-carotenoid proteins of oxygenic
photosynthesis. Annu. Rev. Plant Phys. 47: 685–714.
Green BJ, Li W-Y, Manhart JR, Fox TC, Summer EJ, Kennedy RA, Pierce SK, &
Rumpho ME 2000. Mollusc-algal chloroplast endosymbiosis. Photosynthesis,
thylakoid protein maintenance, and chloroplast gene expression continue for
many monthes in the absence of the algal nucleus. Plant Physiol. 124: 331–342.
Hanten JJ & Pierce SK 2001. Synthesis of several light-harvesting complex I
polypeptides is blocked by cycloheximide in symbiotic chloroplasts in the sea
slug Elysia chlorotica (Gould): A case for horizontal gene transfer between alga
and animal? Biol. Bull. 201: 34–44.
Holdich DM & Ratcliffe NA 1970. A light and electron microscope study of the hindgut
of the herbivorous isopod, Dynamene bidentata (Crustacea: Peracarida). Z.
Mikrosk. Anat. Forsc. 111: 209–227.
54
Hryniewiecka-Szyfter Z & Storch V 1986. The influence of starvation and different diets
on the hindgut of isopoda (Mesidotea entomon, Oniscus asellus, Porcellio
scaber). Protoplasma 134: 53–59.
Jansen S & Balthmann U 2007. Algae viability within copepod faecal pellets: evidence
from microscopic examinations. Mar. Ecol. Prog. Ser. 337: 145–153.
Jones LG 1971. Studies on selected small herbivorous invertebrates inhabiting
Macrocystis canopies and hold-fasts in southern California kelp beds. In:The
biology of giant kelp beds (Macrocystis) in California, pp. 344–353. Nova
Hedwigia, Beihefte.
Kozloff EN 1993. Seashore life of the Northern Pacific Coast: An Illustrated Guide to
Northern California, Oregon, Washington, and British Columbia. University of
Washington Press, Seattle, WA.
Kozloff EN 1996. Marine Invertebrates of the Pacific Northwest. University of
Washington Press, Seattle, WA. 539 pp.
Lee WL & Gilchrist BM 1972. Pigmentation, color change and the ecology of the marine
isopod Idotea resecata (Stimpson). J. Exp. Mar. Biol. Ecol. 10: 1–27.
Menzies RJ & Waidzunas RJ 1948. Postembryonic growth changes in the isopod
Pentidotea resecata (Stimpson) with remarks on their taxonomic significance.
Biol. Bull. 95: 107–113.
Muscatine L & Porter JW 1977. Reef Corals: Mutualistic Symbioses Adapted to
Nutrient-Poor Environments. BioScience 27: 454–460.
Pierce SK, Biron RW, & Rumpho ME 1996. Endosymbiotic chloroplasts in molluscan
cells contain proteins synthesized after plastid capture. J. Exp. Biol. 199: 2323–
2330.
Pierce SK, Curtis NE, & Middlebrooks ML 2015. Sacoglossan sea slugs make routine
use of photosynthesis by a variety of species-specific adaptations. Invertebr. Biol.
134: 103–115.
Porter KG 1976. Enhancement of algal growth and productivity by grazing zooplankton.
Science 192: 1332–1334.
Rice EW, Baird RB, Eaton AD, & Clesceri LS, eds. 2012. Chlorophyll. In:Standard
Methods for the Examination of Water and Wastewater, pp. 10–22–30. American
Public Health Association, Washington, D.C.

55
Rumpho ME, Worful JM, Lee J, Kannan K, Tyler MS, Bhattacharya D, Moustafa A, &
Manhart JR 2008. Horizontal gene transfer of the algal nuclear gene psbO to the
photosynthetic sea slug Elysia chlorotica. P. Natl. Acad. Sci. USA 105: 17867–
17871.
Schwartz J A, Curtis NE, & Pierce SK 2014. FISH labeling reveals a horizontally
transferred algal (Vaucheria litorea) nuclear gene on a sea slug (Elysia
chlorotica) chromosome. Biol. Bull. 227: 300–312.
Stimpson W 1857. The Crustacea and Echinodermata of the Pacific shores of North
America. H. O. Houghton and Company, Riverside, Cambridge. 92 pp.
Storch V & Lehnert-Mortitz K 1980. The effects of starvation on the hepatopancreas of
the isopod Ligia oceanica. Zool. Anz. 204: 137–146.
Storch V, Strus J, & Brandt A 2002. Microscopic anatomy and ultrastructure of the
digestive system of Natatolana obtusata (Vanhöffen, 1914) (Crustacea, Isopoda).
Acta Zool. Stockholm 83: 1–14.
Wägele J-W 1992. Isopoda. In:Microscopic Anatomy of Invertebrates, pp. 529–617.
Wiley-Liss, Inc.
Young AJ 1991. The photoprotective role of carotenoids in higher plants. Physiol.
Plantarum 83: 702–708.

56
APPENDIX
Observations on the Natural History and Behavior of Pentidotea resecata
An extensive literature search on Pentidotea resecata yields scarce information
regarding the animal’s natural history and behavior. Much of what is known comes from
anecdotal remarks in the few studies that have been conducted on the species. In addition
to the results discussed above, this project afforded me the opportunity to add to the body
of general knowledge regarding this species of isopod. Thus, the purpose of this appendix
is to enhance what little is known about this species by giving a written account of my
observations regarding the natural history of Pentidotea resecata. Many of these
observations were made while working with another graduate student, Joanna Cowles.
Further information on some of the included topics can be found in her master’s thesis
(Cowles 2015).
Reproduction and Development
This study was conducted between June 25 and September 2, 2014. The animals
were breeding during this time. It was not uncommon for us to find males clasping
females, both in the collection bucket and in the field. The male clasped the female from
above, such that he was on top of her dorsal surface (Figure A1). This behavior made it
much easier to collect the isopods because once the male clasped a female, he would not
let go and she could not swim away as quickly as she could without him holding her.
The female carries her eggs in a marsupium under her venter (Figure A2) where
they develop into juveniles. The juveniles are released as miniature adults, with a few

57
Figure A1. A larger male isopod clasping a smaller female isopod on the underside of a
blade of eelgrass. The isopods usually cling to the underside of eelgrass blades rather
than sitting on top of the blades.

58
Figure A2. A) A female isopod with a bulging marsupium on a blade of eelgrass. B) A
closer look at the marsupium revealing bright green eggs inside. These eggs were
photographed at 20x.

59
important morphological differences. These differences were noted in a previous study by
Menzies and Waidzunas (Menzies & Waidzunas 1948), and so this is not new
information. Nonetheless, I will describe these anatomical differences here for the benefit
of a reader who might be naïve regarding this species’ development. The smallest
juveniles that we found in our tanks measured ~ 3 mm long from the tip of the telson to
the front of the cephalon (Figure A3). If the length of the antennae were included, then it
would measure 4 mm long. The juveniles had 6 clearly identifiable pereonites with 6
well-developed pereopods. It was difficult to tell if an additional segment between
belonged to the pereon or the pleon. The telson was very odd-shaped (Figure A3). Unlike
that of adult P. resecata, the telson was not concave. It had one point on either side and a
third protuberance or bump in the middle, between the two points. There was a white
band of tissue between the two points. The eyes of the juveniles were decidedly lateral in
position, and the palp of the second maxilliped consisted of four articles (not five as in
adult P. resecata). In addition to these observations, Menzies and Waidzunas (Menzies
& Waidzunas 1948) also noted that the length of the flagellum of the second antenna
increased in length due to the addition of articles as the animal grew. Knowledge of these
differences in appearance between juvenile and adult P. resecata is critical for correct
identification of juvenile P. resecata since several of these features could result in them
keying out to a different species.

60
Figure A3. Juvenile Pentidotea resecata measuring ~ 3 mm long (A). A closer view of
another juvenile P. resecata (B). Note the convex rather than concave telson with the
white bar of tissue in the middle.

61
Size and Molting Pattern
It has been reported that this species grows up to four cm long (Kozloff 1993).
However, over the course of our collections, Joanna and I found that these isopods quite
commonly exceed four and even five cm. In fact, we collected one individual who
measured 64.5 mm (Figure A4A).
Another large individual, shown in Figure A4B, provides a good example of
biphasic molting in these isopods. They first molt the posterior portion of their
exoskeleton, and then they molt the anterior portion. Between the molting of the two
halves, the older (anterior) part of the exoskeleton is browner in color than the freshly
molted posterior part. This difference in color can largely be attributed to the colonization
of the exterior of the isopod by diatoms.
Cannibalism and Parasitism
In addition to the photosynthetic material such as eelgrass cells, the hindgut of
some animals also contained parts of other isopods, such as the palp of a maxilliped or a
pereopod. The presence of these body parts within another animal’s gut would suggest
either scavenging behavior by the isopods, cannibalism, or both. While it could be
possible that isopod had consumed its own molt, a behavior known to occur in some
crustaceans (Jones 1971), old molts were frequently recovered from the containers of
isopods kept individually with eelgrass, suggesting that this species does not habitually
consume its molted exoskeleton. Behavioral observations of the isopods indicated that
they do consume the remains of other dead isopods, and will even begin eating another

62
Figure A4. Two large Pentidotea resecata. Specimen A measured 64.5 mm, and was the
largest individual that we found over the course of our collections. Specimen B was also
quite large, measuring 56.5 mm, and exhibits the biphasic molting pattern characteristic
of these isopods. It has recently molted the posterior portion of its exoskeleton, which is
why the rear half of the isopod is brighter green. It has yet to molt the anterior portion of
its exoskeleton, which appears brown due to the presence of diatoms on its surface.

63
isopod that is not fully dead. However, this behavior may have resulted from the animals
being kept in too small of a tank and/or with inadequate eelgrass substrate. I did observe
one large juvenile eat a smaller juvenile when attempting to sedate both of them in
thesame fingerbowl. Similar observations regarding cannibalism in this species were also
reported by Jones (Jones 1971).
On two occasions I found what looked to be some sort of nematode inside the
digestive system of an isopod, once in a juvenile and once in an adult (Figure A5).
Variation in Prevalence and Appearance of Adults
While I did not conduct a specific study of changes in the size of the Padilla Bay
population of Pentidotea resecata, the isopods seemed to become scarcer towards the end
of the summer. The last collection was made on August 11, 2014, and we had a difficult
time finding enough isopods within our desired size bracket of 4-5 cm long.
We also noticed that the inside of several isopods was filled with a white
substance (Figure A6). This substance was visible through the cuticle and gave the
isopods an odd appearance. It also appeared to increase in the amount to which it filled
the isopods over time. When it first appeared in the isopods, we thought that it might
indicate an animal that was in the process of dying, since their tissues do turn whitish
following death. However, some animals lived for several weeks with the white
substance inside them, and only died as result of being anesthetized and dissected.

64
Figure A5. Two examples of what could be a parasitic worm inside Pentidotea resecata.
Example A is from a juvenile isopod, photographed at 45x. Example B is from an adult
isopod, photographed at 100x.

65
Figure A6. Two examples of the white substance inside several different isopods over
the course of the summer. The top photograph shows a ventral view of the isopod at 6.5x,
and the bottom photograph is of the dorsal surface of a different isopod at 15x.

66
Dietary Fidelity
In addition to feeding isopods eelgrass, 10 isopods were kept in containers with
blades of Macrocystis instead of eelgrass for a period of 23 days. The Macrocystis blades
disintegrated more rapidly than eelgrass blades, making it difficult to determine
whetherthe loss of the blade was caused by the isopod or not. However, isopods
maintained on Macrocystis did grow over the trial period, as indicated by what appeared
to be small increases in length and mass. Just as was reported by Lee and Gilchrist (Lee
& Gilchrist 1972), I did not observe any change in color from green to brown in the
isopods that were fed Macrocystis.