gund institute for ecological economics, university of vermont integrated dynamic ecological...
TRANSCRIPT

• Used as a Consensus Building Tool in anOpen, Participatory Process
• Multi-scale, Landscape Scale and Larger
• Acknowledges Uncertainty and Limited Predictability
• Acknowledges Values of Stakeholders
• Simplifies by Maintaining Linkages and and Synthesizing
• Evolutionary Approach Acknowledges History, Limited Optimization, and the Co-Evolution of Humans and the Rest of Nature
Integrated Dynamic Ecological Economic Modeling

Gund Institute for Ecological Economics, University of Vermont
1. Scoping Models high generality, low resolution models produced with broad participation by all the stakeholder groups affected by the problem.
2. Research Models more detailed and realistic attempts to replicate the dynamics of the particular system of interest with the emphasis on calibration and testing.
3. Management Models medium to high resolution models based on the previous two stages with the emphasis on producing future management scenarios - can be simply exercising the scoping or research models or may require further elaboration to allow application to management questions
Three Step Modeling Process*
Increasing Complexity,
Cost, Realism,and Precision
*from: Costanza, R. and M. Ruth. 1998. Using dynamic modeling to scope environmental problems and build consensus. Environmental Management 22:183-195.

Modules
Site/PatchUnit Models
Small Watersheds
Large Watersheds
Global
Natural Capital Built Capital Human CapitalSocial Capital
hydrology,nutrients,plants
buildings,roads,power grid
population,education,employment,income
institutions,networks,well being
Biome BGC,UFORE
General Ecosystem Model (GEM)
Everglades Landscape Model (ELM)Patuxent Landscape Model (PLM)Gwyns Falls Landscape Model (GFLM)
General Unified Metamodel of the BiOsphere (GUMBO)
RHESSysHSPF
Sp
atia
l Ext
ent
Suite of interactive and intercalibrated models over a range of spatial, temporal and system scales (extents and resolutions)

Ln of Resolution
Higher(smaller grain)
Lower(larger grain)
Ln
of
Pre
dic
tab
ilit
y
Data Predictability
Model Predictability(different models have different slopes and points of intersection)
"Optimum" resolutions for particular models
from: Costanza, R. and T. Maxwell. 1994 . Resolution and predictability: an approach to the scaling problem. Landscape Ecology 9:47-57

GUMBO (Global Unified Metamodel of the BiOsphere)
Atmosphere
Anthropo-sphere
EcosystemServices
HumanImpacts
Natural Capital Human-madeCapital(includes Built CapitalHuman Capital,and Social Capital
SolarEnergy
Hydrosphere
Lithosphere
Biosphere
11 Biomes
From: Boumans, R., R. Costanza, J. Farley, M. A. Wilson, R. Portela, J. Rotmans, F. Villa, and M. Grasso. 2002. Modeling the Dynamics of the Integrated Earth System and the Value of Global Ecosystem Services Using the GUMBO Model. Ecological Economics 41: 529-560

AnthroposphereAnthroposphere
Marc Imhoff
Biospheric Sciences Branch
NASA
QuickTime™ and aCinepak decompressor
are needed to see this picture.


Gund Institute for Ecological Economics, University of VermontHuman impacts on global biology and material cycles

Atmosphere
QuickTime™ and aYUV420 codec decompressor
are needed to see this picture.


Weather-related economic damages have increased

Sea-viewing Wide Field-of-View Sensor (SeaWiFS) data on marine and terrestrial plant productivity
Biosphere
QuickTime™ and aYUV420 codec decompressor
are needed to see this picture.

Human Capital EconomicProductionProcess
GoodsandServices
EvolvingCulturalNorms andPolicy
Well Being(Individual andCommunity)
Consumption(based on changing,adaptingpreferences)
Education, training,
research.
Building
Investment(decisions about, taxescommunity spending,education, science andtechnology policy, etc., basedon complex propertyrights regimes)
Individual Public
GNP
Wastes
Common
Ecologicalservices/amenities
having, being
- having,- being
negative impacts on all forms of capital
being, doing, relating
Restoration,
ConservationNatural Capital
ManufacturedCapital
having
positive impacts on human capital capacity
doing, relatingComplex propertyrights regimes
SolarEnergy
SocialCapital
Lim
ited
Su
bst
ituta
bili
tyB
etw
ee
n C
ap
ital F
orm
s
“Full World” Model of the Ecological Economic System
Waste heat
Institutional
rules, norms, etc.
Materially closed earth system
From: Costanza, R., J. C. Cumberland, H. E. Daly, R. Goodland, and R. Norgaard. 1997. An Introduction to Ecological Economics. St. Lucie Press, Boca Raton, 275 pp.

COOL POWERPOINT 1-from ESR

Comparison Between Quality of Life and Its Components BetweenBurlington VT, and a Selection of Intentional Communities
1.00
2.00
3.00
4.00
5.00
Tota
l Qua
lity of
Life
Built
Capita
l
Natur
al C
apita
l
Human
Cap
ital
Socia
l Cap
ital1
(Frie
nds &
Fam
ily)
Socia
l Cap
ital2
(Neigh
bors
)
Avera
ge S
core
(1=
not
at
all t
o 5
= v
ery
gre
atl
y)
BurlingtonIntentional Communities
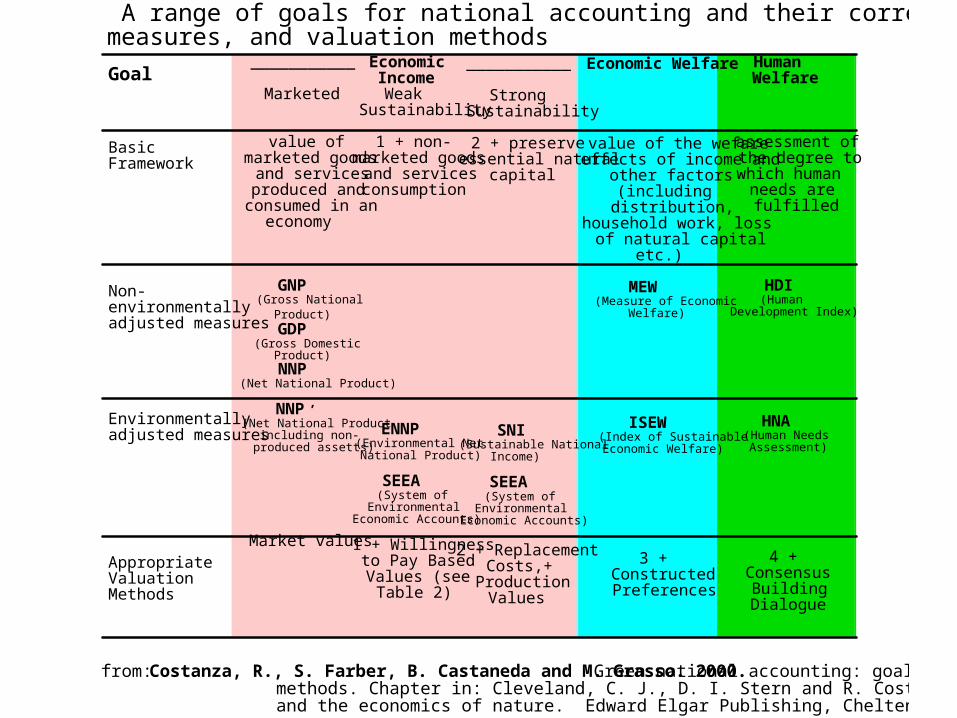
Goal
Basic Framework
Non-environmentally adjusted measures
Environmentallyadjusted measures
AppropriateValuationMethods
___________
Marketed
value ofmarketed goods
and servicesproduced and
consumed in aneconomy
GNP(Gross National
Product)GDP
(Gross DomesticProduct) NNP
(Net National Product)
NNP’(Net National Product
including non-produced assetts)
Market values
EconomicIncome Weak
Sustainability
1 + non-marketed goods
and servicesconsumption
ENNP (Environmental NetNational Product)
SEEA (System of
EnvironmentalEconomic Accounts)
1 + Willingness to Pay Based Values (see
Table 2)
___________
StrongSustainability
2 + preserveessential natural
capital
SNI(Sustainable National
Income)
SEEA(System of
EnvironmentalEconomic Accounts)
2 + Replacement Costs,+
ProductionValues
Economic Welfare
value of the wefareeffects of income and
other factors(including
distribution,household work, loss
of natural capitaletc.)
MEW(Measure of Economic
Welfare)
ISEW(Index of SustainableEconomic Welfare)
3 +ConstructedPreferences
HumanWelfare
assessment ofthe degree towhich human
needs arefulfilled
HDI (Human
Development Index)
HNA(Human NeedsAssessment)
4 + ConsensusBuildingDialogue
A range of goals for national accounting and their corresponding frameworks,measures, and valuation methods
from: Costanza, R., S. Farber, B. Castaneda and M. Grasso. 2000. Green national accounting: goals and methods. Chapter in: Cleveland, C. J., D. I. Stern and R. Costanza (eds.) The nature of economics and the economics of nature. Edward Elgar Publishing, Cheltenham, England (in press)

Column A: Personal Consumption ExpendituresColumn B: Income DistributionColumn C: Personal Consumption Adjusted for Income InequalityColumn D: Va lue of Household LaborColumn E: Va lue of Volunteer WorkColumn F: Services of Household CapitalColumn G: Services Highways and StreetColumn H: Cost of CrimeColumn I: Cost of Family BreakdownColumn J: Loss of Leisure TimeColumn K: Cost of UnderemploymentColumn L: Cost of Consumer DurablesColumn M: Cost of CommutingColumn N: Cost of Household Pollution AbatementColumn O: Cost of Automobile AccidentsColumn P: Cost of Water PollutionColumn Q: Cost of Air PollutionColumn R: Cost of Noise PollutionColumn S: Loss of WetlandsColumn T: Loss of FarmlandColumn U: Depletion of Nonrenewable ResourcesColumn V: Long-Term Environmental DamageColumn W: Cost of Ozone DepletionColumn X: Loss of Forest CoverColumn Y: Net Capital InvestmentColumn Z: Net Foreign Lending and Borrowing
ISEW (or GPI) by Column

US
40
90
140
1940 1960 1980 2000
UK
40
90
140
1940 1960 1980 2000
Germany
40
90
140
1940 1960 1980 2000
Austria
40
90
140
1940 1960 1980 2000
Netherlands
40
90
140
1940 1960 1980 2000
Sweden
40
90
140
1940 1960 1980 2000
Chile
40
90
140
190
240
1940 1960 1980 2000
Indices of ISEW (Index of SustainableEconomic Welfare) and GDP (1970 = 100)

2,000
4,000
6,000
8,000
10,000
12,000
14,000
16,000
18,000
20,000
1950 1960 1970 1980 1990 2000
Year
$/c
ap
ita
Burlington
Chittenden
Vermont
US
Genuine Progress Indicator (GPI) per capita

ECOSYSTEM SERVICES
Gas regulation
Climate regulation
Disturbance regulation
Water regulation
Water supply
Erosion control and sediment retention
Soil formation
Nutrient cycling
Waste treatment
Pollination
Biological control
Refugia
Food production
Raw materials
Genetic resources
Recreation
Cultural
ECOSYSTEM FUNCTIONS
Regulation of atmospheric chemical composition.
Regulation of global temperature, precipitation, and other biologically mediatedclimatic processes at global, regional, or local levels. Capacitance, damping and integrity of ecosystem response to environmental fluctuations such as sea level rise.
Regulation of hydrological flows.
Storage and retention of water.
Retention of soil within an ecosystem.
Soil formation processes.
Storage, internal cycling, processing, and acquisition of nutrients.
Recovery of mobile nutrients and removal or breakdown of excess or xenic nutrients and compounds. Movement of floral gametes.
Trophic-dynamic regulations of populations.
Habitat for resident and transient populations.
That portion of gross primary production extractable as food.
That portion of gross primary production extractable as raw materials.
Sources of unique biological materials and products.
Providing opportunities for recreational activities.
Providing opportunities for non-commercial uses.
Ecosystem Services and FunctionsEcosystem Services and Functions

GUMBO (Global Unified Metamodel of the BiOsphere)
Atmosphere
Anthropo-sphere
EcosystemServices
HumanImpacts
Natural Capital Human-madeCapital(includes Built CapitalHuman Capital,and Social Capital
SolarEnergy
Hydrosphere
Lithosphere
Biosphere
11 Biomes
From: Boumans, R., R. Costanza, J. Farley, M. A. Wilson, R. Portela, J. Rotmans, F. Villa, and M. Grasso. 2002. Modeling the Dynamics of the Integrated Earth System and the Value of Global Ecosystem Services Using the GUMBO Model. Ecological Economics 41: 529-560

Global Unified Metamodel of the BiOsphere (GUMBO)• was developed to simulate the integrated earth system and assess the dynamics and
values of ecosystem services. • is a “metamodel” in that it represents a synthesis and a simplification of several
existing dynamic global models in both the natural and social sciences at an intermediate level of complexity.
• the current version of the model contains 234 state variables, 930 variables total, and 1715 parameters.
• is the first global model to include the dynamic feedbacks among human technology, economic production and welfare, and ecosystem goods and services within the dynamic earth system.
• includes modules to simulate carbon, water, and nutrient fluxes through the Atmosphere, Lithosphere, Hydrosphere, and Biosphere of the global system. Social and economic dynamics are simulated within the Anthroposphere.
• links these five spheres across eleven biomes, which together encompass the entire surface of the planet.
• simulates the dynamics of eleven major ecosystem goods and services for each of the biomes

Built Capital
Knowledge
GOODS &
SERVICES
Knowledge Formation
Built Capital Formation
Social Capital FormationSocial Capital
Labor Force
Ecosystem Goods Production
Fossil Fuel Extraction
Organic Matter Harvested
Ecosystem Services Production
Ore Production
Economic Production
Natural Capital Formation
Water use
WASTE
Disturbance Regulation
Gas RegulationClimate RegulationSoil Formation
Recreation and Cultural Services
Plant Nutrient Uptake
Waste Assimilation Potential
Personal Consumption
Economic Production
-
Savings rates

Welfare
Welfare from human made capital
Knowledge
Social Capital
- Welfare from waste
Welfare from consumption
Welfare from Ecosystem Services
Built Capital
Welfare

1000
800
600
400
200
0
Wetland 3000
2500
2000
1500
1000
500
0
Ice and Rock
2000
1500
1000
500
0
Tundra6000
5500
5000
4500
4000
3500
3000
Grasslands
6000
5500
5000
4500
4000
3500
3000
Forests1000
800
600
400
200
0
Urban
4000
3000
2000
1000
0
21002050200019501900
Croplands2000
1500
1000
500
0
21002050200019501900
Desert
Years
Landuse Changes

23
22
21
20
°C
Global Temp
1300
1200
1100
1000
900
800
700
Gig
a T
on
C
Atmospheric Carbon
0.4
0.3
0.2
0.1
0.0
me
te
rs
Sealevel 2000
1500
1000
500
0
Wa
ste
eq
uiv
ale
nts (
no
rm
ali
ze
d f
or 1
90
0)
Waste
4.0
3.5
3.0
Gig
a T
on
C e
qu
iva
len
ts
Alternative Energy
12
10
8
6
4
2
0
Gig
a T
on
C
Fossil Fuel extraction
1.0
0.8
0.6
0.4
0.2
0.0
Fo
ssil
_Fu
el_
Ma
rke
t_S
ha
re
eq
uiv
ale
nts (
no
rm
ali
ze
d f
or 1
90
0)
21002050200019501900
Year
Fossil FuelMarket share
16
14
12
10
8
6
4
Gig
a T
on
C e
qu
iva
len
ts
2050200019501900
Year
Total Energy
Startrek Big Goverment Ecoptopia Mad Max
Basecase Observations
Physics

20
15
10
5bil
lio
ns o
f in
div
idu
als
Human Population
4.0
3.5
3.0
2.5
2.0
1.5
SO
CIA
L_N
ETW
OR
K e
qu
iva
len
ts (
no
rm
ali
ze
d f
or 1
90
0)
21002050200019501900
Year
The Social Network
2000
1500
1000
500
0
Pro
du
ctiv
ity I
nve
ste
d
Knowledge
8000
6000
4000
2000
0
Pro
du
ctiv
ity I
nve
ste
d
Built Capital
800
600
400
200
0Pro
du
ctiv
ity I
nve
ste
d
Built capital per capita
300
250
200
150
100
50
0
Pro
du
ctiv
ity I
nve
ste
d
Knowledgeper capita
1.2
1.0
0.8
0.6
0.4
0.2
SO
CIA
L_N
ETW
OR
K_Pe
rC
ap
eq
uiv
ale
nts (
no
rm
ali
ze
d f
or 1
90
0)
21002050200019501900
Year
Social network per capita
Ecotopia Startrek Mad Max Big Goverment Basecase Observations

0.030
0.025
0.020
0.015
0.010
0.005
0.000
Price on waste treatment
30
25
20
15
10
5
0
Price on soil formation
3.0
2.5
2.0
1.5
1.0
0.5
0.0
Price on Cultural and recreational service
20
15
10
5
0
Price on Nutrient cycling
10
8
6
4
2
0
Price on gas regulation
30
25
20
15
10
5
0
Price on Disturbance regulatiuon
10
8
6
4
2
0
2050200019501900
Year
Climate price100
80
60
40
20
0
21002050200019501900
Year
Energy price

7000
6000
5000
4000
3000
Waste_Treatment7.2
6.8
6.4
6.0
Soil Formation
24
20
16
12
Recreation and_Culture 0.9
0.8
0.7
0.6
Nutrient_Cycling
12
10
8
6
4
2
Gas_regulation
2.76
2.72
2.68
2.64
Disturbance Regulation
10.90
10.85
10.80
10.75
10.70
10.65
21002050200019501900
Year
Climate Regulation500
400
300
200
100
21002050200019501900
Year
Ecosystem services value
Ecotopia StartrekMad Max Big Goverment Basecase

1.0
0.8
0.6
0.4
0.2
Global_Welfare
80
60
40
20
GWP_per_Capita120
100
80
60
40
20
19
89
do
lla
rs
GWP
0.16
0.12
0.08
0.04
Welfare_per_capita
0.20
0.16
0.12
0.08
21002050200019501900
Year
food_per_capita2.0
1.5
1.0
0.5
21002050200019501900
Year
Energy_per_Capita
10-4
10-3
we
lfa
re p
er
ca
pit
a e
qu
iva
len
ts (
no
rma
lize
d f
or
19
00
)
Welfare_GNP_Index
Ecotopia Startrek MadMax Big GovermentBasecase Observations

In Conclusion:The main objective in creating the GUMBO model was not to accurately predict the future, but to provide simulation
capabilities and a knowledge base to facilitate integrated participation in modeling.
It should be noted that this is “version 1.0” of the model. It will undergo substantial changes and improvements as we continue to develop it, and the conclusions offered here can only be thought of as “preliminary.” Nevertheless, we can reach some
important conclusions from the work so far, including:
To our knowledge, no other global models have yet achieved the level of dynamic integration between the biophysical earth system and the human socioeconomic system incorporated in GUMBO.
Preliminary calibration results across a broad range of variables show very good agreement with historical data. This builds confidence in the model and also constrains future scenarios.
• We produced a range of scenarios that represent what we thought were reasonable rates of change of key
parameters and investment policies, and these bracketed a range of future possibilities that can serve as a basis for further discussions, assessments, and improvements. Users are free to change these parameters further and observe the results.
Assessing global sustainability can only be done using a dynamic integrated model of the type we have created in GUMBO. But one is still left with decisions about what to sustain (i.e. GWP, welfare, welfare per capita, etc.) GUMBO allows these decisions to be made explicitly and in the context of the complex world system. It allows both desirable and sustainable
futures to be examined.
Ecosystem services are highly integrated into the model, both in terms of the biophysical functioning of the earth system and in the provision of human welfare. Both their physical and value dynamics are shown to be quite complex.
The overall value of ecosystem services, in terms of their relative contribution to both the production and welfare functions, is shown to be significantly higher than GWP (4.5 times in this preliminary version of the model).
“Skeptical” investment policies are shown to have the best chance (given uncertainty about key parameters) of achieving high and sustainable welfare per capita. This means increased relative rates of investment in knowledge, social capital, and
natural capital, and reduced investment in built capital and consumption.
• To our knowledge, no other global models have yet achieved the level of dynamic integration between the biophysical earth system and the human socioeconomic system incorporated in GUMBO. This is an important first step.
• Historical calibrations from 1900 to 2000 for 14 key variables for which quantitative time series data was available produced an average R2 of .922.
• A range of future scenarios representing different assumptions about future technological change, investment strategies and other factors have been simulated
• Assessing global sustainability can only be done using a dynamic integrated model of the type we have created in GUMBO. But one is still left with decisions about what to sustain (i.e. GWP, welfare, welfare per capita, etc.) GUMBO allows these decisions to be made explicitly and in the context of the complex world system. It allows both desirable and sustainable futures to be examined.
• Ecosystem services are highly integrated into the model, both in terms of the biophysical functioning of the earth system and in the provision of human welfare. Both their physical and value dynamics are shown to be quite complex.
• The overall value of ecosystem services, in terms of their relative contribution to both the production and welfare functions, is shown to be significantly higher than GWP (4.5 times in this preliminary version of the model).
• “Technologically skeptical” investment policies are shown to have the best chance (given uncertainty about key parameters) of achieving high and sustainable welfare per capita. This means increased relative rates of investment in knowledge, social capital, and natural capital, and reduced relative rates of consumption and investment in built capital.
GUMBO Conclusions