gulf of california and the baja pacific coast (5.9 mb) - global ocean
TRANSCRIPT
An Atlas of Oceanic Internal Solitary Waves (February 2004) Gulf of California and the Baja Pacific Coastby Global Ocean AssociatesPrepared for Office of Naval Research – Code 322 PO
311
Gulf of California and the Baja Pacific CoastOverview
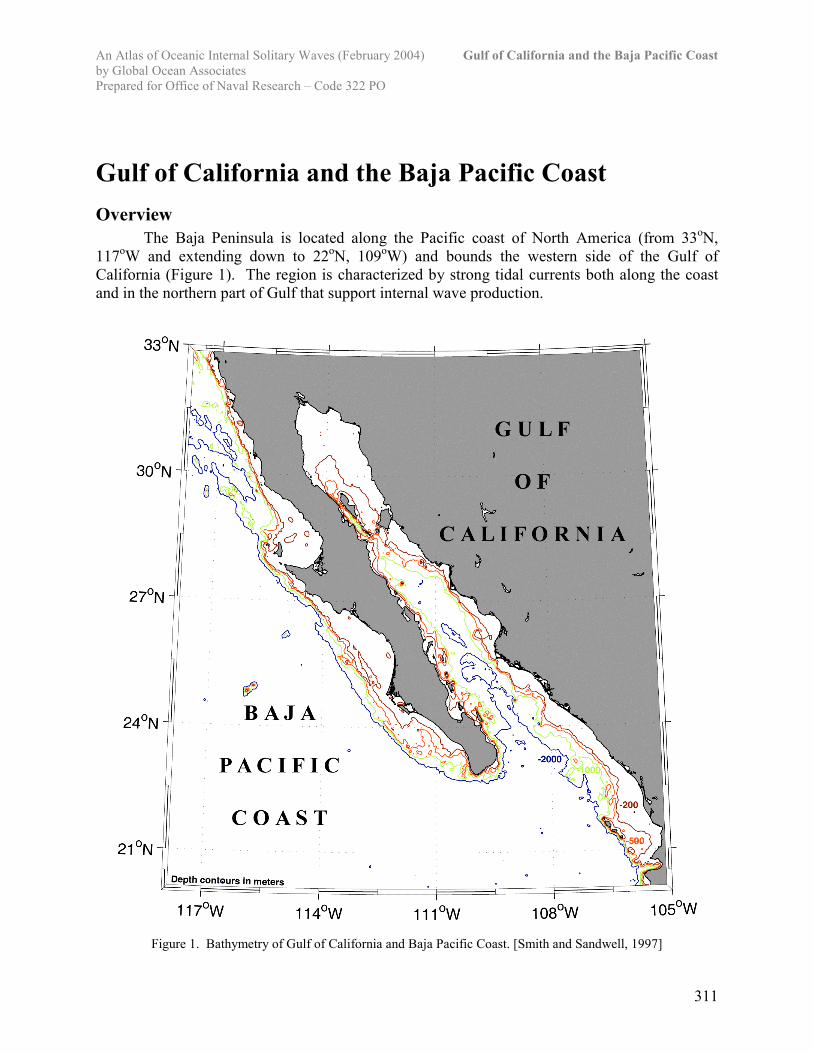
The Baja Peninsula is located along the Pacific coast of North America (from 33oN,117oW and extending down to 22oN, 109oW) and bounds the western side of the Gulf ofCalifornia (Figure 1). The region is characterized by strong tidal currents both along the coastand in the northern part of Gulf that support internal wave production.
Figure 1. Bathymetry of Gulf of California and Baja Pacific Coast. [Smith and Sandwell, 1997]

An Atlas of Oceanic Internal Solitary Waves (February 2004) Gulf of California and the Baja Pacific Coastby Global Ocean AssociatesPrepared for Office of Naval Research – Code 322 PO
312
ObservationsThere has been some scientific study of internal wave in the Gulf of California and the
Pacific Coast of Baja. Apel and Gonzalez [1983] examined internal wave signatures in SEASATSAR imagery acquired in the vicinity of Bahia San Juanico in July 1978. Their analysis showedthat the waves occurred on the continental shelf inside the 200 meter isobath and wereapproximately aligned parallel to the bathymetry. The waves occurred in well-defined packetswith packets having up to 20 individual waves. Individual wavelengths ranged between 200 mand 1.6 km. Packet separations were 15 to 23 km with along crest length of up to 76 km.
Fu and Holt [1984] also used SEASAT SAR imagery in their study of internal waves inthe Gulf of California. They examined nine images over exactly the same ground positioncollected at three-day intervals between 14 September and 8 October 1978 and demonstrated thecorrelation between internal wave field variation and strength of the local tides. The internalwave activity was found to be concentrated in the northern part of the Gulf (north of 28o) wherethe tides are strongest.
Table 1 - Months when internal waves have been observed in the Gulf of California and the Pacific Coast of Baja(Numbers indicate unique dates in that month when waves have been noted)
Jan Feb Mar Apr May Jun Jul Aug Sept Oct Nov Dec
2 5 2 6 7
ReferencesApel, J.R., and F.I. Gonzalez, 1983: Nonlinear features of internal waves off Baja California as
observed from the SEASAT Imaging Radar. J. Geophys. Res., 88 (C7), 4459-4466.Fu, L.L., and B. Holt, 1982, Seasat Views Oceans and Sea Ice with Synthetic Aperture Radar,
JPL Publication 81-120Fu, L.L., and B. Holt, 1984: Internal waves in the Gulf of California: Observations from a
spaceborne radar. J. Geophys. Res., 89 (C2), 2053-2060.Munk, W.H., 1941: Internal waves in the Gulf of California. J. Mar. Res., 4, 81-91.Smith, W. H. F., and D. T. Sandwell, 1997; Global seafloor topography from satellite altimetry
and ship depth soundings, Science, v. 277, 1957-1962http://topex.ucsd.edu/marine_topo/mar_topo.html

An Atlas of Oceanic Internal Solitary Waves (February 2004) Gulf of California and the Baja Pacific Coastby Global Ocean AssociatesPrepared for Office of Naval Research – Code 322 PO
313
Figure 2. ASTER false-color VNIR image over Bahia de La Paz inthe Gulf of California acquired on 10 May 2001 at 1821 UTC. Theimage shows internal waves can manifest themselves in smallenclosed basins over short distances. Imaged area is approximately60 km x 60 km.

An Atlas of Oceanic Internal Solitary Waves (February 2004) Gulf of California and the Baja Pacific Coastby Global Ocean AssociatesPrepared for Office of Naval Research – Code 322 PO
314
Figure 3. Astronaut Photograph (STS068-264-084) acquired on 2 October 1994 at 2133 UTC. The image showsinternal waves originating between San Lorenzo and San Esteban Islands and propagating south. Bathymetricvariations are most likely the cause the curvature in the waves propagation path. Imaged are is approximately 150km x 200 km. [Image Courtesy of Earth Sciences and Image Analysis Laboratory, NASA Johnson Space Center(http://eol.jsc.nasa.gov)].

An Atlas of Oceanic Internal Solitary Waves (February 2004) Gulf of California and the Baja Pacific Coastby Global Ocean AssociatesPrepared for Office of Naval Research – Code 322 PO
315
Figure 4. Simultaneous images of internal waves in the Gulf of California acquired with X-Band SAR and astronautphotography (STS068-273-54). The images were acquired 3 October 1994 at 2114 UTC, twenty fours hours afterSTS068-264-084 shown in Figure 3. [X-Band SAR from DLR http://isis.dlr.de/XSAR/. Astronaut photographcourtesy of Earth Sciences and Image Analysis Laboratory, NASA Johnson Space Center (http://eol.jsc.nasa.gov).]

An Atlas of Oceanic Internal Solitary Waves (February 2004) Gulf of California and the Baja Pacific Coastby Global Ocean AssociatesPrepared for Office of Naval Research – Code 322 PO
316
Figure 5. Seasat (L-band, HH) SAR image ofthe Gulf of California acquired on 29September 1978 at 1811 UTC (Rev 1355).Eight major wave groups can be identifiedalong with many minor ones [Fu and Holt,1982]. Nine images over exactly the sameground position collected at three-dayintervals between 14 September and 8October 1978 demonstrated the correlationbetween internal wave field variation andstrength of the local tides. [Fu and Holt1984]. Imaged area is approximately 100 kmx 285 km. [Image courtesy of NASA JPL]

An Atlas of Oceanic Internal Solitary Waves (February 2004) Gulf of California and the Baja Pacific Coastby Global Ocean AssociatesPrepared for Office of Naval Research – Code 322 PO
317
Figure 6. MODIS (Bands 1,3,4) 250-m resolution visible image overthe northern Gulf of California acquired on 18 July 2001 at 1835 UTC.More than a dozen individual packets are visible originating fromaround the various islands. Imaged area is 185 km x 200 km.

An Atlas of Oceanic Internal Solitary Waves (February 2004) Gulf of California and the Baja Pacific Coastby Global Ocean AssociatesPrepared for Office of Naval Research – Code 322 PO
318
Figure 7. Astronaut photograph (STS030-76-31) acquiredon 5 May 1989 at 1855 UTC. The image shows internalwave signatures approaching the Baja coast from twodirections. Imaged area is approximately 65 km x 65 km.[Image courtesy of Earth Sciences and Image AnalysisLaboratory, NASA Johnson Space Center(http://eol.jsc.nasa.gov).]

An Atlas of Oceanic Internal Solitary Waves (February 2004) Gulf of California and the Baja Pacific Coastby Global Ocean AssociatesPrepared for Office of Naval Research – Code 322 PO
319
Figure 8. Astronaut photograph (STS043-32-19) acquired in August 1989. The image shows internal waves on thecontinental shelf on the Pacific Coast of Baja. Imaged area is approximately 35 km x 55 km. [Image courtesy ofEarth Sciences and Image Analysis Laboratory, NASA Johnson Space Center (http://eol.jsc.nasa.gov)]
An Atlas of Oceanic Internal Solitary Waves (February 2004) Gulf of California and the Baja Pacific Coastby Global Ocean AssociatesPrepared for Office of Naval Research – Code 322 PO
320
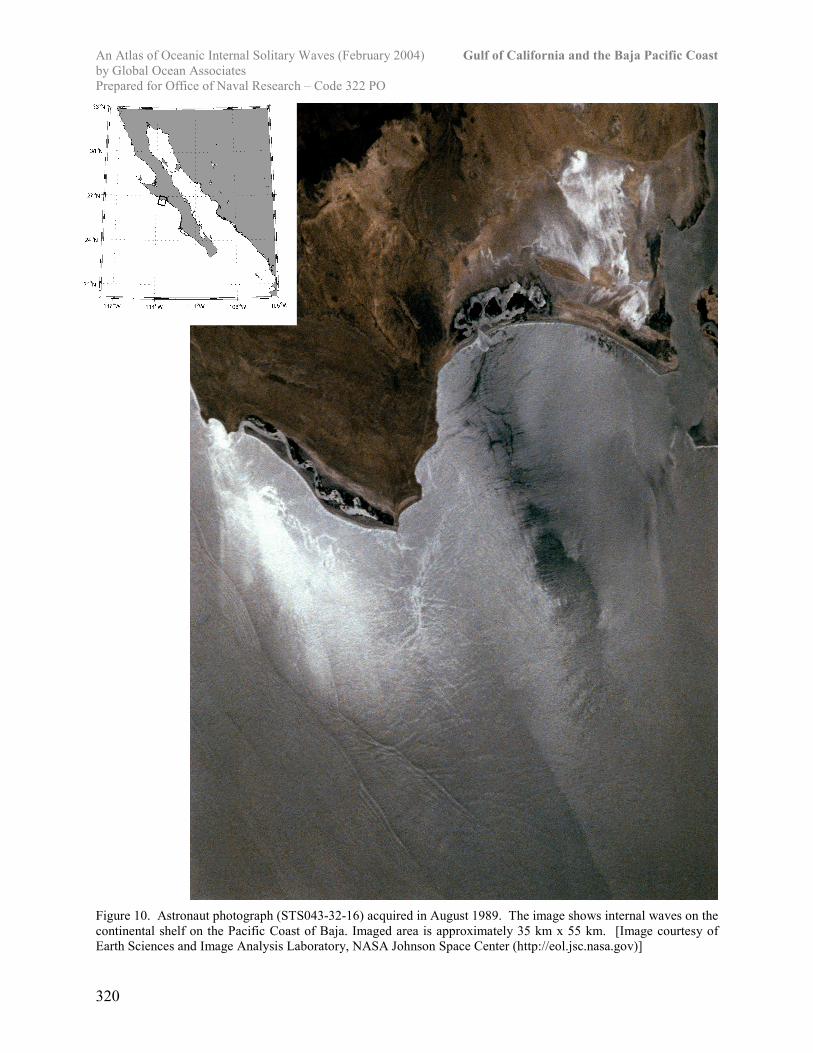
Figure 10. Astronaut photograph (STS043-32-16) acquired in August 1989. The image shows internal waves on thecontinental shelf on the Pacific Coast of Baja. Imaged area is approximately 35 km x 55 km. [Image courtesy ofEarth Sciences and Image Analysis Laboratory, NASA Johnson Space Center (http://eol.jsc.nasa.gov)]

An Atlas of Oceanic Internal Solitary Waves (February 2004) Gulf of California and the Baja Pacific Coastby Global Ocean AssociatesPrepared for Office of Naval Research – Code 322 PO
321
Figure 11. Astronaut photograph (STS043-32-13) acquired in August 1989. The image shows internal waves in thearea near Turtle Bay on the Pacific Coast of Baja. Imaged area is approximately 30 km x 50 km. [Image courtesy ofEarth Sciences and Image Analysis Laboratory, NASA Johnson Space Center (http://eol.jsc.nasa.gov)]

An Atlas of Oceanic Internal Solitary Waves (February 2004) Gulf of California and the Baja Pacific Coastby Global Ocean AssociatesPrepared for Office of Naval Research – Code 322 PO
322
THIS PAGE INTENTIONALLY LEFT BLANK