guidelines for the improved disinfection of small water
TRANSCRIPT

Guidelines for the Improved Disinfection of Small Water Treatment Plants
MNB Momba, P Thompson & CL Obi
Water Research
Commission
TT 355/08
TT 355/08 Guidelines for the Im
proved Disinfection of S
mall W
ater Treatment P
lants

GUIDELINES FOR THE IMPROVED DISINFECTION OF
SMALL WATER TREATMENT PLANTS
Report to the
Water Research Commission
by
*MNB Momba, **P Thompson & ***CL Obi *Tshwane University of Technology
** Umgeni Water
*** University of South Africa
WRC Report No TT 355/08
July 2008

ii
Obtainable from:
Water Research Commission Private Bag X03 Gezina 0031 [email protected]
The publication of this report emanates from a project entitled: Improving disinfection efficiency in small drinking water treatment plants (WRC Project No K5/1531).
This report forms part of a series of two reports. The other report is Improving Disinfection Efficiency in Small Drinking Water Treatment plants (WRC report number 1531/1/08).
DISCLAIMER
This report has been reviewed by the Water Research Commission (WRC) and approved for publication. Approval does not signify that the contents necessarily reflect the views and policies of
the WRC, nor does mention of trade names or commercial products constitute endorsement or recommendation for use.
ISBN 978-1-77005-726-5 Set No 978-1-77005-682-4 Printed in the Republic of South Africa

iii
Foreword
In South Africa the supply of drinking water to rural communities by small drinking water
treatment plants has been plagued by several operational and management problems. These
problems have previously been documented and proved to impinge on water quality, but efforts to
address them have been fragmented or conducted in a piecemeal manner. The comprehensive
guidelines contained in this report describe methods and processes for tackling the litany of
problems associated with the drinking water supplied by small water treatment plants. This is
critical, as the supply of safe drinking water is a fundamental human right and sine qua non for life.
The guidelines provide an overview of the problems and proffer practical solutions and
precautions that maximize the efficacy of disinfection for safe drinking water supplies to rural
communities for improved public health care delivery.
In compiling the guidelines, emphasis was placed on the multiple barrier approach to optimizing
disinfection, which highlights the importance of source selection and protection as the primary
barrier for the prevention of the contamination of the raw water. Appropriate planning, design and
unit process selection are reviewed, highlighting critical design parameters that should be strictly
implemented to ensure the optimum functioning of such water treatment plants. The criteria for the
selection of disinfectants and details for the design and maintenance of gaseous chlorine systems are
highlighted to ensure that proper maintenance practices are implemented because chlorination is the
primary disinfection protocol practised in South Africa.
The various chlorination techniques such as gaseous chlorination, liquid and granular
hypochlorination, including their advantages and disadvantages, are presented. Capital and
operating costs for typical small water treatment plants are highlighted to assist in budgeting and
planning. The description of a commercially available typical gravity dosing system in South Africa
is included as an option for use where frequent power failures are experienced.
Due to the importance of process and water quality monitoring, the guidelines include details on
critical process parameters that should be monitored as well as the frequency of monitoring that will
ensure the efficiency of the disinfection process. Contact details for accredited laboratories in South
Africa are included to assist management in appropriate budgeting.
This guide is intended for use by plant supervisors, plant operators, plants owners, consultants,
technical managers, design engineers and Municipal Water Local Authorities for ultimate service
efficiency and improved welfare.

iv

v
Executive Summary
A number of recent studies and surveys (Swartz, 2000; Mackintosh and Colvin, 2002; Momba
et al., 2004a; 2004b; Momba and Brouckaert, 2005; Obi et al., 2007) conducted in South Africa
have confirmed that about 50% of small treatment plants are not producing the desired water
quantity or quality. The primary reasons for the failure of these plants have been well documented
and include inappropriate technology, poor operation, lack of training, municipal financial
constraints, lack of motivation of operators and lack of knowledge of basic water treatment
operations.
Seventy eight percent (78%) of the operators lacked the ability to calculate chlorine dosages,
determine flow rate, estimate the free chlorine residual concentrations, undertake readings of
turbidity and pH values, or repair basic process equipment. In addition, there appears to be a lack of
understanding of process selection, design, techniques of chlorination, process quality monitoring
and evaluation. Poor working conditions, depletion of chemicals, the lack of a maintenance culture,
the lack of emergency preparedness and poor communication were also found to be major
contributors to the failure of these systems. The remoteness of many of the sites results in limited
technical support and this often leads to total/absence of disinfection or dysfunctional disinfection
systems.
These guidelines have been formulated to serve as a reference document on ways and means of
addressing the array of problems facing small water treatment plants in order to mitigate the
disastrous effects of unsafe water supplies. Application of the recommendations in these guidelines
will ensure that appropriate disinfection systems are selected and installed.
The guidelines include the multiple barrier approach to optimizing disinfection, which
highlights the importance of source selection and protection as the primary barrier for the
prevention of contamination of the raw water. The importance of appropriate planning and design
and unit process selection is highlighted. The technical properties of the various disinfection
practices employed in South Africa are reviewed and criteria for the selection of disinfectants are
included in the guidelines.

vi
In compiling the guide document, emphasis was placed on chlorination as the primary
disinfection protocol practiced in South Africa. Various chlorination techniques include gaseous
chlorination, liquid hypochlorination and granular hypochlorination. The advantages and
disadvantages of the various disinfectants are discussed in detail. Details for the design and
maintenance of gaseous chlorine systems are highlighted to ensure that proper maintenance
practices are implemented. Capital and operating costs for a typical plant sized at 2.5 Ml/d are
included as a guide to assist in budgeting and planning.
A description of a typical gravity dosing system available commercially in South Africa is
included as an option for use where frequent power failure is experienced. The minimum
requirements for operator training and development are included. A summary of roles and
responsibilities of the various role players involved in the management and operation of this system.
The guidelines also emphasize the need for regular water quality and process monitoring and
provide a contact list of various reference laboratories that can assist in this area.
These guidelines outline practical steps for improving the efficiency of disinfection at small
rural water treatment plants and are intended to be used by plant supervisors, plant operators, plants
technical managers, design engineers, plant owners, consultants and Local Authorities for ultimate
service efficiency and improved welfare.

vii
Acknowledgements
The following persons and organisations are thanked for their contribution to these guidelines:
Financial Support
Water Research Commission
Members of the Steering Committee
Dr G Offringa Water Research Commission (Chairman) Prof M Momba Tshwane University of Technology Prof D Key University of Western Cape Mr C Swartz Chris Swartz Engineer Ms M du Preez CSIR Mr M Ramba Emanti Mr PL Chimloswa Amatola Water
Project Team and Technical Support
Prof M Momba Tshwane University of Technology (Project Leader) Mr P Thompson Umgeni Water (Project Team) Prof CL Obi University of South Africa (Project Team) Ms Z N Makala University of Fort Hare (Project Team) Ms Tyafa University of Fort Hare (Project Team) Mr K Charles CSIR (Project Team) Dr A Okoh University of Fort Hare (Technical Support) Dr BM Brouckaert University of KwaZulu-Natal (Technical Support) Mr C Mfenyana University of Fort Hare (Technical Support) Miss A Okeyo University of Fort Hare (Technical Support) Mr N Sibewu University of Fort Hare (Technical Support) Mr A Bosrotsi University of Fort Hare (Technique Support) Mr A Samie University of Venda (Technical Support) Mr E Green University of Venda (Technical Support) Mr E Musie University of Venda (Technical Support) Xolani Ngcemu Umgeni Water (Technical Support) Narina Ramdhaw Umgeni Water (Administrative Support) Nazley Abboy Umgeni Water (Technical Support)

viii

ix
TABLE OF CONTENTS
Executive Summary ............................................................................................................................V
Acknowledgements............................................................................................................................vii
Chapter 1 Introduction .........................................................................................................................1
Chapter 2 Survey of Disinfection Efficiency of Small Drinking Water Treatment Plants: Challenges Facing Small Water Treatment Plants in South Africa...............................................................3
2.1 Introduction...........................................................................................................................3
2.2 Summary of the major findings and conclusions reached....................................................4
Chapter 3 Technical Guidelines For Effective Implementation Of Disinfection In Small Water Treatment Plants .......................................................................................................................10
3.1 Introduction ........................................................................................................................10 3.2 Process Selection................................................................................................................10
3.2.1 Source Selection ..........................................................................................................10 3.2.2 Design parameters .......................................................................................................11
3.2.3 Unit process selection ......................................................................................................12
3.3 Chlorine Disinfection .........................................................................................................14 3.3.1 Terminology ................................................................................................................14 3.3.2 Techniques of chlorination..........................................................................................15 3.3.3 Selecting a Suitable Disinfection System....................................................................16 3.3.4 Process Monitoring......................................................................................................20 3.3.5 Distribution quality monitoring...................................................................................21
3.4 Capital and Operating Costs...............................................................................................22 3.5 Guidelines for Design of Chlorine Gas Facilities ..............................................................32 3.6 Operation of Small Water Treatment Systems...................................................................35 3.7 Selection, Operation and Maintenance of Chlorinators .....................................................36
3.7.1 Nature of the flow of the water to be treated...............................................................36 3.7.2 Origin of the doser and its operation/maintenance requirements................................37 3.7.3 Types of chlorine compound available .......................................................................37
3.8 Chlorinator options for different sources of water .............................................................38 3.8.1 Open wells...................................................................................................................38 3.8.2 Boreholes.....................................................................................................................39 3.8.3 Springs.........................................................................................................................40
3.9 Chlorine dose......................................................................................................................40 3.10 Contact Time and CT Value.............................................................................................41 3.11 Problems with Chlorinators..............................................................................................42
3.11.1Problems with precipitation and scaling ....................................................................42 3.11.2 Corrosion...................................................................................................................43
3.12 Availability and stability of chlorine compounds, and risks from additives....................43 3.13 Handling precautions and transportation..........................................................................44 3.14 Accuracy of preparation of solutions for dosing ..............................................................45 3.15 Calculations ......................................................................................................................46 3.16 Measurement of Treated Water Flow Rates.....................................................................46 3.17 Mixing of the dose with the water to be treated ...............................................................47 3.18 Testing for chlorine concentration ...................................................................................47

x
Chapter 4 Management Guidelines For Effective Implementation Of Disinfection In Small Water Treatment Plants.............................................................................................................49
4.1 Roles and Responsibilities..................................................................................................49 4.2 Training and Development.................................................................................................51 4.3 Operator Salaries & Motivation .........................................................................................52 4.4 Community Involvement and Awareness ..........................................................................52 4.5 Maintenance .......................................................................................................................52 4.6 Independent Water Quality and Process Audits.................................................................53
Conclusion .........................................................................................................................................54
References..........................................................................................................................................55
Appendix 1.........................................................................................................................................58 Appendix 2.........................................................................................................................................64
xi
LIST OF FIGURES
Figure 2.1: Category of Ownership of Small Treatment Plants surveyed in South Africa............ 4
Figure 2.2: Types of Water Sources in Small Treatment Plants surveyed in South Africa ........... 5
Figure 2.3: Types of Coagulants used in Small Treatment Plants Surveyed in South Africa ....... 5
Figure 2.4: Types of Filters used in Small Treatment Plants surveyed in South Africa................ 6
Figure 2.5: Types of Disinfectants used in Small Treatment Plants in South Africa .................... 6
Figure 2.6: Turbidity Compliance of Small Treatment Plants at the Point of Treatment .............. 7
Figure 2.7: Turbidity Compliance of Small Treatment Plants in Distribution system .................. 7
Figure 2.8: Free Chlorine per Province at Point of Use and Point of Treatment ........................... 8
Figure 2.9: Bacteriological Compliance at the Point of Treatment................................................ 8
Figure 2.10: Bacteriological Compliance in Distribution System ................................................. 9
Figure 3.1: Chlorine Concentration as a Function of pH Source .................................................15
Figure 3.2: Breakpoint Chlorination Curves ............................................................................... 16
Figure 3.3: Gas Chlorination P&ID ............................................................................................. 22
Figure 3.4: Typical Setup for 70 kg Gas Chlorine System…………………………….….…….23
Figure 3.5: Typical Setup for Gravity Dosing System.................................................................23

xii
LIST OF TABLES
Table 3.1: Recommended design criteria for small water treatment plants .................................13
Table 3.2: Advantages and Disadvantages of Chlorine ...............................................................16
Table 3.3: Methods of Chlorine Addition ....................................................................................18
Table 3.4: Important Considerations for use of Chlorine as Disinfectant....................................19
Table 3.5: Cost of process monitoring equipment........................................................................20
Table 3.6: Sampling Frequency at a Water Works – Raw and Final ...........................................21
Table 3.7: Design of Sodium Hypochlorite Dosing System ........................................................24
Table 3.8: Operating Costs of Sodium Hypochlorite Dosing System..........................................25
Table 3.9: Capital & Operating Costs of Sodium Hypochlorite Dosing System.........................26
Table 3.10: Gas Chlorination Design ...........................................................................................27
Table 3.11: Capital Costs for Gas Chlorination ...........................................................................28
Table 3.12: Total Operating Costs for Gas Chlorination .............................................................29
Table 3.13: Calcium Hypochlorite Design and Capital Costs......................................................30
Table 3.14a: Calcium Hypochlorite Operating Costs ..................................................................31
Table 3.15b: Calcium Hypochlorite Operating Costs ..................................................................31
Table 3.16: Comparison of Costs of Disinfection Alternatives ...................................................32
Table 4.1: Roles And Responsibilties ..........................................................................................50

1
CHAPTER 1
INTRODUCTION
In South Africa, water infrastructure is well developed in urban areas as opposed to rural areas
where the infrastructure is either poorly developed or non-existent. The supply of water to rural
communities is usually undertaken through small water treatment plants. Small water treatment
plants are defined as water treatment systems that are installed in areas which are not well serviced
and which do not normally fall within the boundaries of urban areas. They include water supplies
from boreholes and springs which are then chlorinated, treatment plants of small municipalities and
establishments such as rural hospitals, schools, clinics and forestry stations. However, the efficacy
of small water treatment plants is plagued by several technical and management problems, which
include: the inability of plant operators to calculate chlorine dosages, determine flow rate, estimate
free chlorine residual concentrations, undertake readings of turbidity and pH values, or effect repair
of basic equipment. In addition, there appears to be lack of understanding of process selection,
design, techniques of chlorination, process quality monitoring and evaluation. Others include poor
working conditions, the frequent depletion of chemical stock, the lack of a maintenance culture, the
lack of emergency preparedness and poor communication (Swartz, 2000; Mackintosh and Colvin,
2002; Momba et al., 2004a; 2004b; Momba and Brouckaert, 2005; Obi et al., 2007). The
remoteness of many of the sites results in limited technical support and this often leads to a total
absence of disinfection or a dysfunctional disinfection system. This is corroborated by the extensive
documentation on the supply of water of poor microbiological quality, which is unsafe for human
consumption, in different provinces of South Africa. Contaminated water is a vehicle for several
waterborne diseases such as cholera, typhoid fever, shigellosis, salmonellosis, campylobacteriosis,
giardiosis, cryptosporidiosis and Hepatitis A viral infections. Such infections cause great
debilitation including a substantial degree of morbidity and mortality in different age groups in both
males and females, with ripple effects on socio-economic and health care systems.
Consequently, these guidelines have been formulated to serve a reference document on ways
and means of addressing the array of problems facing small water treatment plants in order to
mitigate the disastrous effects of unsafe water supplies. These guidelines have been derived from
the findings of a survey of 181 small water treatment plants in South Africa (WRC Report
1531/1/08: Improving disinfection efficiency of small drinking water treatment plants) which is
available at the Water Research Commission of South Africa.

2
The document is presented in three major parts and highlights the results of the survey of
disinfection efficiency of small drinking water treatment plants. It provides guidance on good
practice for technical as well as management issues concerning small water treatment plants for the
purpose of effective implementation of the disinfection process.
The installation and operating costs for the different disinfection systems and chemicals, the cost
of disinfecting drinking water to the required standard using the required equipment instrumentation
and manpower, and the estimated costs of maintenance as well as human development needs are
also included in the document.
Chapter 2 covers the results of the detailed surveys that were undertaken. Technical and non-
technical issues that are responsible for the poor disinfection of small treatment plants were
identified and summarized.

3
CHAPTER 2
SURVEY OF DISINFECTION EFFICIENCY OF SMALL DRINKING WATER TREATMENT PLANTS: CHALLENGES FACING SMALL WATER TREATMENT PLANTS IN SOUTH
AFRICA
2.1 Introduction
In order to unravel the intricacies around the operational and management parameters impinging
on the efficiency of small water treatment plants and to ensure sustainability of a potable water
supply to rural communities, a study involving 181 small water treatment plants across seven
provinces of South Africa was undertaken (WRC Report 1531/1/08). The focus was to determine
the nature and full extent of the problems and provide practical and user-friendly guidelines for
intervention. Specific objectives addressed in this survey include the following:
To identify and characterize the various types of disinfection equipment currently
employed at small water treatment systems, as well as systems that could potentially be
used.
To identify the means of disinfection (i.e. the physical and/or chemical processes)
employed at these systems, as well as the performance, chemical and electrical inputs, and
ongoing maintenance requirements of each type.
To identify or determine the current quality of treated water, procedures followed to
monitor and control the disinfection processes and the adequacy and consistency of the
levels of disinfectant added.
To identify the frequency and adequacy of microbiological tests performed on the final
treated water.
To identify the main reasons for disinfection problems experienced at small water systems
– both technical and non-technical.
To estimate the cost of drinking water disinfection appropriate for the required standards
using the required equipment, instrumentation and manpower.
To identify major problems resulting in water quality changes in a distribution system.

4
2.2 Summary of the major findings and conclusions reached
Small water treatment plant ownership – Four categories of the plant ownership were identified
viz Local/District Municipality, Department of Water Affairs and Forestry (DWAF), Department of
Health (DOH) and Water Board (private company). Overall 81% of the small water treatment plants
surveyed in South Africa were owned by Local/District Municipality.
3628
54
13
181
19 18
130
20
40
60
80
100
Lim
popo
Mpu
mal
anga
Nor
th W
est
Free
Sta
te
KwaZ
ulu
Nat
al
East
ern
Cap
e
Wes
tern
Cap
e
RS
A
%
0
20
40
60
80
100
120
140
160
180
200
Municipality DWAF Private No of Plants Surveyed
No of Plants
Surveyed
Figure 2.1 Category of Ownership of Small Treatment Plants surveyed in South Africa
Design capacity of small water treatment plants – The capacity of the plants surveyed during
the investigation varied between 0.3 ML/d and 120 ML/d. Most of the plants were operating below
the design capacity.
Type of raw water sources – Overall 86% of the small water treatment plants surveyed
abstracted their raw water from surface sources, 10% used groundwater and 4% a combination of
both sources.

5
36
13
54
13
181
19 18
28
0
10
20
30
40
50
60
70
80
90
100
Limpopo Mpumalanga North West Free State KwaZulu Natal* Eastern Cape Western Cape RSA0
20
40
60
80
100
120
140
160
180
200
Surface Water Ground Water Combined No of Plants Surveyed
No of Plants Surveyed
%
Figure 2.2 Types of Water Sources in Small Treatment Plants surveyed in South Africa
Water treatment practices – Conventional water treatment processes were generally used in the
majority of the plants surveyed. In terms of coagulation, it was noted that polyelectrolyte (66%) was
commonly used, followed by alum (18%) and ferric chloride (6%). Sixty percent of the small water
treatment plants used the rapid gravity filtration system while a further 24%, 9% and 2% of the
plants made use of pressure filters, slow sand filtration and diatomaceous earth filters respectively.
Chlorine gas was found to be the most popular disinfectant (69%), followed by sodium hypochlorite
(15%) and calcium hypochlorite (HTH) (14%), among others.
36
19 1813
28
54
13
181
0
10
20
30
40
50
60
70
80
90
100
Limpopo Mpumalanga North West Free State Kwazulu Natal Eastern Cape Western Cape RSA0
20
40
60
80
100
120
140
160
180
200
Polyelectrolyte Alum Ferric Chloride Ferric + Polyelectrolyte Alum + Polyelectrolyte No of Plants Surveyed
%
No of Plants Surveyed
Figure 2.3 Types of Coagulants used in Small Treatment Plants Surveyed in South Africa

6
36
19 18
28
54
13
181
13
0
10
20
30
40
50
60
70
80
90
Limpopo Mpumalanga North West Free State KwaZulu Natal Eastern Cape Western Cape† RSA
Name of Province
0
20
40
60
80
100
120
140
160
180
200
Rapid Gravity Pressure Filter Slow sand
Membrane Diatomaceous Earth No of Plants Surveyed
No of Plants Surveyed
%
Figure 2.4 Types of Filters used in Small Treatment Plants surveyed in South Africa
36
19 1813
28
54
13
181
0
10
20
30
40
50
60
70
80
90
Limpopo Mpumalanga North West Free State KwaZulu Natal Eastern Cape Western Cape RSA0
20
40
60
80
100
120
140
160
180
200
Chlorine Gas HTH Sodium hypochlorite Chlorine Dioxide Ozone Bromine No of Plants Surveyed
%
No of Plants Surveyed
Figure 2.5 Types of Disinfectants used in Small Treatment Plants in South Africa
Physicochemical quality compliance – All water samples collected at various plants fell within
SANS 241:2005 Class I in terms of pH (5 to 9.5) and conductivity (< 150 mS/m).

7
Turbidity – At the point of treatment, 44% and 38% of the small water treatments surveyed in
South Africa fell within SANS turbidity Class I (<1 NTU) and Class II (1-5 NTU), respectively. At
the point of consumption, 46% and 41% of the plants fell within Class I and Class II, respectively.
The highest turbidity compliance (Class I: 69-73%, Class II: 27-31%) was noted in the Free State
and the lowest turbidity compliance (Class I: 27-33%, Class II: 24-45%) was recorded in the
Eastern Cape Province.
36
19 1813
28
13
181
54
0
10
20
30
40
50
60
70
80
Limpopo Mpumalanga North West Free State Kwazulu Natal Eastern Cape Western Cape RSA
Name of Province
0
20
40
60
80
100
120
140
160
180
200
Class 1 < 1 NTU Class 2 1 to 5 NTU Class 2 > 5 NTU No of Plants Surveyed
No of Plants Surveyed
%
Figure 2.6 Turbidity Compliance of Small Treatment Plants at the Point of Treatment
18
181
54
28
1319
36
13
0
10
20
30
40
50
60
70
80
Limpopo Mpumalanga North West Free State Kwazulu Natal Eastern Cape Western Cape RSA
Name of Province
0
20
40
60
80
100
120
140
160
180
200
Class 1 < 1 NTU Class 2 1 to 5 NTU Class 2 > 5 NTU No of Plants Surveyed
No of Plants Surveyed
%
Figure 2.7 Turbidity Compliance of Small Treatment Plants in Distribution system

8
Chlorine residual – Overall, the small water treatment plants surveyed had drinking water with
free chlorine residual concentrations ranging between ≤ 0.1 and ≤ 0.5 mg/L. Forty percent of the
plants visited during the survey did not comply with the ideal target range of 0.3-0.6 mg/L free
chlorine residual in the consumer’s tap water. In most cases, the flow rate of the water and the
initial chlorine dose were not known, resulting in under chlorinated drinking water.
0
10
20
30
40
50
60
70
80
90
Limpopo Mpumalanga North West Free State Kwazulu Natal Eastern Cape Western Cape RSA
Perc
enta
ge B
elow
Stip
ualte
d Li
mit
Chlorine at Point of Treatement <= 0.5 Chlorine at Point of Treatement <= 0.1
Chlorine at Point of Use <= 0.2 Chlorine at Point of Use <= 0.1
Figure 2.8 Free Chlorine per Province at Point of Use and Point of Treatment
During the on-site evaluation of the operating conditions at Fort Beaufort, Seymour and Alice
water treatment plants, the following major problems were found to impact on the effectiveness of
the disinfection process in the distributions: i) the distribution systems of the pipe network did not
show acceptable levels of residual chlorine while the plant chlorination systems gave adequate
dosage at the dosing points; ii) a high chlorine demand in the reservoirs and bulk pipelines resulted
in low chlorine concentrations in the distribution system.
33
1911
17
28
53
12
173
0
20
40
60
80
100
120
Limpopo Mpumalanga Free State North West KZN Eastern Cape Western Cape RSA
Name of Province
0
20
40
60
80
100
120
140
160
180
200
Total Coliform Compliance (%) (<10 cfu/100ml) Faecal Coliform Compliance (%)(<1 cfu/100 ml) Total Plants Surveyed
%
No of Plants Surveyed
Figure 2.9 Bacteriological Compliance at the Point of Treatment

9
33
1911
17
28
53
13
174
0
20
40
60
80
100
120
Limpopo Mpumalanga Free State North West KZN Eastern Cape Western Cape RSA
Name of Province
0
20
40
60
80
100
120
140
160
180
200
Total Coliform Compliance (%) (<10 cfu/100ml) Faecal Coliform Compliance (%)(<1 cfu/100 ml) Total Plants Surveyed
%
No of Plants Surveyed
Figure 2.10 Bacteriological Compliance in Distribution System
Microbiological compliance – For coliforms, 67% and 72% of the plants complied with the
South African drinking water recommended limits for total coliforms and faecal coliforms at the
point of treatment, respectively. The Eastern Cape Province produced the lowest drinking water
quality in terms of both total (28% of the plants) and faecal (34% of the plants) coliforms while the
Free State produced the best water quality (100% compliance).
Control and monitoring – Generally, 50% of the operators and supervisors interviewed did not
display the knowledge of the flow-rates at which their plants operated and more than 78% were
unaware of the chemical doses used or how to correlate the required dose to the flow rate. In terms
of instrumentation, only 46% of plants surveyed had the instruments to measure turbidity, pH and
chlorine residual. Ninety-five percent of the plants reported that an external monitoring group
visited the plants approximately once a month; however most plants complained about a lack of
feedback.
Non technical (management) aspects – Non technical issues affecting the efficiency of water
supply by small water treatment plants included: inadequate manpower training, poor maintenance
practices, poor working conditions, insufficient financial capacity, poor recording, documentation
and communication of data and information, as well as inadequate community involvement.
Chapter 3 provides a detailed guideline on the technical issues that need to be taken into
consideration when selecting a disinfection system.

10
CHAPTER 3
TECHNICAL GUIDELINES FOR EFFECTIVE IMPLEMENTATION OF DISINFECTION IN SMALL WATER
TREATMENT PLANTS
3.1 Introduction
This chapter provides the reader with a summary of the technical issues that need to be
considered when implementing disinfection. Issues that are covered include the emphasis on the
application of an appropriate source and unit process selection as the first step in applying the
principles of “barriers” to reduce the risk of microbiological failures when disinfecting water.
Selecting appropriate design parameters is critical in minimising risk. It also covered the practical
issues involved in selecting disinfectants, the basic chemistry that needs to be taken into
consideration as well as the advantages and disadvantages of the various types of disinfectants that
are applicable to small treatment plants. Capital and operating costs of the various options available
to managers are evaluated. The practical aspects involved in maintaining chlorinators have been
highlighted.
3.2 Process Selection
3.2.1 Source Selection
It is important to apply a multiple barrier approach when
treating waters for human consumption, the greater the number
of barriers, the less the likelihood of infection.
Source protection minimizes the risk of pathogens entering a water treatment plant and selection
is thus a critical aspect of the design of a waterworks. Typical barriers are sedimentation, filtration
and disinfection.
It is important to emphasise
that the first barrier should
be source selection and
protection.

11
Wells and boreholes can get
contaminated by users due to poor
abstraction methods. Users should be
educated on the use of hygienic methods
of abstraction such as using clean
buckets and where possible ensuring
that the well or spring is protected. A pump should be fitted to a borehole to minimize the
possibility of contamination.
In South Africa a large proportion of the
groundwater sources tend to be contaminated with
iron, manganese fluoride and nitrate. Removal of
these contaminants requires sophisticated
chemical processes that are difficult to operate in
the rural environment.
Often this contaminated underground water is the only source available and process engineers have
no choice but to implement these sophisticated chemical treatment processes.
Schoeman and Steyn (2002) have recently made considerable progress in the use of membranes
for the removal of nitrates in rural schemes. This has been made possible by ensuring that a well-
trained technical team is readily available to assist the local community. Selection of the correct
water treatment system is the first step in ensuring sustainable potable water to small communities.
These aspects are covered in the following sections.
3.2.2 Design parameters
Design engineers often concentrate on getting the maximum flow out of the limited funds
available for small water treatment plants, resulting in the neglect of the disinfection unit process,
which can be considered to be the main and final barrier in ensuring safe production of potable
water. It is necessary to ensure that reservoirs are designed in a modular fashion to ensure ease
upgrade. In many of the small rural schemes, population statistics and growth rate data are often not
available. Formerly, the estimation of population density, growth rates and water consumption
figures for design purposes was poor. However, this has improved markedly over the last five years
and has resulted in changes to the design standards.
Groundwater would typically be the first choice as
this requires minimal treatment and in many cases
only needs to be disinfected. Do keep in mind that
many South African boreholes contain soluble iron
and manganese that will require treatment

12
Ensure Proper Unit Process
selection by undertaking
detailed Raw Water quality
analysis for at least 12
months before design of the
plant
A second parameter that has been improved is the design period for construction. Earlier design
engineers used the traditional design periods of 20-30 years. These figures resulted in major water
quality failures in the primary distribution systems due to long retention times. They have been
downgraded and designs are now undertaken for periods of 5 to 10 years, and structures such as
reservoirs are designed in a modular fashion to ensure ease of upgrade.
In rural areas, water is often transported over long distances, firstly by pipeline, frequently
followed by transport in buckets, drums and vehicles, increasing the possibility of cross
contamination.
3.2.3 Unit Process Selection
In rural schemes of South Africa, surface water is the primary
source available (86% of the plants surveyed abstracted water
from surface sources) and this has necessitated the use of
traditional treatment processes of chemical coagulation,
flocculation sedimentation, filtration and disinfection.
During water quality assessment, it is also necessary to ensure that sufficient samples are
taken for laboratory jar tests to determine optimum pH, coagulant type and dosage rates. If this
information is not available, the design engineer should investigate whether other water treatment
plants abstract water from the same river or catchment as this would provide appropriate
performance data for existing unit processes.
Primary reasons for failure of disinfection systems in small treatment plants are as follows:
Poor design
Poor maintenance
Lack of appreciation by operators and management of the importance of disinfection
Lack of communication between technical officials and political decision makers
Lack of training
Selection of inappropriate technology
Lack of spares
Misdirection of funds from water treatment to other areas
Lack of water quality information and absence of water quality monitoring programmes
Poor pre-treatment of upstream unit processes. Table 3.1 summarizes the recommended
design criteria for small water treatment plants.

13
Slow sand filters remove Cryptosporidium more effectively than pressure or rapid gravity filters.
Design problems experienced with pressure filters tend to be the incorrect sizing of the filters due to
budget constraints. In poorly planned systems, the cost of the treatment plant is often under-
estimated and thus there is a limited budget for project implementation. This results in high
filtration rates of 20 to 30 m/h, resulting in short filter runs and high energy costs due to the need
for frequent backwashing. Many pressure filters have inefficient backwashing systems due to poor
design. This inefficient backwashing system, coupled with the fact that none of the typical pressure
filters has a combined air/water backwashing system, leads to mudballing with subsequent
deterioration in filtered water quality. Chemical dosing systems required for pressure filtration are
frequently oversized resulting in overdosing. The modern trend is to replace conventional ferric
sulphate and aluminium sulphate salts with polyelectrolytes. These polyelectrolytes are very
sensitive to dose and minor deviations from the optimum dose will cause a re-stabilization of the
particles and a failure of the system. In small treatment systems, alum and ferric salts are still the
preferred choice as they are less sensitive to over or under-dosage.
TABLE 3.1
RECOMMENDED DESIGN CRITERIA FOR SMALL WATER
TREATMENT PLANTS
Design Parameters Minimum Maximum
Slow sand filtration rate 0.1 m3/m2.h 0.3 m3/m2.h
Rapid gravity filtration rate 5 m3/m2.h 7 m3/m2.h
Pressure filtration rate 5 m3/m2.h 15 m3/m2.h
Horizontal sedimentation 0.5 m3/m2.h 1 m3/m2.h
Upflow Sludge Blanket Clarifiers 1 m3/m2.h 2 m3/m2.h
Do not exceed a filtration rate of 0.3 m3/m2.h for slow sand filters
Keep pressure filtration to a maximum of 10 m3/m2.h
Use alum or ferric chloride whenever is possible
Use slow sand filters whenever possible provided the source water quality
limits tabulated in Table 3.1 are complied with,

14
Other typical design problems include the lack of facilities for the measurement of raw water
flow rate, filtration velocity and headloss development. One of the major advantages of slow sand
filtration is that there is often no need for chemical dosing.
3.3 Chlorine Disinfection
Disinfection is the physico-chemical addition of a chemical designed to inactivate
microorganisms and pathogens that are harmful to human health. There are a wide variety of
disinfectants available for application in the water industry. This presents a dilemma for water
works managers and municipal managers in South Africa. This section provides an overview of the
important considerations when selecting a disinfectant for application in small treatment plants.
The most common chemical used for disinfection is chlorine and it can be applied in different
forms, viz, either as a gas, liquid (sodium hypochlorite) or a solid form (calcium hypochlorite either
as a tablet or a powder)
3.3.1 Terminology
Chlorine dose required - The amount of chlorine
required to satisfy the chlorine demand and also to
achieve the required chlorine residual.
When chlorine is added to water the following
reaction takes place:
Chlorine gas Cl2 dissolves in water to form hypochlorous (HOCl) and hydrochloric acid (HCl).
The actual disinfecting agent is hypochlorous acid which dissociates as below.
Cl2 + H2O = HOCl +HCl
Chlorine Dose = Chlorine Demand + Chlorine
Residual
CChhlloorriinnee rreessiidduuaall:: TThhee aammoouunntt ooff cchhlloorriinnee
rreemmaaiinniinngg iinn tthhee wwaatteerr aafftteerr aa mmiinniimmuumm
ccoonnttaacctt ppeerriioodd ooff uussuuaallllyy 2200 mmiinnuutteess aafftteerr tthhee
ddiissiinnffeeccttiioonn..
HOCl H+ + OCl-

15
Hypochlorous acid has excellent microbiocidal properties and penetrates the microorganism’s
cell walls by disrupting its metabolic activities. The chlorine species in the form of hypochlorous
acid, HOCl, plus the hypochlorite ion, OCl-, are termed free available chlorine. Chlorine in the form
of monochloramine (together with other chloramine species) is termed combined available chlorine.
As indicated in Figure 3.2, the above reaction is highly pH dependent – higher hydrogen (H+)
ion concentrations will drive the reaction to the left thus increasing the concentration of
hypochlorous acid.
3.3.2 Techniques of chlorination
The principal chlorination practices of relevance to small water supplies are:
Free residual chlorination: where the available residual chlorine (the chlorine in the water after
a specific period of time) is either in the form of HOCl or OCl-.
Breakpoint chlorination: In breakpoint chlorination, sufficient chlorine is added to react with
ammonia and organics in the water leaving a free residual concentration for the protection of the
distribution system. This ensures that the distribution system is protected against secondary
contamination (Figure. 3.2).
Chloramination or combined residual chlorination: Ammonia is deliberately added to the water
in conjunction with chlorine. This system is practised where there are long distribution systems.
Table 3.2 summarizes the advantages and disadvantages of chorine disinfection.
Figure 3.1 Chlorine Concentrations as a function of pH (AWWA, 2001)

16
Figure 3.2. Breakpoint Chlorination Curves (Source - White, 1999)
TABLE 3.2
ADVANTAGES AND DISADVANTAGES OF CHLORINE
Disinfectant Advantages Disadvantages
Chlorine Cost effective, well established
process, effective against a wide
spectrum of pathogens and can be
dosed in a number of different forms.
Flexibility in its application to suit
various circumstances provides a
lasting residual that can easily be
measured in the distribution system
using very simple apparatus.
Highly corrosive, limits the
materials of use. Shipping and
handling and application thus have to
be carefully controlled and managed
on a water works. Forms a number of
disinfection by-products which can be
harmful to human health, however its
advantages far outweigh these
disadvantages.
3.3.3 Selecting a Suitable Disinfection System
The following factors must be taken into consideration when choosing a suitable disinfectant:
Ease of handling,
Safety,
Ability to destroy harmful bacteria and pathogens,
Storage,
Capital and operating costs,
1 2 3
TOTALCHLORINEAPPLIED
MEASUREDCHLORINERESIDUAL
BREAKPOINT(POINT A)
IRREDUCIBLECHLORINE RESIDUAL
NUMP
ZONE ZONE ZONE
7-65
N CONC.
N
CHLO
RIN
E CONC. (
mg/L)
CHLORINE CONC. (Mg/L)
AMMONIA-N CONC. (Mg/L)

17
Toxicity and disinfection by-products,
Size of water treatment plant,
Remoteness of site,
Size of plant and suitability of disinfection system
Tables 3.3 and 3.4 summarise various methods of chlorine additions and important considerations
for the use of chlorine as a disinfectant, respectively.

18
TABLE 3.3
METHODS OF CHLORINE ADDITION
Method Description Safety precautions Costs
Gaseous
chlorine
Chlorine is delivered as a gas
in 70 kg or 1 ton cylinders. In
small treatment plants the typical
size used is the 70 kg cylinder. A
chlorinator is required to feed the
gas into the water stream. The gas
is fed into the stream by creating a
vacuum using a pump and ejector.
The gas feed rate is controlled by
a metered orifice.
Gaseous chlorine is a strong
oxidizing agent. It is highly
toxic and required stringent
safety precautions. Minimum
safety equipment required for
the installation includes
breathing apparatus and shower.
Training is critical.
This is the most
economical method
of disinfection.
Typical costs are
14c/kl for a 2.5 Ml/d
plant.
Sodium
hypochlorite
Sodium hypochlorite is
supplied as liquid ranging in
concentration 8% to 16%.
Delivery is either in 20 litre, 200
litre or larger bulk tanks. The
solution can be diluted before
addition to the process stream or
in larger plants; it can be fed
directly as a concentrate.
Sodium hypochlorite
solution is strongly oxidizing,
toxic and classified as a
hazardous chemical. Safety
precautions in handling include
gloves, eye protection and a
bund wall large enough to
contain the full volume under
storage.
Costs are
approximately
35c/kl for a 2.5
Ml/d plant.
Calcium
hypochlorite
Calcium hypochlorite is
supplied in granular of tablet
form. Available chlorine
concentration is 65%. The
granules have to be dissolved in
water to prepare 5% m/v solution
before addition to the process
stream
Calcium hypochlorite is a
strongly oxidizing, toxic
chemical. When added to water
it produces heat and will react
with any oxidizing material.
Preparation tanks must either be
Glass Re-enforced Plastic or
PVC type compounds.
Cost is
approximately
36c/kl for a new
installation for a 2.5
Ml/d plant

19
TABLE 3.4
IMPORTANT CONSIDERATIONS FOR USE OF CHLORINE AS DISINFECTANT
Consideration Description
Generation Chlorine, a chlorine gas, sodium hypochlorite or calcium hypochlorite
is manufacture off-site by specialist manufacturers. There has been a
move to on-site generation; however this involves high maintenance and
technical support.
Primary uses The primary use of chlorination is disinfection. Chlorine also serves
as an oxidizing agent for taste and odor control, the prevention of algal
growths, maintaining clear filter media, the removal of iron and
manganese, the destruction of hydrogen sulfide, color removal,
maintaining the water quality at the distribution systems, and improving
coagulation.
Inactivation efficiency The general order of increasing chlorine disinfection difficulty is
bacteria, viruses, and then protozoa. Chlorine is an extremely effective
disinfectant for inactivating bacteria and highly effective viricide.
However, chlorine is less effective against Giardia cysts.
Cryptosporidium oocysts are highly resistant to chlorine.
Byproduct formation When added to the water, free chlorine reacts with natural organic
matter (NOM) and bromide to form disinfection by-products (DBPs),
primarily trihalomethanes (THM)'s, some haloacetic acids (HAAs), and
others.
Point of application Raw water storage, coagulation/post-raw water storage, pre-
sedimentation/ post coagulation, post-sedimentation or pre-filtration, post
filtration (disinfection), or in the distribution system.
Special
considerations
Because chlorine is such a strong oxidant and extremely corrosive,
special storage and handling considerations should be considered in the
planning of a water treatment plant. Additionally, health concerns
associated with the handling and use of chlorine is an important
consideration.

20
3.3.4 Process Monitoring
It is essential to monitor the treatment process, especially the final water disinfection doses and
residual chlorine concentrations. Ideally, a plant should be maintained in a steady state with
minimal flow rate or raw water quality changes or interruptions. However this is seldom the case
and flow rate changes will be experienced.
All flow rate changes must be accompanied by a process change where the chlorine dose is
either increased or decreased to compensate for the flow rate variation. Similarly when the raw
water quality changes, there is a need to change the coagulant dose and the chlorine dose. These
changes must be effected after the necessary calculations are done and the information must be
recorded in a log sheet. A list of SANAS approved laboratories is attached as Appendix 1.
Process Water Quality must be monitored every two hours. Turbidity, chlorine and pH should
be measured at the raw water inlet, clarifier overflow, individual filters and reservoirs. A typical
process control log sheet is attached as Appendix 2.
All water treatment plants must have a jar stirrer on site to determine the optimum coagulant
dose. Table 3.5 lists the basic process laboratory equipment required for a waterworks.
TABLE 3.5
COSTS OF PROCESS MONITORING EQUIPMENT
Equipment Budget Cost
Ph meter R6 000
Turbidity Meter R20 000
Chlorine Comparator R5 000
Lab Bench R10 000
Deionised water still R5 000
Jar Stirrer R30 000
Consumables and reagents R10 000 per annum
Glassware R5 000

21
Budget approximately R10 000 per month for sampling
3.3.5 Distribution quality monitoring
Sampling Frequency in Distribution System
In a piped water supply, the probability of contamination of the distribution system increases
with the length of the pipe network and the plumbing systems attached to it. It is desirable to take
samples at least weekly; however in small systems, this may not be possible due to human resource
and financial resource constraints. The Sampling frequency recommended by the World Health
Organisation (WHO, 1993) is tabulated in Table 3.6. It is important that the sampling frequency be
spaced out evenly throughout the month. It is thus best to cluster a number of water works and
employ a dedicated sampling officer to sample the raw water storage dams, final water reservoirs
and distribution reservoirs.
TABLE 3.6a
SAMPLING FREQUENCY AT A WATERWORKS
Determinand Frequency
Raw Water Final Water
Free Chlorine NA Two-hourly
Total Chlorine NA Two-hourly
Turbidity Two-hourly Two-hourly
pH Two-hourly Two-hourly
Total Coliforms Weekly Daily
Faecal Coliforms Weekly Daily
Faecal Streptococci Weekly Daily
Colony Counts Weekly Daily
Suspended Solids Weekly NA

22
TABLE 3.6b
SAMPLING FREQUENCY AT A WATER WORKS – RAW AND FINAL
Population Served Minimum Number of Samples
Less than 5 000 1 sample per month
5 000 – 100 000 1 sample per 5 000 population per month
More than 100 000 1 sample per 10 000 per month
3.4 Capital and Operating Costs
Capital and operating costs are highly dependent on the plant size, the environment in which the
product is being used and the form in which it is applied. Generally, gaseous chlorine has the lowest
total operating costs in comparison to calcium and sodium hypochlorite. The total costs should
include the capital costs, the operation and maintenance costs, equipment replacement and repairs
and personnel costs. The following sections provide a summary of the design of typical chlorination
systems as well as the respective capital and operating costs. The designs are based on an average
plant size of 2.5 Ml//d. Costs are based on 2007 values. A typical Process and Instrumentation
Diagram (P&ID) for a Gas Chlorination system is illustrated in Figure 3.3. The costs have been
estimated on the basis of the aforementioned design with the duty and standby system as shown in
Figure 3.4.
Figure 3.3 Gas Chlorination P&ID

23
Calcium hypochlorite is added to a perforated basket and diluted with water to the required
concentration. Allowance is made for mechanical agitation using an axial type mixer. Baffles are
used to optimize mixing and minimise vortexing which can lead to the settling of the calcium.
Calcium hypochlorite solutions are highly corrosive to many of the steel alloys available. A typical
setup of this gravity based dosing system is illustrated in Figure 3.5. In this application Glass Re-
enforced Plastic (GRP) materials are used wherever possible. Where steel has to be used, it has to
be encapsulated in GRP to minimise exposure to the hypochlorite solution. Mixer shafts and
impellers have to be coated with a fluoroploymer for optimum protection.
Installation and operating costs of disinfection Systems are summarized in Tables 3.8 and 3.9
below.
Figure 3.5 Typical Setup for Gravity Dosing System
Figure 3.4 Typical Setup for 70 kg Gas Chlorine System (AWWA, 2001)

24
TABLE 3.7
DESIGN OF SODIUM HYPOCHLORITE DOSING SYSTEM
Average daily inflow Ml/day 2.5
Average inflow Ml/year 913
Chlorine dose mg/l 7
Chlorine dose kg/Ml 7
Chlorine consumption Tons/year 6.39
Mass Balance Min Average Max
Inflow Ml/day 1.50 2.50 3.00
Chlorine dosage mg/l 7.00 7.00 7.00
Chlorine dosage rate required kg/day Cl2 10.50 17.50 21.00
NaOCl specific gravity kg/litre 1.05 1.05 1.05
Sodium hypochlorite 10% m/v % (m/v) 10.00 10.00 10.00
Sodium hypochlorite dosage required l/day 105.00 175.00 210.00
Sodium hypochlorite dosage required l/hr 4.38 7.29 8.75
Storage capacity Min Average Max
NaOCl consumption l/day 105.00 175.00 210.00
NaOCl consumption m3/day 0.11 0.18 0.21
Maximum supplier off-line time Days 15.00 15.00 15.00
Min storage required cap. required m3 1.58 2.63 3.15
Minimum bulk tank size
Tanker load (10% m/v) m3 2
Safety factor 0.25
Tank size for accepting delivery m3 2.50
Equivalent chlorine delivered kg Cl2 200.0

25
TABLE 3.8
OPERATING COSTS OF SODIUM HYPOCHLORITE DOSING SYSTEM
Container size as sold Litres 25
Cost as delivered R/litre NaOCl R2,40
Sodium hypochlorite R/kg NaOCl R2,29
Sodium hypochlorite empty container price R/container R57,00
Contribution of cost of container to overall price R/litre container 2.28
Sodium hypochlorite total price as delivered R/litre NaOCl R4,68
Chlorine total price as delivered R/kg Cl2 R46,80
Chlorine cost (delivered) R/ton Cl2 R46 800
Chlorine cost per annum R/yr R298 935
Total inflow (based on average inflow) Ml/yr 912.50
Chemical costs R/annum R298 935
Direct annual operating costs R308 935
Total annual operating costs R317 455

26
TABLE 3.9
CAPITAL & OPERATING COSTS OF SODIUM HYPOCHLORITE DOSING SYSTEM
Item Description No Unit Cost Total
Purchased equipment (installed) R15 800
Bulk storage tanks, 2 m3 GRP 2 R3 000 R6 000
Day tank, 0.1 m3, GRP 1 R800 R800
Dosing pumps 2 R4 000 R8 000
Piping & fittings (PVC, C16) R1 000
Electrical & instrumentation R6 800
Level transmitter 2 R3 000 R6 000
Installation 1 R800 R800
Civil & structural R20 000
Bund & plinth 1 R4 000 R4 000
Total fixed capital investment R42 600
Annual Operating Costs R/yr cents/kl
Chemical cost – avail chlorine R298 935 32.76
Maintenance R10 000 1.10
Direct operating costs R308 935 33.86
Fixed charges
Depreciation (20% pa)
R8 520 0.93
Total operating costs R317 455 34.79

27
TABLE 3.10
GAS CHLORINATION DESIGN
Gas Chlorination Operating Costs
Gas Chlorination Design Parameters Quantity Units
Unit cost (R/kg) 12.00 R/kg
Treated water flow rate 2.50 Ml/day
Purity (% Cl2) 100.00 %(m/m)
Dose (mg/l Cl2) 7 mg/l Cl2
Dose (kg/Ml) 7 kg/Ml
Daily chlorine gas consumption 17.50 kg/day
No. of days per year 365 days/yr
Annual consumption 6 387.50 kg/year Cl2
Annual cost R76 650 R/yr
Cost per kl 8.40 cents/kl
Size of chlorinator 0.7 kg/h

28
TABLE 3.11
CAPITAL COSTS FOR GAS CHLORINATION SYSTEM
Description Quantity Unit Rate Amount
Cylinder manifold 2 R5 000 R10 000
Chlorinators, one duty and one standby. 2 R15 000 R30 000
Chlorine leak detector and alarm system
dual sensor
1 R20 000 R20 000
Duty/standby operating water booster
pumps for chlorinator including
connections
2 R4 000 R8 000
Heating & lagging 1 R5 000 R5 000
Valves, fittings, chlorine injection sets 1 R10 000 R10 000
Breathing apparatus (gas respirators) 1 R20 000 R20 000
Chlorine cylinders, 65 kg each filled 2 R8 400 R16 800
Scales 2 R10 000 R20 000
Exhaust fan, 1 R15 000 R15 000
Emergency shower, eyewash 1 R4 000 R4 000
First aid kit 1 R1 000 R1 000
Warning and instruction signboards 1 R1 000 R1 000
Filter cartridges for breathing apparatus. 4 R600 R2 400
Chlorine gas injector. 2 R2 600 R5 200
O' rings for vacuum and dosing unit. 4 R4 100 R16 400
TOTAL R184 800

29
TABLE 3.12
TOTAL OPERATING COSTS FOR GAS CHLORINATION
Fixed Capital Costs
Item description Total
Purchased equipment (installed) R184 800
Civil & structural R10 000
Total fixed capital investment R194 800
Operating costs R/yr cents/kl
Chemical cost R76 650 8.40
Maintenance R10 000 1.10
Direct operating costs R86 650 9.50
Fixed charges: depreciation (20%) R38 960 4.27
Total operating costs R125 610 13.77

30
TABLE 3.13
CALCIUM HYPOCHLORITE DESIGN AND CAPITAL COSTS
Typical Calcium Hypochlorite (HTH) Dosing System
Basis for design Size No. Cost (R)
Process flow rate 2.50 Ml/day
Chlorine dose required 7 mg/l Cl2
No. of days per year 365
Daily consumption 17.50 kg/day Cl2
Solution strength 5 % (m/v)
No. batches prepared per day 1
Volume solution required per day 0.35 m3
Tank diameter (assume 1 m) 1 m
Area of tank 0.79 m2
Height of tank 0.45 m
Allow free board of 0.3 m 0.30 m
Total height of tank 0.75 m
Estimated Cost on 1 m3 Tank
CAPITAL COSTING Unit Cost No Cost
Preparation tank size 1 m3
Cost of preparation tank R5 000 2 R10 000
Baffles for make up tank R2 000 2 R4 000
Constant head tank size 0.02 m3
Cost of constant head tank R5 000 2 R10 000
Axial flow mixers R15 000 2 R30 000
20 mm PVC pipework 1 000 1 R1 000
Electrical 10 000 1 R10 000
Fitting and installation 20 000 1 R20 000
Total capital costs R85 000
The calculations for the design and costing of the dosing system are based on the preparation of
5% (m/v) calcium hypochlorite solution.

31
TABLE 3.14
CALCIUM HYPOCHLORITE OPERATING COSTS(a)
Process flow Design flow (Ml/d) Units
Calcium hypochlorite unit of supply 50 kg drums
Unit cost (R/kg) calcium hypochlorite 16.00 R/kg
Purity % Cl2 68% %(m/m)
Unit cost (R/kg) as chlorine (Cl2) 23.53 R/kg Cl2
Dose 7 mg/l Cl2
No. of days per year 365
Daily consumption 17.5 kg/day
Annual consumption as chlorine (Cl2) 6 387 kg/year
Annual consumption as chlorine (Cl2) 6.39 Tons/ year
Annual cost Rands per year 150 294 R/Year
Cost per kilolitre 16.47 Cents/kl
TABLE 3.15
CALCIUM HYPOCHLORITE OPERATING COSTS(b)
Fixed Capital Costs
Item Description Total
Purchased equipment (installed) R85 000
Civil & structural R5 000
Total fixed capital investment R90 000
Operating Costs
Item description R/yr cents/kl
Direct chemical cost R150 294 16.47
Maintenance R5 000 0.55
Direct operating costs R155 294 17.02
Depreciation 20%
Fixed charges: depreciation (20%) R18 000 1.97
Total Annual Operating costs R328 588 36.01

32
TABLE 3.16
COMPARISON OF COSTS OF DISINFECTION ALTERNATIVES Gas/liquid
Chlorination
Sodium
Hypochlorite
Calcium
Hypochlorite
Capital cost R194 800 R317 455 R90 000
Direct operating cost c/kl 9.50 33.86 17.02
Maintenance c/kl 1.10 1.10 0.55
Total Operating Cost c/kl 13.77 34.79 36.01
3.5 Guidelines for Design of Chlorine Gas Facilities
Chlorine gas is very toxic and the primary consideration when selecting this unit process is
public safety, plant reliability and operation. All chlorine gas installations should be designed to
ensure that a leak can be contained in the chlorine room thus minimizing plant personnel and the
public exposure. Doors and windows should be gas-tight to minimize escape of gaseous chlorine to
the exterior atmosphere or building interior.
Chlorinators should be housed in a room separate from but adjacent to the chlorine storage
room. This is to minimize the need to enter the storage room to adjust feed rates and to
minimize the potential for equipment damage caused by chlorine leaks. A gas-tight shatter
resistant window shall be present for viewing the storage and chlorinator rooms from an
interior wall of the plant.
Works managers must consider the following design guidelines extracted from the Ten State
Standards (2004), when selecting this unit process:
All chlorine cylinders must be contained in the chlorine storage room. Vacuum regulators
should be located on individual chlorine cylinders in service. The use of pressurized
chlorine gas lines and manifolds is strongly discouraged and, if utilized, must be contained
in the chlorine storage room.
All chlorine cylinders should be adequately restrained.
Chlorinators should be housed in a room separate from but adjacent to the chlorine storage
room. This is to minimize the need for entering the storage room to adjust feed rates and to
minimize the potential for equipment damage caused by chlorine leaks. A gas-tight shatter
resistant window should be present for viewing the storage and chlorinator rooms from an
interior wall of the plant.

33
The chlorine storage room should only be accessible from the outside. The exterior access
door for the chlorine storage area must open outward, being equipped with panic bar hardware
on the interior. A small viewing window should be present in the door or adjacent to the door
in the exterior wall to allow operator examination of the room before entry. Loading dock
doors shall also open outward and be equipped with the appropriate moldings, gaskets, and
weather stripping to minimize gas leakage to the exterior. Inside access to the chlorinator
room shall be acceptable if chlorine gas is supplied under vacuum.
All access doors should be properly labeled with appropriate warning signs.
A pressure relief valve should be located on the chlorine vacuum line within the vacuum
regulator to prevent gas pressurization of the chlorinator. This valve should be vented to the
chlorine storage room or to the outside if appropriate.
All openings between the chlorine storage room and other parts of the building should be
sealed such that chlorine leaks can be contained within the storage room.
There should be no exterior windows to chlorine storage rooms other than the small viewing
window at the entrance. (This is to minimize the potential for heat build-up from the sun and
to minimize vandalism.)
Scales should be constructed of durable material to withstand the aggressive environment and
situated such that they can be easily and accurately read through a viewing window or use of a
remote readout. This type of design will minimize the need to enter the chlorine storage area
to take readings.
Separate light and ventilation switches should be located outside of the chlorine storage room
near the entrance door and interior viewing window. Lighting fixtures within the chlorine
storage area should be suitable for use in an aggressive environment and, if possible, designed
to operate even during a chlorine gas release.

34
Electrical components should be minimized within the chlorine storage area. Motors for
louvers, cylinder cranes, and ventilation
equipment shall be suitable for use in
an aggressive environment.
Convenience electrical components,
such as outlets, should be avoided. All
electrical systems for the chlorine
storage area should be on dedicated
circuits.
The chlorine storage room should be equipped with ventilation equipment capable of one
complete air exchange per minute. This equipment should be located such that it will
draw suction near the floor as far away as practical from the entrance door and air inlet.
Exhaust shall be located away from the door and other air intakes. Exhaust discharge
should be located so as not to contaminate other air inlets to any rooms or structures. Air
intakes should be through louvers near the ceiling. Louvers for intakes and exhaust should
facilitate airtight closure.
All ventilation and duct work within a chlorine storage room should be separated from
domestic building ventilation systems. All chlorine room duct work should be gas tight
and not pass through other rooms or areas of the building.
The self contained breathing apparatus (SCBA) should not be located within the chlorine
storage room. It is preferable that this equipment be placed in a convenient location where
personnel can easily access it in the event of an emergency.
Service water to operator injectors/eductors should be of adequate supply and pressure to
operate feed equipment within the needed chlorine dosage range for the proposed system.
All service water should be properly protected by the appropriate cross connection control
device.

35
The placement of injectors/eductors should be carefully evaluated. Current system
operation and chlorination practices should also be reviewed before design. In some
cases, it may be appropriate to locate the injector/eductor in the chlorinator room with
distribution of highly chlorinated water to the point of application. In other situations, it
may be best to locate the eductor/injector can at the point of application with distribution
of chlorine gas through plastic tubing under vacuum to the point of application.
A chlorine cylinder repair kit with a leak detection bottle should be supplied within each
chlorine storage room.
Floor drains should not be designed within the chlorine storage area.
Combustible materials should not be stored in chlorine rooms.
Fire sprinkling systems should not be installed in chlorine rooms.
The location of the chlorine room should be on the prevailing downwind side of the
building, away from entrances, windows, louvers, walkways, etc.
When using chloramination, the ammonia room must be separate from the chlorine storage
room.
3.6 Operation of Small Water Treatment Systems
Schultz and Okun (1984) quote the following statement by George D Woods, former president
of the World Bank (1965): “Neither general programs nor even generous supplies of capital will
accomplish much until the right technology, competent management, and manpower with the
proper blend of skills are brought together and focused effectively on well conceived projects.”
They rightly conclude that this statement “summarizes the dilemma that is faced in the provision of
water in the developing world.”
Many of the schemes implemented are sold as fully automated package plants and there is often
the perception that there would either be no operators required or minimal operational input. We
have found that irrespective of the degree of automation, a minimum operator input of two hours
per day is required to ensure continual production of acceptable quality water. The operator needs to
undertake the following measurements on a daily basis: chlorine, pH, turbidity, flow rates, reservoir
levels and chemical dosages.
Intervention by the operator would depend on their level of training. However, it is expected that
they would have been trained to make decisions such as optimising the chemical doses.

36
All systems that have treatment plants will need some technical backup from management,
artisans, technicians, laboratory personnel, scientists and process engineers. Small stand-alone
treatment systems cannot afford this level of institutional backup and this is one of the primary
reasons for the failure of the entire system. Fortunately, in large institutions, such as Water Boards
and the larger Metropolitan Municipalities, these services are readily available as the overhead costs
can be shared across a large number of small treatment systems.
3.7 Selection, Operation and Maintenance of Chlorinators
In a detailed review of gravity and water powered chlorinators, Skinner (2001) lists the
following criteria that should be used in selecting chlorinators. The following sections are
abstracted from the review.
3.7.1 Nature of the flow of the water to be treated
“Is the water stagnant or flowing – Water driven chlorinators will require flowing water.
Is the flow constant or variable? Some dosers can automatically compensate for changes in flow
rate but many can not.
Is the flowrate continuous or intermittent? Continuous, constant flow is usually the easiest
situation to cope with, other than if the chlorinator has to discontinue operation when it is being
refilled or maintained. Having a standby unit that can be brought into operation whilst the first is
being maintained is a good idea if the flow of water can definitely not be stopped during the
maintenance period, although this situation is rare. If flow is continuous and the dosing is
interrupted then obviously some of the water will not receive the correct dose of chlorine. However,
it may be possible to divert this water to waste. If flow periodically ceases, some chlorinators will
automatically stop, others will have to be turned off manually, while some units’ valves are needed
to stop siphoning taking place when flow stops.
Does all of the water have to pass through the unit or should a bypass be used? With high
flowrates it may be necessary to divert only part of the flow through the chlorinator. This water is
then dosed with a high concentration of chlorine before it is diverted back, to be thoroughly mixed
with the remainder of the water. Care needs to be taken when using a bypass, to ensure that the
proportion of flow diverted through the unit remains constant, particularly if the flowrate is
variable.

37
What dosing rate per hour is required? Some chlorinators can only dispense small doses of
solution, which makes them only suitable for disinfecting water with low flowrates. This problem is
compounded if only low strength solutions are available for dosing. Although the use of more than
one chlorinator in parallel will increase the total rate of dosing, the use of a different type of
chlorinator may be the better alternative.
Does the flow need to remain in a pipe or can it be open to the atmosphere? In some situations
the dose needs to be added to flow in a pressurized pipe. Only a few types of chlorinators are
suitable for this.
Is the chlorine demand of the water constant? None of the chlorinators described in this report
can automatically adjust for changes in the dosing rate to cope with changes in the chlorine demand
of the water. It is therefore important that a chlorinator operator test the concentration of free
residual chlorine (in the water leaving the contact tank) whenever s/he suspects there is a change in
the quality of the raw water. Adjustments to the dose should then be made if necessary”.
3.7.2 Origin of the doser and its operation/maintenance requirements
Is the doser produced locally or is it imported?
If an imported chlorinator is to be used it is important that a reliable supply of affordable,
essential spares be readily available. Because small chlorinators are not widely used it may be hard
to find in-country agents able to supply such a service. If this is the case enough spares for several
years operation, or even for the whole life of the chlorinator, may need to be purchased when it is
initially imported.
What are the operational and maintenance requirements of the doser?
The level of skills of both the operators of the chlorinator and the technical staff who may
support them should be matched to the complexity of the operation and maintenance tasks. Training
and monitoring of performance will often be necessary to ensure that operators carry out effective
chlorination.
3.7.3 Types of chlorine compound available
What form of chlorine is available?
Different forms of chlorine, sodium hypochlorite, chlorinated lime, calcium hypochlorite, liquid,
powder, tablets, etc. may determine what types of chlorinator are feasible.
Is the supply of the chlorine compound reliable?
38
In view of the potential, fast deterioration of some chlorine compounds, effective chlorination
will often require a regular and reliable supply of chlorine compounds. If it is properly stored
calcium hypochlorite has the longest shelf-life of the compounds discussed in this report, but for
many chlorinators it will first have to be dissolved to prepare a solution ready for dosing. The
calcium content of chloride of lime and calcium hypochlorite may cause problems unless regular
maintenance takes place.
3.8 Chlorinator options for different sources of water
The most appropriate choice of chlorinator will be partly dependent on the source of the water
and the way in which it is collected or distributed. These aspects are discussed in the following sub-
sections.
3.8.1 Open wells
Successful chlorination of water from open wells is problematic. Unless the water is pumped
from the well the usual choice is a diffusion device such as a pot chlorinator, but this may not be
effective. Another option is to use a constant-rate dosing device to drip-feed chlorine solution into
the well at a suitable rate to match the average rate at which the water is being collected from the
well. This is also unlikely to provide a very reliable dose, since it will tend to provide too little
chlorine during periods of peak demand and too much during periods when the well is not in use.
There also needs to be a way in which the device can be turned off overnight or at other times of
low water demand from the well.
The fact that the water in open wells is not flowing practically rules out the use of most of the
other chlorination devices. However, if the water is raised from the well using a suction hand pump
then a direct suction doser, fitted to the suction side of the hand pump may be used. If it is feasible,
household-level treatment will be another option, which will require less chlorine solution because
the householder can choose to only treat drinking water which seems more logical.
Any organic matter introduced into an open well will consume some of the chlorine meant for
disinfecting the water. It is therefore important to keep the well water as clean as possible.

39
3.8.2 Boreholes
Water in a properly constructed and maintained borehole that is equipped with a hand pump or a
mechanically powered pump is not prone to contamination by users. Chlorination is therefore only
necessary if for some reason the groundwater is already polluted or to give some level of protection
from contamination in a piped distribution system. If a motorised pump is raising the water, then a
number of different types of chlorinator may be appropriate. In fact the situation is identical to that
discussed below when treating pumped surface water except that other treatment processes to deal
with turbidity, etc., will not be necessary.
Unfortunately the variable and intermittent nature of the discharge from hand pumps usually
means that any chlorinator positioned after the pump is unlikely to perform well. However, the
suction device already described may be appropriate if users allow sufficient contact time before
they consume the water. This system is not appropriate for deepwell hand pumps because the
suction side of the cylinder in these pumps will be below the container from which the solution will
be drawn. This means that the solution will continue to siphon into the well even after pumping
stops. Household-level treatment is probably the only reliable method of chlorination where
deepwell hand pumps are used.
A constant rate drip-feed dosing device is not suitable for a hand pump supply because of the
intermittent use of the borehole. Potentially such a device could be used with a powered pumping
system that pumps for a long period at a fairly constant rate, as long as the chlorinator can be turned
off as soon as the pump stops. However, to be effective the chlorine solution needs be delivered
close to the intake to the pump, which is usually some distance below the water level. Delivery at
this point may be achieved if the solution is dripped into an open pipe that runs down the inside of
the borehole to a point near to where the water is entering it from the aquifer.
Some groundwater may contain chemicals such as iron that initially react with chlorine making
less of the dose available for disinfection. The chlorine demand of the chemicals in groundwater
should therefore be established before designing a chlorination system.
3.8.3 Springs
The water from a well-protected spring should all originate from groundwater. Often this will be
safe and will not need any disinfection other than what may be desirable to protect it in a
distribution system. Once the spring water has been channeled into a pipe a number of chlorination
systems may be appropriate. These will be similar to those used for treating surface water for piped
systems.

40
The discharge of springs may be fairly constant although there may be some gradual seasonal
variations that may require periodic changes in the dosing rate. If the discharge changes rapidly
after rain it may indicate a probable pollution by surface water.
3.9 Chlorine dose
To determine the appropriate amount of chlorine solution (the ‘dose’) needed to disinfect water
from a particular source it is first necessary to find the chlorine demand of the water. This can be
established by following these steps:
i) Divide a sample into say six 100 ml sub-samples and put each in different vessel
ii) Add different measured amounts of 100 ppm chlorine solution (i.e. 100 mg of chlorine
per litre of water) to each vessel. For example one could use incremental steps of 0.5 ml
with this amount being added to the first, 1.0 ml to the second etc. After adding the
chlorine solution each sample should be well stirred.
iii) Leave the sample for the required contact period in a cool place and out of direct
sunlight.
iv) After the contact period has expired, take a sample of water from the first vessel and test
it for the presence of residual chlorine. If there is no residual chlorine then test the water
in the next vessel, and so on, until residual chlorine is first detected. This indicates that in
that particular vessel the chlorine demand has been met. If for example it is first detected
in the vessel to which 2.0 ml of the solution was added but is not found in the previous
vessel (to which 1.5 ml was added) then the chlorine demand is at least 1.5 ppm but less
than 2 ppm (2 mg/litre).

41
The chlorine demand of water sources will not necessarily remain constant. It will almost
certainly vary for surface water sources, depending on the recent pattern of rainfall run-off
contributing to the source.
If the water to be treated contains a high level of suspended solids (i.e. it is turbid) there are two
likely results. Firstly, much of the chlorine dose can be wasted because of chemical reactions with
the suspended solids (particularly organic substances) and secondly micro-organisms in cavities
inside some of the suspended particles may not be fully exposed to the full germicidal effects of the
chlorine. This is why some form of treatment prior to disinfection is always advisable where
unprotected surface water is to be chlorinated. Some micro-organisms that are fairly resistant to
chlorination may be found in unprotected surface water sources so in any case, at least filtration and
possibly other forms of treatment prior to chlorination may need to be provided to remove these.
3.10 Contact Time and CT Value
The product of the concentration of chlorine in mg/l and the contact time in minutes is called the
‘CT value’ or ‘exposure value’.
The CT value is sometimes used to specify the exposure time and amount of chlorine needed to
inactivate a particular micro-organism under specified conditions (such as temperature and pH).
Terminal disinfection must produce a residual concentration of free chlorine of ≥0.5 mg/litre
after at least 30 minutes of contact in water at pH<8.0. The World Health Organisation (1993)
indicates that this recommendation is expected to result in ‘negligible virus risk’ and normally will
ensure that the water has negligible risk of transmitting parasites. Escherichia. coli bacteria, which
are indicators of faecal pollution from humans or animals, are also expected be absent (WHO,
1993) if the water has been properly chlorinated. The number of these organisms present in a 100
ml sample of a source of water is often used to gauge its bacteriological quality.
Effective chlorination is not usually straightforward because there are a large number of
variables that can affect the success of the disinfection. Some of these have already been mentioned.
Others will be discussed in the following section in relation to potential operation and maintenance
problems generally associated with chlorinators.
Two of the important variables that control the effectiveness of chlorination are: i) the
concentration of the chlorine and ii) the time during which the organisms are exposed to it.
Therefore usually both a time of contact with the chlorine and a residual concentration are
specified to ensure effective chlorination.

42
Ensuring effective contact time - The importance of contact time has already been discussed. The
important feature is that there should be ‘plug flow’ through the tank so that there are no areas of
static or near-static water. Hence flow in a long straight pipe or narrow channel is ideal. Square or
circular tanks are not very good shapes for contact tanks unless they are divided up with vertical
walls that ensure that the incoming water can not cross directly from the inlet to the outlet. These
dividing walls should ensure that all of the water slowly follows a longer winding path before it
leaves the tank. A weir or high level outlet should be provided to maintain a fixed volume of water
in the contact tank. Otherwise, at low water levels, the contact period will be insufficient. The high
level of the outlet means that the tank can not be used as a storage reservoir.
A storage tank can be used as a contact tank if the outlet is closed whilst it is being filled with
well mixed chlorinated water. When the tank is full the contents should be left undisturbed for the
contact time, after which water can be withdrawn for supply. If two storage tanks are provided they
can be used alternately.
Sometimes, sufficient contact time can be provided while the water is flowing in the water
supply pipework between the dosing point and the start of the distribution system. This is possible if
the first position at which water can be drawn from the pipe is sufficiently far away from the
chlorinator that the flow time exceeds the required contact time. However, this point may be some
distance from the point of treatment. With such an arrangement it is necessary to take samples from
the first water collection point on the distribution system to monitor the achievement of the required
residual.
A shorter length of large diameter pipe at the start of the distribution system, positioned straight
after the dosing point is an alternative. However, flow at the inlet to this larger diameter pipe must
be effectively distributed across the whole of its cross sectional area.
3.11 Problems with Chlorinators
3.11.1 Problems with precipitation and scaling
The use of calcium hypochlorite and chlorinated lime can lead to problems, particularly with hard
water. The formation of calcium carbonate is possible which can over time block orifices, so these
need to be regularly inspected and cleaned. The formation of deposits can also occur at drip feed
nozzles where the calcium in the solution can also react with carbon dioxide in the atmosphere to
form calcium carbonate. Evaporation can also form deposits.

43
One way of reducing the build-up of deposits at drip feed nozzles is to totally enclose them in a
small transparent chamber (through which the correct operation of the nozzle can be seen). A small
vent hole should be provided at the top of the chamber, and at the bottom of the chamber there
should be a pipe to carry away the dripped liquid. This pipe should terminate below the level of the
water that is being dosed.
When making a chlorine solution from solids or powders such as calcium hypochlorite and
chlorinated lime, sufficient time must be allowed for the non-soluble solids to precipitate. Then the
clear solution should be carefully decanted to be used for dosing. This prevents problems that may
otherwise arise from the solids being carried into the chlorinator. As an additional precaution one
can use a simple filter on the outlet from the tank which stores the dosing solution. This filter can
be made from cotton wool inside a perforated container (Solsona, 1990). Small petrol filters, as
used on automobiles, have also worked well (Solsona, 1981).
As sodium hypochlorite is already a liquid, it is more convenient to dose than calcium
hypochlorite or chlorinated lime. When used undiluted it does not usually cause problems with
dosing equipment. However, when it is diluted with tap water the sodium hypochlorite can react
with hardness salts to form precipitates and scales. Crystallisation of sodium hypochlorite solution
can also occur over a period of time if it comes into contact with air.
3.11.2 Corrosion
Chlorine is corrosive and the atmosphere around chlorinators is often damp so only corrosion
resistant components should be used for chlorinators and associated pipework. Solutions of chlorine
are extremely corrosive. For this reason glass, PVC, fibreglass, polyethylene, and certain other
types of plastic or special rubbers are commonly used for chlorinators and their associated
pipework.
3.12 Availability and stability of chlorine compounds, and risks from additives
Wherever chlorination is being considered, it is important that sufficient amounts of a suitable
source of chlorine be available. In view of the fact that the chlorine content of some compounds
reduces rather quickly, it is best to avoid bulk deliveries that would cover many months of use.
Where large deliveries are to be made, the size of the container should be carefully chosen to make
handling safe and easy. The size chosen should also be such that the number of times that the
container needs to be opened before it is emptied, and this opening and removal of the contents does
not have a major adverse effect on the remaining material. The type of container and the way in
which it is stored has a major effect on chlorine compounds.

44
Sodium hypochlorite at normal solution strength (10-14%) can be unstable, decomposition being
particularly accelerated by heat and exposure to light. Chlorinated lime is also unstable. Exposure to
light and moisture make the chlorine content fall rapidly. Calcium hypochlorite is more stable than
either sodium hypochlorite or chlorinated lime. Powders are usually pure. Tablets are made almost
entirely of calcium hypochlorite but have trace additions of materials to prevent powdering and to
stop moisture being absorbed too readily. However, like the other compounds, they should still be
stored in airtight containers in a cool, dry place.
Tablets that are designed for chlorination of swimming pools may have additives (such as
cyanurate compounds) that make them unsuitable for chlorinating drinking water, particularly in the
long-term (Williams, 1983). In view of the deterioration of these compounds with time it is
important that all stock is used in order of the date of manufacture.
3.13 Handling precautions and transportation
Chlorine gas – Chlorine gas is a strong oxidizer and must be considered during the design and
operation of chlorination facilities at a water treatment plant.
Sodium Hypochlorite – Sodium hypochlorite solution is a corrosive liquid with an approximate
pH of 12. Therefore, typical precautions for handling corrosive materials such as avoiding contact
with metals, including stainless steel, should be used. Sodium hypochlorite solutions may contain
chlorate. Chlorate is formed during the both the manufacturing and storage of sodium hypochlorite
(due to degradation of the product). Chlorate formation can be minimized by reducing the
degradation of sodium hypochlorite (Gilbert et al., 1995) through limiting storage time, avoiding
high temperatures and reducing light exposure.
Spill containment must be provided for the sodium hypochlorite storage tanks. Typical spill
containment structures include containment for the entire contents of the largest tank (plus
freeboard for rainfall or fire sprinklers), no uncontrolled floor drains, and separate containment
areas for each incompatible chemical.
Calcium hypochlorite: Calcium hypochlorite is an oxidant and as such should be stored
separately from organic materials that can be readily oxidized. It should also be stored away from
sources of heat. Improperly stored calcium hypochlorite has caused spontaneous combustion fires
(White, 1992).

45
Since chlorine compounds are corrosive they can burn skin. Hence gloves and sometimes other
waterproof or dustproof clothing and eye protection will be necessary when handling them to avoid
all accidental contact with the skin. Inhalation of concentrated gas or dust from these compounds
should also be avoided. This means that the compounds should wherever possible be handled in a
well-ventilated area. Care should be taken not to raise dust from powdered compounds, and as a
precaution, a dust mask and goggles should be worn by an operative when s/he is handling powders.
In view of the risks that arise from handling it is preferable to choose chlorination systems that
require a minimal amount of handling and diluting procedures. Manufacturers’ instructions should
of course, always be followed.
Transportation of the compounds also needs to be arranged carefully to ensure safety so that the
material is protected from unnecessary deterioration. Low-concentration solutions and powders will
of course mean that larger and heavier volumes need to be transported.
3.14 Accuracy of preparation of solutions for dosing
Care needs to be taken when preparing solutions for dosing and regular testing of the chlorine
content of these solutions should be carried out. Adjustments can then be made to ensure that the
chlorine concentration remains constant. (Variation in the strength of the solution may be
acceptable if the rate at which it is dosed to the water being treated is adjusted to compensate, but it
is easier for operatives to deal with dosing a constant-strength solution.)
If only periodic testing of the solution is possible the timing of the tests should take into account
the following:
• The chlorine content of the compound used is likely to reduce over time. Hence, to obtain the
same strength of solution, increased amounts of the compound need to be added to any fixed
volume of water used for dilution. Alternatively the volume of dilution water will have to be
reduced.
• The volume (or mass) of the compound, and the volume of water it is added to, both need to be
carefully measured each time a solution is prepared. Scales are rarely used to weigh out powders.
Instead the powders are normally measured by volume which is related to a known mass.
• The chlorine demand of the water used to make the solution may need to be checked to see if it
has any major effect on the level of available chlorine, particularly if the quality of this water
changes.

46
• Adjusting dilutions to produce a consistent strength of solution may cause operatives problems
if they are not sufficiently numerate to carry out the necessary calculations. The use of numerical
tables and charts may overcome this problem. To make adjustments the operative also needs to have
appropriate equipment to accurately measure out a varying quantity of the compound, or a varying
volume of dilution water.
3.15 Calculations
Assuming that the concentration of chlorine in a compound as a percentage (C1%) by mass is
reliably known, then the necessary mass (M1 grams) of it that should be added to a known volume
of water (V2 litres) to produce a desired concentration of solution (C2%) can be readily calculated
from the equation:
For example to determine the mass of bleaching powder, with the strength of 20% chlorine by
mass (C1 = 20) that needs to be added to 50 litres of water (V2 = 50) to produce a 0.5% solution (C2
= 0.5), the equation is:
So 1250 grams of the powder has to be added to the 50 litres of dilution water to produce a 0.5%
solution
The volume (V2 litres) of a solution of known strength (C2%) which needs to be added to each
litre of water to be treated, to give a required dose (C3%) can be calculated from the equation:
So if a dose of 5 mg/l (C3 = 0.0005%)) is required, and the 0.5% solution (C2 =0.5) is being
dosed, the required volume (V2) per litre will be given by:
V2 = 0.0005/0.5 = 0.001 litre (= 1 ml) of 0.5% solution needs to be added to each litre of water
to be treated to apply a dose of 5 mg/l.
3.16 Measurement of Treated Water Flow Rates
The amount of solution that needs to be dosed will depend on the quantity of water to be treated.
Chlorinators that dose in proportion to the flowrate need to be used if the flowrate is variable.
M1 = (C2 × (1000 x V2)/C1 = (1000 x V2 × C2/C1)
M1 = (1000 × 50 x 0.5/20) = 1250 g
Note that a 0.5% solution contains 5 g of chlorine per litre of water = 5000 mg/l
V2 = C3/C2

47
• If the water to be treated is stationary as in the batch treatment system (i.e. when the contents
of a whole tank of water are treated) the volume of water to be treated can be found by calculating
the amount of water in the tank.
• Where the water is flowing it will be necessary to know its flowrate. This could be based on a
water meter reading but the meter will need to be well maintained to ensure accuracy.
• One method of calculating the flowrate in a pumped system is to observe the rate at which a
tank fills or empties because of the flow of water. The flowrate in m3/h can then be calculated from
multiplying the rate of fall or rise in the water level (in m/h) and the plan area of the tank (in m2).
• Where flow is exposed to the atmosphere sharp-edged triangular or rectangular notches can
also be used. The depth of flow through such notches can be used to calculate the flow using
formulae, graphs or numerical tables.
3.17 Mixing of the dose with the water to be treated
For chlorination to be successful, all of the water to be treated must come into contact with the
disinfectant for at least the required contact time. It is therefore important that at the start of the
contact period the dose is already fully mixed with the raw water.
With constantly flowing water the dose can be added at a constant rate directly into the water
flowing in a pipe or channel, or just as it enters the contact tank. It will then be well mixed
throughout the water.
Where the dose is being added to a large volume of relatively stationary water it is more
difficult. In such a case, the dose should be added at a number of different points, and then the
contents of the tank or well should be agitated to ensure full mixing of the dose. In an open well,
raising and lowering a bucket through the whole depth of the water many times is a good way to
agitate the water.
3.18 Testing for chlorine concentration
The first objective of effective chlorination is to ensure that an acceptable chlorine residual
(usually a free chlorine residual) exists after the contact time. The physical arrangement of the
system should be designed to prevent water being consumed before this period has elapsed.

48
A second objective is often that the chlorine residual is sufficient to protect the water from any
minor sources of contamination it may encounter as it flows through the distribution system. It
should also prevent the growth of nuisance bacteria and other organisms in the pipework.
Monitoring the achievement of this second objective means that in addition to any testing directly
after the contact tank, the water needs to be periodically tested at other points in the distribution
system, particularly those that are far from the point at which the chlorinated water enters the
system.
It is important that testing for residual chlorine in drinking water is carried out with sufficient
frequency to ensure that chlorination is being successfully accomplished.
For measuring high strength concentrations, such as sodium hypochlorite, it may be necessary to
first carefully dilute the sample with demineralised water. This complicates the testing procedure
and can be a source of error unless the operatives of small-scale systems are well trained.
The standard methods of field-testing for chlorine concentrations are based on the following
principle:
The most convenient method for measuring ‘residual chlorine’ is the colorimetric method that
uses DPD (diethyl paraphenylene diamine) tablets that are dissolved in a measured sample of the
water. The extent of the red colour change resulting in the sample is judged visually in comparison
to a scale of standard colours that relate to specific concentrations. It is important that the test is
completed as rapidly as possible (less than 20 seconds after dissolving the tablets) to prevent the
reagent acting on the combined chlorine. Small, cheap, simple ‘comparators’ accurate to within
about 0.1 ppm are available. Different tablets are available either to measure the ‘free residual
chlorine’ or the ‘combined residual chlorine’.
The following chapter highlights the soft issues that need to be considered in order to ensure that
disinfection systems used at small treatment plants are sustainable.

49
CHAPTER 4
MANAGEMENT GUIDELINES FOR EFFECTIVE IMPLEMENTATION OF DISINFECTION IN SMALL WATER
TREATMENT PLANTS
The capacity of any water treatment plant to provide acceptable drinking water quality depends
on the performance of each functional unit in the plant including coagulation-flocculation,
sedimentation, filtration and disinfection. Management and administration of water treatment plants
play an important role in determining the quality of the final water. The major hurdles to providing
safe and clean drinking water in rural areas are: i) poor definition of the roles and responsibilities of
key players in the municipality, ii) lack of training and inability to retain skilled staff to run water
treatment plants, iii) poor financial management, iv) inexperienced managers, v) lack of
maintenance of infrastructures, vi) loss of institutional and intellectual knowledge and vii) poor
working conditions. This chapter therefore outlines practical steps that can be implemented by
management to improve and sustain water quality in rural and peri-urban areas.
4.1 Roles and Responsibilities
There are a number of institutions and role players involved in the management of water works
in South Africa. Table 4.1 lists the various role players and their primary functions. The role
players include staff working directly on the water works such as Operators, Senior Operators, and
Works Managers. Their role is one of water service provision. Other institutions involved in water
supply include Water Service Authorities (WSA) such as local and district municipalities, the
Department of Water Affairs and Forestry (DWAF) and the Department of Health (DoH). There are
also non governmental organisations that represent the interest of the community. It is imperative
that the various role players understand their roles and responsibilities in order to minimise the
possibility of overlooking certain functions to the detriment of the consumer. There is also the
possibility of duplication of activities/functions which can make the system dysfunctional.

50
TABLE 4.1
ROLES & RESPONSIBILITIES
Role Player Responsibility
Operator Primarily responsible for day to day operation of the plant,
ensuring that all processes are optimised
Senior Operator Responsible for process control & implementing major changes
to process
Works
Manager/Superintendent
Overall responsible for safety and operation of plant
Water Service Provider A Water Services Provider is any institution that has a contract
with a WSA to sell water to that authority. A WSP can also be any
institution which has a contract with a WSA to assume operational
responsibility for providing water services to one or more consumers
(end users) within a specific geographic area.
Water Service Authority
(WSA)
Responsible for planning, ensuring access to, and regulating
provision of water services to all constituents within their area of
jurisdiction.
Department of Water Affairs
and Forestry (DWAF)
Responsible for the formulation and implementation of policy
and regulations governing the water sector. To provide support and
strengthen the capacity of local government, and to regulate local
government to ensure effective performance of its duties. As sector
leader, DWAF has ultimate responsibility for water services
provided by local government and manages information to be used
for support, monitoring, regulation and planning.
Department of Health (DoH) The Department of Health (DoH) is responsible for health
strategy, policies and practices as well as the development and
drafting of legislation and associated regulations. District
municipalities have the primary responsibility for health and hygiene
education related to water and sanitation services. National and
provincial departments will assist in the training of staff to do this
work, and in the training and support of community-based hygiene
educators and health promoters on water and sanitation projects.

51
4.2 Training and Development
Ongoing training and development is a prerequisite for the sustainability of small treatment
systems. Local operators become highly marketable when they have been trained in the operation of
treatment plants and tend to migrate towards the larger towns where they can earn better salaries. .
It is thus necessary to have a continuous operator-training programme that provides technical and
operational skills in the sector. It is highly recommended that municipalities gear themselves to
provide internship programmes for graduates from universities of technology. This is a win-win
situation as it provides the trainee with practical experience while the employer has a continuous
feed of new blood into the organization.
Examples of relevant areas to address include general water quality, and specific training to
optimise system performance such as: coagulant control testing; proper filter operation; disinfection
system operation; reticulation management; sampling, monitoring and analysis; interpretation and
recording of results, and maintenance of equipment.
There are limited numbers of locally based staff trained in the operation of water treatment
plants. It can take anything from 18 months to two years to get a local resident trained to the level
required. It is thus best to identify suitable staff during the planning stage of the project and employ
them during the construction stage. This ensures that they receive ongoing training during the life
cycle of the project whilst gaining an excellent understanding of the integration of the various unit
processes.
Identify local people during the planning stage of the project, employ them during the
construction stage and train them to operate the plant.
Municipalities must ensure that they are registered as institutions that can provide
training and learner-ships for students in civil and chemical engineering as well as
analytical chemistry and microbiology.

52
4.3 Operator Salaries & Motivation
One of the key findings has been the low salaries paid to operators. It is strongly recommended
that a minimum salary of R5 000 be paid to the lowest level of operator. The overall package and
incentives that are offered to operators and managers working in small water treatment plants in
rural areas needs to be urgently reviewed by the local and district municipalities.
This will improve their motivation and pride in the job they are doing. Coupled with this is the
urgent need to implement legislation on the health, hygiene and safety standards at water treatment
plants. This must include general landscaping and industrial safety measures such as hand rails. It
should also be noted that a chlorine gas installation is regarded as a Major Hazard Installation and is
governed by the MHI Act which has very stringent regulations on the safety and management of
such facilities.
4.4 Community Involvement and Awareness
Community consultation, involvement and awareness can have a major impact on public
confidence in the water supply and the organisation’s reputation. A communication programme
including both consultation and education should be designed to provide active, two-way exchange
of information to ensure that the consumers’ needs and expectations are understood and are being
satisfied.
4.5 Maintenance
Maintenance is one of the most important elements and if this is neglected, the situation is
bound to fail. Detailed assessments of maintenance should be undertaken where the following
information is recorded as part of normal operation.
Management must urgently review remuneration packages and incentives for
operators and technical supervisors working in small treatment plants
Quality of Installed facilities Water Consumption
Acceptable number of breakdowns Quality of spare parts and repairs
Level of preventative maintenance Cost of maintenance

53
4.6 Independent Water Quality and Process Audits
As part of the routine operation of small treatment systems, an independent water quality audit
needs to be undertaken to ensure that the water complies with the guidelines or standards that have
been agreed to by the consumers and the water service authority. Independent process audits need to
be undertaken to ensure that the treatment process is optimized and to assist with any major
technical problems that have been identified. The frequency of these audits depends on the number
of consumers being served and the volume of water supplied.
The audit will identify potential problems with the water works equipment, operating procedures
and maintenance that would impact on disinfection.
A summary of the areas covered as well as the information that needs to be gathered is discussed
in the following paragraphs.
Individual unit process
Condition of mechanical equipment
Competence of operators
Design capacity
Piping
Controls and instrumentation
Turbidity results across unit processes
Chemicals used and dosages
Capacity of chlorinators
Estimation of the contact time, CT
Housekeeping and cleanliness
Metering
Reliability
Record keeping
Evaluation of the condition of intake including sitting and physical condition
Documentation of size of pumps and their condition
Condition and functionality of intake pump house
Evaluation of the condition of well head if supplied from a borehole
Undertake regular independent Process Audits and
Evaluations of the Water Treatment Plants

54
Inspection of maintenance records that apply to raw water intake system.
Water treatment and disinfection system
Storage reservoirs
Distribution system water quality
Measurement of disinfectant concentrations at terminal points
CONCLUSION
There are a number of different types of disinfection processes that are currently practiced in
South Africa, including chlorination, UV, chlorine dioxide, bromination and ozone. The research
and surveys undertaken have indicated that disinfection with chlorine is still one of the most
effective and practical forms of disinfection for small treatment plants. This guideline will assist
water works managers and municipal mangers in selecting the correct type of disinfection system
and will highlight the need to increase the practice of disinfection in many areas where it is
currently neglected and poorly managed. This should contribute to a reduction in water-borne
diseases and lead to an overall improvement in the health of the communities that are serviced with
water from small treatment plants.

55
References
AMERICA WATER WORKS ASSOCIATION (AWWA) (2001) Water Treatment Operator
Handbook. American Water Works Association #20481, 800-926-7337
MACKINTOSH, G A and COLVIN, C (2002). Failure of rural schemes in South Africa to provide
potable water. Environmental Geology, Vol 44(1), pp 101-105
MOMBA MNB, Z TYAFA and N MAKALA (2004)a Rural water treatment plants fall to provide
potable water to their consumers: the Alice water treatment plant in the Eastern Cape
Province of South Africa. S.A J. Sc. 100: 307-310.
MOMBA MNB, MAKALA N, B BROUKAERT,TYAFA Z, THOMPSON P and AC BUCKLEY
(2004)b Improving the efficiency and sustainability of disinfection at a small rural water
treatment plant. Water SA. 30 (5): 617-622.
MOMBA MNB AND BROUCKAERT MB (2005) Guidelines for ensuring sustainable effective
disinfection in small water supply systems. TT 249/05 WRC. ISBN No 1-77005-321-2.
RSA
OBI CL, MOMBA MNB, SAMIE A, IGUMBOR JO, GREEN E and MUSIE E (2007)
Microbiological, physico-chemical and management parameters impinging on the efficiency
of small water treatment plants in the Limpopo and Mpumalanga Provinces of South Africa.
Water SA 33(2): 1-9.
SANS 241 (2005) South African National Standard-Drinking Water, 6 edn. Standards South Africa.
ISBN 0-626-17752-9.
SCHULZ, C.R. and OKUN, D.A.(1984). Surface Water Treatment for Communities in Developing
Countries, New York, John Wiley & Sons.
SCHOEMAN, J.J. and STEYN A (2002) Treatment of high nitrate concentration in ground water
with reverse osmosis in rural areas in South Africa. Water Institute of South Africa Biennial
Conference, Durban.
SKINNER BH(2001). Chlorinating Small Water Supplies – A review of gravity powered and water
powered chlorinators.
SWARTZ C. D. (2000) Guidelines for the upgrading of existing small water treatment plants. WRC
Report No. 730/1/00
TEN STATE STANDARDS (2004) Recommended Standards for Wastewater Facilities, Great
Lakes Upper Mississippi River Board of State and Provincial Public Health and
Environmental Managers.

56
WALLACE AND TIERNAN, (1995). Chlorination Options Brochure
WILLIAMS K.M. and MAKUCH (1989) Educating the rural about safe drinking water. Water
Resources Bulletin
WILLIAMS P.G. (1983) Chlorination of small scale water supplies, Water Sewerage and Effluent
No 199, pp 19-23.
WHITE GC (1992) The handbook of chlorination and Alternative Disinfectants (3rd edn). Van
Nostrand Reinhold, New York
WHITE G.C. (1999). Handbook of Chlorination and Alternative Disinfectants (4th edition), John
Wiley & Sons.
WHO (1993) Drinking Water Quality Guidelines, Volume 3, World Health Organisation, WHO
Geneva,

57
APP
END
ICES
A
PPE
ND
IX 1
SAN
AS
AC
CR
ED
ITE
D L
AB
OR
AT
OR
IES
Nam
e T
el. n
o.
Fax
no.
Em
ail a
ddre
ss
Post
al a
ddre
ss
AL
A
bbot
t an
d
Ass
ocia
tes (
Pty)
Ltd
021
448
6340
02
1 44
8 63
42
alab
bott
@ia
fric
a.co
m
P.O
. Box
483
, Woo
dsto
ck,
Cap
e T
own,
791
5
Ang
lo
Res
earc
h -
Env
iron
men
tal
Sect
ion
011
377
4659
01
1 37
7 48
72
nsch
utte
@an
glor
esea
rch.
com
;
rmen
toor
@an
glor
esea
rch.
com
P.O
. Box
106
, Cro
wn
Min
es, 2
025
Bem
lab
(Pty
) Ltd
02
1 85
1 64
01
021
851
4379
ak
otze
@be
mla
b.co
.za
P.
O. B
ox 1
2457
, D
ie B
oord
,
Stel
lenb
osch
, 761
3
Bio
Cro
p
Lab
orat
orie
s
012
305
6004
01
2 30
5 60
03
lizet
tec@
necs
a.co
.za
P.
O. B
ox 5
82, P
reto
ria,
000
1
Bio
-Sci
ence
Tec
hnol
ogie
s
031
206
1303
1 or
2051
216
90
0880
31-
2060
518
Vas
@m
web
.co.
za
Bio
scie
nce@
Lab
orat
orie
s.co.
za
P.O
. Box
461
8, D
urba
n, 4
000
Che
m-S
cien
ce
Lab
orat
orie
s
031
206
1390
or
031
205
1216
0880
31-
2060
518
vas@
mw
eb.c
o.za
or
chem
scie
nce@
labo
rato
ries
.co.
za
P.O
. Box
461
8, D
urba
n, 4
000
Clo
ver
Lab
orat
ory
Serv
ices
058
853
3406
05
8 85
3 33
09
hille
t.roo
s@cl
over
.co.
za
P.O
. Box
750
, Hei
lbro
n, 9
650
Col
umbu
s
Lab
orat
ory
013
247
2065
01
3 24
7 27
01
mul
ler.
shar
on@
colu
mbu
s.co.
za
P.O
. Box
133
, Mid
delb
urg,
105
0
Con
sulti
ng
Mic
robi
olog
ical
Lab
orat
ory
011
425
3775
01
1 42
5 25
21
trac
ey@
cmla
bs.c
o.za
or
info
@cm
labs
.co.
za
P.O
. Box
613
2, D
unsw
art,
1508
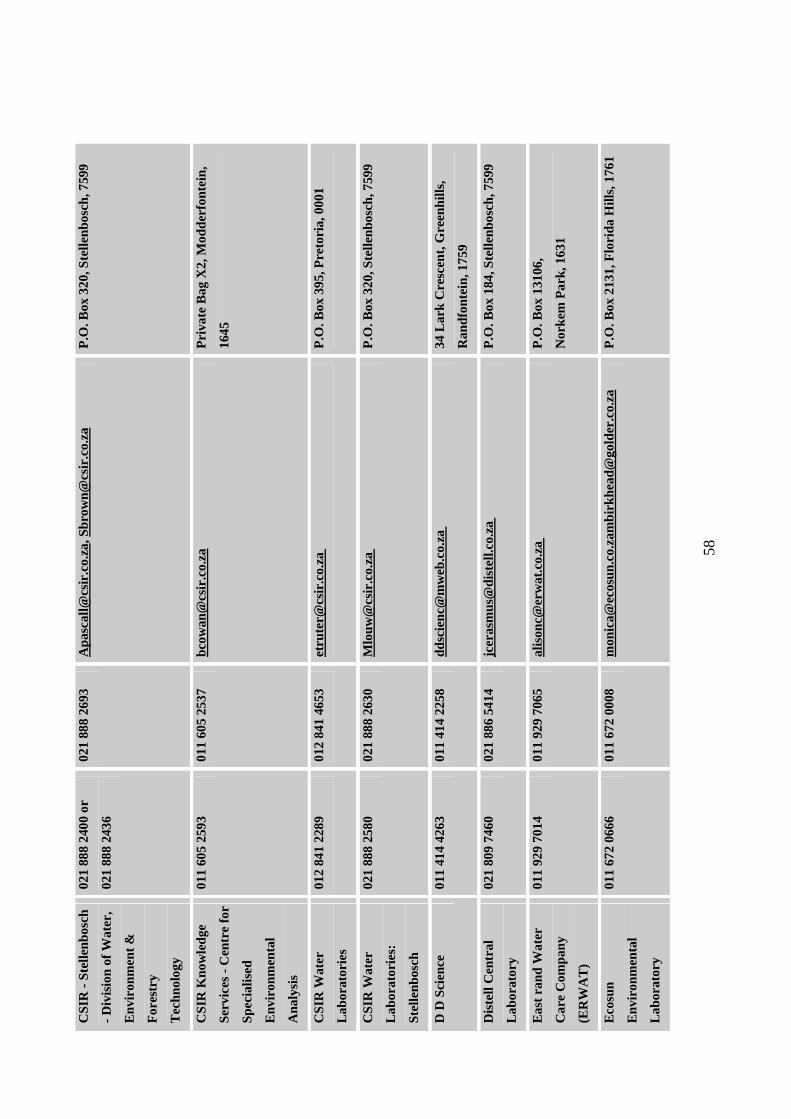
58
CSI
R -
Stel
lenb
osch
- Div
isio
n of
Wat
er,
Env
iron
men
t &
Fore
stry
Tec
hnol
ogy
021
888
2400
or
021
888
2436
021
888
2693
A
pasc
all@
csir
.co.
za, S
brow
n@cs
ir.c
o.za
P.
O. B
ox 3
20, S
telle
nbos
ch, 7
599
CSI
R K
now
ledg
e
Serv
ices
- C
entr
e fo
r
Spec
ialis
ed
Env
iron
men
tal
Ana
lysi
s
011
605
2593
01
1 60
5 25
37
bcow
an@
csir
.co.
za
Priv
ate
Bag
X2,
Mod
derf
onte
in,
1645
CSI
R W
ater
Lab
orat
orie
s
012
841
2289
01
2 84
1 46
53
etru
ter@
csir
.co.
za
P.O
. Box
395
, Pre
tori
a, 0
001
CSI
R W
ater
Lab
orat
orie
s:
Stel
lenb
osch
021
888
2580
02
1 88
8 26
30
Mlo
uw@
csir
.co.
za
P.O
. Box
320
, Ste
llenb
osch
, 759
9
D D
Sci
ence
01
1 41
4 42
63
011
414
2258
dd
scie
nc@
mw
eb.c
o.za
34
Lar
k C
resc
ent,
Gre
enhi
lls,
Ran
dfon
tein
, 175
9
Dis
tell
Cen
tral
Lab
orat
ory
021
809
7460
02
1 88
6 54
14
jcer
asm
us@
dist
ell.c
o.za
P.
O. B
ox 1
84, S
telle
nbos
ch, 7
599
Eas
t ran
d W
ater
Car
e C
ompa
ny
(ER
WA
T)
011
929
7014
01
1 92
9 70
65
alis
onc@
erw
at.c
o.za
P.
O. B
ox 1
3106
,
Nor
kem
Par
k, 1
631
Eco
sun
Env
iron
men
tal
Lab
orat
ory
011
672
0666
01
1 67
2 00
08
mon
ica@
ecos
un.c
o.za
mbi
rkhe
ad@
gold
er.c
o.za
P.
O. B
ox 2
131,
Flo
rida
Hill
s, 17
61

59
Env
iron
men
tal
Ana
lytic
al S
ervs
,
(DB
N) D
iv o
f Wat
er
Env
& F
ores
try
Tec
h, C
SIR
031
242
2348
03
1 26
1 25
09
bkun
ene@
csir
.co.
za
P.O
. Box
170
01, C
onge
lla,
Dur
ban,
401
3
ESK
OM
Ent
erpr
ises
,
Tec
hnol
ogy
Serv
ices
Inte
rnat
iona
l
011
629
5728
01
1 62
9 55
28
jenn
y.re
eves
@es
kom
.co.
za
Priv
ate
Bag
401
75,
Cle
vela
nd,
2022
Food
Con
sulti
ng
Serv
ices
011
315
5007
/8
011
315
5029
el
ri@
fcs-
labs
.co.
za
P.O
. Box
146
1, H
alfw
ay H
ouse
,
1685
Gun
do L
ab S
ervi
ces
011
406
2374
01
1 40
6 23
74
gund
olab
@ya
hoo.
com
P.
O. B
ox 1
5895
, Doo
rnfo
ntei
n,
2028
Hea
rsha
w a
nd
Kin
nes A
naly
tical
Lab
orat
ory
021
650
3533
02
1 65
0 28
60
phir
sch@
scie
nce.
uct.a
c.za
P.
O. B
ox 3
4143
, R
hode
s Gift
,
7707
Hig
hvel
d
Env
iron
men
tal
Con
trol
Ser
vice
s cc
017
647
3296
01
7 64
7 32
96
hecs
cc@
mw
eb.c
o.za
P.
O. B
ox 2
174,
Bet
hal,
2310
Inno
Ven
ton
Ana
lytic
al
041
504
3497
04
1 50
4 94
97
ceci
saun
@nm
mu.
ac.z
a
P.O
. Box
770
00, N
MM
U,
Port
Eliz
abet
h, 6
000
Insp
ecto
rate
M &
L
011
496
2228
01
1 49
6 22
39
Alb
an.B
oyle
@in
spm
l.co.
za
P.O
. Box
821
24, S
outh
dale
, 213
5
Insp
ecto
rate
M &
L
(Pty
) Ltd
013
246
2347
01
3 24
6 17
06
ike.
ram
othi
be@
insp
ml.c
o.za
,
aman
da.o
livie
r@in
spm
l.co.
za
P.O
. Box
112
61, M
idde
lbur
g, 1
050

60
Inte
rfru
it
Mic
robi
olog
y
Lab
orat
ory
011
918
3951
01
1 89
4 11
63
yola
ndie
@in
terf
ruit.
co.z
a
P.O
. Box
263
31, E
ast R
and,
146
2
J M
ulle
r
Lab
orat
orie
s
021
511
8301
02
1 51
0 38
00
jmla
bs@
iafr
ica.
co.z
a, jm
labs
@ia
fric
a.co
m
P.O
. Box
511
, Paa
rden
Eila
nd,
7420
Joha
nnes
burg
Wat
er (P
ty) L
td-
CY
DN
A, N
orth
ern
Wor
ks &
Gou
dkop
pies
Lab
orat
ory
011
728
7373
01
1 72
8 54
44
tngo
dela
@jw
ater
.co.
za, r
rim
mer
@jw
ater
.co.
za
P.O
. Box
615
42,
Mar
shal
ltow
n, 2
107
Kum
ba R
esou
rces
Sish
en Ir
on O
re
Min
e
053
739
2203
or
053
739
2303
053
739
2233
ko
bus.m
oll@
kum
bare
sour
ces.c
om
Priv
ate
Bag
X50
6, K
athu
, 844
6
Lab
orat
ory
and
Bio
logi
cal S
ervi
ces
cc
011
867
2059
or
011
867
0593
011
867
3281
la
bser
ve@
mw
eb.c
o.za
P.
O. B
ox 1
4540
6,
Bra
cken
gard
ens,
1452
Mhl
athu
ze W
ater
03
5 90
2 10
45
035
902
1107
bb
eetg
e@m
hlat
huze
.co.
za
P.O
. Box
126
4, R
icha
rds B
ay, 3
900
Mic
ron
Lab
orat
orie
s
021
440
7800
/782
8
021
448
4197
ki
ms@
ij.co
.za
or a
diel
f@m
icro
nlab
s.co.
za
P.O
. Box
480
4, C
ape
Tow
n, 8
000
Mid
vaal
Wat
er
Com
pany
018
482
1241
01
8 48
2 11
10
Mid
vaal
@m
web
.co.
za
P.O
. Box
31,
Stil
font
ein,
255
0
Min
tek
Ana
lytic
al
Serv
ices
011
709
4053
/404
6 01
1 79
2-66
50
nqob
ileg@
min
tek.
co.z
a Pr
ivat
e B
ag 3
015,
Ran
dbur
g, 2
125

61
Mpu
mal
anga
Ana
lytic
al S
ervi
ces
CC
017
799
3144
01
7 79
9 34
62
sem
aja@
ripp
leso
ft.c
o.za
P.
O. B
ox 1
55, V
olks
rust
, 247
0
Nam
akw
a Sa
nds
MSP
Lab
orat
ory
022
701
3079
02
2 70
1 30
77
jpet
erse
n@na
mak
wa.
co.z
a P.
O. B
ox 2
23, L
utzv
ille,
816
5
Nam
akw
a Sa
nds
Smel
ter
Lab
orat
ory
022
701
3911
02
2 70
1 30
75
esch
oltz
@na
mak
wa.
co.z
a
P.O
. Box
435
, Vre
denb
urg,
738
0
Nat
ref L
abor
ator
y
016
940
2167
01
6 94
0 20
45
anita
.mcc
linto
ck@
natr
ef.c
om
P.O
. Box
234
, Sas
olbu
rg, 1
947
NE
CSA
Pel
inda
ba
Ana
lytic
al
Lab
orat
orie
s
012
305
453
5 01
2 30
5 47
25
mbr
itton
@ne
csa.
co.z
a
P.O
. Box
582
, Pre
tori
a, 0
001
Ran
d W
ater
01
6 42
1515
0 01
6 45
5 20
55
mm
them
b@ra
ndw
ater
.co.
za
P.O
. Box
352
6, V
eree
nigi
ng, 1
930
Reg
en W
ater
s cc
01
3 69
0 14
87
013
656
5050
re
genl
ab@
mw
eb.c
o.za
P.
O. B
ox 8
328,
Witb
ank,
103
5
Res
ourc
e Q
ualit
y
Serv
ices
(Pre
viou
sly
IWQ
S)
012
808
9621
01
2 80
8 03
38
Port
wig
E@
dwaf
.gov
.za
Pr
ivat
e B
ag X
313,
Pre
tori
a, 0
001
Rho
des F
ood
Gro
up
021
870
4194
02
1 87
4 13
70
thom
asl@
rfff
oods
.com
Pr
ivat
e B
ag X
3040
, Paa
rl, 7
680
SAB
S C
omm
erci
al
(Pty
) Ltd
Wat
er
Lab
orat
ory
Wes
tern
Cap
e
08
6 61
8 09
03
sant
erj@
sabs
.co.
za
P.O
. Box
615
, Ron
debo
sch,
770
1
SAB
S C
omm
erci
al
(Pty
) Ltd
- Fo
od
Che
mis
try
012
428
6884
01
2 42
8 60
19
fouc
hecm
@sa
bs.c
o.za
Pr
ivat
e B
ag X
191,
Pre
tori
a, 0
001

62
SAPR
EF
Lab
orat
ory
031
480
1727
03
1 46
8 11
48
Gly
nis.S
haik
@sa
pref
.com
,
Dan
iel.M
abas
o@sa
pref
.com
P.O
. Box
317
9, D
urba
n, 4
000
Sedi
ba L
abor
ator
y
032
944
802
0/68
21
032
944
769
5
bish
s@m
illen
nium
was
te.c
o.za
P.
O. B
ox 1
852,
Ton
gaat
, 440
0
Sedi
beng
Wat
er -
Qua
lity
Con
trol
Lab
orat
ory
056
515
0318
05
6 51
5 03
81
lsau
nder
son@
sedi
beng
.co.
za
P.O
. Box
500
, Bot
havi
lle, 9
660
Set P
oint
Lab
orat
orie
s
011
923
7020
01
1 92
3 70
29
cor@
seth
old.
com
P.
O. B
ox 8
56, I
sand
o, 1
600
SGS
Em
oyen
i
Qua
lites
t
031
466
2713
03
1 46
6 27
27
Raj
en_p
erum
al@
sgs.c
om
P.O
. Box
218
31, B
luff
, 403
6
Swift
Mic
ro
Lab
orat
orie
s (Pt
y)
Ltd
021
689
9344
/5
021
689
6363
Ia
n@SW
IFT
.co.
za
15 L
ower
Hop
e St
reet
, Ros
eban
k,
Cap
e T
own,
770
0
Swift
Mic
robi
olog
y
Lab
orat
ory
011
805
4310
01
1 80
5 79
30
info
@sw
ift.c
o.za
Po
stne
t #64
, Pri
vate
Bag
X12
1,
Hal
fway
Hou
se, 1
685
Tal
bot L
abor
ator
ies
033
346
1444
03
3 34
6 14
45
vane
ssa@
talb
ot.c
o.za
P.
O. B
ox 3
391,
Pie
term
aritz
burg
,
3200
UIS
Ana
lytic
al
Serv
ices
(Pty
) Ltd
012
665
4291
01
2 66
5 42
94
will
ieh@
uis-
as.c
o.za
P.
O. B
ox 8
286,
Cen
turi
on, 0
046
Um
geni
Wat
er -
Am
anzi
033
341
1067
03
3 34
1 15
01
Man
nie.
Sew
char
ran@
umge
ni.c
o.za
P.
O. B
ox 9
, Pie
term
aritz
burg
,
3200
Woo
lwor
ths F
ood
Lab
orat
ory
021
407
9111
/344
8 02
1 40
7 39
39
raym
ondh
artle
y@w
oolw
orth
s.co.
za
Woo
lwor
ths H
ouse
, P.O
. Box
680
,
Cap
e T
own,
800
0
Xst
rata
Coa
l SA
Gro
up L
abor
ator
y
013
690
5093
01
3 69
0 50
92
dirk
ie.p
rins
loo@
duik
er.c
o.za
Pr
ivat
e B
ag X
7265
, Witb
ank,
103
5

63
APP
END
IX 2
EXA
MPL
E O
F A
PR
OC
ESS
CO
NTR
OL
SHIF
T LO
G S
HEE
T D
ate
Plan
t Nam
e:
Ope
rato
r N
ame:
Ti
me
Raw
w
ater
Tu
rbid
ity
Raw
wat
er
pH
Coa
gula
nt
Dos
e C
lari
fier
turb
idity
C
hlor
ine
dose
F
inal
wat
er
chlo
rine
Li
me
dose
F
inal
wat
er p
H
06:0
0
08
:00
10:0
0
12:0
0
14:0
0
16:0
0
18:0
0
20:0
0
22:0
0
00:0
0
02:0
0
04:0
0