guidelines for nonlinear finite element analysis 1016-1(2017) version 2...guidelines for nonlinear...
TRANSCRIPT

Rijkswaterstaat Technical Document (RTD)
Guidelines for Nonlinear Finite Element Analysis of Concrete Structures
Doc.nr.: RTD 1016-1:2017
Version: 2.1 Status: Final Date: 15 June 2017
Water. Wegen. Werken. Rijkswaterstaat
0
10
20
30
40
50
60
70
80
90
100
Prd/P
exp
[%]

Rijkswaterstaat Centre for Infrastructure
Page: 2 of 69 Guidelines for Issued: 15 June 2017 Nonlinear Finite Element Analysis of Version: 2.1 Concrete Structures Status: Final RTD: 1016-1:2017
Please refer to this report as: M.A.N. Hendriks, A. de Boer, B. Belletti, “Guidelines for Nonlinear Finite Element Analysis of Concrete Structures”, Rijkswaterstaat Centre for Infrastructure, Report RTD:1016-1:2017, 2017. This document is one from a series of documents. At the time of writing, the following documents have been drafted: RTD 1016-1: Guidelines for Nonlinear Finite Element Analysis of Concrete Structures RTD 1016-2: Validation of the Guidelines for Nonlinear Finite Element Analysis of
Concrete Structures - Part: Overview of results RTD 1016-3A: Validation of the Guidelines for Nonlinear Finite Element Analysis of
Concrete Structures - Part: Reinforced beams RTD 1016-3B: Validation of the Guidelines for Nonlinear Finite Element Analysis of
Concrete Structures - Part: Prestressed beams RTD 1016-3C: Validation of the Guidelines for Nonlinear Finite Element Analysis of
Concrete Structures - Part: Slabs

Rijkswaterstaat Centre for Infrastructure
Guidelines for Page: 3 of 69 Nonlinear Finite Element Analysis of Issued: 15 June 2017 Concrete Structures Version: 2.1 RTD: 1016-1:2017 Status: Final
PREFACE
The Dutch Ministry of Infrastructure and the Environment is concerned with the safety of existing infrastructure and expected re-analysis of a large number of bridges and viaducts. Nonlinear finite element analysis can provide a tool to assess safety using realistic descriptions of the material behavior based on actual material properties. In this way, a realistic estimation of the existing safety can be obtained utilizing “hidden” capacities (de Boer et al., 2015). Nonlinear finite element analyses have intrinsic model and user factors that influence the results of the analysis. This document provides guidelines to reduce these factors and to improve the robustness of nonlinear finite element analyses. The guidelines are developed based on scientific research, general consensus among peers, and a long-term experience with nonlinear analysis of concrete structures by the contributors. This version of the guidelines can be used for the finite element analysis of basic concrete structural elements like beams, girders and slabs, reinforced or prestressed. The guidelines can also be applied to structures, like box-girder structures, culverts and bridge decks with prestressed girders in composite structures. The guidelines are restricted to be used for existing structures. The guidelines have been developed with a two-fold purpose. First, to advice analysts on nonlinear finite element analysis of reinforced and pre-stressed concrete structures. Second, to explain the choices made and to educate analysts, because ultimately the analysts stays responsible for the analysis and the results. An informed user is better capable to make educated guesses; something that everybody performing nonlinear finite element analyses is well aware of.
Max Hendriks, Ane de Boer, Beatrice Belletti June 2017

Rijkswaterstaat Centre for Infrastructure
Page: 4 of 69 Guidelines for Issued: 15 June 2017 Nonlinear Finite Element Analysis of Version: 2.1 Concrete Structures Status: Final RTD: 1016-1:2017
CONTRIBUTORS This is version 2.1 of the guidelines. The authors of this revision are: Prof.dr.ir. M.A.N. Hendriks, Delft University of Technology, Netherlands, and Norwegian
University of Science and Technology, Norway Dr.ir. A. de Boer, Ministry of Infrastructure and the Environment, Netherlands Assoc. prof.dr. B. Belletti, University of Parma, Italy and formerly Delft University of
Technology, Netherlands
Apart from the names listed above, the main contributors of version 1.0 were: Ir. J.A. den Uijl, formerly Delft University of Technology, Netherlands Dr.ir. P.H. Feenstra, formerly Delft University of Technology, Netherlands, and presently
Exponent, United States Dr. C. Damoni, formerly Delft University of Technology, Netherlands and University of Parma,
Italy Information: [email protected]

Rijkswaterstaat Centre for Infrastructure
Guidelines for Page: 5 of 69 Nonlinear Finite Element Analysis of Issued: 15 June 2017 Concrete Structures Version: 2.1 RTD: 1016-1:2017 Status: Final
CONTENTS
1 INTRODUCTION ................................................................................................. 7 1.1 Format ............................................................................................................. 7
1.2 Applicability .................................................................................................... 7 1.3 Deviations ........................................................................................................ 8 1.4 Case studies ..................................................................................................... 8 1.5 Disclaimer ....................................................................................................... 8
2 MODELING .......................................................................................................... 9
2.1 General ............................................................................................................ 9 2.2 Units ................................................................................................................ 9
2.3 Material Properties ........................................................................................ 10 2.3.1 Concrete ............................................................................................... 10 2.3.2 Reinforcement ...................................................................................... 13
2.4 Constitutive Models ...................................................................................... 15
2.4.1 Model for Concrete .............................................................................. 15 2.4.2 Model for Reinforcement ..................................................................... 29 2.4.3 Model for Concrete-Reinforcement Interaction ................................... 31
2.5 Finite Element Discretization ........................................................................ 36 2.5.1 Finite Elements for Concrete ............................................................... 36 2.5.2 Finite Elements for Reinforcement ...................................................... 42
2.5.3 Meshing Algorithm .............................................................................. 43 2.5.4 Minimum Element Size ....................................................................... 43
2.5.5 Maximum Element Size ....................................................................... 44
2.6 Prestressing .................................................................................................... 45
2.7 Existing Cracks ............................................................................................. 46 2.8 Loads ............................................................................................................. 46
2.9 Boundary Conditions ..................................................................................... 47 2.9.1 Support and load plates ........................................................................ 47
2.9.2 Symmetry ............................................................................................. 48 3 ANALYSIS .......................................................................................................... 49
3.1 Loading Sequence ......................................................................................... 49
3.2 Load Incrementation ..................................................................................... 50 3.3 Equilibrium Iteration ..................................................................................... 50
3.4 Convergence Criteria ..................................................................................... 51 4 LIMIT STATE VERIFICATIONS ...................................................................... 53
4.1 Serviceability Limit State (SLS) ................................................................... 53
4.2 Ultimate Limit State (ULS) ........................................................................... 55 4.2.1 Global Resistance Factor Method (GRF) ............................................ 55 4.2.2 Partial Safety Factor Method (PF) ....................................................... 56 4.2.3 Estimation of Coefficient Of Variation of Resistance Method (ECOV)
57 5 REPORTING OF RESULTS ............................................................................... 59
5.1 Finite element analysis input check list ......................................................... 61 5.2 Finite element results check list .................................................................... 62 5.3 Finite element model checks ......................................................................... 63

Rijkswaterstaat Centre for Infrastructure
Page: 6 of 69 Guidelines for Issued: 15 June 2017 Nonlinear Finite Element Analysis of Version: 2.1 Concrete Structures Status: Final RTD: 1016-1:2017
6 REFERENCES .................................................................................................... 64 Annex A: Material input values for Safety Formats .................................................... 67

Rijkswaterstaat Centre for Infrastructure
Guidelines for Page: 7 of 69 Nonlinear Finite Element Analysis of Issued: 15 June 2017 Concrete Structures Version: 2.1 RTD: 1016-1:2017 Status: Final
1 INTRODUCTION This document provides guidelines for nonlinear finite element analyses of
existing concrete structures and infrastructures, like bridges and viaducts. The guidelines could be applied to beams, slabs, box girders, tunnels, culverts, etc.. The members can contain prestressing as well as normal reinforcement.
1.1 Format
The format is similar to the fib documents:
On the right-hand side, the guideline as brief as possible.
On the left-hand side, the comments and explanations of the guidelines and, where appropriate, references to literature.
1.2 Applicability
The guidelines in this document are intended to be applied to nonlinear finite element analysis for the safety verification of reinforced and pre-stressed concrete structures under quasi-static, monotonic loading. These guidelines cannot be applied to any other kind of analysis. For instance, these guidelines are not intended for modeling cyclic and dynamic loading, such as earthquake or wind loads, and are not intended to model transient effects, such as creep and shrinkage.

Rijkswaterstaat Centre for Infrastructure
Guidelines for Page: 8 of 69 Nonlinear Finite Element Analysis of Issued: 15 June 2017 Concrete Structures Version: 2.1 RTD: 1016-1:2017 Status: Final
1.3 Deviations
The analyst is ultimately responsible for the model, the analysis, and the interpretation of results. The analyst has therefore the right to deviate from these guidelines. In the case the guidelines are not followed, the analysis report should explicitly mention this and the analyst should show sufficient proof that the alternative method or model will result in accurate and reliable results using benchmarks agreed on by both principal and analyst.
1.4 Case studies
Additional information on the numerical analyses can be found in various other publications (Belletti et al., 2011, 2013, 2014), (de Boer et al. 2014).
As part of the development of these guidelines a number of case studies have been performed. An overview of the numerical analyses is provided in a separate validation report, which is released alongside with the guidelines (Belletti et al., 2017).
1.5 Disclaimer
Although the editors have done their utmost best to ensure that any information given is accurate, no liability of any kind, including liability for negligence, can be accepted in this respect by the organization involved, its employees, or the Authors of this document.

Rijkswaterstaat Centre for Infrastructure
Guidelines for Page: 9 of 69 Nonlinear Finite Element Analysis of Issued: 15 June 2017 Concrete Structures Version: 2.1 RTD: 1016-1:2017 Status: Final
2 MODELING
2.1 General
Modeling a structure consists of a number of sequential steps which should be taken deliberately to ensure the quality of the overall analysis. A finite element model consists of a number of entities. First, the unit system for the analysis should be decided. Next, the material and sectional properties are defined for all the parts of the structure. Then, the finite element discretization is created and boundary conditions and loads are applied to the model. Since these guidelines are written for assessing the reliability of a structure, in general a full model of the structure is necessary with permanent loads and those variable loads for which the load-carrying capacity is to be found.
A finite element model of a structure is an abstraction of the physical structure with a number of assumptions, generalizations, and idealizations. The abstraction process has two distinct steps: first, the abstraction from the structure to the mechanical model, and then the abstraction from the mechanical model to the finite element model. In the first step, assumptions and simplifications have to be made regarding to which extent and to which detail the structure has to be modeled, how the boundaries of the model are described, which loads on the structure are significant and how they are described, et cetera. The second step is to discretize the mechanical model into a finite element model, and attach the necessary attributes such as material models, boundary conditions, and loading to the finite element model.
2.2 Units
It is important to use a consistent set of units when generating input for a finite element program. A units check should be used to ensure that the set of units lead to results in the required units. The Finite Element Method has no inherent notion of units; it deals only with numbers. Finite element programs, however, sometimes require certain input in predefined units.
A consistent set of units should be used and the input of the finite element program should always be checked with a units check. The preferred system of units is listed in the table below.

Rijkswaterstaat Centre for Infrastructure
Guidelines for Page: 10 of 69 Nonlinear Finite Element Analysis of Issued: 15 June 2017 Concrete Structures Version: 2.1 RTD: 1016-1:2017 Status: Final
The program will take care that the unit system is consistent. Note that the preferred length unit is in meters. A length unit of millimeters is often used but special care should be taken with in particular dead weight and the gravity constant, g = 10 m/s2= 10 N/kg, and the interpretation of output such as eigenfrequencies and the units of the stress plots, for instance.
Entity Unit Alternative unit
Length Meter m Millimeter mm
Mass Kilogram kg
Time Second s
Temperature Celsius °C
2.3 Material Properties
Material properties should reflect the current physical state of the structure. From these properties the model parameters are derived, dependent on the particular model used in the finite element analysis. For the guidelines, material properties for concrete and reinforcing steel are discussed only.
2.3.1 Concrete
The number of the concrete grade indicates the characteristic cylinder compressive strength fck. Following the Model Code 2010, the most important material properties of concrete can be related to this property and are listed in the table below.
The concrete properties should be derived from the provisions of the fib Model Code 2010 (fib, 2013). For Serviceability Limit State analysis characteristic values of the material properties should be used (see section 4.1). For failure Ultimate Limit State

Rijkswaterstaat Centre for Infrastructure
Guidelines for Page: 11 of 69 Nonlinear Finite Element Analysis of Issued: 15 June 2017 Concrete Structures Version: 2.1 RTD: 1016-1:2017 Status: Final
Parameter (Model Code 2010)
Characteristic cylinder compressive strength
ckf
Mean compressive strength cm ckf f f
Design compressive strength
c
ck
cccd
ff
Minimum reduction factor of compressive strength due to lateral cracking
minmin ;4.0
(40% of the strength remains)
Lower-bound characteristic tensile strength
ctmctk ff 7.0min,
Mean tensile strength (for ≤ C50) 3/23.0 ckctm ff
Design tensile strength
c
ctk
ctd
ff
min,
Fracture energy 18.073 cmF fG
Compressive fracture energy, (Nakamura and Higai, 2001)
FC GG 250
Young’s modulus after 28 days 3/1
010
cm
cci
fEE
(Initial) Poisson ratio ν = 0.15
Density plain concrete ρ = 2400 kg/m3
Density reinforced concrete ρ = 2500 kg/m3
Concrete safety coefficient c=1.5
Long term effect coefficient cc <1
analyses either characteristic, design or mean values of the material properties should be used, in accordance with the safety format (see
section 4.2 and Table 1 and Table 2 in Annex A).

Rijkswaterstaat Centre for Infrastructure
Guidelines for Page: 12 of 69 Nonlinear Finite Element Analysis of Issued: 15 June 2017 Concrete Structures Version: 2.1 RTD: 1016-1:2017 Status: Final
The parameters in the equations above are listed in the table below.
8f MPa MPaEc
4
0 1015.2
Typical values for concrete C40 are listed in the following table.
Parameter Value Unit
fck 35.5 N/mm2
cc 1 -
fcd 23.67 N/mm2
fctm 3.24 N/mm2
fctk,min 2.27 N/mm2
fctd 1.51 N/mm2
Eci 34925 N/mm2
GF 0.144 Nmm/mm2
ρ 2500 · 10-9 kg/mm3

Rijkswaterstaat Centre for Infrastructure
Guidelines for Page: 13 of 69 Nonlinear Finite Element Analysis of Issued: 15 June 2017 Concrete Structures Version: 2.1 RTD: 1016-1:2017 Status: Final
2.3.2 Reinforcement
2.3.2.1 Steel for bars
Parameter
Characteristic yielding strength ykf
Characteristic ultimate strength tkf
Mean yielding strength 10 ykym ff
Design yielding strength
s
yk
yd
ff
Design ultimate strength
s
tk
td
ff
Class A: (ft/fy)k1.05
Class B: (ft/fy)k1.08
Class C: 1.15 (ft/fy)k1.35
Class D: 1.25 (ft/fy)k1.45
uk2.5%
uk5%
uk7%
uk8%
Design ultimate strain ukud . 90
Poisson ratio ν = 0.3
Density steel ρ = 7850 kg/m3
Steel safety coefficient s=1.15
The material properties for the bars should be determined from data sheets provided by the manufacturer, or from original specifications. If material properties are determined on test bars, the in-situ values can be used. In other cases the properties should be derived from the provisions of the fib Model Code 2010. Hardening can be approximated by a bilinear diagram.

Rijkswaterstaat Centre for Infrastructure
Guidelines for Page: 14 of 69 Nonlinear Finite Element Analysis of Issued: 15 June 2017 Concrete Structures Version: 2.1 RTD: 1016-1:2017 Status: Final
Typical values for steel B450C are listed in the following table. Parameter Value Unit Value Unit
fyk 450 · 10+6 N/m2 450 N/mm2
ftk 540 · 10+6 N/m2 540 N/mm2
Es 200000 · 10+6 N/m2 200000 N/mm2
ρ 7850 kg/m3 7850 10-9 kg/mm3
2.3.2.2 Steel for prestressing tendons
Parameter
Characteristic 0.1% proof stress k.pf 10
Characteristic ultimate tensile strength ptkf
Characteristic percentage total elongation at maximum force
puk
Design 0.1% proof stress
s
k.p
d.p
ff
10
10
Design ultimate tensile strength
s
ptk
ptd
ff
Poisson ratio ν = 0.3
Density steel ρ = 7850 kg/m3
Steel safety coefficient s=1.1
The material properties for the prestressing steel should be determined from data sheets provided by the manufacturer, or from original specifications. If material properties are determined on test bars, the in-situ values can be used. In other cases the properties should be derived from the fib Model Code 2010. Hardening can be approximated by a bilinear diagram.

Rijkswaterstaat Centre for Infrastructure
Guidelines for Page: 15 of 69 Nonlinear Finite Element Analysis of Issued: 15 June 2017 Concrete Structures Version: 2.1 RTD: 1016-1:2017 Status: Final
Typical values for seven wire-low relax strands are listed in the following table.
Parameter Value Unit Value Unit
fp0.1k 1675 · 10+6 N/m2 1675 N/mm2
fptk 1862 · 10+6 N/m2 1862 N/mm2
Es 196500 · 10+6 N/m2 196500 N/mm2
ρ 7850 kg/m3 7850 10-9 kg/mm3
2.4 Constitutive Models
Constitutive models, also known as material models, used in a finite element context specify the constitutive behavior (the stress-strain relationship) that is assumed for the materials in the structure. The material models are often simplified abstractions of the true material behavior.
2.4.1 Model for Concrete
Compared to the fixed model, the rotating model usually results in a lower-limit failure load because it does not suffer as much from spurious stress-locking. The stress-locking phenomena is present in the fixed crack model where stresses rotate significantly after crack formation resulting in a considerable overestimation of the failure load (Rots 1988). If a fixed crack model is used, an adequate shear retention model should be used (see 2.4.1.3). For beams and slabs without stirrups the adequacy of the shear retention model should be proved explicitly. Alternatively the rotating crack model
For concrete, a total strain-based rotating crack or fixed crack model is preferred.

Rijkswaterstaat Centre for Infrastructure
Guidelines for Page: 16 of 69 Nonlinear Finite Element Analysis of Issued: 15 June 2017 Concrete Structures Version: 2.1 RTD: 1016-1:2017 Status: Final
should be used.
2.4.1.1 Linear-elastic properties
The linear-elastic material properties are the Young’s modulus and the Poisson ratio. The latter is assumed equal to 0.15, irrespective of the concrete strength. If the applied cracking model does not include a decrease of the Poisson effect during progressive cracking an additional analysis with a Poisson ratio equal to 0.0 should be considered. A reduced Young’s modulus should be used with a reduction factor equal to 0.85 to account for initial cracking due to creep, shrinkage, and such. The initial Young’s modulus can be determined according to the Model Code 2010 provisions given in Section 2.3.1, or, alternatively, the simplified relationship according to the Eurocode-2 can be used.
0.3
0
0
0.85 0.85 cmc ci c
cm
fE E E
f
with Eco = 22000 MPa and fcm0 = 10 MPa.
An isotropic linear-elastic material model based on the Young’s modulus and Poisson ratio should be used.
2.4.1.2 Tensile Behavior
The uniaxial stress-strain diagram for tension is shown in the figure below. The exponential-type softening diagrams such as the Hordijk relationship or the exponential softening diagram is preferred since this diagram will result in more localized cracks and consequently will avoid large areas of diffuse cracking. The area under the stress-strain curve should be equal to the fracture energy divided by the equivalent length. After complete softening, i.e. when virtually no stresses are transmitted, the crack is said to be “fully open”. In case of a multi-linear stress-strain diagram, a predefined
An exponential softening diagram is preferred. The parameters are the tensile strength, ft, the fracture energy, GF, and the equivalent length, heq. For the description of heq , reference to section 2.4.1.7 is made. A multi-linear approximation of the exponential uniaxial stress-strain diagram can be used if exponential softening is not available. The apparent Poisson ratio should be reduced after cracking after crack initiation.

Rijkswaterstaat Centre for Infrastructure
Guidelines for Page: 17 of 69 Nonlinear Finite Element Analysis of Issued: 15 June 2017 Concrete Structures Version: 2.1 RTD: 1016-1:2017 Status: Final
equivalent length has to be taken into account that should be based on the element size as much as possible.
Figure 1 Exponential softening
Figure 2 Hordijk softening

Rijkswaterstaat Centre for Infrastructure
Guidelines for Page: 18 of 69 Nonlinear Finite Element Analysis of Issued: 15 June 2017 Concrete Structures Version: 2.1 RTD: 1016-1:2017 Status: Final
Figure 3 Multi-linear softening
The exponential softening relationship is given by
expcr
t
u
f
The softening curve according to Hordijk (Hordijk 1991) is given by
3
3
1 2 1 21 exp 1 exp 0
0
cr cr crcr
t u
u u u
cr
u
f c c c c
The usual parameters are c1=3.0 and c2=6.93. For both curves, the maximum stress is given by the tensile strength ft and shape of the softening diagram is governed by the ultimate strain
parameter εu. For exponential softening the ultimate strain parameter is given by

Rijkswaterstaat Centre for Infrastructure
Guidelines for Page: 19 of 69 Nonlinear Finite Element Analysis of Issued: 15 June 2017 Concrete Structures Version: 2.1 RTD: 1016-1:2017 Status: Final
Fu
eq t
G
h f
The ultimate strain parameter in case of Hordijk softening is given by
5.136
Fu
eq t
G
h f
2.4.1.3 Shear Behavior
The selection of a shear retention model is only relevant for fixed crack models. In a conservative variable shear retention model the secant shear stiffness degrades at the same rate as the secant tensile stiffness due to cracking. Alternatively, for beams, a variable shear retention model can be used in which de shear stiffness gradually reduces to zero for a crack width of half the average aggregate size. Constant shear retention models are not advisable, or should at least be accompanied with thorough post-analysis checks of spurious principal tensile stresses.
For fixed crack models a variable shear retention model is strongly recommended. For beams and slabs without stirrups the adequacy of the variable shear retention model should be verified explicitly.
2.4.1.4 Compressive Behavior
The compressive behavior of concrete is rather complicated; especially the post-peak behavior is complex and depends to some extend on the boundary conditions of the experimental setup. The experimental behavior under uniaxial compression shows a softening relationship after the peak strength. Under increasing levels of lateral confinement, concrete in compression shows an increasing strength and increasing ductility (see 2.4.1.6). On the other hand, the compressive strength should be reduced,
The compressive behavior should be modeled such that the maximum compressive stress is limited. Parabolic stress strain diagram with softening branch is recommended. The softening branch should be based on the compressive fracture energy value (see 2.3.1) in order to reduce mesh size sensitivity during compressive strain localization.

Rijkswaterstaat Centre for Infrastructure
Guidelines for Page: 20 of 69 Nonlinear Finite Element Analysis of Issued: 15 June 2017 Concrete Structures Version: 2.1 RTD: 1016-1:2017 Status: Final
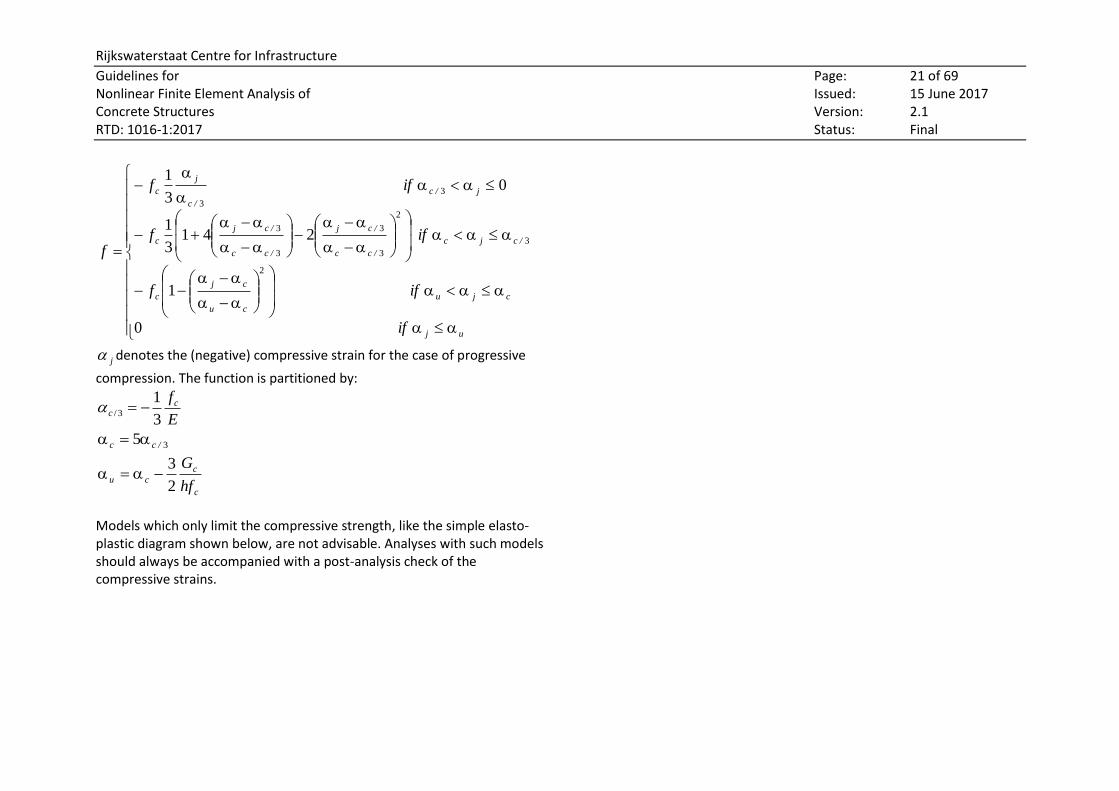
specifically in case of lateral cracking in plane stress models (see 2.4.1.5). The preferred model is based on a compressive fracture energy, Gc, (Feenstra 1993, Cervenka and Cervenka 2010), regularized with a crushing-band width (see 2.4.1.7). The (automatic) determination of the crushing-band width of heq follows the same lines as for tension softening and the cracking-band width, but should now be based on the principal compression strain direction. The compressive softening is a function of the compressive fracture energy, based on the tensile fracture energy value (see 2.3.1). The parabolic diagram can be used to model this, see Figure below. Alternatively a model with a parabolic ascending branch followed by a linear softening can be used.
Figure 4 Parabolic compression diagram
The above parabolic curve is defined as:
Rijkswaterstaat Centre for Infrastructure
Guidelines for Page: 21 of 69 Nonlinear Finite Element Analysis of Issued: 15 June 2017 Concrete Structures Version: 2.1 RTD: 1016-1:2017 Status: Final
uj
cju
cu
cj
c
/cjc
/cc
/cj
/cc
/cj
c
j/c
/c
j
c
if
iff
iff
iff
f
0
1
2413
1
03
1
2
3
2
3
3
3
3
3
3
j denotes the (negative) compressive strain for the case of progressive
compression. The function is partitioned by:
E
fcc
3
13/
35 /cc
c
c
cuhf
G
2
3
Models which only limit the compressive strength, like the simple elasto-plastic diagram shown below, are not advisable. Analyses with such models should always be accompanied with a post-analysis check of the compressive strains.

Rijkswaterstaat Centre for Infrastructure
Guidelines for Page: 22 of 69 Nonlinear Finite Element Analysis of Issued: 15 June 2017 Concrete Structures Version: 2.1 RTD: 1016-1:2017 Status: Final
Figure 5 Elasto-plastic compression diagram
0c e
c e
E if
f if
with e c cf E .
This holds also for the parabola-rectangular diagram used for the design of cross-sections from the Eurocode-2:
Figure 6 Parabola-rectangular compression diagram

Rijkswaterstaat Centre for Infrastructure
Guidelines for Page: 23 of 69 Nonlinear Finite Element Analysis of Issued: 15 June 2017 Concrete Structures Version: 2.1 RTD: 1016-1:2017 Status: Final
2
2
2
1 1 if 0
if
n
c c
c
c c
f
f
The parameters of the curve are n=2, εc2 = -2.0‰, and εcu2 = -3.5‰ for compressive strengths lower than 50 MPa. The initial slope of the curve should be equal to the linear-elastic Young’s modulus. However, the initial slope is fully determined by the parameters of the curve resulting in
2
c c
c
nE f
Neither of the relationships given above model the strength degradation after the peak strength. In the post-analysis check for these non-softening models compressive failure of the structure is identified as reaching of an ultimate compressive strain (-3.5 ‰) somewhere in the structure. The area over which the compressive strains are averaged should be motivated. The compressive stress-strain diagram of Thorenfeldt, see below, is not advisable.

Rijkswaterstaat Centre for Infrastructure
Guidelines for Page: 24 of 69 Nonlinear Finite Element Analysis of Issued: 15 June 2017 Concrete Structures Version: 2.1 RTD: 1016-1:2017 Status: Final
Figure 7 Thorenfeldt compression diagram
The Thorenfeldt curve is defined as
2
2
1
c nk
c
c
nf
n
where
0.8017
cfn
and
2
2
1 0
0.6763
c
cc
if
k fif
The strain at the maximum stress is defined as

Rijkswaterstaat Centre for Infrastructure
Guidelines for Page: 25 of 69 Nonlinear Finite Element Analysis of Issued: 15 June 2017 Concrete Structures Version: 2.1 RTD: 1016-1:2017 Status: Final
21
cc
c
fn
n E
Note that the parameters of the Thorenfeldt curve are not unit-free and that the compressive strength needs to be defined in MPa. Also, the curve shows a softening behavior and finite element results are consequently mesh-dependent since they are not regularized with a crushing-band width heq.
2.4.1.5 Tension-Compression Interaction
Although tension-compression interaction is an important feature of the constitutive behavior of concrete, the behavior is rather complicated and for existing models the parameters are sometimes difficult to interpret. Attention should be given to the finite element results since ignoring tension-compression interaction is a non-conservative assumption. A reduction of the compressive strength resulting from lateral cracking should be taken into account. Different models that take into account the tension-compression interaction are available in literature (Vecchio & Collins 1993, Hsu 2010). Some of these models only reduce the compressive strength, leading to a reduction of the Young’s modulus for low values of compressive strain. Some other more refined models reduce both the compressive strength and the peak compressive strain so that the initial stiffness of the structure is not reduced, see Figure below.
Tension-compression interaction needs to be addressed and taken into account in the modeling of concrete structures subjected to multi-axial stress state.

Rijkswaterstaat Centre for Infrastructure
Guidelines for Page: 26 of 69 Nonlinear Finite Element Analysis of Issued: 15 June 2017 Concrete Structures Version: 2.1 RTD: 1016-1:2017 Status: Final
Figure 8 Compression softening models As an example the reduction of the compressive strength trend for Model B is shown below.
Figure 9 Reduction of the compressive strength

Rijkswaterstaat Centre for Infrastructure
Guidelines for Page: 27 of 69 Nonlinear Finite Element Analysis of Issued: 15 June 2017 Concrete Structures Version: 2.1 RTD: 1016-1:2017 Status: Final
The formulation of the reduction coefficient reported below.
cc
red,c
Kf
f
1
1
where
370270
0
..K lat
c
lat is the tensile strain and 0 is the compressive peak strain.
However the reduction of the compressive strength should be limited in order to avoid excessive reduction that leads to a non-realistic response of
the structure (see 2.3.1, min
).
2.4.1.6 Compression-Compression Interaction
Compression-compression interaction is an important feature to model confinement effects. Although modeling this effect is necessary to fully understand the nonlinear behavior of concrete, ignoring confinement effects is a conservative assumption and therefore permitted.
Compression-compression interaction does not need to be modeled.
2.4.1.7 Equivalent Length
The equivalent length, related to the dimensions of the finite element, is crucial to reduce mesh size dependency (Bazant and Oh 1983; Crisfield 1984; Rots 1988). User-assigned values for this parameter are usually inaccurate and increase the user and model factors of the simulation. A first method is to assign a value based on the area or volume of the element (Rots 1988; Feenstra 1993), but this method will not be accurate in case of
The equivalent length, also known as the crack-band width, is an essential parameter in constitutive models that describe a softening stress-strain relationship. An automatic procedure for determining the equivalent length, or crack-band width, should be used. The preferred method is a method based on the initial direction of the crack and the element dimensions. Alternatively, a method based on the area or volume of the

Rijkswaterstaat Centre for Infrastructure
Guidelines for Page: 28 of 69 Nonlinear Finite Element Analysis of Issued: 15 June 2017 Concrete Structures Version: 2.1 RTD: 1016-1:2017 Status: Final
distorted elements and elements with a high aspect-ratio. An improved method has been proposed by Oliver (Oliver 1989) with improvements suggested by Govindjee et al. (Govindjee, Kay et al. 1995). The equivalent length should be based on the element dimensions and the crack directions with respect to the element alignment (Oliver, 1989). It is advised to supplement this procedure with an additional orientation factor (Cervenka, 1995, Cervenka and Cervenka, 2010). For quadratic quadrilateral elements with a square shape (dimensions h x h) and with a crack direction along one of the diagonals this would lead to an
estimated crack-band width of heq = √2 h. For the same square elements with a crack direction along one of its edges this would simply lead to heq = h.
Figure 10 Examples of equivalent length based on element dimensions and crack direction For other shapes and for other crack directions other results will apply. It is
finite element can be used.
heq = a heq = b heq = 2 h
a
b
h
h

Rijkswaterstaat Centre for Infrastructure
Guidelines for Page: 29 of 69 Nonlinear Finite Element Analysis of Issued: 15 June 2017 Concrete Structures Version: 2.1 RTD: 1016-1:2017 Status: Final
advised to make use of an automatic determination of heq by the finite element program. If the finite element program does not have an option for a variable crack-band width determination depending on the crack orientation, the user should either choose for a conservative (i.e. large) estimation of heq or check the used crack-band width a posteriori based on the obtained crack orientations and element alignment. For rectangular elements (dimensions a x b) with a crack direction along edge “a” this would lead to heq = b. Note, that in smeared cracking, the ratio Gf/heq determines the actual softening. For obtaining conservative results, instead of increasing the heq, reduction of fracture energy Gf can be applied.
2.4.2 Model for Reinforcement
2.4.2.1 Model for steel bars
Reinforcing steel exhibits an elasto-plastic behavior where the elastic limit is equal to the yield strength of the steel. The post-yield behavior is known as hardening that should be modeled according to the specifications of the reinforcing and pre-stressing steel. If no hardening specifications are available, a nominal hardening modulus, for instance Ehar = 0.02 Es, can be used. This will improve the stability of the analysis.
An elasto-plastic material model with hardening should be used.

Rijkswaterstaat Centre for Infrastructure
Guidelines for Page: 30 of 69 Nonlinear Finite Element Analysis of Issued: 15 June 2017 Concrete Structures Version: 2.1 RTD: 1016-1:2017 Status: Final
Figure 11 Stress-strain diagram for steel
2.4.2.2 Model for prestressing steel
The stress-strain relationship is characterized by the definition of the 0.1% proof stress, by the ultimate tensile strength and by the percentage total elongation at maximum force, see Figure below.
An elasto-plastic material model with hardening should be used to approximate the stress-strain relationship.

Rijkswaterstaat Centre for Infrastructure
Guidelines for Page: 31 of 69 Nonlinear Finite Element Analysis of Issued: 15 June 2017 Concrete Structures Version: 2.1 RTD: 1016-1:2017 Status: Final
Figure 12 Stress-strain diagram for prestressing steel
2.4.3 Model for Concrete-Reinforcement Interaction
Concrete-reinforcement interaction is the main mechanism for stress redistribution after cracking in concrete structures with bonded reinforcement. Although the mechanisms are governed at the micro- and meso-scale with rather complex inter-dependencies, which can only be properly modeled using dense finite element discretizations with dedicated constitutive models, the models at the macro-level can be simplified significantly.
2.4.3.1 Tension-stiffening
Redistribution of stresses from concrete to reinforcement after cracking occurs is an essential load-carrying mechanism in reinforced and prestressed concrete. The behavior of a reinforced bar in tension is
The interaction effect of distributed cracking and stress-redistribution to the reinforcement need to be taken into account.

Rijkswaterstaat Centre for Infrastructure
Guidelines for Page: 32 of 69 Nonlinear Finite Element Analysis of Issued: 15 June 2017 Concrete Structures Version: 2.1 RTD: 1016-1:2017 Status: Final
governed by the number of cracks that are present after a stabilized crack patterns has developed. The number of cracks that can develop is dependent on different structural and material properties such as reinforcement ratio, reinforcement diameter, tensile strength, and such. Even after a stabilized crack pattern has developed, the stiffness of the reinforced tensile member is higher than the stiffness of the reinforcement alone. This effect is often referred to as tension-stiffening. A conservative assumption is to ignore the tension-stiffening component and only account for the energy dissipated in the cracks that develop during the loading process. If the element size is smaller than the estimated average crack spacing, the tension-softening model can be used, provided that the analysis leads to an realistic crack spacing. Otherwise, the amount of energy that can be dissipated within a finite element should be related to the average crack spacing and the size of the element. If the crack spacing is equal to sr,max and the equivalent length equal to heq, then the amount of released energy is given by
RC
F cr FG n G
where the number of cracks, ncr, is given by
,max
max 1,eq
cr
r
hn
s
Rijkswaterstaat Centre for Infrastructure
Guidelines for Page: 33 of 69 Nonlinear Finite Element Analysis of Issued: 15 June 2017 Concrete Structures Version: 2.1 RTD: 1016-1:2017 Status: Final
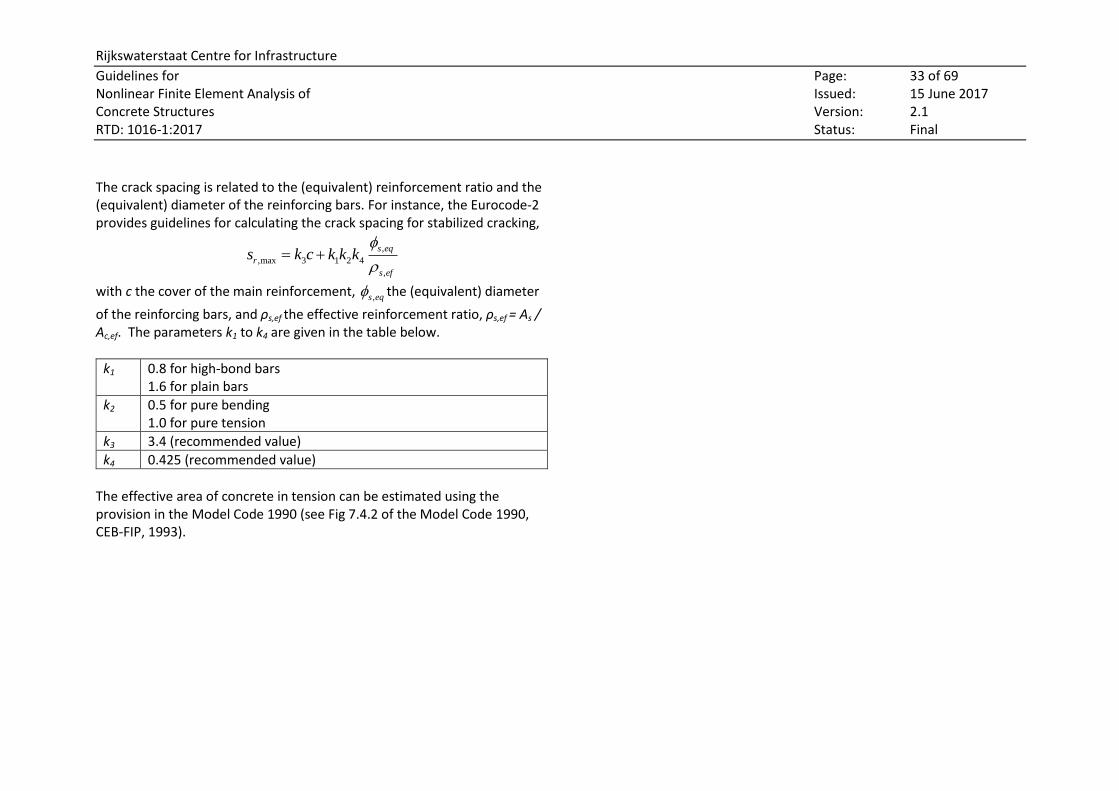
The crack spacing is related to the (equivalent) reinforcement ratio and the (equivalent) diameter of the reinforcing bars. For instance, the Eurocode-2 provides guidelines for calculating the crack spacing for stabilized cracking,
,
,max 3 1 2 4
,
s eq
r
s ef
s k c k k k
with c the cover of the main reinforcement, ,s eq the (equivalent) diameter
of the reinforcing bars, and ρs,ef the effective reinforcement ratio, ρs,ef = As / Ac,ef. The parameters k1 to k4 are given in the table below.
k1 0.8 for high-bond bars 1.6 for plain bars
k2 0.5 for pure bending 1.0 for pure tension
k3 3.4 (recommended value)
k4 0.425 (recommended value)
The effective area of concrete in tension can be estimated using the provision in the Model Code 1990 (see Fig 7.4.2 of the Model Code 1990, CEB-FIP, 1993).

Rijkswaterstaat Centre for Infrastructure
Guidelines for Page: 34 of 69 Nonlinear Finite Element Analysis of Issued: 15 June 2017 Concrete Structures Version: 2.1 RTD: 1016-1:2017 Status: Final
(a) beam (b) slab
Figure 13 Effective area For a beam, the effective concrete area is determined by
, ,c ef c efA h b
with b the width of the beam and hc,ef the effective height,
dhxhhefc
5.2;3/min,
The parameter x in this equation is the depth of the neutral axis. For a slab structure, the effective concrete area is calculated per unit width, with the effective height given by
25.2;3/min,
cxhhefc
The underlying assumption of the calculation of the crack spacing is that the crack direction and the reinforcement are approximately orthogonal. In case the cracks will develop under a significant angle with the reinforcement, or if an orthogonal reinforcement grid is used, the crack spacing should be calculated using the directional average

Rijkswaterstaat Centre for Infrastructure
Guidelines for Page: 35 of 69 Nonlinear Finite Element Analysis of Issued: 15 June 2017 Concrete Structures Version: 2.1 RTD: 1016-1:2017 Status: Final
zryrss
s
max,,max,,
sincos
1
where is the angle between the reinforcement along y direction and the
principal tensile stress direction and ymax,,rs , zmax,,rs are the crack spacing
calculated according to the Eurocode 2. For finite elements with dimensions much larger than the crack spacing, it is practical to assign an ultimate strain in the tension-softening diagram that is equal to the yield strain of the reinforcement. Note that this can only be applied in an area equal to the effective concrete area around the main reinforcement. For other parts of the structure, a regular, fracture energy-based tension-softening model should be used.
2.4.3.2 Slip
Taking into account slip between reinforcement and concrete will result in more accurate results. The Model Code 2010 provides bond-slip relations. However, robust and easy-to-use models are not commonly available in commercial finite element codes. Instead, a perfect-bond assumption is considered sufficient. In that case special care should be taken when calculating the crack opening in the Serviceability Limit State verification (see 4.1).
Slip between reinforcement and concrete can be modeled if an appropriate model is available.
2.4.3.3 Dowel Action
Although taking into account dowel action will result in more accurate results, robust and easy-to-use models are not commonly available in commercial finite element codes.
Dowel action of reinforcement can be modeled if an appropriate model is available.

Rijkswaterstaat Centre for Infrastructure
Guidelines for Page: 36 of 69 Nonlinear Finite Element Analysis of Issued: 15 June 2017 Concrete Structures Version: 2.1 RTD: 1016-1:2017 Status: Final
2.5 Finite Element Discretization
When using the Finite Element Method to perform a numerical simulation of the behavior of a structure, the mechanical model of the structure needs to be divided in a number of elements. Various aspects are influencing the quality of the results of the analysis and the most important aspects are the shape of the elements used; the degree of interpolation of the displacement field; and the numerical integration scheme for the internal state since we tacitly assumed that the internal state is defined as a stress-strain relationship and not based on generalized forces and deformations.
2.5.1 Finite Elements for Concrete
2.5.1.1 Shape and Interpolation
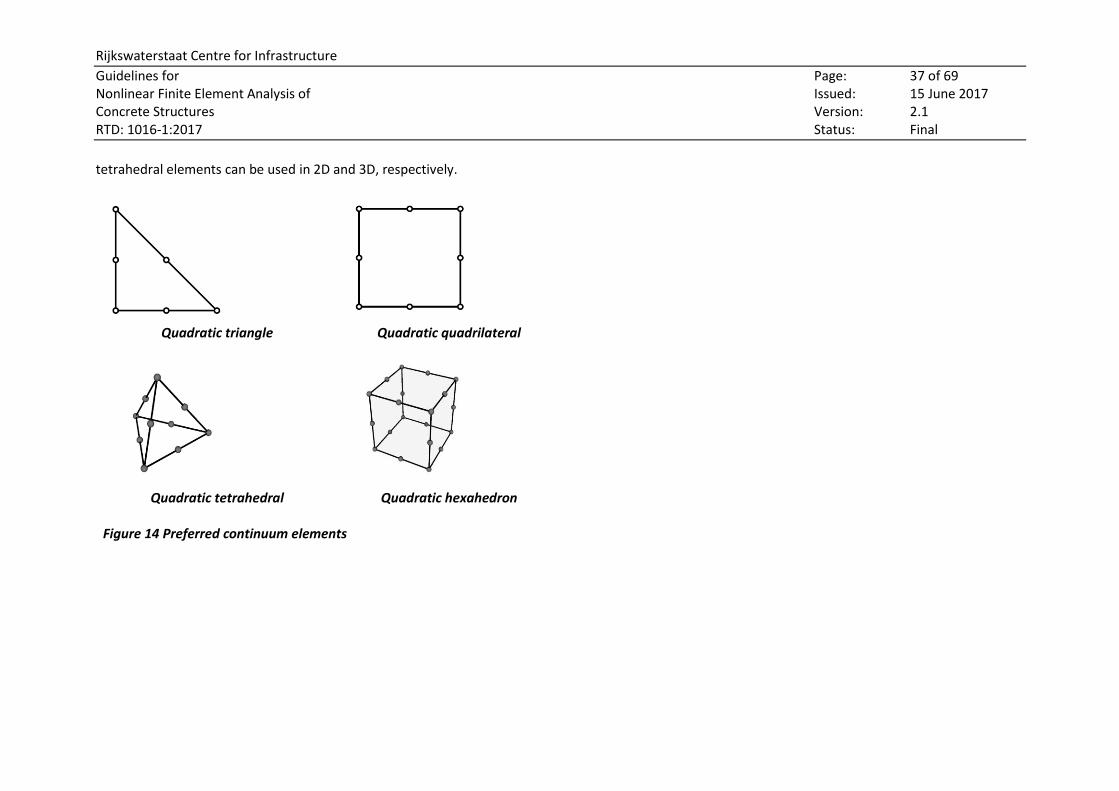
Linear elements will show locking behavior in certain cases. In most finite element programs these linear elements have been improved but quadratic elements are still better suited because they can described more deformation modes and are better capable of describing more complex failure modes such as shear failure. For analyzing beams the preferred element is an 8-node quadrilateral element for 2D simulations and a 20-node hexahedral element for 3D simulations. For analyzing slabs the preferred element is a 20-node hexahedral element. If necessary, quadratic triangular and quadratic
Elements with quadratic interpolation of the displacement field should be used. Preferably a quadrilateral shape or a hexahedral shape should be used in 2D and 3D, respectively.
Rijkswaterstaat Centre for Infrastructure
Guidelines for Page: 37 of 69 Nonlinear Finite Element Analysis of Issued: 15 June 2017 Concrete Structures Version: 2.1 RTD: 1016-1:2017 Status: Final
tetrahedral elements can be used in 2D and 3D, respectively.
Quadratic triangle Quadratic quadrilateral
Quadratic tetrahedral Quadratic hexahedron
Figure 14 Preferred continuum elements

Rijkswaterstaat Centre for Infrastructure
Guidelines for Page: 38 of 69 Nonlinear Finite Element Analysis of Issued: 15 June 2017 Concrete Structures Version: 2.1 RTD: 1016-1:2017 Status: Final
For large slab structures, modeling with continuum-based finite elements is not practical because of the large amounts of finite elements needed to accurately describe the stresses in the structure. Structural elements such as beam elements and (flat) shell elements can be used to model large-scale structures where it is not feasible anymore to model with continuum elements. However, these types of structural elements are not capable to model shear failure and additional post-analysis checks should be carried out to ascertain that a shear failure mode is not overlooked. The preferred elements are also quadratic elements, such as 3-node beams in 2D and 3D, and 6-node triangular and 8-node quadrilateral shell elements for 2.5D analysis. Also, models with a combination of structural elements and continuum elements can be considered.

Rijkswaterstaat Centre for Infrastructure
Guidelines for Page: 39 of 69 Nonlinear Finite Element Analysis of Issued: 15 June 2017 Concrete Structures Version: 2.1 RTD: 1016-1:2017 Status: Final
Quadratic 2D beam Quadratic 3D beam
Quadratic triangular shell Quadratic quadrilateral shell Figure 15 Preferred structural elements
2.5.1.2 Numerical Integration
Reduced-order integration for quadratic elements can lead to spurious modes when the stiffness of the element becomes small due to extensive
Full integration should be used.

Rijkswaterstaat Centre for Infrastructure
Guidelines for Page: 40 of 69 Nonlinear Finite Element Analysis of Issued: 15 June 2017 Concrete Structures Version: 2.1 RTD: 1016-1:2017 Status: Final
cracking (De Borst and Rots 1989). Continuum elements should be integrated with the integration rules given in the figure below.
Quadratic triangle: 7-point Hammer
Quadratic quadrilateral: 3x3-point Gauss
Quadratic tetrahedral: 4-point Hammer
Quadratic hexahedron: 3x3x3-point Gauss
Figure 16 Sampling points for continuum elements
Other integration rules that result in full integration are also available but Gaussian integration rules for quadrilaterals and hexahedrons and Hammer integration rules for triangles and tetrahedral are most commonly used.

Rijkswaterstaat Centre for Infrastructure
Guidelines for Page: 41 of 69 Nonlinear Finite Element Analysis of Issued: 15 June 2017 Concrete Structures Version: 2.1 RTD: 1016-1:2017 Status: Final
For structural elements integration schemes are used in case the elements are numerically integrated. The integration scheme is a combination of an integration rule along the axis of the beam or in the plane of the slab, and through the thickness.
Quadratic 2D beam: 3-point Gauss along the axis and 7-point Simpson through depth
Quadratic 3D beam: 3-point Gauss along the axis and 7-point Simpson through depth and thickness
Quadratic triangular shell: 7-point Hammer in-plane and 7-point Simpson through depth
Quadratic quadrilateral shell: 3x3-point Gauss in-plane and 7-point Simpson through depth
Figure 17 Sampling points for structural elements

Rijkswaterstaat Centre for Infrastructure
Guidelines for Page: 42 of 69 Nonlinear Finite Element Analysis of Issued: 15 June 2017 Concrete Structures Version: 2.1 RTD: 1016-1:2017 Status: Final
The integration rule along the beam axis or in the plane of the slab should result in full integration, for instance 3-point Gauss for a quadratic beam element. The through-depth integration rule should be capable of capturing a gradual stiffness reduction due to cracking and crushing. In general, a 7-point Simpson rule is mostly sufficient but an 11-point Simpson rule is necessary in certain cases and recommended in case of doubt.
2.5.2 Finite Elements for Reinforcement
Embedded reinforcement has the advantage over explicitly modeling reinforcement with truss elements of overlay elements that the connectivity of the concrete elements does not have to be altered to model the reinforcement layout. Using overlay elements to model grid reinforcement has the disadvantage that shear stiffness will be present while this term is usually ignored in embedded grid reinforcement. In most commercial finite element codes the use of embedded reinforcements entails that slip between reinforcement and concrete is ignored (see 2.4.3.2). In modern “embedded bond-slip models” the advantages of embedded reinforcements and interface models are combined, such that slip can be modeled explicitly.
Embedded reinforcement elements are preferred; both embedded bars and grids can be used.
2.5.2.1 Shape and Interpolation
The interpolation of the displacement degree of freedom of the reinforcement should be compatible with the element in which the reinforcement is embedded.
The same order of interpolation as the concrete elements should be used.

Rijkswaterstaat Centre for Infrastructure
Guidelines for Page: 43 of 69 Nonlinear Finite Element Analysis of Issued: 15 June 2017 Concrete Structures Version: 2.1 RTD: 1016-1:2017 Status: Final
2.5.2.2 Numerical Integration
The reinforcement can be integrated with a reduced integration scheme since the reinforcement will not exhibit spurious modes since these are inhibited by the embedding element.
Full or reduced integration can be used.
2.5.3 Meshing Algorithm
The finite element discretization has a profound effect on the accuracy of a nonlinear finite element simulation. The shape of the generated finite elements can usually be checked by the program using various metrics such as aspect ratio, skewness, area over perimeter ratio, and such. These metrics should be used as much as possible to create a finite element discretization that has a limited number of distorted elements. Comparisons of results with different discretizations might provide additional confidence.
The finite element mesh has to be generated using an algorithm that produces regular meshes with less than 5% of distorted elements.
2.5.4 Minimum Element Size
The minimum element size is usually determined by practical considerations. The computational time increases approximately quadratic with the number of elements and the number of elements should be limited in order to reduce the elapsed time for finishing the simulation.
There is no minimum element size requirement.

Rijkswaterstaat Centre for Infrastructure
Guidelines for Page: 44 of 69 Nonlinear Finite Element Analysis of Issued: 15 June 2017 Concrete Structures Version: 2.1 RTD: 1016-1:2017 Status: Final
2.5.5 Maximum Element Size
For softening materials, the post-peak response can show a snap-back behavior when the equivalent length is too large. Since the equivalent length is related to the element size, the maximum element size is given by the initial slope of the post-peak stress-strain relationship. For exponential softening, the initial post-peak slope is given by
0 0
expcr
cr
cr
t t
cr
u u u
f f
which should be larger than the Young's modulus, E. With u F eq tG h f ,
the equivalent length should be smaller than
2
Feq
t
EGh
f
The maximum element edge length should be approximately half of the maximum equivalent length.
The element size is limited to ensure that the constitutive model does not exhibit a ''snap-back'' in the stress-strain relationship.
The maximum element size is also limited by the inherent inaccuracy of the finite element method. If the finite element discretization is too coarse, the stress field will show considerable jumps from one element to another since the stress field is not continuous. As a guideline, for reinforced concrete members with standard reinforcement layouts, the element size should be less than the values in the table below.
The maximum element size in the model should be chosen such that relatively smooth stress fields can be calculated.

Rijkswaterstaat Centre for Infrastructure
Guidelines for Page: 45 of 69 Nonlinear Finite Element Analysis of Issued: 15 June 2017 Concrete Structures Version: 2.1 RTD: 1016-1:2017 Status: Final
Beam Structure Maximum element size
2D modeling
6,
50min
hl
3D modeling
6,
6,
50min
bhl
Slab Structure Maximum element size
2D Modeling
50,
50min
bl
3D Modeling
6,
50,
50min
hbl
where h the depth, l the span, and b the width, see Figure 13 on page 34. In other words: for 2D modeling of beams at least 6 elements over the height should be used. For beams or slabs with openings or other discontinuities more elements should be considered.
2.6 Prestressing
Short-term prestress losses due to wobble, friction, and anchor retraction have to be taking into account. Long-term prestressing levels also change due to relaxation, shrinkage, and creep of the structure. The actual level of prestressing should be assessed as accurately as possible. If no data is available, the design prestressing level should be reduced to 70% for SLS and ULS simulations. For simulation of construction stages, the prestressing
Prestressing should be applied taking into account prestress losses.

Rijkswaterstaat Centre for Infrastructure
Guidelines for Page: 46 of 69 Nonlinear Finite Element Analysis of Issued: 15 June 2017 Concrete Structures Version: 2.1 RTD: 1016-1:2017 Status: Final
levels should be increased to 110%.
2.7 Existing Cracks
Existing cracks basically reduce the stiffness in a local region of the structure. This can be modeled using a reduced tensile strength, reduced Young's modulus and reduced fracture energy. Since the amount of reduction is difficult to assess, the existing crack pattern should be recreated using multiple load cases that lead to the observed pattern. Alternatively the cause of existing cracks is modeled explicitly. Possible causes include restrained volume changes or differential support settlement.
Existing cracks in the structure should be taken into account whenever detailed information about location and crack widths is available.
2.8 Loads
Dead weight and permanent loads should be modeled as a separate, initial load case. Including dead weight loading leads to a non-uniform stress field in general, which is beneficial in nonlinear analysis because constant-stress zones exhibit multiple localizations which are mostly spurious since only a small number of cracks will localize. The traffic load is modeled using a predefined wheel configuration that is applied to the structure. The wheel configuration has to be in the most unfavorable position, considering all relevant failure modes of each structural part.
Loads on new structures should be applied according to the specifications in the Eurocode, the National Appendices or the RWS ROK-1.3 (Richtlijnen Ontwerpen Kunstwerken). For existing structures the Eurocode, the National 8700 serie or the RWS RBK 1.1 (Richtlijnen Beoordeling Kunstwerken) should be applied. Loads that should be taken into account, but are not limited to:
1. Dead weight and prestressing. 2. Permanent loads, such as asphalt, barriers and railings. 3. Traffic loads, both distributed and combinations of axle loads (per
lane). 4. Temperature loads

Rijkswaterstaat Centre for Infrastructure
Guidelines for Page: 47 of 69 Nonlinear Finite Element Analysis of Issued: 15 June 2017 Concrete Structures Version: 2.1 RTD: 1016-1:2017 Status: Final
Temperature loads need to be applied in combination with all other load cases to find the most conservative case. In general, a temperature gradient over the depth of the structure has to be modeled to account for daily temperature differences, as well as a constant temperature difference to account for annual temperature differences. In certain cases, a concentrated load can be replaced by an equivalent displacement. This method is often referred to as displacement control and is often more stable than load control where the force is applied. However, displacement control restricts the displacement of a point to a prescribed value and is often not suitable for structures with a multiple of loads and/or distributed loads such as dead weight loading. Displacement controlled analysis, albeit more stable than force control, should be considered more research-oriented.
2.9 Boundary Conditions
Boundary conditions are considered in this document the restraints on the displacements at certain points of the structure. They e.g. can represent the supports of a structure, or the load plate in an experiment. In case of structural symmetry and a symmetrical loading pattern, the finite element model can be reduced.
2.9.1 Support and load plates
Loads and supports are usually applied using load and support plates. These Unless the objective of the analysis is to study the detailed behavior of the

Rijkswaterstaat Centre for Infrastructure
Guidelines for Page: 48 of 69 Nonlinear Finite Element Analysis of Issued: 15 June 2017 Concrete Structures Version: 2.1 RTD: 1016-1:2017 Status: Final
structural components can be included in the finite element model but special attention is needed since spurious high stress concentrations can occur due to the finite element discretization. These high stress concentrations can result in premature, numerical failure that is not present in the real structure. To avoid stress concentrations due to loading, the load can be replaced by a distributed load over the area of the load plate. This approach assumes that the load plate is highly compliant; for instance a rubber block. Alternatively, a no-tension/no-friction interface could be used between the plate and the concrete, thus reducing local stress concentrations. If the objective of the analysis is to study the behavior of the loading and/or support in detail, then the relevant part of the structure should be modeled and analyzed in detail.
loading and support points, the support and load plates should be modeled such that local stress concentrations are reduced.
2.9.2 Symmetry
In case of a symmetrical structure with symmetrical loading, it could be decided to model only half or a quarter of total the structure by applying the proper symmetry boundary conditions. Although this can reduce the computational costs, applying symmetry inherently assumes that the failure mode is symmetric which is not correct in most cases.
Using the symmetry of the structure and the loading should be used with care.

Rijkswaterstaat Centre for Infrastructure
Guidelines for Page: 49 of 69 Nonlinear Finite Element Analysis of Issued: 15 June 2017 Concrete Structures Version: 2.1 RTD: 1016-1:2017 Status: Final
3 ANALYSIS
3.1 Loading Sequence
A clear loading sequence plan should be motivated. This plan could include several loading sequences to be applied on the same finite element model. The loading sequence plan should follow for instance the Eurocode 2, that considers different loading combinations for the Ultimate Limit State and the Serviceability Limit State verifications. An example of such an loading sequence plan, including one load combination of actions of a bridge in the Netherlands, looks like:
Load step
Load Factor Remark
1 Dead weight &
prestress 1.0
Each load step can be divided in substeps, load increments, according to the adopted coefficients for the combination, frequent, quasi-permanent value of variable action. The occurrence of cracking and convergence issues might also influence the increments.
2 Permanent 1.0
3 Concentrated
variable Qk 1.0
3 Distributed variable qik
1.0
4 Permanent 0.15
5 Concentrated
variable Qk 0.15
6 Distributed variable qik
0.15
7 Concentrated 0.1
The loading sequence should always contain initial load steps where dead weight, permanent loads, and, if appropriate, prestressing are applied to the structure. The loading sequence will depend on the limit state and on combinations of actions to be considered.

Rijkswaterstaat Centre for Infrastructure
Guidelines for Page: 50 of 69 Nonlinear Finite Element Analysis of Issued: 15 June 2017 Concrete Structures Version: 2.1 RTD: 1016-1:2017 Status: Final
variable Qk
8 Distributed variable qik
0.1
9 Concentrated
variable Qk 0.3375
10 Distributed variable qik
0.3375
Notes: The load factors up to step 8 are based on the Dutch code. The total load factor after step 9 and 10 for the variable loads is 1.5875 which is the product of 1.25 and 1.27. For factor 1.27 see section 4.2.1.
3.2 Load Incrementation
The load increment that would lead to the first crack can easily be determined with a linear-static analysis. Subsequent load increments should be determined using an automated procedure such as the method based on the number of iterations of the previous step(s), the method based on external work, or any other method that takes into account the changing stiffness in the structure.
The load for which the failure mechanism is studied should be applied incrementally with increments that are approximately 0.5 times the load increment that would lead to the first crack. The load incrementation can be done manually but the preferred method is to apply a load incrementation method based on a measure of nonlinearity.
3.3 Equilibrium Iteration
A nonlinear analysis will, in general, result in an unbalance force between the internal or restoring forces and the external forces (loads). Using an iterative procedure, the unbalance force will be cancelled out and the
Equilibrium between internal and external forces should be achieved iteratively using a Newton-Raphson method with an arc-length procedure.

Rijkswaterstaat Centre for Infrastructure
Guidelines for Page: 51 of 69 Nonlinear Finite Element Analysis of Issued: 15 June 2017 Concrete Structures Version: 2.1 RTD: 1016-1:2017 Status: Final
internal and external forces become in equilibrium. The Newton-Raphson method is the most commonly used procedure to perform the equilibrium iteration and sufficiently accurate and efficient. The method can be applied with an updated stiffness matrix at all iterations or with an update of the stiffness matrix at the initial iteration only. For stability reasons, the load increment during the iterations needs to be adjusted using an arc-length procedure that allows the simulation to continue beyond a local or global maximum in the load-deflection response.
3.4 Convergence Criteria
The Newton-Raphson iteration method needs at least one criterion at which equilibrium has been achieved. In general, the unbalance force will not be reduced exactly to zero but instead a tolerance has to be set at which convergence is achieved. The criterion is often a norm of the unbalance force vector, the incremental displacement vector or a norm based on energy. The convergence criterion is often enhanced with a pre-defined maximum number of iterations to avoid excessive number of iterations. The latter, however, should not be considered a convergence criterion. There is no consensus on the tolerance that has to be used, but for the type of analyses for which these guidelines are intended the following tolerances are suggested.
A suitable convergence criterion has to be used for determining equilibrium. Preferably an energy-norm together with a force-norm should be used; a norm based on displacements only should be avoided.

Rijkswaterstaat Centre for Infrastructure
Guidelines for Page: 52 of 69 Nonlinear Finite Element Analysis of Issued: 15 June 2017 Concrete Structures Version: 2.1 RTD: 1016-1:2017 Status: Final
Convergence criterion based on Tolerance
Norm of the unbalance force 0.01
Energy norm 0.001
Load increments in which at least one of the two norms is satisfied can be considered as converged. Load increments which do not fully comply the convergence criteria might be still admissible, provided that they are followed by converged load increments and a plausible explanation for the temporarily non-convergence is provided.

Rijkswaterstaat Centre for Infrastructure
Guidelines for Page: 53 of 69 Nonlinear Finite Element Analysis of Issued: 15 June 2017 Concrete Structures Version: 2.1 RTD: 1016-1:2017 Status: Final
4.1 Serviceability Limit State (SLS)
For the load level corresponding to the SLS, derived from the SLS combinations imposed by the current codes, the following checks must be performed:
1. Stress state control 2. Crack opening control 3. Deflection control
For verifications 1. and 3., the values of stress and inflection can be directly read from the nonlinear finite element analysis and compared with the limit values imposed by the current codes. The procedures to calculate the crack opening, to be compared with the limit values imposed by the codes, is presented below.
In case of bending cracks the crack opening w shall be calculated as:
srsw
max,
where s
is the average strain value of the longitudinal reinforcement in
the cracked zone coming from the analysis and max,r
s is the maximum crack
spacing (see 2.4.3.1), see Figure below.
As requested by the current codes (EC2, MC 2010) Serviceability Limit State verifications must be performed as post-analysis checks.
4 LIMIT STATE VERIFICATIONS

Rijkswaterstaat Centre for Infrastructure
Guidelines for Page: 54 of 69 Nonlinear Finite Element Analysis of Issued: 15 June 2017 Concrete Structures Version: 2.1 RTD: 1016-1:2017 Status: Final
w
sr,max
Figure 18 Crack spacing and crack opening
In case of shear cracks the crack opening shall be calculated as:
stirrupssw
where stirrups is the average strain value of the stirrups in the cracked zone
coming from the analysis and s is the spacing between inclined “fully
open” cracks (see 2.4.3.1), see Figure below.
s
w
z
y
Figure 19 Inclined crack spacing and crack opening
In case of plain concrete the crack opening shall be calculated as:
hw 1

Rijkswaterstaat Centre for Infrastructure
Guidelines for Page: 55 of 69 Nonlinear Finite Element Analysis of Issued: 15 June 2017 Concrete Structures Version: 2.1 RTD: 1016-1:2017 Status: Final
where 1 is the principal tensile strain coming from the analysis and h is
the crack-band width (see 2.4.1.7).
4.2 Ultimate Limit State (ULS)
As requested by the current codes ULS verifications must be performed in order to obtain a design resistance to be compared with the design loads applied to the structures. The fib Model Code 2010 proposes three different methods to obtain the design resistance from nonlinear finite element analyses: the Global Resistance Factor method (GRF), the Partial Factor method (PF) and the Estimate of Coefficient of Variation Of resistance method (ECOV). Application of safety formats involves one or two analyses with material properties as given in the following sections and summarized in Table 1and Table 2 in Annex A.
4.2.1 Global Resistance Factor Method (GRF)
Mean mechanical properties of materials, derived from the characteristic mechanical properties (see 2.3.1), must be input in the analysis. The “mean” (see Model Code 2010) mechanical properties are calculated as follow:
ckGRFcmff 85.0
,
ykGRFymff 1.1
,
According to this method, which is also included in the Eurocode 2, the global resistance of the structure is a random variable. The effects of various uncertainties are integrated in a global design resistance and can be expressed by a global safety factor.

Rijkswaterstaat Centre for Infrastructure
Guidelines for Page: 56 of 69 Nonlinear Finite Element Analysis of Issued: 15 June 2017 Concrete Structures Version: 2.1 RTD: 1016-1:2017 Status: Final
)06.065.1( eff
ymyk
The other concrete parameters can then be derived from cmf via standard
relations. The global safety coefficient is equal to the product of the safety and the model coefficient:
27.106.12.1 GL
(Note that the ratio 1.27/0.85 equals the concrete partial safety coefficient
of c=1.5 and that the ratio 1.27/1.1 equals the steel partial safety
coefficient of s=1.15). The design resistance Rd is taken as the design value of the ultimate load calculated as:
GL
u
dd
PPR
where Pu is the ultimate load obtained from the analysis by inputting “mean” mechanical properties.
4.2.2 Partial Safety Factor Method (PF)
Design mechanical properties of materials, derived from the characteristic mechanical properties (see 2.3.1), must be input in the analysis. The design mechanical properties are calculated as follow:
C
ck
cd
ff
C
ctk
ctd
ff
S
yk
yd
ff
According to this method the basis variables are deterministic quantities so that this method separates the treatment of uncertainties and variabilities originating from various causes by means of design values assigned to variables.

Rijkswaterstaat Centre for Infrastructure
Guidelines for Page: 57 of 69 Nonlinear Finite Element Analysis of Issued: 15 June 2017 Concrete Structures Version: 2.1 RTD: 1016-1:2017 Status: Final
)06.065.1( effymyk
wherec
is the concrete partial safety coefficient equal to 1.5, s
is the steel
partial safety coefficient equal to 1.15. The other concrete parameters can
then be derived from cdf via standard relations.
The ultimate load Pu obtained from the analysis by inputting the design mechanical properties is already the design resistance Rd.
udPR
The nonlinear analysis is now derived with extremely low strength parameters. This may therefore cause deviations in structural response, e.g. in failure mode. For this reason it is not advised to base conclusions only on the PF method.
4.2.3 Estimation of Coefficient Of Variation of Resistance Method (ECOV)
Two nonlinear finite element analyses must be performed by inputting measured (or mean) mechanical properties of materials and characteristic mechanical properties of materials. The design resistance Rd is than calculated as:
RRD
mu
d
PR
,
where m,uP is the ultimate load obtained from the analysis by inputting
mean measured mechanical properties, RD is the model uncertainty
coefficient equal to 1.06 and R is calculated as follows: RVR
Re
According to this method an estimate of mean and characteristic values of resistance shall be calculated using corresponding values of material parameters. The random distribution of resistance of reinforced concrete members can be described by a two parameter lognormal distribution, therefore this method is based on the assumption of a lognormal distribution identified by two random parameters: the mean resistance and the coefficient of variation VR.

Rijkswaterstaat Centre for Infrastructure
Guidelines for Page: 58 of 69 Nonlinear Finite Element Analysis of Issued: 15 June 2017 Concrete Structures Version: 2.1 RTD: 1016-1:2017 Status: Final
8.0R
with the reliability index, 8.3
and the coefficient of variation,
ku
mu
RR
RV
,
,ln
65.1
1
where ku
R,
is the resistance equal to the ultimate load obtained from the
analysis by inputting characteristic mechanical properties.

Rijkswaterstaat Centre for Infrastructure
Guidelines for Page: 59 of 69 Nonlinear Finite Element Analysis of Issued: 15 June 2017 Concrete Structures Version: 2.1 RTD: 1016-1:2017 Status: Final
5 REPORTING OF RESULTS Thoroughly planning a finite element analysis reduces risks of errors and time and thus costs. Also, results of a finite element analysis should be reported in a standard fashion to reduce time and costs associated with review and archiving of an analysis. Generally accepted requirements for technical reports, like the consistent use of figure and table captions, consistent referencing to figures, tables, appendices and other reports, an effective structuring in sections and appendices should be followed strictly. More information on performing and reporting results of a finite element analysis can be found in publications of NAFEMS; see for instance (Baguley and Hose 1994; Baguley and Hose 1994; Baguley and Hose 1994; Beattie 1995; Baguley and Hose 1997). Note that NAFEMS also introduced the Professional Simulation Engineer (PSE) Certification. This certification incorporates an extensive range of competencies. When reporting a finite element analysis, the analysis report should contain at least:
1. Specification. The specification should include, but is not limited to, a. The objectives of the analysis. b. The type of analysis. c. The software used; version and date of the release.
2. Model Preparation and Checking. Model preparation and checking should include, but is not limited to,
a. Consistent usage of units. b. Material models and parameters. c. Type, number, and if appropriate, the integration scheme of elements; a
plot of the finite element mesh; if available and appropriate, you can use “shrink plots” of a FEM mesh to display finite elements more distinctly.
d. Description and plot of the boundary conditions and loading, including details of loading areas and locations.
e. Miscellaneous data necessary to reanalyze the model if necessary. f. Outcomes of basic model verification test; e.g. by using symmetric test
loadings or presenting eigen modes. g. In case the behavior of the used materials models are not obvious, like is e.g.
the case for models with advanced lateral effects, a report with the analysis results of single element tests with well defined strain paths is strongly recommended, see section 5.3.
An example check list is given in section 5.1.
3. Analysis. A finite element program usually produces some sort of log file with information about the model, the time used, and the warnings and error messages. Provide information about:
a. Information about the model (type, number of degrees of freedom). b. The loading scheme and schedule.

Rijkswaterstaat Centre for Infrastructure
Page: 60 of 69 Guidelines for Issued: 15 June 2017 Nonlinear Finite Element Analysis of Version: 2.1 Concrete Structures Status: Final RTD: 1016-1:2017
c. Time used for the analysis (only if significant). d. The condition of the stiffness matrix by comparing the ratio between
smallest and largest diagonal terms (if given). e. Discuss warnings issued by the program and motivate why these can be
ignored. f. The convergence behavior; preferably iteration and variation of the norm in
a graphical fashion. g. The number of cracking points, crushing points, and yield points at the most
significant points in the loading history.
An example results check list is given in section 5.2. 4. Validation. The analysis validation is the part of the analysis report where the
analyst discusses the simulation results. A discussion includes but is not limited to: a. A plot of the displacement fields for the most relevant load cases. b. Stress fields, and history data of significant points in the structure. c. A comparison of the results of the analysis with the expected outcome; for
instance based on an analysis of a simplified model or a sectional analysis. d. Discussion of the validity of the results both in qualitative and quantitative
sense.
5. Post-analysis checks. The results of the analysis should be checked to assess the possibility of a different, and sometimes more dangerous, failure mode such as shear failure. The analysis results should be checked for:
a. Regions where the minimum strain of concrete is less than -3.5 ‰. b. Regions with fully open cracks. c. Estimating crack width from crack strain and equivalent length. d. Checks for possible shear failure, especially when beam or shell elements
are used. e. Plasticity in the reinforcements. Maximum plastic strains in the
reinforcements.
Possibly an additional analysis based on mean values of mechanical properties for concrete and steel can be reported.

Rijkswaterstaat Centre for Infrastructure
Guidelines for Page: 61 of 69 Nonlinear Finite Element Analysis of Issued: 15 June 2017 Concrete Structures Version: 2.1 RTD: 1016-1:2017 Status: Final
5.1 Finite element analysis input check list The following table can be used as the input check list (Baguley and Hose 1994).
COMMENTS analysis type units constants extent of model coordinate system major dimensions material data element type integration scheme mesh density mesh quality (e.g. aspect ratios of distorted elements)
elements missing internal edges supports constraints symmetry constraints load cases

Rijkswaterstaat Centre for Infrastructure
Page: 62 of 69 Guidelines for Issued: 15 June 2017 Nonlinear Finite Element Analysis of Version: 2.1 Concrete Structures Status: Final RTD: 1016-1:2017
5.2 Finite element results check list The following table can be used as the results check list (Baguley and Hose 1994).
COMMENTS warnings system conditioning convergence behavior displacement history cracking history crushing history yielding history reactions
deformations
deformed shape plots
stresses
stress continuity discussion of results post-analysis checks

Rijkswaterstaat Centre for Infrastructure
Guidelines for Page: 63 of 69 Nonlinear Finite Element Analysis of Issued: 15 June 2017 Concrete Structures Version: 2.1 RTD: 1016-1:2017 Status: Final
5.3 Finite element model checks In order to verify the way in which the finite element software used operates and applies the theoretical model implemented in the software, simple checks are suggested. These checks shall be done on simple models such as one element tests. Below, as example, the mechanical model used to verify the way in which the software applies the interaction between tension and compression is shown. One plain concrete element is adopted. In a first load step the element is subjected to a tensile strain leading to fully open cracks along y direction (uy(1)) and to the lateral Poisson effect (ux(1)). In a second load step the element is subjected to a lateral compressive strain (ux(2)).
ux (1)
uy (1)uy (1)
ux (1)
ux (2)
ux (2)
The compressive stress-strain curves and the reduction of the compressive stress trend can be than plotted (see also 2.4.1.5). Below these graphs are reported; each compressive stress-strain curve refers to different ratios between the tensile strain and the compressive strain applied.
-80
-70
-60
-50
-40
-30
-20
-10
0
-0.012 -0.01 -0.008 -0.006 -0.004 -0.002 0
x
(N/m
m2)
x
pure compression
0.2
0.6
1
1.5
2.5
4
6
0.0
0.2
0.4
0.6
0.8
1.0
1.2
0 2 4 6 8 10 12 14 16 18 20 22 24
lat/0
NLFEA
Similar tests can be performed to verify other multi-axial states, such as the biaxial compression.
uy(1) = tensile strain
ux(1) = Poisson effect = uy(1) ux(2) = compressive strain

Rijkswaterstaat Centre for Infrastructure
Guidelines for Page: 64 of 69 Nonlinear Finite Element Analysis of Issued: 15 June 2017 Concrete Structures Version: 2.1 RTD: 1016-1:2017 Status: Final
6 REFERENCES Baguley, D. and D. R. Hose (1994). How to - Get Started with Finite Element, NAFEMS. Baguley, D. and D. R. Hose (1994). How to - Plan a Finite Element Analysis, NAFEMS. Baguley, D. and D. R. Hose (1994). How to - Understand Finite Element Jargon, NAFEMS. Baguley, D. and D. R. Hose (1997). How To - Model with Finite Elements, NAFEMS. Bazant, Z. P. and B. H. Oh (1983). "Crack band theory for fracture of concrete." Materials and Structure, RILEM 93(3): 155-177. Beattie, G. A. (1995). Management of Finite Element Analysis - Guidelines to Best Practice, NAFEMS. Belletti, Beatrice, Damoni, Cecilia, Hendriks, Max A.N. (2011) "Development of guidelines for nonlinear finite element analyses of existing reinforced and pre-stressed beams" European J of environmental and civil engineering 15(9): 1361-1384 Belletti, Beatrice, Damoni, Cecilia, den Uijl, Joop A., Hendriks, Max A.N., Walraven, Joost C. (2013) "Shear resistance evaluation of prestressed concrete bridge beams: fib Model Code 2010 guidelines for level IV approximations" J. Structural Concrete 14(3):242-249. Belletti, Beatrice, Damoni, Cecilia, Hendriks, Max A. N., de Boer, Ane (2014) "Analytical and numerical evaluation of the design shear resistance of reinforced concrete slabs", J. Structural Concrete 15(3):317-330. de Boer, A., Hendriks, M.A.N., den Uijl, J.A., Belletti, B., Damoni, C. (2014) "Nonlinear FEA guideline for modelling of concrete infrastructure objects" in "Computational modelling of concrete strcutures", Vol 2, edited by Bicanic, N, Mang, H, Meschke, G, DeBorst R: 977-985. de Boer, A., Hendriks, M.A.N., van der Veen, C., Ensink, S.W.H. (2015) "Evaluation and progress of concrete girder nonlinear analysis by contests", NAFEMS World Congress 2015 inc. the 2nd International SPDM Conference | San Diego, CA, 21-24 June 2015. de Borst, R. and J. G. Rots (1989). "Occurrence of spurious mechanisms in computatinos of strain-softening solids." Eng. Comput. 6: 272-280. Cervenka, V., Pukl, R., Ozbolt, J., Eligehausen, R. (1995). Mesh Sensitivity Effects in Smeared Finite Element Analysis of Concrete Fracture, FraMCoS-2, ISBN 3-905088-13-4, pp. 1387-1396. Cervenka, J., Cervenka, V. (2010). On the uniqueness of numerical solutions of shear failure of deep concrete beams: Comparison of smeared and discrete crack approaches, Euro-C 2010, ISBN 9780415584791, pp. 281-290.

Rijkswaterstaat Centre for Infrastructure
Guidelines for Page: 65 of 69 Nonlinear Finite Element Analysis of Issued: 15 June 2017 Concrete Structures Version: 2.1 RTD: 1016-1:2017 Status: Final
Crisfield, M. A. (1984). Difficulties with current numerical models for reinforced concrete and some tentative solutions. Proc. INt. Conf. Computer Aided Analysis and Design of Concrete Structures, Pineridge Press, pp/ 331-358.
Feenstra, P. H. (1993). Computational aspects of biaxial stress in plain and reinforced concrete, Ph.D. thesis, Delft University of Technology. Govindjee, S., G. J. Kay, et al. (1995). "Anisotropic modelling and numerical simulation of brittle damage in concrete." Int. J. Numer. Meth. Engrg. 38: 3611-3633. Hordijk, D. A. (1991). Local approach to fatigue of concrete, Ph.D. thesis, Delft University of Technology. NAFEMS Professional Simulation Engineer (PSE) Certification, www.nafems.org/pse Nakamura H, Higai T. (2001). "Compressive fracture energy and fracture zone length of concrete." In: Shing P, Tanabe T, editors. "Modelling of inelastic behaviour of RC structures under seismic loads". American Society of Civil Engineers; 2001. p. 471-487. Oliver, J. (1989). "A consistent characteristic length for smeared cracking models." Int. J. Numer. Meth. Engrg. 28( ): 461-474. Rots, J. G. (1988). Computational modelling of concrete fracture, Ph.D. thesis , Delft University of Technology.
Vecchio F.J., Collins M.P. (1993) “Compression response of cracked reinforced concrete”, J. Str. Eng., ASCE 119, pp. 3590-3610.
Hsu T.T.C., Mo Y.L. (2010) “Unified theory of concrete structures”, John Wiley and Sons, Ltd, Publication.
(Dutch) Standards and publications of Rijkswaterstaat (RWS) Guidelines for Nonlinear Finite Element Analysis of Concrete Structures, RTD 1016-1:2017 Validation of the Guidelines for Nonlinear Finite Element Analysis of Concrete Structures - Part: Overview of results, RTD 1016-2:2017, 2017, RWS GPO, Utrecht, Nederland Validation of the Guidelines for Nonlinear Finite Element Analysis of Concrete Structures - Part: Reinforced beams, RTD 1016-3A:2017, 2017, RWS GPO, Utrecht, Nederland Validation of the Guidelines for Nonlinear Finite Element Analysis of Concrete Structures - Part: Prestressed beams, RTD 1016-3B:2017, 2017, RWS GPO, Utrecht, Nederland Validation of the Guidelines for Nonlinear Finite Element Analysis of Concrete Structures - Part: Slabs, RTD 1016-3C:2017, 2017, RWS GPO, Utrecht, Nederland

Rijkswaterstaat Centre for Infrastructure
Page: 66 of 69 Guidelines for Issued: 15 June 2017 Nonlinear Finite Element Analysis of Version: 2.1 Concrete Structures Status: Final RTD: 1016-1:2017
CEB-FIP Model Code 90, 1993. Eurocode 2, “Design of concrete structures-Part 1-1: General rules and rules for buildings”, EN 1992-1-1:2004. fib Model Code for Concrete Structures 2010, (2013), Ernst & Sohn. NEN-EN 1990+A1+A1/ C2:2011 nl. Eurocode: Basis of structural design (in Dutch). NEN-EN 1990+A1+A1/ C2:2011/NB:2011 nl. National Annex to NEN-EN 1990+A1+A1/C2: Eurocode: Basis of structural design (in Dutch). NEN-EN 1991-2+C1:2011 nl. Eurocode 1: Actions on structures - Part 2: Traffic loads on bridges (in Dutch). NEN-EN 1991-2+C1:2011/NB:2011 nl. National Annex to NEN-EN 1991-2: Eurocode 1: Actions on structures - Part 2: Traffic loads on bridges (in Dutch). NEN-EN 1992-2+C1:2011 nl. Eurocode 2: Design of concrete structures - Concrete bridges - Design and detailing rules (in Dutch). NEN-EN 1992-2+C1:2011/NB:2011 nl. National Annex to NEN-EN 1992-2+C1 Eurocode 2: Design of concrete structures - Concrete bridges - Design and detailing rules (in Dutch). NEN 8700:2011 nl. Assessment of existing structures in case of reconstruction and disapproval - Basic Rules (in Dutch). NEN 8701:2011 nl. Assessment of existing structures in case of reconstruction and disapproval – Actions (in Dutch). ROK, Richtlijnen Ontwerp Kunstwerken, ROK 1.3 definitief, RTD 1001:2015, RWS GPO, Utrecht, Nederland RBK, Richtlijn Beoordeling Kunstwerken, RBK 1.1 definitief, RTD 1006:2012, RWS GPO, Utrecht, Nederland

Rijkswaterstaat Centre for Infrastructure
Guidelines for Page: 67 of 69 Nonlinear Finite Element Analysis of Issued: 15 June 2017 Concrete Structures Version: 2.1 RTD: 1016-1:2017 Status: Final
Annex A: Material input values and design resistance for Safety Formats
Table 1: Concrete input values for Safety Formats
fc [MPa] fct [MPa] Ec [MPa] ν GF
2mm
Nmm Gc
2mm
Nmm
Mean measured fff ckcm * 32
3.0 ckctm ff concrete grades ≤C50
))(1.01ln(12.2 fff ckctm
concrete grades > C50
*31
010
cm
cci
fEE
MPaEc 215000
variable
18.0073.0 cmF fG
Fc GG 250 Characteristic fff cmck ctmctk ff 7.0min,
31
010
ck
cci
fEE 18.0
073.0 ckF fG
Mean GRF ckGRFcm ff 85.0, 32
,, 3.0 GRFcmGRFctm ff concrete grades ≤C50
GRFcmctm ff ,1.01ln12.2
concrete grades >C50
31
,
010
GRFcm
cci
fEE 18.0
,073.0 GRFcmF fG
Design cckcd ff cctkctd ff min, 31
010
cd
cci
fEE 18.0
073.0 cdF fG
*Mean measured values of concrete strength and Young’s modulus can alternatively be taken as specified in a reference document

Rijkswaterstaat Centre for Infrastructure
Page: 68 of 69 Guidelines for Issued: 15 June 2017 Nonlinear Finite Element Analysis of Version: 2.1 Concrete Structures Status: Final RTD: 1016-1:2017
Table 2: Reinforcement input values for Safety Formats
fy [MPa] ft [MPa] εy
Mean measured ymf
tmf symym Ef
Characteristic ymyk
fvf 65.1exp yktk
fAf sykyk
Ef
Mean GRF ckGRFymff 1.1
,
GRFymGRFtkfAf
,,
sGRFymGRFymEf
,,
Design sykyd ff ydtd
fAf sydyd Ef
ν coefficient of variation ranging from 0.05 to 0.1; 6.0v is assumed to be a good intermediate value:
ymymyk
fff 9057.006.065.1exp
A Ratio of the measured ultimate strength and the measured yield strength: ymtm
ffA
Table 3: Design resistances for safety formats
GRF method ECOV method Partial factor method
RdR
GRFm
d
frR
,...)(,
Where: 2.1R and 06.1
Rd ,
,...mm
frR , ,...kk
frR
RRd
m
d
RR
with:
RRR
V exp and 8.0 , 8.3 ,
k
m
RR
RV ln
65.1
1
,...dd
frR
,...)(m
fr ,...)(,GRFm
fr , ,...k
fr , ,...d
fr represent nonlinear analyses with mean, mean GRF, characteristic and design material properties respectively

Rijkswaterstaat Centre for Infrastructure
Guidelines for Page: 69 of 69 Nonlinear Finite Element Analysis of Issued: 15 June 2017 Concrete Structures Version: 2.1 RTD: 1016-1:2017 Status: Final