guidelines for integrated risk assessment and management
TRANSCRIPT

XA9846400
IAEA-TECDOC-994
lilllllilll I00 •s
Guidelines forintegrated risk assessment and
management inlarge industrial areas
Inter-Agency Programme on the Assessment andManagement of Health and Environmental Risks from
Energy and Other Complex Industrial Systems
Jointly sponsored by
IAEA
|ga , UNIDO
UNEP UNIDO WHO
29-17
IAEAJanuary 1998

The IAEA does not normally maintain stocks of reports in this series.However, microfiche copies of these reports can be obtained from
IN IS Clearinghouse
International Atomic Energy AgencyWagramerstrasse 5P.O. Box 100A-1400 Vienna, Austria
Orders should be accompanied by prepayment of Austrian Schillings 100,-in the form of a cheque or in the form of IAEA microfiche service couponswhich may be ordered separately from the INIS Clearinghouse.

1AEA-TECDOC-994
Guidelines forintegrated risk assessment and
management inlarge industrial areas
Inter-Agency Programme on the Assessment andManagement of Health and Environmental Risks from
Energy and Other Complex Industrial Systems
UNLDOJointly sponsored by
IAEA UNEP UNiDO WHO
wn M
INTERNATIONAL ATOMIC ENERGY AGENCY 0 ^

The originating Section of this publication in the IAEA was:
Safety Assessment SectionInternational Atomic Energy Agency
Wagramerstrasse 5P.O. Box 100
A-1400 Vienna, Austria
GUIDELINES FOR INTEGRATED RISK ASSESSMENT ANDMANAGEMENT IN LARGE INDUSTRIAL AREAS
IAEA, VIENNA, 1998IAEA-TECDOC-994
ISSN 101-M289
© IAEA, 1998
Printed by the IAEA in AustriaJanuary 1998

FOREWORD
Industrial development is essential to raise the standard of living in all countries. Thisrequires the building of refineries, power stations and other large industrial complexes.However, human health can be affected, directly or indirectly, by routine discharges of wastefrom industrial installations. The environment is adversely affected by emissions from powerstations and the accumulation of industrial wastes. Releases of toxic materials can havedisastrous effects on both health and the environment. A series of major industrial accidents inthe 1970s and 1980s highlighted the need for better management of risks in routine industrialoperations and from accidents.
Past efforts to cope with these risks, if any, have been largely piecemeal. Some plantsare well equipped to manage environmental hazards while others are not. Some riskmanagement studies have concentrated on occupational hazards and some on threats to theenvironment such as pollution, while others concentrated on contingency planning for majoraccidents. Very few have considered all risks.
If risks can be assessed and managed on a comprehensive basis, then scarce resourcescan be deployed more effectively and industrial development can be facilitated. Developingcountries, in particular, have much to gain from adopting a sound approach to management ofthe risks associated with industrial development.
The IAEA, the United Nations Environment Programme (UNEP) within the framework ofthe Awareness and Preparedness for Emergencies at Local Level (APELL), the United NationsIndustrial Development Organization (UNIDO) and the World Health Organization (WHO) decidedin 1986 to join forces in order to promote the use of integrated area wide approaches to riskmanagement An Inter-Agency Programme, which brings together expertise in health, theenvironment, industry and energy, all vital for effective risk management, was established.
The Inter-Agency Programme on the Assessment and Management of Health andEnvironmental Risks from Energy and Other Complex Industrial Systems aims at promotingand facilitating the implementation of integrated risk assessment and management for largeindustrial areas. This initiative includes the compilation of procedures and methods forenvironmental and public health risk assessment, the transfer of knowledge and experienceamongst countries in the application of these procedures and the implementation of anintegrated approach to risk management. The purpose of the Inter-Agency Programme is todevelop a broad approach to the identification, prioritization and minimization of industrialhazards in a given geographical area.
The UN organizations sponsoring this programme have been involved for several yearsin activities aimed at assessment and management of environmental and health risks, preventionof major accidents and emergency preparedness. These Guidelines have been developed on thebasis of experience from these activities, to assist in the planning and conduct of regional riskmanagement projects. They provide a reference framework for the undertaking of integratedhealth and environmental risk assessment for large industrial areas and for the formulation ofappropriate risk management strategies.

This report has been developed over a number of years with contributions from a largenumber of authors. It was reviewed in detail during an International Workshop in Tel Aviv, Israel,18-22 November 1991, held specifically to review the Guidelines. It was subsequently restructured,revised augmented as recommended at the Tel Aviv meeting. On 12-16 September 1994 an IAEATechnical Committee Meeting was called to review experience obtained in the use of the draftguidelines and to make final revisions to thereport. Representatives from Croatia, Egypt, Finland,Greece, India, Israel, Latvia, Netherlands, Philippines, Russia, Switzerland and the United Kingdomattended the September 1994 meeting.
EDITORIAL NOTE
In preparing this publication for press, staff of the IAEA have made up the pages from theoriginal manuscripts as submitted by the authors. The views expressed do not necessarily reflectthose of the IAEA, the governments of the nominating Member States or the nominatingorganizations.
Throughout the text names of Member States are retained as they were when the text wascompiled.
The use of particular designations of countries or territories does not imply any judgement bythe publisher, the IAEA, as to the legal status of such countries or territories, of their authoritiesand institutions or of the delimitation of their boundaries.
The mention of names of specific companies or products (whether or not indicated asregistered) does not imply any intention to infringe proprietary rights, nor should it be construedas an endorsement or recommendation on the part of the IAEA.
The authors are responsible for having obtained the necessary permission for the IAEA toreproduce, translate or use material from sources already protected by copyrights.

CONTENTS
1. INTRODUCTION 1
1.1. Background 11.2. Purpose of guidelines and areas of application 11.3. The concept of integrated risk assessment and management 21.4. Nature of health and environmental risks 3
1.4.1. Types and sources of risk 31.4.2. Targets of risk 31.4.3. Dimensions of health and environmental risk 5
2. PROJECT PROPOSAL AND MANAGEMENT PLAN 6
2.1. Outline of the project process 62.2. Project planning 6
2.2.1. Procedural steps 62.2.2. Formulating the objectives and project proposals 92.2.3. Area study problem formulation 92.2.4. Selection of participating organizations 122.2.5. Necessary human, financial and other resources 132.2.6. Steering Committee 132.2.7. Implementation Committee 132.2.8. Working groups 142.2.9. Reporting 152.2.10. Evaluation 15
3. HAZARD IDENTIFICATION AND PRIORinZATION 17
3.1. Factors to be considered in the selection of the study area 173.2. Basic information on the area 173.3. Inventory of possible hazards 17
3.3.1. Types of activities to be considered 173.3.2. Basic information on activities 21
3.4. Hazard identification and prioritization 213.4.1. Hazards from accidents and other abnormal occurrences 223.4.2. Normal operation 263.4.3. Setting priorities for further analysis 29
3.5. Selection of hazards for further analysis 33
4. ANALYSIS AND ASSESSMENT OF CONTINUOUS EMISSIONS FROMFDCED FACILITIES 34
4.1. Introduction 344.2. Identification of sources, types and quantities of emissions 34
4.2.1. Data reporting protocols 384.2.2. Data sources 394.2.3. Compilation of US emission factors 40

4.2.4. Emission standards for energy facilities in OECD countries 404.3. Establishing environmental transfers of pollutants
to sensitive receptors 504.4. Environmental dispersion models 54
4.4.1. General types of models . 554.4.2. Atmospheric dispersion models 564.4.3. Aquatic dispersion models 574.4.4. Food chain models 60
4.5. Estimates of dose-response relationships 614.5.1. Background 614.5.2. Kinds of exposures: Dose-response implications 634.5.3. Kinds of effects: Implications for dose-response 654.5.4. Data sources and their implications 664.5.5. Deriving the dose-response relationship 664.5.6. Levels of aggregation: Population at risk 674.5.7. Uncertainty 684.5.8. Guidance note 69
4.6. Assessment of continuous emission impacts to the environment 694.6.1. Endpoints 704.6.2. Assessment methods 70
5. ANALYSIS OF ACCIDENTS FROM FKED FACILITIES 72
5.1. Overview 725.2. Hazard identification at the plant level 77
5.2.1. Introduction 775.2.2. Objectives 785.2.3. System description 785.2.4. Initiating event selection and establishment of plant response 785.2.5 Grouping and screening of initiating events 79
5.3. Modeling of accident scenarios 795.3.1. Event tree analysis 805.3.2. Binning of accident sequences in plant damage states 82
5.4. Consequence analysis for accidental emissions 825.4.1. Introduction 825.4.2. Site topography and population distribution 835.4.3. Flammable releases 845.4.4. Toxic releases 875.4.5. Consequence assessment 895.4.6. Mitigating effects 90
5.5. Estimation of the frequency of accidents 915.5.1. Introduction 915.5.2. Event definition 915.5.3. Direct frequency assessment of accident sequences • • • - 925.5.4. System analysis 925.5.5. Human errors 955.5.6. Data requirements 955.5.7. Accident sequence quantification 97

5.6. Risk estimation and risk assessment 995.6.1. The combination of consequence and frequency to produce risks . . . . 995.6.2. Individual risk 1005.6.3. Societal risk 1015.6.4. Assessment of resultant risk levels 101
6. ASSESSMENT OF TRANSPORTATION RISK 103
6.1. Overview and scope of application 1036.2. Analysis and assessment of transportation risk
and environmental and land use safety factors 1046.2.1. Overview 1046.2.2. Mandatory routing factors 1046.2.3. Environmental and land use safety factors 1066.2.4. Subjective routing factors 1086.2.5. Guidance implementation 112
6.3. An example of the analysis and assessment of thetransport operational and traffic factors for a road route 1146.3.1. Traffic volume and composition 1146.3.2. Carriageway level of service 1146.3.3. Structural and geometric adequacy of roads 1146.3.4. Number of traffic signals 1156.3.5. Travel time and travel speed 1156.3.6. Availability of alternative emergency route 115
6.4. Transport operational costs and operation requirements 1166.5. Pipeline transport 117
7. ANALYSIS OF HAZARDOUS WASTES 118
7.1. Introduction 1187.2. Categorization of wastes 1187.3. Hazardous wastes 127
7.3.1. Why are wastes different? 1277.3.2. What are hazardous wastes? 128
7.4. Identification and assessment of waste generation systems 1287.4.1. Identification 1297.4.2. Assessment of waste practices and controls 130
7.5. Conclusions 131
8. RISK MANAGEMENT 132
8.1. Introduction 1328.1.1. General introduction on risk management 1328.1.2. Presentation of project results 132
8.2. Area risk management 1348.2.1. Introduction 1348.2.2. Decision criteria 1348.2.3. Decision analysis 135

8.2.4. Decision making 1378.3. Area action plans 138
8.3.1. Introduction 1388.3.2. Preventive measures 1398.3.3. Risk reducing measures 1468.3.4. Emergency preparedness 148
9. REVIEW AND DEVELOPMENT OF LEGISLATION 149
9.1. Legislation about major hazards 1499.1.1. Policy 1499.1.2. Review of legislation 1499.1.3. United Kingdom 1499.1.4. Netherlands 1529.1.5. Belgium 1539.1.6. Republic of Ireland 1539.1.7. Italy 1539.1.8. Luxembourg 1539.1.9. Germany 1539.1.10. France 1549.1.11. Switzerland 1549.1.12. The United States of America 1559.1.13. International organizations 155
9.2. Legislation about environmental impacts 1569.2.1. Policy 1569.2.2. Review and development of legislation 157
REFERENCES 159
APPENDK I. GUIDELINE ON CONTENT OF REGIONAL RISKMANAGEMENT PROJECT PLAN 163
APPENDIX H. ENVIRONMENTAL GUIDELINES 165
APPENDIX m. STEPS AND TECHNIQUES FOR HAZARD
IDENTTFICATION 177
APPENDK IV. MODELS FOR MAJOR HAZARD INCIDENTS 183
APPENDIX V. BACKGROUND ON DECISION CRITERIA 209
ANNEX I. THE COUNCIL DIRECTIVE (82/501/EEC AND AMENDMENTS87/216/EEC, 88/610/EEC) ON THE MAJOR-ACCIDENT HAZARDS OFCERTAIN INDUSTRIAL FACILITIES 217
ANNEX H. AWARENESS AND PREPAREDNESS FOREMERGENCIES AT LOCAL LEVEL (APELL) 229

ANNEX m. FIRE PREVENTION AND PROTECTION 249
ABBREVIATIONS 259
CONTRIBUTORS TO DRAFTING AND REVIEW 261
1. INTRODUCTION
1.1. BACKGROUND
There is worldwide a growing awareness and concern of governments, communities and industryabout the risks to people and the environment from the location and operation of hazardous andpolluting industries, including those involved in the production of energy. The identification,assessment and management of health and environmental risks are now recognized as essentialelements for orderly economic and social development.
Three important emerging issues are particularly significant:
- The need to optimally allocate resources in the health and environmental risk managementprocess. That is, the need to prioritize all relevant risks and to direct management strategiestowards achieving the highest benefits from the resource expenditures in the risk control andmanagement processes.
- The need to ensure that all elements of health and environmental risks are considered: risks topeople and to the environment; risks from continuous emissions as well as those from accidents;risks from the operation of fixed installations, as well as those associated with support activitiessuch as transportation and disposal of wastes.
- The importance of integrating all elements in the health and environmental risk managementstrategy: locational, technical, organizational, legislative, social and economic. These elementsare complementary and cannot be considered in isolation.
These issues are particularly significant when dealing with an extended geographical area withconflicting demands and pressures for industrial development and urbanization.
Recognizing the importance of such needs the International Atomic Energy Agency (IAEA), theUnited Nations Environment Programme (UNEP) within the framework of the Awareness andPreparedness for Emergencies at Local Level (APELL) programme, the United Nations IndustrialDevelopment Organization (UNIDO) and the World Health Organization (WHO), have joined effortsto promote and facilitate the implementation of integrated risk assessment and management for largeindustrial areas. Such an initiative includes the compilation of procedures and methods for publichealth and environmental risk assessment and the transfer of knowledge and experience amongstcountries in the application of these procedures.
The integrated risk assessment approach is based on the notion that all health andenvironmental risks within an area should be systematically identified, analyzed and assessed in sucha way that rational choices can be made about which risks should be reduced, weighing the social andeconomic costs of such risks, and the costs of risk reduction.
The integrated risk management approach is based on the notion that all options of riskmanagement: locational, preventive, mitigative, protective and institutional should be explored suchthat the resources committed in the safety management process are utilized in the most effective way.
1.2. PURPOSE OF GUIDELINES AND AREAS OF APPLICATION
The main purpose of these guidelines is to provide practical guidance and a reference frameworkfor the undertaking of integrated health and environmental risk assessment studies and for theformulation and implementation of co-ordinated health and environmental management strategies forlarge industrial areas, including those that accommodate energy producing facilities. This purpose is

achieved by presenting an outline of the methodologies and procedures to enable an appreciation ofthe techniques and processes involved. It is noted that there are already a number of publishedguideline documents dealing with various aspects of health and environmental risk assessment. It isnot the aim to duplicate these documents. The integrated risk assessment approach, however,necessitates a cumulative approach for all emission sources, over the entire cycle of production for anumber of industries and associated operations including transportation and waste generation. Theintegrated risk management approach also necessitates the formulation of overall co-ordinatedstrategies involving multi-dimensional elements including technical, locational, social and economicconsiderations. These aspects require specialized methodologies. These guidelines therefore refer toexisting documentation where appropriate, but in addition provide specialized guidance to address theintegrated risk assessment approach on an area-wide basis.
The methods and techniques of integrated health and environmental risk assessment andmanagement presented in these guidelines are best applied to geographical areas that accommodate anumber of industrial and related activities of a hazardous and/or polluting nature, also being areas ofsignificance in terms of social and economic developments. Two situations may apply: The study areamay include existing hazardous activities or it may be the subject of conflicting demands fordevelopments and environmental protection, particularly in terms of future land use planning. Withinthat context, major areas of applications include:
Assessment of existing health and environmental risks in a large industrial area including theprioritization of those risks that need to be managed or reduced;
• The formulation of integrated risk management strategies, including the prioritization ofimplementation measures and resources;Environmental planning of future industrial developments, population and land use safetyplanning and the formulation of appropriate assessment criteria to guide orderly economic andsocial developments;Transportation planning of hazardous substances;Licensing of hazardous and polluting industries;Emergency planning;Influencing institutional and legislative actions with respect to hazardous and pollutingindustries.
1.3. THE CONCEPT OF INTEGRATED RISK ASSESSMENT AND MANAGEMENT
Policy makers are often confronted with complex issues concerning economic and socialdevelopment, industrialization and associated infrastructure needs and population and land useplanning. Such issues have to be addressed whilst ensuring that public health will not be endangeredby continuous or accidental hazardous emissions, that important ecological systems will not bedisrupted and that land, water and air will not be irreversibly damaged for future generations. Onlydecisions made in such a way can support sustainable development of an area.
The case may also be mat serious risks to people and the environment already exist in aparticular area and that decisions have to be made about the prioritization of the risks to be reduced,consistent with available resources. Another important objective is to produce a well documenteddecision-making procedure, which gives the community insight into the hazards which were assessed,the risks to which they are exposed and the basis of the assessment process. Insight into the methodsby which risks were identified, estimated and assessed increases the opportunity for a rationaldiscussion and acceptance of the recommended risk management strategy by the community. Ad hocdecisions, on the other hand, which consider only some of the risks, neglecting others, may lendthemselves to opposition. The policy-making process may also be ill-founded if certain risks areignored. Many accidents and environmental catastrophes could likely have been avoided with a broaderand more thorough approach to risk assessment and management.

Although the integrated risk assessment and management approach necessitates the considerationof all risks, the level of detail in such considerations may vary depending on pre-assigned priorities.The methods for setting risk priorities for further analysis are described in subsequent sections of theguidelines.
A truly integrated risk assessment should take into consideration all forms of risks to all peoplein the given area. However, such a broad study would be too complex and is generally not practicalto be undertaken. Therefore, some limitations of the study are needed. These guidelines only considersome risks from some types of industrial activities. It depends on the particularities of a given areawhether this limitation is adequate or whether other risks are more important. The methodology whichis described in these guidelines is, in principle, also applicable for other risks, although different datawould be needed.
Integrated risk management also necessitates efficient co-ordination between all the differentparties involved in the risk management process: government, industry and community. Co-ordinationbetween the various government institutions involved in risk management is also essential. Liaison andco-ordination should preferably be formalized at an early stage of the risk assessment study processand continued as an integral part of developing the safety management strategy and its implementation.The question of risk communication is extremely important and it is essential that those not familiarwith the concept of risk and its assessment are properly informed.
1.4. NATURE OF HEALTH AND ENVIRONMENTAL RISKS
1.4.1. Types and sources of risk
Most human activities and many natural phenomena are possible sources of risk. Although thereis no single authoritative source of acceptable definitions of the terminology used in risk assessment,it is widely accepted that the term "risk" implies the consideration of the measure of some form of lossin terms of both the likelihood and magnitude of that loss. In the context of these guidelines, thefollowing constitute the most relevant types and sources of risk, see also Fig. 1.1, to be considered:
Continuous emissions to air, water and land from fixed installations, including those of anindustrial, commercial or residential nature are one type of hazard. Transportation systemsincluding motor vehicle emissions can also be considered to constitute a source of continuousemissions. Large-scale agricultural use of fertilizers, insecticides and herbicides have thepotential to contaminate groundwater, rivers, lakes and soils and can be considered a form ofcontinuous emission. Continuous emissions can also occur from waste disposal facilities.
• Accidental releases of materials from fixed installations have the potential to cause serious harmto the public and the environment. Serious accidents resulting from the transportation ofhazardous materials can also result in severe consequences for the public and the environmentIn this context, transportation includes the transfer of material by rail, road, pipeline and ship.Waste disposal facilities can also be subject to accidental releases.
• Natural hazards such as earthquakes, storms, flooding and volcanic eruptions can have a directimpact on human health and may also increase the likelihood of accidental releases from fixedinstallations and transportation systems. Natural hazards may therefore constitute an importantsource of risk to be considered in the assessment process.
1.4.2. Targets of risk
Targets of risks are, firstly, the people living in the study area under consideration. However,people outside the study area may also be at risk, due to transportation of contaminants through theair, by waterways or by contamination of agricultural products.

Health risk
Source
Routine or accidents
People at risk
Workers and public
Exposure
Short, medium or long term
Effects
Fatal and non-fatal(Immediate or delayed)
Environmental risk
Source
Routine or accidents
Effects
Duration
Short, medium or long term
Extent
Local, regional or global
FIG. 1.1. Categorization of health and environmental risk

Secondly, the ecological systems in the study area or within the influence sphere of the studyarea may be at risk. The extermination of one or two species may disrupt a whole ecological foodchain.
Thirdly, economic resources can be at risk. An accident at an industrial installation can destroyothers in its neighbourhood. Acid emissions may destroy forests, fisheries, historical buildings andmonuments, and pollution may have significant economic consequences to the tourist industry of anarea.
1.43. Dimensions of health and environmental risk
An integrated approach necessitates considerations of the different categories of risks and natureof impacts. Fig. 1.1 outlines the broad categories of risk to assess the health and environmental impactsof different industrial operations and associated activities.
In all cases it is necessary to assess (separately) both the risks to the environment and to humanhealth;Risks from routine operations should be differentiated from those from major accidents.
In relation to health impacts, occupational and public health risks should be treated separately.Two categories of risk apply as a result of direct or indirect impacts:
Fatal effects, either immediate (resulting from direct exposure or accidental situation) or delayed(resulting from chronic exposure to hazardous substances or due to latency period);
• Non-fatal effects (injuries, diseases) of either an immediate or delayed nature.
In relation to health and environmental risk, categorization of risks can be made on the basis ofextent: local, regional or global; and on the duration of the effect: short, medium or long term.
Some environmental effects are of such a long term nature that they are irreversible. Thecomplete destruction of vegetation and soil cover in certain mining operations is one such example;widespread loss of species in an area is another.

2. PROJECT PROPOSAL AND MANAGEMENT PLAN
2.1. OUTLINE OF THE PROJECT PROCESS
Fig. 2.1 shows the methods and procedures for health and environmental risk assessment andindicates where the relevant information for each stage can be found in these guidelines.
The study process may be divided into four broad components:
Step 1: Establishment of a Database for the Study Area and Prioritization of Activities forAnalysis. This includes the delineation of the study area, the identification of various landuses, nature and type of industrial and other activities, the identification of priorityactivities for analysis and the establishment of key environmental and safety issues. Aninitial hazard identification scheme in order to determine those facilities for further analysismay be adopted. A separate document has been produced by the IAEA [1] for theclassification and prioritization of risks from major accidents in process and relatedindustries, to aid mis process.
Step 2: Conduct of Health and Environmental Risk Analysis Studies. This includes.quantifiedrisk or hazard analysis (QRA) for major accidents, analysis of continuous emissions andquantification of environmental impacts from emissions into air and water, analysis ofhazardous waste generation and analysis of transportation related risks.
Step 3: Conduct of Infrastructure and Organizational Safety Analysis. This includes theanalysis and evaluation of emergency planning provisions, including prevention andprotection facilities off-she and on-site; environmental monitoring infra-structure in thearea; and the review and analysis of institutional and regulatory provisions.
Step 4: Formulation of Integrated Management Strategies with Associated Action Plans. Thisincludes the establishment of cost/benefit allocations for the various risk contributors andthe prioritization of implementation measures. The components of the risk managementstrategy should cover the technical, operational, organizational and locational aspects.
2.2. PROJECT PLANNING
There are a number of facets in which an integrated area-wide risk assessment project differsfrom other projects. Firstly, the number of parties involved is relatively large and therefore, adescription of the project and the organizational and management aspects thereof require particularattention. Usually, the project deals with complex issues that could be socially and politically sensitive.Debate may ensue as to the results of the assessment and the proposed risk managementrecommendations; extra care is therefore required in formulating both. The uncertainty associated withthe end results may be great, since assessment of the health and environmental risks relies on a numberof assumptions. Therefore the quantified results should be interpreted with care and all theuncertainties exposed. To ensure orderly and efficient progress of the study a number of proceduralsteps should be followed.
2.2.1. Procedural steps
The following procedural steps are suggested:
(a) The organization that intends to undertake the study should formulate the objectives and drafta project plan, including the timetable, and identify the required financial, human and otherresource requirements.
(b) The initiating organization should ensure that all the relevant industry and governmentorganizations are involved. These organizations should decide on the conditions under which

Project planning
Formulate objectivesSelection of ImplementationCommitteeCreate Working Groups
Section 2.2
Hazard Identificationand Prioritization
Area informationHazard inventoryHazard prioritization
Chapter 3
_LAnalyse and assessrisks of continuousemissions from fixedfacilities
Chapter 4
_LAnalyse and assessrisks from transportactivities
Chapter 6
Analyse and assessrisks from accidentsat fixed facilities
Chapter 5
Analyse and assessrisks from hazardouswastes
Chapter 7
Evaluate Study andprepare remedialaction plans
Chapter 8
FIG. 2.1. Methods and procedures for health and environmental risk assessment

they wish to participate and on whether the proposed objectives and the draft study plan requireany modifications to fit their needs. They should also decide on the practical forms in whichthey are prepared to participate, be it manpower, information sources or funds. Should anyadjustments applicable to the objectives of the study be made, joint agreement must be reachedby all the participating organizations. They may also establish a joint co-ordinating committee.Industry participation in these studies is seen as essential and every attempt should be made toensure the co-operation of industry from the outset. The participating organizations should puttheir decisions into effect, ensuring that the responsibilities and procedures are properly arrangedto monitor and evaluate the implementation process. They should evaluate, together orseparately, the results of their risk management policy, implemented on the basis of the resultsof the study.
(c) A Steering Committee for the project should be established by the participating organizations,specifying its responsibilities and terms of reference. For the execution of the project anImplementation Committee will assume responsibility.
(d) The Implementation Committee should formulate the project proposal into a detailed workingproject plan and establish working groups to carry out the various analyses. The working groupsshould undertake the various analyses associated with the project If external consultants arenecessary, the Implementation Committee should make tenders for the work and approvecontract awards.
(e) The Implementation Committee should accept, if necessary after some modification, the finalreport of the working groups and prepare its own covering report, including the conclusions andrecommendations.
(f) The participating organizations should receive the reports and decide on: (1) the finalconclusions and recommendations, (2) the policy changes to be implemented, and (3) which ofthe proposed actions should be carried out, including final prioritization and action plans forimplementation.
The organizational arrangements for such a study are shown in Fig. 2.2.
Steering Committee(representing sponsoring andparticipating organizations)
( 4 - 8 )
Implementation Committee(8 -12 , max. 16)
Working Groups(3-6 per group)
FIG. 2.2. Organizational arrangements for an integrated risk assessment study

2.22. Formulating the objectives and project proposals
In most cases, the main objective of the study is to formulate a completely integrated health andenvironmental risk management strategy for a complex industrial area based on cumulative assessmentof the health and environmental risks in that area. Emphasis placed on a definite objective (i.e. whetherin terms of assessment of particular types of risk or in the environmental or safety management ofparticular activities within the area) will vary, depending on the precise needs of the particular area.Other objectives directly or indirectly related to the main objective may also arise, includingdevelopment of methods and procedures for integrated risk assessment and management which couldbe applied to other regions in the country, development of local knowledge and capabilities in thefield, and review and refinement of institutional or legislative provisions in the country.
Appendix I outlines the main elements to be included in formulating a proposal for a regionalrisk management project. Such elements include:
A clear statement on the objectives of the study and its expected output and results.A description of the study area and the main safety, environmental, social and economic issuesof relevance to the study.
• A detailed description of all the activities to be undertaken.The financial, human, equipment and other resources needed to undertake the study.
• Organizational charts for project implementation, including management/co-ordinationresponsibilities and liaison mechanisms. The project description should stipulate the nature andtype of documentation that is to be produced during the course of the project, including progressreports, revised time schedules and budget reports (see Figs 2.3, 2.4, 2.5).
2.23. Area study problem formulation
It is obvious that the first step in performing a study is the most difficult and at the same timethe most important one. Thus, it could be very significant that the Implementation Committee at theearly beginning of the project development (before it is going to define purpose and objectives of theproject) makes certain efforts to define the scope of the project i.e. what is reasonably to be analyzedwithin the integrated area risk study: normal operation of industrial facilities (which means continuousemission to air, water and soil); accidents in the stationary industrial facilities (which means accidentalreleases in air, water and soil); emissions due to traffic; traffic accidents; problems related to wastemanagement (industrial waste, municipal waste, hazardous waste and soil, surface and ground waterpollution); hazardous materials transportation (railway, road, ship, pipeline); noise and odor, etc. Also,the types of risk to be assessed need clarification: health risk (individual or societal risk; risk to theworkers or to the public; mortality or morbidity risk; immediate or delayed); or perhaps environmentalrisk should be taken into consideration.
It is also important to define in advance (if possible) what kind of methodologies, i.e. computercodes will be applied and how many and what kind of databases should be established. Depending onthe choices between all these options made by the Implementation Committee the project goals andhuman, financial and other resources can be assessed and planned, as well as the provisional timeschedule and some milestones of the project preparation can be set. Of course, limited resources havea feedback to the already defined scope of the project. Balance between these two aspects is of highimportance for the further project development.
To make a proper decision related to the scope of the project, the results of previously performedstudies and analyses in the field should be available to the Implementation Committee. It is one of thebasic requirements which should be satisfied.

EstablishProjectObjective
DevelopInitialProjectPlan
DevelopOrganizationalStructure
DevelopInitial Work
Evaluate andPrioritize nWorkPackages
Develop WorkSchedules
AcquireResources
Develop FinalProject Plan
FIG. 2.3. Project planning
PlanProject
Review Adequacyof CurrentLegislation andControls
Conduct RiskAssessment andOther Health andEnvironmentalStudies
EstablishDesired Healthand
Goals andStandards
Review andEvaluateResults ofStudies
DevelopAction Planfor RemedialActions
Institute New, orChanges toexisting,Legislation andControls
ImplementOtherActionPlans
Develop New orImprovedEmergencyResponseMeasures
FIG. 2.4. Project management
10

JB. Jjam*_ Raiourc* N«m*« May I Jun I Jul I Aug I S»p I Pel | Nov I D w Jan l F i b l Mar 1 Apr 1 May I Jun 1 Jul TAuaTSapTOc
1
2
3
4
S
e7
8
0
10
I'I
12
13
14
IS
10
17
16
10
SO
21
22
Projtot Planning
8ttObJacth*i,Dafln*R*glon
D*v. Initial Pr«|«otPltn
Oav. Organization Glmeturo
Div.lnH.WorkPaelfflgai
SvaluatttndPitorMnWP*
O*v*lopProj*<X8oh*dul*
Idantliy Raqulrad Rttoureaa
0*v«top Final PreJaet Plan
StMnftQ COHIITV AppfOVIl
Conduct 8tudl«i
Conduct Trtnap. Rlik Studlaa
Conduct Watti Mngmt. etudlai
Conduct Air Pollution Studln
Conduct Cham. Plant StUdlM
Conduct HiaUhfitudlM
R*v4aw Adiquiey of Currant Ltgliltt.
Brtabllih Ooala and 8tand»rd»
Rtvltwand Eval. Study Roaulta
Oav. Ramadlal Actions Plan
Oiv. Bmitj. Rtapont* Plan*
Draft NawLtglal. and Control*
100d
1w
1w
8w
tw4w
2w
2w
2w
1w
200d
29ff
20V
20w
40w
22w
2»tf
20iw
8w
12W
20W
20w
A
A
Af
loam
ttam
A
8C
A
8C
W01
WO 2
WO 3
WO 4
WO 5
laam
ttam
taam.SC
taam
W01,WO 4
t*am
Zi implamantOtharAotlontPlana tttm
Project: ProJadTMaD«t»: 3/1B/94
Noncrlloat 1aummary
Critical V///////////fiZ%& Prograas
J MDastona •
RolladUp O
FIG. 2.5. Example of a regional risk management project schedule

2.2.4. Selection of participating organizations
There are three main factors that guide the selection of organizations for participating in thestudy: the objectives of the study, the required knowledge, expertise and statutory responsibility andthe necessary resources.
Because of the wide-ranging nature of the integrated risk assessment and management process,it is essential that all relevant organizations participate in the study. In all cases, both industry andrepresentatives from relevant government authorities must be involved.
For example, if a university or scientific institute without any legislative power is the initiatingorganization and all the legislative bodies refuse to participate, then only a risk assessment study withrecommendations on the risk management policy is possible. However, there is less chance of sucha policy actually being implemented.
SELECTION OF PARTICIPATING ORGANIZATIONS
FACTORS:Objectives of the studyExpertise, knowledge and statutory responsibilityResources
POSSIBLE PARTICIPATING ORGANIZATIONS:
Government authorities (at national, regional and local levels as applicable)Industrial organizationsUniversities, research institutesLabour organizationsEnvironmental/community groups
When a local or regional authority or a national ministry is the initiating organization, it usuallyhas the authority to implement the risk management policy for some forms of environmental andpublic health risk. The integrated approach, however, requires co-operation amongst several authorities;in particular those that are responsible for different forms of environmental and other legislation. Itis always necessary for local or regional authorities to co-operate in, or at least to be aware of theproject. Because of the size and importance of the project, it is often appropriate that one or morenational government authorities participate.
Another consideration is the contribution made by an organization in the form of finances, expertmanpower or information. Often large government authorities, industrial organizations and internationalorganizations can supply funds and manpower more easily. The necessary expertise usually resides inindustry. Important information sources are frequently only available from specific authorities and fromthose organizations which own the industrial installations, pipelines, ships, trains, etc. Therefore, it maybe necessary and fruitful to foster co-operation between those industrial organizations representing theindustries to be studied and government authorities. In such cases one or more representatives of theseorganizations or industries should also be members of the Implementation Committee. It may also beappropriate to involve local community or environmental groups in the project
Whilst there may be many reasons for involving a relatively large number of participatingorganizations in an integrated risk assessment and management study, it may be more appropriate tolimit the number of organizations with direct responsibility/participation to, say, four or sixorganizations, each of which makes substantial resource (e.g., financial, human) contributions.
Where more organizations are interested in the project than can be accommodated, theparticipating organizations and the implementation committee should keep them informed by means
12

of regular progress reports and by provision of the final report It may also be useful to organize adiscussion group in which all the organizations can participate.
2.2.5. Necessary human, financial and other resources
Only when the objectives and extent of the study project are defined, is it possible to provideestimates of the human, financial and other resources needed. Other requirements may includecomputers, software and environmental measuring and monitoring facilities. Human resources areusually more easily available from the participating organizations than from hired consultants and thisshould be encouraged in order to develop and extend their knowledge and capabilities. However, insome cases it may be necessary to hire external experts. The role of such experts should in all timesbe to advise personnel from the local participating organizations, rather than to undertake tasks inisolation, in line with the objective of expertise transfer.
Usually it is sufficient to have one or two modern personal computers or workstations available.Also, it is also not appropriate to purchase expensive measuring or monitoring equipment until the realneeds of the study have been determined. The risk assessment study itself should first show whatimportant gaps in knowledge exist and men define the priority requirements. If no data nor measuringequipment are available, the purchase or loan of some equipment may be justified in order to obtainsome objective data on the existing situation.
2.2.6. Steering Committee
The Steering Committee should be composed of senior-level representatives from allparticipating organizations. These individuals should have significant decision-making authority inareas such as policy formation, resource allocation and action plan implementation.
2-2.7. Implementation Committee
When the study project has been defined and the participating organizations, through theirSteering Committee, have approved its objectives and scope, and have made decisions concerninghuman, financial and other resources, then responsibility for the execution of the study falls on theImplementation Committee. Thereafter, the Implementation Committee should make all further routinedecisions and direct the course of the study. Interim reports should be regularly presented by theImplementation Committee to the Steering Committee.
All participating organisation^ especially those which contribute significant resources or valuableinformation, should be invited to take their place on the Implementation Committee. Therepresentatives should preferably be experts with wide experience. Leaders of working groups shouldalso be represented on the Implementation Committee.
The size of the Implementation Committee should not be too large. The optimum number iseight to twelve people, the maximum 16 people. The Implementation Committee should conveneregularly, perhaps, every 4-8 weeks, to supervise progress, to make decisions on questions that havearisen and to review the interim and final reports.
Selection of the members of the Implementation Committee should be done in such a way thatthe Implementation Committee can act with authority and expertise. The Steering Committee must beable to rely on the Implementation Committee for almost all the day-to-day decisions to be takenduring the course of the project. It should not be necessary for its members to consult theorganizations they represent before taking decisions. Therefore, the representatives should be givenample mandate by their organizations.
Further, the Implementation Committee must have sufficient experience and expertise amongstits members to be able to make a critical review of the work of the working groups and to formulate
13

THE IMPLEMENTATION COMMITTEE
SELECTION OF THE TEAM:• 8 - 1 2 people (optimum), 16 people (maximum)• Broad knowledge and experience
Includes leaders of working groups• Representatives of different interests
TERMS OF REFERENCE:
Overall responsibility for the day-to-day progress of the study tocompletionSteer the project in line with the objectives agreed by the SteeringCommitteeMake adjustments where necessaryEstablish and guide working groupsReview working group reportsPrepare final strategy with recommendationsEnsure appropriate consultations
practical conclusions and recommendations. Thus people with broad knowledge and experience in thefield of environmental sciences, technology, risk management and policy formulation should be mademembers of the Implementation Committee. External experts, i.e. those that do not belong to one ofthe participating organizations, may be asked to assist when only a few specialists are available withinthe participating organizations. The chairman of the Implementation Committee should be selected byconsensus. He/she does not necessarily have to be an expert in the field of environmental sciences, buthe/she should have some experience in leading major projects, chairing committees and formulatingconclusions and recommendations.
The Implementation Committee should also have a secretary with some knowledge of theenvironmental sciences, with experience in taking minutes of complex meetings and in writing draftconclusions and reports. The secretary is charged with most of die practical work attached to thecommittee meetings.
2.2.8. Working groups
The analysis and assessment of different issues should be carried out by one or more workinggroups under the guidance of the Implementation Committee. For example, separate working groupsmay be established to undertake analysis of continuous emissions, the risk of accidents, legislativeprovisions, etc. The whole study, considered as a system, can often be divided into sub-studies matcan be carried out by different working groups in their own specific operations. Possible subdivisionsof the study are reflected in the various sections of this manual, but other forms of subdivision of thetotal study are also possible.
When subdividing the work of the main study into sub-studies with a view to allocate specifictasks to the different working groups, data collection should be organized as efficiently as possible inorder to avoid the same information sources being collected by more than one working group.
The working groups should consist of technical experts in the particular fields required by thespecific study. There is a wide range of expertise required for the specific sub-studies, e.g.
14

environmental sciences, biology, ecology, chemistry, chemical engineering, mechanical engineering,civil engineering, toxicology, epidemiology, safety science and risk analysis, meteorology, physicalplanning, economy, legislation, administration, political sciences, etc.
Each working group should consist of three to six people. If more experts are needed, they canbe consulted by the working group on an ad hoc basis. The working group itself should remain small,to be able to work informally and efficiently. Larger topics of work, requiring more manpower andexpertise should be further subdivided by the Implementation Committee, so that they can be carriedout by working groups of the size of three to six people.
2.2.9. Reporting
The Implementation Committee is responsible for the execution of the study and should reporton the final results. Such a report should also contain the conclusions and recommendations to bediscussed and agreed upon by the participating organizations at the end of the study. Interim progressreports from the Implementation Committee should only be required for very large and complexstudies. The writing and discussion of such progress reports involve time and resources which maybe better spent on the main study and the final report. The Implementation Committee briefs theworking group(s) on the various steps of the study. The tasks of each working group should be dividedinto well-defined steps which are then reported step-by-step to the Implementation Committee. Suchreporting does not always have to be done through formal progress reports; in most cases, it may besufficient to have the main progress points written down. The general progress report can be made byway of verbal presentation to the Implementation Committee. The purpose of such progress reportsis to brief the members of the Implementation Committee on the activities that have been carried outby the working groups and of the direction the study is taking. All changes from the main project planand all the preliminary decisions of the working group on questions that have arisen during the courseof the study must be reported on, since it is the Implementation Committee that has to decide on thesematters.
The progress reports of the working groups can be used as building blocks for the draft finalreport. In principle, the working groups are responsible for writing the draft final report of theiractivities, together with the appropriate recommendations. The Implementation Committee evaluatesthe final report and writes its own covering report with a short account of the main steps of the studyand its own conclusions and recommendations.
The covering report of the Implementation Committee should be short. It should refer to the finalreport for all details, but should contain the main conclusions and recommendations of theImplementation Committee, to be approved by the Steering Committee.
For complex studies with several working groups and final reports, the ImplementationCommittee has to decide if it will collect these reports and send them with a covering report of theconclusions and recommendations to the Steering Committee, or if it will send each report togetherwith its own separate covering report, with, possibly, an additional integrated final report of theImplementation Committee at the end of all sub-studies.
22.10. Evaluation
Three forms of evaluation are recommended for an area-wide integrated risk assessment study.During the course of the study, the Implementation Committee should evaluate whether the workcarried out by the working groups and by itself is in agreement with the stated objectives of the study.
The second form of evaluation relates to the results of the integrated risk assessment as a basisfor formulating an integrated risk management strategy. In this case, the evaluation should focus onwhether the results of the assessment process have provided the relevant basis for formulatingmanagement policies and strategies.
15

The third form of evaluation relates to the total resources committed to the study and itssubsequent risk management policy development. This evaluation should preferably be carried outsome time after the implementation of the policy. It can lead to a new, improved and adapted cycleof the whole study process, placing more emphasis on certain points which were not covered wellenough by the study or which need to be updated.
16

3. HAZARD IDENTIFICATION AND PRIORTITZATION
3.1. FACTORS TO BE CONSIDERED IN THE SELECTION OF THE STUDY AREA
The crucial first step in an area-wide risk assessment and management project is the delineationof an appropriate study area. The appropriate basis for area selection will depend on the particularcircumstances of each case. The study area is defined as the area where the emissions from theindustrial area may significantly affect human health and the environment Although absolute rules forchoosing a study area cannot be given, experience on the dispersion of pollutants through differentmedia will help to define the study area. Several factors should be considered:
The study area should be selected for its physical and industrial/economic characteristics,although administrative and national boundaries may be used if necessary.
• Strict boundaries should not be drawn before the initial hazard analysis is completed, as the areawhich may be affected will not have been identified.
• Transport systems for the movement of hazardous materials should only be considered withinthe study area.
• Some risk sources will have potential for effects well beyond the immediate area. In certaincases consideration should be given to see if the analysis needs to take account of local effectsand separately of wider regional effects.
• Community concern may also be a factor to be considered.
3.2. BASIC INFORMATION ON THE AREA
Background information on the study area is normally required. The desirable set of informationincludes:
(i) General Environmental Quality
• Air - Average and high concentrations of SO2, NOX, CO, TSP (total suspended particulates)and other pollutants of concern in industrial, urban and rural areas;
• Water - General water quality including drinking water;• Soil - Deposits of acid, nitrates, fluorides, heavy metals.
(ii) Geographical and-Socio-economic Information
• Demography, population density and distribution;• Main transportation routes;• Topography;• River systems and other waterways;• Climatic and meteorological data;• Actual and intended land use and zoning;• General location of industrial facilities.
It should be noted that the listing in (i) and (ii) above is by way of indicative examples and isby no means exhaustive.
3.3. INVENTORY OF POSSIBLE HAZARDS
33.1. Types of activities to be considered
The following list, which is by no means exhaustive, gives an indication of the types of activitieswhich should be considered for inclusion in the initial identification stage of the study.
17

Agricultural Activities: intensive agricultural operation involving the use/application ofchemicals and/or generation of significant quantities of problem wastes.
Biochemicals, Biotechnology and Pharmaceuticals: production and storage of biochemicalsand pharmaceuticals is of concern as some of the materials used are highly biologically active and maybe hazardous to people and other organisms. Combustion products may also be harmful. Chlorine,sulphur and solvents may be present in sufficient quantities to pose a hazard.
Defence: storage, manufacture and transport of ammunition, explosives, fuels, etc., and specialtransport systems including pipelines need to be considered.
Explosives and Fireworks: storage, handling and processing of industrial explosives,pyrotechnical devices and fireworks.
Food and Drink:
- Refrigeration plants in the food industry may use ammonia;- Distilleries will have flammables;- Breweries;- Edible oil processing (use of hexane);- Food processing (use of sulphur dioxide, formaldehyde, solvents);- Dust explosions (flour, sugar).
Gas Works: the main hazards here are those of explosions, fires and toxicity.
- Coal gas production;- LNG facilities;- Gas distribution stations.
Manufacturing: manufacturing activities where the principal materials are not by themselveshazardous, such as brickworks and glassworks, but may involve the storage of significant quantitiesof fuel, the utilization of solvents and cleaning materials which are hazardous.
- Metal works (carbon monoxide, NOX);- Paint (hydrocarbons);- Brick works (fuel, fluorides);- Glass works (fluorides);- Shipyards (gases, acids).
Metal Production:
Steel (CO, NOX
- Aluminium (fluorides, cyanide wastes);- Non-Ferrous Metals (solvents, trace metal emissions).
Mining, Quarrying, Other Extraction and Primary Processing: the main hazards areexplosions, fire, air pollution, waste, use of explosives.
Oil;Gas;Coal;Metal;
- Non-metallic Minerals.
18

Other Nuclear:
- Processing/reprocessing plant;- Accelerators;- Irradiation plants (radioactive materials);- Industrial uses;- Medical uses.
Petrochemicals and Chemicals: This category includes many products and processes such asdistillation, halogenation, sulphurization. Some examples:
- Oil refineries;- Plastics (ethylene, vinylchloride, acrylonitrile);
Solvents;- Biocides;- Fertilizer production (ammonia, ammonium nitrate, NO,, hydrogen);- Acids, alkalis;- Detergents;- Bulk chemical production;- Ammonia production;- Chlorine production.
Pipelines: liquids, gases and possibly slurries (crude oil, gasoline, chlorine, ethyleneoxide).
Power Generation and Distribution: Electric generation systems are based on:
Coal/peat;Oil;Gas;
- Nuclear;Biomass (wood, wastes);
- Hydroelectricity;Wind;
- Solar energy.
SO, and NOX emissions are of concern in case of fossil fuel or biomass fuelled power plants. Alsodusts and wastes containing heavy metals can form a hazard. Many plants store chlorine for theconditioning of cooling water. Radiological hazards are primarily connected with nuclear power plants,but should also be considered for fossil fuel plants.
Transformer/Switchyards: where transformer oils containing PCBs are involved they also couldrepresent a source of hazards.
Research Facilities: handling hazardous materials in significant quantities. Also natural orgenetically engineered organisms, bacteria and viruses are of concern.
Storage: bulk and packaged storage of flammable, toxic and explosive gases, liquids and solidsincluding materials with potential for production of toxic combustion products or dust explosions intanks, silos, warehouses, etc. For example:
Bulk fuel;- Grain/flour silos (possibility of dust explosions);- Biocides;- Plastics (combustion products).
19

PETROCHEMICALS, CHEMICALS AND RELATED INSTALLATIONS
1. (a) Installation for the production of organic or inorganic chemicals using for thispurpose, in particular:- alkylation- amination by ammonolysis- carbonylation- condensation- dehydrogenation- esterification- halogenation and manufacture of halogens- hydrogenation- hydrolysis- oxidation- polymerization- sulphonation- desulphurization, manufacture and transformation of sulphur-containing
compounds- nitration and manufacture of nitrogen-containing compounds- manufacture of phosphorus-containing compounds- formulation of pesticides and of pharmaceutical products
(b) Installation for the processing of organic and inorganic chemical substances, usingfor this purpose, in particular:- distillation- extraction- sulphonation- mixing
2. Installations for distillation, refining or other processing of petroleum or petroleumproducts.
3. Installations for the total or partial disposal of solid or liquid substances by incinerationor chemical decomposition.
4. Installations for the production or processing of energy gases, for example, LPG, LNG .
5. Installations for the dry distillation of coal or lignite.
6. Installations for the production of metals or non-metals by a wet process or by meansof electrical energy.
Transportation of Hazardous Materials: trucks, trains and ships with hazardous materials passoften through densely populated areas. Transfer sites have often large quantities of such materialspresent. Road, rail, water (sea-going and internal), including transfer, marshalling yards, terminals,harbour facilities, isocontainer storage.
Waste Treatment and Disposal: hazardous wastes may be present at unsuspected wastetreatment facilities. The waste can generate flammable gases.
20

- Landfill (methane, seepage of materials into ground water);- Chemical, physical, thermal, etc., treatment of wastes, incinerators;- Ships, tank cleaning, etc. (remaining contents of tanks, cleaning liquids);
Waste water treatment (methane, hazardous liquids transported accidentally from a chemicalplant).
Water Treatment: potential for bulk storage/use of water treatment chemicals, especiallychlorine.
33.2. Basic Information on Activities
In order to be able to identify possible hazards of the activities listed in the previous section,one must obtain information of a general nature for each activity:
(a) Fixed Facilities
- General description of the nature of activities at the site;- Nature, type and quantity of substances being used (as main input and as auxiliary materials),
processed, stored (including transportation vessels) and produced;- What kind of materials are produced as waste, air emissions and water emissions: average and
maximum quantities;Main methods of waste treatment and disposal;
- Transport of materials in and out (including pipelines);- Number and type of transportation vessels with hazardous materials;- Surrounding land use (activities, main roads and dwelling areas).
(b) Transport of Hazardous Materials
The UN list of hazardous materials can be used as the basis information to identify transportedhazardous materials. Identify the main modes and routes of transportation, if possible also mainorigins and main destinations. Road, rail, barge, ship, pipelines and conveyors as well as maintransfer facilities should be considered. Special attention should be given to chlorine, ammonia,LPG and other liquified flammable gases; toxic gases; flammable liquids and gases.
3.4. HAZARD IDENTIFICATION AND PRIORITIZATION
In some situations it may be possible, and more expedient, to use the procedures described inthe manual for the Classification and Prioritization of Risks from Major Accidents in Process andRelated Industries [1]. The methods and procedures outlined in the Manual apply to the risks of majoraccidents with off-site consequences from fixed installations handling, storing and processinghazardous materials; and transport of hazardous materials by road, rail, pipelines and inland waterways.The types of risk being considered are risk of fires, explosions and releases of toxic substances to thepublic outside the boundaries of hazardous installations. The risk to workers (occupational risk) andthe risk of accidents to the natural environment are not included. With the information collected in theprevious steps an initial hazard identification can be carried out. For this the form as shown in Table3.1. should be filled in for each activity and for each hazard aspect The hazard aspects are dividedinto two main categories: hazards from accidents and other abnormal occurrences and hazards fromnormal operation. The subcategories of hazard are: acute fatalities, long term health effects, propertydamage and major economic damage, biophysical damage through the media air, water or soil.
For each entry one of the following labels should be given: "yes", "no", or "maybe".Guidance for the factors to be considered for these choices is given hereafter.
The basic principles for initial hazard identification and prioritization of activities for furtheranalysis are:
21

• Select the main activities for hazard analysis based on the quantity of hazardous materialshandled, stored or transported. The criteria for quantities can be based on the listing of notifiableinstallations in the Directive of the Council of the European Communities (see Annex I) and onthe threshold quantities specified, e.g., in the Dutch Labour Directorate (see Table 3.3.)
• Prioritize activities for further analysis based on the location of selected hazardous activitiesrelative to populated areas. The basis is a distance vs. quantity tabulation and a hazard indexapproach described in section 3.4.3.
3.4.1. Hazards from accidents and other abnormal occurrences
(a) Acute Fatalities
The total quantity of each hazardous material at the facility under investigation or in onetransport unit is taken into account. It should be noted that for nuclear facilities an assessment givingall the information required should be made available separately. Nuclear facilities will not thereforeneed to be considered in the initial hazard identifications process.
Step 1. If the quantity is equal or greater man the quantity prescribed in the CEC Directive, use label"yes"; otherwise label "no". Annex I outlines the relevant information of the CEC Directive.If "no", proceed to Step 2.
Step 2. Use a simplified classification based on the Dutch Labour Directorate threshold quantityvalues for different substances.
Flammable substances > 10 000 kg• Explosive substances > 1 000 kg• Toxic substances: based on LCS0
Toxic substances: use 'ERPG0, IDUf\ TLV3).
Table 3.2 provides the relationship between the threshold quantity and LC^. Examples of toxicsubstances and threshold quantities are given in Table 3.3. A list of toxic substances derived from theEmergency Response Planning Guidelines is provided in Table 3.4.
If the quantity of substance is equal or greater than the threshold quantity from above, label"yes", otherwise label "no", in doubt "maybe".
(b) Health Effects
If specific categories of materials such as carcinogens, mutagens, teratogens, asbestos,combustion products are present use label "yes", otherwise, "no".
(c) Property Damage and Economic Loss
If the following type of losses might occur fill in label "yes"> otherwise "no".
- Structural damage/loss including corrosive and other effects on paints etc.;- Contamination;- Infrastructure loss/costs;
ERPGJ): Emergency Response Planning Guidelines [2].IDLH2): Immediately Dangerous to Life or Health [3].TLV3): Threshold Limit Values, see publications on national occupational limits.
22

TABLE 3.1. INITIAL HAZARD IDENTIFICATION
Facility/Activity HAZARDS DUE TO ACCIDENTS AND OTHERABNORMAL OCCURRENCES
AcuteFatalities
Long-TermHealth
PropertyDamage
Biophys.Air, Water, Land
HAZARDS FROM NORMAL OPERATION
Long-TermHealth
Biophys.Air, Water, Land

TABLE 3.2. MODEL CALCULATION OF THRESHOLD QUANTITY OF TOXIC SUBSTANCES
LC50 IHI-rat, 1 hmg/m3
LC < 20 (4h)
20 , LC< 100
100 <LC< 500
500 <LC< 2000
2000 <LC< 20000
LC> 20.000
Physical conditionat 25°C
not applied
gasliquid HVliquid (MV)liquid (LV)solid
gasliquid (HV)liquid (MV)liquid (LV)solid
gasliquid (HV)liquid (MV)liquid (LV)solid
gasliquid (HV)liquid (MV)liquid (LV)solid
not applied
Threshold quantityKg
1
31030
too300
3010030010003000
3001000300010000
- *)
300010000
- *)- *)- *)
-
HV = high volalility, 25 C < boil.pl < 50 CIMI = initial hazard identificationMV = medium volatility, 50 C < boil.pt < 100 CLV = low volatility, boil.pt > 100 C•) Because of (he combination of (he dispersion possibilities and (lie acute toxicity no threshold quantity is determined.

TABLE 3.3. EXAMPLES OF TOXIC SUBSTANCES AND THRESHOLD QUANTITIES USEDIN THE HAZARD INDEX SYSTEM
Substance
Acrolein
Acrylonitrile
Aldicarb
Ammonia
Arsine
Azinphos-methyl
Hydrogenbromide
Chlorine
Hydrogenchloride
Chromic acid
Hydrogencyanide
Dichloroethane l\2-
Dichlorovos
Dieldrin
Diethyl-s-ethionylmethyl-fosfoTtnioaat/O.O-
Diethyl-s-(ethyhhiomethyl)-thiofosfaat
Dimefox
Ethylchloroformiate
Ethyleneoxide
Fluor
Hydrogenfluoride
Formaldehyde
Phosphine
Phosgene
Furan
Methylchloroformiate
Methylisocyanate
Mevinphos
Threshold Quantity(Kg)
300
-
1
3000
30
300
3000
300
3000
1000
100
-
1
1
1
1
1
3000
3000
30
300
300
30
3
100
300
1
1000
Toxicity-Data
LG»: 109.7 mg/m3 IH
LC«- 1 hour between3 g/m3 and 5 g/m3
LD» ORL-RAT = 1 mg/kg
Le»: 11590 mg/m3 IH
LC«: 369 mg/m3 IH
Le»: 69 mg/m3 IH
LC»: 2858 ppm/lH
LCM: 293 ppm/lH
LCj«: 3124 ppm/lH
LC«: 0.35 g/m3 1H
Le»: 163 mg/m3 IH
LCJO: 28 g/m3 1H
LC*: 15 mg/m3 4H
Le«,: 3.8 mg/m3 IH
LO» ORL-RAT= lmg/kg
Lu» ORL-RAT = 250 ug/kgof body mass
LD» ORL-RAT= 1 mg/kg
LC»: 145 ppm/lH
LCj,: 10.95 g/m3 1H
LC»: 185 Rjm/IH
LC»: 1276 ppm/lH
LCJO 1-hour between 600 and1000 mg/m3
LC»: 361 mg/m3 IH
LC«: 38 mg/m3 IH
Le»: 120 mg/m3 IH
LCJO: 88 ppm/lH
LC». 5 ppm/4H
LCj,: 14 Rpm/1H
Boiling Point°C
53
77
indep.
-33
-55
solid
-67
-34
-85
>100
26
84
indep.
indep.
indep.
indep.
indep.
93
11
-188
20
-21
-88
8
31
71
indep.
solid
25

TABLE 3.3. (cont)
Substance
Monocrotofos
Oxamyl
Ozon
Parathion
Pentaboraan
Phoraat
Promurit
Nitrogendioxide
Nitrogenmonoxide
Nitrogentrifluoride
Sulfurylfluoride
TCDD
TEPP
Tetraethyllead
Triethylenemelamine
Sulphurdioxyde
Carbonsulphide
Hydrogensulphide
Sulphuric acid
Threshold Quantity(Kg)
3000
3000
1
1000
1
1
1
30
300
-
3000
1
1
10000
1
3000
-
300
-
Toxicity-Data
LC50: 162 mg/m3 1H
LC»: 170 mg/m3 1H
LCs<,: 4.8 ppm/4H
Le«: 210 mg/m3 1H
Le«: 7 ppm/4H
L u » ORL-RAT = 1 mg/kg
L u » ORL-RAT = 0,28 mg/kg
LO»: 220 mg/m3 1H
LCjo.- 924 mg/m3 1H
LC»: 6700 ppm/lH
LG*,: 3020 ppm/lH
L u » ORL-RAT = 22,5 ug/kg
LO» ORL-RAT = 0,5 mg/kg
LC»: 850 mg/m3 1H
LDJO ORL-RAT = 1 mg/kg
LC«: 5.14 g/m3 1H
A concentration of 20.5 g/m3
during 1 hour no lethality
LC»: 898 mg/m5 1H
LC»: 3.6 g/m3 1H
Boiling Point°C
125
solid
indep.
375
indep.
indep.
indep.
-21
-152
-129
-55
indep.
indep.
>100
indep.
-10
-60
280
- Factors of strategic significance, crucial plant loss;- Crops and stock losses;- Social dislocation.
(d) Biophysical Damage (Air/Water/Soil)
If the following type of damage could occur fill in label "yes", otherwise "no", in doubt"maybe".
- Possible destruction of large quantities of animals, plants or destruction of whole species;- Possible serious disruption or destruction of eco-systems;- Presence of materials such as biocides, PCBs, heavy metals;
Possibility of crude oil spills etc.
3.4.2. Normal Operation
For normal operation the hazards are mainly caused by the regular emission of the hazardousmaterials to the air and water and by the disposal of wastes.
26

TABLE 3.4. EMERGENCY RESPONSE PLANNING GUIDELINES, REF.[2]: TOXICSUBSTANCES
ERPGs according to AIHA [2]
CHEMICAL
Acrolein
Acrylic acid
Allyl chloride
Ammonia
Benzyl chloride*
Bromine
1,3-Butadiene
n-Butyl acrylate**
n-Butyl isocyanate*
Carbon disulfide
Carbon tetrachloride**
Chlorine
Chlorine trifluoride**
Chloroacetyl chloride
Chloropicrin
Chlorosulfonic acid
Chlorotrifluoroethylene
Crotonaldehyde
Diketene
Dimethylamine
Epichlorohydrin
Ethylene oxide*
Formaldehyde
Hexachlorobutadiene
Hexafluoroacetone**
Hydrogen chloride
Hydrogen cyanide*
Hydrogen fluoride
Hydrogen sulfide
Isobutyronitrile
Methyl alcohol*
Methyl chloride**
ERPG-1
0.1 ppm
2 ppm
J ppm
25 ppm
1 ppm
0.2 ppm
10 ppm
0.05 ppm
0.01 ppm
1 ppm
20 ppm
1 ppm
0.1 ppm
0.1 ppm
NA
2mg/m 3
20 ppm
2 ppm
1 ppm
1 ppm
2 ppm
NA
1 ppm
3 ppm
NA
3 ppm
NA
5 ppm
0.1 ppm
10 ppm
200 ppm
NA
ERPG-2
0.5 ppm
50 ppm
40 ppm
200 ppm
10 ppm
1 ppm
50 ppm
25 ppm
0.05 ppm
50 ppm
100 ppm
3 ppm
1 ppm
1 ppm
02 ppm
10 mg/m3
100 ppm
10 ppm
5 ppm
100 ppm
20 ppm
50 ppm
10 ppm
10 ppm
1 ppm
20 ppm
10 ppm
20 ppm
30 ppm
50 ppm
1000 ppm
400 ppm
ERPG-3
3 ppm
7$0 ppm
300 ppm
1000 ppm
25 ppm
5 ppm
5000 ppm
250 ppm
1 ppm
500 ppm
750 ppm
20 ppm
10 ppm
10 ppm
3 ppin
30 mg/m3
300 ppm
50 ppm
50 ppm
500 ppm
100 ppm
500 ppm
25 ppm
30 ppm
50 ppm
100 ppm
25 ppm
50 ppm
100 ppm
200 ppm
5000 ppm
1000 ppm
27

TABLE 3.4. (cont).
CHEMICAL
Methyl iodide
Methyl mercaptan
Monomethylamine
Perfluoroisobutylene
Phenol
Phosgene
Phosphorus pentoxide
Sulfur dioxide
Sulfuric acid (Oleum, sulfurtrioxide and sulfuric acid)
Tetrafluoroethylene
Titanium tetrachloride
Trimethylamine
Vinyl acetate
ERPGs according
ERPG-1
25 ppm
0.005 ppm
10 ppm
NA
10 ppm
NA
5 mg/m3
0.3 ppm
2 mg/m3
200 ppm
5 mg/m3
0.1 ppm
5 ppm
to AIHA [2]
ERPG-2
50 ppm
25 ppm
100 ppm
0.1 ppm
50 ppm
0.2 ppm
25 mg/m3
3 ppm
10 mg/m3
1000 ppm
20 mg/m3
100 ppm
75 ppm
ERPG-3
125 ppm
100 ppm
500 ppm
0.3 ppm
200 ppm
1 ppm
100 mg/m3
15 ppm
30 mg/m3
10 000 ppm
100 mg/m3
500 ppm
500 ppm
NA
Set 8 (under consideration by AIHA)Set 9 (under consideration by AIHA)not applicable
(a) Health Effects
Air: Major pollutant gases such as SOX, NOX, CO, O3, NH3, HCL, hydrocarbons,carcinogens such as benzene, benzo(a)pyrene, toluene, fluorine, H2S, dusts, particulatesand fumes, CFCs and radioactive materials;
- Water: Biocides, heavy metals, phosphates, acids, nitrates, fertilizers, carcinogens, radioactivematerial;
- Waste: Hazardous waste disposal.
If such emissions or waste are produced by the activity fill in the label "yes" for this entry,otherwise "no".
(b) Property Damage
- Stock and crop loss including forests and fisheries;- Acid gas damage to buildings and monuments;- General quality of life, such as recreational activities (loss of access to beaches, fishing grounds).
If such damage may be caused by the emissions of the activity fill in the label "yes", otherwise
(c) Biophysical Damage
As for accident situation.
28

3.43. Setting Priorities for Farther Analysis
The completed table described in the previous section gives a first identification of the hazardousactivities. In principle all activities with label entries "yes" or "maybe" should be investigatedfurther. However, the number of such activities may in some cases be very large and it may bedesirable to concentrate further only on some of the major activities. This section gives guidance forthe selection and identification of the most important hazards for further analysis.
3.4.3.1. Accidents
(a) Acute Fatalities
Step 1: If the activity occurs within the distance from populated areas indicated in Table 3.5. label
"yes". Otherwise label "maybe" and proceed to step 2.Step 2: For activities labelled "maybe" from step 1 above, calculate the Potential Hazard Index (PHI)
as a function of distance to the nearest population area. Fig. 3.1. indicates the relevantrelationships to be applied.
TABLE 3.5. CRITERIA OF DISTANCE FROM POPULATED AREAS1 (FIRST DWELLINGS)"
Industrial Activity
Stationary installations
Transport
flammable substances and/or explosives
specifically:• petrol station• LPG station• pipeline with flammable liquids• storage of cylinders (25-100 kg)
toxic substances
specifically:• cooling installation* storage of pesticides for retail
LPG, by: rail/roadwater
petrol, by: rail/roadwater
oil, by: rail/roadwater
toxic substances, by: rail/roadwater
Distance frompopulated areas
(m)
< 1000
<50< 100<50
< 100
< 10000
< 100<50
<200<500
<50<200
<25< 100
<3000<3000
The values are related to the maximum possible quantities (and maximum toxicity for toxic substances)that exist in normal industrial practice.Adapted from Ref. [1].
29

Installations in buildings
Combustiblesa = 1 0 , T = 1
Explosive materialsa=100 ,T=1
Toxic materialsa = 1000, T = threshold
PHI(d)= a Q / T d 3
PHI(d): represents the Potential Hazard Indexas a function of distance, d
Q: quantity of materials in kgd: distance to nearest populated area in metresT: the threshhold quantity which varies with LC50
(see Tables 3.2 and 3.3 )
FIG. 3.1.Potential hazard index
IfPHI(d)< 1 label "no"IfPHI(d)> 1 label "yes"
All activities labelled "yes" should be further analyzed by way of quantified risk assessment.
(b) Health Effects
Make the worst case accident scenario for the maximum number of people that can be affecteddue to an accident.
(c) Property Damage and Economic Loss
Make an attempt to quantify the possible damage by the worst case accident scenario.
(d) Biophysical Damages
Make an attempt to quantify the area affected by the worst case accident scenario.
3.4.3.2. Normal Operation
The ambient concentrations of major pollutants are compared with the levels given in the WHOguides for air and water, Tables 3.6. and 3.7. This is done for industrial, urban and rural areas. If alevel exceeds the concentration as given in the WHO guides, an important hazard has been identified.
Furthermore, the total emission in the area can be calculated from the data on the number ofemitters and the quantities each of them emits. The population density is taken into account todetermine approximately the number of people affected by too high ambient concentrations. For aworst case accident scenario extremely bad meteorological circumstances are to be assumed. Thus, arough quantification of the damage per year due to the different pollutants considered in the analysiscan be obtained.
30

TABLE 3.6. WHO AIR QUALITY GUIDELINES VALUES FOR INDIVIDUAL SUBSTANCESBASED ON EFFECTS OTHER THAN CANCER OR ODOR/ANNOYANCE GIVENIN REF. [4].
Substance
Cadmium
Carbon disulfide
Carbon monoxide
1-2 Dichloroethane
Dichloromethane
Formaldehyde
Hydrogen sulfide
Lead
Manganese
Mercury
Nitrogen dioxide
Ozone
Styrene
Sulfur dioxide
Tetrachloroethylene
Toluene
Trichloroethylene
Vanadium
Time-weighted average
1-5 ng/m3
10-20 ng/m3
100 ug/m3
100 mg/m3*60 mg/m3 *30 mg/m3 '10 mg/m3
0.7 mg/m3
3 mg/m5
100 ug/m3
150 ug/m3
0.5-1.0 ug/m3
1 ug/m3
1 ug/m3b
400 ug/m3
150 ug/m3
150-200 ug/m3
100-120 ug/m3
800 ug/m3
500 ug/m3
350 ug/m3
5 mg/m3
8 mg/m3
1 mg/m3
1 ug/m3
Averaging time
1 year (rural areas)1 year (urban areas)
24 hours
15 minutes30 minutes1 hour8 hours
24 hours
24 hours
30 minutes
24 hours
1 year
1 year
1 year
1 hour24 hours
1 hour8 hours
24 hours
10 minutes1 hour
24 hours
24 hours
24 hours
24 hours
Exposure at these concentrations should be for no longer than the indicated times and should not berepeated within 8 hours.
The value is given only for indoor pollution.
31

TABLE 3.7. WHO DRINKING-WATER QUALITY GUIDELINES FOR INORGANIC ANDORGANIC CONTAMINANTS AND PESTICIDES OF HEALTH SIGNIFICANCEGIVEN IN REF.[5]
Contaminant
Aldrin and Dieldrin
Arsenic
Benzene
Benzo[a]pyrene
Cadmium
Carbon Tetrachloride
Chlordane
Chloroform
Chromium
Cyanide
2,4-D
DDT
1.2-Dichloroethane
Fluoride
Gamma-HCH (lindane)
Gross alpha activity
Gross beta activity
Heptachlor & neptachlor epoxide
Hexachlorobenzene
Lead
Mercury
Methoxychlor
Nitrate
Pentachlorophenol
Selenium
Tetrachloroethene
Trichloroethene
2,4,6-Trichlorophenol
Guideline Value
0.03 ug/1
0.01 mg/1
lOug/la
0.7 ug/1
0.003 mg/1
2ug/la
0.2 ug/1
200fig/l'
0.05 mg/1
0.07 mg/1
30 ug/Ih
2 ug/1
30 ug/r
1.5 mg/1
2 ug/1
0.1 Bq/1
1 Bq/1
0.03 ug/I
lug/1-
0.01 mg/1
0.001 mg/1
20ji&'I
50 mg/1 (N)
9 ug/1
0.01 mg/1
40 ug/1'
70 ug/r
200 ug/1 •*
These guidelines values were computed from a conservative hypothetical mathematical model which cannot be experimentallyverified and values should therefore be interpreted differently Uncertainties involved may amount to two orders of magnitude (ie..from 0.1 to 10 times the number).May be detectable by taste and odour at lower concentrationsLocal or climatic conditions may necessitate adaption.
32

3.5. SELECTION OF HAZARDS FOR FURTHER ANALYSIS
The initial hazard identification process carried out according to section 3.4. gives the firstidentification of the hazardous activities in the region to be studied. In principle all activities with labelentries "yes" or "maybe" should be investigated further. In practice, the limitations of the resourcesavailable will determine the number of activities to be studied, the depth of these studies and thetimescale involved. It will be necessary therefore to evaluate and prioritize analyses in the light of thenature and extent of the hazards involved, the resources required and the time necessary to carry themout. As environmental impacts may also have a significant effect on the health of the population, theyshould be considered additionally.
Further examination of the hazardous activities so far identified may reveal that some activitiespresent unacceptable hazards for which clear remedies are apparent Remedial actions could beproposed for these activities without further studies being made at the time.
Additional simple consequence analysis of those activities posing the highest risk in terms oftheir inventory of hazardous materials or their location relative to areas of high population density willgive rise to further indicators of priority.
The next stage is to assess the resources required for the study of each activity.
Examination of the hazards posed and the resources required will then permit to rank theactivities thus identified in order of priority. With this completed it will be possible to develop workschedules, to acquire the needed resources and develop the final project plan.
Some hazardous activities, because of their lower priority, will not attract resources nor furtherstudies. It is however important that these activities are not forgotten but marked for consideration atsome future date when either further resources become available or their hazard ranking increases asthe risks from the current higher priority hazardous activities are reduced.
33

4. ANALYSIS AND ASSESSMENT OF CONTINUOUSEMISSIONS FROM FIXED FACILITIES
4.1. INTRODUCTION
Continuous emissions include: pollutants routinely released into the atmosphere from stacks,tailpipes and fugitive emissions from vents, open burning, etc.; pollutants discharged to surface waterfrom outfall pipes or channels, routine overflow from waste ponds or lagoons and spread sources suchas run-off from urban roadways products or agriculture; emissions to ground water from soilfillleachate, percolation from surface ponds and lagoons, leakage from pipelines and discharges frominjection wells. Products released to water, soil or air which result in the occurrence of adverse effectsin humans or the environment are pollutants.
Continuous emissions generally lead to exposures that can create chronic, long-term effects.Acute health effects may also result Extended meteorologic inversions, for example, lead to acuteexposures and acute effects from routine emissions if adequate provisions are not taken. Usuallycontinuous emissions to water can yield chronic effects only but there can be exceptions. Exceptions,for example, are contaminant concentrations which have been built up in river sediments over longperiods and may be released during storms that stir up these sediments, resulting in acute, high-levelexposure.
Emission sources have to be characterized and compared with the relevant emission standardsconcerning air, water and soil pollution. As far as the effects are concerned, once the receptors havebeen identified, the transport of the pollutants from the source to the receptor has to be defined andcalculated and the dose-response relationships to the receptor assessed. Owing to the probabilisticcharacter of the transport process, exposures to the receptors are obtained in terms of figures withprobabilities. The estimated risk to the receptor, i.e. certain damage affected by a certain probability,is calculated and compared with the relevant risk acceptance criteria. If the criteria are not met, thepollution abatement process in the plant has to be adapted in an iterative procedure. Figure 4.1 outlinesthe general assessment framework.
The first step in analyzing continuous emissions is to identify their sources and to characterizetheir quantities and their physical and chemical properties. This is discussed in section 4.2.
The second step is to identify receptors and characterize the dispersion of pollutants from sourceto receptor, either through the use of mathematical models or the use of measurements if available.This is discussed in sections 4.3 and 4.4. The procedure requires that receptors, be they humanpopulations or sensitive environments, be identified and located, and pathways from source to receptorbe determined. Appropriate models are men established and exposures estimated. Ambient monitoringof pollution levels is helpful in guiding this process and in validating results of modeling. Modelingthe transport of pollutants from source to receptor provides an estimate of exposure.
The next steps are meant to identify or develop dose-response relationships between exposureand effects so that effects or risk may be detennined. This is discussed in section 4.5 for human healtheffects and in section 4.6 for environmental effects. An overview of environmental guidelines andstandards is given in Appendix II.
4.2. IDENTIFICATION OF SOURCES, TYPES AND QUANTITIES OF EMISSIONS
Estimates of sources, types, and quantities of gaseous, liquid, and solid emissions from industrialactivities and energy systems are needed to evaluate their risks to health and the environmentAlthough there is a large compiled literature on a range of technologies and emission types, the WorldHealth Organization WHO, as given in Refs [6,7,8,9], the United Nations Environment Program, Ref.
34

EMISSION SOURCES
Identify pollutantsEvaluate quantitiesMonitoring
iCompare with Standards
(air, water, soil)
DISPERSION OFPOLLUTANTS
Mathematicalmodelsand/orMeasurements
Dose-ResponseModels
Compare withRisk Criteria
RECEPTORS
Humanpopulation;Sensitiveenvironments
iRisk Estimation
FIG. 4.1. The general assessment framework

ANALYSIS AND ASSESSMENT OF CONTINUOUS EMISSIONS
STEP 1: Identify sources of continuous emission
STEP 2: Characterize the emission source inventory
2.1. If monitoring is available estimate pollution from different source terms by directmeasurements.
22. If monitoring is not available or monitoring is not technically and environmentallyfeasible, then calculate emissions of different pollutants by means of conversionfactors and the efficiency figures of the controlled pollution equipments.
23 . If no measurement values are available and monitoring not at hand, use comparativevalues from similar situations or based on existing literature in order to estimateemission values; check if the results of using these values are applicable to thefacility under investigation.
2.4. Use expert judgement
STEP 3: Select a pathway for analysis organized according to the receiving media: air, water,soil.
STEP 4: Using models calculate dispersion values in the receiving media and addbackground values if necessary
4.1. If air is the medium where dispersion of pollutants occurs, then calculateconcentration of pollutants under given weather conditions, according to step 5, andadd background air pollutant concentrations (see subsection 4.42). Go to step 6.
42. If water is the medium where dispersion of pollutants occurs, then calculateconcentration of different pollutants at some time instance and at a distance fromthe source of pollution and add background water pollutant concentrations ifnecessary (see subsection 4.43). Go to step 6.
43 . If soil is the medium, evaluate the soil content of pollutants and add backgroundcontents if necessary. Go to step 6.
STEP 5: For evaluating the concentration of pollutants as a time-distance function useatmospheric dispersion models.
5.1. For distances between one and about 50-80 km dispersion from a point source insimple regional and meteorological conditions use simple Gaussian Plume Models.
52. For complex geographical and meteorological conditions use Complex PlumeModels.
STEP 6: Use either air quality, water quality and soil quality standards or dose-responserelationships to estimate the risk to the population; evaluate the health impacts.
STEP 7: Use analytical methods, critical load concepts or expert judgement for environmentalimpact assessment.
36

METHODS FOR ESTIMATION OFCONTINUOUS EMISSIONS
MONITORINGDATA
INPUT - OUTPUTCORRELATION
MODELS
USE OFREPRESENTATIVE
SOURCEPARAMETERS
EXPERTJUDGEMENT
FIG. 4.2. Methods for estimation of continuous emissions
DATA COLLECTION REQUIREMENTS
Process
Activfty [
Trajectory
System
LevelofComplexify
FIG. 4.3. Data collection requirements
EngineeringEstimates
GovernmentInformationSources
1
DATASOURCES
1
Measurements
PrivateOrganizations
FIG. 4.4. Data sources
37

[10], and others e.g. OECD, Ref. [11], have found that in developing quantitative assessments of healthand environmental effects, emissions data for a given technology in different countries vary. Principalreasons for these variations include differences in operating characteristics of fuel or materialconsuming devices, in fuel or material quality, or in regulatory-based pollution control requirements.
Owing to these variations, country/technology specific emissions estimates are needed to increasethe accuracy of any risk assessment effort. There are three principal approaches that can be used todevelop estimates of routine or continuous emissions from a source; each has its own unique strengthsand weaknesses, see Fig. 4.2.
The first method consists of the collection of monitoring data from an operational source. Insuch a case monitoring equipments are used either on a continuous or intermittent basis to provide dataspecific to the process unit in question. Monitoring, however, requires substantial time and effort andmay be neither technically nor economically feasible in many cases. Furthermore, if data are notcollected for an extended time period, they may not be representative of the true emissioncharacteristics because of time and process dependent variations.
A second approach is based on using theoretical or empirical equations correlating operatingparameters to input values. Stoichiometric estimates may be, however, erroneous because of inadequatespecifications, poor understanding of the process or insufficient knowledge.
The third approach is to use data compiled from other facilities or based on existing literatureand to assume that the results are applicable to the facility in question. In this approach questions willalways remain about the accuracy and precision of the extrapolation.
In addition to the preceding approaches or as a fourth approach, if previous methods do notapply, expert judgment may be called upon.
The following subsections highlight information relevant to these methods, including datareporting protocols, potential information sources, sample emission coefficients for some energyprocesses, national emission standards in OECD member countries and demonstrate how to estimateemission factors.
4.2.1. Data reporting protocols
4.2.1.1. Scope of data
The scope of data to be compiled can vary by process and by pollutant. Processes beingevaluated may need to be treated as one unified system or as many independent subsystems. Thedegree of aggregation depends on the complexity of the facility in question as well as on the degreeof dependence among process operations. Facilities which tend to be more complex and are composedof many semi-independent operations require more disaggregation than simple integrated operations.In general, this dichotomy parallels the difference between energy-related vs. industry-related activities.Energy-related activities tend to focus on the processing or combustion of a particular fuel in a unifiedway. Industrial operations, however, may include many loosely aggregated activities that must beevaluated independently.
As collection efforts are begun, some thought should be given to defining the system boundariesof interest (i.e. the back- and front-ends of the fuel and material supply cycles). In some instances,these contribute most of the emissions. Hence, the potential consequences of including or excludingthem should be considered. As a general guide, complete cycles are often evaluated when systems arebeing compared or when regional or national-scale analyses are being conducted. As the geographicor technologic scales of the analysis decrease, the value of including complete cycles diminishes.
38

Similarly, in assessing risks from these processes it might be appropriate to identify all pollutantsfrom all alternatives. Practical limitations, however, quickly demand that effort be focused. Datacollection could focus on any or all of the areas given in Fig. 4.3.
Moreover, data collection should pay due consideration to the specificity of the products releasedfrom the emission source, their environmental impacts and to existing standards, e.g.:
(1) pollutants that quantitatively dominate the waste streams (e.g. carbon dioxide from oil- orgas-fired steam electric power plants);
(2) index pollutants (e.g. biochemical oxygen demand (BOD) or sulfur oxides);(3) pollutants for which there are environmental standards (e.g. lead in the atmosphere);(4) pollutants for which there are acute (e.g. hydrogen sulfide) or chronic (benzo(a)pyrene) health
effects;(5) pollutants that are emitted routinely (e.g. noble gases from nuclear power plants).
Emission coefficients may be derived using simple point estimates or complex models. Ingenerating simple and complex coefficients for specific activities many underlying predictors may needto be defined. In combustion-based systems, for example, the following types of information mustoften be specified:
(i) energy content of the fuel;(ii) moisture, sulphur, ash, and trace element content of the fuel;(iii) thermal efficiency of the boiler;(iv) temperature of the exiting gases;(v) type and characteristics of the emission-control equipment.
In industrial-based systems all the aforementioned information must be examined. In addition,the rate of feedstock input and rate of product output may also need to be identified.
4.2.1.2. Format
In the technical literature many formats are used to express emission data for different processes.In principle the following units could be used:
(i) mass of pollutant per mass of fuel (kg/kg);(ii) mass of pollutant per mass of product (kg/kg);(iii) mass of pollutant per unit time (kg/s);(iv) mass of pollutant per unit of volume (kg/m3);(v) mass of pollutant per unit of energy input or output (kg/J).
Reporting protocols differ, due to historical and regulatory reasons. In the USA and at OECD[11] emissions are regulated as pollutant mass per unit of energy input (kg/J) or as pollutant mass perunit of volume (kg/m3). Emission standards for non-combustion sources associated with industrialactivities span the range of reporting protocols listed above.
4.2.2. Data sources
Information can be collected from government and private organizations, from compiledliterature, from new engineering estimates or from new measurements (see Fig. 4.4). As noted byWHO[12] "A major task of the study team is to locate all major government information sources andto extract the required data from them." Table 4.1 presents a list of possible sources of information.Undoubtedly, a sizeable portion of the required information available from these organizations will bein an unpublished form. Therefore, some efforts will be needed to extract, process and classify the
39

useful information. The major difficulties with unpublished data consist in determining which data isneeded and then in data interpretation. Often there is a danger of omitting important information ifscreening is not done carefully. But complexity and resource requirements increase considerably ifrelatively unimportant data are retrieved and processed. Cross-checking collected data with informationfrom other sources is often possible and highly desirable, since it is a way of ensuring accuracy of theresults. If important data from various sources are in significant disagreement, investigation of theiroriginal derivation often provides a good basis for formulation of the most accurate estimates.
In the event that the agencies listed in Table 4.1 have not compiled the needed information,first-order approximations of the engineering and environmental characteristics for most energysystems and for most conventional air (e.g. PM, SOX, NOX) and water (e.g. TDS, BOD, pH) pollutantscan be derived from several summary documents. Emission data on many industrial processes forconventional pollutants have been evaluated by WHO and by the US Environmental Protection Agency(EPA) to establish air and water pollutant emission standards. Tables 4.2 and 4.3 summarize theindustries and pollutants examined in the EPA efforts. EPA efforts have also been focused on sometoxic chemicals, see Table 4.4.
More detailed characterization efforts may be required for any of the following reasons:
(i) development of site-specific case studies;(ii) analysis of site specific energy systems (e.g. peat or dung) or industrial activities that are not
widely used;(iii) emission coefficients for non-conventional (e.g. toxic or hazardous) pollutants.
In such cases the data gathering efforts may need to be focused on technical literature publishedby various research (e.g. US Department of Energy) or regulatory organizations (e.g. USEnvironmental Protection Agency) as well as by equipment manufacturers.
4.23. Compilation of US emission factors
Table 4.5 gives emission coefficients for five conventional air pollutants (i.e. SOX, NOX, CO, HC,and TSP) for a range of energy systems. These are compiled from a report prepared for the USDepartment of Energy. Detailed documentation needed to define the basis for these numbers iscontained in that report. Although these data provide some perspective on the coefficients for similaractivities elsewhere, the true coefficients will differ, perhaps in major ways, for some or all of thefollowing reasons:
(i) processes vary in their engineering characteristics (e.g. size, efficiency and temperature);(ii) fuel supplies have different characteristics (e.g. heating value, sulphur and ash content);(iii) pollution control equipments have different impacts (e.g. efficiency or types of pollutants
scrubbed).
Thus, extrapolation or direct application of these coefficients to other countries may introducelarge errors unless these factors are examined.
4.2.4. Emission standards for energy facilities in OECD countries
Table 4.6 gives emission standards for electric generating plants for OECD countries [11]. Thebase reporting protocols for these coefficients vary among the different countries. As discussed byOECD, simply reporting the standards on one uniform basis (e.g. ng/J input) may introduce errorsbecause of underlying assumptions that must be made (e.g. temperature and moisture content of theflue gas). There may be other variations such as actual vs. normalized stack conditions, or weightedvs. rolling averages. Consequently, comparisons among the different coefficients should be made withcaution.
40

TABLE 4.1. POSSIBLE SOURCES OF INFORMATION[12]
Type of Data Possible Sources
Industrial activity
Electric energy ministry,Authority or company
Fuel consumption
Rail & road traffic activity
Air traffic activity
Shipping activity
Water emissions
Air emissions
Solid wastes
Ministry of industry or commerceNational planning/economic development agencies
Internal revenue agenciesLocal governmentsIndustry associationsMinistry of animal productionAir, water and solid waste pollution control authorities
Ministry of energyMinistry of industryInternal revenue agenciesRefineries or oil distribution companies
Ministry of transportation
Airport authoritiesMinistry of transportation
Port authoritiesMinistry of transportation
Oceanographic instituteMinistry of health or environmentRiver authoritiesWater pollution control authoritiesMinistry of fisheriesArea planning agenciesLocal health departmentsUniversities
Ministry of health or environmentAir pollution control authoritiesUniversities
Local authoritiesMinistry of environmentPrivate refuse disposal companiesArea planning or development agencies
Occupational health
Public health
Ministry of healthLocal health departmentsUniversities
Ministry of healthLocal health departmentsUniversities
41

TABLE 4.2. INDUSTRIES FOR WHICH NEW SOURCE PERFORMANCE STANDARDS FORAIR POLLUTANTS HAVE BEEN DEVELOPED BY THE U.S.ENVIRONMENTAL PROTECTION AGENCY
Industry Pollutants Regulated
Fossil-fuelled steam generators
Incinerators of capacity larger than 50 TPD
Portsoil cement plants
Coal preparation facilities
Nitric acid plants
Primary aluminum smelters
Sulfuric acid plants
Asphalt concrete plants
Sewage sludge incineration
Iron and steel plants
Electric arc furnaces
Ferro alloy production facilities
Secondary brass and bronze ingot
Kraft pulp mills
Petroleum refineries
Storage vessels for petroleum
Secondary lead smelters and refining
Primary copper, lead and zinc
Phosphate fertilizer industry
Grain elevators
Ammonium sulfate manufacture
Lead acid battery manufacture
Stationary gas turbines
Glass manufacturing
Phosphate rock plants
Synthetic organic chemicals
Pressure-sensitive tape and label coating
Auto and tight truck surface coating operations
Asphalt processing and asphalt roofing manufacture
Rotogravure printing
Bulk gasoline terminals
Beverage can coating
TSP, SO,, NOX
TSP
TSP, Opacity
TSP, Opacity
NOX, Opacity
F, Opacity
SOX, Acid Mist, Opacity
TSP, Opacity
TSP, Opacity
TSP, Opacity
TSP, Opacity
TSP, CO
TSP, Opacity
TSP, Total Reduced Sulfur
TSP, Opacity, CO, SO2
VOC
TSP, Opacity
TSP, SO2, Opacity
F
TSP, Opacity
TSP, Opacity
Pb, Opacity
NOx, SO2,
TSP
TSP, Opacity
VOC
VOC
VOC
TSP, Opacity
VOC
VOC
VOC
Acronyms: TSP = Total Suspended Particulates; VOC = Volatile Organic Carbon; TPD = Tons per Day
Source: Ref. [13]
42

TABLE 4.3. INDUSTRIES FOR WHICH PRETREATMENT AND EFFLUENT GUIDELINESAND STANDARDS FOR WATER POLLUTANTS HAVE BEEN DEVELOPED BYTHE U.S. ENVIRONMENTAL PROTECTION AGENCY
Industry Pollutants Regulated
Beet sugar
Cane sugar
Fiberglass insulation manufacturing
Sheet, plate and laminated glass
Rubber processing
Asbestos manufacturing
Meat products
Phosphate manufacturing
Fruit & vegetable processing
Plastics & synthetics
Nonferrous metals
Timber products
Organic chemicals
Leather tanning & finishing
Petroleum refining
Pulp, paper & paperboardmanufacturing
Builders' paper & roofing felt
Iron & steel manufacturing
Textiles
Steam electric power plants
Paint formulating
Ink formulating
Paving & roofing materials
Offshore oil & gas extraction
Mineral mining & processing
Coal mining & processing
Pharmaceutical manufacturing
Metal finishing
BOD, TSP, pH
BOD, TSP, pH
Phenol, COD, BOD, TSP, pH
TSP, pH, O&G, P, F, Pb, Ammonia
TSP, O&G, pH, BOD, COD
COD, TSP, pH
BOD, TSP, O&G, Fecal Coliform, Ammonia
TSP, Phosphorus, As, pH, F
BOD, TSP, pH
BOD, COD, TSP, pH, Cr, Zn, Phenols, O&G
TSP, F, Ammonia, Al, Cu, COD, pH, O&G, As, Cu, Pb, Cd, Se,Zn
BOD, TSP, pH, Phenols, O&G, Cu, CR, As
COD, BOD, TSP, pH, Phenols, Cyanide
BOD, TSP, O&G, Cr, pH, Sulfide
BOD, TSP, COD, O&G, pH, Phenols, Ammonia, Sulfide, Cr
BOD, TSP, pH, Pentachlorophenol, Trichlorophenol, Zn
BOD, TSP, pH, Pentachlorophenol, Settleable Solids,Trichlorophenol
TSP, O&G, Ammonia, CN, Phenols, pH, Benzene, Naphthalene,Benzo(a)-pyrene, TRC, Pb, Zn, Ni, Cr, Tetrachloroethylene
BOD, TSP, COD, O&G, Cr, pH, Phenol, Sulfide, Color, FecalColiform
TSP, O&G, Cl, Cu, Fe, Cr
No discharge of process waste
No discharge of process waste
O&G, pH, TSP, BOD
Produced water, deck drainage,Drilling muds, Drill cutting,Well treatment, Sanitary,Domestic, Produced sand
pH, TSP, F, Fe
Fe, Mn, TSP, pH, Settleable Solids
CN, COD, BOD, TSP, pH
CN, Cd, Cr, Cu, Pb, Ni, Ag, Zn, TTO, O&G, TSP, pH
43

TABLE 4.3. (cont.)
Industry Pollutants Regulated
Coil coating
Porcelain enameling
Copper forming
Aluminum forming
Ore mining & dressing
Explosives manufacturing
Gum & wood chemicalsmanufacturing
Photographic processing
Pesticide manufacturing
Electroplating
Dairy processing
Grain mills
Canned & preserved seafood
Cement manufacturing
Feedlots
Soap & detergent manufacturing
Fertilizer manufacturing
Phosphate manufacturing
Ferroalloy manufacturing
Asbestos products manufacturing
Electrical & electronic components
Inorganic chemicals
Cr, CN, Zn, Fe, O&G, TSP, pH, P, Mn, TTO
Cr, Pb, Ni, Zn, Al, Fe, O&G, TSP, pH, Ammonia, Phenols, CN
Cr, Cu, Pb, Ni, Zn, O&G, TSP, F, pH, TTO, Cd, As
Cr, CN, Zn, Al, O&G, TSP, pH, TTO,
TSP, Fe, pH, Al, COD, As, Zn, Ra226, NH, U, Cd, Cu, Pb
COD, BOD, TSP, pH, O&G
BOD, TSP, pH
Ag, CN, pH
COD, BOD, TSP, Organic Pesticides, pH
CN, Pb, Cd, Ni, Cr, Zn, Total Metals, TSP, pH Ag, TTO
BOD, TSP, pH
BOD, TSP, pH
BOD, TSP, O&G, pH processing
TSP, Temperature, pH
Fecal Coliform, BOD
BOD, COD, TSP, O&G, pH, Surfactants
P, F, TSP, Ammonia, N
P, F, pH, TSP
TSP, Cr, Mn, pH, CN, Phenols, Ammonia
TSP, pH, COD
TTO, F, pH, As, TSP
TSP, pH, Zn, Hg, Cu, Pb, Ni, Cl, TOC, CN, Cr, Fe, COD, Se, Ba,Sulfide, Ag
Acronyms: TSP = Total Suspended Particulates; COD = Chemical Oxygen Demand; BOD = BiologicalOxygen Demand; O&G = Oil and Grease; TTO = Total Toxic Organics; TOC = Total Organic Carbon.
Source: Ref. [13]
44

TABLE 4.4. POLLUTANTS AND ACTIVITIES FOR WHICH HAZARDOUS AIR POLLUTANTEMISSION STANDARDS HAVE BEEN DEVELOPED BY THE U.S.ENVIRONMENTAL PROTECTION AGENCY
AsbestosAsbestos millsRoadway surfacingManufacture of cloth, cord, wicks, tubing, tape, twine, rope, thread, yam, roving, lap or othertextile materials, cement products, fireprooflng and insulating materials, friction products, paper,millboard and felt, floor tile, paints, coatings, caulks, adhesives, plastics, rubber materials, chlorine,shotgun shells, and asphalt concreteDemolition and renovation
Beryllium
Extraction plants, ceramic plants, foundries, incinerators, propellant plants, rocket motor test sitesand machine shops
Mercury
Stationary sources which process mercury ore to recover mercury, use mercury chlor-alkali cells toproduce chlorine gas and alkali metal hydroxide, and incinerate or dry waste water treatment plantsludge
Vinyl Chloride
Plants which produce ethylene dichloride by reaction of oxygen and hydrogen chloride, vinylchloride by a process, and/or one or more polymers containing any fraction of polymerized vinylchloride.
Benzene
Fugitive emission source, coke by-product plants
Radionuclides
DOE facilities, NRC-licensed facilities, elemental phosphorus plants
Inorganic Arsenic
Low and high arsenic copper smehers
Source: Ref. [13]
45

TABLE 4.5. EMISSION COEFFICIENTS FOR CHOSEN AIR POLLUTANTS FROM VARIOUSENERGY TECHNOLOGIES IN TONS/1012 BTU (1 BTU = 1055J, 1 TON =907 KG)
To recalculate for metric tons/GW © year use the coefficient
TONS ,,, MTn = zin-IQpBTU GW-a
(MT= 1000 kg, a=365 days)
TECHNOLOGY
NUCLEAR
Open Pit UraniumMining
UndergroundUranium Mining
Uranium Milling
HexafluorideConversion
Gaseous Diffusion
Gas CentrifugeEnrichment
Fuel Fabrication
Commercial WasteRepository
AIR POLLUTANTS
so, NOX CO HC TSP
COMMENTS
0.43
0.02
0.01
1.30
197.00
0.46
1.10
0.27
0.25
0.32
0.41
0.46
51.80
0.37
0.28
0.42
0.00
0.19
0.01
1.30
0.01
0.01
0.38
0.02
0.03
0.04
0.50
0.03
0.27
0.01
5.40
51.80
0.02
0.02
Open pit miningof ore for fuel
Undergroundmining of ore forfuel
Milling ore toyellowcake (U308)
Yellowcake toUF6
Enrichment to 4%U235
Enrichment to2-4% U235
UF6 to UO2 fuelelements
Construction &OperationsEmissions
46

TABLE 4.5 (cont)
TECHNOLOGY
COAL
EasternUndergroundMining Emissions
Eastern SurfaceMining
Western SurfaceMining
Beneficiation
Dedicated Rail,eastern
Dedicated rail,western
Conventional Rail,eastern
Conventional RaiL,western
Barge Transport,eastern
Barge Transport,western
Truck Transport,eastern
Coal-Oil PowerPlant
Fluidized BedBituminous
Fluidized Bed,Subbhumen
Coal-Oil PowerPlant
Coal-fired Plant,eastern coals
Coal-Fired Plant,western coals
AIR POLLUTANTS
sox NOX CO HC TSP
COMMENTS
0.03
2.55
0.32
0.01
3.70
5.00
2.60
3.50
0.52
1.47
029
1297.
1440.
1700.
1297. •
850.00
600.00
0.31
3.50
4.80
0.60
320
4.40
2.90
4.00
7.71
22.03
1.87
648.00
366.00
582.00
648.00
850.00
850.00
0.08
7.30
0.97
020
3.40
4.60
0.50
3.70
1.68
4.79
2.95
40.00
56.00
90.00
40.00
60.00
90.00
0.02
227
0.30
020
2.50
3.60
2.00
2.70
0.62
1.76
0.47
18.00
15.00
30.00
18.00
18.00
30.00
0.02
1.81
0.90
102.90
140.00
102.00
138.40
0.55
1.57
35.16
144.00
138.00
146.00
144.00
42.00
40.00
With preparationplant; diesel
With preparationplant
Cleaning process
4 diesels, 90trips/yr.
4 diesels, 90trips/yr.
1 diesel, 20trips/yr; (othercargo)
1 diesel, 20trips/yr, (othercargo)
1 diesel tug,22040 miles/yr.
1 diesel tug,26889 miles/yr.
1 trailer 12 x 106net ton miles
40/60 mix (by wt)coal/oil
Steam plant withemission controls
Steam plant withemission controls
40/60 mix (by wt)coal/oil
Mine-mouth steamplant; emissioncontrols
Conv. steam plant;emission controls
47

TABLE 4.5 (cont.)
TECHNOLOGY
PETROLEUM
Primary OilExtraction
Enhanced OilRecovery
Offshore OilExtraction
Crude Oil Storage
Oil-Fired PowerPlant
GAS
Onshore GasExtraction
Offshore GasExtraction
Natural GasPurification
Natural GasPipeline
Liquified Nat Gastanker
Underground GasStorage
Gas Fired PowerPlant
SOLAR/BIOMASS
Residential WoodStoves
Industrial Wood-Fired Boiler
AIR POLLUTANTS
sox NOX CO HC TSP
COMMENTS
13.60
207.00
11.79
3720.
18.60
71.00
31.92
432.00
0.50
4.00
6.91
49.30
10.60
2.00
2.55
227
9.80
3.50
24.00
2.28
410.00
Emissions fromdrilling/production
Recovery viasteam injection
18 platforms, 4000bbl/day
Lined salt-domescaverns
Steam plant withemission controls
1425.
300.00
0.01
0.01
7.42
0.19
0.79
84.70
0.15
40.90
4.00
5.84
136.98
930.00
1.90
0.06
0.00
1.52
0.41
3.92
22.40
0.60
0.01
0.36
028
0.52
9.45
0.03
1.90
0.16
2.44
42.90
120 gas wells
18 well platforms88.7 x 106 cu.ft/day
Treatment prior totransmission
600 mileunderground pipe
63,460 DWT tontanker
5000 acres 6 x10¹⁰ scf/yrcapacity
Conventionalsteam plant
32.30
70.00
134.65
162.00
29.098
1300
28.15
325.00
565.00
79.60
Transport and fuelgas emissions
Steam boiler withemission controls
Source: Ref.[14].
48

TABLE 4.6. COMPARISON OF NATIONAL EMISSION STANDARDS FOR FOSSILELECTRICITY GENERATING PLANTS'
Fuel/Country
SolidAustraliaBelgiumCanadaDenmarkGermanyGreeceJapanNetherlandsNew ZealandSwedenUnited KingdomUnited States
LiquidAustraliaBelgiumCanadaDenmarkGermanyGreeceJapanNetherlandsNew ZealandSwedenUnited KingdomUnited States
GasAustraliaBelgiumCanadaDenmarkGermanyGreeceJapanNetherlandsNew ZealandSwedenUnited KingdomUnited States
]
TSP
10514743632156422052154813
4336185618
43
25615
Pollutant (ng/J= g/GJ)
so,
258
148
230230
100
520
740258
168
203
100
340
258
10
165
340
NO,
258
333
259/173270
280
260
129
167
99
210
105
86
106
37
86
: Adapted from Ref.[ 11]
49
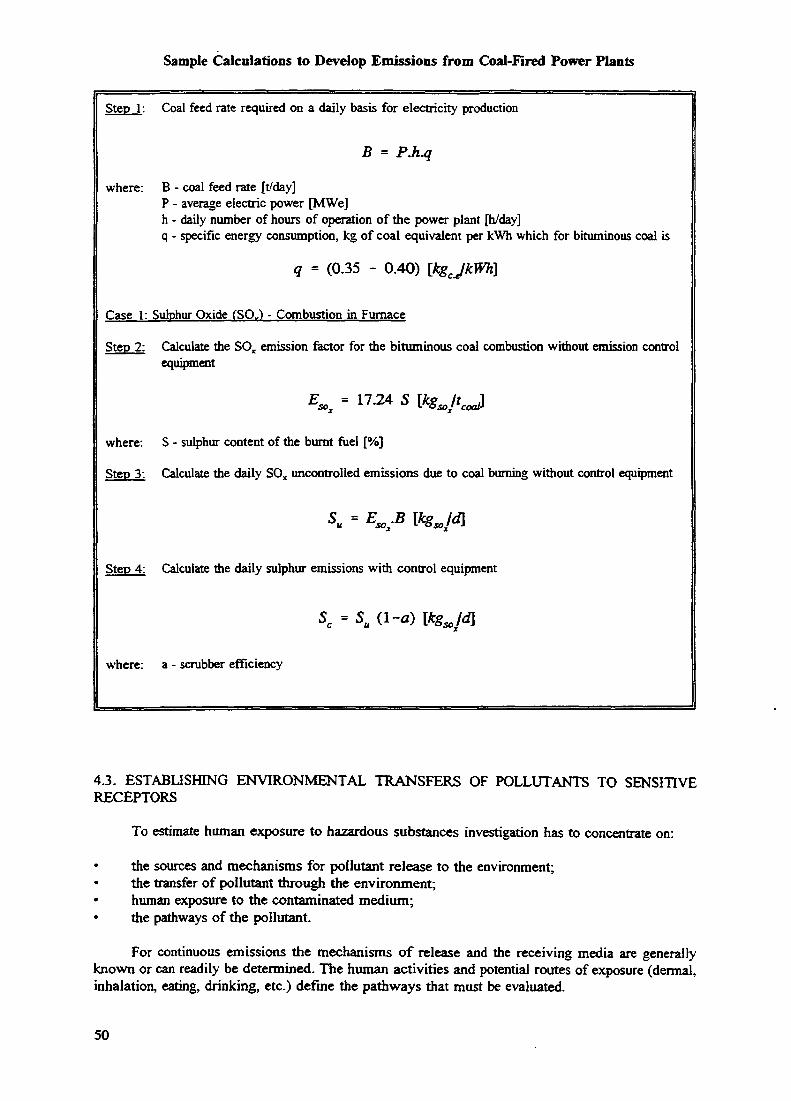
Sample Calculations to Develop Emissions from Coal-Fired Power Plants
Step 1: Coal feed rate required on a daily basis for electricity production
B = P.hui
where: B - coal feed rate [t/day]P - average electric power [MWe]h - daily number of hours of operation of the power plant [h/day]q - specific energy consumption, kg of coal equivalent per kWh which for bituminous coal is
q = (0.35 - 0.40) [kgJkWh]
Case 1: Sulphur Oxide (SO.) - Combustion in Furnace
Step 2: Calculate the SOX emission factor for the bituminous coal combustion without emission controlequipment
E^ = 17.24 S [k8sojtcoj
where: S - sulphur content of the burnt fuel [%]
Step 3: Calculate the daily SOX uncontrolled emissions due to coal burning without control equipment
Su - * „ * [kSso/d\
Step 4: Calculate the daily sulphur emissions with control equipment
Sc = Stt (1-*) [kgsojd\
where: a - scrubber efficiency
4.3. ESTABLISHING ENVIRONMENTAL TRANSFERS OF POLLUTANTS TO SENSITIVERECEPTORS
To estimate human exposure to hazardous substances investigation has to concentrate on:
the sources and mechanisms for pollutant release to the environment;the transfer of pollutant through the environment;human exposure to the contaminated medium;the pathways of the pollutant.
For continuous emissions the mechanisms of release and the receiving media are generallyknown or can readily be determined. The human activities and potential routes of exposure (dermal,inhalation, eating, drinking, etc.) define the pathways that must be evaluated.
50

Numerical Example:
If:
then:
P = 400
q --
s =
B - 400 MWe x 103
MJFe
5 - 17.24 xl Z*'cot
Sc = 184
Case 2: TSP - Pulverized Coal Boilen
Step 2:
where:
Step 3:
Calculate paniculate emissions
A - ash content in the fuel
Calculate the daily uncontrolled
P.
MWe; h =24 hoursjd
-- 0.37 kgJkWh
3% a = 0.8
"* JC 3 5 5 ° t a w r 1 O r - 1 8 1 *"*it ^ A? ^
x*>x C1"0-8) = 36-8 —
7.25 A [kg]jtcoj
paniculate emissions
= Ep£ [kgjd]
51

Step 4: Calculate the daily controlled participate emissions
Pc = 7.25-lO"3 AAf-B- (1-e) \tjd\
where: Af - fraction of fly ash in the ash of the coal (usual value: 0.80)e - efficiency of the control device(e.g. electrostatic preciphator)
Numerical Example:
If:
R —
A =
Af =
e =
men:
3552 hssLd
0.08
0.80
0.995
Pu = 7.25 x 0.08 kgjt^ x 3552 taJd x 10"3 tp
- 125 -10'3 tp 0.08 x 0.8 x 3552 t Id (1-0.995) =. a wlcoal
Ikg = 2.06 ia
-- 8.24-10"3 yj=8.d
As a rule, pathways are considered to provide estimates of population-average exposures andmaximum individual exposures. Each realistic pathway from source to receptor represents a uniquemechanism of exposure. In considering exposure, especially following accidents, it is easy to becomeoverwhelmed with considerations of "what-if* scenarios which postulate extreme combinations ofunlikely pathways and events. But little is accomplished by analyzing potential exposure ofexceedingly low probability. The most extreme exposure scenario normally evaluated for continuousemissions is that of the "fence-post" or the "maximum individual," a person who, for example, liveshis whole life at the boundary of a facility, drinks water from a well there, grows all of his food ona farm there, etc. Such an analysis is useful only to define the highest conceivable exposures to beconsidered for evaluation. It is not useful for estimating actual health risk, since no such personnormally exists and the results are only defining a hypothetical upper boundary of the exposures.
52

Some form of analysis involving realistic "maximum individuals," particularly any classes ofespecially sensitive individuals, is appropriate and useful. But care is required that the maximumscenario be quantitatively meaningful (i.e. its probability or its consequences are high enough to beworthy of attention).
Table 4.7 shows some typical maximum exposure points that might be evaluated.
The selection of areas to be actually evaluated has to be made in each case according to specificcriteria.
The transfer of pollutants depends on:
the medium into which they are initially released;the physical and chemical properties of the pollutants;the transfer from one medium to another.
TABLE 4.7. TYPICAL CONTACT POINTS FOR DETERMINING MAXIMUM EXPOSURE FROMCONTINUOUS EMISSIONS
Medium
Air
Surface water
Ground water
Soil
Exposure Area
Nearest residenceNearest population magnet(school, shopping area, etc.)
(occupied) point ofhighest concentration
Withdrawal point for drinking
Withdrawal point foragriculture
Nearest point for swimming/contact sports
Nearest point for fishing
Nearest potable well
Nearest agricultural well
Nearest well for other uses
On-site
Immediately adjacent toshe (if restricted)
Nearest cropsoil
Exposure Route
InhalationInhalation
Inhalation
Ingestion, dermal, inhalation
Inhalation, ingestion (food),dermal
Ingestion, dermal
Ingestion (food)
Ingestion, dermal, inhalation
Inhalation,ingestion (food),
Inhalation, dermal
Dermal ingestion
Dermal, ingestion
Ingestion (food)
53

The first two factors can be determined directly from the emission source inventory, which isnormally organized by receiving medium (air, water, soil). The physical and chemical characteristicsof the pollutants determine their transferability among media. The specific transfers depend on themagnitude of transfer between different media e.g. transfer between air and soil, air and water, etc.,which are characteristics of the surrounding environment.
The receiving medium is often technology-specific: one technology may release a substance tothe air and another competing technology may release the same substance or a transformation product(e.g. scrubber wastes) to water or soil. After emission into the air heavy particles deposit rapidly tonearby surfaces on soil or water. Lighter particles travel farther and deposit at lower rates. Gases maybe absorbed slowly or rapidly, depending on their reactivity with the surfaces they encounter. Manyreactive gases change chemical and/or physical form in transit which can change their absorptioncharacteristics.
Emissions to water seldom reach the air, except for volatile substances like organic solvents.Mostly these emissions change medium by direct deposition in bottom sediments, by uptake up and/ordecomposition in the aquatic food chain or by changing chemical and physical form during transport.
Materials deposited on soil routinely enter surface and ground waters by runoff and leaching andenter the air through direct volatilization, chemical or biological transformation (fire, bacterialdecomposition, etc.) or resuspension. Rates are determined by the chemical and physical properties ofthe materials and the characteristics of their environment (e.g. rainfall, wind, permeability of soils, andcover).
The physical and chemical characteristics that are important in determining transfers amongmedia are usually available in the environmental literature and are often included as part of thecharacterization of source terms or incorporated in standard environmental transport models. Expertjudgment is helpful in selecting appropriate rate constants for less common pollutants. Rate constantsare often complex functions of environmental conditions and cannot be transferred from oneenvironment to another without careful evaluation.
Some care must be taken in cases where a single indicator chemical has been selected torepresent a broader class of pollutants. Indicators are often developed for different purposes; sometimesthey are just substances mat are easy to measure. A particular indicator may be useful for quantifyingthe presence of a class of pollutants in a source term, but the physical and chemical characteristics ofthe indicator may not provide a good representation of the transport and fate of that class of pollutantsin the environment or the health effects of exposure to them. Expert judgment is helpful in determiningthe usefulness of a particular indicator chemical in all stages of a risk assessment.
Transfers of materials from one medium to another are normally treated as a loss to thesupplying medium and a source to the receiving medium. Deposition and chemical transformation ratesare usually incorporated directly into environmental transport models and models need only to beappropriately linked at the loss-source term.
4.4. ENVIRONMENTAL DISPERSION MODELS
In the absence of direct measurements of exposures produced by specific emissions,quantification of the pollutant concentrations must be made with models that simulate transport andtransformation of materials in the environment. These models can range from the simplest ofcalculations done on hand calculators to state-of-the-art computerized systems that solve coupledpartial differential equations governing transport and transformation of pollutants.
Characteristics that must be considered in selection of a model for estimating pollution dispersioninclude:
54
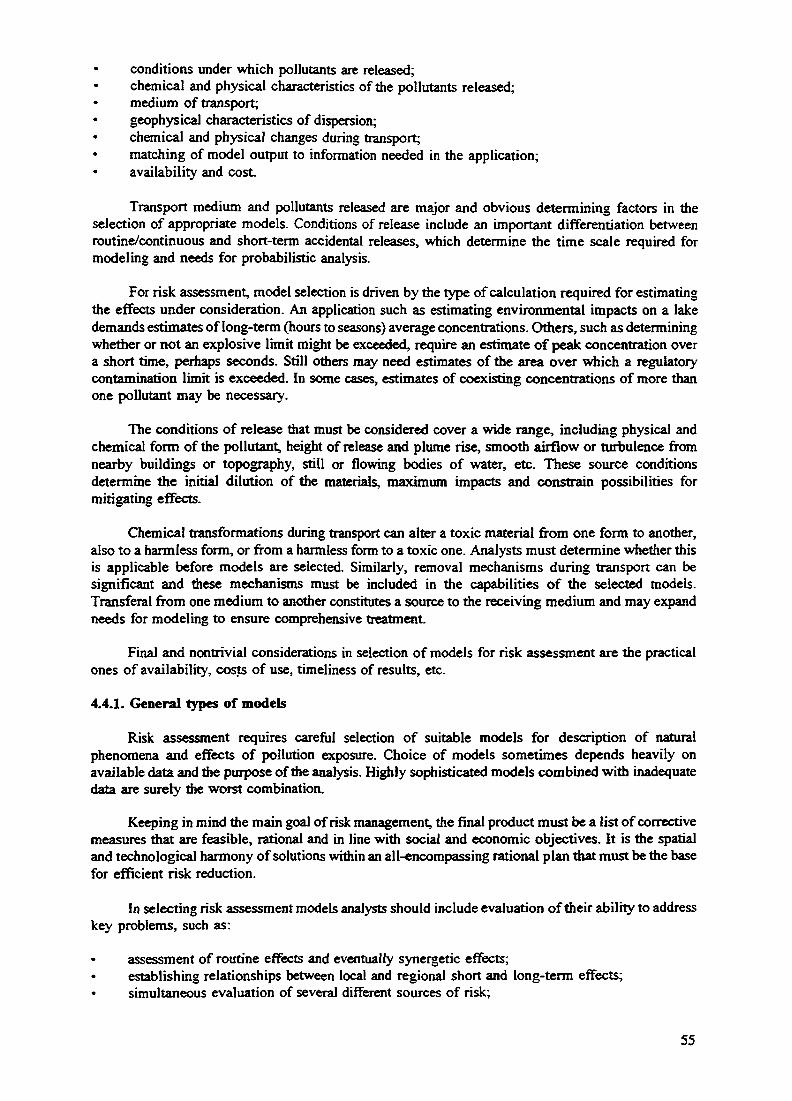
* conditions under which pollutants are released;chemical and physical characteristics of the pollutants released;medium of transport;
* geophysical characteristics of dispersion;chemical and physical changes during transport;matching of model output to information needed in the application;availability and cost
Transport medium and pollutants released are major and obvious determining factors in theselection of appropriate models. Conditions of release include an important differentiation betweenroutine/continuous and short-term accidental releases, which determine the time scale required formodeling and needs for probabilistic analysis.
For risk assessment, model selection is driven by the type of calculation required for estimatingthe effects under consideration. An application such as estimating environmental impacts on a lakedemands estimates of long-term (hours to seasons) average concentrations. Others, such as determiningwhether or not an explosive limit might be exceeded, require an estimate of peak concentration overa short time, perhaps seconds. Still others may need estimates of the area over which a regulatorycontamination limit is exceeded. In some cases, estimates of coexisting concentrations of more thanone pollutant may be necessary.
The conditions of release that must be considered cover a wide range, including physical andchemical form of the pollutant, height of release and plume rise, smooth airflow or turbulence fromnearby buildings or topography, still or flowing bodies of water, etc. These source conditionsdetermine the initial dilution of the materials, maximum impacts and constrain possibilities formitigating effects.
Chemical transformations during transport can alter a toxic material from one form to another,also to a harmless form, or from a harmless form to a toxic one. Analysts must determine whether thisis applicable before models are selected. Similarly, removal mechanisms during transport can besignificant and these mechanisms must be included in the capabilities of the selected models.Transferal from one medium to another constitutes a source to the receiving medium and may expandneeds for modeling to ensure comprehensive treatment.
Final and nontrivial considerations in selection of models for risk assessment are the practicalones of availability, costs of use, timeliness of results, etc.
4.4.1. General types of models
Risk assessment requires careful selection of suitable models for description of naturalphenomena and effects of pollution exposure. Choice of models sometimes depends heavily onavailable data and the purpose of the analysis. Highly sophisticated models combined with inadequatedata are surely the worst combination.
Keeping in mind the main goal of risk management, the final product must be a list of correctivemeasures mat are feasible, rational and in line with social and economic objectives. It is the spatialand technological hannony of solutions within an all-encompassing rational plan that must be the basefor efficient risk reduction.
In selecting risk assessment models analysts should include evaluation of their ability to addresskey problems, such as:
assessment of routine effects and eventually synergetic effects;establishing relationships between local and regional short and long-term effects;simultaneous evaluation of several different sources of risk;
55

assessment of risks over time;uncertainty analysis.
Various environmental dispersion or transport models are available. They fall into three generalcategories based on transport medium:
short and long-range air quality models;water quality models of various types and scales;terrestrial and aquatic food-chain models.
Selection of a suitable model must depend on the aims of the regional risk management projectin which it will be used and on an in-depth evaluation of the parameters and implementationrequirements as well as verification of the adequacy of predicted results.
4.4.2. Atmospheric dispersion models
The goal of atmospheric dispersion modeling is to predict concentrations of pollutants as afunction of time since release and position with respect to the source.The final outputs of dispersionmodels are derived from emissions and atmospheric dispersion conditions, but they can be quitedifferent according to the nature of the problem.
A distinction has to be made between models for accidental releases which use a very short timescale and those for continuous releases which refer to average meteorological and emission conditions.
Some meteorological dispersion models can be expressed in simple mathematical formulae. Theycan be lists of equations to be calculated by hand, using PCs or more complex models run on microcomputers. The simplest models can be run with little experience, the more complicated ones needconsiderable skill and experience. These complex models are normally not applied for routine riskassessment.
Most of the atmospheric dispersion models are deterministic. Risk assessment assumes aprobabilistic approach. This is achieved by using sets of emission values and of dispersion conditionseach of which are affected by probabilities. The model output is consequently also probabilistic.
4.4.2.1. Gaussian plume models
Selection of appropriate meteorological dispersion models depends in part on the relativeproportion of large point sources of emissions to the total regional emissions. Dispersion within 50-80km of one to a few large point sources is normally simulated with some form of plume model andresults for these few sources are added.
Gaussian plume models are commonly used. These models are derived from mathematicaldescriptions of the physical characteristics of dispersion in wandering plumes, and they produce anestimate of the concentration distribution throughout a plume as a function of a few source andmeteorological characteristics. They require as inputs only a source term, an atmospheric stabilitycategory and wind speed and direction. Estimated dispersion is governed by an increase in standarddeviation with distance or by an increase in transfer time. Gaussian plume models assume the pollutantto be passive; they do not account for topography or changes in meteorological conditions. But theycan accept exogenous variables such as release height, deposition parameters and transformationkinetics. These models can be reduced to simplified nomograms giving dilution factors at variousdistances and they are available in easy-to-use microcomputer software packages. If there are areasources, plume models are not appropriate and regional average dispersion models must be used. TheU.S. Environmental Protection Agency has an especially useful guide for selecting appropriate airquality models from among a broad range of models that are in the public domain and available free
56

as down-loadable code on a computer bulletin board system (SCRAMS) or at modest cost from theU.S. National Technical Information Service.
A broad range of more complex Lagrangian and Eulerian regional wind-trajectory models isavailable from various government agencies and packaged in user-friendly formats by private computersoftware firms. These models are data-intensive, require considerable knowledge and experience tooperate properly, and their relative applicability is problem-specific. Analysts should seek advice onthese from experienced meteorological modelers.
4.4.2.2. Physical models
Models of a region with precise representation of topography make it possible to simulate windand temperature patterns and the exact behaviour of one or several plumes. Such models are able toprovide qualitative results that may be compared with sophisticated computer plume behaviour models.
4.4.2.3. Regional air quality models
The simplest air quality models assume some linear relationship between regional averageemissions and regional average concentrations.Coefficients are estimated during a monitoring periodand applied to some future period when emissions are different.
The first of these was die Linear Roll-back Model used in the early days of air qualityassessment to estimate the effect on regional air quality of regulating specific sources. This modelassumed that all sources in an area contributed to measured regional average pollution concentrationin direct proportion to their relative contribution to total regional emissions. Information on emissionsfrom all sources was used to estimate an overall coefficient for concentration per unit emission fromany source, and this coefficient was then used to estimate the change in concentration that would beproduced by a change (increase or decrease) in emissions from each source. This modeling approachcan be expanded to yield coefficients for seasons or for different meteorological conditions, but thebasic idea remains the same.
These models require simple data and are exceedingly easy to use, but are useful only over asmall range of changes from the observations and only for pollutants without complex atmosphericchemistry that makes the emission-concentration relationship non-linear. They contain no causalmechanisms that can be adjusted for new conditions.
4.43. Aquatic dispersion models
The aquatic environment can be divided into a number of media submitted to differentsub-regimes, each requiring a different kind of model:
* surface watersseas, lakes and reservoirsestuariesrivers and canalssurface runoff of rain
stationarysubsurface watersflowing subsurface waters
Except for the simplest of water bodies, modeling water quality is sufficiently complex that itmust be computerized. Many models are available as general-purpose computer software packages thatcan be configured by users for specific bodies of water. A few simple screening-type models areavailable that can estimate maximum allowable loadings of important conservative andnon-conservative pollutants, but cannot estimate concentrations as a function of source strength.
57

4.4.3.1. Surface models
Models of surface water contamination are either steady state or time-dependent. They vary incomplexity, containing two or three dimensions, with or without convection, and with or without sinks.The simplest models are no more than solutions to simple equations that use mixing ratios (perhapstime dependent) and some removal constants. These are usually sufficient only for routine effluents,and can lead to gross estimation errors even in simple cases.
Unlike atmospheric dispersion models, many water quality models are not readily adjustable toconditions different from those for which they were designed. They tend to be highly site-specific.Thus, accommodating site-specific conditions may require gross revisions of existing models or useof models specifically designed to be general-purpose and easily configured by users.
Relatively simple, straightforward models are available for estimating concentrations in riversand streams. More complex models are needed for lakes, reservoirs, and estuaries, because they arereadily stratified and large enough to support complex patterns of flow. Subsurface models are simplein concept, but complicated in execution because of the potential complexity of the subsurfacestructures.
(a) River models
Rivers are modeled as linked segments between nodes where mere are important changes, suchas a large discharge, a large intake, entry of a tributary or a large change in the physical characteristicsof the river. Within segments all conditions are assumed constant except for the flow-controlled timeof transit to the next downstream node. Non-conservative substances, such as decomposing organicsand the associated oxygen uptake, pathogens, radionuclides with short half-lives and substances withhigh deposition, biological accumulation or chemical reaction rates, are estimated as a function of timewhile in each segment Conservative substances accumulate between sources.
Some river pollution problems, for which maximum concentration is of special concern (suchas heat), are modeled as plumes for short and possibly long distances downstream of the dischargepoint.
Organic and nutrient loading of rivers are particularly important and a broad range of helpfulequations and models is available to assist in determining the self-purification capacity of a river andthe maximum organic loading that can be accommodated while maintaining dissolved oxygen levelsat specified minimum levels.
(b) Lake models
Lakes are generally classified as oligotrophic (low nutrients, always oxygenated) and eutrophic(high nutrients, can become anoxic). Oligotrophic lakes tend to be nutrient limited and therefore donot support abundant growth of plants. Within limits, these lakes can absorb exogenous nutrients andoxidize organic material without damage.
Eutrophic lakes have large amounts of nutrients which support abundant growth of algae andother aquatic organisms. Dead plants and animals sink to the lower levels of these lakes wheredecomposition by microorganisms depletes or eliminates oxygen, with associated killing ofoxygen-dependent species. Eutrophic lakes cannot absorb large quantities of exogenous nutrients andorganic materials without damage.
Oligotrophic lakes are usually phosphate-controlled. Vollenweider, in Ref.[15] has developeda simple equation that can be used to estimate the loading of nutrient phosphates that can be addedto an oligotrophic lake without reaching a critical ieveheutrophications can be expected whenphosphorous loading reaches two to three times the critical level.
58

The regime of water flows in lakes can be very complicated with some parts of the water reallystagnating while other parts are flowing like rivers without mixing with the surrounding waters. Forthis reason simple calculations assuming complete mixing and using materials - balance equations maybe completely misleading.
In addition, the water in the lake is strongly stratified. In large and deeplakes this stratificationis completely disturbed according to the season.
Extreme prudence has to be exerted if pollutants or heat are considered to be discharged intothe lakes.
4.4.3.2. Subsurface models
Contamination of subsurface aquifers is modeled in two phases:
• vertical transport through the unsaturated zone;plume-like spreading and transport through the aquifer.
Vertical transport of pollutants through the unsaturated zone above an aquifer is a function ofthe physical and chemical characteristics of the pollutant and the percolation characteristics of the soil.Many organic pollutants are relatively nonpolar and hydrophobic, so they tend to sorb into soils andmigrate more slowly than polar pollutants. Inorganic chemicals can precipitate out. Some low-densityorganics can even float. Soils differ greatly in their physical and chemical characteristics and theirinteractions with specific pollutants.
Similarly, once in the aquifer, pollutants form plumes by diffusion and transport ingravity-driven water flow. Again, the rates of movement are controlled by the physical and chemicalcharacteristics o f the pollutant and the geohydrology of the aquifer. Modeling movement in sand issimple; modeling movement in fractured rock or solution cavities is orders of magnitude morecomplex.
These characteristics are incorporated into models by combining a ground-water flow equationand a chemical mass transport equation. There are separate models for unsaturatedand saturated zones,but they are often linked in comprehensive computer codes.
Groundwater flow modeling requires powerful computer models and the availability of a greatnumber of data. Hydrogeological data may be obtained from cores taken in boring and from classicalhydraulic tests (pumping, water injection, water table level measurements etc.). These tests shouldpossibly be complemented with more specialized tests such as water sample chemical analyses,temperature measurements, tracing substances flow measurements, isotopic sampling e.g. for O18 deficitmeasurement, H3 content, etc.
It is common that the geophysical and hydrological characteristics that must be modeled varyby large amounts over short distances. And because sampling requires expensive drilling programs,data are often sparse.
Oil refineries placed on-shore, sometimes amidst large industrial areas, are the cause ofenvironmental impacts due to normal or accidental conditions.
The impurities in effluent water are of the following sort:
- in solution (e.g. soluble salts and organic compounds);- insoluble material (e.g. higher-molecular-weight oil fractions and suspended solids).
59

The mechanism of the fate of oil in the marine environment is represented by the principalelements of:
- evaporation;- dissolution;- adsorption;- entry into sediments;- hydrocarbons in marine lists.
Data gathering and applying associated models for this problem requires specialized informationand knowledge.
These problems with data quality, plus the long time spans involved in ground-water movements,have hindered verification of models for ground-water transport. Most are not fully verified. Thereliability of model results therefore depends heavily on site-specific conditions and analyst's abilityto account for them adequately in the coefficients supplied to the models. Much professional judgmentis required.
There are basically two types of models used for simulating ground water flows. According tothe scope of the investigation and the data available, direct models are used. In these models thephysical data of the aquifer and water boundary conditions are entered while flows are calculated.Conversely, when the aquifer data is uncertain, an inverse model can be used in which thepermeability (or transmitivity) of the rock structure is calculated from flow data actually measured orassumed for simulation purpose.
4.4.4. Food chain models
Food chain pathways that should be evaluated can be determined from examination of diets,local sources of food, and the likely pathways for contamination of these foods.
A number of conceptual and computerized models has been developed for assessing humanexposures to harmful toxic substances in foods. Although food-chain models are usually categorizedas terrestrial or aquatic they do not differ in concept. All are based on an assumption of equilibriumtransfer rates among "compartments" representing different parts of an ecosystem.
They differ only in their relative complexity i.e. the number of compartments included and thenumber of variables influencing each compartment including multiple interconnections with othercompartments. They range from simple transfer coefficients or bioaccumulation factors expressing theproportion of contamination deposited to water or ground that is ingested by humans(single-compartment) to complex ecosystem models with multiple transfers among many ecosystemcompartments. Bioconcentration factors can be derived from field measurements or they can begeneralized from results of more complex modeling of the contaminant through the food chain underrepresentative conditions.
These models were developed primarily for assessing long-term releases. They can be appliedto short-term accidental releases, but with considerable increases in uncertainty associated with thevalues of model parameters. Their scale is necessarily medium-range; small-scale contamination iseasily prevented from reaching the food-chain and long-range dilution is usually assumed to reduceexposures to insignificance.
In general, the more complex the models, the more site-specific data they require. The mostcomplex are so site-specific that the effort required to adapt them to other sites is generally notjustifiable.
60

4.5. ESTIMATES OF DOSE-RESPONSE RELATIONSHIPS
4.5.1. Background
The need to quantify dose-response curves is tied directly to quantitative risk assessment. To aidin rational planning and decision making it is necessary to estimate health risks associated with newdevelopments or review of existing situations. The method of approach generallyadopted consists ofhazard identification, followed by parallel steps of exposure assessment and dose-response assessment,which are brought together in risk characterization, see e.g., Ref.[16].This section is concerned withdose-response assessment, i.e. the evaluation and quantitative characterization of the relationshipbetween the level of exposure and the health-related response, as given in Ref.[17]. It differs fromother parts of risk assessment in that it is often developed independently of the application on whichthe risk assessment focuses, using data from other sources. A single dose-response assessment can beapplicable to several risk assessment projects.
Toxicity is related to dose. A "toxic" agent is observably toxic at some dose level. Below thatlevel it is apparently safe and may even be beneficial. Depending on the mechanism of effect theremay be a threshold level below which the agent is truly safe or there may be no threshold. In the lattercase, with decreasing dose, the level of effect approaches the level of spontaneous occurrence of thesame effect so that the effect signal becomes lost in the natural variation of the effect. It is thenimpossible to detect the presence of an effect in a particular experimental design, even if it exists. Intheory, one can detect effects, if they exist, at lower and lower dose levels by going to more powerfulexperimental designs, but there are practical limits. There will always be dose levels below which onecannot observe effects directly.
It is statistically impossible to distinguish between a true threshold of effect and a continuingeffect which disappears into the background noise of spontaneously occurring disease. Decisions on(a) whether to treat a dose-response relationship as threshold or no threshold and (b) die form ofequation that should be used for the dose-response function should be based on an understanding ofthe underlying mechanism of disease, not on the dataof a single experiment. In the hazardidentification process, screening experiments are often used to determine if an effect can be observed.The standard animal tumor bioassay of the National Toxicology Program, Ref.[18], for example, isused to determine if a chemical is a carcinogen. This generally consists of exposing animals at threedose levels:the maximum tolerated dose (the highest dose that is not acutely toxic), half the maximumtolerated dose and a zero dose control. The question to be answered is basically "Do the exposedanimals have a higher tumor incidence than the control animals?". This is a different question to askof a data set man "What is the quantitative relationship between exposure and response?".In cancerrisk assessment the process is generally a two-step process. First, ask if the substance is a carcinogen.If the answer is "yes", then determine the quantitative dose-response relationship for use in riskassessment Other situations have been handled as a one-step process and the quantitativedose-response relationship is determined directly. Since the determination that the substance is acarcinogen is made at a high dose level, the confidence limits of the dose-response function mayinclude zero effect at low doses.
Detailed risk assessments are unnecessary if environmental agents are routinely present at levelswhich are clearly toxic to any substantial group of people; if such an exposure occurred, it could bebrought under control by the regulatory authority. Dose-response functions in this clearly toxic rangeare useful primarily to assess effects of accidental exposures. Risk assessment of routine, low levelexposures almost always involves dose-response functions in the fuzzy range below the point whereeffects are clear. As dose-response functions are extrapolated from high doses (where the data havebeen collected) to low doses, uncertainty increases.
Effect models can influence space and time resolution in a given dispersion model. In case ofnon-stochastic effects, which manifest themselves at high exposure levels, there is the certainty that
61

above some threshold level of exposure harm will occur. In this case the harm will be a monotonicallyincreasing function of the exposure, see Fig. 4.5.
Stochastic effects are those in which there is always a probability of harm from any exposureto a contaminant, no matter how small. This situation is given by a dose-response relationship, shownin Fig. 4.6.
For the case of near field of exposure, peak concentrations are relevant. In the far field one hasto define the long-term exposures in order to estimate both the individual and collective exposure risks.
Severity of harm
Threshold Dose
FIG. 4.5. Dose-effect relationship
Probability of harm
FIG. 4.6. Dose-response relationshipDose
62

Mathematically, a dose-response function can be extrapolated down to infinitesimally smalldoses. Practically, limits must be considered. First, at what level does the risk become so low as tobe of no practical concern to either society or the individual?This is often referred to as a "de minimislevel". If the criterion is individual risk, a de minimis level can be determined from the dose-responsefunction directly. If the criterion is the population risk, however, the decision goes beyonddose-response assessment and also depends on the size of the population exposed and the level ofexposure. Second, at what level does the dose-response relationship become too tenuous to justify itsapplication?As the dose level of concern extends further from the range for which experimental orobservational data are available, uncertainty increases. In general, either a threshold is established ora decision is taken to assume a continuous dose-response function to zero dose.
The most important current problem in the interpretation of dose-response functions and the riskassessments using them is that of including an appreciation of uncertainty and of individual risk levelsin the final risk estimates. Typically, the size of the population at risk and the uncertainty in thedose-response function increase with decreasing exposure levels. It is difficult to judge the importanceof estimates of high population risk when large populations are exposed to low doses without a clearunderstanding of the uncertainty.
4.5.2. Kinds of exposures: Dose-response implications
4.5.2.1. Exposure and dose
An understanding of dose-response assessment and if s use in risk assessment requires a cleardistinction between exposure and dose. Exposure is the concentration (or amount) of pollutant in theenvironment to which a person is exposed, e.g. 25 ug/m3 in the air one breaths or e.g. 50 ppb in thewater one drinks. Dose is the amount of pollutant reaching the organ, tissue, or specific cell of interest.Interposed between the two are simple factors such as breathing rate (e.g. an exercising person has afaster breathing rate and thus inhales more pollutant than the sedentary person with the same exposure)as well as complex metabolic and pharmacokinetic processes, as described in Ref.[19]. The dose ofconcern may not even be the same material as the exposure but a chemically altered metabolite (e.g.the actual cancer-producing agent in an exposure to benzo[a]pyrene is its metabolite 7b,8a-dihydroxy-9a, 10a-epoxy-7,8,9,10-tetrahydrobenzo[a]pyrene). Therefore, the term dose-responsefunction most commonly indicates an exposure-response function.
Risk assessments must deal with multi-media exposures including air, water, and food-chains.The same level of exposure in different environmental media can lead to vastly different doses at thetissue level. The exposure-response function is thus highly dependent on how the person was exposed.For example, while the exposure-response function for lung cancer from benzo[a]pyrene in air maybe substantial, the exposure-response function for lung cancer from benzo[a]pyrene in food may bezero. However, the true dose-response function for the lung is independent of how the person wasexposed or how the pollutant reached the lung. The true dose-response function may be difficult todetermine, since the actual dose to the target organ is difficult to measure. The target tissue itself maybe unknown or in questionris it the whole lung or the basal cells of the bronchial epithelium?
An exposure-response function thus incorporates the metabolic, pharmacokinetic and otherprocesses which intervene between the initial point of exposure and the tissue of interest. Theseprocesses are often poorly understood and, from what is known, can be highly non-linear and involvesubstantial interspecies variation.The current trend is to couple physiologically based pharmacokineticmodels, which predict organ or tissue dose, with dose-response models which predict health effectsfrom biologically relevant dose. Unless the relationship between exposure and dose can be quantified,one must exercise care in using a dose-response function based on ingestion in a risk assessmentinvolving an inhalation exposure or even in extrapolating from high doses to low doses.
63

4.5.2.2. Averaging time
Concentrations of pollutants in air vary over time and space. A person standing in one spot issubmitted to a continually varying exposure. People moving through their daily activities are exposedto even wider variations in exposure. Averaging times for exposure measurements range from secondsto 24 hours or longer. For acutely toxic materials, a single breath exposure may be an appropriatemeasure, although the more conventional approach is a 30-minute exposure. The latter defines thelevelimmediately dangerous to life or health given, e.g. in Ref.[20]. For some pollutants (e.g. ozone,nitrogen oxides), peak exposures seem to be important in causing effects although the role of thetime-distribution of the peak or the interval between peaks is not well understood. For yet otherpollutants, particularly those which accumulate in the body (e.g. lead, cadmium), long term averagesare more appropriate measures. In deriving dose-response functions the importance of exposureaveraging time is often neglected. In many cases, lack of data on effects at the desired averaging timeforce the analyst to rely on less suitable data. For example, data from short term occupational oraccidental exposures may be used as surrogates for population dose-response functions. Considerationshould always be given to the match between the averaging time of the dose-response function(presumably that from the underlying experiment) and that of the exposure data in the risk assessmentWhen they do not match, assumptions must be made about the relationship between average and peakexposures.
4.5.2.3. Time-regimen of exposure
Uncertainties are introduced in risk assessments by applying dose-response functions based onanimal experiments in which the animals were exposed 5-days per week or from occupationalepidemiologicai studies in which the workers were exposed for 8-hours per day, S-days per week, togeneral populations with continual exposures (although varying in magnitude). A correction factor isused to pro-rate the exposure on the assumption that only the long term average is of importance. But,is there a recovery factor over the weekend? Does this make a difference when carried through to alow dose extrapolation? Quantitative answers are seldom available to such questions, but somequalitative information, based on knowledge of the action of the chemical, may be available.
4.5.2.4. Complex mixtures
No one is exposed to a single pure chemical. Dose-response functions, on the other hand, arealways expressed in terms of single chemicals, sometimes in a pure state (usually derived from animalexperiments), sometimes as an index of a mixture (usually derived from epidemiological studies). Theindex-based dose-response function presumably would overestimate the risk in this situation. Ingeneral, the state-of-the-art precludes more than simple assumptions of independence of action in mostcases, but further information is available in References [21,22,23].
4.5.2.5. Measurement techniques
Technical considerations in measuring exposure, dose, or effect are often ignored. Adose-response function is developed from a study in which both exposure and response were measured.It is then applied in a risk assessment in which only exposure is measured (or estimated with models).This is particularly true for composite indices such as "fine particles" or "total organics". Although thisis not the principal source of error in risk assessments one must give some consideration to thecompatibility of the exposure measures in the risk assessment and the dose-response function. Fromthe standpoint of dose-response there is, thus, an obligation to provide adequate documentation on thebasis of the exposure.
Ambient concentrations may not be the same as exposure. Environmental measurements aremade for many different purposes and in many different ways. Those made in conjunction withdose-response studies must be designed to provide estimates of exposure to people. Surprisingly, onlyin the past decade has it become commonly considered in air-pollution epidemiology and risk
64

assessment that people spend the majority of their time indoors and that outdoor measurements maybe poor indicators of exposure, a consideration addressed in Ref. [24]. Personal monitoring, monitoringof micro-environments, including indoor monitoring and monitoring in vehicles and personal activitypattern analyses are now almost a "sine qua non" in air pollution health effects studies. Recent studies,Ref.[13], are following the concept of "total exposure".
4.53. Kinds of effects: Implications for dose-response
There are many health end-points for which dose-response functions are available or might bedesirable for risk assessment Commonly used end-points depict diseases which are of greatest concern,e.g. cancer, heart disease, or reproductive effects. They also include injury, mortality and effects onfuture generations. These end-points have obvious social significance that can be understood easily bythe decision maker. For example, a risk assessment which concludes mat a given action will produceten additional cancers per year fits easily into a decision process. If desirable, such results can readilybe translated into monetary terms to allow calculation of benefit-cost ratios in like units. There is somefeeling that such end-points may over-simplify the risk, reducing it to "body counts" that are oftenartificial. This is particularly pertinent in the case of low-level effects spread over a large population.The numbers may be a useful index to the analyst but have quite a different meaning to the public.
Two recent advances in the study of health effects are a focus on sensitive subgroups in thepopulation and on early biological and biochemical markers of disease.
4.5.3.1. Sensitive populations
Important effects may be missed in large population studies if they occur only in sensitivesubgroups that are not identified and examined separately or in sufficient numbers.
4.5.3.2. Early markers of disease
Parallel to the increasing use of biochemical markers of dose, research efforts have recentlybegun to focus on early biochemical indicators of disease rather than the disease itself. These may ormay not have direct significance themselves and so are more difficult to incorporate in a riskassessment
4.5.3.3. Morbidity
Morbidity is the recognized presence of disease. It is generally expressed as incidence (numberof new cases developing annually per 1000 people in a population) or prevalence (number of casesextant per 1000 people in a population at a given time). The former is more appropriate fordose-response relationships. Dose-response relationships usually relate exposure to a specific pollutantwith a specific disease. For example, sulfur dioxide with respiratory disease, lead with neurotoxicdiseases, cadmium with kidney disease. Special subcategories of morbidity are reproductive anddevelopmental effects. The former is associated with preconceptual exposure to the mother or fatherwhile the latter is associated with exposures (through the mother) to the fetus. Risk assessmentapplications of these effects are discussed in Ref. [25].
4.5.3.4. Mortality
Total mortality is frequently used as an end-point in dose-response functions. An importantconsideration for risk assessment in mortality studies has been the length, quality, or value of life lostThe probability of death is one. It is not the fact of death but the unnecessary cutting short of life thatis of concern. Expressing the response in terms of years of life lost would help solve the problemregarding the length of life lost. Some examples may help to clarify the problem. An analysis of thebenefits of superior ambulance service might count the number of heart attack victims whose liveswere saved. Would a victim of multiple heart attacks who was saved, say 3 times, count the same as
65

3 separate people each saved once? Would saving a 50-year old heart attack victim count equally withsaving a 25-year old traffic accident victim? If the 50-year old had an average expectation of 25 yearsto live and the 25-year old an average expectation of 50 years to live, would saving one 25-year oldbe an equivalent benefit to saving two 50-year olds? These are questions for risk assessments or policyassessments, not for dose-response per se, but they can never be addressed unless dose-responsefunctions include the necessary detail. The data are often difficult to obtain. Consider the case of airpollution - mortality risks [26]. Even though the London fog of 1952 resulted in 4000 deaths abovethe normal, decades of study passed before it was demonstrated that the deaths were not all simplya harvesting of people who would have died over the next few days anyway. While it is generallyagreed that the deaths were among people with poor adaptive capacity due to serious lung disease,heart disease, asthma, or other advanced chronic disease, the question of whether a few months or 20years of life was lost to the average victim is still unresolved. No clear determination has been madeof the years of life lost per death in macro-epidemiological studies of air pollution mortality, whichare more likely to represent chronic effects. In Reference [27] a broad estimate is made that the mostlikely range was from 5-15 years lost per death with a range mat could be as wide as from 1-30 yearslost per death.
The difference between the ambulance and the air pollution examples illustrates an importantpoint regarding risk assessment of effects of environmental exposures. Environmental effects areseldom specific. There is no way to distinguish a death or a lung cancer from air pollution from otherdeaths or lung cancers. Therefore, it is not possible in these cases to gamer statistics specifically onthe victims of air pollution or other environmental agents. In the ambulance case, one can find outspecifically the ages and past medical histories of the victims assisted; in the air pollution case onecannot. Key pieces of information must be estimated indirectly. There are, of course, someenvironmental agents which produce specific effects, leave characteristic markers or act so quickly thatvictims can be easily identified. A special case of the latter effect is injury. The victim of an accidentalinjury is immediately identifiable and detailed statistics on the characteristics of the victim and thecircumstances of the injury are frequently available.
4.5.4. Data sources and their implications
Data for dose-response functions come from three basic sources: (1) studies of humanpopulations, both epidemiological and clinical; (2) toxicological studies on whole animals, generallymammals; and (3) laboratory studies on human or animal cells or tissues or on lower life forms suchas bacteria.
Any study which is to provide the basis of a dose-response function must include informationon both exposure (or dose) and the health response.
Before attempting to derive a dose-response relationship from basic data, however, the riskanalyst should seek relationships already developed and available in the literature. Suitable quantitativerelationships are available for many pollutants along with considerable background analysis anddiscussion. For other pollutants, qualitative or semi-quantitative reviews may be available. The USEnvironmental Protection Agency has developed numerous quantitative dose-response functions,especially for carcinogens. These are available in computerized form, along with other dose-responseinformation, in EPA's Integrated Risk Information System (IRIS). IRIS includes some on-linedocumentation, but cites appropriate source reports. Other useful sources include WHO's series onEnvironmental Health Criteria and the publications of the International Agency for Research onCancer. Numerous commercial publications compile available dose-response functions orsupplementary information, e.g. Refs [21,28,29,30,31,32,33].
4.5.5. Deriving the dose-response relationship
A dose-response relationship specifies a quantitative increase in a specific health effectassociated with an increase in exposure to a pollutant. The effect may be in absolute terms (number
66

of increased cases per 1000 people per unit of exposure) or in relative terms (percentage increase inbackground rate per unit of exposure). Dose-response relationships are usually derived through theapplication of a mathematical model to data from epidemiological, toxicological, or clinical studies.Mathematical models simplify the underlying biological mechanisms and often include assumptionsthat are not experimentally verifiable.
Mathematical and statistical methods of deriving quantitative dose-response relationships froma toxicological or epidemiological data set are well known. Almost never is a single study sufficientto determine the form of the dose-response function. In fact, for extrapolations to the low-dose region,there is seldom sufficient information on which to select a functional form; it must be assumed.Ideally, the form of the function (i.e. the shape of the dose-response curve), be it linear, quadratic,exponential, threshold or no-threshold, is based on the entire body of knowledge available on themechanisms involved in producing the observed effects from the kind of agent of concern.
A dose-response function can take several forms. Qualitatively, as dose increases, differenteffects of increasing severity occur within an individual. Carbon monoxide, for example, at low levelsof exposure causes measurable (though not noticeable) visual impairment and decreased manualdexterity; at increasingly higher exposure levels the progression of symptoms includes headache,dizziness, nausea, vomiting, collapse, coma and ultimately death. Because of differences in individualsusceptibility the threshold for each level of effect will differ among individuals. Quantitatively, thedistribution of these thresholds describes a population dose-response function for that individual effect.That is, at increasing levels of dose, the particular effect will occur in an increasing number of people.This is called a statistical or tolerance distribution model. This is an appropriate form for thresholdphenomena and is the basis of classical toxicology in which dose-response functions are oftenrepresented as probit curves.
In some cases, detailed dose-response function equations are themselves incorporated into riskassessments. More frequently, however, results of such dose-response modeling are reduced to a singlecoefficient, the slope of a linear portion of the dose-response curve. This coefficient is then simplymultiplied by the exposure to yield the effect on the population. While the state of knowledge maynot warrant a more complicated approach, it is important to be aware of the assumptions behind this.It assumes a linear dose-response function, at least within the range of exposures in the population ofinterest Equally important, it assumes a dose-response function in one variable, excluding any effectof concurrent exposures or population-based factors such as age or susceptibility.
Consider a dose-response function for which the exposure of interest (F() is unknown, but thereis a potency estimate (PJ. For a similar exposure, both the dose-response function (Fs) and the potencyestimate (Ps) are known. In the simplest form, the desired dose-response function is estimated as:
F.-F.CVP.)
This is an example of combining different kinds of health effects information to produce adose-response function for which insufficient information was available from a single kind ofinformation.
It is generally recognized that drawing on all the information available is more likely to providea better dose-response function than one based on a single study. While information from other studiesis often used to support the dose-response function based on a single study there is no generallyrecognized analytical method to mathematically combine data from several sources to form a combineddose-response function, although such integration of results is obviously done subjectively.
4.5.6. Levels of aggregation: Population at risk
Each individual responds uniquely to an environmental exposure, but it is impracticable to makeenvironmental risk assessments at the individual level. Instead, the population must be divided into
67

groups with similar characteristics. The degree of detail in grouping depends primarily on informationavailable for exposure and dose-response. Thus, the more detail available in the dose-responsefunction, the more flexibility for grouping is available in the risk assessment It is always possible forthe risk assessment to be conducted at a more aggregated level than the dose-response function, butseldom possible to meaningfully work at a more detailed level. There are basically three classes ofgrouping:
(1) demographic factors, (e.g. age, sex, and race);(2) constitutional factors, (e.g. genetic predispositions, pre-existing disease, constitutional
susceptibilities resulting from earlier disease, and susceptibilities or sensitivities resulting fromprevious exposures);
(3) exposures, especially the exposure level of the particular agent of interest but also others,including smoking, diet, and concurrent occupational or environmental exposures.
Some of these factors can easily be included in a dose-response function and used in a riskassessment. These include the demographic factors and many exposure factors. Others are moredifficult. Information on genetic susceptibility, for example, may be impossible to obtain. Often,surrogate factors such as socio-economic level are used as indicators, too.
4.5.7. Uncertainty
Dose-response functions, particularly for low-level exposures, are inherently subject toconsiderable uncertainty. If this uncertainty is not explicitly incorporated in the dose-response function,results derived from using the dose-response function can be misleading. Several reports provide usefulinformation on the characterization of uncertainty in dose-response functions and their application inrisk assessments, such as Refs [34,35,36,37].
Reference [38] lists five areas in quantitative risk assessment which have important uncertainties.First is in high- to low-dose extrapolation. This can apply to dose-response functions derived fromoccupational as well as animal studies. Second is animal to man extrapolation. Third is extrapolationfrom long-term to short-term exposures. In the case of carcinogens, the studies from whichdose-response functions are drawn must be long-term; the application of these dose-response functionsto short-term exposures introduces uncertainties. In other situations, dose-response functions developedfrom short-term studies might be extrapolated to long-term exposures, also introducing uncertainty.Fourth is the subject's age at the time of exposure, and fifth the extrapolation from one route ofexposure to another.
In any situation in which a model is used, two basic sources of uncertainty must be considered:
(1) uncertainty in the appropriateness of the functional form of the dose-response model;(2) uncertainty in specifying the parameters of that model, which has to do with the validity of data
and the stochastic nature of events.
Since the use of 95% confidence levels is so ingrained in science and since risk assessmentdraws heavily on science, 95% confidence levels are often used in risk assessments. The degree ofuncertainty in risk assessment and especially in dose-response assessment, is usually so great thatestimating 95% confidence bounds requires assumptions about the shape of probability distributionsthat are unwarranted. It is better to present 67% or 80% confidence bounds in which one hasconfidence, than 95% confidence bounds which may be misleading.
The ideal, and generally practicable solution, in the case of dose-response functions, is toexplicitly include sufficient uncertainty information so that decision-makers (who may be the public),who are in a better position to judge the appropriate level of confidence for a particular analysis, candraw their own conclusions.
68

4.5.8. Guidance note
All quantitative dose-response functions involve considerable uncertainty at low dose levels. Ifthis uncertainty can be adequately characterized and expressed, however, quantitative dose-responsefunctions can be usefully applied in health risk assessments to guide planning and policy.
Dose-response functions, in general, represent biological relationships which are commonworld-wide. The same dose-response function can thus be used in risk assessments in different settingsand cultures. In any case, however, even in situations seemingly similar to that in which thedose-response function was derived, the specific applicability of the dose-response function should beinvestigated. Areas of particular importance to assure compatibility include characteristics of exposureand of the population at risk. Are the exposure measurement techniques, concurrent exposures to othermaterials, and the relationship between the overall complex mixture to the index compound in the riskassessment compatible with those from which the dose-response function was derived? Is the effectassociated with particularly sensitive subgroups of the population or does it depend on a particulardistribution of sensitivity in the population? Ideally, dose-response functions should be disaggregatedin such a way that dependencies on characteristics of the population at risk are explicit.
4.6. ASSESSMENT OF CONTINUOUS EMISSIONS IMPACTS TO THE ENVIRONMENT
Assessment of environmental impacts is more complex than that of human health impactsbecause of the large variety of species and physical entities involved, the availability of toxicologicaldata on only a few and the need to consider competition, predation, and other ecological interactions.To make the task manageable, effects are usually addressed in terms of aggregate indices (totalbiomass or species diversity) or assessment is limited to key species.
Four key issues in an ecological risk assessment programme are relevant:
1. Which ecological resources are at risk? What are the characteristics of these ecosystems and howdo they respond to pollution? What are the best indicators and endpoints to determine thecondition of these ecosystems? What are the best methods for screening and characterizingpollutants in these ecosystems?
2. What is the condition of the environment and how is it changing? What are the baselinecharacteristics that define a healthy ecosystem against which to measure change? How are theaffected ecosystems changing? Which pollutants are contributing to ecosystem deterioration?How accurately can ecosystem exposure and effects models predict reality?
3. To what levels of pollutants are the ecosystems exposed? What pollution levels exist in theenvironment? What biological, chemical or physical processes form and transform complexpollutants and how are they taken up in the environment? What are the most accurate andsensitive biomarkers of pollution exposure?
4. How do pollutant exposures affect ecosystems? What structural properties of chemicalspredispose mem to be biologically active and what are the best methods for predicting theireffects? How can we predict effects of long term, indirect, or cumulative exposures ofecosystems to pollutants? How can laboratory data be extrapolated to ecosystem effects? Howcan effects seen in one species, population, or community be extrapolated to others?
69

4.6.1. Endpoints
The diversity of possible endpoints requires that they be divided into classes as described below:
Biome: Biomes represent large types of environment: tundra, deciduous forest, grassland, anddesert. Many specific processes of environmental impact and ecological models through which thoseprocesses are quantified to explain impacts or estimate risk are biome specific.
Structure and function: The health of ecological communities can be evaluated by parametersmeasuring their structure and function. Species diversity is a frequently used measure. The greater thediversity of species in a community, the stronger that community is ecologically.
Physical support entities: Air, water, and soil are the basis of the environment. Whileenvironmental impact assessment often focuses on the biosphere, the biological inhabitants of thephysical world, the term environmental quality itself usually refers to the physical state of air, water,and soil. While in health effects assessment degrading environmental quality is addressed in terms ofpotential risks to human health, in environmental assessment it is addressed bom in terms of its ownmerit and for its implications for the biosphere. In some cases the latter relationships are sufficientlywell established that physical environmental parameters can be used as indices of ecological damage.For example, to define the relationship between acidification of freshwater lakes and the resultingimpacts on aquatic life it is often sufficient that the latter be indexed solely on the basis of predictedchanges in pH of the lake water.
4.6.2. Assessment methods
Matrix approach: This is essentially a checklist approach, widely used in environmental impactassessment It helps assure completeness but, in itself, is not sufficient for environmental riskassessment
Thresholds: There are often specific levels of environmental quality parameters (e.g. pH inlakes) that represent the threshold of ecological change. A series of such thresholds can represent aprogression of stages in ecological decline. Thresholds may also be toxicological benchmarks such asLC*.
Functions: Where decline is continuous, without clear thresholds, continuous damage functionsmay be available. Such functions have been developed for the impact of air pollution on agriculturalcrops, for example. Ideally, functions should include extrapolation errors, which are the appropriateuncertainty factors associated with extrapolation from laboratory test organisms to field observations.
Simulation models: Thresholds or formulae, while often useful for environmental assessment,are generally limited in the kinds of impact they can represent and are always a simplification.Analysis of complex ecosystems usually requires more detailed models that can integrate the combinedeffect of multiple relationships. Models have often proven to be powerful guides for studying andunderstanding ecological relationships, but less useful as predictors of future effects. Nonetheless, theycan serve as useful comparative measures of the possible impacts of different policy options. Addeddetail in highly complex models may improve predictability, although too much detail can introducecrippling problems of parameter estimation and error propagation. In some cases, simplified modelsmay be preferred even when detailed data are available. The status of ecological models has beensummarized in Ref. [39].
Long-term predictability remains an elusive target. There are severe limits to how long into thefuture the behavior of complex systems with many feedbacks can be projected. Such projectionsshould be replaced by short-term predictive schemes coupled with monitoring and adaptivemanagement approaches that incorporate both modeling and monitoring.
70

Probabilistic models: Probabilistic models explicitly take into account the variability anduncertainty in natural systems. These include analysis of extrapolation error (mentioned above),fault-tree analysis applied to elucidate causal linkages between pollutants and endpoints, ecosystemuncertainty analysis using Monte Carlo simulation, and ecosystem models for extrapolating laboratorytoxicological data so that they can be used to estimate risks to populations and ecosystems , see Ref.[40].
Expert judgement: Few, if any, needs for environmental risk assessment can be metsatisfactorily with ecological models within the foreseeable future. While these models may providevaluable guidance, they must be used in an integrated way with expert judgment. Judgments can beapplied to policy making using techniques such as decision theory or analytical hierarchy method.Environmental applications of the latter are described in Ref. [40].
71

5. ANALYSIS OF ACCIDENTS FROM FIXED FACILITIES
5.1. OVERVIEW
Government, industry and the community now recognize the need to identify, assess and controlthe risks to both people and the environment from potentially hazardous industries. Appropriate sitingand comprehensive risk assessment and safety management are therefore essential in ensuring orderlydevelopment and at the same time the safety of people and the environment.
Good industrial safety practices, engineering safety codes and standards, design and operatingprocedures remain at the core of safety management. The increasing awareness of hazards andaccidents, that may result in a significant loss of life and property, has led to development andapplication of systematic approaches, methods and tools for risk assessment. These methods termed"hazard analysis" or "quantified risk assessment" are hazard evaluation tools. Fig. 5.1 is an overallscheme of the risk assessment process, which involves: a system description, the identification ofhazards, the development of accident scenarios and events associated with a process operation or astorage facility, the estimation of the effects or consequences of such hazardous events on people,property and the environment, the estimation of the probability or likelihood of such hazardous eventsoccurring in practice and of their effects - accounting for the different operational and organizationalhazard controls and practices, the quantification of ensuing risk levels outside the plant boundaries interms of both consequences and probabilities, and the assessment of such risk levels by reference toquantified risk criteria.
The process of quantified risk assessment is probabilistic in nature. It recognizes that accidentsare rare and that possible events and risks cannot be entirely eliminated. Because major accidents mayor may not occur over the entire life of a plant or a process, it is not appropriate to base the assess-ment process on the consequences of accidents in isolation. The likelihood or probability of suchaccidents actually occurring should be taken into account. Such probabilities and resultant risk levelsshould reflect the level of design as well as operational and organizational controls available at theplant. Table 5.1 is a summary listing of major chemical accidents/incidents during the period 1950-1988.
HAZARDIDENTIFICATION
MODELINGOF
ACCIDENTS
CONSEQUENCEASSESSMENT
RISK ESTIMATIONAND
ASSESSMENT
FREQUENCYESTIMATION
FIG. 5.1. Overview of quantitative risk assessment procedure
72

TABLE 5.1. MAJOR CHEMICAL ACCIDENTS/INCIDENTS (1950-1988)
YEAR
1950-1960
1955-1959
1956
1959
I960
1965
1968
19701971-1972
1972
1973
1974
COUNTRY
Japan
Japan
Turkey
UK
Morocco
India
UK
Japan
Japan
Iraq
USA
USA
UK
USA
LOCATION
Minamata Bay
Toyama
Bombay
Epplng
Fukuoka
Osaka
St. Louis
Market TreeFort Wayne
Michigan
OreensburgFllxborough
Decatur
Wenatchee
Houston
TYPE OFACCIDENT/INCIDENT
Foodstuff contamination(fish)
Foodstuff contamination(rice)
Foodstuff contamination(seed)
Foodstuff contamination(flour)
Food stuff contamination(oil)
Foodstuff contamination(oil)Foodstuff contamination(flour)
Foodstuff contamination(oil)ExplosionFoodstuff contamination(seed)
Rail accident (fire)
Rail accidentRail accident
Foodstuff contamination(livestock)
Rail accident
Plant (explosion)
Rail accident
Rial accident (explosion)
Rail accident (explosion)
CHEMICAL(S)INVOLVED
Methyl mercury
Cadmium
Hexachlorobenzene
Bndrin
O-Cresyl-phosphate(OCP)
O-Cresyl-phosphate(OCP)
4,4-Methylenedianiline
PCBs
OasMelhylmercury
Propylene
LPOVinyl chloride
PBBS
ChlorineCyclohexane
IsobutaneMonoethyl ammonium
Butadiene
Deaths
439
0
400
0
0
0
0
0
92459
0
028
7
2
1
OUTCOME
Injuries'
1,044
200
3,500'
59
2,000'
58
84
200'
6,071
250
333
8
89
152
112
235
Evacuated11
25004500
2000
3000

TABLE 3.1. (com.)
YEAR
1975
1978
1979
COUNTRY
German Dem.Rep.
Netherlands
USA
Italy
Jamaica
USA
German Dem.Rep.
Italy
Mexico
Spain
UKUSACanada
China, Taiwan
LOCATION
Helmstetten
Beek
Eagle Pass
Niagara Falls
Seveso'
Houston
Deer Park
Baton Rouge
Regensburg
Manfredonia
Xilatopec
Hulmanguille
Los Alfaques
Oxford
Youngstown
Mlssisauga
Yucheng
Three Mile Island
Crystal City
Crest View
Memphis
TYPE OFACCIDENT/INCIDENT
Warehouse
Road accident (explosion)
Road accident
Rail accident
C h e m i c a l p l a n t(explosion)
Foodstuff contamination(flour)
Road accident
Rail accident
Plant (explosion)
Factory fire
Plant
Road accident (explosion)
Explosion (pipe)
Transport accident
Road accidenl
Rail accident (leak)
Rail accident
Foodstuff contamination
(o»)
Reactor failure
Warehouse
Rail accident
Storage
CHEMICAL(S)INVOLVED
Nitrogen oxide
Propyulene
LPOChlorine
Dioxln (TCDD)/2,4,5T
Paralhion
Ammonia
Ammonia
Chlorine
Nitrogen oxide
Ammonia
das
Gas
Propylene
Chlorine
Chlorine
Chlorine/propane/butane/toluene
PCBs/PCDFs
Radlonuclldes
Pesticides
Ammonia/chlorine
Parathion
OUTCOME
Deaths
14
17
A
0
17
65
0
100
38
216
8
0
0
Injuries'
104
34
176
193
62
178
200
40
150
200
99
114
1900*
140
Evacuated*
10000
730
10000
2000
10000
3500
220000
200000
6000
4300
200
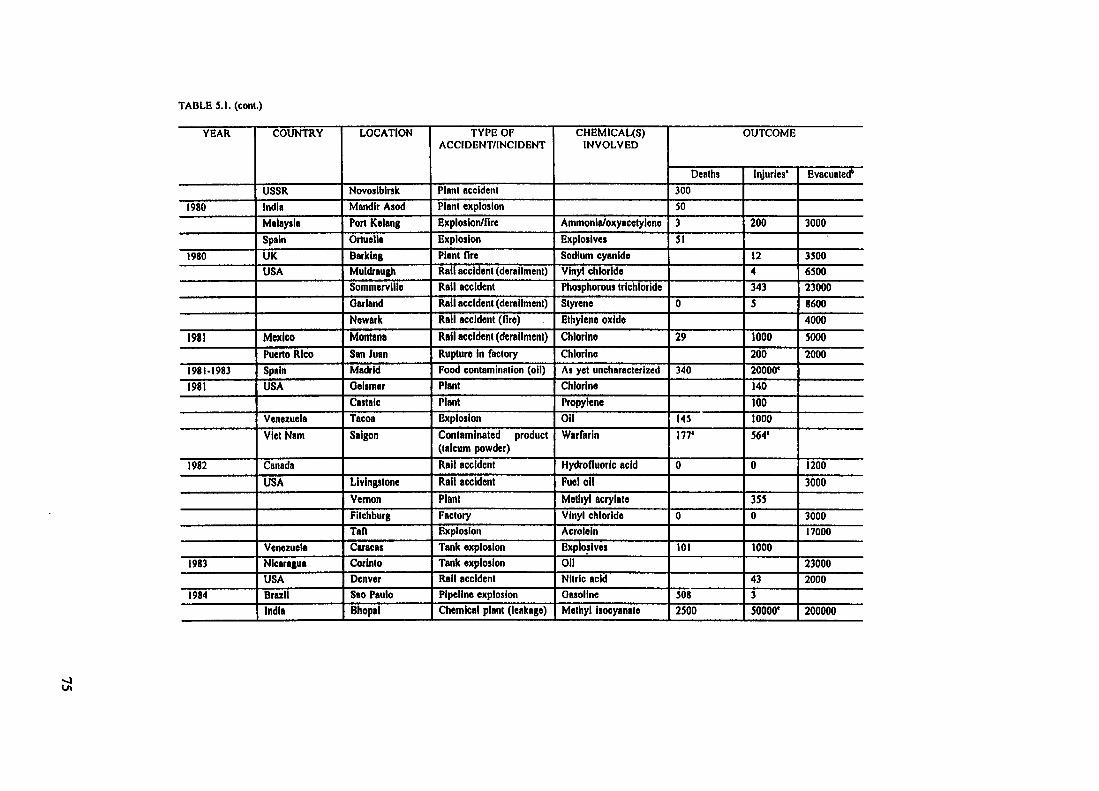
TABLE S.I. (com.)
YEAR
1980
1980
1981
1981-1983
1981
1982
1983
1984
COUNTRY
USSR
India
Malaysia
Spain
UKUSA
Mexico
Puerto Rico
Spain
USA
Venezuela
Viet Nam
Canada
USA
Venezuela
Nicaragua
USABrazil
India
LOCATION
Novosibirsk
Mandir Asod
Port Kelang
Ortuella
Barking
Muldraugh
Sommerville
Oarland
Newark
Montana
San Juan
Madrid
Oeismar
Castalc
Tacoa
Saigon
Livingstone
Vernon
Fitchburg
Talt
Caracas
Corinlo
Denver
Sao Paulo
Bhopal
TYPE OFACCIDENT/INCIDENT
Plant accident
Plant explosion
Explosion/fire
Explosion
Plant lire
Rail accident (derailment)
Rail accident
Rail accident (derailment)
Rail accident (fire)
Rail accident (derailment)
Rupture in factory
Food contamination (oil)
Plant
Plant
Explosion
Contaminated product(talcum powder)
Rail accident
Rail accident
Plant
Factory
Explosion
Tank explosion
Tank explosion
Rail accident
Pipeline explosion
Chemical plant (leakage)
CHEMICAL(S)INVOLVED
Ammonia/oxyacetylenc
Explosives
Sodium cyanide
Vinyl chloride
Phosphorous trichloride
Styrene
Ethylene oxide
Chlorine
Chlorine
As yet uncharacterized
Chlorine
Propylene
OilWarfarin
Hydrofluoric acid
Fuel oil
Methyl acrylate
Vinyl chloride
Acrolein
Explosives
OilNitric acid
Oasoline
Methyl isocyanate
Deaths
300
50
3SI
0
29
340
145
177'
0
0
101
508
2500
OUTCOME
Injuries'
200
124
343
5
100020020000'
140
100
1000
564'
0
3550
1000
433
50000'
Evacuated'
3000
3500
6500
23000
8600
4000
5000
2000
1200
3000
3000
17000
23000
2000
200000
J

OSTABLE 5.!. (cont.)
YEAR
1985
1986
1987
1988
COUNTRY
Mexico
Matamoras
Pakistan
Peru
USA
India
Mexico
USA
Ukrainian SSR
China
USA
USSR
LOCATION
St, J. Ixhuatepec
Fertilizer factory
Oarhi Dhoda
Callao
Mlddleport
Sauget
Linden
Bombay
New Delhi
Guadalajara
Institute
Peabody
Chernobyl'
Quangxl province
Shanxi
Wilson country
Nantleote
Ohio
Confluence
Yaroslavl
TYPE OFACCIDENT/INCIDENT
Tank explosion
Ammonia
Explosion (gas-pipe)
Pipeline explosion
Plant
Plant
Plant
Industrial accident (pipeburst)
Industrial accident(leakage)Rail accident (leakage)Fire
Plant
N u c l e a r r e a c t o r(explosion)
D r i n k i n g w a t e rcontamination
Rail accident
Factory fire
Road accident
Rail accident
Rail accident
CHEMICAL(S)INVOLVED
Gas
Natural gas
Methyl isocyanate
P h o s p h o r o u soxychloride
Malathion
Chlorine
Sulphuric acid
Sulphuric acid
Aldicarbe oxime
Benzene
Radionuclides
Methyl alcohol
Ammonium bicarbonate
Sulphuric acid
Sulphuric acid
Phosphorous trichloride
Propane gas
Deaths
452
60
1
0
0
131
550
00000
OUTCOME
Injuries'
4248
200
110I2S
161DO
49
49
140125300
3600
15400
0
0
6034
Evacuated*
31000
3000
3000
5000
5000
135000
3000
18000
2000
1000
2000
' Or affected In cases of poisonings.' Majority of data are approximations.' Approximation.' Accompanied by widespread conumlnation of livestock and crops,e Infants.
Accidents/Incidents listed are those which have caused 30 or more deaths and injuries and/or 1000 evacuated.Accideni/lncldents associated with the use of pesticides or drugs are nol included.Figures for numbers of Injuries do nol include numbers of deaths.Incidents need nol be of accidental origin and commonly result from ignorance or malpractice (e.g. uncontrolled chemical waste disposal or misuse of chemicals).Data have been taken from Refs( 4l,«,4J,44.45,4o).

There are a number of uncertainties associated with the quantification of risk. Amongst the mostimportant sources of such uncertainties are the mathematical models in estimating the consequencesof major accidents including dose-effect relationships and the setting of probabilities for differentaccident scenarios and for the probability effects of such accidents. Significant procedural andmethodological advances have been developed in order to address and reduce the effect of suchuncertainties. The risk assessment process should in all cases expose and recognize such uncertainties.
As risk analysis technology has matured and become a more important tool in planning andsafety investment decision-making, the pressure for quality in such studies has increased. Key themesinclude:
StaffToolsDataDocumentation -
competent, formally trainedvalidated, approvedtraceableauditable
It is to be noted that the main value of the quantified risk assessment process should not restwith the numerical value of the results (in isolation). Rather, it is the assessment process itself whichprovides significant opportunities for the systematic identification of hazards and evaluation of risks.The most significant advantage in this regard relates to the optimum allocation of priorities in riskreduction in that the assessment process provides a clear identification and recognition of hazards andas such enables the allocation of relevant and appropriate resources to the hazards control process. Thequantified risk assessment process also provides a useful tool for risk communication.
5.2. HAZARD IDENTIFICATION AT THE PLANT LEVEL
5.2.1. Introduction
The first and most essential step in any risk assessment is the identification of all relevanthazards and initiating events applicable to a particular plant or operation. In all cases it is necessaryto establish:
what dangerous situations exist within a plant or a process operation;how these situations may come about
This component of the analysis, termed 'Hazard Identification", involves consideration of allsituations where potential harm may exist in order to identify those which are hazardous. In the nextprocedural step, termed 'Modeling of Accident Scenarios', the identified hazardous situations will beanalyzed systematically to assess which events could transform this potential to an accident. Once anaccident scenario has been established, the likelihood of such an accident occurring in practice (ac-counting for design, operational and organizational safeguards) and its consequence (impact effect),should it occur, can be estimated. Fig. 5.1. indicates the context of hazard identification within theoverall risk assessment process.
This section provides guidance on the role of the hazard identification process, the tools andtechniques available to undertake hazard identification and the relevance and scope of application ofthese techniques. The review presented here is intended to provide a basic procedural framework toassist in undertaking hazard identification for both existing and new proposed plants. It does not intendto duplicate the extensive body of reference material available on the subject
It must be noted that there is no fixed golden rule as to which particular technique should beadopted. There are, however, useful and important guidelines. It may be necessary to use a variety ofapproaches to improve the hazard identification process. Techniques may also be used in isolation orto complement each other. Relevant screening may be an important part of this process and this is adecision to be made by the project manager.
77
5.2.2. Objectives
Hazard identification is a corner stone in the assessment of safety of an installation. It is essentialto have a clear understanding of the type and nature of hazardous incidents associated with theoperation of a plant and of the initiating and contributing events that can lead to such hazardousincidents. Without such an understanding the formulation and implementation of any risk managementstrategy is in many cases not possible and certainly inefficient. The main objectives for identifyinghazards at an early stage of the assessment process are basically:
(a) Providing the basis for the design and operation of appropriate operational (hardware) andorganizational (software) safety mechanisms. Safeguards must be appropriate and relevant toeach type of hazards, since, unless such hazards are identified and recognized, safeguards maybe irrelevant or sub-optimal.
(b) Risk quantification and evaluation. Estimations of likelihood and consequences of hazardousincidents cannot be undertaken unless each hazard has been identified in the first instance butscreening may also be appropriate.
(c) Accidents can be prevented by anticipating how they may occur. A systematic understandingof the major contributors to hazardous incidents and of the interaction of contributing events(concurrently or sequentially) enables the formulation of appropriate mitigating measures (e.g.shut-off systems) that may prevent such events escalating into major hazards.
(d) Prioritization of hazards for further analysis and control. Systematic identification of hazardsenables the formulation of risk management strategies based on optimum resources allocationon a priority control/management basis including the management of future change.
(e) Hazard identification may also be used for safety training purposes, as a tool for communicatingsafety information to the general public and as a basis for emergency procedures and emergencyplanning.
5.23. System description
The first task of the risk assessment process involves gathering all necessary and availableinformation about the installation to be analyzed. This includes information concerning the design,construction and operation of the plant and normal and/or emergency situations. The information willbe not only in the form of relevant documentation (e.g. pids, procedure manuals, log books) but alsoin the form of experienced plant personnel. Complete understanding about the function of theinstallation is absolutely necessary for a realistic risk assessment and this is not possible without theparticipation of an analysis team involved in the design, operation and maintenance of the plant.
5.2.4. Initiating event selection and establishment of plant response
Hazard identification involves assessment of all events that can initiate a course of events whichmay eventually lead to the release of hazardous material to the environment These events are called
' initiating events. Following the onset of an initiating event the various engineered protection and/orsafety systems of the installation are called upon to mitigate the event and keep the installation in asafe state. This step of the risk assessment process aims to determine all possible initiating events andto establish and understand the response of the installation both in terms of hardware and humanactions.
In order to complete this task the analysts should combine information about past experience(both from the particular installation and from other similar installations) and techniques that can helpto identify events which may initiate accidents. Review of past experience in the form of historical
78

data concerning accidents ail over the world and that of the installation itself should be the first stepin this procedure.
An enormous quantity of accident reports exist. The information available is often limited towhatever was recorded at that time and particularly when based on eyewitness reports it can beextremely unreliable. A variety of databanks have been set up to store and process this type ofinformation. Examples are the MHIDAS database operated by the UK Safety and ReliabilityDirectorate/Health and Safety Executive, the FACTS database operated by TNO - The NetherlandsOrganization of Applied Scientific Research - and the compilation of events by the Commission ofthe European Communities published by the Joint Research Center at Ispra. Review of the events re-ported in these databases will provide those that are applicable to the installation under analysis.
This review of die past experience should be followed by an analysis of the installation in orderto identify additional initiating events and assess the response of die installation to those alreadyidentified. Of particular help can be techniques used for overall qualitative assessment of the plantsafety. These techniques can be divided into two categories:
Category 1: Comparative Methods
- Process/System checklistSafety audit/reviewRelative ranking: Dow and Mond hazard indices
- Preliminary hazard analysis
Category 2: Fundamental Methods
Hazard operabiiity studies (HAZOP)"What i f checklist
- Failure mode and effects analysis (FMEA)- Master logic diagram
Appendix III provides detailed information on each of these methods.
Once the initial list of the initiating events has been compiled the next step consists of thedetermination of the safety functions and the systems that serve these functions. Safety functions andsystems are incorporated in the design of the facility to prevent and/or mitigate the possibleconsequences of die initiating events. Furthermore it is important to identify other systems whosemission is to support the function of die safety systems e.g. die electric power supply of a coolingsystem. These systems and their potential failures will be used later in die modeling of accidentscenarios.
5.2.5. Grouping and screening of initiating events
The objective of mis step is to group together all die initiating events diat provoke die sameresponse from die plant, therefore requiring die same safety functions and die corresponding systems.Only one accident model (e.g. event tree) is required for all initiating events in die same group..Furthermore, die groups of die initiating events can be screened on die basis of dieir expectedfrequencies. Extremely unlikely accident initiators can be excluded from further analysis. When indoubt, however, the screening is better to be postponed until after die assessment of die consequencesof die accident in order to avoid excluding highly unlikely accidents with very severe consequences.
5.3. MODELING OF ACCIDENT SCENARIOS
Some initiating events might lead directly to die release of a particular amount of hazardousmaterial to die atmosphere. In this case die analysis may proceed with die consequence assessment step
79

as described in Section 5.4. If, however, a number of safety systems as well as human actions cansuccessfully mitigate the initiating event then, in order to have a release of hazardous material, acombination of failures need to follow.
Techniques for modelling the response of the installation following the onset of an initiatingevent falls into the category of logic diagrams. These are techniques that try to model the logicalcombination of simpler events into composite events. For accident modelling the predominantly usedtechniques consist of a combination of event tree and fault tree analysis.
53.1. Event tree analysis
In many cases a single incident can lead to many distinct outcomes. The process of developingpossible accident scenarios is an essential element in the risk assessment process. The event treetechnique provides a logic framework for determination and quantification of a sequence of eventswhich can result in the occurrence of potential accidents. Event trees use inductive logic (normallybinary) and have been widely used in risk analysis of chemical and nuclear industries.
Two distinct applications can be identified which lead to the development of pre- and post-accident event trees. The basic steps of event tree analysis include:
- identification of initiating events (hazard identification);- identification of functions or factors which can influence the sequence propagation;- development of all possible outcomes;- classification of outcomes in categories of similar consequences for further consequence
estimation.
Event trees starting with an initiating event and proceeding to the release of hazardous materialcan be called "pre-accident" event trees. Event trees starting with the release and examining thedevelopment of the physical phenomena following the release are called "post-accident" event trees.
Pre-accident event trees can be used to evaluate effectiveness of plant protective systems andoperator actions against the occurrence of an accident initiator. Post-accident event trees can be usedto evaluate types of accident outcomes that might arise from a release of hazardous materials. Post-accident event trees can be appended to those branches of pre-accident event trees which led to unsafeplant states. See Fig. 5.2.
Other event trees as those shown in Figures 5.3 and 5.4 lead directly to the undesired physicalphenomenon (e.g. fire).
In all cases however, the heading or constituent events in an event tree will be a hardware failure(system failure), a human action or a physical phenomenon. Branching at each mode of the event tree(which is not necessarily binary) is done to die extent that it is necessary to uniquely determine theresult of the accident sequence. For example, in the case of a cooling system consisting of twocompressors, if die function of only one compressor will lead to a different damage state than mat ofthe failure of both compressors, three branches will be necessary to depict the three alternatives: bothcompressors operating; one compressor operating; no compressor operating. Alternatively, one coulduse two headings: Compressor A; Compressor B. This tends to explode die size of the event trees.
In general it is recommended to develop event trees only up to the point where the nature of dieaccident sequence is uniquely determined. In die previous example, if loss of one compressor wouldmean effectively loss of die cooling function tiien only one "event" should be considered witii die title"cooling system".
80

PRE-ACCIOENT EVENT TREE
COOLANT FLOWALARM WORKING
B
REACTORCOOLANTFAILURE
A
YES
NO-
REACTOR TEMP.ALARM WORKING
C
YES
NO
YES
NO
REACTOR DUMPVALVE WORKING
0
SEQUENCEDESCRIPTION
YES £§22 t SAFE SHUTDOWN
NO £222 2 RUNAWAY REACTION
YES £522 3 SAFE SHUTDOWN
NO £222 4 RUNAWAY REACT ION
YES £222 S SAFE SHUTDOWN
NO £222 « RUNAWAY REACTION
. Y E S £222 7 RUNAWAY REACTION
. NO £522 8 RUNAWAY REACTION
IGNITIONATX
B
WtNOT O Y
C
POST-ACCIDENT EVENT TREE
IGNITIONATY6
EXPLOSIONON IGNITION
E
SEQUENCEDESCRIPTION
FLAMMABLERELEASE
ATXA
YES-
• N O
-YES-
YES
NO
YES
NO
1 EXPLOSION ATX
2 FIRE AT X
YES £ 2 2 2 1 - 3 EXPLOSION AT Y
NO A B C 0 E 4FIREATY
5 DISPERSES
SOISPERSES
FIG. 5.2. Examples of pre-incident and post-incident event trees
81

533.. Binning of accident sequences in plant damage states
Accident sequences leading to the same consequences should at this point be binned into plantdamage states. A plant damage state uniquely defines the conditions that affect the type of releasesof hazardous material from the installation. Ultimately the frequencies of the accident sequencesbelonging to the same plant damage state will be combined to determine the frequency of this statewhich in turn will characterize the frequency of the corresponding consequences.
5.4. CONSEQUENCE ANALYSIS FOR ACCIDENTAL EMISSIONS
5.4.1. Introduction
Major disasters are not new. Natural disasters have been recorded throughout history. Thepotential for man-made disasters has grown with technological achievements. In the context of thisdocument a major hazard incident has been taken to mean an accident involving one or morehazardous materials which have an impact in terms of death, injury or evacuation of people, damageto property or lasting harm to the environment. This type of impact can be caused by an explosion,high levels of thermal radiation or by exposure to a toxic material. It is acknowledged that other(lesser) effects could be caused by ionizing radiation, asphyxiants, very cold substances (cryogens) andcorrosive substances. However, it is not intended to consider tiiese in the context of the guidelinedocument
This section presents the various methodologies and procedures used to calculate or estimate theunwanted consequences, effects, impacts or outcomes of severe accidents involving substances of ahazardous nature.
The outcomes may cause death, injury, property damage or damage to the environment and canbe considered under the broad headings of fire, explosion, toxic effects and missiles. The process ofestimating quantitatively the effects of such outcomes is termed consequence analysis.
The calculation of the consequences of an accidental release of a hazardous substance may besub-divided into three main steps that relate to:
• physical models;• effect models;
consideration of mitigation effects.
It is the responsibility of the project managers to assess impact criteria and assure their consistentapplication throughout the whole exercise. Model evaluation groups are being set up (e.g. in the CEC)to structure representative overall approaches. In the absence of absolute information, a representativerange of source terms should be assumed.
The overall approach is illustrated in Table 5.2. Each of the steps involved are addressed by thefollowing sections.
A brief description of the approaches to methods of consequence analysis for accidentalemissions are given in the remainder of this section while more details about the physical models canbe found in Appendix IV.
Before presenting the various methodologies and procedures for the estimation and calculationof the consequences of severe accidents a number of past accidents will be described. These will beused to illustrate the type and effect of major hazards that can occur at installations handling hazardousmaterials.
82

TABLE 52. OVERALL APPROACH TO CONSEQUENCEESTIMATIONS
Determine accident scenarios
pipe break, pressure vessel failure (partial ortotal), explosions, etc.
Establish mode of hazard realization
release of toxic materialrelease of flammable materialsrelease of energy
Determine mode of transmission to target
airborne or waterborne dispersionhigh thermal radiationoverpressuremissiles
Calculate effects on target
thermal radiation effectsexposure to toxic materialseffects of blast overpressure
Take allowance of mitigating effects
shelterevacuationmedical treatment
Assess Consequences
assess probability of death, injury, structuraldamage, environmental harm, etc.
5.4.2. Site topography and population distribution
Meteorological conditions and other topographical characteristics that affect the consequencesof the accident must be established before applying the appropriate physical models and estimatingthe consequences of the accident. Furthermore the population distribution around the site should beestablished for assessing the societal risk (see section 5.6.2).
83

5.43. Flammable releases
5.4.3.1. Explosions
These can be dense-phase explosions, confined or partially confined vapour cloud explosions,boiling liquid expanding vapour explosions (BLEVE) or dust explosions. All of these can lead to blastoverpressures. Other causes of less destructive explosions are large vessel rupture through internaloverpressure, runaway chemical reactions or explosions resulting from contact of a hot non-volatilebody such as molten iron with water.
(i) Dense-phase explosions
A dense-phase explosion occurs when a liquid or solid is suddenly converted to a gaseous form.The rapid increase in volume results in a pressure wave which radiates from the source at a velocitygreater than the speed of sound in air. This pressure wave can be very destructive. One of the mostdestructive explosions of this type which involved an industrial (rather than a military) hazardousmaterial occurred at Oppau in Germany in 1921. A mixture of ammonium nitrate and ammonium sul-phate was stored in the open in a large heap before being made into fertilizer. This mixture tended to
TRANSFERPUMPLEAK
yes
no
yes
yes
no
NO FIRE
yes MINOR FIRE
MAJOR FIRE
no
MAJOR FIRE
POTENTIAL FOR
no MAJOR FIRE
Leak of flammableliquid delected and
isolated immediately
Source ofignition
Firedetected
Fire servicesavailable
FIG. 5.3. Simplified event tree example
84

M(S VAPOUR
TO OIVC AJCT f U H C t
IS Jtr »LAMEoiRccreoTOWAROS THCipo vessel Ì
IS J(T I UmriNOiNoON vesstiVAPOUR sPAce r
IS STORAGEvessel SPRAYSYSTCMOPERATIONAL Ì
IS STORAOCvessel SPRAYSYSieH ABSOIVTEIYCPFCCTIVt r
IS THC FIRE IS THC FIRESCRVIce SERVICEOPERATIONAL 1 ABSOLUTELY
EFFECTIVE T
Y
FAILURE OFIPO PIP(WORK
VAPOUR SPACE OR
YTORCHINO ATTACK
RAOIANT HEAT At
N
110 / VAP SPACE
enow uouio i we
TACK
1 1i
11
1
N
• ICVt IACROHYH FOR BOIIINO UOUIO (XPANOIHO VAPOUR EXPLOSION I
• Th'l« i l l u a t l t n a r l t t t whtn liquid lt««l drop» btlow torch point.
OUTCOMEBLEVf
OR NO
sieve
NO BLCVC
NO SIEVE
BLEVE
SIEVE
NO euvc
eiEvesieveNO aievt
NO tlEVE
eicvc
8KVC
HO SIEVEneve •sieve •HO SIEVE
HO SIEVE
sieve
SIEVE
NO SIEVE
sievesieve
NO SIEVE
FIG. 5.4. Event tree indicating how the failure of LPG vapour pipework can developtowards a BLEVE of an LPG storage vessel
become somewhat solid and it became the practice to break it up using explosive charges - a techniquethat had been carried out a large number of times. On this particular occasion it appeared that some45001 of the material exploded with devastating effects. The explosion killed 561 people, 4 of whomwere 7 km away in the town of Mannheim. 1500 persons were injured and 75% of the buildings inthe nearby town of Oppau were demolished. A total of around 1000 houses were destroyed. Allbuildings within a range of between 250 and 300 m were demolished and a 10 m deep crater roughly100 m in diameter was formed. Damage to buildings up to 45 km away was reported.
(ii) Vapour cloud explosions
The requirement for this type of explosion is a large pre-mixed cloud of flammable vapour andair within the flammable range and the presence of some confinement or obstructions. The combustionprocesses of large vapour clouds axe still not fully understood, however the effects are stronglyaffected by the degree of confinement encountered, the size of the cloud and the degree of turbulenceexperienced. An example of a vapour cloud explosion occurred at Flixborough in the UK in 1974. Aspart of its process the plant reacted cyclohexane (a flammable material with a boiling point of 81°C)with air at a temperature of 145°C at a pressure of about S bars gauge in a series of reactors. Due toa fault one of the reactors had been taken out of service and a temporary pipe in the shape of a 'dog-leg' installed in its place. Some time later this temporary pipe failed and hot liquid was released whichflashed into a mixture of vapour and entrained liquid. A large vapour cloud was formed whichcontained approximately 50 t of cyclohexane. Ignition occurred within a minute and a massiveexplosion resulted. The plant and on-site buildings were destroyed and 28 plant personnel, most ofthem in the nearby control room, were killed. Nearby houses suffered heavy damage and some win-dows were broken up to 15 km away.
(iii) Dust explosions
These explosions are a hazard whenever combustible solids of small particle size are handled.A significant number of these explosions have occurred in flour mills or in buildings used for storingor discharging grain. A particularly large explosion occurred at Westwego near New Orleans,Louisiana, USA, in 1977. Over forty silos containing corn, wheat and soya beans were involved and35 on-site workers killed. Most of these were in an office block which collapsed when an 80 m tallconcrete tower fell on it.
5.4.3.2. High levels of thermal radiation (fires)
Following release of flammable materials there is the possibility (apart from die explosionsdescribed above) of the material igniting and burning in a manner which can give rise to high levelsof thermal radiation. Depending on the physical properties (temperature, pressure, etc.) the mode ofrelease and the time of ignition, the material can be involved in a pool, flash (vapour) torch fire orBLEVE.
(i) Boiling Liquid Expanding Vapour Explosions (BLEVE)
A BLEVE describes the sudden rupture of a vessel containing liquefied flammable gas underpressure. The primary cause is usually an external flame impinging on the shell of a vessel above theliquid level, weakening the container and leading to sudden shell rupture. The pressure burst and theflashing of the liquid to vapour creates a pressure wave and potential missile damage. The immediateignition of the expanding mixture of fuel and air leads to intense combustion and the creation of a fire-ball. The majority of BLEVEs have occurred during the transport of pressurized liquefied gases buta number have occurred at fixed installations. Most probably the worst occurred at Mexico City in1984. A release of gas occurred during the early morning at a large LPG distribution plant. Theinitiating event was possibly a leak in a pipeline transporting LPG from a refinery. A cloud of vapourwas formed and ignited. There were several violent BLEVEs (7 or 8) and numerous smaller ones.
86

These BLEVEs and the fires that followed killed at least 500 people, injured more than 7 000 othersand about 60 000 persons had to be evacuated. Out of the original 48 'bullet' type storage vessels only4 remained on their supports. One of them weighing about 201 was found 1200 m away. There werealso 6 spherical storage vessels on the site, of which the 4 smallest ones exploded and large fragmentsof them travelled at least 400 m. The two larger spheres did not explode but collapsed through theirlegs buckling. Virtually all housing within a 300 m radius of the plant was severely damaged. It shouldbe noted that when the plant was originally constructed some 25 years before the accident the nearesthousing was about 300 m away. However poor quality, flimsily constructed housing had been allowedto encroach to within 100 m of the site boundary.
(ii) Pool Fires
Liquid spilt onto a flat surface spreads out to form a pool. If the liquid is volatile, evaporationtakes place and if the liquid is flammable then the atmosphere about the pool will be in the flammablerange. If ignition takes place then a fire will bum over the pool. The heat from this fire will vaporizemore liquid and air will be drawn in from the sides of the pool to support combustion. The systemwill then consist of a solid cylinder of flame burning above the pool. The principal hazard to peopleis from exposure to the high levels of thermal radiation generated. Whilst some of these fires can bespectacular, because the extent of injury depends on the proximity to the fire and the time of exposure,it is unusual for large numbers of people to be seriously affected and large accidents with multiplefatalities are rare. However plant damage and losses can be severe. An exception to this is the 'boilover* incident during storage of hazardous substances. Products of combustion from pool fires may alsoprovide a hazard.
(iii) Flash Fires
A flash fire occurs when a cloud of a mixture of flammable gas and air is ignited. The shapeof the fire closely resembles the shape of the flammable cloud prior to ignition but it also dependsupon where within the cloud ignition occurred. In many cases the cloud extends back to the originalpoint of release and can men give rise to a torch or pool fire depending on the mode of release. Whenignition occurs, the flame front races or 'flashes' through the cloud very quickly. It is also possible thatthe flame may accelerate to a sufficiently high velocity for an explosion to occur. People or propertyclose to or within the cloud are at risk from thermal radiation effects. An example of a severe flashfire occurred at Meldrim, Georgia, USA in 1959 when LPG was released from a derailed train. TheLPG spread over a wide area before ignition occurred. The resultant flash fire killed 23 people. Undercertain circumstances a flash fire can lead to vapour cloud explosion.
(iv) Jet or Torch Fires
A jet or torch fire usually occurs when a high pressure release from a relatively small opening(ruptured pipe, pressure relief valve, etc) ignites. This gives rise to a torch which can burn with flamelengths several metres long. The flame is a hazard to persons nearby but the main hazard is generallyits effect on adjacent vessels which may contain flammable liquids. A number of BLEVEs haveoccurred as a result of flame impingement - a typical scenario being the torch fire from the pressurerelief valve on an overturned rail tankcar impinging on an adjacent tankcar. An example is the jet-firetorching from a safety valve on top of a 50 t LPG tanker which was deflected onto its own unwettedsurface and caused a BLEVE in Kingman, Arizona, USA in 1973. Thirteen firemen were engulfed inthe ground level fireball and died.
5.4.4. Toxic releases
Toxic chemicals can cause harm to both animal and plant life. Effects from explosions and firesare usually confined to a relatively small area but toxic materials can be carried by wind or water overgreater distances and can cause lasting damage to man and environment. Harm from toxic material isa function of the concentration of the toxic material and the duration of the exposure time. The process
87
of calculating harm is inexact and is complicated by the fact that, as far as man is concerned, in-dividual susceptibility varies considerably. The elderly, those in poor health, and the very young arethose most at risk. Two of the most important toxic chemicals produced in bulk are chlorine and am-monia. Chlorine is produced at a rate of over 30 Mt/y. Therefore it is not surprising that there havebeen a number of accidental releases involving this material.
One of the worst industrial accidents involving chlorine occurred in December 1939 at Zarnestiin Romania. This disaster, probably caused by the rupture of a storage vessel, spilled 24 t of chlorineand killed 60 people. Many of those killed were close to the vessel but some were killed at a railwaystation about 250 m away. One person was killed about 800 m away - this is probably the greatestdistance away from a peace-time chlorine release for a human fatality. It was fortunate that at the timethe wind speed was low and therefore the rate at which the material dispersed enabled a number ofpeople to escape to higher ground.
Ammonia is produced in similar quantities to that of chlorine but is much less toxic.Nevertheless, there have been a number of accidents which have resulted in fatalities. One of the worstoccurred at Potchetstroom in South Africa in 1973. A pressurized storage vessel was being filled froma rail tank when the vessel failed, possibly from being overfilled. About 38 t of ammonia werereleased more or less instantaneously. Exposure to ammonia resulted in the deaths of 18 persons, 6of them outside of the works boundary. Five persons who died were at a distance of between 150 and200 m from the release point.
There are numerous reports of incidents involving chlorine and ammonia which have causedserious damage to the environment. At an incident in La Barre, Louisiana, USA in 1961, in whichbetween 27 and 35 t of chlorine were released, there were reports of damage to animal life over anarea of approximately 15 km2. At an accident near Floral, Arkansas, USA in 1971, about 600 t ofammonia were released from a pipeline. This ammonia reached a watercourse and killed thousandsof fish.
The most horrifying incident involving a toxic gas release occurred in December 1984 inBhopal India, in which an escape of methyl isocyanate killed at least 2500 people and may haveinjured 200 000 more. This disaster is possibly the worst industrial accident in the world's history.Due to reasons which have noi been fully explained approximately two tonnes of water was added to41 t of methyl isocyanate in a storage tank. Water and methyl isocyanate can react together in anexothermic reaction. The use of a refrigeration system to deal with this eventuality had been dis-continued some six months earlier. The increase in temperature resulted in an increase in pressurewhich burst a ruptured disc fitted to the tank and gases passed along a long line to a scrubber system.This system was inadequate to pass a large volume of gas (it was designed to pass process ventilationproducts, not the full flow from a runaway reaction) and so the gases passed untreated to a flarewhich, at the time of the accident, was shut down for repair. A further possible safety feature was apressurized water spray curtain - this failed due to insufficient water pressure. A major contributionto the high death rate was that many of the nearby population were asleep at the time in very highdensity accommodation and poorly constructed dwellings which offered virtually no protection. Alarge number of animals were also killed.
An accident which caused considerable damage to the environment occurred at Seveso, Italy in1976. Approximately 2 kg of the chemical dioxin was released which affected an area of about 17km2. Although no persons died directly as a result of the release, a number of persons were found tobe victims of chloracne. There were a large number of deaths among the animal population and manyother animals were slaughtered as a protection against dioxin entering the food chain. The dioxin re-leased proved capable of sterilizing about 4 km2 of land for agricultural use. The effects will last forseveral years. A large quantity of earth was removed from other areas in an attempt to return the landto agricultural use.
88

5.4.5. Consequence assessment
The physical models discussed in the previous section and in Appendix IV considered thedispersion of airborne flammable or toxic materials, the creation of high levels of thermal radiationfrom various types of fires, the production of overpressures from explosions and the generation ofmissiles. This section will now consider the effects of these on people, property and the environment.However, environmental effect models development is still in its infancy and existing approachescontain great uncertainties. A good overview of people and property effects modelling is given inRef.[47].
5.4.5.1. Effects of hazardous material dispersion (toxicity effects)
There are two main outputs from calculations of the way in which hazardous materials aredispersed in the atmosphere. The first is the determination of the concentration of flammable materialswith a view to establishing the hazard ranges of these substances to some pre-determined concentrationsuch as the Lower Flammable or Lower Explosive Limit The results of these calculations are thenused as inputs to the modelling and determination of the characteristics of fires and explosions (seeAppendix IV). The effects of these are considered under the heading of fires and explosions and sowill not be discussed here. The main group of substances to be dealt with are therefore those whichhave toxic effects on man, plant and animal life.
The objective of using toxic effect models is to assess the consequences to man, animals andplants as a result of exposure to toxic materials. Considering first the effects on man it is difficult, fora variety of reasons, to evaluate precisely the toxic responses caused by acute exposures to toxicsubstances. Humans experience a very wide range of adverse effects which can include irritation,neurosis, asphyxiation, organ system damage and death. In addition, the scale of these effects is afunction of both the magnitude and duration of exposure. There is also a high degree of individualresponse among different persons in a given population, due to factors such as general health, age andsusceptibility. A further cause of difficulty is mat there are known to be thousands of different toxicsubstances and there is by no means enough data (on even some of the more common ones!) on thetoxic response of humans to permit a precise assessment of a substances hazard potential. In mostcases the only data available are from controlled experiments with animals under laboratory conditions.The extrapolation of the effects observed in animals to the effects likely to occur in humans or indeedin other animals is not easy and is subject to a number of judgements. The methods used to calculatethe effect of toxic releases on the environment from continuous releases are also applicable to calculatethe effects of accidental releases.
There are a large number of references which give useful information on the methods ofpredicting the likelihood that a release will cause serious injury or death. A number of commonsubstances have been examined in depth. In the UK, chlorine was considered by the Major HazardsAssessment Panel [48], and associated publications have given an extensive review of the animal datafor man, see e.g. Ref. [49]. The same group has also reviewed ammonia, [SO].
If an attempt is made to estimate the proportion of the population which may suffer a defineddegree of injury it is necessary to have information on the statistical distributions relating theprobability of injury to the dose (total intake). Typically this is a log-normal distribution but for thesepurposes can take the form of a probit equation. The probit equation relates the effect of an exposureto a given concentration and duration.
89

The general form of a probit equation is:
PT = a + b I0& ( C t)
where PT = measure of the percentage of people affecteda,b, and n = constantsC = concentration (ppm)t = exposure time (min)(C t) = quantity known as toxic load.
Values of the constants for the lethal toxichy probit equation for a number of the more commonchemicals along with further details are given in Appendix IV.
A probit quantity (P) has a mean of S and a standard deviation of 1. To evaluate the probit, thetoxic load (C* t) must be calculated at positions of interest At a given location the concentration willvary over time as the cloud passes and dilutes. The total toxic load for the location is obtained byconsidering different time steps and the average concentration during those time steps. Then for m timesteps the toxic load is given by:
Total Toxic Load = 1 W j . (Q» tj)
This total toxic load is then used in the probit equation. It is important to ensure that correct andcompatible units are used.
5.4.5.2. Effects of thermal radiation
Similar probit functions have been developed for the effects of thermal radiation where insteadof the toxic load' the thermal load is used. Further details are given in Appendix IV.
5.4.5.3. Explosion effects
Explosions effects are caused by die blast overpressure. Details on these effects on people andstructures are given in Appendix IV.
5.4.6. Mitigating effects
The objective of this section is to draw attention to some of the factors which may mitigateagainst the consequences of incidents involving hazardous materials. The omission of mitigating effectsin a risk assessment will nearly always lead to an overestimation of the numbers of casualties. Thereare considerable uncertainties in estimating the factors that account for evasive actions. For thesereasons many risk assessments do not consider the role of mitigating effects such as sheltering andevacuation - in such cases the possibility of having overestimated the number of casualties should beacknowledged.
It has been observed in many accidents that the consequences to people and property were lesssevere than would have been predicted using the approaches described earlier. Obviously there areuncertainties in all the various stages of analysis and there are also modelling limitations which maylead to conservative assumptions and hence results. However, in addition to these factors, the resultsmay be less serious than predicted due to topographical factors, physical obstructions and to evasiveactions taken by people. Such evasive actions can include evacuation, sheltering and medical treatment.These are briefly described thereafter.
90

5.4.6.1. Evacuation
This is a mitigating factor which can only be usefully employed if there is sufficient time forit to be effectively carried out. Evacuation is not without its own risks - useful references include[51,52].
5.4.6.2. Sheltering
It has been observed that, following an incident, the effects on people who take shelter differmarkedly from those for people in the open. This has been discussed in relation to building types andhuman behaviour [53]. The effects of sheltering depend on:
- The nature of the hazard - shelters can have a beneficial effect for thermal and toxic effects butcan be of limited benefit for flash fires due to the possibility of vapour ingress. In the case ofexplosion overpressure the hazards may be increased due to the increased risk of collapse of thestructure providing shelter.
- The time available - escape to a shelter can be very beneficial in the case of pool and jet fires.There may well be insufficient time to shelter from a fireball and there may be no time toescape from explosion overpressure or missiles. There may be benefit in sheltering from releasesof toxic materials, particular if time allows to reach shelter before there has been a significantexposure. However where the shelter has been exposed to a cloud of toxic material for sometime it should be recognized that, once the outside concentrations decrease, an indoorconcentration, albeit lower man the peak values experienced outdoors, may persist for some timeand the total exposure could be reduced by leaving the shelter once the cloud outside has passed.
5.4.6.3. Medical treatment
The effectiveness of training and the availability of equipment for emergency response andmedical treatment can greatly improve the chance of survival for those seriously injured as aconsequence of an incident involving hazardous materials. Of particular interest to those treatingpersons exposed to toxic materials will be the name, and the basic hazards of the material(s) involved.Modem methods of treating those who have experienced severe bum injuries have greatly increasedthe chances of survival. It should however be recognized that whereas facilities may exist for treatinga few seriously burnt people at the same time there may be problems in treating tens or even hundredsof such people.
5.5. ESTIMATION OF THE FREQUENCY OF ACCIDENTS
5.5.1. Introduction
This section describes the methodological step of estimating the frequency of accident sequencesidentified in die previous steps (see Section 5.3 and Appendix III) for which the consequence analysis(see Section 5.2.) has shown can lead to non-negligible consequences. The strengths and weaknessesof the analytical techniques and the data requirements for quantification are examined, with commentson possible future developments. Accuracy and uncertainty in these estimates are considered and theimplications for use of the techniques, together with the potential benefits and limitations, arediscussed.
5.5.2. Event definition
Careful definition of events to be quantified is an important stage in the analysis. It isparticularly vital for a full analysis where the probabilities and consequences of the various possible
91

events are to be combined to produce an overall quantitative risk estimate. Risk analysis is an iterativeprocess; initially a coarse estimate of the consequences of events is made to identify which of thedangerous events would be sufficiently damaging to be included in a more detailed study.
In a case where loss of containment is the major concern the breakdown of event probabilityagainst size of release is necessary to couple probability and consequences. This is not usually treatedas a continuous function since the possible releases tend to be characteristic of the particular plant, i.e.the dimensions of the equipment and the conditions such as pressure and temperature under normaland fault conditions. Similar releases are usually grouped together in order to achieve the coupling ofevents with the appropriate consequences of the overall risk analysis. The coupling of eventprobabilities and consequences is considered further in Section 5.6.
In this section the possibility of an occurrence of an event is generally referred to as a"probability". This quantity may indeed be a probability and therefore dimensionless. However, inmany circumstances it will be expressed as a frequency of occurrence over a specified time interval,e.g. a year or a plant lifetime. It may be possible to relate such a frequency to a finite number ofoccurrences over a sufficiently long time: for example a large number of events over a relevanttimescale are taken to be indicative that an event will occur during a more limited period.. As we shallsee in Section 5.6.3 the distinction between dimensionless probability values and frequency values isimportant where these numbers are used in combination. Because it is not always possible to bedefinite about which way a particular value should be expressed, some authors use the term"likelihood" to express the possibility of something happening, leaving it open as to whether aprobability or a frequency should be used depending on the circumstances. There are two basicapproaches.
5.53. Direct frequency assessment of accident sequences
The first is direct use of statistical data on release frequency or oilier failure types, sometimescalled the "historical approach" or "generic data". Such data is usually defined for specific hole sizes(5 mm, 25 mm, 100 mm, and full bore ruptures are typical for pipes). Attempting to link hole sizesto specific single mechanisms such as flange leaks or critical crack sizes is an attractive explanationfor the general public, but the reality is far more complexed as a review of release case descriptionshighlights. It is becoming increasingly common to apply "Management Factors" to generic frequencydata to account for the overall effectiveness of the She Safety Management System (SMS). This is anattempt to put back into failure rate data, used in risk analysis, the frequency variation induced by theSMS which the generic averaging process has removed.
An advantage associated with the use of historical event data is that, where the accumulatedexperience is relevant and statistically meaningful, the assessment will not omit any of the significantroutes leading to the event. The data already encompass all relevant contributory aspects including thereliability of equipment, human factors, operational methods, quality of construction, inspection,maintenance, operation, environment, etc. However, routes which may not be relevant to a specificcase study will be included, resulting in an over-estimate, which is usually referred to as a"conservative" estimate of the chance of an event. The sample may also include older plants built toa lower standard.
Often the historical data is of such a quality that, while undoubtedly relevant, it is not consideredadequate. In this case synthesis must be used and the predicted event probability should be testedagainst whatever experience exists to judge whether the different approaches produce compatiblepredictions.
5.5.4. System analysis
The second approach in accident sequence quantification is to break down the event into itscontributory factors and causes, using the analytical techniques described in Section 5.3.1. This process
92

is pursued up to the point where data is available, or can be obtained for the contributory sub-events.The overall event probability is then synthesized from the data of these various sub-events. Theanalytical approach will inevitably be adopted where the historical data are inadequate or simply notavailable. It may also be adopted where there is a cause for expecting a particular plant, system or itemto have a different failure probability from that indicated by historical data.
Sometimes the analytical approach will not succeed in breaking the event down to the pointwhere data is available for all sub-events. In this case judgmental inputs may be required and this hascaused suspicion that the technique is not scientifically rigorous. However, the philosophy here isconsistent with the basic approach of breaking down the judgement on how likely the event is intosmaller areas of more specific judgements which are within the realms of practical experience. Theoverall outcome is then less sensitive to any one particular judgmental input. An importantconsideration in the analytical approach is how far to continue the breakdown of the main event.
There are various techniques for modelling mechanisms - logical combinations or a sequenceof events - by which an undesired event could occur. Most of these techniques are based ondiagrammatic methods known as logic diagrams. The techniques are essentially qualitative in nature,and if appropriate can provide a model for subsequent quantification. In Section 5.2 on hazardidentification some of these techniques have already been mentioned and their usefulness in this roleshould not be underestimated. The distinction between identification techniques and failure logicsynthesis techniques is, therefore, somewhat artificial. The comparative, guideword and FMEAmethods discussed in Appendix III do not provide a logical framework for the setting down of eventcauses and effects generated by logic diagrams. However, logic diagrams must start from an eventwhich has been identified by some method.
The techniques are, therefore, complementary. Logic diagrams will not be necessary where thecause and effect relationship is simple. Generally, only a proportion of the identified hazardous eventsin a study will contain sufficient complexity to require the use of logic diagrams.
Logic diagram techniques are sometimes classified as "top-down" or "bottom-up", according towhether they work back from the undesired event of die contributory causes or follow through initialfault conditions, failures or errors to the various possible conclusions. Most problems may beaddressed by any of the more important techniques, considered briefly below. However, each havestrengths and weaknesses, depending on the type of problem applied. In particular, when applied asan identification tool a combination of methods are often used to minimize the chance of omissions,which is possible with either approach. It sometimes proves easier to develop the logic using oneapproach or a combination of approaches, but then clearer to present it using another.
The event trees that might have been developed in the step of hazard identification follow initialcauses through to possible outcomes. They can be used to deal with independent and coincident events,but are particularly powerful in portraying event sequences. Event trees are usually applied to binarystate systems but can be used for multi-outcome states. Although event trees are often used in theirown right and provide easy extension to quantification they are also useful in identifying sub-systemswhich require fault tree analysis. It is difficult to represent interactions between event states and aseparate tree will be required for each initiating event, but then the relationship between different treesmust be considered very carefully. Outcomes are related to the specific cause being analyzed and couldarise from other causes which would not be shown.
5.5.4.1. Fault trees
Fault trees are the best known and most widely used technique for developing failure logic. Thebasic process adopted is to select an undesired "top-event" and trace it back to the possible causeswhich can be component failures, human errors or any other pertinent events that can lead to the topevent. This procedure should be followed methodically, identifying immediate precursors to the topevent, then the immediate precursors to the sub-events and so on, as shown in Fig. 5.5.
93

NAZAROOUSCVENTS
A1
INITIATINGOEHANO
PROTECTIONFAILURE
EOUIPMEHTFAILURE
H A L - OPERATION NO ACTIONON
OEHANO
HAROWAREFAILURE
MAINTENANCEERROR
HAROWARE MAINTENANCEFAILURE ERROR
NOSUCCESSFUL
OPERATORINTERVENTION
00
AND GATE • a l t of the inputstogether ore required toproduce the output.
OR 6ATE - any of inputs alone issufficient to produce the output.
HAROWAREFAILURE
MAINTENANCEERROR
FIG. 5.5. Example used to illustrate the construction of a fault tree
A fault tree is comprised from a complex of entities known as "gates" which, when a logicalcombination of input conditions are satisfied, produces a specified output which is propagated. Theconstruction of a fault tree follows a defined methodology, but as yet, mere is no universally adoptedset of symbols, which is unfortunate as fault trees provide a vivid method of communication.
The fault tree is not a model for all system failures or possible causes for system failures as itonly includes events which contribute to the top event A fault tree does not show sequences of events,although some complex gates can be used to illustrate the conditions of the sequence of input events.This can be confusing and often leads to difficulties in evaluating the tree.
94

A fault tree essentially shows the system states and because of this, other techniques are oftenmore useful in cases where the sequence is likely to be important, as would generally be the case withbatch processes. Fault trees may, however, still be used for analysis of sub-systems on batch plantssuch as protective instrumentation or services.
When compiled rigorously in a "top-down" procedure, certain sub-events may appear more thanonce in the fault tree. This is not anomalous and does not prevent the tree from being quantified.Attempts to draw the tree without repetition of events in the tree usually leads to the "top-down"approach not being rigorously followed, increasing the chance of omissions. An important feature thatthe analyst must consider is the possibility of failure from independent items by a single cause. Thisis considered further in Section 5.5.7.
Fault tree analysis provides an extremely powerful tool which is capable of handling most formsof combinational events. It provides a good basis for quantification and is particularly useful wherea small number of major outcomes are of concern, as is usually the case in hazard analysis. Very largetrees can result, with a separate tree required for each top-event and relationships between differenttrees then need to be considered carefully. Only the outcome under consideration is shown but otheroutcomes from the causes in the tree will not be shown. Transition routes between states are notrepresented and the technique generally deals with binary states: partial failures and multiple failuremodes can cause difficulties.
5.5.4.2 Cause consequence diagrams
Cause-consequence analysis is a technique which combines the ability of fault trees to show theway various factors may combine to cause a hazardous event and with the ability of event trees toshow die possible outcome. Sequences and therefore time delays can be illustrated in the consequencepart of the diagram. A symbolism similar to that used in fault trees is used to show logicalcombinations. The technique has considerable potential for illustrating the relationships from initiatingevents through to the end outcome. It can be used fairly directly for quantification, but the diagramscan become extremely unwieldy. Because of this, cause-consequence analysis is not as widely usedas the first two techniques described, possibly because fault and event trees are easier to follow andso tend to be preferred for presentation of the separate parts of the analysis.
5.5.5. Human errors
Some of the events depicted in either the event trees or the fault trees correspond to humanactions. The probability of committing these actions by the human involved should be calculated withan appropriate human error analysis technique.
Human Error Analysis consists of a systematic evaluation of the factors that influence theperformance of human operators, maintenance staff, and other personnel in the plant and identifieserror-likely situations that can lead to an accident It includes identification of the system interfaceaffected by particular errors and relative ranking of errors based on probability of occurrence orseverity of consequences. Results are qualitative and quantitative and include a systematic listing ofthe types of errors likely to be encountered during normal or emergency operation.
53.6. Data requirements
The data required for estimating the frequency of the various accidents identified, as describedin section 5.3 and Appendix III, and evaluated for their consequences, as described in section 5.4 andAppendix IV, are those that will permit the estimation of the parameters necessary for thequantification of the event trees and the fault trees. They can be distinguished into three categories:
1. Frequencies of initiating events;
95

2. Probabilities of occurrence of basic events;3. Human error probabilities.
The first category is used to quantify those initiating events which are leading events in anaccident sequence. The second category involves the estimation of parameters of various reliabilitymodels used as a model for the basic events in fault trees. As described in section 5.5.4 they providethe necessary input for calculating the probability of top events of fault trees corresponding to theheadings of the event trees. Of course, if some headings of event trees have not been further modeledin terms of a fault tree or of another model the probability of the whole system failing will be directlyestimated from existing data or expert judgement. The third category of data involves the estimationof the probabilities of human errors that are explicitly modeled in the event trees and the fault trees.
Some types of human error are implicitly included in the reliability data for components. Indeed,it would be very difficult to separate many types of error, including design, installation, inspection,calibration, maintenance and so on, from the data to give a basic hardware failure rate. This meansthat application of such failure data implies an assumption about operating standards and maintenanceregimes which is discussed further below. However, it may not be enough to assume that this approachis adequate and in critical situations specific attention may need to be given to these types of humanerrors, requiring a data input. It is also important to model carefully the variability of human responsesin emergency situations.
Other types of human error are evidently not included in component reliability data, althoughthey would be included in accident data. These include operational errors of omission or commission,such as failing to cany out a task or doing the wrong task, which may precipitate a dangeroussituation, and errors in responding to dangerous situations as they arise. Where possible errors of thistype are identified as being significant a data input is again required. The error rate observed has beenfound to be dependent on many factors such as the level of stress, familiarity with an operation orprocedure, complexity of the task, training, and situation-specific features.
Several attempts have been made to gather relevant human error data for a variety of tasks undervarious conditions and levels of stress. Data collection is continuing and the study of human factorshas become a very important subject in its own right.
5.5.6.1. Types of data
Data used for estimating frequencies and/or probabilities of events can be distinguished intocategories according to their source:
1. Plant specific data;2. Generic data.
Plant specific data are those originating from the particular installation under analysis. These arethe most appropriate data to be used but it is most time consuming and expensive, if possible at all.Generic data are data from various plants gathered in various databases.
High quality event data are very expensive to collect and often a long time elapses before astatistically viable sample has accumulated. Therefore, such data are often regarded as a contributorto reliability information. Reliability data are values of the probability that a system performs as thedesigner intended. This parameter might just be an overall failure rate or it might be a quantity whichcan be separated into failure modes and causes.
There are data banks throughout the world which have considerable amounts of information,particularly on the reliability of components in nuclear plants. The data bank operated by SRS(Systems Reliability Service of the UKAEA) probably has the largest single collection of reliabilitydata, drawn mainly from conventional rather than nuclear plants.
96

Another data bank, a multinational Event Recording Data System (ERDS) is under developmentby the CEC Ispra establishment This data bank, intended to assemble in one system data failures fromall light water nuclear reactors in Europe, is still only at the prototype stage and is indicative of theinternational co-operation that is required and can be achieved.
Publications are another source of information. The problem with inserting this type ofinformation into a data bank is that distortion can be introduced by the data bank coding system whendata has not been collected specifically for the data bank.
Data collection schemes must be arranged with due consideration for the nature of the eventsor failures concerned. A different approach is necessary to collect information on relatively frequentoccurrences as compared to rare events, and when an extremely large amount of experience may benecessary for the data to be statistically meaningful. In the UK offshore operators are collaboratingwith HSE to provide a database which will hopefully produce useful and representative offshore failurerate data (OREDA).
5.5.6.2. Sharing and pooling of data
This area is very much in its infancy. Presently, two methods are being pursued, typified by theSRS system and the system being developed by the EUREDATA Association. The SRS method is oneof encouraging co-operation of various industries and organizations with similar interests to supplydata to a central data bank with benefit to the member organizations. The EUREDATA Associationhas the intention of drawing together, for the purpose of data acquisition, people of like interests sothat exchanges of information and co-operation between the organizations can be collectively agreed.At this stage it is not possible to judge the efficiency of this approach, but die aims are clearlylaudable. (See also reference to OREDA in reliability and event data above).
5.5.6.3. Possible future development
There is a great potential for progress given the co-operation of large numbers of organizations.Information sharing schemes and data banks have a vital role to play, as arrangements can generallybe made to overcome problems and inhibitions regarding commercial confidentiality. The problem ofdemonstrating very high reliability, i.e. obtaining a statistically meaningful sample for rare events, willalways remain. Data collection may well proceed independently of risk analysis, as much of the datais useful in reliability and availability studies, for which there is generally a keener economicincentive.
Analysis and modelling of data, within the limitations of the data, provide worthwhile results.Current developments which are proving useful include mukivariety analysis of failure data, whichallows tests to be made for coherence of data and correlation between observed parameters and knownattributes. These techniques represent a considerable advance on existing modelling techniques.
5.5.7. Accident sequence quantification
The evaluation of failure logic diagrams i.e. the production of an algebraic expression for theprobability of a particular outcome is carried out through application of probability mathematics andin particular the rules of boolean algebra.
Event trees are relatively straightforward to evaluate, as a probability of occurrence can beallocated to each outcome conditional only to the precursor event. As mere are no logical combinations(gates) the probability of any particular outcome, conditional on the initiating event of the treeoccurring, can be obtained by straightforward multiplication.
However, evaluation of logic diagrams which include gates is more complex. When compiledrigorously even simple systems can produce complex fault trees, with some events featuring more than
97

once requiring evaluation by Boolean algebra. Conditions on the input events, e.g. sequence, can poseproblems. The algebraic expressions can become unwieldy, making reduction tiresome. In the case ofcomplex systems, for example multiple redundant and standby units with diverse or cross-linkedsupplies as might be found where extremely high reliability is required, the logic can become socomplex as to virtually defy manual evaluation. However, correctly understanding the failure logic andensuring consistency in the design is obviously crucial. Computer packages are available for evaluationof such fault trees. This introduces a possible disadvantage: that the analyst learns less about diesystem, or has less "feel" for it. The computer packages identify "minimal cut sets" i.e. groups of basicevents, which cause the top event if existing at the same time. The analyst who writes a fault tree"straight down" is usually proceeding directly to this stage and by starting with the minimal cut setshe can increase the chance of errors in constructing the tree.
Over the past few years a number of computer codes have been developed for fault tree analysis(FTA). Fault tree analysis provides an extremely powerful tool which is capable of handling mostforms of combinational events. It provides a good basis for quantification and, as is usually the casein hazard analysis, is particularly useful where a small number of major outcomes are of concern. Witha separate tree required for each top-event very large trees can result and relationships then need tobe considered carefully between the different trees. Finally, only the outcome under consideration isshown in the tree, whereas other outcomes from the causes will not be shown. Transitions routed be-tween states are not represented and the technique generally deals with binary states: partial failuresand multiple failure modes can cause difficulties.
Simple fault trees can, of course, be evaluated by "short cut" methods. Typically, simple faulttrees are approximately evaluated by multiplication/addition of probabilities at and/or gates. It isimportant mat the analyst should be aware of the possible pitfalls of this approach. It will only workif there are no events occurring more than once in the tree. This encourages the-analyst to over-simplify in order to construct a tree which can be quantified in this manner. Also, large probabilitiesmust not be added together: a flammable cloud encountering two ignition sources, with 0.5 probabilityof ignition at each, is not certain to ignite.
Although in many cases mere is no need to use Boolean algebra or computer codes to evaluatefault trees, an advantage of such techniques is the ability to carry out sensitivity analyses, with inputdata as statistical distributions. The accuracy and availability of data, discussed later, is often such matsensitivity analyses are extremely valuable.
An important point that must be considered in the evaluation of fault trees is commoncause/mode failure. Where redundant units are used the system failure probability, calculated bymultiplication of the individual unit failure probabilities, is only valid provided that the units are trulyindependent. The fault tree and the practical situation must be examined to consider susceptibility tocommon mode failure. Computer codes are available for complex cases where the number of possiblecombinations has become large: these tools will not perform miracles but will search exhaustively forspecified types of common mode failure.
However the tree is evaluated, the inputs must be dimensionally consistent Probabilities cannotbe added to frequencies and multiplication of frequencies produces a meaningless value. This mayrequire manipulations of the data inputs into the required form, for example, the frequency of an eventmay depend on the frequency of a demand and the probability for failure of a protective system ondemand. This failure probability must be determined from failure data of the system expressed as afrequency by using the fractional dead time concept, allowing for testing and repair. This type ofcommon manipulation is discussed in most standard texts which cover the subject.
5.5.7.1. Quantification of accident event trees
Estimation of the frequency of an accident sequence depicted in an event tree entails theestimation of the frequency of the joint event consisting of the branches of the tree that constitute the
98

sequence. In the most simple case this calculation is simply the multiplication of the frequency of theinitiating events with the probabilities of die following events. This however, is valid only if the eventsare statistically independent Formal quantification requires that the probability of each branch beevaluated conditional on the events preceding this branch in the accident sequence.
When a computer code for analyzing fault trees is available the quantification of the accidentsequences can be done with the method of fault tree linking. Fault tree linking is the generation of alarge fault tree incorporating accident sequences and system fault trees, in the following steps:
(i) All accident sequences are put into groups leading to the same type of releases.
(ii) For each type of release a large fault tree is created with the top event "occurrence of theparticular release". The top event is linked with an "OR" gate which inputs all the accidentsequences in the same group.
(iii) Each accident sequence is linked through an "AND" gate with all the event tree events thatconstitute the accident sequence.
(iv) Each event of the accident sequence is considered a basic event if its probability has beencalculated directly (human error, or system failure without further analysis) or it is replaced bythe system fault tree that models the systems failure.
The resulting tree can be very large and requires the use of specific codes for its quantification.The resulting "cut sets" represent accident sequences expressed in terms of basic events (simplefailures) all resulting in the same type of release. The frequency of the top event is the frequency ofthe release category to be used in the risk estimation described in section 5.6.
5.6. RISK ESTIMATION AND RISK ASSESSMENT
5.6.1. The combination of consequence and frequency to produce risks
As described in section 53 the basis for quantification of risk from an industrial activity is a listof hazardous events or groupings of like events which can be considered to produce similarconsequences. The frequencies of these events may be estimated by the techniques described in section5.5. There may be a range of possible outcomes from each event, depending on the differentcircumstances which may prevail: for example meteorology, location of people, probability of ignitionetc. Each of these circumstances must be defined and assigned a probability. The aggregation of thefrequency and consequence analysis can, therefore, be complex, although it is conceptually simple andall analyses follow essentially the same procedure.
Damage causing events must be related to the undesired initiating events: for example, thevarious possible outcomes arising from a release of flammable material may be modelled using anevent tree. The conditional probability for factors such as wind direction towards ignition sources andchance of ignition at each source can then be used to produce a frequency for the damage causingevent from the frequency of the initiating event
The consequences of each damage causing event are assessed using the methods described insection 5.4. and in Appendix IV. The usual approach is to define ranges to selected casualtyprobabilities from a combination of effect and vulnerability models. These casualty probabilities maybe selected and limit ranges to each value estimated: for example, the probability of casualtiesoccurring at various over-pressures could be used in conjunction with an explosion overpressure modelto produce radii to selected casualty probabilities. The selection of probabilities will usually dependon the available data underlying the vulnerability model used. The analyst should be wary of usingprobit type relationships to produce a large number of casualty probability bands as this not onlycomplicates the analysis, but the degree of detail would not be supported by the base data.
99

Having obtained the frequency and casualty probabilities against range for each damage causingevent under consideration, the risk relationships are derived in the following manner. Taking eachevent in turn, the number of people present in the area covered by each casualty probability band aremultiplied by the appropriate casualty probability producing, by summation, the total number of peoplepredicted to be affected by each event. The overall frequency-consequence relationship can then bedrawn up from the number affected and the frequency for each event. Expressing the risk in terms ofthe frequency distribution of multiple casualty events in mis way is known as calculating theSOCIETAL RISK.
The INDIVIDUAL RISK at a location is obtained by taking the casualty probability at thatlocation for each damage causing event and multiplying it by the frequency of that event. Theindividual risk from all such events, and therefore from the activity as a whole, is obtained by summa-tion over all the events.
The final expression of individual and societal risks then incorporates the likelihood and severityof all the outcomes that have been considered and allows for features specific to the plant and to theparticular location.
The following three sections illustrate the way in which the calculations can be carried out.
5.6.2. Individual risk
Individual fatality risk is defined as the frequency (probability per unit of time) that an indi-vidual at a specific location (x,y) relative to the installation will die as a result of an accident in theinstallation.
The following components are combined to form the individual fatality risk:
f; frequency of the i* initiating event that can lead to an accident (i=l,...,I).
Pri conditional probability that the r* initiating event can result in a release of type (r) of ahazardous material or in an event like pool fire, explosion etc (r=l,...,R).
fr frequency of the r* release category given by:
f] frequency of the j * type of weather conditions coupled with any other type of uncertainparameter e.g. ignition time (j=l,...,J)
The two sets of uncertain events R and J define a new combined set of random events W, whereW=JR, each of which has a frequency f»:
Level of adverse exposure (e.g. heat, radiation, dose of toxic material) at location (x,y) condi-tional on the joint event W. This quantity is calculated by the physical models presented insection 5.4.3, 5.4.4 and in Appendix IV.
Conditional probability that an individual exposed to the k* level of the adverse effect willdie as a result of that exposure (Casualty Probability).
Conditional probability that an individual at location (x,y) will die given the joint event w.
100

Frequencies of accident initiators (fj) and conditional probabilities of releases (Pri) are calculatedat the hazard identification steps and the corresponding quantification. Frequencies fw and levels ofexposure to adverse effects, kj(x,y), are calculated during the consequence estimation steps.
Conditional probabilities P^ are the result of the dose/response analyses involving probitfunctions in the consequence estimation step. Given the fact that from an installation a number ofinitiating events (i) can occur each with the potential of resulting in a number of release types eachof which, owing to the weather variability and other uncertainties, can result in a number ofconsequence levels k, the total individual risk at a location (x,y) is given by:
I(x,y) =1 fJPJw)
5.63. Societal risk
Societal risk proceeds one step further than individual risk by taking into consideration thepopulation size and distribution around the site of the installation. Societal risk is expressed in termsof the so called FN- curves and gives the frequency for the number of fatalities which exceed thenumber N.
Societal risk is calculated as follows:
d(x,y) is the population density at location (x,y)
Nw is the number of people mat will die given the joint event w (w=l,...,W) given by
Nw = lPw(x,y)d(x,y)
where the summation extends over all points (x,y) for which Pw(x,y) and d(x,y) are differentthan zero.
This process results in W doublets (Nw Q which can then be sorted out to form the cumulativedistribution function of N or the FN- curves.
5.6.4. Assessment of resultant risk levels
The qualitative and quantitative results of the analysis can be applied in the assessment processas follows:
(a) Risk impacts at various distances from the plant may be compared with safety targets or criteria.A judgement can be made on the hazard impacts. A general principle of assessment is that therisk impacts from the development should be well below the levels of risk which people and theenvironment are regularly exposed to from other sources.
(b) The analysis should particularly highlight major contributors to risk, i.e. their nature and extentand secondly, areas where risk can be eliminated or cost-effectively reduced. These results canbe used to develop prevention and protection measures including priority allocation of resourcesfor hazard control.
Verification of results is a critical stage in risk analysis. It is relatively easy to make an errorin the calculation sequence and several types of checking are necessary.
101

(a) Total result:
Is the total individual and societal risk predicted consistent with the historical experience forsuch facilities.
(b) Major risk contributors:
The top ten to twenty major risk contributors for both individual and societal risk needs to beseparately checked in detail. As well as verifying correct analysis, the accident sequence andsafeguarding deficiencies are a major deliverable of the risk analysis.
(c) Minor risk contributors:
A task often omitted is the need to check for analysis errors in the minor risk contributors.Important cases can be neglected if the initial analysis has under- estimated the event either infrequency or consequence.
(d) Shape of the individual risk contour:
Does the shape reflect any predominant wind direction, are major isolated ignition sourcesclearly contributing to the shape, do contours reflect appropriate dominance of non-directional(e.g. BLEVEs) or directional (e.g. flash fire) events?
It is through the process of detailed results checking that errors are removed from the analysisand that the project manager achieves a clear understanding of the full risk picture. Once this iscomplete, it is possible to compare results against formal criteria and, where appropriate, to developa range of suitable mitigation measures.
Event frequency modifiers resulting from audit of management systems are discussed inChapter 8.
102

6. ASSESSMENT OF TRANSPORTATION RISK
6.1. OVERVIEW AND SCOPE OF APPLICATION
The transport and distribution of hazardous substances, such as petroleum products, liquifiedpetroleum gases, chlorine gas, pesticides, chemicals/petrochemicals, hazardous waste and radioactivematerials, inevitably involve the potential for incidents and accidents which may result in death orinjury to people, property damage or damage to the bio-physical environment through the effects offire, explosion or toxicity. An increasing number of transportation accidents involving hazardoussubstances have occurred worldwide. Such accidents with their resultant effects on people and theenvironment have increased awareness in government, industry and the community at large andresulted in a re-think in the risk assessment process for hazardous substances transportation. In thatcontext, it is now recognized mat the safety planning of transportation routes, accounting for the typeand nature of surrounding land uses, is an integral component of the safety management of hazardoussubstances transportation. Delineating hazardous substances transportation routes is, as such, asignificant and essential complementary measure to technical and operational safety and environmentalcontrols on the hazardous substances containers and associated regulatory processes. It is relevant tonote that fixed installations are more amenable to locational, organizational and operational hazardcontrols. Transportation systems are dynamic systems with additional external variables (e.g. drivers,traffic conditions, etc.) difficult to bring into one overall control system. A recent study carried outby the HSE's Advisory Committee on Dangerous Substances (ACDS) on the Major Hazards Aspectsof the Transport of Dangerous Substances gives detailed accounts of the methodologies and techniquesused in the assessment of transport risks [54].
There are several important features of transport risk that require a different type of analysis tofixed facilities. Such features include:
the hazard source is not continuously present at any place (except pipelines);the exposed population is in close proximity to the hazard (buffer zones are impractical);individual risk may be very low (due to occasional exposure) but societal risk may be very high(as the transport vehicle is always affecting someone);the level of safeguards is less (bunding, water sprays, fire insulation are impractical);
* immediate availability of specialist knowledge is less (i.e. no foreman or engineers present).
This chapter of the guidelines focuses on the analysis and assessment of transportation routes(road, rail, waterway, harbour and pipelines) for the carriage of hazardous materials. The integratedrisk assessment approach to the safety of hazardous substance transportation necessitates considerationof three main elements in an integrated manner:
(a) Transportation risk and environmental and land use safety factors; including theidentification and quantification of risks to people, property and the environment from thetransport of hazardous material, particularly as they relate to effects on land uses andenvironmental ecosystems along the transportation routes. These are environmental and riskfactors;
(b) Capability of the existing network and cumulative traffic implications; including overalltraffic movement, congestion and level of service on used or potential routes, accident rates,route conditions. These are traffic related factors;
(c) Economic distribution considerations and operator's requirements for practicaltransportation economics; including considerations of travel distance and time and thetransportation costs of alternative route systems.
An integrated assessment of the safety adequacy of an existing hazardous substancestransportation route or the formulation of alternative routes for the safety management of such
103

transportation necessitate the quantification and weighing of all three elements indicated above.Although a brief description of elements (b) and (c) will be provided, the focus of the chapter is onthe risk and environmental considerations of hazardous material transportation in line with the mainfocus of this guideline document.
There are three main applications for the information, tools and techniques outlined in thischapter:
(i) identification, analysis and assessment of the environmental and safety land use implications (aswell as traffic and economic implications) of existing routes and transportation of hazardousmaterials on an area scale. The output being a quantification of existing risk from thetransportation of hazardous material and assessment of the adequacy and appropriateness ofexisting routes for the transportation of such material;
(ii) the formulation and designation of hazardous material transportation routes as an integralcomponent of the environmental and safety management of such transportation, including theexclusion of routes with the highest risk to people and the environment;
(iii) providing the basis for the assessment of both the individual and cumulative environmental andsafety implications of a development proposal which generates or receives hazardous material.
The assessment of the safety suitability of an existing transport network for the transport ofhazardous material and the formulation of routes for the safe transport of such material are thereforemajor objectives.
It should be noted that although this chapter deals mainly with the risks of hazardous materialsbeing transported, when considering the overall system the risks of choosing a particular mode oftransport may well be dominated by the risks involved at the loading/unloading facility. These riskscan be calculated either as part of the fixed facility assessment or as part of the transport assessment -whichever is the more appropriate for the specific situation.
It should also be noted that, for most forms of transport of hazardous materials, mere exists acomprehensive and extensive list of international transport regulations. The results of a transport riskassessment are very specific to that particular assessment and care must be taken to avoid drawingconclusions from a few studies and then generalizing from these, i.e. rail may not always be safer thanroad, pipelines may not always be safer than rail, etc.
A good screening system for transport risk is given in Ref. [1].
62. ANALYSIS AND ASSESSMENT OF TRANSPORTATION RISK AND ENVIRONMENTALAND LAND USE SAFETY FACTORS
6.2.1. Overview
This section describes the procedures for analyzing and comparing alternative routes for thetransportation of hazardous materials on the basis of land use and environmental safety. It is notintended to provide in-depth documentation of the assumptions and processes implicit in themethodology. Rather, the purpose is to highlight the most relevant procedural information and aconcise description of the criteria that may be applied for hazardous materials routing.
Factors that influence routing decisions, from an environmental safety viewpoint, may begrouped into three inter-related categories (see Fig. 6.1):
• Mandatory factors, including legal and physical constraints;
104

Environmental and land use risk, including the identification of hazards and the quantificationof risk;
• Subjective factors mat reflect community priorities and values which may not be easilyquantified. Such factors include special populations, special land uses, emergency response.
Consideration of each of the above factors may on its own or in combination preclude the useof any particular route for the transportation of hazardous material or favour an alternative route.
622. Mandatory routing factors
(a) Physical mandatory factors that may preclude a routing alternative include: weight limitationson bridges, height restrictions on overpasses, inadequate shoulders for breakdowns, extensiveconstruction activities or inadequate parking and turning spaces.
(b) Laws and regulations may apply to any routing alternative in prohibiting the transport ofhazardous materials through certain routes or structures (e.g. tunnels, bridges). Local, state andnational transport authorities should be consulted in all cases. Such prohibited routes are obviousfirst cut alternatives to be eliminated.
ANALYZE MANDATORY
FACTORS
•LEGAL
•PHYSICAL
DETERMNERSK
• ACCIDENT PBOBAHUTY
ACCOENT CONSEQUENCES
«HSK COMPOSITIONS
ANALYZE SUBJECTIVE
FACTORS
•SENSITIVE LAND USES
• SENSmVE ENVRONMENT
• EMERGENCY EVACUATION
COMPARE ALTERNATIVES
SELECT ROUTES
FIG. 6.1. Overall approach to risk comparisons and assessment for hazardous materialstransportation routes
105

63.3. Environmental and land use safety factors
The overall environmental and land use safety criteria for route selection is that the route whichhas the lowest risk value to surrounding people, property and the natural environment should beselected. In this context, risk is determined in terms of the cumulative combination of the probabilityof accidents and the consequences of such accidents. These two elements of risk are dependent on theextent of population exposed and number of properties or extent of natural environment ecosystemsand the accident rates. In general, routes with the smallest adjacent population as well as accident rateswill have the lowest risk values. This population should also include that on the traffic route itself.
In designating routes for the transportation of hazardous materials, the risk values in absoluteterms are of limited practical use. It is the relative difference in the risk values that should mainly beconsidered when differentiating between the different route alternatives. If sufficient differences existbetween the risks of alternative routes (e.g. 25% or more) it may be possible to designate the preferredhazardous materials route on the basis of the mandatory factors and the risk calculations.
6.2.3.1. Estimations of the consequences of hazardous materials transportation
The estimation of the consequences of accidents from the transportation of hazardous materialsnecessitate data on:
The nature and the compatibility of the materials being transported and the tank construction(this should include hazardous waste);
• Identify for the various transportation modes (i.e. sea, river, road, rail or pipeline) thosematerials which have the potential for continuous (routine) releases hazardous to health and theenvironment;
• Identify for the various transportation modes those materials which pose a threat to health andthe environment if released as a result of an accident;
• The storage/transportation conditions (e.g. temperature, pressure);• The quantity of the load;• The nature of the transportation tanker(s) including configuration of major characteristics;• Prevailing meteorological conditions applicable to the road network under consideration
(including wind speed, direction and where possible atmospheric stability);• Topographical characteristics of the general area both - natural and man-made;• Land use survey of the surrounding areas along the transportation routes, including the type and
nature of land use (residential, commercial, schools, hospitals, etc.) and the residential/populationdensity associated" with each type of land use.
Based on accident scenarios, including leakage of the tanker's contents, pool fires, tanker fire,explosions and/or release of toxic substances into the environment, the consequences (effects) of eachaccident scenario are calculated, usually in terms of heat flux, explosion overpressure and toxicexposure, using thereby mainly consequence modeling tools (see Section S.4 of mis document). Basedon estimated effects and population data (densities for land use types along the route and for roadways,people on the route trapped in the blocked up traffic) the number of people that may be affected bythe postulated accident, in terms of injuries or fatalities can be determined. The effects on theenvironment can be determined in a similar manner using the models described in Chapter 4.
It is difficult to set out standard safety separation distances for evacuation and other emergencyresponse following an accident. A better approach is to assess each type and quantity of load for itsspecific hazardous consequences (e.g. BLEVE, jet fire, pool fire, toxic cloud) for a small number ofrealistic accident scenarios. The methods described in Chapter 5 are suitable for this purpose, but seealso the IAEA Prioritization Scheme [1].
Useful emergency response guidance for a wide range of chemicals is given in the US Coastguard CHRIS Manuals [55]. This applies to both land and marine spillages.
106

6.2.3.2. Estimations of the probability of transport accidents
The probability of a hazardous materials accident is the likelihood or chance that a vehiclecarrying hazardous materials will be involved in an accident To calculate this probability, the analystderives the accident rate applicable to the load and the route segment and then must adjust thisaccident rate to reflect the amount of exposure or vehicle experience. Similar reasoning can be appliedto pipeline accidents.
A suggested sequence of steps can be summarized as follows:
(i) Determine the accident rates on a particular route: ideally, the most reliable data concerningaccident rates would be those associated specifically with hazardous materials transportationtankers in terms of the number of hazardous materials accidents per tanker. If such informationis available then it should be used directly into probability estimations. In many cases, however,such information is not readily available. It is usually necessary therefore to rely on accidentrates statistics for all vehicles and then to adjust these to reflect the smaller share of hazardousmaterials in the traffic stream.
The first step is usually to obtain statistics from historical records of the local total rates ofaccidents from relevant vehicles, usually in terms of accidents/vehicles-km, where vehicle-kmrefers to the total number of kms travelled by all vehicles for which accident statistics areavailable.
(ii) Calculate the probability of an accident for any vehicle based on vehicle exposure: theprobability of any vehicle being involved in an accident of a specific segment is calculated bymultiplying the segment accident rate from (i) above with the road segment length (or amountof exposure). This probability is in terms of accidents/vehicles.
(in) Factor the probability statement for any vehicle to reflect the incidence of hazardousmaterials vehicles in the traffic stream: this is done by multiplying the probability figure fromstep (ii) by the hazardous materials accident factor (being the ratio of hazardous materialstransport accidents/all vehicles transport accidents). This probability is in terms of hazardousmaterials accidents/vehicles.
Where the hazardous material accidents could be obtained from available statistics, then thefollowing steps could be directly applied:
• Obtain the accidents statistics applicable to hazardous material tankers and convert to hazardousmaterials accidents/vehicle-km (i.e. per total number of km travelled by all hazardous materialtankers to which statistics apply);
* Obtain probability of hazardous material accident
It is necessary in some justifiable circumstances to further introduce a correction factor thatreflects physical characteristics of the particular route segment which may increase the probability ofan accident on that particular route.
6.2.3.3. Methodology to calculate transport risk
The potential consequences (population and/or property) and accident probabilities for each routesegment are multiplied to calculate the segment risk. The cumulative summation across all routesegments produces the total risk for the route. It is noted that the accident probabilities derived perSection 6.2.32 above should be further converted to a likelihood or probability of impact. Theprobability of a hazardous event and release occurring is computed using tools such as event and faulttree analysis to incorporate factors such as: whether the load will be dislodged as the result of anaccident, the extent of such load loss and ensuing spillage, the effectiveness of any
107

containment/emergency procedures and the likelihood of the spill or release reaching environmentallysensitive areas or having an effect on people, buildings, etc.
For the computation of transportation risks along different route segments, based on thecumulative combination of the consequences and probabilities of accidents, the following proceduralsteps are appropriate:
(a) For each substance (load category) transported establish the range of hazardous events scenarios,the probability of each scenario Psc and the radius of fatality (or injury) effects from eachscenario. Figs 6.2, 6.3, and 6.4 are examples of event trees that may be followed. The depth,extent and number of hazardous scenarios will depend on the comprehensiveness of the analysisstudy. It may be possible for a simplified case analysis to postulate two or three hazardousaccident scenarios and assign probabilities and estimate the radius of fatality (or injury) effectsfor each event;
(b) From the above, estimate the severity index for each category of hazardous load:
Calculate P^ 7CT2 for each hazardous scenario• Calculate the severity index (S J.) by summing up SP rcr2 for all postulated scenarios;
(c) Multiply the severity index for each load category (SP^rcr2) by the probability of a hazardousmaterial accident as determined in section 6.2.3.2.
(d) Multiply the result of step (c) above by the population density along each of the transportationroutes under consideration. This is the population risk for the route(s) under consideration forthe hazardous load;
Note: The population density (number of people/km2) may be obtained by calculations or frompopulation statistics for different categories of land uses.
(e) Compare the population risks for the different route alternatives.
6.2.4. Subjective rooting factors
Subjective routing factors in die selection (or elimination) of routes for the transport ofhazardous materials usually include:
• The location along the roadway or in its vicinity of sensitive land uses such as hospitals,schools, old age person housing, churches or hems of heritage or cultural significance; or thelocation of sensitive ecosystems and natural landscape such as park reservations, wetlands.
• Emergency and evacuation planning and infrastructure, including: the availability of formalizedemergency and evacuation procedures and plans, the location of emergency response teams andtheir ability to respond to hazardous material release, access and ease of emergency evacuation.
Subjective factors should reflect community priorities and values and should preferably bearrived at through community discussion and consensus. These factors are particularly relevant in theassessment process when one alternative is not clearly superior to the others. As such, whether or notthe analyst chooses to select and apply subjective factors will depend upon the outcome of the riskcalculations and how conclusive the findings are.
108

PROBABILITY
PROBABILITY
FATALITY
RADIUS(m)
PETROL TANKER ACCIDENT
NOPETROL SPILL
PROBABILITY 0.5
(0.8)
0.4
NO FIRE
0.9
YES
0.5
NOIGNITION
YES
(0-2)
0.1
ISEE OF POOL FIRE
<10005
1000000 10 tOO
5 00020
10 000900
> 20 000
(0.25) (0.2) (0.2) (0.2) (0.15)I I I I I
0.025 0.02 0.02 0.02 0.015
4.0 5.3 6.7 8.0 10.6
0 1.3 1.8 2.8 4.0 5.3
SEVERITY INDEX S.I. = 14.9
FIG. 6.2. Event tree for petrol tanker accident (Spill size in litres). Extracted from Ref. [54].
109

ACCIDENT WITH TRUCK CARRYING CHLORINE
Probabilityof load
33kg. Cylinders Carried 1 70kg Cylinders Carried 920kg Drums Carried •> 12 500kg Tanker
Probability thatCylinder/DrumIs Dislodged
Probabilityof Leakfollowing
0.14
!(0.1)0.014
0.71
I(0.1)
0.071
0.13
I(0.1)
0.013
0.02
I(0.1)0.002
(0.1)0.0014
(0.1)0.0071
(0.1)
0.0013
(0.1)
0.0002
SizeofLeak
25mrr_Hole
10mrrHole
1mmHole
25mnrHole
10mrrHole
1mmHole
25mrrHole
10mrrHole
1mmHole
25mmHole
10mrrHole
1mmHole
Probability ofLeak Of (0.01) (0.09) (0.9) (0.01) (0.09) (0.9) (0.01) (0.09) (0.9) (0.01) (0.09) (0.9)Above Size
Probability ofevent glvenO.0000140.000126 0.00126 0.0000710.0006390.00639 0.0000130.000117 0.00117 0.0000020.000016 0.00018Accident
FatalityRadius (m) 17.2 11.5
J5.8 17.2 11.5 5.6 17.2 11.5 5.6 17.2 11.5 5.6
Psc«r 0.013 0.052 0.133 0.113 0.411 0.928 0.152 0.872 1.313 0.079 0.413 0.224
SEVERITY INDEX S.I = 4.7
FIG. 6.3. Event tree for accident with truck carrying chlorine. Extracted from Ref. [54],

LP.G. TANKER ACCIDENT
0.95
Small Release<100kgOr No Qamage
(0.9)0.0029925
IGNITION
(0-5)0.0225
0.045
Cont SmallLeak
0.0035i
initial LargeLeak
(0.95)
0.003325
PIPE FAILURE/HOLE IN PIPE
E.F.V.
OPERATES
0.00016625
(0.5)
(0.1)0.0003325
IMMEDIATE
IGNITION
I(05)
0.00036825
0.9754925(0-5)
0.0225
(0.5)0.00016625
EXPLOSION
0.0015
Total TankFailure
(0.05)
0.000175
"I ITOTALTANKERRELEASE
0.00184125
IGNFTION
(0.7)0.000257775
(0-3)0.000110475 (0.8)
0.001473Small LeakNo Event
SmallTorch Fire
LargeTorch Fire
fireball/ .Rash Fire
VCE PoolRre
FIG. 6.4. Event tree for LPG tanker accident. Extracted from Ref. [54].
I l l

6.2.5. Guidance implementation
The following guidance woridng sheet may be used as a guide in the computation of the landuse safety factors for assessment purposes.
GUIDANCE WORKING SHEET FOR HAZARDOUS MATERIALSROUTING BASED ON LAND USE SAFETY FACTORS
3. GENERAL ROUTE CHARACTERISTICS
Alternative No: Length: kms
Origin: Destination:
GeneralDescription:
Type of Hazardous MaterialsTransported:
2. MANDATORY FACTORS
Are there any physical constraints(explain):
Are there any legal constraints(explain):
Special hazardous properties for emergencyresponse:
3. SUBJECTIVE FACTORS (optional)
Explain any of the following subjective factors, as applicable.
Special Population:
Special Properties:
Emergency response capabilities:
Other factors:.
112

RISK ESTIMATION
Segment No. Probability of aHazardousMaterialAccident
Population HazardDensity Index
PopulationRisk
TOTAL:
113

6.3. AN EXAMPLE OF THE ANALYSIS AND ASSESSMENT OF THE TRANSPORTOPERATIONAL AND TRAFFIC FACTORS FOR A ROAD ROUTE
The following traffic factors reflect the ability of a route to effectively and safely move thetraffic flows using it:
• Traffic volume and composition;Carriageway level of service;Structural and geometric adequacy of roads;
• Number of traffic signals;• Travel time;
Availability of alternative emergency routes.
An overview outline of each of these factors is provided thereafter.
63.1. Traffic volume and composition
The composition of vehicles by size and type is required to assess the roads structural adequacyas well as its operating level of service.
Traffic volume and composition along various sections and segments of the road network maybe obtained from published statistical infonnation but preferably through field screening surveys.Traffic volume may be expressed in terms of: Annual Average Daily Traffic (AADT); hourly trafficvolume (average and peak). The directional distribution of traffic should also be obtained. Thisinfonnation together with hourly intersection counts can be used to estimate the peak directional hourlyvolumes along all road sections within the study area.
Classification counts to establish the type of vehicles would differentiate as a guide between:Light vehicles and heavy vehicles (both rigid tankers and articulated tankers).
63.2. Carriageway level of service
'Level of service' for a road section indicates the capability of roads for moving the type andvolume of traffic using it. One definition of "level of service' is 'qualitative measure describingoperational conditions within a traffic stream, and their perception by motorists and/or passengers'. Itdescribes these conditions in terms of several factors such as speed and travel time, trafficinterruptions, safety, driving comfort. A possible designation of the level of service is from A to Fwith level of service A representing the best operating conditions (i.e. free flow) and F level of servicethe worst (i.e. forced or break down flow).
A 'service volume' is defined as 'the maximum hourly rate at which vehicles can reasonably beexpected to traverse a point or uniform section of a lane or roadway during a given time period underthe prevailing roadway, traffic and control conditions while maintaining a designated level of service'.Table 6.1 indicates suggested one-way hourly volumes for interrupted traffic flow at different levelsof service.
It is suggested that for arterial/sub-arterial roads used for hazardous material transportation alevel of service C not be ideally exceeded with an utmost level of service D in urban situations. Trafficvolume estimated as per Section 6.3.1. may therefore be used to estimate the appropriate level ofservice of each road under consideration.
6 3 3 . Structural and geometric adequacy of roads
The structural and geometric adequacy of the routes under consideration to cater for heavyvehicles carrying hazardous material should be assessed. Routes with good geometry (e.g. wider
114

TABLE 6.1. EXAMPLE OF ONE-WAY TRAFFIC VOLUMES (PCU)1 FOR URBAN ROADS ATDIFFERENT LEVEL OF SERVICE (INTERRUPTED FLOW CONDITIONS)
Type of RoadCarriageway
2 Lane Undivided
4 Lane Undivided
4 Lane Undivided withclearway
4 Lane Divided withclearways
6 Lane Undivided
6 Lane Divided withclearway
Level of Service
A
540
900
1080
1140
1440
1740
B
630
1050
1260
1330
16S0
2030
C
720
1200
1440
1520
1920
2320
D
S10
1350
1620
1710
2160
2610
E
900
1500
1800
1900
2400
2900
PCU1 = Passenger car unit, i.e. heavy vehicle volumes are converted into passenger car equivalent.
carriageway with minimum horizontal and vertical curves) and good line of sight should be selectedin preference to routes of lesser quality. In situations where for other reasons routes in the lattercategory were selected they should be upgraded to provide better geometry and, if necessary, thepavement should be reconstructed to cater for increased volumes of heavy vehicles.
63.4. Number of traffic signals
The number of traffic signals is often used as a measure of delays along a route section. A routewith a smaller number of signals would most likely be chosen as it would have the potential for lessdelays.
6.3.5. Travel time and travel speed
Travel time for vehicles using a route indicates the congestion points as well as reflects the levelof congestion. Travel time information is usually available from transport authorities or may have tobe collected by way of field surveys. The National Association of Australian State Road Authoritieshas suggested an average vehicle travel speed for different levels of service given in Table 6.2.According to this table, travel speeds in the range 25-30 km/hr correspond to levels of service C-Dbordering the range of suitability for route selection. Routes with higher travel speeds are selected inpreference to those with lower speeds.
63.6. Availability of alternative emergency routes
In case of an emergency which would require the closure of a route designated for the transportof hazardous material an alternative route should be available.
115

TABLE 6.2. EXAMPLE OF TRAVEL SPEED AND FLOWS FOR DIFFERENT CATEGORIESOF LEVEL OF SERVICE
Level of Service
A
B
C
D
E
F
Type of Flows Average(km/hr)
Free flow (almost no delay)
Stable flow (slight delay)
Stable flow (acceptable delay)
Approaching unsuitable flow
Unsuitable flow (congestion)
Forced flow
Overall'
£50
>40
>30
>25
25 (app.)
<25
6.4. TRANSPORT OPERATIONAL COSTS AND OPERATIONREQUIREMENTS
An important criterion in the assessment and selection of a route network for the transportationof hazardous material is the relative cost of delays and travel time. The analysis of this informationwould enable the determination of the economic implications of particular routes for the transport ofhazardous material and the transport operator's requirements for practical transport economies.
Transport costs fall into two basic categories: fixed costs and variable costs (usually referred toas operating costs). Generally, the former costs do not vary significantly with the vehicle-kilometerstravelled. If the tanker carrying hazardous material needs to change to a route of a longer or shorterdistance, only the operating costs will be higher or lower respectively. In many cases, both operators'cost requirements and operators' "convenience1 result in the use of the shorter route irrespective ofsafety implications.
Operating costs are based on two main components - a variable cost for operating the roadtanker and the cost of the driver's time.
Total vehicle operating cost = Unit cost component by distance travelled (cost/km) + Unit costcomponent by time taken to travel the distance (cost/hr).
These factors could be reflected by the distance travelled and the travel time along the route.
For the above, it is indicated that the main cost criteria when assessing or comparing alternativeroutes for the transportation of hazardous material is the expected increase or decrease in travel time(the main component that influences operating costs).
An increase or decrease in operating costs of over 10% is considered to have a significant effecton the cost of transporting hazardous material. It is also considered that the distance cost couldincrease further as long as the travel time was within the 10% margin. For example, a longer distanceroute could have less congestion thereby resulting in a travel time about the same as the shorter route.
116

6.5. PIPELINE TRANSPORT
Pipelines share common risk features with both fixed facilities and transport facilities.Physically the pipeline does not move but population separation can be very little and third partyinterference is hard to prevent (e.g. digging).
It is not possible here to provide a method, but features to consider in the analysis include:
• length of isolatable sections (block valve locations);• realistic isolation times (manual or remote operated valves);• leak detection systems (if any);• depth of cover;• corrosion protection (wrapping, cathodic protection);• safety factor (specified minimum yield stress, enhancement at road, river crossings, etc.);• inspection and maintenance;• safety management system.
Once all these factors are included a risk analysis of the type defined in Chapter 5 may becarried out. Pipeline failure rate data is available from various sources (CONCANE in Europe and theUS National Transportation Safety Board) but these will need to be modified using logic diagrams toaccount for local factors (e.g. digging, welding standards, etc.). An interesting but confusing aspectof individual risk contents when applied to pipelines carrying flammable gases is that contours appearto shrink in size when entering populated areas. This is due to the many local ignition sources andthus few vapour clouds will reach their full extent before igniting.
117

7. ANALYSIS OF HAZARDOUS WASTE
7.1. INTRODUCTION
Wastes are generated by almost all branches of industry including industries that produce non-dangerous products, but a few major groups are most likely to produce hazardous toxic wastes whichrequire special treatment. Industries with a high potential for generating hazardous wastes are mainly-inorganic and organic chemicals, petroleum refining, iron and steel, non-ferrous metals (smelting andrefinery), leather tanning and finishing, paint and coatings, nuclear facilities, electroplating and metalfinishing. A list of the main waste producing industries, the type of waste produced and the potentialimpacts on health and the environment is given in Table 7.1.
In general, the industrial production system generates products and wastes - it consumes rawmaterials, energy and manpower. The waste products generated enter some form of waste stream andare moved to the waste management sector for further processing, treatment and ultimately disposal.Fig. 7.1 illustrates the various points at which the generation, storage, handling and transport ofhazardous wastes may arise. Fig. 7.2 shows the hierarchy or alternatives in waste management, whichinvolves the following four options:
(a) avoidance at source;(b) re-cycling of the hazardous waste;(c) special treatment of hazardous waste;(d) disposal of the waste.
The chemical plant (or any other process system) will produce wastes that may be recycled in-house. If wastes, either from the plant or process itself or from the re-cycling unit are hazardous, thenstorage, handling and transport problems will arise when it is transferred to the waste disposal industryas shown on the diagram. Hazardous waste will also arrive from industries which use toxic chemicalswhich may subsequently appear in liquid, sludge or solid wastes.
It is not only industrial wastes that need to be considered in the integrated risk assessment ofthe study area concerned but also domestic wastes such as discarded paints, insecticides and aerosolcontainers can be hazardous and in landfill disposal sites methane may be produced which can presentan explosion hazard. Toxic chemicals can also get into ground-water if not properly contained.
The assessment of the risks from all the waste forms produced in a large area of industrialactivity will be very difficult and time-consuming and it is recommended that a top-down approachis applied to rank the wastes in order of priority so mat those which cause the biggest problem canbe identified and dealt with first.
Once the various waste streams have been identified the methods of assessing their effects onhealth and the environment presented in these guidelines can be applied. For example continuousdischarges to the atmosphere or water can be dealt with in Chapter 4 of these guidelines - theconsequences of methane explosions from landfill sites can be estimated from section 5.2 and so on.
The objective of this chapter is to define hazardous wastes, to discuss why wastes are treateddifferently to normal industrial hazardous material and to identify and assess waste generation systems.
12. CATEGORIZATION OF WASTES
It is important to clearly categorize wastes and waste streams so mat there is no ambiguity asto the responsibility for the appropriate management of waste. Many different systems of wastecategorization have been developed by regional, state and national governments. At the internationallevel the OECD [56] has produced a comprehensive system of categorization.
118

TABLE 7.1. HAZARDOUS WASTE: GENERATING OR HANDLING FACILITIES
Activity
A. Mining
Coal mining washeries
Non-ferrous metal mining(particularly gold)
Asbestos mining
Gas and oil extraction
Uranium mining
B. Manufacturing
Gas works
Typical Hazardous Waste
Spoil heaps/slurry wastewaters/dams
Spoil heaps/slurry waste damscontaining heavy metals/salts,cyanide arsenic etc
Slurry waste heaps high inasbestos
Oily muds/sludges
Radioactive slurry waste andwaters. Other minerals andmetals in slurry waste waters
Phenol/mercaptan/cyanidecontaining sludges
Nature of Hazards
Physical impact/pollution
Pollution by toxics/physicalimpact
Asbestos fibres/dust
Pollution/fire
Radiation/pollution
Pollution by toxics andodorous substances
Potential Impacts
Pollution of water courseslandslides/dam failures
Contamination of ground andsurface waters (runoff andleachate). Aquaticenvironment damage
Soil contamination
Soil, groundwater and surfacewater contamination
Pollution of water bodies andimpact on aquatic and otherspecies
Soil, water and aircontamination
Potential Health Impacts
Chronic and acute illnessesthrough intake of pollutantsthrough water supply and foodchain
Chronic and acute illnessesthrough intake of pollutantsthrough water supply and foodchain
Chronic and acute illnessesthrough intake of pollutantsthrough water supply and foodchain
Chronic and acute illnessesthrough inhalation and intakeof pollutants through watersupply and food chain
Chronic and acute illnessesthrough inhalation and intakeof pollutants through watersupply and food chain
Chronic and acute illnessesthrough inhalation and intakeof pollutants through watersupply and food chain

TABLE 7.1. HAZARDOUS WASTE: GENERATING OR HANDLING FACILITIES (cont.)
Activity
Oil refineries
Leather production/tanneries
Coke works
Aluminium smelters
Electro-plating works
Pharmaceutical works
Asbestos works
Typical Hazardous Waste
Sludges/tars/aqueous waste
Sludges containing heavymetals
Sludges/tars/solvents
Fluoride and cyanidecontaining residues
Sludges containing heavymetals
Halogenous and halogen freesolvents
Asbestos containing residues
Nature of Hazards
Fire/explosion/pollution bytoxics
Pollution by toxics
Pollution by toxics
Pollution by toxics
Pollution by toxics
Pollution by toxics
Asbestos fibres/dust
Potential Impacts
Soil, water and aircontamination
Soil and water contamination
Soil and water contamination
Surface and groundwatercontamination.
Soil and water contamination
Soil and water contamination
Soil contamination
Potential Health Impacts
Chronic and acute illnessesthrough inhalation and intakeof pollutants through watersupply and food chain
Chronic and acute illnessesthrough intake of pollutantsthrough water supply and foodchain
Chronic and acute illnessesthrough intake of pollutantsthrough water supply and foodchain
Chronic and acute illnessesthrough intake of pollutantsthrough water supply and foodchain
Chronic and acute illnessesthrough intake of pollutantsthrough water supply and foodchain
Chronic and acute illnessesthrough intake of pollutantsthrough water supply and foodchain
Chronic and acute illnessesthrough intake of pollutantsthrough water supply and foodchain

TABLE 7.1. HAZARDOUS WASTE: GENERATING OR HANDLING FACILITIES (cont.)
Activity
Metal pickling works
Plastic manufacturing
Rubber production/processing
Paint/resin manufacturing
Coating works
Pesticide production
Non-ferrous metal refining
Typical Hazardous Waste
Acid mixtures/sludgescontaining metal residues
Sludges/halogenatedresidues/solvents
Solvents
Sludges/heavy metals/solvents
Acids/solvents/metals
Pesticides and byproducts/contaminated filters
Slags and sludges containingheavy metals
Nature of Hazards
Corrosion/pollution by toxics
Fire/pollution by toxics
Pollution by toxics
Pollution by toxics/fire
Fire/pollution by toxics
Pollution by toxics
Pollution by toxics
Potential Impacts
Soil and water contamination
Soil and water contamination.
Soil and water contamination
Soil and water contamination.
Soil and water contamination.
Soil, water and aircontaminationBioaccumulation andpersistence in environment
Soil and water contamination.
Potential Health Impacts
Chronic and acute illnessesthrough intake of pollutantsthrough water supply and foodchain
Chronic and acute illnessesthrough inhalation and intakeof pollutants through watersupply and food chain
Chronic and acute illnessesthrough intake of pollutantsthrough water supply and foodchain
Chronic and acute illnessesthrough inhalation and intakeof pollutants through watersupply and food chain
Chronic and acute illnessesthrough inhalation and intakeof pollutants through watersupply and food chain
Chronic and acute illnessesthrough inhalation and intakeof pollutants through watersupply and food chain
Chronic and acute illnessesthrough intake of pollutantsthrough water supply and foodchain

TABLE 7.1. HAZARDOUS WASTE: GENERATING OR HANDLING FACILITIES (cont.)
Activity
Uranium refining and fuel rodproduction
C. Agriculture
Cropping and animalhusbandry including feed lots,piggeries, chicken batteriesetc.
D. Medical and VeterinaryFacilities
Hospitals and medical clinics
Quarantine stations, abattoirsetc
E. Waste ManagementOperations
Sewage treatment
Municipal or industrial landfill
Typical Hazardous Waste
Radioactive/heavy metalcontaining sludges and waters
Pesticides and manure
Infectious waste, radioactivematerial
Infectious wastes
Bacterial sludges, sludges withheavy metals and organics
Domestic or industrial wastes
Nature of Hazards
Radiation/pollution by toxics
Pollution by toxics/infections
Pollution by toxics/micro-organisms/radiation
Pollution by micro-organisms
Pollution by toxics/micro-organisms
Fire/explosion/ pollution bytoxics
Potential Impacts
Soil, water and aircontamination
Soil, water and aircontamination
Soil, water and aircontamination
Soil, water and aircontamination
Soil, water and aircontamination
Soil, water and aircontamination
Potential Health Impacts
Chronic and acute illnessesthrough inhalation and intakeof pollutants through watersupply and food chain
Chronic and acute illnessesthrough intake of pollutantsthrough water supply and foodchain
Chronic and acute illnessesthrough inhalation and intakeof pollutants through watersupply and food chain
Chronic and acute illnessesthrough inhalation and intakeof pollutants through watersupply and food chain
Chronic and acute illnessesthrough inhalation and intakeof pollutants through watersupply and food chain
Chronic and acute illnessesthrough inhalation and intakeof pollutants through watersupply and food chain
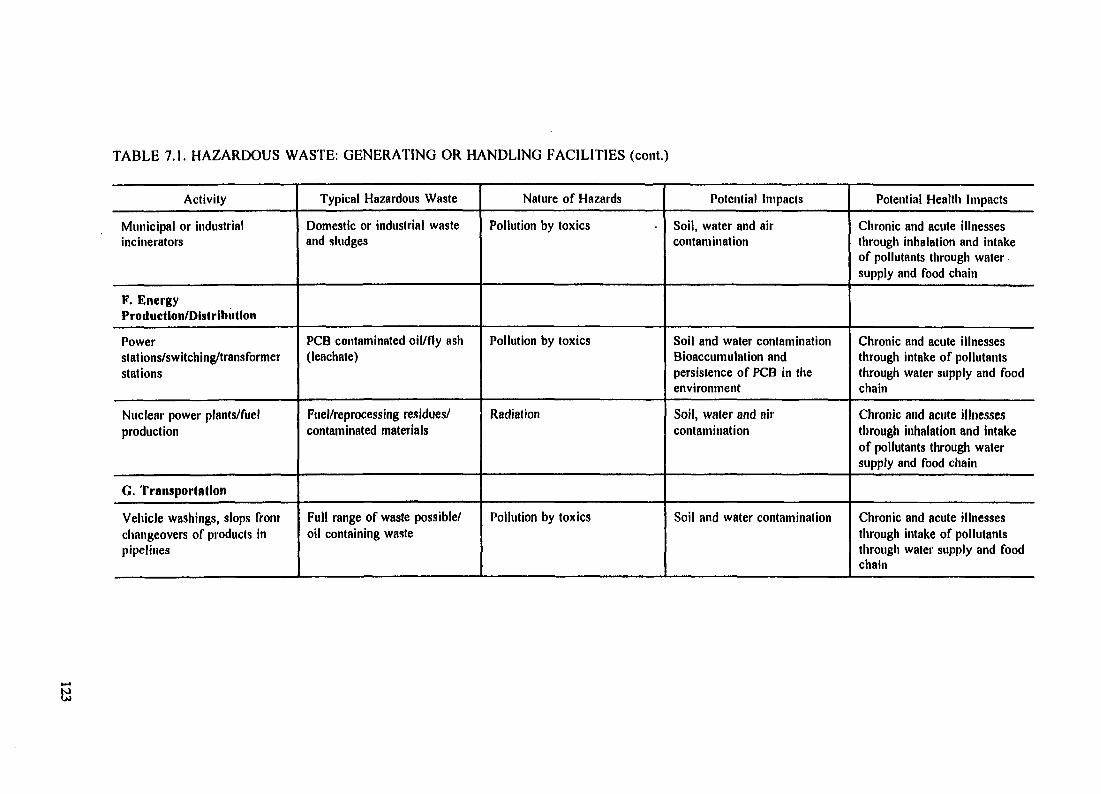
TABLE 7.1. HAZARDOUS WASTE: GENERATING OR HANDLING FACILITIES (cont.)
Activity
Municipal or industrialincinerators
F. EnergyProduction/Distribution
Powerstations/switching/transformerstations
Nuclear power plants/fuelproduction
G. Transportation
Vehicle washings, slops fromchangeovers of products inpipelines
Typical Hazardous Waste
Domestic or industrial wasteand sludges
PCB contaminated oil/fly ash(leachate)
Fuel/reprocessing residues/contaminated materials
Full range of waste possible/oil containing waste
Nature of Hazards
Pollution by toxics
Pollution by toxics
Radiation
Pollution by toxics
Potential Impacts
Soil, water and aircontamination
Soil and water contaminationBioaccumulation andpersistence of PCB in theenvironment
Soil, water and aircontamination
Soil and water contamination
Potential Health Impacts
Chronic and acute illnessesthrough inhalation and intakeof pollutants through watersupply and food chain
Chronic and acute illnessesthrough intake of pollutantsthrough water supply and foodchain
Chronic and acute illnessesthrough inhalation and intakeof pollutants through watersupply and food chain
Chronic and acute illnessesthrough intake of pollutantsthrough water supply and foodchain

TABLE 7.1. HAZARDOUS WASTE: GENERATING OR HANDLING FACILITIES (cont.)
Activity
H. Military
Munitions production
I. Research Facilities
Scientific laboratories etc
J. Construction Industry
Demolition and excavation
K. Accidents and spills
Deliberate and accidentalfires/explosions/spills etcduring production, storage andtransportation of hazardousmaterials
Typical Hazardous Waste
Surplus or expiredconventional, chemical andbiological weaponry
Wide range of hazardousmaterials usually in relativelysmall quantities
Building and soil material
Contaminated fire fightingwater/soil/"cocktails" ofhazardous materials
Nature of Hazards
Explosion/fire/pollution bytoxics/infections
Pollution bytoxics/infections/radiation
Pollution by toxics
Pollution by toxics
Potential Impacts
Contamination of soil, waterand air
Soil, water and aircontamination
Soil, water and aircontamination
Soil and water contamination
Potential Health Impacts
Chronic and acute illnessesthrough inhalation and intakeof pollutants through watersupply and food chain
Chronic and acute illnessesthrough inhalation and intakeof pollutants through watersupply and food chain
Chronic and acute illnessesare through intake ofpollutants through watersupply and food chain
Chronic and acute illnessesthrough intake of pollutantsthrough water supply and foodchain

Mining/Agriculture
Refining /PrimaryProcessing
- -
Manufacturingof IndustrialProducts
A Consumer ProductManufacturing/ProductConsumption
r
IWasteFacilities
FIG. 7.1. Industries at which waste may arise

From the ;previous Histage ;
Environment 4
Refining/primary processing
Materialinputs
r
Materials ^produced
r
Process/refiningplant
r
Wastetreatmentrecycling
r
Wastestorage
r
To wastemanagement facilities
„ To thenext stage
FIG. 7.2. Alternatives in waste management
126

Categorization is more difficult than for other hazardous materials as the materials are oftenmixtures of materials which may also have different hazards attached to them. There can also beunexpected reactions between different waste materials and there may also be synergistic effects onman and the environment due to the combination of several otherwise 'harmless' wastes.
To be useful waste categorization systems need to be able to aid in the monitoring of hazardouswaste generation and transport. They need to be compatible with other hazardous materialcategorization and regulatory systems and with the broader regulatory and administrative context.Categorizations also need to cover composition, physical state, packaging/containment and type ofhazards. One particular reason for a robust waste categorization system is the tracking of wastes fromproduction through transport and storage to final treatment and disposal. In the absence of acategorization system or a loosely administered one the discrepancies in waste description are likelyto lead to error and abuses. For the purpose of these area studies, the limits placed by the exclusionof wastes from existing categorization systems should be disregarded.
The range of waste management strategies and options, economic considerations and regulatoryapproaches and aspects of the technologies which can be applied within these options form an integralpart of the integrated risk management strategy. Problems are associated win the siting of facilitiesof waste treatment with respect to community perception to waste treatment and transport.
7.3. HAZARDOUS WASTES
73.1 . Why are wastes different?
Why should wastes be dealt with separately in mis guide? What is it that sets wastes apart fromother hazardous materials? Why should waste handling, treatment or disposal facilities be regardedas different from other potentially hazardous facilities? An understanding of these issues isfundamental to the successful integration of wastes into area risk assessment and the adoption ofappropriate management practices.
The perception of wastes, as much as their physical and chemical characteristics, necessitatesthe separate treatment of the subject The characteristic that typifies wastes is mat they have a negativevalue - they are unwanted and a cost is involved in their disposal. This characteristic can lead towastes being handled differently to hazardous materials which are regarded as valuable. As ageneralization wastes are more likely to be handled without due care and more likely to beinadequately dealt with in the design and assessment of industrial facilities than raw materials orproducts.
Note: It is the negative value of a material that causes it to be classed as waste and not thecharacteristics of the material. What may be considered a waste in some circumstances can be usefulmaterial in others. The situation can change as local, domestic and international demand and supplychange and is also dependent on knowledge about demand
Further, wastes are often mixtures of materials, impure or contaminated materials and thisincreases the likelihood of accidental inappropriate handling, treatment or disposal. This alsocomplicates the assessment of impacts of releases.
The historical record of problems arising from past disposal practices and the negativeconnotation of 'waste' has resulted in a perception of risk in the public mind from waste storage,treatment and disposal facilities that is often disproportionately high.
While the characteristics outlined above do require some special treatment in assessment andmanagement, the basic methodologies of hazard identification, consequence and frequency analysisand risk assessment are applicable to the potentially hazardous waste materials and waste handlingoperations. As with other specific aspects of potentially hazardous industrial activities, the nature of
127

management measures and strategies and die recommendations for remedial action which may resultfrom the analysis are, however, particular to the waste management aspects.
132. What are hazardous wastes?
In their original state or through decomposition, reaction or other change, wastes can present awide range of hazards to people, property and the biophysical environment through fire, explosion,pollution by toxics and microorganisms leading to chronic or acute health effects, corrosivity,eutrophication, radiation and contribution to climate change.
Wastes of many types can be hazardous if they are not appropriately managed. They include e.g.dangerous liquids, with pH below 3 or greater than 10, which would behave like acids or basic fluids.Domestic garbage, for example, can play a role in spreading disease if it is not treated or disposed ofby soil filling. In landfills it can present an explosion hazard if methane produced is confined in andunder buildings. Methane also contributes to global warming. It can also contribute to pollution ofwaterways and ground water through leaching of nutrients, heavy metals, organics etc. If burnt orincinerated dioxins, furans, heavy metals and other emissions to the air can be a problem. A furtherexample is mine wastes which may be hazardous because of heavy metal contaminated leachate, dustor runoff, radioactivity, asbestos contamination, or physical bulk and stability.
Principal types of hazardous waste include: radioactive materials, pesticide residues andbyproducts, sludges contaminated with heavy metals, halogenated and halogen free organic solvents,PCB contaminated materials, asbestos contaminated materials, hospital and quarantine wastes, picklingliquors, phenol containing sludges, arsenic contaminated sludges, cyanide containing sludges, liquorsand spoil heaps, radioactive materials, slags containing metal salts, mineral oils and tars.
Waste streams will vary greatly from case to case. Different raw materials, different technologiesand different waste management practices will all greatly affect the type, form and hazardousness ofthe waste stream. The general activity descriptors of the first column of Table 7.1 encompass a numberof different specific operations and activities. Within each specific activity the waste profile will differwith the attempt of waste avoidance, the technology applied and the waste management approach.Further, many waste streams, as shown in Table 7.1 will involve a variety of hazardous components.As the environmental and health impacts will be specific to the materials and processes they cannotbe covered in detail in a generalized table such as mis. The manner of release also critically affectsimpacts (for example the slow leakage from sludge settling ponds with long term low levelcontamination of a water body as against the sudden failure of containment and sudden grosscontamination). Similarly high short term levels of exposure to a toxic material may, for example,produce acute affects while low level exposures may produce chronic effects. It is essential thereforethat the complexities and the diverse range of possible impacts are dealt with by the use of a carefulcase specific approach.
Whilst mis chapter is focused on materials with potential for local or regional impact, theinclusion in the assessment of materials with wider impacts, such as greenhouse gases and ozonedepleting substances (bom as wastes and as emissions of waste disposal facilities) should not beoverlooked.
7.4. IDENTIFICATION AND ASSESSMENT OF WASTE GENERATION SYSTEMS
As stated, both the hazardous waste generation of industrial and other activities and wastemanagement operations which handle hazardous waste (and may themselves be a source of hazardousemissions) should be covered in the analysis. Coverage of both the waste generators and managementoperations also helps ensure mat die fate of all hazardous waste is known. An appreciation ofhazardous waste type and volume being received by management operations may also be a usefulcheck to ensure that all potentially hazardous industry operations have been identified in the study. The
128

transfers of wastes from sources to waste facilities by all modes of transport also needs to be includedin the analysis to ascertain that hazards and risks are fully addressed.
7.4.1. Identification
Potentially Hazardous Industrial Facilities: The general hazard identification carried out for thearea as described in Chapter 3 will have identified a number of facilities for closer analysis. A routineelement of the initial hazard identification should be to consider emissions (to air, water and soil) andsolid, liquid or gaseous waste generated (including materials collected in air filtration and scrubbing,and sludges from water treatment) which is stored or disposed of by means other than release to theenvironment. The hazard potential to the biophysical environment is likely to be particularly importantin this regard. Through consideration of hazards resulting from wastes, facilities can be expected tobe included on the list which would not pose any significant off-site risk from any other cause thanunsound waste disposal practices. As can be seen from the list in Table 7.1 a number of metalprocessing works, for example, generate hazardous wastes but many of these operations would nototherwise pose significant fire, explosion or toxic release hazards.
The analysis of selected sites should involve following through of processes and activities frominputs to outputs. Particular attention should be paid in this analysis to waste outputs. Opportunitiesfor waste streams to be wrongly directed or handled should be carefully identified.
The 'mass balance' methodology should be regarded as a means of identifying problems forinclusion in the analysis rather than a basis for eliminating matters from the analysis. One reason isthat large scale problems are usually more likely to be identified while relatively small but potentiallysignificant waste streams, particularly very toxic substances, may be missed.
The possibility of stored wastes, including storage of unwanted materials which may notnormally be regarded as wastes (such as materials acquired for operations now discontinued orproducts no longer saleable e.g. banned pesticides), should also be considered.
Any history of on-she or nearby landfill operations should be thoroughly investigated.
Other Facilities: Facilities which may generate hazardous wastes but may be outside the'industrial' facility category are also to be taken into account As indicated in Table 7.1 facilities suchas hospitals and other large medical treatment operations, quarantine facilities, research laboratories,energy production and distribution facilities, mines and agricultural activities should also be includedto help build up a comprehensive picture of hazardous waste sources and management practices.
Waste Storage, Treatment and Disposal Facilities: Currently operating and former storage,treatment and disposal sites and facilities should be carefully identified. The identification processshould consider national, regional and local government waste management operations of all types aswell as operations conducted by privately owned entities or by industrial organizations (both privateand public). Landfill operations should receive particular attention due to their potential to createproblems which may only appear many years later.
Particular attention should however be given to storage, landfill/marine dumping and incinerationoperations as these are the most likely to be hazardous. The contamination of soil and groundwaterby waste disposal practices, such as absorption of metal processing wastes in on-site pits, should befactored into the overall analysis.
Transportation: The analysis of hazards from wastes would not be complete if only sources andmanagement facilities are considered. Careful identification of the volumes, mode of transport (truck,rail, pipeline or ship), type of containment/packaging, transport of wastes compatible with each other,routes used, control systems in place and safeguards including regulatory systems, is an essential step
129

in ensuring appropriate management. Vessel/vehicle and pipeline washings etc. should be consideredas a waste source.
Wastes from Incidents/Accidents: In addition to wastes generated from normal production andfrom waste management operations, a further source of waste is contaminated material from productionfailures (e.g. out of specification pesticides) and incidents and accidents involving unintended releases.This waste stream can be particularly problematic as it may be outside the parameters of the wastesnormally managed, may be in large volume and may require prompt action, at least on a holding basis.
The hazard analysis for the area should specifically consider the adequacy of the provisions forincident waste management in area and industry emergency plans for all identified significant potentialincidents.
Categorization and Registration Systems: The identification of waste streams and their fates ismuch easier where there is a regulatory framework which records them and their movements. Theadequacy of any such system should be reviewed in the risk assessment study. The informationgathered from these sources should not be relied on in isolation as, even at their best, such systemsare likely to be reliable only for those wastes which are being handled responsibly.
If recommendations are made as a result of the study care should be exercised to ensure thatthey are implementable in the relevant cultural and social context.
Incident Records: As with other hazardous materials and facilities, the incident history in thearea and more 'widely should be examined. In the case of wastes in particular, this examination shouldextend to cover soil, fresh water (rivers, lakes), drinking water, seawater and groundwatercontamination. Transport incidents should receive particular attention. Records of any known illegaldumping and prosecutions or other regulatory intervention can also be usefully examined. The absenceof any record of incidents should not be taken to mean that none have occurred.
It may be appropriate to address incident and near-incident reporting in the recommendationsif current systems are inadequate.
7.4.2. Assessment of waste practices and controls
This section deals with the elements of assessment of practices and controls in the area studyprocess without pre-empting discussion of die appropriateness of such practices.
Assessment of waste operations needs to be holistic, following wastes from source to ultimatefate. As well as the technical controls, the organizational and institutional measures to prevent, controland contain/clean-up accidental releases and deliberate acts of unsound disposal need to becomprehensively assessed.
As for other hazardous materials, consequence and frequency analysis and risk assessment shouldbe carried out in respect of hazardous wastes for identified industrial, waste management and otherfacilities. Incident scenarios and exposure pathways and the impacts on people, property and thebiophysical environment should be carefully assessed in accordance with methodologies outlined inChapters 4 and 5 of this document This analysis may be complicated by the fact that the compositionof wastes may be variable and uncertain or unknown. The analysis must also take account of delayedrelease, particularly for stored or landfilled wastes. This aspect complicates frequency analysis as theperiod of delay may in some cases be many years and standards of management and the controlsexercised may well deteriorate with time, particularly with wastes which are no longer generated fromcurrent operations.
130

Analytical approaches must be suitably conservative to cope with the high degree of uncertaintyoften associated with waste composition and other factors.
Records of waste generated and transferred for storage or disposal should be checked and anysignificant discrepancies noted and investigated. As stated previously, record systems are likely to benot entirely accurate and should not be relied upon alone. Such recording and regulatory systems arean important element of the safeguards and their adequacy should be assessed.
Waste storage, treatment and disposal facilities should be subjected to the same type of analysis.There is no reason why the 'long-term' storage of toxic wastes (long-term indicating no currentintention to carry further treatment) should be treated any less thoroughly than the long-term storageof radioactive wastes. Particular attention should be paid, however, to waste input information andsystems for verifying waste composition. The adequacy of waste management should then be assessedin the context of social and economic factors as well as technological.
The assessment of hazardous waste safety should encompass natural hazards such as floods andearthquakes as initiators of releases. The likelihood of failure of engineered containment structures,such as dams and secure landfill in these events as well as structural failure without such additionalstress, should be carefully assessed.
7.5. CONCLUSIONS
This chapter has attempted to provide some broad, general guidance on identification andassessment of hazards and risks arising from wastes in the context of area risk assessment andmanagement. There is a substantial general and specialized literature on hazardous waste issues,management, technologies etc. It is not appropriate nor possible to cover this large, diverse andcomplex subject in any detailed or comprehensive way in a guidance document such as this. Insteadthe intention has been to advocate the inclusion of wastes into die area risk analysis. As is the thrustof these guidelines generally, the emphasis is on careful, case-specific analysis without prejudgment.The holistic, systematic approach proposed should provide a sound basis for hazardous wastemanagement strategies to minimize risk to people, property and the biophysical environment A guidefor such a holistic and systematic approach is provided in the WHO Environmental Technology Series,Ref. [12], which treat, among others, the solid waste management problem.
131

8. RISK MANAGEMENT
8.1. INTRODUCTION
In Chapter 2 reference was made to the formation of an Implementation Committee. The firsttask of the Implementation Committee should be to formulate the project proposal into a detailedproject plan and establish working groups to carry out the various analyses. The ImplementationCommittee should accept reports from the working groups and prepare its own covering report whichshould include consolidated conclusions and recommendations. This consolidated report should be thenpresented to the Steering Committee for their endorsement of the recommendations and associatedaction plans for implementation.
The objective of this chapter is to provide guidance in the preparation and presentation of thefinal report, to assist with setting decision criteria and to help in the preparation of remedial actionplans.
8.1.1. General introduction on risk management
Risk management constitutes a system of decisions directed towards what needs to be done inorder to reduce unacceptable risks. The problem of choice is in most cases based on economic analysisand every economic analysis is reduced to the question of the optimal utilization of financial resources.Thus, risk management itself is reduced to the problem of selecting risk reduction/elimination measuresto bring about maximum risk reduction with the available means.
8.1.2. Presentation of project results
It is recommended that the documentation of the project results be divided into three major parts:
• summary report;• main report;• appendices.
The summary report should provide an overview of the Regional Risk Management Project,motivations, assumptions, objectives, scope, results, conclusions and recommendations at a level whichis useful to the Steering Committee and participating organizations. The summary report should:
- provide a high-level view of the project;- communicate key aspects of the study to a wide audience;- provide a clear framework and guide for the reader or user prior to consulting the main report.
The summary report should also list the contents of the main report and the appendices.
The main report should give a clear and traceable presentation of the complete project. It shouldinclude the scope of the project, objectives, implementation, methods used, results, conclusions andrecommendations. It is important that areas of uncertainty are identified and highlighted. Theappendices should contain detailed data, detailed models and other information which most users willeither not need at all or will not need to consult regularly.
The Implementation Committee of the project is usually in a position to make a presentation ofthe results achieved within the area risk study to the professional public, decision makers as well asto the general public. Presentation of achieved results should be very carefully designed by theImplementation Committee of the project, especially when the representatives of the general publicparticipate in the audience. It is obvious that public relations in this particular case represent extremelysensitive questions because of the different ways risks can be perceived. It should be noted that, for
132

example, the perception of the industrial risks is considerably different from the risk perception in thecase of natural disasters.
In general, it is possible to present each type of risk in different ways, but also there is no clearrule which one is more useful. There are several ways to make risk presentations, such as:
- Absolute risk presentation;Relative risk presentation;F-N graph;Risk profile;Risk isolines;Risk matrix.
Some of these are also illustrated in Figs 8.1, 8.2, 8.3.
high
F R C Q U C N C T tntotufn
low
KJW mOOIlim Mgn
FIG. B. 1. Example of risk matrix CONSEQUENCES
Unas Individual Risk of DeatWyoar
FIG. 8.2. Example of risk isolines
133

F '
FREQUENCY(Nor morefata«les>yoar)
unacceptable
negligible
NUMBER OF FATAUTIES N
FIG. 8.3. Example of FN graph
8.2. AREA RISK MANAGEMENT
8.2.1. Introduction
As indicated in Chapter 2, the objective of an integrated risk assessment is to identify andanalyse all risks of industrial activities to humans and the environment in the project area and to assessthe risks in such a way that rational choices can be made about what risks should be reduced inexisting situations, weighing the social and economic costs of such risks and the costs of riskreduction. Also, for newly planned industrial developments rational decisions should be made withrespect to which risks can be tolerated and what the consequences are for land use and permitteddevelopment of the industry in the area. In this section guidance will be given on management of therisks in an area. If necessary a distinction will be made between existing industrialized areas and newindustrial developments in an area.
The following steps are distinguished in the area risk management:
- definition of decision criteria for the identified risks in the risk analysis;- decision analysis on the defined alternative options;- presentation of the results of the decision analysis for the decision makers and the public.
The above mentioned steps are iterative. One will start defining the decision criteria for theacceptable or tolerable risks. Next it will be assessed if in the present situation (or for the proposeddevelopment) the criteria are met. If not, different packages of risk reducing measures will be definedand assessments made on which packages meet the criteria, including the costs of these packages. Theresult will be that some packages meet the criteria at acceptable costs, other packages at high costs andsome do not meet the criteria. It is possible that not one package meets the defined criteria atacceptable costs. Then it will be necessary to set less rigid criteria and the decision analysis can berepeated as indicated in Figure S.4.
8.2.2. Decision criteria
As with most decision processes, risk management works better if clear criteria are establishedto guide the decision-making process. Decision criteria can be expressed as 'tolerable' individual orsocietal risks or as emissions or concentrations where these have been based on health riskconsiderations. Appendix V provides background and advice on how to establish decision criteria.
134

DEFINITION OF CURRENT ORPLANNED SITUATION
RISK ASSESSMENT DEFINITION OF DECISIONMAKING CRITERIA
COMPARISON OF RISK ASSESSMENT
RESULTS WITH CRITERIA
-•4 IDENTIFY RISK REDUCTION OPTIONS
ESTIMATE COSTS AND RISK-REDUCINGPOTENTIAL FOR EACH OPTION
EVALUATE OPTIONS
SELECT PREFERRED OPTION
FIG. 8.4. Risk management process
8.23. Decision analysis
The risks in an existing area or for a proposed new development of an area can or cannot meet thedefined criteria. If not, alternative options will be defined. These alternative options can be:
- For existing industrialized areas different packages of risk reducing measures at the source,restrictions in land use (e.g. not allowing the construction of new houses and other buildings inthe area) or mitigating measures (e.g. a well prepared emergency response system).
- For newly planned industrialization in an area, land use planning will be an important tool toreduce the risks for the population. Alternative options can include different packages ofrequired safety measures for the industries, different types of industrialization (production andapplication of hazardous materials or not) with different associated risks and different degreesof allowed housing in the neighbourhood.
135

The present situation or proposed development and alternative options will have economicconsequences for the industries, authorities and the public. Because of the limited available resources,the associated costs of the options for the authorities and companies should also be assessed. If otheraspects than costs are important for the realization of an option they should be included in the decisionanalysis. Such aspects are for example:
time schedule required to realize the option;availability of the technology to realize the option;
- availability of other areas for housing.
For such a decision analysis several methodologies do exist, such as cost benefit analysis andmulti criteria analysis, amongst others. The following steps can be distinguished in these method-ologies:
- assess a score for how the risks of the present situation or proposed development and alternativeoptions fit into the framework of the defined risk criteria;assess a score for the other aspects like costs, time and other constraints;
- present the scores in a comprehensive way, e.g. in a scoring matrix;- assess a total score for each option.
An example of such a scoring matrix is presented below (Table 8.1).
TABLE 8.1. SCORING MATRIX
Measure
SO2 (actual concentration divided bythe SO2 criterion)
Carcinogenic risk(actual risk divided by the criterion)
Area, km2, where the individual riskis above 10"*
Costs in $ 10'
Time for realization in years
Availability of other housing areas
Presentsituation
2.4
0.5
10
10
yes
Option 1
1.5
0.5
15
50
2
no
Option 2
1.0
0.5
5
80
5
yes
Option 3
0.8
0.4
7
100
10
no
The dimensions of the individual scores to the criteria are not the same. Therefore an assessmentof total score based on the scoring matrix is impossible. A total score is only possible if the scores aremade dimensionless. This can be done as in the following example: Divide area for 10"6 individual riskby minimum area, divide costs by present costs. If additional housing is required in the example, thepresent situation could only be compared with option 2.
It is not necessary to assess a total score to select the preferred option. Other site specificdecision schemes can be developed, for example by defining different classes that indicate at whatlevel a criterion is met on a site in the area. An example of such classes applied in area risk assess-ments is given below (Table 8.2).
136

TABLE 8.2. CLASSES IN AREA RISK ASSESSMENTS
Category
Industrial noise indB(A)
Individual risk
Stench in odourunits/m3
Carcinogenic chemicals
Toxic compounds per-centage of NOAEL
Class
E
>65
> 10 s
> 10
> 10 s
>100
D
65-60
lO'MO^
1 0 - 3
10-MO*
100-10
C
60-55
10-M0-7
3 - 1
10-M0-7
10-3
B
55-50
10-MO"*
< 1
IO-'-IO-*
3-1
A
<50
< IO-8
< 1
< IO-8
< 1
Mote: This table shows one possible approach to the multidimensional integrated risk problem. Other successfulapproaches exist too.
The classes have to be combined to integral environmental risk classes. An example of such acombination for existing situations is presented below:
TABLE 8.3. ENVIRONMENTAL RISK CLASSES
Integral class
I
II
III
IV
V
V]
Combination of Classes
Only B, classes CJDJE not allowed
2 x C, no classes D or E
At maximum 3 x C, no D or E
At maximum 1 x D, and at minimum 1 x C orat maximum 4 x C and no D and no E
At maximum 2 x D, and no E or1 x D and 4 x C and no E
3 x D or more, or 1 x E or more
8.2.4. Decision making
The final step is taking the decision for the most preferred option. When the matrix is presentedto the decision maker, he can indicate which criteria are important in the final decision. Such criteriacould get a greater weight factor or even could exclude certain options. In the example whereadditional housing was required, this criterion excludes options 1 and 3. All the environmental risksare reduced in option 2, the price for this reduction is high and it will take 5 years. If this is acceptableoption 2 has preference; if not, other options should be defined and the risk assessment repeated.
137

For the site specific approach, restrictions with respect to housing could be defined for theintegral environmental classes as in the next table:
TABLE 8.4. SITE SPECIFIC RESTRICTIONS
Class I
Class II
Class III
Class IV
Class V
Class VI
No restrictions
Housing allowed if alternative locations are not available
As in class II but more restrictive
Only replacement of old houses, no increase of number ofinhabitants
As class IV, more restrictive
Removal of existing houses
8.3. AREA ACTION PLANS
83.1. Introduction
It is the responsibility of the Steering Committee, working with the Implementation Committee,to prepare and approve action plans consistent with the recommendations that have been accepted. Theselected preferred options for the future will require risk reduction measures to bring outlier risks toan acceptable level. The possible risk reduction measures available are many and therefore it isessential that structured action plans are prepared which provide clarification for all concerned about:
the actions required;the responsibility for carrying out the actions;the costs involved;the time-scale to be met.
Risk reduction measures to be considered can fall into a number of categories:
• Preventive measures
- To prevent risks at the source by using alternative technologies/processes;- Land use planning to avoid people being exposed to high risk levels;
Transport routing to avoid transport of hazardous materials in populated areas.
Risk reduction measures
- Source-oriented measures like additional instrumentation in a plant to reduce probability andpossible consequences of an accident Also very important is to improve the safety managementin the plant;
- With respect to the environment the risks can be reduced by a proper land use planning.
• Emergency preparedness
- A well-trained emergency service can significantly reduce the number of fatalities from anaccident.
These different categories of measures are discussed in more detail in the following.
138

83.2. Preventive measures
8.3.2.1. Generalities
Hazards and risks from activities involving pollutant emissions and hazardous materials cannotbe entirely eliminated. There will always be a residual risk which in many cases will extend beyondsite boundaries. The consequences of such events depend mainly on the distance between the sourceof emissions and the sensitive objects (population, environmental sites, groundwater. etc.).
The location of hazardous and polluting activities is therefore an important preventive measure.Safety must become one aspect of land use planning and of all planning related to hazardous activities.
Of course safety is not the only criterion for decisions concerning the location of hazardousactivities. There are broader social and economic considerations that should also be considered andtaken into account in the locational aspects of hazardous installations and surrounding areas.
The following paragraphs describe how the safely-related aspects can be taken into considerationin the frame of the overall planning process.
8.3.2.2. Principles of land use planning
Increase in environmental and safety awareness, spurred by an increasing number of reportedindustrial accidents with major off-site consequences to people, property and the environment havecontributed to a fundamental recognition of the practical technological and economic constraints andlimitations of engineering and technical environmental pollution and safety controls when applied inisolation.
Decisions concerning the location and continuous operations of hazardous and pollutingindustries are therefore to a large extent land use planning decisions. Properly implemented, land usesafety and environmental planning becomes an essential and integral component of the hazards andrisks management. In this process, land use safety conflicts are prevented by identifying, analyzing andquantifying hazards and risks and managing such risks through both, technical controls at the sourceas well as ensuring compatible land uses.
The basic land use safety planning principle relates to the provision of physical buffer zones orseparation between hazardous and polluting industries and sensitive land uses and other naturalenvironmental areas. In this way, physical separation complements technical controls at source tomanage the risk. However, the determination of such separation distances is not (and should not be)limited to technical issues in isolation. There are broader social and economic considerations thatshould also be taken into account in the locational aspects of hazardous installations and surroundingland uses. Firstly, the physical dimensions of buffer zones greatly vary depending on severalparameters, mostly the nature of the facility and its environmental and safety controls. A uniformstandard separation distance rule may not be possible in this regard, but each case should be lookedat on its own merit Secondly, in the decision-making process for the derivation of such buffer zones,various economic and social trade-offs, cost and benefit considerations need to be evaluated. Anoverall strategic approach ought to be adopted between industrialization, urbanization, cost of pollutionand safety controls, land sterilization, etc.
The conclusion is made therefore that the location of hazardous and polluting industries, ofsurrounding land uses and of associated compatibility issues should be made within the broader contextof environmental, safety, economic, social and overall planning issues. It is essential to agree on aplanning strategy for the area. The strategy must recognize the technological and economic constraintsof accommodating industry and urban developments 'across the road' from each other. Environmentalplanning policies and strategies should be developed on a case by case basis to guide industrial as wellas all other forms of developments.
139

8.3.2.3. Safety distances
Establishing safety distances is often difficult. Especially in densely populated areas there areusually hard conflicts between the interests in using all the territory and the need to provide safetydistances. Establishing safety distances therefore always requires a cost effectiveness analysis in orderto decide whether source-oriented safety measures to reduce risks are preferable. This costeffectiveness analysis must include not only the market price of the territory involved but the wholesocial and economic context. Land use planning has always to take the specific conditions of the givencase into consideration.
Having said this some general guidelines and criteria can be given for providing safety zones.
Whether safety distances are justified or needed depends on:
- the character of the potentiality affected sites;- the distance in which hazards can happen as a consequence of an accident;- the probability of a damage at a certain distance.
(a) Categorization of Development and Notification Requirements
In deciding on the separation required from a site it can be helpful to categorize the proposeddevelopment. This will enable individual development decisions to be made within the framework ofa consistent approach. Categories of development can take account of a number of relevant factors indeciding on whether to permit development, e.g. amount of time individuals spend in the development,ease of implementing an emergency plan, vulnerability of occupants of the development (old peopleare more vulnerable to thermal radiation). One broad categorization which has been widely used isbased on three general categories:
Category A: Residential, including houses, hotels, flats;
Category B: Industrial, including factories (unless they have high-density employment),warehouses;
Category C: Special, including schools, hospitals, old people's homes.
Other types of developments can then be added to the most appropriate of these categories, e.g.theaters/cinemas and shopping centres could be included in category A. In Table 8.5 and as a firstapproximation, the separation distances given should be considered as follows:
(a) within the separation distance - no category C development;
(b) within about two-thirds of the distance - no category A development;
(c) no restriction of category B development
The principles outlined above have also been used as the basis o f notification' practices, notablyin the United Kingdom. The responsibility for granting planning permission for all types ofdevelopments in the United Kingdom rests with the local planning authority. Under applicableregulations in mat country, the Health and Safety Executive (HSE) is notified of all installations whichmeet a criteria of storage (substance and quantity). It then informs the relevant local planning authorityand provides a site specific consultation zone (CD). The majority of sites have CDs of 1 km or less
140

in size. Within each CD the local planning authority is requested to refer to the Health and SafetyExecutive for advise on developments that include: any residential development regardless of size; allshops over 250 m2 gross space; all industrial development over 750 m2 gross space; all officedevelopment over 500 m2 gross space; any development likely to lead to a significant increase inpeople close to a hazard. The Health and Safety Executive assesses the hazards implications andadvises Local Planning on the appropriateness of the proposed development from a safety viewpoint.It must be noted that such advice is not binding on the local planning authority. The advice is usuallyin terms of two situations of risk:
(i) Negligible risk: where the assessment has shown it to be extremely unlikely that people outsideof the factory fence would be killed.
(ii) Substantial risk where the risks are sufficiently severe that health and safety considerationsshould be a major issue in any planning decisions. If mere are other factors strongly favouringthe development, the local Planning Authority is advised to ask the HSE for more detailedexplanation/assessment of the risk.
(b) Hazard Analysis
A hazard analysis must be made for each individual activity in order to determine the distancewhere hazards can happen. Table 8.5. gives suggested approximate separation distances for a rangeof major hazards. These distances should be regarded as tentative and would need to be consideredunder local circumstances.
(c) The Probability of Damage at a Certain Distance
Usually it is not justified to require safety separation distance if the probability of a fatality isless than 10'5. On the other hand, safety separation distances should be established if the probabilityis higher than 10"3.
These numbers are related to the acceptability criteria for individual risks, taking intoconsideration the effect of mitigation procedures in the case of an accident.
If the probability is between 10"3 and 10s it depends on the general economic and socialsituation whether safety distances should be established.
8.3.2.4. Land use planning for existing situations
Existing land use environmental and safety conflicts are those most prevailing (relative topotential conflicts from proposed new developments) and offering the most difficult challenges torectify. As land use patterns develop it becomes very difficult to relocate industry or people. The mosteffective strategy is to prevent land use safety conflicts from developing from the onset by formulatingand adopting strategies, guidelines and criteria for the location of industrial and other land uses whichensure environmental and safety compatibility.
In the case of existing situations the main basic immediate strategy is that of managing the riskswithin the existing constraints of land use patterns. A longer term strategy should also be formulatedwith the aim to rectify land use safety conflicts. The following procedural/strategic steps are relevant:
(i) An environmental study should be undertaken for the whole area in consideration includingstudies on air pollution, water pollution and solid wastes. The study should identify, on acumulative basis, the health and environmental effects and delineate areas and people most atrisk.
141

TABLE 8.5. SUGGESTED APPROXIMATE SEPARATION DISTANCES FOR SOME MAJORHAZARD WORKS
Substance
Liquefied petroleum gas, such as propane and butane, held at apressure greater than 1.4 bar absolute
Liquefied petroleum gas, such as propane and butane, heldunder refrigeration at a pressure of 1.4 bar absolute or less
Phosgene
Chlorine
Hydrogen fluoride solution
Sulphur Dioxide
Acrylonitrile
Hydrogen cyanide
Carbon disulphide
Ammonium nitrate and mixtures of ammonium nitrate wherethe nitrogen content derived from the ammonium nitrateexceeds 28% of the mixture by weight
Liquid oxygen
Sulphur dioxide
Bromine
Ammonia (anhydrous or as solution containing more than 50%by weight of ammonia)
Hydrogen
Ethyiene oxide
Propylene oxide (atmospheric pressure storage) (stored underpressure)
Methyl isocyanate
Classes of substances not specifically named
Largest tank size(t)
25-4041-8081-120More than 30025 or more, onlyin cylinders orsmall bulk tanksof up to 5 tecapacity
50 or more
2 or more
10-100More than 100
10 or more
15 or more
20 or more
20 or more
20 or more
500 or more
500 or more
20 or more
40 or more
More man 100
2 or more
5-25More than 25
5 or more5-25More man 25
1
Separationdistance (m)
3004005006001000100
1000
1000
10001500
1000
1000
250
1000
250
See note '
500
1000
600
1000
500
5001000
2505001000
1000
142

TABLE 8.5. (cont.)
Substance
1. Gas or any mixture of gases which is flammable in airand is held in the installation as a gas (except low-pressure gasholders)
2. A substance or any mixture of substances which isflammable in air and is normally held in the installationabove its boiling point (measured at 1 bar absolute) as aliquid or as a mixture of liquid and gas at a pressure ofmore than 1.4 bar absolute
3. A liquefied gas or any mixture of liquefied gases whichis flammable in air, has a boiling point of less than 0°C(measured at bar absolute) and is normally held in theinstallation under refrigeration or cooling at a pressure of1.4 bar absolute or less
4. A liquid or any mixture of liquids not included in items1-3 above which has a flashpoint of less than 21°C
Largest tank size
(t)
15 or more
25-4041-8081-120121-300More than 30025 or more onlyin cylinder orsmall bulk tanksor up to 5 tecapacity
50 or more
10000 or more
Separationdistance (m)
500
30040050060010001000
1000
250
1 For bagged ammonium nitrate stored in stacks of 300 t (maximum) a separation distance of 600 m isappropriate. For loose ammonium nitrate, the separation distance is given by:
600 (stack size (t)
300 r(ii) A hazard analysis and quantified risk assessment for hazardous installations and transportation
systems should be undertaken for each plant (as applicable) and cumulatively for the whole area.Resultant risk levels both in terms of individual and societal risk should be compared withagreed criteria or targets. People, property and various land uses most at risk should bedelineated.
(iii) Based on the above, it is possible to identify environmental systems, land uses (residential,commercial, recreation, etc.) and number of people and properties exposed to the highest riskfrom both normal emissions and accidents from the operations of industry in the area. Thestudies should also identify the major contributors to the total risk. Based on such informationan overall land use safety plan may be formulated for immediate-short term implementation.
(iv) The immediate-short term strategic elements should include the following three essentialcomponents:
Reduce risk at the source with emphasis on technical controls for the major risk contributorswherever economically and technically feasible. A comprehensive risk reduction programmeshould be formulated and implemented at each facility. As a minimum, no developments,industrial or otherwise, should be allowed which may increase the overall risk. This maynecessitate no further increase in any industrial activities of a hazardous or polluting nature inthe immediate - short term.
143

Control the number of people exposed to risk. No further increase in residential densities in theareas most affected by the total risk should be allowed. Increase in people related activitieswithin the most affected areas should be strictly controlled to ensure no increase in the numberof people exposed to high risk.
Mitigate the consequences of major hazards with a priority emergency plan for the area mostlyaffected by the risk. A comprehensive emergency plan and procedures should be formulated withspecific reference to the type of hazards in the area. People in the affected area should be madeaware of the hazards and emergency/evacuation procedures to follow in case of accidents.
(v) A long-term strategic plan for the area should be formulated on the basis of an integratedapproach that includes consideration of environmental, health, safety, social and economicfactors. The plan should be based on national needs and preferences for the area and shouldspecify a long term planning outlook in terms of either continuation and controlled expansionof industrial activities or urban developments and intensification.
The implementation of the long term strategic plan should be based on the following elements:
Industrial Oriented Strategy
- Any intensification of an existing industry or introduction of a new industry in the areashould be allowed only if it can be demonstrated at an early stage of development that nocumulative increase in existing risk levels will result from this new development. Adecrease in some activities may have to be implemented to achieve this objective. This willensure that the area affected does not increase.
- Whilst no intensification in residential development should be permitted every opportunityshould be taken to encourage re-development or re-location of residents in the area mostlyaffected by risk.
Urbanization Oriented Strategy
- This strategy is based on encouraging residential and people related land uses in preferenceto industry. In this case, no developments of a hazardous industrial nature should beallowed. A stringent programme for risk reduction should be implemented and industryshould be encouraged to relocate in circumstances where the necessary distances betweenthe installation and the population cannot be achieved.
- Intensification of residential developments in the area mostly affected by risk should not beundertaken until risk reduction measures have been implemented.
(vi) Criteria and guidelines for the location, assessment and decision making process for industrial,residential and other forms of land use in the area should be formulated as part of theimplementation process for the above strategies.
It is important to recognize that at many of the above stages the public should be encouragedto participate.
8.3.2.5. Land use planning for proposed development
The formulation and implementation of criteria, guidelines, zoning controls, assessment policiesand practices as an integral component of the decision making process for the location anddevelopment approval of new hazardous and polluting industries and proposals for development ofother land uses in the surrounding of such industries are the most effective measures to prevent landuse safety conflicts. The integration of planning as complementary to technical risk controls at the
144

source may be the most cost effective risk management strategy for all concerned. The approachesoutlined hereafter serve as examples of comprehensive controls over the locational aspects of newproposed developments of a hazardous nature (similar principles apply to industrial developments ofa polluting nature) and of land uses in their surroundings. In all cases, an overall regionalenvironmental plan for the whole area should be prepared. The plan should specify policies, guidelinesand criteria for various land uses.
(a) Environmental Impact Assessment Procedures
Development proposals of a hazardous or polluting nature, particularly those proposing to locatenear sensitive land uses or environment, are the subject of environmental impact assessment proceduresin many countries. These procedures require the preparation of Environmental Impact Statements (EIS)and associated studies as part of the decision making process to give or not give permission to theproposed development. Two approaches are mostly used in different countries: (i) a range ofdevelopments (including those of a hazardous and polluting nature) are specified by regulations andan EIS is necessary for these, irrespective of their proposed location; (ii) The decision is made on acase by case basis as to whether an EIS is required, taking into account various factors including thezoning of land, size and nature of the development
The EIS and its associated assessment process is a powerful tool that greatly assists in ensuringthat, at an early stage of development, resultant risks are compatible with the various land uses in thelocality. The process also ensures that technical safety and environmental controls at the sourcecomplement locational siting considerations.
At the EIS stage, the proponent is requested to demonstrate that the development at the proposedlocation will not result in significant increases to overall risk levels at existing land uses. This is doneby undertaking a preliminary hazard analysis and quantified risk assessment, identifying all relevanthazards and indicating cumulative risk levels to surrounding land uses. An assessment of resultantcumulative risk levels and their implications for, and impact on, land uses and the environment shouldbe undertaken with particular emphasis on the locational suitability of the proposed development,accounting for proposed safety measures.
(b) Zoning Controls
Different countries pursue the implementation of safety separation distances using the zoningregime or other arrangements appropriate to their legislation. Usually different zones are establishedfor industrial, commercial and residential purposes. New buildings are only allowed if they are inaccordance to the respective zone. In this way safety distances between industrial zones and e.g.residential zones can be established.
For establishing the zones it is desirable to undertake additional environmental impact studies.
Before designing new residential zones, the risk exposition of the zone should be considered andresidential buildings should not be allowed if the risk is too high unless it is reduced by appropriatesafety measures.
In the same way new industrial zones should not be established if the industries which aresupposed to be built could be too high a risk for existing or planned residential zones or other sensitiveobjects in the neighbourhood of this zone.
8.3.2.6. Transportation planning
In many cases risks from transportation of hazardous materials are more important than risksfrom fixed installations. Transportation planning is therefore an important measure for risk reduction.There are, however, some constraints to be taken into account:
145

- Theoretically it would be possible to establish safety distances between transportation routes andsensitive objects. However, the main purpose of transportation routes is to connect variouspopulated areas. It can therefore not be completely avoided that transportation routes are crossingthrough populated areas.
- Usually the main transportation routes already exist and can hardly be removed.- The international transport regulations indicate that transports of hazardous materials must be
allowed if they comply with the safety measures defined in these regulations. It is therefore notpossible to forbid such transportations or to demand more source-oriented safety measures.
There are, however, some safety measures which can be taken into consideration:
Although it is not possible to keep residential zones completely away from transportation routes,this can at least be achieved for terminals and other places where big quantities of hazardousmaterials are loaded or unloaded. This is often a very important contribution to safety, becausea great deal of transportation accidents happen in connection with loading activities.Many transportation accidents do not happen because the safety regulations would not be strictenough but because they are not respected by the drivers. Therefore a better control of thedrivers by the police is often a very effective mean to reduce the risk.Although it is not possible to fully forbid the transport of hazardous material, it can be forbiddenon some routes which go through densely populated areas.
• Transportation can also be restricted in time, e.g.:- No transportation through cities during rush hour,- No transportation by rail through railway stations when there are many people at the station.Pipelines should be considered in the same way as fixed installations. Appropriate measures canbe taken to limit the risk, e.g. by establishing safety distances between pipelines and populatedareas.A long term transportation planning should be established with the following elements:- estimation of the future amounts of hazardous materials transported through the area;- estimation of the possibilities to reduce the amount of transported goods;- overview over the existing transportation capacities (rail, road, pipelines, water), including
loading terminals;- overview over the specially endangered areas and the existing neuralgic points;- estimation of the future need for transport capacity;- evaluation of the best possible mean to improve the transport capacity based on a risk
estimation and a cost-effectiveness-analysis;According to such planning measures can be taken in order to:- reduce the amount of transported goods;- deviate the transportation from more dangerous to less dangerous transportation means;- build new transportation capacities with the means which are the least dangerous.
8 3 3 . Risk reducing measures
With proper risk management and additional risk reduction measures, the risks of industries ortransport of hazardous materials can be reduced.
8.3.3. J. Safety management
It is widely recognized within the process industry that safety management systems have a majorinfluence on failure rates. It has been frequently demonstrated that dramatic improvements in LostTime Injury rates are possible by large corporations which have adopted rigorous and auditable safetymanagement procedures. Given the very large impact of Safety Management Systems (SMS), thereis increasing belief by regulatory bodies in the need to quantify such systems and to consider thesein an analogous manner to hardware implications in QRA studies.
146

A problem with the generic failure rate data used in QRA studies is that it implies the sameaverage value for all sites, regardless of the quality of safety management systems employed. QRAstudies need at least to be supported therefore with a reasonable qualitative overview of safetymanagement systems, and preferably some quantitative estimate as well (recognizing that this will bea crude estimate only).
Key source documents in this area include Refs [57, 58, 59].
One of the earliest quantitative systems developed for Modification of Risk (MOR) is theMANAGER technique. This was originally developed by Bellamy with HSE and VROM support andits operational version is described in Ref. [60]. The system uses human performance shaping factorsas an underlying basis linked to real accidents.
Other quantitative systems for scoring management systems include STATAS (HSE),ACRONYM (TNO, DuPont, and other), and ISRS (DNV). STATAS has substantial human factorstheory underlying (socio-technical pyramid), while ISRS has the largest user base.
Topics to be covered in the safety management system audit vary between audit systems, butthe following list is indicative:
- Safety leadership and administration;- Safety policy and safety culture;- Incident and accident reporting;- Formal safety studies and documentation;- Written procedures;- Inspection and maintenance;- Management of change;- Emergency resources and procedures;- Human factors influences (control room design, ergonomics, manning levels, etc.);- Organizational factors (management structures, ability to deal with change, etc.);- Training.
Typically the results of an audit would be scored relative to a 'generic' typical facility for whichgeneric frequency data would apply directly. For the audited site a so-called Management Factor (MF)would be derived and applied to all frequency data for that site. This method is covered briefly inRef. [1].
8.3.3.2. Source-oriented risk-redwing measures
A number of technical measures can reduce the probability or effect of a major hazard. Someexamples are:
- reduction of the quality of the hazardous material in the process;- isolation valves to reduce the inventory of a system;- leak detection systems;- explosion protection;- fire protection.
A process review and review of the design of the process should be performed to identify thepossibilities of additional risk reduction measures. In Annex III risk reduction measures for fires aredescribed.
147

83.4. Emergency preparedness
In line with a defence-in-depth approach to risk management, it is appropriate for a communityto be prepared for industrial accidents (or natural hazards) even though risks have been lowered totolerable levels by other risk-reducing measures. Emergency preparedness is the name given to thisaspect of community protection. Emergency preparedness requires industries and local authorities towork together to develop and exercise response plans so as to minimize the impacts of an industrialor transportation-related accident should it occur. Annex II outlines in detail an approach to this subjectconcentrating on UNEFs Awareness and Preparedness for Emergencies at Local Level (APELL)approach.
148

9. REVIEW AND DEVELOPMENT OF LEGISLATION
9.1 LEGISLATION ABOUT MAJOR HAZARDS
This Chapter provides an overview of the legislative requirements in selected countries in thefield of major hazards control. The main aim is to highlight the relevant practices. The formulationof a specific regulatory framework is a matter for each national authority to consider, based on localcircumstances.
9.1.1. Policy
Legislation about safety at work and accident prevention exists in all countries. This legislationaims to protect primarily the workers in industry, but at the same time also to contribute to the safetyof the population and the environment. Usually this legislation does not regulate in terms of risk, butmay contain technical specifications which sometimes require risk assessments to satisfy the authoritiesthat the necessary margin of safety does exist.
In the last twenty years, however, this legislation has resulted in not being completelysatisfactory. Therefore, a new type of legislation is being developed which is based on the probabilisticnotion of risk and aims to reduce the risk of industrial activities. The main steps in order to achievethese goals are:
the owners of installations with hazardous materials are obliged to notify the authority about theamount of the substances and the safety measures;the competent authority can require a quantitative and/or qualitative risk analysis;if the risk is considered too high, the authority can order supplementary safety measures or closedown the facility,the owners of installations have to establish an internal emergency plan;the governmental bodies are responsible for preparing external emergency plans;the public must be informed about the risk;in case of an accident the authorities and the potential victims must be notified;
• in many countries principles for siting hazardous activities have been established;• a strict liability is often proposed or introduced as a means to internalize the external costs of
risk.
9.1.2. Review of legislation
The above mentioned principles have mainly been established by the European Union in aCouncil Directive on the major-accident hazards of certain industrial activities (see Annex I), whichwas partly based on the UK Health and Safety at Work etc. Act [61]. The purpose of the Directivewas to ensure the introduction of legislation in this area in all Member States in accordance with theobjectives given in the Directive and the establishment of related procedures by competent authoritiesto implement its provisions.
The Directive has been implemented by all Member States of the European Union by specificnational legislation.
9.13. United Kingdom
In 1972 the Robens Committee produced a report which was a precursor to significant legislationin the UK in that it crystallized the realization for the need for specific and unified control ofpotentially hazardous industrial installations.
149

In response to public pressure and concern following the Flixborough disaster in 1974 theauthorities adopted the Robens Committee recommendations. The legislation that enacted the mainpoints was the Health and Safety at Work etc. Act [61] (HASAWA), which set up a unified authority,the Health and Safety Commission. In general, the legislation:
• established a general duty of care on companies at Board level (a written safety policy isrequired),
• identified the employer as responsible for both employees and public, (the "etc" in the Act title),• in addition, imposed duties on employees.
9.1.3.1. Advisory Committee on Major Hazards (ACMH)
The committee produced three public reports which represent a comprehensive and authoritativeexposition of methods and policy issues on industrial major hazards.
In 1976, their report recommended the adoption of legislation requiring operators to notify theauthorities of potentially hazardous installations, based on specified inventories of chemicals (notifiableinstallations). This would lead to the selection of installations requiring more elaborate risk assessment,Ref. [62].
The Health and Safety Executive has the powers now, under HASAWA [61], to prohibitoperations (and operators) considered unsafe and they could require improvements in installationswhere they were not satisfied. The ACMH further recommended that a realistic program be establishedby the Health and Safety Executive to bring older existing plants up to new plant standards.
The second report in 1979, Ref. [63] examined the historical experience and the frequency andconsequences of major hazard incidents. This data was seen as generally supporting the levels at whichinventories of hazardous substances should be notifiable. The report also:
(a) developed categories of installations which led to the definition of priority sites which wouldneed hazard surveys as those with ten times the notification level of inventory;
(b) outlined a scheme of licensing regulations;
(c) canvassed means whereby planning controls may be applied to new sites and intensified activityat existing sites.
The report also called for more effort in understanding the causes of major incidents.
The Advisory Committee findings were made legislative requirements in the "Notification ofInstallations Handling Hazardous Substances, (NIHHS), Ref. [64]. The EU Directive was enacted inBritain as the "Control of Industrial Major Accident Hazards Regulations (CIMAH), see Ref. [65].
9.1.3.2. Experience with CIMAH regulations
The siting and control of hazardous industry in the UK is primarily the responsibility of localauthorities. The Major Hazards Assessment Unit (MHAU) of the Health and Safety Executive (HSE)can only advise local authorities on the siting of hazardous plants and land use but has no control overthe final decision.
Public information on hazardous plants is provided mainly at the local level. Industry liaisonwith the local safety inspector is encouraged. The implementation of CIMAH is thus seen as anongoing process, not just a single exercise of submitting a Safety Case.
150

Important issues with CIMAH are:
• it does not specify the depth of treatment for consequence analyses;• risk criteria have not been specified;• transport risks are not included.
9.1.3.3. Recent developments
The third and final report from the Advisory Committee on Major Hazards in 1984 set out apractical system based on Quantitative Risk Assessment (QRA) as the best control mechanism, butpointed out the problems which can arise if inflexible fixed criteria for acceptability are employed, Ref.[66].
In particular, the report:
(a) adopted the "reasonably practicable" approach as applicable to the control of major hazards.Instead of setting a particular risk criterion, it proposed that the risk from a hazardous installationto an individual employee or member of the public should not be significant when compared toother risks to which he is exposed in everyday life. Further, the risk from any hazardousinstallation should, where reasonably practicable, be reduced. It suggested that the likelihood ofa serious accident of one in ten thousand years was on the borderline of acceptability, bearingin mind the background risks faced everyday by the general public;
(b) recommended that information given to the public should include the nature of hazards whichmight affect them if control measures fail, emergency arrangements which have been made inadvance and what should be done in the event of a major accident;
(c) recommended that hazard surveys should be based on some form of quantitative assessment;
(d) endorsed the full use of technical and managerial techniques available to ensure plant reliability;
(e) recommended the location of plants away from centers of population and the development ofguidelines for separation distances;
(f) recommended a unified off-site emergency planning scheme with co-operation between industryand local government;
(g) recommended further education among senior management, further research into theconsequences of major incidents and canvassed the need for the storage of data from incidents.
In addition, new approaches to operational safety such as a scheme based on a hazard warningstructure was outlined. This is based on 'near miss' or warning incidents and it predicts the closenessof real disasters rather than waiting for them to occur.
The Health and Safety Executive is moving towards establishing risk probability consequencetargets like the Dutch. It has developed a simpler version of the Dutch SAFETl package which is inregular use. Although no specific criteria have been published, it indicates that an individual fatalityrisk of 1 in 10"6 is acceptable while 1 in 10'3 is intolerable. However, it appears that these criteria willbe used only to compare various industries rather than target criteria.
In the area of Transport Risks, an Advisory Committee has been established to examine therouting by rail, road and pipeline for hazardous substances.
151

9.1.4. Netherlands
The Working Environment Act has since 1977 contained the requirement for a Safety Report(Arbeidsveiligheidsrapport) for specific installations. The legislation applies to new and existinginstallations. The Labour Inspectorate has issued guidelines interpreting the law including the contentsof the Safety Report. It requires not merely a list of substances involved but also the conditions ofstorage and/or processing and associated details.
There is, in addition, the need to comply with the Nuisance and Air Pollution Laws to protectthe population at targe; under these laws, construction and operating licenses have to be obtained fromthe provincial authority. The effects of major accidents on the surrounding population and environmentare included (together with any normal emissions) under these provisions. The public is given theopportunity to inspect the license application and draft permit and lodge objections. Any confidentialmaterial, however, can be withheld from such publicly available dossiers at the manufacturer's request.
The Dutch designation system compares a mathematical combination of the threshold quantitiesunder reference conditions (T) the correction factors) which account(s) for the physical condition andthe process conditions (C) and the phasing factor (F) with the quantity of material present in theinstallation. This can lead to a designation. An installation is designated when the amount of dangerousmaterials present in the installation and multiplied by one or more correction factors is equal or largerthan the relevant threshold quantity multiplied by the prevalent phasing factor.
Additional legislation on external safety, specifically concerned with protection of the populationoutside the operating sites, as is legislation introducing Environmental Impact Reporting andAssessment, also applies. As part of the External Safety Policy the Dutch government has embarkedon an extensive research program to obtain insight into three main areas:
• the methodology for the quantification of risks, the possibilities and limitations;• the attitude of groups concerned with a potentially hazardous activity, their motives and
reactions;• the handling of these factors in a decision-making process.
The Dutch government has also designed a computerized quantification model along the linesof the Public Vulnerability Model developed by the US Coast Guard for risks associated with theimport of dangerous substances in sea harbors. This model has been adapted to the specialcircumstances of the chemical industry in the Netherlands. It is now operational and includes failuredata, dispersion models, meteorologic data, population data and consequence models for the effects oftoxic, flammable and explosive materials. The SAFETI package is used as a 'benchmark' to whichdisputing parties can be referred and as a vehicle for optimizing the siting of a plant, routing ofhazardous pipelines and improving the safety of the community.
This model is being used in conjunction with both individual and societal risk criteria, whichare quantitatively specified.
Where risk levels are considered unacceptable, risk reduction is achieved by in situ measures,such as plant layout, the use of additional safety devices or less hazardous technology. Zoning controlsare used to keep the public apart from a hazardous activity. This may include the removal ofvulnerable dwellings. The Dutch government will provide compensation funds for such rehabilitationschemes. Risks associated with the transport of hazardous materials may require improvement of themeans of transport or zoning or both. In every case, risk reduction measures are undertaken based ontheir cost effectiveness.
152

9.1.5. Belgium
Legislation on hazardous factories requires a license for the building and operation of plantsclassified on the basis of listed sectors.
The Regulation is aimed primarily at protecting the workers, but the application for a licenseunder this regulation must, apart from technical details of the installation, also include informationcovering measures to prevent or reduce the consequences of accidents affecting the surroundings ofthe installation.
The application and the authority's decision are displayed for public inspection and, in certaincases, communicated in writing to those in the immediate vicinity of the establishment.
In addition the provincial authorities may require a Safety Survey, whose extent they determinethemselves. Currently the EEC Directive is being incorporated into the Labour Law.
9.1.6. Republic of Ireland
The Public Health Act of 1978, the Alkali Act of 1906 and the Local Authorities Acts 1963 and1976 provide for licensing dangerous establishments (determined according to emissions). They alsoempower planning authorities to require an environmental impact report in addition to plans andgeneral technical data on the facility. The planning procedure is public. To this extent, there is somecontrol of hazardous installations; any measures that are deemed necessary can always be imposed byplanning authorities on a case by case basis.
9.1.7. Italy
The beginning of implementing the EEC Directive on Major Accidents within Law 833 is thePresidential Decree of 1982 on fire prevention. This requires the company concerned to carry out asafety survey before a new plant or a new process is put into operation. Other decrees coveringprotection of health, of the environment, etc. are expected in due course.
9.1.8. Luxembourg
The legislative mechanism is based on a 1979 law and on regulations listing and classifying allindustrial establishments which could present hazards or nuisance affecting the safety, health andcomfort of the workers or the general public or endanger the environment.
Such establishments have to be licensed by the Inspectorate of Labour and Mines. Theapplication for a license must include information about the type and location of the establishment,plants and processes to be operated, the approximate quantities of products to be manufactured orstored, the measures planned to prevent or mitigate the danger of nuisance which the establishmentmight cause and the approximate number of workers employed. These provisions thus cover much ofwhat is required by the EU Council Directive on Major Accident Hazards.
9.1.9. Germany
The Law "Storfall-Verordnung" (Decree on the control of disturbances) was published in 1980with the aim of providing protection against major hazards from industrial activities: fire, explosion,and the release of certain substances (two appendices list the industrial activities and the 142substances concerned). This law came into power in September 1980 imposing on industry theobligation, amongst others, to have a "Safety Analysis" (Sicherheitsanalyse) available for the competentauthority.
153

The Regulation of 1981, detailing the application of the Stdrfall-Verordnung, defined the SafetyAnalysis as including:
• description of the installation and the process, including the characteristics of the process undernormal operating conditions;
• description of parts of the installation significant from the point of view of technical safety, thepossible sources of hazard and hypothetical causes of an accident;
• chemical analysis/composition of the substances involved;• a description of measures concerned with safety, limitation of the consequences of the
disturbances and ensuing emergency;• information on the consequences of an accident.
After the German unification the Industrial Initiative for Environmental Protection was founded.This body promotes the exchange of experts from companies and consultancy on specificenvironmental solutions. Germany is comprehensively regulated in the environmental field, the existinglimit values and regulations are of a preventative nature. The objectives of the German environmentalpolicy and associated legislation are:
• introduction of environmental protection as a constitutional policy;• multimedia environmental protection (e.g. liability for environmental damage, environmental
impacts statements);• producing revised legislation on effluent charges, waste management, federal emission control,
measures for soil protection, etc.
9.1.10. France
In accordance with the laws of 1976 and 1977 (Protection of Nature and Impact on theEnvironment respectively), the competent authorities may examine the hazards presented by normalas well as abnormal operation involving certain raw materials, intermediates or products with a viewof mitigating such hazards.
For installations requiring a license, the application (which is available to the public forinspection) must include a safety study, maps of the surrounding area and plans of the installation,an impact study, a description of emergency resources and an account of the provisions for hygieneand safety. The final decision is published by means of notices and announcements in localnewspapers.
The "Code de Travail" (Labour Law) contains provisions regarding fire and explosion hazardsat work which cover requirements relating to the construction of installations, operating practices andprocedures aimed at the protection of workers in the event of accidents. The Decree of 1979 on safetytraining, which also forms part of this Code, strengthens the provisions for informing workers,particularly as regards procedures, in the event of an accident.
9.1.11. Switzerland
The "Stdrfall-Verordnung" from 1991, based on the environmental protection act from 1983, isin principle similar to the EU Council Directive. There are however, some important particularities:
• it is also applicable for installations with micro-organisms and for installations with hazardouswaste as well as for transportation routes (railway, roads, Rhine) through which hazardousmaterials are transported;
• concerning installations with chemical substances the limits for application of the Stdrfall-Verordnung are lower than the ones of the Council Directive;
154

• all owners of installations subject to the Storfall-Verordnung have to make a short report whichindicates the worst case scenario. This allows the authority to make a prioritization and to requirea risk analysis from the installations which could cause severe damages.
9.1.12. United States of America
Although there have been several chemical industry incidents in the United States, the one ofmost concern to the public was the Love Canal episode, when a toxic waste dump so heavily polluteda waterway that leaks and spills finally made the surrounding area uninhabitable. As the full impactof the extent of the problems emerged, legislation for control and clean up of problem sites wasenacted (Toxic Substances Control Act 1976) and through the Superfund,. techniques and expertisewere developed to deal with the problems.
In the aftermath of the Bhopal accident in India in 1984 regulatory efforts dealing withprevention of major chemical plant accidents started to increase. The Environmental ProtectionAgency (EPA) initiated a programme in 1985 to encourage community planning and preparednessconcerning major releases of hazardous materials. The Clean Air Act Amendments signed in 1990,which contain provisions for accidental release prevention, mandate the EEA to create regulations forfacilities possessing listed chemicals above a threshold quantity. The extensive risk management plansrequired must contain three specific components:
• a hazards assessment of a worst case accident;• an accident prevention programme;• an accident response programme.
At the same time that EPA began to intensify their major accident prevention effort theDepartment of Labour's Occupational Safely and Health Administration (OSHA) began performingdetailed inspections of chemical plants. It became obvious that OSHA needed new regulatory standardsto establish consistent regulations on accidental release prevention. This led to the release of the reporton Process Safety Management of Highly Hazardous Chemicals [67]. Concerned facilities must developand implement a process safely management (PSM) system which must be maintained over the lifetimeof the facility and is mainly concerned with protection of workers.
In general, significant advances have been made in the development and application of accidentprevention strategies by several industry groups. The American Institute of Chemical Engineers, forexample, created its Center for Chemical Process Safety which published a large number of technicalguidelines. Furthermore, Recommended Practices on Process Hazard Management were issued by theAmerican Petroleum Institute, see Reference [58].
9.1.13. International Organizations
The most active international organizations in the field of controlling major hazards have beenthe United Nations Economic Commission for Europe (UNECE), the International Labour Organization(ILO) and the Organization for Economic Co-operation and Development (OECD) as described in[68].
The 1992 UNECE convention covering Transboundary Major Accidents is based on the sameprinciples as the EU Council Directive (see Annex I). It stresses the need for international consultationand information exchange about dangerous activities and accidents as well as the principle of equalaccess and treatment in administrative and judicial matters.
A Code of Practice on Major Accidents was published by the ILO in 1991. After consultationsand negotiations with Member States and the European Community a convention, covering pipelinesand the extractive industries, was adopted in June 1993.
155

The OECD has recently completed a programme dealing with various aspects related to majoraccidents. These areas include:
• the role of human factors in plant operations;• food management practice;• information to the public;• the role of workers in accident prevention and response;• the role of public authorities in preventing major accidents;• the role of public authorities in land use planning.
The use of economic instruments in environmental policy was recommended by the OECD in1991. Following this principle a draft convention on the regime of strict liability for hazardousactivities in Europe was formulated by the European Council.
9.2. LEGISLATION ABOUT ENVIRONMENTAL IMPACTS
9.2.1. Policy
The emergence of environmental policy in the industrialized countries over the 20 years from1972 to 1992 has been described in Reference [69] and is characterized by the following main features:
(1) A recognition of the need for policies to take more account of environmental impacts andconstraints. Environmental impact has been a feature of development control in most developedcountries.
(2) An increased recognition of the need for cross-sectoral policies. Links between environment,energy, transport and technology policies have been strengthened.
(3) Replacement of formerly largely reactive approaches to pollution control by anticipatory andpreventive ones. During the last two decades there has been an increasing focus on pollutionabatement at source. The precautionary principle, which broadly demands that, if an activity orsubstance clearly carries a significant risk of environmental damage, it should either not proceedor be used, or should be adopted only at the minimum essential level and with maximumpractical safeguards, is now widely recognized. Also widely recognized is the polluter paysprinciple which essentially states that the costs of pollution should not be externalized. Anindustry or municipality should itself bear the costs, without subsidy, of the actions needed tomeet environmental standards and avoid environmental damage. Screening of potentiallyhazardous substances before their introduction to the general market has become more stringent,partly as a reaction to the unforeseen impacts of persistent organochlorine pesticides andchlorofluorocarbons. The concept of "critical loads" (defined as the maximum amount ofpollutant an ecosystem can stand without stress) has increasingly come to guide policy. Suchcritical loads have been defined for water, air and soil pollution and relate to a large number ofharmful substances.
(4) Increasing interest in economic instruments as an incentive to energy and materials efficiencyand pollution control.
(5) Increasing promotion of energy efficiency, energy conservation and environmentally soundprocesses in industry, transport and domestic environments.
(6) Recognition of the international and often regional nature of many environmental problems withan increasing broadening of the response.
156

(7) Increased attention to public information and participation. It has become evident that the mosteffective way of ensuring the success of environmental policies is to involve all sectors of thecommunity in the discussion of their objective and to inform the public about the state of theenvironment and the actions being taken to protect it.
(8) Better environmental science and monitoring. These are the foundation of sound policy andpublic understanding. Through them the loop between policy implementation and effect can beclosed.
(9) Increased concern about global climate change due to anthropogenic CO2 emissions. The climateconvention adopted in Rio has the main objective to stop and reduce the quantities of CO2
emitted worldwide.
9.2.2. Review and development of legislation
There has been a major evolution of environmental law in the industrialized countries since 1970.In recent years the character of the legislation has changed to bring about a more integrated and cross-sectoral series of policies and increasingly to apply, within the territory of individual countries,international obligations.
Much national environmental legislation has been concerned with regulating activities that havethe potential to cause environmental hazard. Such regulations concern, for example, the containmentof toxic substances in storage, in use and in transportation: the authorization of discharges to theenvironment and the setting of standards for emissions.
The emergence of an increasing body of legislation and regulation has been paralleled bychanges in the way in which legal instruments are interpreted and enforced in a number of countries.The public has acquired an increasing right to challenge the way in which departments of governmentand official agencies carry out their functions and this move, to make public authorities accountableto the public at large through the courts for the achievement of national policy goals in theenvironmental field, is a development that has clear implications for the future.
Institutional responsibility for the environment in industrialized countries is commonly dividedbetween the national and the state/district/municipal/local authority levels. Moreover there arecommonly decisions at both these levels between departments with overall responsibility for settingtechnical standards, granting operational consents, levying charges, monitoring performance andprosecuting infringements.
The governmental sector has no monopoly of institutions concerned with the nationalenvironment. During the last 20 years there has been an increasing emergence of self-regulationinstitutions within industry, linked to the development of new and environmentally compatibletechnologies in which sectors of industry have commonly co-operated. A third institutionaldevelopment has been the massive growth in non-governmental organizations, usually in the form ofgroups whose business it is to demand higher standards of environmental performance, protectparticular regions or interests or draw attention to inadequacies of performance.
At a national level, the early 1970s were characterized in many developed countries by a suddeninitiative to incorporate what were then perceived as new environmental concerns within the mandatesof existing sectoral ministries. This was done in Sweden (Ministry of Agriculture), The Netherlands(Ministry of Health) and Germany and Finland (Ministry of the Interior), see Ref. [70]. In somecountries, including the United Kingdom and France, new ministries were formed by bringing togetherpre-existing sectoral departments. In other countries, including the United States, Japan, Norway,Canada, France, Australia and New Zealand, more specialized environment ministries were created.Toward the end of the 1980s there was increasing concern within governments over the inadequacyof having sectoral Departments of Environment established alongside others, when it was apparent that
157

the environment was actually the natural capital of nations, the foundation of the quality of life andprosperity and influenced by all the various sectoral activities, Ref. [71]. Many governments havetherefore established new machinery to better co-ordinate the activity of the sectoral departments. Asurvey of 101 countries by UNEP shows that by 1991/2 nearly all industrialized countries surveyedhad established a ministry or department concerned solely or principally with environmental protectionand natural resource management, see Ref. [69].
In many industrialized countries (notably the United States, Australia, Switzerland, Germany,Canada and to a lesser extent the United Kingdom, France, Austria and the Nordic countries),provinces, cantons and states within the unitary state have substantial responsibility for setting goalsfor environmental protection and for enforcing standards and regulations. In a number of countriesthere has been a debate about the proper balance between the central or federal government and thestate or provincial administrations. The conclusion seems to be that the broad strategy has to benational, but worked out through a dialogue involving the components of the state and that whilestandards and policies must be applied everywhere, the enforcement mechanism is often mosteffectively decentralized. Making this machinery work means establishing effective consultation withinthe countries, often down to local community and village level and the need to empower localcommunities to take more direct care of their own environments is being increasingly stressed e.g.in Ref. [72].
In the industrial field, Chambers of Commerce, national business councils and specializedindustrial organizations are playing an increasing part in environmental policy. Some suchorganizations are concerned with promoting products perceived to be superior in energy use orenvironmental impact, while others seek to represent industrial sectors in dialogue with governmentIn Canada, for example, the Canadian Manufacturer's Association has produced a policy paper whichdescribes sustainable development as both, a challenge and an opportunity for industry, while theCanadian Chamber of Commerce has established a task force for the environment and machinerydesigned to stimulate and guide national industry. The need for technological transformation isappreciated in many countries and within sectors of industry and will therefore be a growing area inthe future, as described in Ref.[73].
A dramatic feature of the last 20 years has been the growth in non-governmental organizationsconcerned with environmental affairs. For example, the aggregate membership of the majorenvironmental organizations in the US increased from under three million in 1971 to over nine millionin 1990. The figures for the UK are even more startling - a combined membership of under half amillion in 1971 grew to over 3.6 million in 1990. Another recent trend has been the recognition bygovernments of the need to involve all these institutions - governmental and non-governmental alike -in the discussion of the national policy. In Canada, round tables that involve government, industry and
the non-governmental environmental movement have been established at both, national and provinciallevels. A similar mechanism has been established in Australia for a national study of ecologicallysustainable development. In general there is an increasing preparedness for discussions between thegovernmental sector, as the regulator of action and the establisher of overall policy for theenvironment, the industry, as the source of the invention and technological advance that will be neededin order to maintain quality of life while minimizing environmental impact and the waste of resources,and the environmental non-governmental movement, with its extensive scientific knowledge andcommitment and ability to mobilize public opinion.
158
REFERENCES
[I] INTERNATIONAL ATOMIC ENERGY AGENCY, Manual for the Classification andPrioritization of Risks due to Major Accidents in Process and Related Industries, IAEA-TECDOC-727, Vienna (1993).
[2] Emergency Response Planning Guidelines, Am. Ind. Hyg. Assoc. J. 54 (1993).[3] NATIONAL INSTITUTE FOR OCCUPATIONAL SAFETY AND HEALTH,
Immediately Dangerous to Life and Health, NIOSH Pocket Guide to Chemical Hazards, USGovernment Printing Office, Washington, DC (1990).
[4] WORLD HEALTH ORGANIZATION, Air Quality Guidelines for Europe, European SeriesNo.23, WHO Regional Publications, Copenhagen (1987).
[5] WORLD HEALTH ORGANIZATION, Guidelines for Drinking-Water Quality(2nd edn), Volume 1: Recommendations, WHO, Geneva (1993).
[6] WORLD HEALTH ORGANIZATION, Compendium of Environmental Guidelines andStandards for Industrial Discharges, WHO, Geneva (1983).
[7] WORLD HEALTH ORGANIZATION, Selected Techniques for Environmental Management -Training Manual, WHO, Geneva (1983).
[8] WORLD HEALTH ORGANIZATION, Emissions, Environmental Transport and Dose-Response Models: Guidelines for Case Studies, Rep. WHO/PEP/8813, WHO, Geneva (1988).
[9] WORLD HEALTH ORGANIZATION, Management and Control of the Environment, Rep.WHO/PEP/89.1, WHO, Geneva (1989).
[10] UNITED NATIONS ENVIRONMENT PROGRAMME, The Environmental Impacts ofProduction and Use of Energy, Part IV: The Comparative Assessment of the EnvironmentalImpact of Energy Sources, Phase I: Comparative Data on the Emissions, Residuals and HealthHazards of Energy Sources, Rep. ERS-14-85, UNEP, Nairobi (1985).
[II] ORGANIZATION FOR ECONOMIC CO-OPERATION AND DEVELOPMENT, EmissionStandards for Major Air Pollutants from Energy Facilities in OECD Member Countries, OECD,Paris (1984).
[12] WORLD HEALTH ORGANIZATION, Assessment of Sources of Air, Water, and LandPollution - A Guide to Rapid Source Inventory Techniques and their Use in FormulatingEnvironmental Control Strategies, Part 1: Rapid Inventory Techniques in EnvironmentalPollution, Rep. WHO/PEP/GETNET/93.1-A, Part 2: Approaches for Consideration inFormulating Environmental Control Strategies, Rep. WHO/PEP/GETNET/93.1-B, WHO,Geneva (1993).
[13] WALLACE, L.A., The Total Exposure Assessment Methodology (TEAM) Study: Summary andAnalysis, Rep. EPA/600/6-87/002a, US Environmental Protection Agency, Washington, DC(1987).
[14] US DEPARTMENT OF ENERGY, Energy Technology Characterizations Handbook:Environmental Pollution and Control Factors (3rd edn), Aerospace Corporation and MuellerAssociates Inc., Baltimore, MD (1983).
[ 15] VOLLENWEIDER, R_, Advances in Defining Critical Loading Levels for Phosphorus in LakeEutrophication, OECD Co-operative Programme for Eutrophication, Canada Centre for InlandWaters (1976).
[16] NATIONAL ACADEMY OF SCIENCE, Risk Assessment in the Federal Government:Managing the Process, Committee on the Institutional Means for Assessment of Risk to PublicHealth, Commission on Life Sciences, The National Research Council, National Academy Press,Washington, DC (1983).
[17] COMMITTEE TO CO-ORDINATE ENVIRONMENTAL AND RELATED PROGRAMMES,Risk Assessment and Risk Management of Toxic Substances, US Department of Health andHuman Services, Washington, DC (1985).
159

[18] NATIONAL TOXICOLOGY PROGRAM, Report of the NTP Ad Hoc Panel on ChemicalCarcinogenesis Testing and Evaluation, Board of Scientific Counselors, US Department ofHealth and Human Services, Washington, DC (1984).
[19] NATIONAL ACADEMY OF SCIENCE, PharmacoKinetics in Risk Assessment, DrinkingWater and Health, Vol. 8, Subcommittee on PharmacoKinetics in Risk Assessment, NationalResearch Council, National Academy Press, Washington, DC (1987).
[20] NATIONAL INSTITUTE FOR OCCUPATIONAL SAFETY AND HEALTH, Pocket Guide toChemical Hazards, NIOSH/OSHA, US Dept. of Health and Human Services and US Dept. ofLabour, US Government Printing Office, Washington, DC (1981).
[21 ] CALABRESE, E.J., Multiple Chemical Interactions, Lewis Publishers, Chelsea, MI (1990).[22] GRAY, R.H., CHESS, E.K., MELLINGER, P.J., RILEY, R.G., SPRINGER, D.L. (Eds), Health
and Environmental Research on Complex Organic Mixtures, Proc. CONF-851027, PacificNorthwest Laboratory, Richland, WA (1987).
[23] NATIONAL ACADEMY OF SCIENCE, Complex Mixtures, Methods for In Vivo ToxicityTesting, Committee on Methods for the In Vivo Toxicity Testing of Complex Mixtures, NationalResearch Council, National Academy Press, Washington, DC (1988).
[24] MORGAN, M.G., MORRIS, S.C., Needed: A National R&D Effort to Develop Individual AirPollution Monitor Instrumentation, Air Pollution Control Association 27 (1977) 670-673.
[25] NATIONAL ACADEMY OF SCIENCE, Drinking Water and Health, Vol.6, Safe DrinkingWater Committee, National Research Council, National Academy Press, Washington, DC(1986).
[26] LIPFERT, F.W., The Association of Air Pollution with Human Mortality: Multiple RegressionAnalyses for 136 US Cities, Air Pollution Control Association, Toronto, (1977).
[27] MORGAN, M.G., MORRIS, S.C., MEIER, A.K., SHENK, D.L., A Probabilistic Methodologyfor Estimating Air Pollution Health Effects from Coal-Fired Power Plants, Energy Systems andPolicy 2(1978)287-310.
[28] COTHERN, C.R., MEHLMAN, MA., MARCUS, W., Risk Assessment and Risk Managementof Industrial and Environmental Chemicals, Princeton Scientific Publishing, Princeton, NJ(1988).
[29] HOWARD, P.H., Handbook of Environmental Rate and Exposure Data for Organic Chemicals,Lewis Publishers, Chelsea, MI (1989).
[30] LAPPENBUSCH, W.L., Contaminated Waste Sites Property and Your Health, LappenbuschEnvironmental Health Inc., Alexandria, VA (1989).
[31] LIOY, P.J., DAISEY, J.M., Toxic Air Pollution - Non Criteria Pollutants, Lewis Publishers,Chelsea, MI (1987).
[32] SITTIG, M., Handbook of Toxic and Hazardous Chemicals and Carcinogens, NoyesPublications, Park Ridge, NJ (1985).
[33] WEISS, G., Hazardous Chemicals Data Book (2nd edn), Noyes Publications, Park Ridge, NJ(1986).
[34] MORGAN, M.G., HENRION, M., MORRIS, S.C., AMARAL, D.A.L., Uncertainty in RiskAssessment, Environ.Sci.Technol. 19 (1985) 662-667.
[35] GRIFFITHS, R.R., Chemical Plant Risk Assessment: Uncertainties and Development Needs,Environment International 10 (1984) 523-530.
[36] NIEHAUS, F., NOVEGNO, A., VUORI, S., Areas of Uncertainty in Comparing Risks of EnergySystems, Environment International 10 (1984) 531-539.
[37] COTHERN, C.R., CONIGLIO, W.A., MARCUS, W.L., Development of Quantative Estimatesof Uncertainty in Environmental Risk Assessments When the Scientific Data Base is Inadequate,Environmental International 12 (1986) 643-647.
[38] CRUMP, K., "An Overview of Factors that Influence the Quantative Risk Assessment ofCarcinogens", Workshop on Problem Areas Associated with Developing Carcinogen Guidelines,Rep. BNL-51779, Brookhaven National Laboratory, Upton, NY (1984).
160

[39] US DEPARTMENT OF ENERGY, On Understanding Impacts of Energy Use and Developmenton Ecological Systems, Technical Information Center, Oak Ridge, TN (1987).
[40] BARNTHOUSE, L. W., Methodology for Environmental Risk Analysis, Rep. ORNL/TM-8167,Oak Ridge National Laboratory, Oak Ridge, TN (1982).
[41 ] BUFFLER, P.A., CRANE, M., KEY, M.M., Possibilities of Detecting Health Effects by Studiesof Populations Exposed to Chemicals From Waste Disposal Sites, Environmental HealthPerspectives 62 (1985) 423-456.
[42] KRISHNA MURTI, C.R., "A Systems Approach to the Control of Chemical Disasters", RiskAssessment of Chemicals in the Environment (RICHARDSON, M.L.,Ed.), Royal Society ofChemistry, London (1988).
[43] ORGANIZATION FOR ECONOMIC CO-OPERATION AND DEVELOPMENT,Environmental Data Compendium 1987, OECD, Paris (1987).
[44] UMWELTBUNDESAMT, Materialien 5/83, Erich Schmidt Verlag, Berlin (1983).[45] UNITED NATIONS ENVIRONMENT PROGRAMME, Environmental Events Record 1985-
1988, UNEP NEWS, Nairobi (1989).[46] WORLD HEALTH ORGANIZATION, Environmental Epidemiology - Bibliography of Health
Effects of Environmental Hazards in Developing Countries, WHO, Geneva (1987).[47] TNO, Methods for the Determination of Possible Damage: to people and objects resulting from
the release of hazardous materials, Rep. CPR-16E ("The green book"), Committee for thePrevention of Disasters caused by Dangerous Substances, Voorburg (1989).
[48] MAJOR HAZARDS ASSESSMENT PANEL, The Chlorine Toxicity Monograph, Institute ofChemical Engineers, Rugby (1987).
[49] WITHERS, R.M.J., LEES, F.P., The Assessment of Major Hazards: The Lethal Toxicity ofChlorine, Parts 1 and 2, J.Haz.Mat. 12 (1985) 231-302.
[50] WITHERS, R.M.J., The Lethal Toxicity of Ammonia, Refinement of Estimates of theConsequences of Heavy Toxic Vapour Releases, Paper No.l, Institute of Chemical EngineersNorthwestern Branch, Manchester (1986).
[51 ] PRUGH, R.W., Mitigation of Vapour Cloud Hazards, Plant/Operations Progress 4 (1985).[52] AUMONIER, S., MORREY, M., Non-Radiological Risks of Evacuation, J.Rad.Prot. 10 (1990)
287-290.[53] DA VIES, P.C., PURDY, G., Toxic Gas Risk Assessment - The Effects of Being Indoors,
Institute of Chemical Engineers Northwestern Branch, Rugby (1986).[54] HEALTH AND SAFETY COMMISSION, Major Hazard Aspects of the Transport of Dangerous
Substances, Advisory Committee on Dangerous Substances, London (1991).[55] CHRIS Manual (3 volumes), Department of Transportation, US Coast Guard, Springfield, VA
(1992).[56] ORGANIZATION FOR ECONOMIC CO-OPERATION AND DEVELOPMENT / UNITED
NATIONS ENVIRONMENT PROGRAMME, "Identifying, Classifying and DescribingHazardous Wastes", Hazardous Wastes, Detection, Control and Treatment, (ABBOU, Ed),Elsevier, Amsterdam and New York (1987) 15-45.
[57] AMERICAN INSTITUTE OF CHEMICAL ENGINEERS, Guidelines for TechnicalManagement of Process Safety, Center for Chemical Process Safety, New York (1989).
[58] AMERICAN PETROLEUM INSTITUTE, Process Hazard Management, API RecommendedPractice 750, API, Washington, DC (1989).
[59] HEALTH AND SAFETY EXECUTIVE, Successful Health and Safety Management, HS(G) 65,HSE Books, London (1991).
[60] PITBLADO, R.M., WILLIAMS, J., SLATER, D.H., Quantitative Assessment of SafetyManagement Systems, Plant/Operations Progress 9 (1990).
[61 ] HEALTH AND SAFETY AT WORK ETC. ACT - HASAWA, HMSO, London (1974).[62] HEALTH AND SAFETY COMMISSION, Advisory Committee on Major Hazards, Rep.
ACMH-1, HMSO, London (1976).
161

[63] HEALTH AND SAFETY COMMISSION, Advisory Committee on Major Hazards, Rep.ACMH-2, HMSO, London (1979).
[64] HEALTH AND SAFETY EXECUTIVE, Notification of Installations Handling HazardousSubstances; Regulations 1982 (NIHHS), Rep.SI 1982/1357, HMSO, London (1982).
[65] HEALTH AND SAFETY EXECUTIVE, Control of Industrial Major Hazards Regulations 1984(CIMAH), Rep.SI 1984/1902, HMSO, London (1984).
[66] HEALTH AND SAFETY EXECUTIVE, Advisory Committee on Major Hazards, Rep. ACMH-3, HMSO, London (1984).
[67] OCCUPATIONAL SAFETY AND HEALTH ADMINISTRATION, Process SafetyManagement of Highly Hazardous Chemicals, Rep.29-CFR-1910.119, US Government PrintingOffice, Washington, DC (1992).
[68] LEDERMAN, L., An Overview of International Approaches for the Control of Major IndustrialHazards, Interdisciplinary Center of Technological Analysis and Forecasting, Tel AvivUniversity, Tel Aviv (1994).
[69] TOLBA, M.K., EL-KHOLY, O.A., The World Environment 1972-1992: Two Decades ofChallenge, Chapman and Hall on behalf of the United Nations Environment Programme, London(1992).
[70] ORGANIZATION FOR ECONOMIC CO-OPERATION AND DEVELOPMENT, The State ofthe Environment in OECD Member Countries, OECD, Paris (1979).
[71 ] WORLD COMMISSION ON ENVIRONMENT AND DEVELOPMENT, Our Common Future,Oxford University Press, Oxford and New York (1987).
[72] INTERNATIONAL UNION FOR CONSERVATION OF NATURE AND NATURALRESOURCES, Caring for the Earth: A Strategy for Sustainable Living, IUCN/UNEP/WWF,Gland, Switzerland (1991).
[73] HEATON, G., REPETTO, R.C., SOBIN, R., Transforming Technology: An Agenda forEnvironmentally Sustainable Growth in the 21 st Century, World Resource Institute, Washington,DC (1991).
162

Appendix I
GUIDELINE ON CONTENT OF REGIONAL RISK MANAGEMENTPROJECT PLAN
This Appendix provides general guidance concerning the range of information to be addressedwhen formulating a Project Plan for a regional risk management project. The details of suchinformation would vary for different situations and conditions. Some sections may not be able to becompleted in detail at the early stages of a proposal.
SUMMARY
1. INTRODUCTION
2. BACKGROUND INFORMATION
2.1. GENERAL DESCRIPTION OF AREA
2.1.1.2.1.2.2.1.3.2.1.4.2.1.5.2.1.6.2.1.7.2.1.8.2.1.9.
LocationTopographyClimateDemographyThe Labour ForceRivers, Forests, Agricultural LandIndustryTransportation RoutesEconomic Importance
REGULATORY CONTEXT
2.2.1.2.2.2.2.2.3.
Governmental StructureLegislation StructureRoieofNGOs
2.3. LOCAL CONSENSUS AND PAST EXPERIENCE
3. OBJECTIVES AND SCOPE OF THE PROJECT
3.1. OBJECTIVES AND EXPECTED OUTPUT
3.2. INDUSTRIES AND TRANSPORTATION ROUTES
3.1.1. Transport Systems3.1.2. Energy Production3.1.3. Industries in the Area3.1.4. The Future for Hazardous Industry
3.4. INVENTORY OF POTENTIAL HAZARDS
3.5. HEALTH AND ENVIRONMENTAL RISKS TO BE STUDIED
163

3.6 CRITERIA FOR EVALUATING STUDY RESULTS
3.6.1. Acceptable Risk Criteria
3.6.2. Societal Risk
4. PROJECT ORGANIZATION
4.1. PARTICIPANTS AND STEERING COMMITTEE
- Government Departments
- Agencies- Universities- Research Organizations- Consulting Engineering
4.2. IMPLEMENTATION COMMITTEE AND WORKING GROUPS
- Composition
5. REQUIRED RESOURCES
- Financial- Manpower- Equipment
- Computer hardware/software
6. PROJECT PROCESS
- Major steps to be followed in conduct of study
7. DEFINITION OF WORK PACKAGES
- As prepared by Working Groups and approved by Implementation Committee
8. PROJECT SCHEDULE
REFERENCES
164
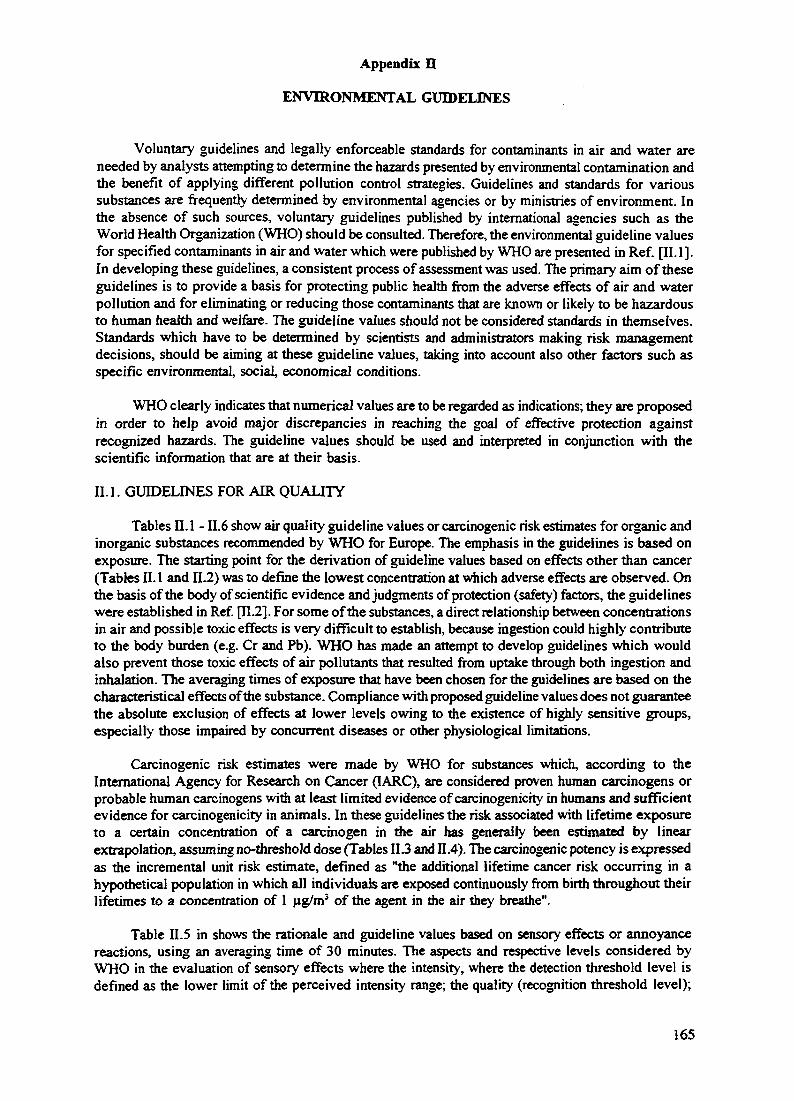
Appendix II
ENVIRONMENTAL GUIDELINES
Voluntary guidelines and legally enforceable standards for contaminants in air and water areneeded by analysts attempting to determine the hazards presented by environmental contamination andthe benefit of applying different pollution control strategies. Guidelines and standards for varioussubstances are frequently determined by environmental agencies or by ministries of environment. Inthe absence of such sources, voluntary guidelines published by international agencies such as theWorld Health Organization (WHO) should be consulted. Therefore, the environmental guideline valuesfor specified contaminants in air and water which were published by WHO are presented in Ref. [II. 1 ].In developing these guidelines, a consistent process of assessment was used. The primary aim of theseguidelines is to provide a basis for protecting public health from the adverse effects of air and waterpollution and for eliminating or reducing those contaminants that are known or likely to be hazardousto human health and welfare. The guideline values should not be considered standards in themselves.Standards which have to be determined by scientists and administrators making risk managementdecisions, should be aiming at these guideline values, taking into account also other factors such asspecific environmental, social, economical conditions.
WHO clearly indicates that numerical values are to be regarded as indications; they are proposedin order to help avoid major discrepancies in reaching the goal of effective protection againstrecognized hazards. The guideline values should be used and interpreted in conjunction with thescientific information that are at their basis.
ILL GUIDELINES FOR AIR QUALITY
Tables II. 1 - II.6 show air quality guideline values or carcinogenic risk estimates for organic andinorganic substances recommended by WHO for Europe. The emphasis in the guidelines is based onexposure. The starting point for the derivation of guideline values based on effects other than cancer(Tables II. 1 and II.2) was to define the lowest concentration at which adverse effects are observed. Onthe basis of the body of scientific evidence and judgments of protection (safety) factors, the guidelineswere established in Ref. [II.2]. For some of the substances, a direct relationship between concentrationsin air and possible toxic effects is very difficult to establish, because ingestion could highly contributeto the body burden (e.g. Cr and Pb). WHO has made an attempt to develop guidelines which wouldalso prevent those toxic effects of air pollutants that resulted from uptake through both ingestion andinhalation. The averaging times of exposure that have been chosen for the guidelines are based on thecharacteristical effects of the substance. Compliance with proposed guideline values does not guaranteethe absolute exclusion of effects at lower levels owing to the existence of highly sensitive groups,especially those impaired by concurrent diseases or other physiological limitations.
Carcinogenic risk estimates were made by WHO for substances which, according to theInternational Agency for Research on Cancer (IARC), are considered proven human carcinogens orprobable human carcinogens with at least limited evidence of carcinogenicity in humans and sufficientevidence for carcinogenicity in animals. In these guidelines the risk associated with lifetime exposureto a certain concentration of a carcinogen in the air has generally been estimated by linearextrapolation, assuming no-threshold dose (Tables II.3 and II.4). The carcinogenic potency is expressedas the incremental unit risk estimate, defined as "the additional lifetime cancer risk occurring in ahypothetical population in which all individuals are exposed continuously from birth throughout theirlifetimes to a concentration of 1 u.g/m3 of the agent in the air they breathe".
Table II.5 in shows the rationale and guideline values based on sensory effects or annoyancereactions, using an averaging time of 30 minutes. The aspects and respective levels considered byWHO in the evaluation of sensory effects where the intensity, where the detection threshold level isdefined as the lower limit of the perceived intensity range; the quality (recognition threshold level);
165

TABLE II. 1. WHO AIR QUALITY GUIDELINES VALUES FOR INDIVIDUAL SUBSTANCESBASED ON EFFECTS OTHER THAN CANCER OR ODOR/ANNOYANCE [II. 1]
Substance
Cadmium
Carbon disulfide
Carbon monoxide
1,2, -Dichloroethane
Dichloromethane
Formaldehyde
Hydrogen sulfide
Lead
Manganese
Mercury
Nitrogen dioxide
Ozone
Styrene
Sulfure dioxide
Tetrachloroethylene
Toluene
Trichloroethylene
Vanadium
Time-weighted average
1-5 ng/m3
10-20 ng/m3
100 ug/m3
100 mg/m3 '60 mg/m3 '30 mg/m3 a
10 mg/m3
0.7 mg/m3
3 mg/m3
100 ug/m3
150 ng/m3
0.5-1.0 ug/m3
1 ug/m3
1 Hg/m3b
400 ug/m3
150 ug/m3
150-200 ug/m3
100-120 ug/m3
800 ug/m3
500 ug/m3
350 ug/m3
5 mg/m3
8 mg/m3
1 mg/m3
1 Ug/m3
Averaging Time
1 a(rural areas)1 a(urban areas)
24 h
15 min30 min1 h8h
24 h
24 h
30min
24 h
1 a
1 a
1 a
1 h24 h
1 h8h
24 h
10 min1 h
24 h
24 h
24 h
24 h
1 Exposure at these concentrations should be for no longer than the indicated times and should not berepeated within 8 hours.
b The value is given only for indoor pollution.
and the acceptability and annoyance, where the nuisance threshold level is defined as the concentrationat which less than 5% of the population experience annoyance for less than 2% of the time.
Table 11.6 shows WHO guideline values for individual substances based on effects on terrestrialvegetation which occur at concentrations below those known to be harmful to humans. It is to bementioned that WHO guidelines regard only few of the pollutants that are harmful for the ecosystemand that only the effects to the vegetation are considered.
WHO guidelines are for individual chemicals (except that for sulphur dioxide and suspendedparticulates). Pollutant mixtures can yield differing toxicities, but data for synergetic effects are atpresent insufficient for establishing guidelines.
166

TABLE II.2. GUIDELINES VALUES FOR COMBINED EXPOSURE TO SULFUR DIOXIDEAND PARTICULATE MATTER1 [II. 1]
Short term
Long term
Averaging time
24 h
1 a
Sulfurdioxide
(ug/m3)
125
50
Reflectanceassessmentblack smokeb
(ug/m3)
125
50
Gravimetic assessment
Total suspendedparticulates(TSP)C
(ug/m3)
120*
-
Thoracicparticles(TP)d
(ug/m3)
70e
-
No direct comparison can be made between values for particulate matter in the right and left hand sectionsof this table, since bom the health indicators and the measurement methods differ.Nominal ug/m3 units assessed by reflectance. Application of the black smoke value is recommended onlyin areas where coal smoke from domestic fires is the dominant component of the particulates. It does notnecessarily apply where diesel smoke is an important contributor.TSP: measurement by high volumes sampler without any size selection.TP: equivalent values as for sampler with ISO-TP characteristics (having 50% cut-off point at 10 urn):estimated from TSP values using site-specific TSP/ISO-TP ratios.Values to be regarded as tentative at this stage, being based on a single study.
TABLE II.3. CARCINOGENIC RISK ESTIMATES BASED ON HUMAN STUDIES [II. 1]
Substance
Acrylonitrile
Arsenic
Benzene
Chromium (VI)
Nickel
Polynuclear AromaticHydrocarbons (PAH) b
Vinyl Chloride
Unit Risk*
2 x 10"5
4 x 10"3
4 x 10⁻⁶
4 x 10"2
4 x lO"4
9 x 10":
1 x 10⁻⁶
Cancer risk estimates for lifetime exposure to aconcentration of 1 ug/m3.Expressed as benzo[a]pyrene.
II.2. GUIDELINES FOR WATER QUALITY
Table II.7 shows WHO guideline values for various substances or contaminants in drinkingwater. WHO states that, if properly implemented, the guidelines will ensure the safety of drinking-water supplies. Although the guideline values describe a quality of water that is acceptable for lifelong
167

TABLE II.4. RISK ESTIMATES FOR ASBESTOS [II.l]
Concentration
50OF*/m3 (0.0005F/ml)
Range of lifetime risk estimates
10"M0'5 (lung cancer in a population where 30% aresmokers)
10s-10J (mesothelioma)
Note F* = fibres measured by optical methods.
TABLE II.5. RATIONALE AND GUIDELINE VALUES BASED ON SENSORY EFFECTS ORANNOYANCE REACTIONS USING AN AVERAGING TIME OF 30 MINUTES[11.2]
Substance
Carbon disulfide inviscose emissions
Hydrogen sulfide
Styrene
Tetrachloroethylene
Toluene
Detection threshold
0.2-2.0 ug/m3
70 ug/m3
8 mg/m3
1 mg/m3
Recognition threshold
0.6-6.0 ug/m3
210-280 ug/m3
24-32 mg/m3
10 mg/m3
Guideline value
20 ug/m3
7 ug/m3
70 ug/m3
8 mg/m3
1 mg/m3
TABLE II.6 GUIDELINE VALUES FOR INDIVIDUAL SUBSTANCES BASED ON EFFECTSON TERRESTRIAL VEGETATION [II. 1]
Substance
Nitrogen dioxide
Total nitrogendeposition
Sulfur dioxide
Ozone
Peroxyacetylnitrate
Guidelinevalue
95ug/m3
30 ug/m3
3 g/m2
30 ug/nr5
100 ug/m3
200 ug/m3
65 ug/m3
60 ug/m3
300 ug/m3
80 (xg/m3
Averagingtime
4 h1 a
1 a
1 a24 h
1 h24 haveraged overgrowingseason
1 h8h
Remarks
In the presence of SO, and O; levels which arenot higher than 30 ug/m3 (arithmetic annualaverage) and60 ug/m3 (average during growingseason), respectively
Sensitive ecosystems are endangered above thislevel
Insufficient protection in the case of extremeclimatic and topographic conditions
168

TABLE II.7. WHO DRINKING-WATER QUALITY GUIDELINES FOR INORGANIC ANDORGANIC CONTAMINANTS OF HEALTH SIGNIFICANCE [II.l]
Contaminant
Aldrin/Dieldrin
Arsenic
Benzene
Benzo/iz/pyrene
Cadmium
Carbon Tetrachloride
Chlordane
Chloroform
Chromium
Cyanide
2,4 D
DDT
1,2-Dichloroethane
1.1 -Dichloroethylene
Fluoride c
gamma-HCH (lindane)
Gross alpha activity
Gross beta activity
Heptachlor & heptachior epoxide
Hexachlorobenzene
Lead
Mercury
Methoxychlor
Nitrate
Pentachlorophenol
Selenium
Tetrachloroethylene
Trichloroethylene
2,4,6-Trichlorophenol
Guideline Value
0.03 ug/1
0.05 mg/1
10. ug/1a
0.01 ug/1 *
0.005 mg/1
3 ug/1'
0.3 ug/1
30 ug/1 *
0.05 mg/1
0.1 mg/1
100 ug/1 b
lug/1
ioug/ii
0.3 ug/1 •
1.5 mg/1
3 ug/1
0.1 Bq/1
1 Bq/1
0.1 ug/1
0.01 ug/I •
0.05 mg/1
0.001 mg/1
30 ug/1
10 mg/1 (N)
10 ug/1
0.01 mg/1
10 ug/1 •
30 ug/1 •
10 ug/1 *-b
These guideline values were computed from a conservative hypothetical mathematical model which cannotbe experimentally verified and the values should therefore be interpreted differently. Uncertaintiesinvolved may amount to two orders of magnitude (i.e., from 0.1 to 10 times the number).May be detectable by taste and odour at lower concentrations.The value may necessitate adaptation due to local or climatic conditions.
169

consumption, the establishment of these guidelines should not be regarded as implying that the qualityof drinking-water may be degraded to that recommended level. In this context, the specified guidelinevalues have been derived to safeguard health on the basis of lifetime exposure. Short term exposureto higher contaminant levels that might occur following an accident may be tolerated, but should beexamined on a case-by-case basis. In developing the guideline values, WHO took into considerationthe total intake of each contaminant from air, food and water. For the majority of the substancesevaluated, the toxic effect in man is predicted from studies with animals. Furthermore, because of theuncertainties in applying animal data to humans and because of the doubts about the reliability ofextrapolating from high doses to low doses, arbitrary safety factors ranging from 100 to 1000 wereapplied, see Ref. [II.3].
The actual methods of extrapolating data from animal to man deal with exposures to singlesubstances; therefore, effects from exposure to mixtures are not considered. Guideline values are alsoproposed for carcinogenic substances, taking into account appropriately conservative risk factors.
II.3. HEALTH EFFECTS OF VARIOUS POLLUTANTS
It is useful to include short information on the health effects of exposure to variousconcentrations in air of some pollutants. Tables II.8 - II.12 regard health effects of sulphur dioxide andsulphate, sulphur dioxide and particulate matter, nitrogen oxides, carbon monoxide and ozone. TablesII. 13 and II. 14 show the major health effects of selected toxic trace air pollutants, respectively organiccompounds and metals, without specifying the dose absorbed and the exposure time.
TABLE H.8. HEALTH EFFECTS OF SULPHUR DIOXIDE AND SULPHATE [II.4]
SO,ug/m3
30CM00
365
180-250
220
90-100
95
106
NA
Sulphatesug/m5
NA
8-10
6-10
11
9
14
15
13
Concentration
AveragingTime
24 h
24 h
24 h
Annual mean
Annual mean
Annual mean
Annual mean
Annual mean
Health Effect
Increased mortality
Aggravation of symptoms inelderly
Aggravation of asthma
Decreased lung function inchildren
Increased acute lowerrespiratory disease in families
Increased prevalence of chronicbronchitis
Increased acute respiratorydisease in families
Increased respiratory disease-related illness, absence infemale workers
170

TABLE II.9. SYNERGETIC EFFECTS OF SULPHUR DIOXIDE AND SUSPENDEDPARTICULATE MATTER [II.4]
Concentration
SO,ug/m3
500
500-250
100
80
SPMug/m3
500
250
100
80
Averaging Time
daily average
daily average
annual arithmetic mean
annual geometric mean
Adverse Effect
Excess mortality and hospitaladmissions
Deterioration of patients withpulmonary disease
Respiratory symptoms
Visibility and/or humanannoyance effects
TABLE 11.10. HEALTH EFFECTS OF NITROGEN OXIDES [11.4]
Average NO2 ConcentrationHg/m3
300-1130
150-280
100 vs. 80
96 vs. 43
20-70
10
580-1120
150-280
150-280
Health Effects
Decrease in several measures ofpulmonary function as comparedto controls
Borderline decrease in lungfunction test
No difference in variousmeasures of pulmonary function
No difference in variousmeasures of pulmonary function
Twofold excess in acuterespiratory disease compared tounexposed group
Excess in acute respiratorydisease ranging from 11 to 27%
Forty-four percent increase inphysician visits for respiratory,visual, nervous system and skinproblems
Excess in acute respiratorydisease 1-17% in children, 9-33% in adults
Infants exhibited 10-58% excessof acute bronchitis; children 6-9years showed 39-71% excess ofacute bronchitis
Population Studied
Japanese railroad workers
Chattanooga school-children,aged 7-8
Central City vs. suburbanpolicemen in Boston
Seventh Day Adventists in LosAngeles, San Diego
Czechoslovakian children aged7-12
USSR adolescents in chemicaland fertilizer plants
Individuals living within 1 km ofa USSR chemical plant
Families in Chattanooga,Tennessee
Infants and children 6-9 inChattanooga
171

TABLE 11.11. HEALTH EFFECTS OF CARBON MONOXIDE [D.4]
CO concentrationug/m3
0-4 250
4 250-12 750
12 750-21 250
21 250-34 000
34 000-51 000
51 000-76 500
76 500-119 000
119 000-204 000
204 000
204 000
Health Effects
No symptoms
Slight headache, tightness across foreheadshortness of breath with vigorous exertion, dilationof cutaneous blood vessels
Slight to moderate headache and throbbing intemples, shortness of breath with moderate exertion
Decided to severe headache, weakness, dizziness,dimness of vision, nausea, vomiting and collapse,irritable judgement disturbed
Same as previous hem with more possibility ofcollapse and syncope, especially with exertion andincreased respiration and pulse; slight confusion
Fainting, increased respiration and pulse, comawith intermittent convulsions and irregularrespiration
Coma with intermittent convulsions, depressedhearing action and respiration and possible death
Weak pulse and slow respiration, respiratory failureand death
Rapidly fatal
Immediately fatal
172

TABLE 11.12. RELATIONSHIP OF OZONE AND PHOTOCHEMICAL EXPOSURE TO HUMANHEALTH EFFECTS AND RECOMMENDED ALERT AND WARNING SYSTEMLEVELS [II.5]
RecommendedEpisode Levels
Emergency
Red alert
Yellow alert
Watch
Ozone andPhotochemicalsOxidants (ppm)
0.70
0.50
0.37
0.37
0.30
025
0.25
0.10
0.10
0.07
0.065
0.05
0.005
Duration ofExposure
2.0 h
2.75 h
2.0 h
2.75 h
-
2.75 h
1 h
2 h average
-
15-30 min
-
Health Effects
Soreness of upper respiratory tract:tendency to cough while taking deepbreaths; significant increase in breathingdifficulty. These conditions were madeworse by 15 minute of light exercise.
Measurable biochemical changes inblood sera enzyme levels and in redblood cell membrane integrity; somesubjects become physically ill andunable to perform normal jobs forseveral hours.
Impairment of pulmonary function inyoung adults probably due to adecreased lung elastic recoil, increasedairway resistance and small airwayobstruction.
Significant biochemical changes inblood sera enzyme levels and in redblood cell membrane integrity, but lesssevere than at 0.50 ppm; some subjectsbecome physically ill and unable toperform normal jobs for several hours.
Precipitous increase in rates of coughand chest discomfort in young adults.
Greater number of asthma attacks inpatients on days when daily maximaequalled or exceeded 0.25 ppm during a14-week period.
Biochemical changes in blood seraenzyme levels.
Breathing impaired.
Tokyo elementary school children hadsignificantly reduced respiratoryfunction associated with ozone levelsless than 0.1 ppm during a long-termepidemiologic study. Beginning ofheadache without fever in young adults;median age 18.6 years.
Impairment of performances of studentathletes during running competition.
Threshold of respiratory irritation.
Decreased electrical activity of thebrain.
173

TABLE 11.13. HEALTH EFFECTS OF SELECTED TOXIC TRACE AIR POLLUTANTS,ORGANIC COMPOUNDS [II.6]
Pollutant
Acryronitrile (CH:-CH-C-N)
Benzene (CSH6)
Carbon disulfide (CS,)
1,2 Dichloroethane (C,H,CI,)
Formaldehyde (HC HO)
Methylane chloride (CH,CI,)
Polychlorinated bi-phenyls(PCB) (coplanar)
Polychlorinated dibenzo-dioxins furans
Polycyclic Organic Matter(inch benzo(a)pyrene (BaP)
Styrene (C6H5-CH-CH,J
Tetrachloroethylene (C,CI4)
Toluene (C6H5-CH3)
Trichloroethylene (C2HCI-)
Vinyl chloride (CH2-CHCI)
Major Health Effects
Dermatitis; hematological changes; headaches;irritation of eyes, nose and throat; lung cancer.
Leukemia; neurotoxic symptoms; bone marrowinjury incl. anaemia, chromosome aberrations.
Neurologic and psychiatric symptoms, incl.irritability and anger; gastro-intestinal troubles;sexual interferences.
Damage to lungs, liver and kidneys; heart rhythmdisturbances; effects on central nervous systems,incl. dizziness; animal mutagen and carcinogen.
Chromosome aberrations; irritation of eyes, noseand throat; dermatitis; respiratory tract infections inchildren.
Nervous system disturbances.
Spontaneous abortions; congenital birth defects;bioaccumulation in food chains.
Birth defects; skin disorders; liver damage;suppression of the immune system.
Respiratory tract and lung cancers; skin cancers.
Central nervous system depression: respiratory tractirritations; chromosome aberrations; cancers in thelymphatic and hematopoietic tissues.
Kidney and genital cancers; iymphosarcoma; lung,cervical and skin cancers; liver dysfunction; effectson central nervous system.
Dysfunction of the central nervous system; eyeirritation.
Impairment of psychomotoric functions; skin andeye irritation; injury to liver and kidneys; urinarytract tumors and lymphomas.
Painful vasospastic disorders of the hands;dizziness and loss of consciousness; increased riskof malformations, particularly of the centralnervous systems; severe liver disease; liver cancer:cancers of the brain and central nervous system;malignancies of the lymphatic and hematopoieticsystem.
174
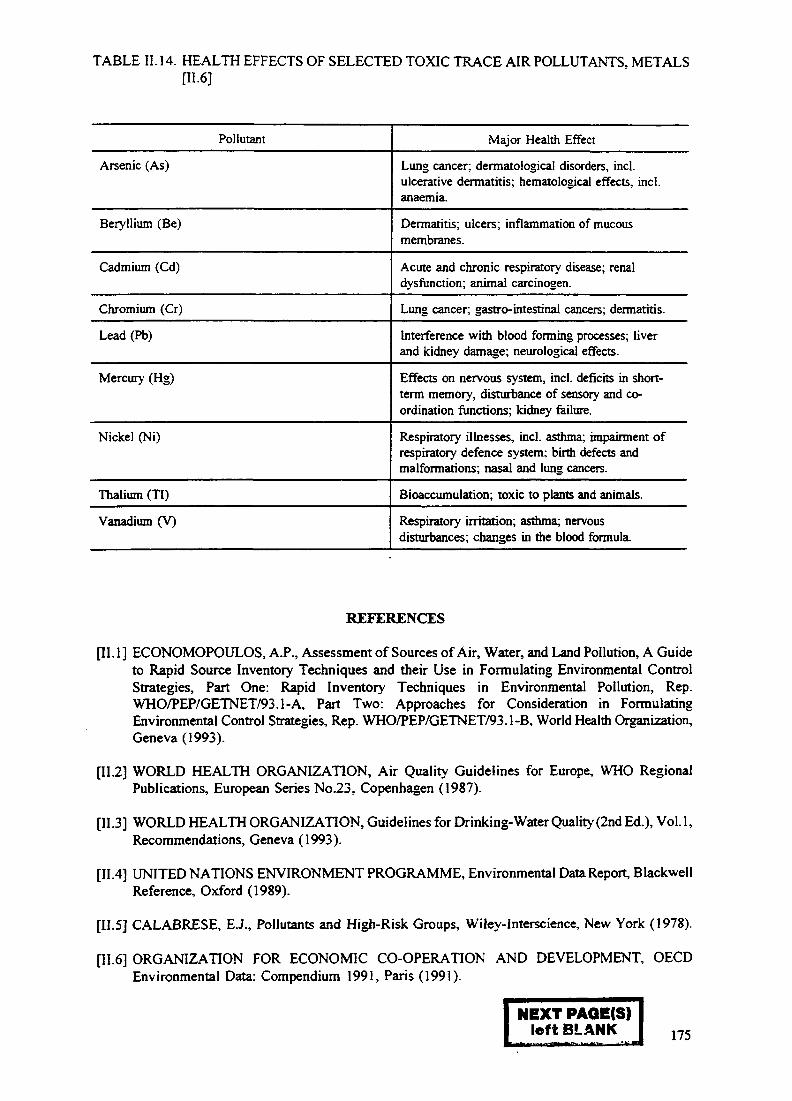
TABLE 11.14. HEALTH EFFECTS OF SELECTED TOXIC TRACE AIR POLLUTANTS, METALS[II.6]
Pollutant
Arsenic (As)
Beryllium (Be)
Cadmium (Cd)
Chromium (Cr)
Lead (Pb)
Mercury (Hg)
Nickel (Ni)
Thalium (TI)
Vanadium (V)
Major Health Effect
Lung cancer; dermatological disorders, incl.ulcerative dermatitis; hematological effects, incl.anaemia.
Dermatitis; ulcers; inflammation of mucousmembranes.
Acute and chronic respiratory disease; renaldysfunction; animal carcinogen.
Lung cancer; gastro-intestinal cancers; dermatitis.
Interference with blood forming processes; liverand kidney damage; neurological effects.
Effects on nervous system, incl. deficits in short-term memory, disturbance of sensory and co-ordination functions; kidney failure.
Respiratory illnesses, incl. asthma; impairment ofrespiratory defence system; birth defects andmalformations; nasal and lung cancers.
Bioaccumulation; toxic to plants and animals.
Respiratory irritation; asthma; nervousdisturbances; changes in the blood formula.
REFERENCES
[II. I] ECONOMOPOULOS, A.P., Assessment of Sources of Air, Water, and Land Pollution, A Guideto Rapid Source Inventory Techniques and their Use in Formulating Environmental ControlStrategies, Part One: Rapid Inventory Techniques in Environmental Pollution, Rep.WHO/PEP/GETNET/93.1-A, Part Two: Approaches for Consideration in FormulatingEnvironmental Control Strategies, Rep. WHO/PEP/GETNET/93.1-B, World Health Organization,Geneva (1993).
[II.2] WORLD HEALTH ORGANIZATION, Air Quality Guidelines for Europe, WHO RegionalPublications, European Series No.23, Copenhagen (1987).
[11.3] WORLD HEALTH ORGANIZATION, Guidelines for Drinking-Water Quality (2nd Ed.), Vol. 1,Recommendations, Geneva (1993).
[II.4] UNITED NATIONS ENVIRONMENT PROGRAMME, Environmental Data Report, BlackwellReference, Oxford (1989).
[II.5] CALABRESE, E.J., Pollutants and High-Risk Groups, Wiley-Interscience, New York (1978).
[II.6] ORGANIZATION FOR ECONOMIC CO-OPERATION AND DEVELOPMENT, OECDEnvironmental Data: Compendium 1991, Paris (1991).
NEXT PAQE(S)left BLANK I 175

Appendix i n
STEPS AND TECHNIQUES FOR HAZARD IDENTIFICATION
This appendix provides a brief description of some of the most frequently used methods insupport of hazard identification.
III.l. METHODS FOR HAZARD IDENTIFICATION
Process/Safety Checklists: checklists are used to identify hazards and examine compliances ofotherwise standard procedures. Checklists are limited to the experience base of the checklistauthors). Qualitative results from this hazard evaluation procedure vary with the specificsituation, including the knowledge of the system or plant; they lead to a "yes-or-no" decisionabout compliances with standard procedures.
• Safety Audit/Review: a walk-through on-site inspection can vary from an informal routinefunction that is mainly visual with emphasis on housekeeping to a formal comprehensiveexamination by a team with the appropriate background and responsibilities. When a compre-hensive review is undertaken it is referred to as a safety audit/review, a process review or a lossprevention review. In addition to providing an overall assessment of the safety of the plant, bothoperationally and organizationally, such reviews intend to identify plant conditions or operatingprocedures that could lead to an accident and significant loss of life or property. The reviewincludes systematic on-site examination of process plants, equipment and safety systems, as wellas interviews with different people associated with plant operations including: operators,maintenance staff, engineers, management, safety and environmental staff and personnel. Anexamination of accident records, maintenance procedures, emergency plans, etc. is alsoundertaken.
Various hazard evaluation techniques are used including checklists and "What if?" questions.
• Relative Ranking (Dow and Mond Indices): the method assigns (i) penalties to processmaterials and conditions that can contribute to an accident and (ii) credits based on plant featuresthat can mitigate the effects of an accident An index for a relative ranking of the plant risk isderived from the combined penalties and credits. The method gives also qualitative informationon equipment exposed to possible damage through accident propagation. The Dow Index hasrecently been extended to apply to toxic risks.
• Preliminary Hazard Analysis: the method is designed to recognize early hazards and focuseson hazardous materials and major plant elements since only few details on the plant design andpossibly no information on the procedures would be available. The method consists offormulating a list of hazards related to the available design details with recommendations toreduce or eliminate hazards in the subsequent plant design phase. The results are qualitative,with no numerical estimation or prioritization.
• Hazard and Operability Studies: a HAZOP study is a systematic technique for identifyingpotential hazards and operability problems. It involves essentially a multi-disciplinary teamwhich methodically "brainstorms" the plant design focusing on deviations from the designintention. The effectiveness of the hazard identification process relates strongly to the interactionof the team and the individual diverse backgrounds of the personnel involved. The method aimsto stimulate reactivity and generate ideas. The ultimate objectives are to facilitate smooth, safeand prompt plant start up; to minimize extensive last minute modifications and ultimately toensure trouble-free long term operation.
177

HAZOP studies are systematic techniques and were developed using a multi-disciplinary teamfor the evaluation of hazards and plant operability. The HAZOP technique is based on theassumptions that the plant will:
- Perform as designed in the absence of unintended events which will affect the plantbehaviour;
- Be managed in a competent manner;- Be operated and maintained in accordance with good practice and in line with the design intent;- Protective systems will be tested regularly and be kept in good working order.
The HAZOP procedure was originally described in Ref [III.l] but a more up-to-date description canbe found in Ref. [III.2]. In simple terms, the HAZOP procedure gives a full description of the processand systematically questions every part of it to discover how deviations from the design intent canoccur. The consequences of such deviations are then determined and if significant are reviewed andremedial action is either recommended or flagged for further study.
AH modes of plant operation must be considered:
- Normal operation;- Reduced throughput operation;- Routine start-up;- Routine shutdown;- Emergency shutdown;
Commissioning.
The standard and level of penetration of a HAZOP study is very difficult to demonstrate conclusivelyto a non-participant because the results depend more on the experiences and attitudes of theparticipants and on the leadership style adopted than on the procedure itself.
For an effective HAZOP study, the participants should be selected to provide necessary experience,knowledge, skill and authority in the following areas:
Process design;Instrument and control design;
• National and corporate engineering standards;• Plant operation;
Plant maintenance;Design and construction management;
• Project management.
• "What I f Checklists: the main purpose of the method is to consider carefully the result ofunexpected events that would produce an adverse consequence by a detailed examination ofpossible deviations from the design, construction, modification, or operating intent. It identifiesthe hazards, consequences, and perhaps potential methods for risk reduction.
• Failure Mode and Effects Analysis (FMEA): is a tabulation of die system/plant equipment,it's failure modes as a description of how equipment fails (open, closed, on, off, leaks etc.) andthe effect of failure modes (e.g. system response of an accident resulting from equipmentfailure). FMEA requires the knowledge of a system/plant function; it does not apply to acombination of equipment failures that leads to accidents. The result of using the method isqualitative and consists in a systematic reference listing of system/plant equipment, failuremodes, and it's effects. The method is especially useful in the analysis of very critical processesbut can be extremely time consuming if applied on too broad a scale.
178

* Master Logic Diagrams: this is a logic diagram similar to a fault tree but without the formalboolean structure that characterizes the latter. One starts with the general undesirable event (e.g.release of toxic material to the environment) and proceeds in a deductive "top-down" approachto define causes of the events identified in the previous level. Events at a particular level willfind their causative factors in events at the immediate lower level. A precise connection with an"AND" or "OR" logic is not, however, necessary. Eventually at the lowest level of this tree therewill be events that have the potential to trigger chains of events leading to the top undesirableevent.
A comparative description of these methods is summarized in Table III. 1.
III.2. GUIDANCE ON IMPLEMENTATION
The appropriateness and relevance of any one particular technique of hazard identification largelydepends on the purpose for which the risk assessment is being undertaken. The primary principle isto first examine the plant or operations from the broadest viewpoint possible and systematicallyidentify possible hazards. Elaborate techniques as a primary tool may cause problems and can resultin missing some obvious hazards.
The objectives of the analysis must be clearly established at an early stage. It may also benecessary to adopt more than one technique depending on the level of detail required and whether thefacility is a new proposed installation or an existing operation. For example, a preliminary hazardanalysis or a generalized 'What if analysis may be appropriate for a proposed new facility to assistin establishing a suitable location and when only preliminary design information is available. Thiscould be followed by a detailed HAZOP at the design stage and then periodic safety audits andreviews at the operational stage. For an existing plant HAZOP may be limited to when modificationsare contemplated with safety audits and fault and event tree analysis undertaken as part of evaluatingsafety measures. A guidance framework of the most appropriate techniques for various situations isgiven in Table III.2.
The application of hazard identification methods can be both time consuming and expensive sothat some sections of the plant will receive a more detailed study than others. The depth of studydepends upon the appraisal of the inherent hazards from the various sections of the plant. In the caseof a highly sensitive reactor system the hazard identification study may be very detailed and oftensupplemented by a reliability analysis of the control system using a method such as fault tree analysis.On the other hand a water treatment plant might only be reviewed for operability and personnelprotection. Therefore, the depth and scope of a study is determined by the organizations' perceptionof the hazards as a process and their appraisal of the need to control them.
In stressing the need to identify hazards as early as possible in the development of a process,and especially at the process design stage, the impression may have been given that hazardidentification ends when the design specification has been approved. In fact, approval of design meansonly that "at the time of the study the study team believed that, provided the plant is constructed andoperated in accordance with their recommendations, the plant will be acceptably safe". The firstuncontrolled change during construction or the first unapproved modification during operation negatesthis approval. Consequently hazard identification is a continuing ingredient for safe operation andshould be applied, sometimes in a very simple form, to control any changes from the originalintentions of the designers.
179

TABLE III. 1. TECHNIQUES OF HAZARD IDENTIFICATION
Techniques of Hazard Identification
Process/System Checklist
Safety Audit/Review
Relative Ranking (Dow and MondHazard Indices)
General Description
Standard list to indicate:type of hazards for various plant itemsand operation; compliance or otherwisewith codes and standards
Walk through the plant recordingpossible hazards, nature and conditionsof plant equipment. Interview operatorsand plant managers. Examinemaintenance procedures, organizationalsafety systems, emergency procedures
Use standard indices charts to assignpenalties and credits based on plantfeatures and safety controls. These arecombined to derive an index that is arelative ranking of the plant risk
Data and Requirements
Need knowledge of system orplant and its operationsManual of operating proceduresOne or more experienced personsshould prepare the checklist. Anexperienced manager/engineershould review the checklistresults
For a complete review, teamneeds access to p lan tdescr ipt ions, p ip ing andinstrumentat ion diagrams,f l o w c h a r t s , m o n i t o r i n gprocedures and all related safetydocumentationDepending on scale of operations,2-5 personnel may be required toundertake the audit. The auditteam should preferably beindependent from local operationsmanagement
Plot plansUnderstanding of process flowsNature/type of materials handledand processed and of siteinventoriesProcess and material data sheetsExperienced engineer withsupport from senior plantoperators would be most suited toundertake the identificationprocess
Output
Qualitative results usually in the form of'yes-no' decision about compliance withstandards/codes
Safety audit report which identifiesnature/type of hazards, outlining(qualitatively) nature and extent ofimpact and where appropriaterecommend safety measures
Relative ranking of plant process unitsbased on degree of risk. Qualitativeevaluation of people and equipment riskexposure

TABLE III.1. (Cont.)
Techniques of Hazard Identification
Preliminary Hazard Analysis
Failure Mode and Effects Analysis(FMEA)
Hazard Operability(HAZOP)
"What If?" Analysis
General Description
Examine preliminary design todetermine hazards related to materialsand processes, components andinterfaces as well as organizationalsafety
List all conceivable failuremalfunctions; describe intermediate andultimate effects of failure on otherequipment or rest of system; rank eachfailure mode and its effect by failuremodes severityInclude worst case consequences ofsingle point failure
A systematic review of the plant design,section by section, using a series ofguide words to identify possibledeviations and establish necessary actionto cope with such deviations
Systematic examination of a process ofoperation, using "what i f prompt tosuggest an initiating event, a failurefrom which an undesirable eventsequence could occur
Data and Requirements
Preliminary design specificationsand information on nature ofprocesses and of processconditionsOne to two experiencedpersonnel (depending on scale)
Knowledge of equipment andplant/system functionPlot plants, piping diagrams, flowchartsListing of plant items andinventoriesIdeally two analysts should beinvolved
Piping and instrumentation andprocess flow sheets and diagrams
- HAZOP relies on brainstorminga m o n g s t t e a m o fdesign/operational personnel
Process flow sheets, pilot plans,PIDS
- two qualified analysts A nidentification of deviations withtheir consequences andrecommended actions
Output
Qualitative listing of potential incidentsand hazards. Word diagrams as a usefulpresentation tool
Systematic list of failure modes andpotential effects
A comprehensive identification ofpossible deviations, their consequences,causes and suggested actions
An identification of deviations withtheir consequences and recommendedactions

TABLE III.2. GUIDANCE TABLE ON IMPLEMENTATION OF HAZARD IDENTIFICATIONTECHNIQUES
Process SystemChecklist
SafetyAudit/Review
Dow and MondHazard Indices
Preliminary HazardAnalysis
Hazard Opera-bility Studies
'What ifChecklist
Failure Modeand EffectsAnalysis
Fault TreeAnalysis
Event TreeAnalysis
Cause-ConsequenceAnalysis
HumanReliabilityAnalysis
A- Best suited
Site selection/early designstage
B
C
A
A
B
A
C
C
c
c
c
B- Could be used
Design stageof new plants
B
C
B
C
A
B
B
A
A
B
A
C- last suited(not advised)
Operationalstage of newand existing plants
A
A
B
C
B
B
A
A
A
A
A
Modificationsto existingplants
B
C
C
B
A
A
B
A
A
B
A
REFERENCES
111.1. CHEMICAL INDUSTRIES ASSOCIATION, A Guide to Hazard and Operability Studies,London (1977).
111.2. AMERICAN INSTITUTE OF CHEMICAL ENGINEERS, Guidelines for Chemical ProcessQuantitative Risk Analysis, Center for Chemical Process Safety, New York (1989).
182

Appendix IV
MODELS FOR MAJOR HAZARD INCIDENTS
IV.l. PHYSICAL MODELS
IV.1.1. Release or Discharge Rates* » * •
The objective of this section is to review the release or discharge models currently used inconsequence analysis. Most accidents are the result of a hazardous material escaping from itscontainment. This may be from a crack or hole in a vessel or pipework, it may be from catastrophicfailure of a pipe or vessel, it may be from a wrongly opened valve or it may be from an emergencyrelief system. These leaks could be in the form of a gas, a liquid or a two-phase flashing liquid-gasmixture. It is essential at this stage to estimate the total amount of material involved. This may begreater or lower than the amount of material stored in any single vessel or pipework system due tointerconnection with other vessels or pipework systems and also due to the relative position of the leakwithin the system.
Vessels may catastrophically fail or leak from a crack, a hole or at a connection to pipelines.The behaviour of the contents of the vessel depends on its initial conditions immediately before release- the main factors being the physical properties of the material and the temperature and pressure withinthe vessel. In the case of flammable liquefied gases stored under pressure, the contents of the vesselwhich has catastrophically failed will rapidly flash off and form a vapour cloud, if unignited. If asource of ignition is found, then a large fireball will be formed. Other materials in liquid form,including many stored at reduced temperatures, will spill onto the ground below the vessel. The liquidwill spread out to form a pool which will be confined in the event of the vessel being bunded (havinga confining barrier around it). This pool will evaporate as a result of heat supplied from the air andthe ground wind stream and form a vapour which will be dispersed in the atmosphere. Holes andcracks will have discharge rates similar to pipe breaks of similar sizes. Depending on the position ofthe leak relative to the liquid level within the system, the discharge can be a vapour (discharge alwaysabove the liquid level) or a liquid (discharge always below the liquid level). However, a leak locatedbetween these two extremes can experience a range of conditions going from liquid to two-phase tovapour with the flowrate varying under each of these conditions as the pressure and static level withinthe tank varies Fig. IV.l.
These effects can be summarized as follows:
(a) Gas/Vapour discharge results from:
- a hole in equipment (pipe, vessel, etc) containing gas under pressure;- a relief valve discharge of vapour only;- evaporation or boil-off from a liquid pool;- generation of toxic combustion products in fires.
(b) Two-phase discharge results from:
- a hole in a pressurized storage vessel containing a liquid above its normal boiling point;
- a relief valve discharge under certain conditions (possibly a foaming liquid, a runaway reactionor because the vessel it relieves has been moved and the valve is no longer at the top of thevessel).
183

(c) Liquid discharge results from:
- holes under liquid head in atmospheric storage tanks or other atmospheric pressure vessels orpipes;
- holes in vessels or pipes containing pressurized liquids below their normal boiling point.
There are a number of equations and models which deal with the release of liquids, two phasemixtures and vapours from various leak regimes. The most important are detailed in Ref. [IV. 1] which
Small hole in liquid space Intermediate size hole inliquid space
Y////////A1
Failure in liquid pipe Small hole in gasstorage vessel
Failure in gas pipe Small hole in vapour space
Large hole in vapour space
r-V////77Z////Z*
Intermediate size hole invapour space
• I fY/77777/77/)
FIG. IV. 1. Location of discharge positions, from Ref. [IV.2].
184

lists example base cases for a range of hole sizes and Refs [IV.2, IV.3, IV.4, IV.5] Relief valvedischarges can be determined by reference to the AICheE/DIERS work in Refs [IV.6, IV.7].
Fig. IV.2 shows some curves which may be used to make an approximate estimate of the releaserates of propane and butane from apertures of different sizes.
100
Co = 0.6 for holes= 0.75 for guillotine breaks
RELEASE RATES FOR
PROPANE AND BDTANE
C_ = DISCHARGED COEFFICIENT
1 1 1 1
100Equivalent diameter of aperture (mm)
1000
1000
f 100
2S=
2 10
i
/
v //:: //
/ /
C o =0.6forhotes= O.7~5 for guillotine breaks
/ •
Propane • y Butane
/ RELEASE RATES FOR
/ TWO-PHASE FLOW OF
PROPANE AND BUTANE
CQ = DISCHARGECOfctiXCLfcNX
10 100Equivalent diameter of aperture (mm)
1000
FIG. IV.2. Release rates for propane and butane, Ref. [W.8J
185

There are a few computer codes which deal with discharge-rate calculations these include thefollowing:
PHAST (Technica, UK/USA)SUPERATOMS (AD Little, USA)RAMSKILL (SRD, UK)CHARM (Radian Corporation, USA)
A few integrated computer packages for consequence analysis also include discharge calculationrate modules. In many cases the specific and detailed nature of the system under study may requiremanual calculations to be carried out. In the following, simple models are illustrated which permit theuser to perform first hand calculations of the source term.
(i) Gas discharge
The following, taken from Ref. (TV.8], describes the gas flowrate through openings in apressurized reservoir (large vessel or large pipeline). The gas is assumed to behave as an ideal gas andthe transformation is assumed to be a reversible adiabatic expansion. Two flow regimes are possibledepending on the value of the critical pressure ratio:
where: p = absolute upstream pressure (N/nr);pa = absolute downstream pressure (N/nr);F = C,/Cv = gas specific heat ratio.
Depending on whether the ratio of the actual upstream and downstream pressures is lower orgreater than r^,, the flow regime is subsonic or sonic (chocked). The gas flow is given by:
G =v
where: Gv = gas discharge rate (kg/s);Cd = discharge coefficient;A = hole area (nr) ;c = sonic velocity of gas at temperature T, c = (RT/M)I/2;T = absolute temperature in the reservoir (K);M = molecular weight of gas (kg-mol);R = gas constant;Y = flow factor.
The flow factor is dependent on the flow regime:
subsonic flow2T2
Y = { - ipjp?" [ 1-(P,/P)(r-Iyr ] }>Q for (p/Pa) < rm
r-i
sonic flow2
Y = r { - - } ( r + ^ ( r - " for (p/Pl) >r+i
186

(ii) Liquid discharge
Using Bernoulli's equation, the liquid flowrate can be calculated with:
G, = CdA6[2(p - pa)/d+2gh]1'2
where: G, = liquid discharge rate (kg/s);Cd = discharge coefficient;A = hole area (nr) ;6 = liquid density (kg/m3);p = storage pressure, absolute (N/m2);pa = ambient pressure (N/m2);g = gravity constant (m/s2);h = liquid head above hole (m).
For fully turbulent flow at the discharge from small sharp edged orifices Cd assumes a value of0.6 - 0.64.
If the liquid is superheated and if the diameter of the break is sufficiently small compared to thediameter of the pipeline or the dimensions of the tank (ratio of lengths lower than 12) the flow isassumed to remain liquid while it is escaping through the break. Immediately after, it flashes to vapourfor the fraction:
Cp, ( T , - T s )fv =
where: Cp, = specific heat of liquid (kJ/kg/K);T, = liquid temperature (K);Ts = saturation temperature at atmospheric pressure (K);Hlv = enthalpy of evaporation at atmospheric pressure (kJ/kg).
Non flashing liquid is entrained in the vapour phase as aerosol. As a first approximation, it canbe assumed that all the liquid is entrained if fv 0.2; none, of course, if fv = 0; for values included inthis range, a linear relationship could be considered.
A major area of effort has been devoted to the prediction of aerosol formation of non-flashingliquids entrained in the vapour phase of a release. Simple estimates have been provided in Ref. [IV.9]where doubling the flash fraction is suggested and more recently in Ref. [IV. 10] where 5 times theflash fraction is suggested. Thus if fv > 0.2 then all the liquid is entrained and none if fv=0, with linearinterpolation used in between. Better estimates of entrainment can be calculated based on surfacetension, density and other physical parameters characterizing the release. Subsequent rainout cangreatly reduce the size of the initial vapour cloud and this can be estimated based on predicted dropletsize.
(iii) Two-phase discharge
If a superheated liquid is discharged through a hole which has the equivalent diameter equal orgreater than one tenth of the length of the pipe or the dimensions of the tank, or if the discharge isfrom the vapour space of a vessel containing a viscous or foamy volatile liquid, a two-phase criticalflow develops. An empirical method reported in the World Bank Manual, Ref. [IV. 11], is explainedin the following.
187

It is assumed that the two phases form a homogeneous mixture in equilibrium; it is assumed alsothat the ratio of the critical pressure pc at the throat to the upstream pressure p for water systems (0.55)can be applied to other substances.
The fraction of liquid flashing at pc is:
Cp, (T, - T Jf = _
H|V.C
where : Cp, = specific heat of liquid (kJ /kg/K) ;T, = liquid temperature (K) ;Tsc = saturation temperature a t pressure p c (K);H,v c = enthalpy of evaporation a t pressure pc (kJ/kg).
The mean specific volume vm of the two-phase mixture is:
where: v. = specific volume of saturated vapour (m3/kg);v, = specific volume of saturated liquid (nrVkg);
The discharge rate of the mixture is:
r
where : Cd = discharge coefficient (0 .8 recommended) ;Ar = effective hole area (m 2 ) ;p = upstream pressure (N/m 2 ) ;pc = critical pressure (N/m 2 ) .
The entrainment o f liquid can be es t imated as in the case o f flashing immediately following thedischarge (see above).
Discussion:
Gas and liquid phase discharge calculation methods are well founded and are readily availablefrom many standard references. However, many real releases of pressurized liquids will give rise totwo-phase discharges which must be taken into account. A simplified approximate method has beendeveloped in Ref. [IV. 12].
IV.1.2. Airborne Dispersion Models
One of the most important factors governing dispersion of a hazardous gas or vapour closelyfollowing release is the density of that gas or vapour. It is convenient therefore to classify cloudsaccording to whether they are lighter than air, they have the same density of air or are denser than air(positively, neutral or negatively buoyant, respectively). Positively (lighter than air) buoyant cloudstend to naturally rise and in most circumstances this reduces the harm they can do, although hazardoussituations can exist close to low-level releases. However, dense clouds can stay at a low level for aconsiderable distance downwind and can therefore pose a much greater hazard (indeed under relativelycalm conditions large releases of dense gases can travel upwind whilst under the influence ofgravitational forces such as slumping of large releases or due to topographical features. Unfortunately,many of the hazardous substances met in large quantities are either denser than air (e.g. LPG orchlorine) or behave as though they are denser than air due to their storage temperature which leadsto aerosol formation and 'dense' effects (e.g. LNG or ammonia).
188

Dispersion models require the background meteorological regime to be specified. This willusually be in the form of a wind-rose (wind speed and direction probabilities) and atmospheric stabilityinformation (A-unstable, D-neutral, F-stable). If no data are available, it is typical to assume a uniformwind distribution and two weather classes D5m/s and F2m/s.
Meteorological data needs to be of adequate duration to be representative, usually one year orgreater is recommended. Such data is readily available at low cost from the UK Met office or the USANOAA for a large number of airports worldwide. Wind rose data can be highly variable over relativelyshort distances especially in hilly terrain and thus care is required where the met station is wellseparated from the site under review. Often, however, there will be no other reasonable alternative.
(i) Evaporating pool
Liquid spilled from a containment forms a pool which would then evaporate and becomedispersed to the atmosphere. Vapour generation rates from evaporating pools must be calculated beforeconsidering methods of estimating the dispersion of gases and vapours. A liquefied gas can form aliquid pool if it escapes from refrigerated storage. Other liquids which boil above ambient temperaturescan form slowly evaporating pools. The vaporization rate of a pool is the product of the average localvaporization rate and the pool area. However the local vaporization rate is in itself largely dependentupon the pool area. The final shape and size of the pool will be a function of the quality of materialinvolved, the nature of the surface upon which it was spilt and whether or not the pool size is confinedby a physical barrier such as a bund.
Pool vaporization rates therefore depend on a number of variables, the principal ones being:
• the spread of liquid on land or water;heat and mass transfer from the atmosphere;heat transfer to or from the surface upon which the material has been spilt.
The way pools spread is also a very complex problem. This is very much dependent on thenature and type of surface involved and is difficult to model in a generic manner.
The sheer diversity and complexity of the physical phenomena (heat and mass transfer effects)which conspire to determine pool vaporization rates have made numerical solutions to the problemnecessary. Hand calculation methods can be used as shown in [Ref. IV.3], but accurate estimates needsophisticated computer models. The most recent and thorough of these is GASP in Ref. [IV. 13]. Thiscode makes predictions for a wide range of continuous and instantaneous liquid spills on land andwater. Because the physical properties of the substances involved are so important in determining theevaporation rate, the code has been coupled to a databank containing properties of a number ofcommon hazardous substances. Other available computer codes include those in Refs [IV. 14, IV.15].
(ii) Neutral and positively buoyant gases
Neutral and positively buoyant models are used to predict concentration and time profiles offlammable or toxic material downwind of a source. These models are almost always based on theconcept of Gaussian dispersion. The models attempt to determine the concentration of a hazardousgaseous material downwind of a release (see section 4.4.2). Descriptions of neutral or positivelybuoyant gases and the way in which they disperse are given in Refs [IV. 16, IV. 17] and in the TNOYellow Book, Ref. [IV.18].
Hand calculations to estimate the dispersion of neutral or positively buoyant clouds are stillcommon in chemical process plant risk assessment but most models do use computerized techniques.A good review of these models is given in Ref. [IV.19].
A brief description of Gaussian dispersion models has been already reported in section 4.4.2.
189

(iii) Negatively buoyant gases (dense gas dispersion)
The importance of dense gas dispersion has been recognized for some time. Attempts have beenmade to develop comprehensive computer models and a number of field experiments have been carriedout which confirm the fact that dense gases behave in a markedly different manner than neutral orpositively buoyant gases. Probably the largest and most comprehensive field experiments were thosecarried out under the supervision of the UK Health and Safety Executive (HSE) at Thorney Island inthe early 1980's, Refs [IV.20, IV.21]. These were co-ordinated by the HSE and funded by a widerange of contributors from a number of different countries.
There are a number of mechanisms by which a dense gas or vapour can disperse in theatmosphere and become progressively diluted as it mixes with air. These mechanisms depend mainlyon the buoyancy and momentum of the material involved. Momentum forces are associated with theearly stages of release from pressurized equipment although gravitational forces can providemomentum following the 'slumping' stages of large instantaneous releases. Whilst consideration ofthe momentum driven period of dispersion may satisfy relatively small releases of flammable gaseswhich are diluted below the lower flammable limit during the momentum phase alone, in many othersituations dispersion beyond the transition to the buoyant plume dispersion must be considered. Thepoint at which this transition occurs depends on the momentum and buoyancy forces acting on thedispersing material, although in certain situations gravity effects and collision with solid surfaces(buildings, trees, very rough ground, etc) may become important before the momentum of the jetbecomes negligible. It is here not possible to discuss in detail the mathematics which describe thisdispersion process. The solutions of the equations describing the gravity-slumping of a heavier-than-airgas cloud, the simultaneous movement in the wind and the entrainment of air into the cloud, togetherwith heat effects, is sufficiently complex to require computer modelling. Perhaps the mostcomprehensive review of vapour cloud dispersion models is that given in Ref. [IV. 19]. A number ofcodes are available, with some dealing only with instantaneous releases, others only with continuousreleases, whilst others are capable of dealing with both situations. At the moment, few codes canhandle complex time-varying situations, although many codes are under development. These codesmodel the transition from a heavier-than-air cloud to a neutrally buoyant one, as the cloud dilutes andequilibrates with the temperature of the surrounding air. Therefore, they can also be used for neutrallybuoyant releases, although the equations for this are generally simpler and, as stated earlier, can be,and often are, calculated by hand. Publications which describe methods of calculating the dispersionof dense gas in the atmosphere are numerous.
Dense gas dispersion computer codes which have been made available in substantial numbersinclude the following:
DOW INDEX MODEL FOR TOXICSCHARM (Radian Corporation, USA)DEGADIS (US Coastguard)HEGADAS (SHELL)DENZ/CRUNCH (SRD, UK)HASTE (ERT, USA)SLAB (Lawrence-Livermore National Laboratory, USA)PHAST (Technica, UK)TRACE (SAFER CORPORATION, USA)DRIFT (SRD, UK)SUPERATOMS (AD Little)
The USA has completed, and the CEC are proceeding with overall comparative model validation.It must be appreciated by now that the subject of dense gas dispersion is a very specialized, technicalone, and because of this it is important that calculations of the hazard ranges due to the dispersal ofdense gases are carried out by those who have more than just a passing acquaintance with the topic.Even with the modern tendency to make codes easier and more attractive to use, caution must always
190

be taken to ensure that the situations presented to the computer model are realistic. There is no easyshort-cut to carrying out dense gas dispersion calculations. For a few of the more common hazardousmaterials encountered in everyday life there are curves, derived from the use of modern codes, whichcalculate gas concentration as a function of distance and time for a range of release scenarios.Examples of these for flammable gases and chlorine can be found in Chapters 8 and 14 of Ref. [IV. 1]and in Ref. [IV.22]. Figs IV.3 and IV.4 show curves for the dispersion of a continuous release ofpropane or butane as a function of distance to lower flammability limit against the leak flow rate fortwo weather stability classes (D and F) and related typical wind velocities (5m/s and 2 m/s,respectively). These curves were derived with the use of the SRD computer code CRUNCH, Ref.[IV.23].
Discussion
The strength of most of the dense gas dispersion models is their inclusion of the importantmechanisms of gravity slumping, air entrainment and heat transfer processes. Their main weakness isthe difficulties encountered with estimating the source term and the fact that a degree of skill isrequired by the user.
FV.13. Aquatic Dispersion Models
Environmental impact of accidental spills of hazardous liquids is not well worked out except forcertain special cases (e.g. oil spills in coastal locations) which have received special attention.
In other cases a simple approach may be all that is possible. This must address the source term(spill size and immediate containment) and then translate this into the aquatic environment. Themethods discussed in Section 4.4.3. for continuous emissions will be a good starting point.
IV.1.4. Fires
Three separate categories of fire can be considered: pool fires, jet fires and the so-calledfireballs.
1000
E
Ei 10081
I
10
Dispersion range for a
continuous release of
propane vapour
_L
F2
S©
10
Leak flow rate (kg/s)
FIG. IV.3. Dispersion range for propane, Ref. [IV.23]
100
191

1UUU
J
y lim
itim
ablll
t
M 100
low
er
o4-*
gCO
DIs
m
^ ^ Dispersion range for
/ a continuous release
of Jbutane vapour
CD
s
10Leak flow rate (kg/s)
100
F/G. /F.4 Dispersion range for butane, Ref. [IV.23]
(i) Pool fire: it occurs when an accumulation of flammable liquid as a pool on the ground or on adifferent liquid surface is ignited. A steadily burning fire is rapidly achieved as the fuel vapour tosustain the fire is provided by evaporation of the liquid by heat from the flames. For liquefied gases,significant heat transfer from the surface on which the pool is formed usually contributes to thevaporization of the fuel. The rate of consumption of fuel is a function of the properties of the fuel suchas latent heat, heat of combustion etc, which results in typical rates of regression of the pool depth of6-13 mm/minutes.
There are three methods of calculating the thermal radiation fluxes from a pool fire.These are the point source method, the solid flame method and the volume emitter method.
In the point source method it is assumed that the heat is radiated from the vertical axis at thecentre of the pool. The radiation flux is given by the formula:
J.R2
where: 1 = incident radiation per unit area; (ignoring transmissivity)R = distance from the sourcef = the fraction of the heat of combustion assumed to radiate in all directions from the
notional centrepoint source (often around 0.3)Hc = the heat of combustion per unit time
The solid flame method has the advantage over the simple point source method as it takesaccount of the actual shape and volume of the flame, although it is reduced to a simple geometricalshape for ease of manipulation.
192

It is however a simplification to assume that a flame emits thermal radiation solely from itssurface. The volume emitter method takes account of the fact that the sources of radiation are hotmolecules and particles distributed throughout the whole volume of the flame. The radiation isdetermined by factors like the path length, concentration and temperature of the molecules andparticles. However, it is extremely difficult to do; this is the reason why the normal procedure is touse the solid flame method.
The portion of the thermal radiation from a source which is incident upon a nearby target isgiven by the relationship:
where: T = atmospheric transmissivity (a function of the path length and the physicalcharacteristics of the atmosphere) Ref. [IV.24];
Q, = thermal radiation received at distance d (W/m2);Qs = total heat radiated (W);FB = geometrical view factor (or form factor or configuration factor).
The geometrical view factor is the fraction of the total radiation from one surface which isincident upon the other in its line of sight. The calculation can be difficult but fortunately tables areavailable which give the view factors for a large variety of shapes and orientations, see Refs [IV. 18,IV.25, IV.26, IV.27].
Pool fires have been studied for many years and the empirical equations used are well validated.The treatment of smoky flames is still difficult, also flame impingement effects are not simulated.
(ii) Jet fire: Jet fire modelling has received considerable experimental attention in recent years, mainlyby Shell, due to escalation problems on offshore oil platforms. Useful references include [IV.28, IV.29,IV.30, IV.31 ]. The API method is relatively simple. An example of its application to an LPG jet flameis given in Figs IV.5 and IV.6. which show the flame length and the distance to a given level ofthermal radiation against the flow rate. As in pool fires flame impingement effects are not simulated.
(iii) Fireball: it occurs when there has been a release of considerable violence and vigorous mixingand rapid ignition takes place. The initial flammable cloud is often hemispherical before ignition butrapidly approximates to a rising sphere due to thermal buoyancy. If the release of fuel is directedupwards, such as when a vessel suddenly ruptures, a spherical shaped fireball forms immediately. Animportant source of a fireball is due to the phenomena known as a Boiling Liquid Expanding VapourExplosion or BLEVE. These usually occur with flammable liquids stored under pressure at ambienttemperature, liquids such as liquefied petroleum gas, propylene or ethylene oxide. The event starts withan external fire, possibly fuelled by a spillage or leak from the vessel itself, which has flamesimpinging on areas of the vessel which are in contact with the liquid contents. Boiling of the liquidincreases the vapour pressure but keeps the wetted vessel surface relatively cool.
However, where the flames impinge on areas of the vessel blanketed by vapour, heat transferis poor and the metal surface temperature rapidly rises. At these high temperatures the metal weakensand ruptures. As a result of the vessel failure the pressurized contents rapidly escape and expandforming a large cloud of vapour and entrained liquid. The cloud is ignited by the original flames anda huge fireball is formed. Casualties can be due to not only thermal radiation but also to the effectsof the blast and to missiles.
Fireballs tend to produce large heat fluxes for a short period of time. Some useful formulas forfireballs produced by BLEVEs are given in Refs [IV.18, IV.32, IV.33].
193

1000
10Leak flow rate (kg/s)
FIG. IV. 5. Jet fire modeling - length of flame
1000
JO
100
i*a>
<Du
I
10
Thermal radiation:6.3 kW/m2 . ^ -
.. - •' ' 25 kW/m2
Thermal radiaHon fromLPG jet flames
10Leak flow rate {kg/s)
100
FIG. IV. 6. Jet fire modeling - distance of thermal radiation
194

Discussion
BLEVE dimensions and durations have been studied by many authors and the empirical basisconsists of several well-described incidents, as well as many smaller laboratory trials. The use of asurface emitted flux estimate is the greatest weakness, as this is not a fundamental property.
IV. 1.5. Explosions
An explosion is a process involving the production of a pressure wave resulting from a veryrapid release of energy. In the case of an explosion in air, the air will become heated locally due toits compressibility. This will increase the velocity of sound causing the front of the disturbance tosteepen as it travels through the air, thereby increasing the pressure and density of the air until a peakpressure wave is developed at some nominal distance. The magnitude of this pressure wave willgovern the loading and therefore the damage to structures, people, etc. nearby. A good overview ofthis topic is given in Ref. [IV. 18].
This section will consider the prediction of blast overpressure effects from vapour cloudexplosions, condensed phase explosions and catastrophic failure of large vessels under pressure.
The idealized structure of a blast wave is shown in Fig. IV.7. Before the arrival of the front ofthe shock wave the pressure is at the ambient level. The time taken for the front to travel from thesource of the explosion to the point at which the blast is measured is known as the arrival time.
At the arrival time the pressure rapidly rises to a peak value which is known as the peak positiveoverpressure. This pressure then decays back to the ambient pressure in a time known as the positivephase duration. This is followed by a further decline to produce a pressure lower than ambient andeventually returns back to the ambient pressure. The period from the end of the positive phase to thefinal return to the ambient atmospheric pressure is known as the negative phase duration. Theparameters of most interest are the peak positive overpressure and the area enclosed by the positiveoverpressure time curve.
FIG. IV.7. Idealized structure of a blast wave, Ref.fIV.35J
195

A vapour cloud explosion occurs when a release of gas mixes with air and is ignited. Themixture must be within a limited flammability range for an explosion to occur. The effects of a vapourcloud explosion depend to a large extent on the degree of confinement. Open-air, so called unconfined,vapour cloud explosions have been thought to be impossible and are very difficult to theoreticallyunderstand. However, the presence of relatively minor turbulence producing obstacles with therequirement for a certain critical mass may explain the fact that a large number of so-called unconfinedvapour cloud explosions have occurred. The blast wave from such an explosion is characterized bya relatively slow rise to peak pressure and a relatively long duration (typically a few tenths of asecond). Vapour cloud explosions produce levels of overpressure of the order of 1 bar and do notproduce craters.
Confined gas explosions may occur in equipment (such as storage tanks), amongst groups ofplant items and/or buildings (partially confined explosions) or inside buildings. Under totalconfinement, most gases will, when mixed with air at atmospheric pressure, produce a maximumpressure of 8 bars when ignited, see Refs [IV.33, IV.34]. The pressure profile due to thermal effectsfor a totally confined explosion is shown in Fig. IV.8.
In most practical confined situations there will be a vent or a weak point (sometimes deliberatelyinserted) within the structure which will relieve some of the explosion gases and cause a reduction inpeak overpressure.
Condensed phase explosions arise as a result of detonation of high explosives such as TNT ormaterials such as some organic peroxides which are used as propellants for military purposes.Condensed phase explosions are the type which most closely approximate that of the idealized blastwave structure described earlier in that it is characterized by an abrupt pressure rise, a short (1 to 10ms) positive phase duration and a very high peak positive overpressure. For confined or semi-confinedexplosions a further phase of the blast wave exists as a result of reflections from surroundingstructures.
^ 6
UJ(Xra-ce
0.2 0.U 0.6TIME . sees
0.8
FIG. IV.8. The pressure-time profile for a totally confined stoichiometric propane - air mixture
196

Failure of a large vessel under pressure results in a blast wave which is similar to the ideal blastwave structure during its positive phase but has a larger negative phase and is followed by multipleshocks. The stored energy released from the vessel is transferred to fracture energy, blast wave energyand kinetic energy of missiles. Generally something between 40 and 80% of the total energy istransferred to the blast wave. This depends on the amount of energy spent in fragmenting the vessel.
The most common method of estimating the effects of explosions is to determine the mass ofTNT which would cause an equivalent amount of damage. This is based on the assumption that inthe far field at least, a blast wave from any source of explosion will tend towards that of a TNTexplosion. This method is known as the TNT equivalence technique. This method has been outlinedby the UK Advisory Committee on Major Hazards, Ref. [IV.3 5]. The method is under review to takeaccount of improved understanding of the underlying mechanisms of flame acceleration in partiallyconfined structures. A number of people also use a model developed by TNO, Ref. [IV. 18], which isbased on actual unconfined vapour cloud explosions and employs one of two defined explosion yields.The model is limited to flammable materials of medium reactivity. Both methods are strictly empiricaland are not based on solid theory.
For condensed phase explosions the TNT equivalent mass is evaluated by using a TNTefficiency factor which is an estimate of the proportion of the available energy of the explosiontransferred to the blast wave. This efficiency factor is then multiplied by the total stored energy todetermine the energy in the blast wave. The mass of TNT required to produce an equal energy blastcan then be calculated using 4520 kJ/kg as the mass specific energy for TNT. The efficiency factorfor high explosives varies from about 60% to 130%, however as a first approximation it can beassumed that 1 equivalent tonne of high explosive will produce the same blast energy as 1 tonne ofTNT. Explosives used as propellants generally transfer only up to 25% of their available energy to theblast wave on explosion.
Having obtained the TNT equivalent mass for the scenario under consideration, it is thenpossible to estimate the blast parameters of an explosion at any distance from the source. A numberof sources publish plots of blast parameters versus scaled distance Z for high explosives, see Ref.[IV.36].
Z =W 1/3
where: R = distance (m) from the source of the explosionW = charge weight (kg TNT).
Fig. IV.9 which relates peak overpressure to scaled distance, is an example of the TNT blastrelationship. Ref. [IV.35] explains the application and use of the TNT equivalence approach.
The TNT equivalent mass of a gas cloud explosion is difficult to estimate with any realaccuracy. A large number of factors affect the magnitude of the blast wave energy. These includeturbulence, the volume of gas, the composition of the cloud, the location of the ignition source relativeto the cloud, the shape of the cloud and the proportion of the total energy transferred to the blast wave.The complexity of this problem led to the production of a number of models such as in Refs [IV.35,IV.37]. The range of efficiency factors obtained from such models can be as low as a fraction of oneper cent up to a few tens of percent. The UK Advisory Committee on Major Hazards recommends thatan approximate value of 3% of the total available energy should be assumed to have been transferredto the blast wave. It should however be noted that the TNT method should not be used to predict blastwave parameters for gas explosions at a distance of less than 10 cloud diameters from the source ofthe explosion. The TNO multi-energy method, presented in Ref. [IV.38], is now considered to giveresults which are much more representative of those observed in actual explosions and to match theory.This model is very well regarded.
197

1087654
3
1J0
as-c 0.7£ 0.6T 0.5
fe 0.3>o
s "
ai0.080.060.050.04
0.03
0.01
-Basic curve for TNT
causing serious but not fatal injuries
20
Assumed upper bound for overpressure in doud
Category A damage*\ Y ~ Assumed overpressure at cloud edge
\
•f I \ . \ • Overpressure causing category B— I » . T! damage at radius 56\ /W tonne metres .
10
1"S . If 1 tonne vapour =0.42 tonaeTNTexplodedat« =
If 1 tonne vapour ^- 0 3 tonne TNT exploded at JT
&J metres "*%\
\
ISen
O2
10 20 30 40 5060 80 100 200 300 500 1000distance (at)
'Scaled distance' •=V « tonnes TNT or equwaient
FiG. IV.9. Relationship between peak overpressure and "scaled distance", Ref.fIV.35J.
Computer models do exist which attempt to model the basic physical principles of explosionbehaviour. These models are generally neither simple nor easy to use. Probably the best known andmost widely used are the codes FLACS which was developed by the CMR at Bergen, Norway, andCHAOS, developed by British Gas, UK.
Discussion
The TNT equivalent model as described is relatively easy to use. Neither this nor the TNOmodel is solidly based on theory, but they both predict well the observed VCE incidents. Onedifficulty is that in the TNT approach some expertise is required in selecting the explosion yield. Theother weakness of the TNT model is the substantial physical difference between detonations and VCEdeflagrations. The TNO correlations model is based on actual VCE incidents and employs one of twodefined explosion yields, but it is limited to flammable models of medium reactivity.
IV.1.6. Missiles
The consideration and prediction of the effects of fragments of pressure components which failunder incident conditions is important as there have been many deaths and cascade damage effects due
198

to such fragments. Generally, in risk terms, due to the small area affected, fragments are not a majorissue; but they can be a public perception problem. Most of the events seem to be associated with thestorage of flammable liquids such as liquefied petroleum, often resulting in the projection of missiles(sometimes still containing liquefied gas) to distances much greater than the thermal hazard range fromthe initial event. The effect of these missiles is to cause physical damage to property and people andto act as an initiating event for further incidents due to damage to plant and also as a result of startingsecondary fires. A number of studies have been carried out into the cause, likelihood and effect ofmissiles. These include Refs [IV.36, IV.39, IV.40, IV.4I]. The comprehensive study by Holdenconfirmed the assumption of others that the probability of missile projection from cylindrical liquefiedgas vessels which fail when affected by fire is almost 0.8. Major fire engulfment events usuallyproduce up to about 4 fragments; non-fire events tend to produce slightly more - this is for cylindricalvessels. The generally larger spherical vessels tend to produce more fragments, a useful mean beingaround 10.
The distance travelled depends on the shape of the fragment produced. Cylindrical end tubfragments, which are closed at one end, tend to act like rockets and can travel anything up to 1 km.However, as a rough guideline, it can be assumed for cylindrical vessels that about 80% of thefragments will travel less than 200 m. For cylindrical vessels, the fragments are generally projectedin directions roughly axial to the vessels orientation at the time of rupture. For spherical vessels thereis a tendency of a non-random directional distribution.
When assessing the hazards from missiles, it should be particularly noted that nearby pipeworkand thin walled tanks are very vulnerable to impact from vessel fragments. Large thick-walled pressurecomponents can also be susceptible.
IV.2. EFFECTS MODELS
The physical models discussed in the previous section considered the dispersion of airborneflammable or toxic materials, the creation of high levels of thermal radiation from various types offires, the production of overpressures from explosions and the generation of missiles. This section willnow consider the effects of these on people, property and the environment. However, environmentaleffect models development is still in its infancy and existing approaches contain great uncertainties.A good overview of people and property effects modelling is given in the TNO Green Book, Ref.[IV.42].
IV.2.1. Effects of Hazardous Material Dispersion (Toxicity Effect)
There are two main outputs from calculations of the way in which hazardous materials aredispersed in the atmosphere. The first is the determination of the concentration of flammable materialswith a view to establishing the hazard ranges of these substances to some pre-determined concentrationsuch as the Lower Flammable or Lower Explosive Limit. The results of these calculations are thenused as inputs to the modelling and determination of the characteristics of fires and explosions. Theeffects of these will be considered under the heading of fires and explosions and so will not bediscussed here. The main group of substances to be dealt with are therefore those which have toxiceffects on man, plant and animal life.
The objective of using toxic effect models is to assess the consequences to man, animals andplants as a result of exposure to toxic materials. Considering first the effects on man it is difficult, fora variety of reasons, to evaluate precisely the toxic responses caused by acute exposures to toxicsubstances. Humans experience a very wide range of adverse effects which can include irritation,neurosis, asphyxiation, organ system damage and death. In addition the scale of these effects is afunction of both the magnitude and duration of exposure. There is also a high degree of individualresponse among different persons in a given population, due to factors such as general health, age andsusceptibility. A further cause of difficulty is that there are known to be thousands of different toxicsubstances and there is by no means enough data - on even some of the more common ones - on the
199

toxic response of humans to permit a precise assessment of a substances hazard potential. In mostcases the only data available are from controlled experiments with animals under laboratory conditions.The extrapolation of the effects observed in animals to the effects likely to occur in humans or indeedin other animals is not easy and is subject to a number of judgements. The methods presented inchapter 4 of these Guidelines to calculate the effect of toxic releases on the environment fromcontinuous releases are also applicable to calculate the effects of accidental releases.
There are a large number of references which give useful information on the methods ofpredicting the likelihood that a release event will result in serious injury or death. A number ofsubstances in common have been examined in depth. In the UK, chlorine was considered by a sub-group of the UK Major Hazards Assessment Panel and associated publications have given an extensivereview of the animal data for man. Refs [IV.43, IV.44]. The same group has also reviewed ammonia,Ref. [IV.45].
If an attempt is made to estimate the proportion of the population which may suffer a defineddegree of injury it is necessary to have information on the statistical distributions relating theprobability of injury to the dose (total intake). Typically this is a log-normal distribution but for thesepurposes can take the form of a probit equation. The probit equation relates the effect of an exposureto a given concentration and duration.
The general form of a probit equation is:
PT = a + b log, ( C t)
where PT is a measure of the percentage of people affected, a, b, and n are constants:
C = concentration (ppm)t = exposure time (min)
The quantity ( C t) is known as the toxic load.
Table IV. 1 gives the constants for the lethal toxicity probit equation for a number of the morecommon chemicals.
Hence, for: Chlorine:
PT = -8.29+0.92 log/C2*)
Ammonia:
PT= -35.9+1.85 loge(C2r)
The important factor in the determination of the effects of toxic material is to study the knowndata about the material in question, see Refs [IV.46, IV.47] and the monographs for Chlorine,Ammonia and Phosgene. In any case, before interpreting the results of an assessment involving toxicmaterials, agreement should be reached with those concerned about the concentration of toxic materialwhich should be considered as various action levels or hazard indicators. Major sources of toxicityinformation are in Refs [IV.42, IV.48]. But there are also databases many of which are nowcomputerized and some of which are on Compact Disc-Read Only Memory, Refs [IV.49, IV.50].
200

It should be noted however that the information on dose-response relationships necessary toapply a probit function is only available for the chemicals shown in Table IV. 1., information on a fewother chemicals is slowly becoming available. In circumstances where chemicals other than those listedin Table IV. 1 are involved or where a rapid result is required, it may be necessary to make use ofestablished toxicological criteria. Some are listed below:
- Emergency Response Planning Guidelines (ERPGs) for air contaminants issued by the AmericanIndustrial Hygiene Association (AIHA). Over 40 ERPGs have been developed, for 3 differentlevels of impact, all for 60 minutes of exposure.
- Immediately Dangerous to Life or Health (IDLH) Levels established by the National Institutefor Occupational Safety and Health (NIOSH). NIOSH has published IDLH concentrations to beused as acute toxicity measures for common industrial gases. An IDLH level represents themaximum airborne concentration of a substance to which a healthy male worker can be exposedfor as long as 30 minutes and still be able to escape without loss of life or irreversible organsystem damage. Because IDLHs were developed to protect healthy worker populations they mustbe used with caution when applied to sensitive populations.
TABLE IV. 1. CONSTANTS FOR LETHAL TOXICITY PROBIT EQUATION, Ref.[IV.3]
Substance
Acrolein
Acrylonitrile
Ammonia
Benzene
Bromine
Carbon monoxide
Carbon tetrachloride
Chlorine
Formaldehyde
Hydrogen chloride
Hydrogen cyanide
Hydrogen fluoride
Hydrogen sulfide
Methyl bromide
Methyl isocyanate
Nitrogen dioxide
Phosgene
Propylene oxide
Sulfur dioxide
Toluene
a(ppm)
-9.931
-29.42
-35.9
-109.78
-9.04
-37.98
-6.29
-8.29
-1224
-16.85
-29.42
-35.87
-31.42
-56.81
-5.642
-13.79
-1927
-7.415
-15.67
-6.794
b(ppm)
2.049
3.008
1.85
5.3
0.92
3.7
0.408
0.92
1.3
2.00
3.008
3.354
3.008
521
1.637
1.4
3.686
0.509
2.10
0.408
n(min)
I
1.432
2
2
1
2.502
2
1.001.431.001.431.000.6532
1
2.001.00
2.50
Note: These values should be used with caution. They contain uncertainties and are subject to regular reviewand updating/change.
Emergency Exposure Guidance Levels (EEGLs) and Short-Term Public Emergency GuidanceLevels (SPEGLs) issued by the American National Academy of Sciences/National Research
201

Council. An EEGL is defined as a concentration of a gas, vapour or aerosol that is judged tobe acceptable and that will allow exposed individuals to perform specific tasks duringemergency conditions lasting from 1 to 24 hrs. SPEGLs are defined as acceptableconcentrations for exposures of members of the general public . These are generally set at 10to 50% of the EEGL and are calculated to take account of the effects of exposure on sensitivepopulations. Their advantage over IDLH values are that they have been developed for a rangeof exposure times and consider the effects on sensitive populations.
- Threshold Limit Values (TLVs) established by the American Conference of GovernmentIndustrial Hygienists (ACGIH) including Short Term Exposure Limits (STELs) and ceilingconcentrations. The STELs are designed to protect workers from acute effects resulting fromexposure to chemicals. They are however designed as limits on exposure excursions lastingup to 15 minutes.
The use of established toxicity measures such as ERPGs, IDLH, EEGLs, SPEGLs andTLV/STEL is usually a simpler approach than the probit model - and is also applicable over a widerrange of chemicals. However the results are more difficult to interpret when the release is over adifferent time period to that published.
IV.2.2. Effects of Thermal Radiation
The modelling of high thermal radiation effects which are likely to cause injury or damage topeople and property is much more straightforward than for toxic effects. A large amount ofexperimental data exists and a large number of simple tabulations, charts and theoretical models areavailable. Most of these charts, models etc. refer to bare skin. The effects can be considerably modifieddue to the presence of such factors as clothing (which most probably will protect but in a few casesmay make the situation worse), instinctive response (to turn and run away) and the existence of solarradiation exposure in sunny climates. Fig. IV. 10 from Ref. [IV.26] shows a simple relationship
100
'io
UJ
0.1
injury <S^\\threshold \
Data of
(1954)
Near 100%fatalities
''fatalities
\ . 1% Fatalities
10 100 1000
INCIDENT THERMAL FLUX, kW/M'
FIG. IV. 10. Fatality and injury levels for thermal radiation, Ref. [IV.26J
202

between incident thermal flux, time and damage (injury/fatalities). A probit model was developed, seeRef. [IV.51], to estimate the injury levels for a given thermal radiation dose from pool and flash firesbased on data from nuclear tests:
Pr = 14.9+ 2.56 log, ( t I. 10 "*) 4/3
where: Pr = Probit (measure of the percentage of people affected)t = exposure time in sec.I = thermal radiations intensity (W/nr)
This normally should be used only with care and not applied to long exposure doses.Table IV.2indicates the consequence effects of heat radiation on people and property.
TABLE IV.2. CONSEQUENCE EFFECTS OF HEAT RADIATION ON PEOPLE ANDEQUIPMENT, Ref. [52]
INCIDENT FLUX(kW/m2)
35
23
12.6
4.7
2.1
1.2
DAMAGE TO EQUIPMENT
Damage to processequipmentCellulosic equipment willpilot ignite within oneminute exposure
Spontaneous ignition ofwood after long exposureUnprotected steel willreach thermal stresstemperatures which cancause failurePressure vessels need tobe relieved or failure willoccur
Minimum energy to ignitewood with flameMelts plastic tubing
• Thin steel with insulationon the side away from thefire may reach a thermalstress level high enough tocause structural failure
DAMAGE TO PEOPLE
Significant chance offatality for people exposedinstantaneouslyLikely fatality forextended exposures
• Chance of fatality forinstantaneous exposure
Significant chance offatality for extendedexposureHigh chance of injury
Causes pain if duration islonger than 20 sec.Possible injury after 30sec. exposure
Minimum to cause painafter 1 min.
Causes no discomfort forlong exposure
203

Discussion
Thermal effect models are simple and are based on extensive experimental data. The mainweakness arises if duration of exposure is not considered. Thermal effect data relates to bare skin andit is necessary to take account of the effect of clothing and sheltering.
IV.23. Explosion Effects
The objective of explosion effect models is to predict the impact of blast overpressure on peopleand structures. It so happens that people are much more resilient to blast overpressures than structures.The major threat to people is produced by missiles, structural collapse or whole body translation.Death or injury to humans which arises directly from the blast overpressure alone varies with theposition of the body and its relationship to possible pressure reflecting objects. Human organs whichare particularly susceptible to direct blast effects are those where a large difference in density existsbetween adjacent organs such as the ears and lungs. Much of the data have been derived from nuclearexperience and may slightly overestimate the fatalities from non-nuclear explosions.
There have been a number of different approaches developed to determine the response ofstructures to a given blast load. A number of these draw a comparison between the magnitude of thepredicted blast wave and existing data from explosions of a similar scale. Other approaches attemptto model the response of a structure to an applied load. Much of the data on explosions comes frommilitary experience but a number of large industrial explosions have also been investigated in depth.The effects of explosion overpressure on people and buildings are indicated in Table IV.3.
It should be noted that this correlation is applicable to standard European or North Americanbrick built dwellings and much more severe damage would be experienced by less strongly constructedbuildings.
The damage to industrial buildings is less easy to correlate since these range from buildings withstrong reinforced concrete walls to lightly constructed buildings with large wall and roof areas.
TABLE IV.3. EFFECTS OF EXPLOSION OVERPRESSURE ON PEOPLE AND BUILDINGS
(A) Effects on Buildings
Building almost completely destroyedHeavy building damageRepairable building damageWidespread glass damage10% broken glass
(B) Effects on People
100 % lethality50% lethalityThreshold lethalitySevere lung damage50 % eardrum rupture50 % eardrum rupture
0.7 bar0.35 bar0.10 bar0.05 bar0.02 bar
5 to 8 bars3.5 to 5 bars2 to 3 bars1.33 to 2 bars2 to 2.33 bars (over 20 yrs. of age)1 to 1.33 bars (under 20 yrs. of age)
Note: Cireat caution should be exercised in the use of promts tor modelling consequence effects from explosionoverpressure in a non-nuclear event.
Discussion
The strength of explosion effect models is their solid base of experimental data and the generalsimplicity of the approach. Attention has been drawn to the fact that people may be killed indoors dueto building collapse at a much lower overpressure than outdoors due to overpressure alone. Explosions
204

in built-up areas are rarely uniform in effects. VCEs are often directional and this effect is notaccounted for in manv current effect models.
REFERENCES
[IV. 1] LEES, F.P., ANG, Safety Cases - Within the Control of Industrial Major Accident Hazards(CIMAH) Regulations 1984, Butterworth, London (1989).
[IV.2] RAMSKJLL, P.K., Discharge Rate Calculations Methods for Use in Plant SafetyAssessments, Rep. SRD-R-352, UK Atomic Energy Authority, Safety and ReliabilityDirectorate, Culcheth, Warrington (1987).
[IV.3] AMERICAN INSTITUTE OF CHEMICAL ENGINEERS. Guidelines for Chemical ProcessQuantitative Risk Analysis, Center for Chemical Process Safety, New York (1989).
[IV.4] PERRY, R.H., GREEN, D., (Eds), Perry's Chemical Engineering Handbook, 6th edn,McGraw-Hill, New York (1984).
[IV.5] CRANE Co., Flow of Fluids Through Valves, Fittings and Pipe, Metric Edition - SI Units,Technical Paper No. 410M, Crane, New York (1981).
[IV.6] FAUSKE, H.K., EPSTEIN, M., GROLMES, M.A., LEUNG, J.C., Emergency Relief VentSizing for Fire Emergencies Involving Liquid Filled Atmospheric Storage Vessels, PlantOperations Progress 5, 4 (1986) 205-208.
[IV.TJ CROZIER, R.A. Jr., Sizing Relief Valves for Fire Emergencies, Chemical Engineering 9222(1985)49-54.
PV.8] PILZ, V., VAN HERCK, W., "Chemical Engineering Investigations with Respect to theSafety of Large Chemical Plants", Third Symposium on Large Chemical Plants, EuropeanFederation of Chemical Engineers, Antwerp (1976).
[IV.9] KLETZ, T.A., "Unconfined Vapor Explosions", Loss Prevention, Vol. 11, Chemical ProgressTechnical Manual, American Institute of Chemical Engineers, New York (1977) 50-56.
[TV. 10] DOW, Chemical Exposure Index Guide, American Institute of Chemical Engineers, NewYork (1995).
[IV. 11 ] TECHNICA, Ltd., Techniques for Assessing Industrial Hazards - A Manual, Technical PaperNo. 55, The World Bank, Washington DC (1988).
[IV. 12] FAUSKE, H.K., EPSTEIN, M., "Source Term Considerations in Connection with ChemicalAccidents and Vapour Cloud Modelling", Vapour Cloud Modelling (Proc. InternationalConference, Cambridge, MA, 2-4 November 1986) American Institute of ChemicalEngineers, New York (1987).
[IV. 13] WEBBER, et al., A Users Guide to GASP on Microcomputers, Rep. SRD-R-521, UK AtomicEnergy Authority, Safety and Reliability Directorate, Culcheth, Warrington (1990).
[IV. 14] WU, J.M., SCHROY, J.M., "Emissions from Spills", Air Pollution Control Association andWPCF Joint Conference on Control of Specific (toxic) Pollutants, Air Pollution ControlAssociation, Florida Section, Gainesville, FL (1979) 337.
205

[IV. 15] FLEISCHER, M.T., SPILLS, An Evaporation/Air Dispersion Model for Chemical Spills onLand, Westhollow Research Centre, Shell Development Center, Houston, TX (1980).
[IV. 16] HANNA, S.R., BRIGGS. G.A.. HOSKER. R.P., Handbook on Atmospheric Diffusion, Rep.DOE/TIC-11223, Department of Energy, Technical Information Center, Oak Ridge, TN(1982).
[IV. 17] PASQUILL, F., SMITH, F.B., Atmospheric Diffusion, 3rd edn, Halsted, New York (1983).
[IV. 18] TNO, Methods for the Calculation of the Physical Effects: Resulting from releases ofhazardous materials (liquids and gases) (2nd edn), Rep. CPR-14E ("The Yellow Book"),Committee for the Prevention of Disasters, Voorburg (1992).
[IV. 19] HAMNA, S.R., DRIVAS, P.J., Guidelines for Use of Vapor Cloud Dispersion Models,American Institute of Chemical Engineers, Center for Chemical Process Safety, New York(1987).
[IV.20] MCQUAID, J., Heavy Gas Dispersion Trials at Thorney Island, J. Haz. Mat. 11 (1985).
[IV.21 ] MCQUAID, J., ROEBUCK, Large Scale Field Trials on Dense Gas Vapour Dispersion, Rep.EUR-9903, CEC, Brussels (1985).
[IV.22] CHEMICAL INDUSTRIES ASSOCIATION, General Guidance on Emergency Planningwithin the CIMAN Regulations for Chlorine Installations. Chemical Industries Association,London (1987).
[IV.23] JAGGER, S., The development of CRUNCH: A Dispersion Model for Continuous Releasesof a Denser-than-air Vapour into the Atmosphere, Rep. SRD-R-229, UK Atomic EnergyAuthority, Safety and Reliability Directorate, Culcheth, Warrington (1983).
[IV.24] SIMPSON, I.C., Atmospheric Transmissivity - The Effect of Atmospheric Attenuation onThermal Radiation, Rep. SRD-R-304, UK Atomic Energy Authority, Safety and ReliabilityDirectorate, Culcheth, Warrington, (1984).
[IV.25] CONSIDINE, M., Thermal Radiation Hazard Ranges from Large Hydrocarbon Pool Fires,Rep. SRD-R-297, UK Atomic Energy Authority, Safety and Reliability Directorate, Culcheth,Warrington (1984).
[IV.26] MUDAN, K.S., Thermal Radiation Hazards from Hydrocarbon Pool Fires, Prog. EnergyCombust. Sci. 10 1 (1984) 59-80.
[IV.27] INSTITUTE OF PETROLEUM, Liquefied Petroleum Gas - (Model Code of Safe Practicein the Petroleum Industry, Pt.9), Wiley, London (1987).
[IV.28] AMERICAN PETROLEUM INSTITUTE, Guide for Pressure-Relieving and DepressuringSystems, API Recommended Practice 521, 2nd edn, API, Washington, DC (1982).
[I V.29] HUSTAD, J., SONJU, O.K., "Radiation and Size Scaling of Large Gas and Gas-Oil DiffusionFlames" (Proc. I Oth International Colloquium on Dynamics of Explosions and ReactiveSystems, 1985), American Institute of Aeronautics and Astronautics, New York (1986).
[IV.30] BAGSTER, D.R., Pool and Jet Fires. Major Industrial Hazards Project, Warren Centre forAdvanced Engineering, University of Sydney, NSW, Australia (1986).
206

[IV.31 ] CHAMBERLAIN, G.A.. Developments in Design Methods for Predicting Thermal Radiationfrom Flares, Chem. Eng. Res Des. 65 (1987) 299-309.
[IV.32] HYMES, 1., The Physiological and Pathological Effects of Thermal Radiation, Rep. SRD-R-275, UK Atomic Energy Authority, Safety and Reliability Directorate, Culcheth, Warrington(1983).
[IV.33] MARSHALL, V.C.. Major Chemical Hazards, Halsted, New York (1987).
[IV.34] HARRIS, R.J., Gas Explosions in Buildina and Heating Plants, E&F.N. Spon., London(1983).
[IV.35] ADVISORY COMMITTEE ON MAJOR HAZARDS, Rep. ACMH-2, HMSO, London(1979).
[IV.36] BAKER, W.E., COX, P.A., WESTINE, P.S., KULESZ, J.J., STREHLOW, R.A., ExplosionHazards and Evaluation. Elsevier, New York (1983).
[IV.37] W1EKEMA, B.J., Vapour Cloud Explosions - An Analysis Based on Accidents, J. Haz. Mat.8(1984).
[IV.38] WINGERDEN, Vapour Cloud Explosion Blast Protection, Plant Op. Progress, 8 (1989).
[IV.39] ASSOCIATION OF AMERICAN RAILROADS, Analysis of Tank Car Tub Rocketing inAccidents, Rep. AAR-R-146, Washington, DC (1972).
[IV.40] ASSOCIATION OF AMERICAN RAILROADS, Summary of Ruptured Tank Cars Involvedin Past Accidents, Rep. AAR-R-130, Washington, DC (1973).
[IV.41J HOLDEN, P.L., Assessment of Missile Hazards: Review of Incident Experience Relevant toa Major Hazard Plant, Rep. SRD-R-477, UK Atomic Energy Authority, Safety and ReliabilityDirectorate, Culcheth, Warrington, (1989).
[IV.42] TNO, Methods for the Determination of Possible Damage: to people and objects resultingfrom the releases of hazardous materials. Rep. CPR-16E ("The Green Book"), Committee forthe Prevention of Disasters caused by Dangerous Substances, Voorburg (1989).
[IV.43] MAJOR HAZARDS ASSESSMENT PANEL, The Chlorine Toxicity Monograph, Instituteof Chemical Engineers. Rugby (1987).
[IV.44] WITHERS, R.M.J., LEES. F.P., The Assessment of Major Hazards: The Lethal Toxicity ofChlorine, Parts 1 and 2. J. Haz. Mat. 12 (1985) 231-302.
[IV.45] WITHERS, R.M.J., The Lethal Toxicity of Ammonia. Refinement of Estimates of theConsequences of Heavy Toxic Vapour Releases, Paper No. 1, Institute of Chemical EngineersNorthwestern Branch, Manchester (1986).
[IV.46] NATIONAL INSTITUTE FOR OCCUPATIONAL SAFETY AND HEALTH, Pocket Guideto Chemical Hazards, NIOSH/OSHA, US Dept. of Health and Human Services and US Dept.of Labour, US Government Printing Office, Washington DC (1978).
[IV.47] HABER. The Poisonous Cloud - Chemical Warfare in the First World War. Clarendon Press,Oxford (1986).
207
[IV.48] AMERICAN INSTITUTE OF CHEMICAL ENGINEERS. Guidelines for Safe Storage andHandling of High Toxic Hazard Chemicals, Center for Chemical Process Safety, New York(1988). *"
[IV.49] NATIONAL INSTITUTE FOR OCCUPATIONAL SAFETY AND HEALTH, Registry ofToxic Effects of Chemical Substances (RTECS), US Government Printing Office,Washington, DC (1978).
[IV.50] TOXLINE, Data from the Public Domain Files of TOXLINE 1981-1987, CD-ROM, SilverPlatter International, NV (1990).
[IV.51] EISENBERG, N.A., LYNCH, C.J., BREEDING, R.J., Vulnerability Model -A SimulationSystem for Assessing Damage Resulting from Marine Spills, Rep. CG-D-136-75, NTIS AD-015-245, U.S. Coast Guard, Office of Research and Development, Springfield, VA (1975).
[IV.52] DEPARTMENT OF PLANNING OF THE STATE OF NEW SOUTH WALES, Risk Criteriafor Land Use Safety Planning, Advisory Paper No.4, Department of Planning, Sydney (1990).
208

Appendix V
BACKGROUND ON DECISION CRITERIA
V.l. HEALTH RISK CRITERIA
V.I.I. Overview
All activities have an associated risk. Risk can be assessed and managed but never eliminated.Indeed, zero risk cannot be achieved even if the activity itself is eliminated. In many cases this simplyleads to risk transfer which is an important concept in risk assessment and management.
In going about their daily-life individuals continuously assess situations and make decisions onwhether the risk associated to a particular action is justified. Such decisions are mostly made underconditions of uncertainty and involve value judgements which normally cannot be explicitly expressedin terms of quantitative criteria. This is often the case when the risk is of a voluntary nature, i.e. it istaken as a free choice (e.g. smoking, downhill skiing). On the other hand when the individual cannotfully chose to avoid exposure to risk, it is termed as involuntary (e.g. natural disasters, large industrialaccidents) and the decision making process needs to be more explicit using quantitative data.Moreover, people are generally willing to expose themselves to quite different levels of risk dependingon whether it is of a voluntary or non-voluntary nature. Tables V.I and V.2 indicate a range of variousvoluntary and non-voluntary risks to which people are generally exposed as the result of variousactivities.
TABLE V.I. EXAMPLES OF SOME ANNUAL INDIVIDUAL MORTALITY RATES:VOLUNTARY RISKS (AVERAGE TO THOSE WHO TAKE THE RISK)
Smoking (all effects)
Riding a motorcycle
Drinking alcohol
Driving a car
Travelling by train
Travelling by plane
5
1
4
1.5
3
1
x 10-3
x 10-3
x KT1
x 10-*
x 10-5
x lO"5
5000 in one million
1000 in one million
400 in one million
150 in one million
30 in one million
10 in one million
TABLE V.2. EXAMPLES OF SOME ANNUAL INDIVIDUAL MORTALITY RATES: RISKSAVERAGED OVER THE WHOLE POPULATION
Cancers (from all causes)
Accidents at home
Walking
Storms and floods
Lightning
2 x 10"3
1 x 10*
3 x 10s
2 x 10"7
1 x 10⁻⁷
2000 in one million
100 in one million
30 in one million
0.2 in one million
0.1 in one million
The increased societal awareness of the need to protect the environment, the complexity ofmodern industries and their potential to cause accidents with large consequences are related toinvoluntary risks. Decisions involving these issues are often dominated by emotional arguments.Therefore, a rational decision-making process requires the establishment of a consistent framework
209

with standards to express the desired level of safety. Probabilistic Safety Criteria (PSC), which arequantitative expressions for the probability of occurrence of an undesirable event within a given periodof time, can play the role of such standards. The purpose of this appendix is to provide a generalguidance concerning the setting and applications of such criteria.
V.1.2. Risk Categories
In addition to the voluntary versus involuntary nature of risks, a broader categorization is neededto put risks in proper perspective and to develop risk management strategies.
Tables V.3 and V.4 outline the broad categories of risks usually adopted to assess and comparethe health and environmental impacts of different hazardous activities. In all cases, risks to theenvironment should be assessed and compared separately from risks to human health.
TABLE V.3. CATEGORIES OF HEALTH RISK
Source
Routine or accidents
People at Risk
Workers and public
Exposure
Short or medium andlong term
Effects
Fatal and non-fatalimmediate/delayed-immediate/delayed
TABLE V.4. CATEGORIES OF ENVIRONMENTAL RISK
Source
Routine or accidents
Effects
Duration
Short or medium and long term
Extent
Local, regional and global
In terms of health impacts, occupational and public risks should be treated separately. Twocategories of risk apply as a result of direct or indirect impacts:
- Fatal effects, either immediate (resulting from direct exposure or accidental situation) or delayed(resulting from long term chronic exposure to hazardous substances);
- Non-fatal effects, (injuries, diseases) of either an immediate or delayed nature.
In relation to environmental risk, categorization of risks can be made on the basis of extent:local, regional and global; and on the duration of the effect: short or medium term and long term.
Some environmental effects are of such a long term nature that they are virtually or actuallyirreversible. The complete destruction of vegetation and soil cover in certain mining operations is onesuch example; widespread loss of species in an area is another. Planning is the only way in which suchirreversible environmental effects can be avoided.
Risks from routine operations should also be differentiated from those resulting from majoraccidents. The criteria proposed in this appendix refer to the latter type.
To date, emphasis has been placed on the development of risk criteria in terms of acute(immediate) health effects, mostly fatalities and in some cases immediate injuries to people. Fewexamples exist (The Netherlands being an exception) where encompassing overall quantified riskcriteria have been established for long term chronic exposure to chemicals from on-off or repeated
210

accidental exposures. For the long term effects of chemicals, the assessments have until now reliedmostly on translating animal test results to people. Recommendations established by National HealthCouncils are relied upon in that regard.
There are also very few cases of probabilistic safety criteria that apply to accidental releases ofchemicals into the natural environment. The diversity of response mechanisms (in type and nature) tothe multitude of species within the different ecosystems, including the issue of irreversibility and/orrecoverability of damage make it difficult to establish uniform criteria in this area. Such criteria willlargely depend on local circumstances and may need to be developed on a case by case basis.
V.I J . Societal Risk Criteria
There is a general agreement that societal or group risks should be considered when assessingthe acceptability of any hazardous industrial facility.
Societal risk is usually defined as the relationship between the number of people killed in asingle accident and the chance or likelihood that this number will be exceeded. It is usually presentedin the form of an T-N curve', which is a graphic indicating the cumulative frequency (F) of killingN or more people.
Group risk does not involve the calculation of the individual risk of death but rather the risk ofa number of deaths.
There are many ways of expressing the societal impact of serious accidents, such as the numberof predicted immediate or latent fatalities, agricultural restrictions, large scale evacuation and economicloss. There is no international consensus on which of these or other measures should be chosen todevelop societal risk criteria. Individual countries will need to choose the impacts of greatest concernto them.
A number of factors should be borne in mind when developing PSC based on societal riskincluding public aversion to accidents with high consequences. The risk level chosen should decreaseas the consequence increases. The criteria should be relatively simple to understand and shouldrecognize the imprecision of QRA estimates that predict societal effects (either health or otherwise).
V.1.4. Safety Assurance
Further to proposing criteria to express the desired level of safety, it should be discussed towhich extent risk estimates and their compliance with risk criteria can assure safety.
First, it should be kept in mind that severe accidents are rare events and as such their estimatedprobability of occurrence is the result of an engineering model representation of the reality and notthe result of observable repetitive events. Therefore, when we refer to the probability of a certainundesirable outcome we are expressing, according to the subjective concept of probability, our degreeof belief that such events may happen.
Second, any model includes assumptions which have to be respected for the results to becredible. They also form the basis for the 'safety assurance' which is both a fundamental safety conceptand a requirement for QRA results to be a realistic qualitative and quantitative measure of plant safety.
In this context the concept of a 'living' QRA, one which is kept constantly updated, should anychanges in the conditions used in the base case calculation be introduced, has emerged and isincreasingly being used as a tool for operational safety management and risk monitoring.
It goes without saying that low risk estimates are not surrogates to sound plant design and soundoperational practices and to constant operators' safety awareness required for safe plant operation.
211

V.1.5. Probabilistic Safety Criteria (PSC) Framework
The basis adopted in many cases in setting a PSC is that the criteria ought to be set below (andin many cases well below) known voluntary and non-voluntary risks associated with the different dailyactivities to which any one person or the society as a whole is exposed. Although it has been arguedthat by setting assessment criteria in such a way, such criteria should provide a 'tolerable' level of risk,the notion of risk tolerability' has been and still is the subject of significant debate. Attention is nowbeing given to the setting of a 'tolerable' level of risk. The tolerability of such risks may be suggestedby both reference to other levels of risks experienced by the society and those which may be toleratedin relation to both the costs and benefits associated with the activities under consideration. Social andeconomic considerations therefore become integral aspects of the setting of such tolerable risk levels.
Within the context of the above a framework suggested in setting PSC is one that embraces three"regions of risk": an upper region (I) in which the risk is judged to be so high as to make the practiceor activity intolerable whatever its benefits, an intermediate region (II) where the risk is acceptablesubject to the overriding requirement that all reasonable practical measures have been taken to reducethe risk, and a lower region (III) in which the risk is judged sufficiently low as to be broadlyacceptable with no additional effort required to further reduce i t Fig. V.I depicts the three regionsdescribed. This is based on the approach promulgated in a United Kingdom Policy Paper on theTolerability of Risks from Nuclear Power Stations, Ref. [V.I].
It is recognized that it is difficult to define the boundaries between Regions I, II, and III assingle precise values. In addition, the practical application of QRA inevitably involves uncertainty andimprecision in the estimation of risks. These factors need to be taken into account in assessing QRAresults within this framework and the criteria must not be used as absolute go/no-go rules, hence theyare shown as hatched zones. Within such a framework it is unnecessary to define separate levels forold and new plants. However, it is recognized that it will generally not be reasonably practicable toreduce the risks from plants in operation to the levels achievable on new plants.
The establishment of specific upper and lower risk criteria may be influenced by manyconsiderations which will vary with the type of risk addressed. These considerations include publichealth, social and economic factors. The basic choice of the appropriate levels of the public health andsocietal impact related criteria is essentially a socio-political decision and can only be made in anational context. The translation of this decision into a technical definition is, however, a process inwhich judgement will inevitably be involved.
Principles and procedures used in establishing compliance with existing PSC in the presence ofthe quantified uncertainties are still evolving. It is recommended that where distribution of frequencieshas been calculated in QRA, the mean value rather than an upper or lower bound should be used.Where only point values have been used they should be representative of a central value. In all casesit should be recognized that the criteria developed should be guidelines only and not treated asabsolute rules.
V.1.6. Individual Risk Criteria
Individual risk is usually defined as the probability per year that any one person will suffer adetrimental effect as the result of exposure to an activity.
PSC for individual risk are proposed under the consideration that risks arising from accidentsin hazardous installations should present only a small increment to the risk to which individuals arealready exposed.
The criteria are intended for application to an individual risk calculated using the followingassumptions:
212
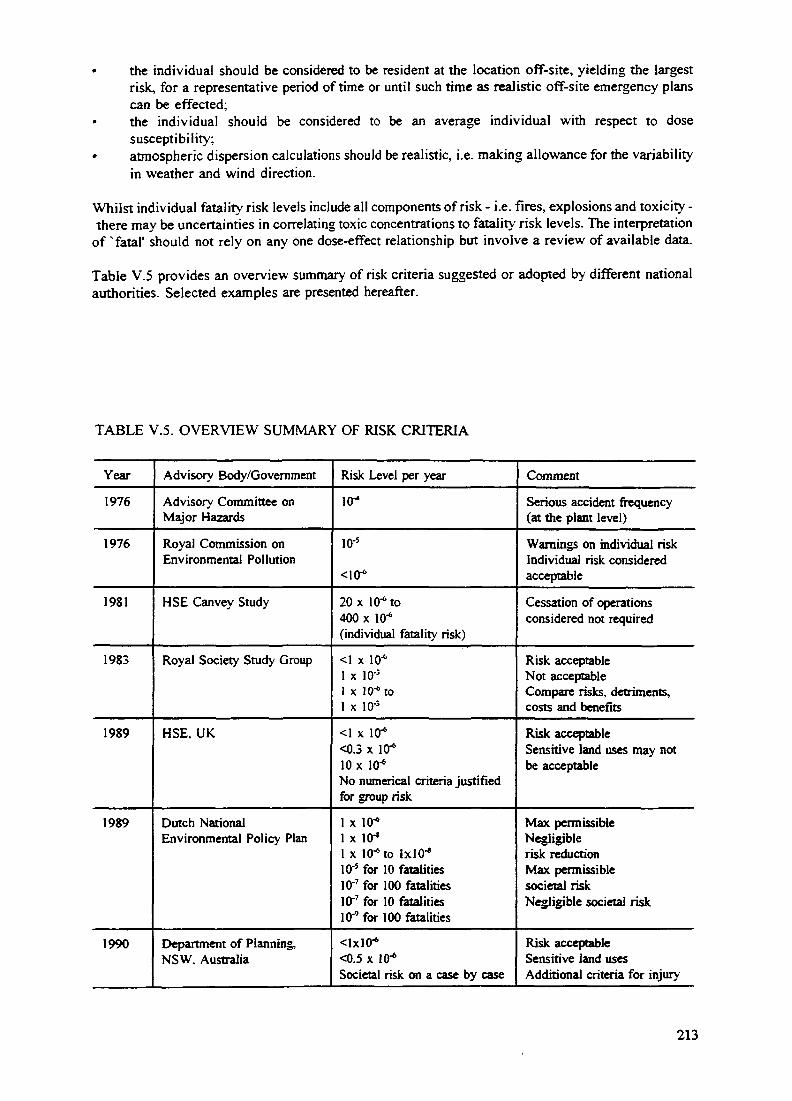
• the individual should be considered to be resident at the location off-site, yielding the largestrisk, for a representative period of time or until such time as realistic off-site emergency planscan be effected;
• the individual should be considered to be an average individual with respect to dosesusceptibility;
• atmospheric dispersion calculations should be realistic, i.e. making allowance for the variabilityin weather and wind direction.
Whilst individual fatality risk levels include all components of risk - i.e. fires, explosions and toxicity -there may be uncertainties in correlating toxic concentrations to fatality risk levels. The interpretation
of x fatal' should not rely on any one dose-effect relationship but involve a review of available data.
Table V.5 provides an overview summary of risk criteria suggested or adopted by different nationalauthorities. Selected examples are presented hereafter.
TABLE V.5. OVERVIEW SUMMARY OF RISK CRITERIA
Year
1976
1976
1981
1983
1989
1989
1990
Advisory Body/Government
Advisory Committee onMajor Hazards
Royal Commission onEnvironmental Pollution
HSE Canvey Study
Royal Society Study Group
HSE, UK
Dutch NationalEnvironmental Policy Plan
Department of Planning,NSW. Australia
Risk Level per year
io-
io-5
<\0*
20 x 10-° to400 x 10-"(individual fatality risk)
<1 x 10^1 x 10-'1 x 10-* to1 x 10"3
<1 x 10*<0.3 x 10"4
10 x 10"6
No numerical criteria justifiedfor group risk
1 x 10-*1 x 10"8
1 x lO"6 to ixlO"8
10'5 for 10 fatalitieslO"7 for 100 fatalities10'7 for 10 fatalities10"9 for 100 fatalities
<lxI0"*<0.5 x !(r*Societal risk on a case by case
Comment
Serious accident frequency(at the plant level)
Warnings on individual riskIndividual risk consideredacceptable
Cessation of operationsconsidered not required
Risk acceptableNot acceptableCompare risks, detriments,costs and benefits
Risk acceptableSensitive land uses may notbe acceptable
Max permissibleNegligiblerisk reductionMax permissiblesocietal riskNegligible societal risk
Risk acceptableSensitive land usesAdditional criteria for injury
213

CO
oCO<UJa:o
iINTOLERABLE
REGION
DESIGN CHANGESMUST BE MADE TOREDUCE RISKS
'THRESHOLD OF^INTOLERABILITY
IIREGION OF
CONDITIONALACCEPTABILITY
ACCEPTABLE ONLYIF ALL REASONABLYPRACTICABLE MEASURESHAVE BEEN TAKENTO REDUCE RISK
; DESIGNTARGET
I IIIBROADLY
ACCEPTABLEREGION
NO ADDITIONALEFFORT REQUIREDTO REDUCE RISK
FIG. V.I. Regions of risk
V.1.7. Qualitative Risk Assessment Criteria
Irrespective of the numerical value of any risk criteria level for risk assessment purposes, it isessential that certain qualitative principles be adopted as a yardstick for safety assessment andmanagement. The following qualitative criteria are appropriate when assessing the risk implicationsof a development project of a potentially hazardous nature or the locational safety suitability of adevelopment in the vicinity of a potentially hazardous installation:
a) All 'avoidable' risks should be avoided. This necessitates the investigation of alternativelocations and alternative technologies, wherever applicable, to ensure that risks are notintroduced in an area where feasible alternatives are possible and justified.
b) The risk from a major hazard should be reduced wherever practicable, irrespective of thenumerical value of the cumulative risk level from the whole installation. In all cases, if theconsequences (effects) of an identified hazardous incident are significant to people and theenvironment, then all feasible measures (including alternative locations) should be adopted sothat the likelihood of such an incident occurring is made very low. This necessitates theidentification of all contributors to the resultant risk and the consequences of each potentiallyhazardous incident. The assessment process should address the adequacy and relevancy ofsafeguards (both technical and locational) as they relate to each risk contributor.
214

c) The consequences (effects) of more likely hazardous events (i.e. those of high probability ofoccurrence) should, wherever possible, be contained within the boundaries of the installation.
d) Where there is an existing high risk from a hazardous installation, additional hazardousdevelopments should not be allowed if they add significantly to that existing risk.
V.I.8. Guidance Notes on Implementation
The following notes are provided to assist in the formulation and implementation of appropriaterisk assessment criteria:
a) The individual fatality and societal risk criteria should include all components of risk: fire,explosion and toxicity.
b) The implementation of the criteria must acknowledge the limitations and in some cases thetheoretical uncertainties associated with risk quantification. Two approaches are usually adoptedto account for such uncertainties: a 'pessimistic1 approach, i.e. assumptions err on theconservative side with overestimation of the actual risk; or 'best estimates' using realisticassumptions with an estimated risk that could either be an overestimate or an underestimate ofthe actual risk. The criteria suggested in this appendix are set at a realistic level.
c) In the context of b), a degree of flexibility in the implementation and interpretation of theabsolute values of the risk criteria may be justified in some cases. There may also be variationsin local conditions. Consideration of vulnerability of people and situations is necessary. Thecriteria are best implemented when used as targets rather than absolute levels. Nevertheless, anysubstantial deviations from such targets should be fully justified. It is advisable that in ail casesthe assessment process emphasizes the hazard identification and risk quantification process andprocedures rather than entirely relying on absolute risk levels.
d) Given the probabilistic nature of the assessment process, care must be exercised ininterpreting/assessing compliance with risk criteria in terming plants which exceed the suggestedcriteria as unsafe'. Nevertheless, a higher resultant risk level relative to the suggested criteriaindicates land use safety incompatibility and locational safety constraints.
e) The implementation of the risk criteria should differentiate between existing land use situationsand new situations in terms of applicability to reflect that a tighter locational and technologicalstandard is applied now than at earlier times. In the case of existing industry, compliance withrisk criteria is part of an overall strategy to mitigate existing risk levels by reducing both therisks and the number of people exposed to those risks. As such, risk criteria designed for newplants can only be used as targets for existing plants, as part of an overall safety strategy.
f) The risk to an individual and/or to the public in the vicinity of an industrial site arises from allindustrial activities in the area. The basic risk criteria (to various land uses) need to be relatedto the site. It may also be appropriate to plan for sub-criteria for each individual site to accountfor a cumulative impact of developments.
g) In a large industrial complex risk criteria should also provide for the potential of accidentpropagation. The risk of an accident at one plant triggering another accident at anotherneighbouring plant should be kept low. Adequate safety separation distances should bemaintained.
h) The application of the risk criteria should also apply to development/re-development ofresidential and other sensitive land uses in the vicinity of hazardous installations.
An example to illustrate how to define criteria for an area risk assessment is given in Table V.6.
215

TABLE V.6. EXAMPLE OF A SET OF CRITERIA FOR AN AREA RISK ASSESSMENT
Emissions in Water
Air Emissions
Major Hazards
Carcinogenic Risk
Pesticides
Nitrate
Lead
Other criteria can be derived from Table II.7.
SO,
Toluene
CO
Other criteria can be derived from WHO AirQuality Guideline Values (see Table II. 1)
< 0.03 ug/l
< 10mg/l
< 0.05 mg/i
< 500 ug/m3
< 8 ug/m3
< 100 mg/m3
< Individual risk 10"*
< 10"6
REFERENCE
V. 1. HEALTH AND SAFETY EXECUTIVE, The Tolerability of Risks from Nuclear Power Stations,HSME, London (1992).
216

Annex I
THE COUNCIL DIRECTIVE(82/501/EEC AND AMENDMENTS 87/216/EEC,88/610/EEC)
ON THE MAJOR-ACCIDENT HAZARDS OFCERTAIN INDUSTRIAL FACILITIES
The Directive is concerned with industrial activities which involve or may involve substancesthat are particularly dangerous in certain quantities, with the prevention of major accidents and thelimitation of their consequences for man and the environment. The general presentation is in the formof "Articles", some of which will be given below in a shortened version to permit better understandingof the related tables.
ARTICLE 1: Definitions
(a) Industrial activity means:
- any operation carried out in an industrial installation involving, or possibly involving, one ormore dangerous substances and capable of presenting major-accident hazards, and also transportcarried out within the establishment for internal reasons and the storage associated with thisoperation within the establishment,
— any other storage.
(b) Manufacturer means:
- any person in charge of an industrial activity;
(c) Major accident means:
— an occurrence such as a major emission, fire or explosion resulting from uncontrolleddevelopments in the course of an industrial activity, leading to a serious danger to man,immediate or delayed, inside or outside the establishment, and/or to the environment, andinvolving one or more dangerous substances;
(d) Dangerous substances means:
- for the purposes of Articles 3 and 4, substances generally considered to fulfil the criteria laiddown in Table 1-1.
— for the purposes of Article 5, substances listed in Table 1-3.
The indicative criteria for dangerous substances are the following:
(a) very toxic substances
(i) substances which correspond to the first line of Table 1-1.
(ii) substances which correspond to the second line of Table 1-1. and which, owing to theirphysical and chemical properties, are capable of producing major accident hazards similarto those caused by the substance mentioned in the first line.
(b) other toxic substances
(i) are the substances showing the values on line three of Table 1-1. of acute toxicity andhaving physical and chemical properties capable of producing major accident hazards.
217

TABLE 1-1. CRITERIA FOR TOXIC SUBSTANCES
ToxicityCase
1
2
3
LD50 (oral)mg/kg body weight
LD50 < 5
5 < LD50 < 25
25 < LD50 < 200
LD50 (cutaneous)mg/kg body weight
LD50 < 10
10 < LD50 < 50
50 < LD50 < 100
LC50
LC50
0.1 <
0.5 <
mg/1
<0.1
LC50
LC50
(inhalation)
<0.5
<2
LD50 (oral) in ratsLDso (cuteneous) in rats or rabbitsLCS0 by inhalation (four hours) in rats
(c) flammable substances
(i) flammable gases (substances which in the gaseous state at normal pressure and mixedwith air become flammable and the boiling point of which at normal pressure is 20°C orbeiow);
(ii) highly flammable liquids (substances which have a flash point lower than 21° C and theboiling point of which at normal pressure is above 20° C);
(iii) flammable liquids (substances which have a flash point lower than 55° C and whichremain liquid under pressure where particular processing conditions such as high pressureand high temperature may create major accident hazards).
(d) explosive substances
(i) substances which may explode under the effect of flame or which are more sensitive toshocks or friction than dinitrobenzene.
ARTICLE 3:
Member States shall adopt the provisions necessary to ensure that, in the case of any of the industrialactivities specified in Article 1, the manufacturer is obliged to take all the measures necessary toprevent major accidents and to limit their consequences for man and the environment.
ARTICLE 4:
Member States shall take the measures necessary to ensure that all manufacturers are required to proveto the competent authority at any time, for the purposes of controls, that they have identified existingmajor-accident hazards, adopted the appropriate safety measures, and provided the persons workingon the site with information, training and equipment in order to ensure their safely.
ARTICLE 5:
1. Without prejudice to Article 4, Member States shall introduce the necessary measures to requirethe manufacturer to notify the competent authorities.
- if in an industrial activity as defined in Article 1 (a), first indent, one or more of the dangeroussubstances listed in Table 1-3. are involved, or it is recognized that they may be involved, in thequantities laid down in Table 1-3. such as:• substances stored or used in connection with the industrial activity concerned,• products of manufacture;
218
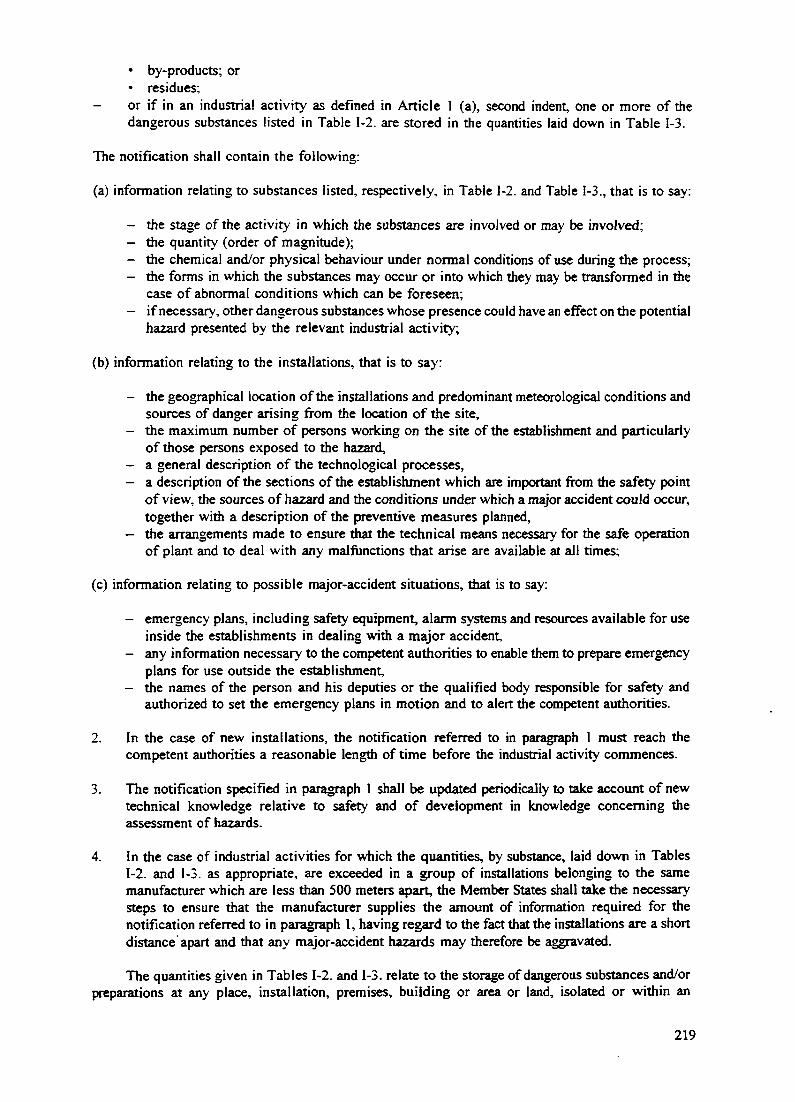
• by-products; or• residues;or if in an industrial activity as defined in Article 1 (a), second indent, one or more of thedangerous substances listed in Table 1-2. are stored in the quantities laid down in Table 1-3.
The notification shall contain the following:
(a) information relating to substances listed, respectively, in Table 1-2. and Table 1-3., that is to say:
- the stage of the activity in which the substances are involved or may be involved;- the quantity (order of magnitude);- the chemical and/or physical behaviour under normal conditions of use during the process;- the forms in which the substances may occur or into which they may be transformed in the
case of abnormal conditions which can be foreseen;- if necessary, other dangerous substances whose presence could have an effect on the potential
hazard presented by the relevant industrial activity;
(b) information relating to the installations, that is to say:
- the geographical location of the installations and predominant meteorological conditions andsources of danger arising from the location of the site,
- the maximum number of persons working on the site of the establishment and particularlyof those persons exposed to the hazard,
- a general description of the technological processes,- a description of the sections of the establishment which are important from the safety point
of view, the sources of hazard and the conditions under which a major accident could occur,together with a description of the preventive measures planned,
- the arrangements made to ensure that the technical means necessary for the safe operationof plant and to deal with any malfunctions that arise are available at all times;
(c) information relating to possible major-accident situations, that is to say:
- emergency plans, including safety equipment, alarm systems and resources available for useinside the establishments in dealing with a major accident,
- any information necessary to the competent authorities to enable them to prepare emergencyplans for use outside the establishment,
- the names of the person and his deputies or the qualified body responsible for safety andauthorized to set the emergency plans in motion and to alert the competent authorities.
2. In the case of new installations, the notification referred to in paragraph I must reach thecompetent authorities a reasonable length of time before the industrial activity commences.
3. The notification specified in paragraph 1 shall be updated periodically to take account of newtechnical knowledge relative to safety and of development in knowledge concerning theassessment of hazards.
4. In the case of industrial activities for which the quantities, by substance, laid down in Tables1-2. and 1-3. as appropriate, are exceeded in a group of installations belonging to the samemanufacturer which are less than 500 meters apart, the Member States shall take the necessarysteps to ensure that the manufacturer supplies the amount of information required for thenotification referred to in paragraph 1, having regard to the fact that the installations are a shortdistance apart and that any major-accident hazards may therefore be aggravated.
The quantities given in Tables 1-2. and 1-3. relate to the storage of dangerous substances and/orpreparations at any place, installation, premises, building or area or land, isolated or within an
219

TABLE 1-2. LIST OF SUBSTANCES FOR THE APPLICATION OF ARTICLES 3 AND 4
Substances or groups of substances
1. Acrylonitrile
2. Ammonia
3. Chlorine
4. Sulphur dioxide
5. Ammonium nitrate (')
6. Ammonium nitrate in the form offertilizers (2)
7. Sodium chlorate
8. Oxygen
9. Sulphur trioxide
10. Carbonyl chloride (Phosgene)
11. Hydrogen sulphide
12. Hydrogen fluoride
13. Hydrogen cyanide
14. Carbon disulphide
15. Bromine
16. Acetylene
17. Hydrogen
18. Ethylene oxide
19. Propylene oxide
2 0 . 2-Propena! (Acrolein)
2 1 . Formaldehyde (concentrat ion^ 90%)
2 2 . Bromomethane (Methyl bromide)
2 3 . Methyl isocyanate
2 4 . Tetraethyl lead or tetramethyl lead
2 5 . 1,2 Dibromoethane (Ethylene dibromide)
2 6 . Hydrogen chloride (liquefied gas)
Quantity (tonnes)_>
for application of articles 3 and 4
20
50
10
25
350
1 250
25
200
15
0,750
5
5
5
20
50
5
5
5
5
20
5
20
0,150
5
5
25
( ' ) This appl ies to ammonium nitrate and mixtures of ammonium nitrate w h e r e the nitrogen content derivedfrom the ammonium nitrate is greater than 2 8 % by weight and aqueous solutions of ammonium nitratewhere the concentration of ammonium nitrate is greater than 90% by w e i g h t
C2) This applies to straight ammonium nitrate fenilizers which comply with Directive 80/876/EEC and tocompound fertilizers where the nitrogen content derived from the ammonium nitrate is greater than 2 8 %by weight (a compound fertilizer contains ammonium nitrate together wi th phosphate and/or potash).
220

TABLE 1-3. LIST OF SUBSTANCES FOR THE APPLICATION OF ARTICLE 5
Substance
Group 1: Toxic substances(Quantity < 1 tonne)
Aldicarb
4-Aminodipheny 1
Amiton
Anabasine
Arsenic pentoxide. Arsenic (V) acidand salts
Arsenic trioxide, Arsenious (III) acidand salts
Arsine (Arsenic hydride)
Azinphos-ethyi
Azinphos-methyl
Benzidine
Benzidine salts
Beryllium (powders, compounds)
Bis (2-chloroethyl) sulphide
Bis (chloromethyi) ether
Carbofuran
Carbophenothion
Chlorfenvinphos
4-(Chloroformyl) morphoiine
Chloromethyi methyl ether
Cobalt metal, oxides, carbonates,sulphides, as powders
Crimidine
Cyanthoate
Cycloheximide
Demeton
Dialifos
00-Diethyl S-ethylsulphinylmethylphosphorothioate
00-Diethyl S-ethylsulphonylmethylphosphorothioate
Quantity (forapplication of
Article 5)
100 kilograms
1 kilogram
1 kilogram
100 kilograms
500 kilograms
100 kilograms
10 kilograms
100 kilograms
100 kilograms
1 kilogram
1 kilogram
10 kilograms
1 kilogram
1 kilogram
100 kilograms
100 kilograms
100 kilograms
1 kilogram
1 kilogram
1 tonne
100 kilograms
100 kilograms
100 kilograms
100 kilograms
100 kilograms
100 kilograms
100 kilograms
CAS number"
116-06-3
92-67-1
78-53-5
494-52-0
7784-42-1
2642-71-9
86-50-0
92-87-5
505-60-2
542-88-1
1563-66-2
786-19-6
470-90-6
15159-40-7
107-30-2
535-89-7
3734-95-0
66-81-9
8065-48-3
10311-84-9
2588-05-08
2588-06-09
EEC number'
006-017-OOX
051-056-00-1
015-039-00-9
612-042-00-2
603-046-00-5
006-026-00-9
015-044-00-6
015-071-00-3
613-004-00-8
015-070-00-8
015-088-00-6
221
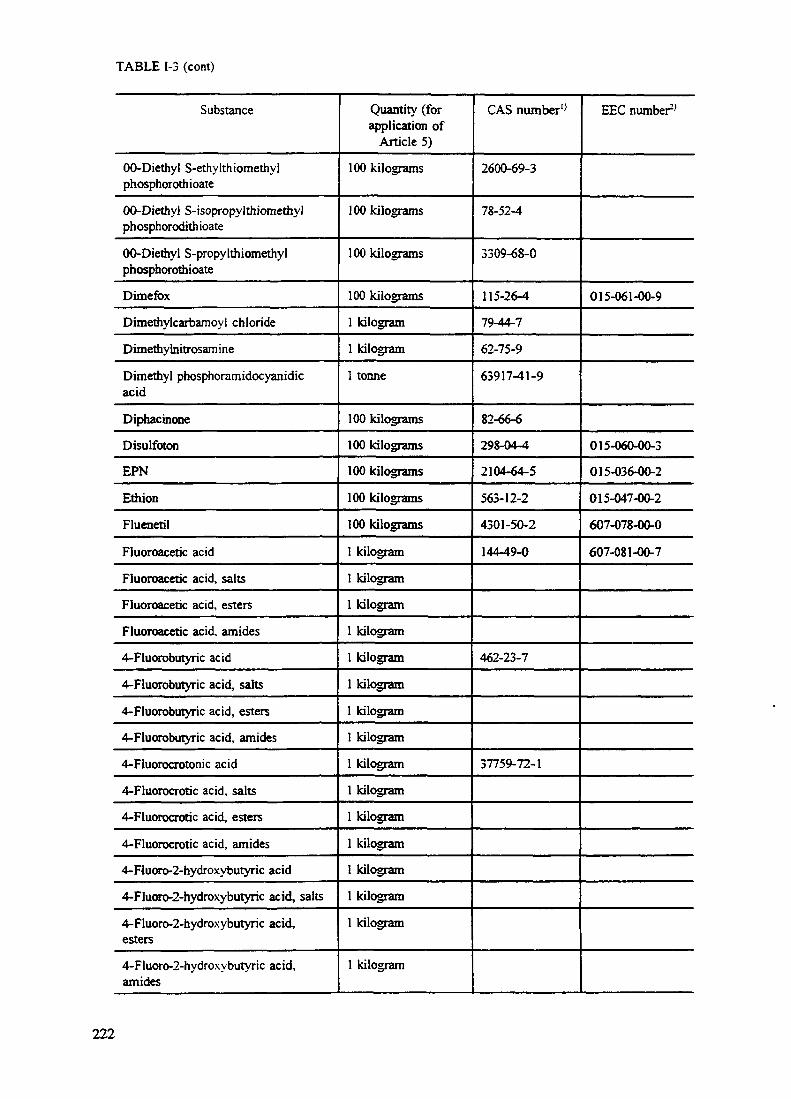
TABLE 1-3 (cont)
Substance
00-Diethyl S-ethylthiomethylphosphorothioate
00-Diethyl S-isopropylthiomethyJphosphorodithioate
00-Diethyl S-propylthiomethylphosphorothioate
Dimefox
Dimethylcarbamoyl chloride
Dimethylnitrosam ine
Dimethyl phosphoramidocyanidicacid
Diphacinone
Disulfoton
EPN
Ethion
Fluenetil
Fluoroacetic acid
Fluoroacetic acid, salts
Fluoroacetic acid, esters
Fluoroacetic acid, amides
4-Fluorobutyric acid
4-Fluorobutyric acid, salts
4-Fluorobutyric acid, esters
4-Fluorobutyric acid, amides
4-Fluorocrotonic acid
4-Fluorocrotic acid, salts
4-Fluorocrotic acid, esters
4-Fluorocrotic acid, amides
4-Fluoro-2-hydroxybutyric acid
4-Fluoro-2-hydroxybutyric acid, salts
4-Fluoro-2-hydroxybutyric acid,esters
4-Fluoro-2-hydroxybutyric acid,amides
Quantity (forapplication of
Article 5)
100 kilograms
100 kilograms
100 kilograms
100 kilograms
1 kilogram
1 kilogram
1 tonne
100 kilograms
100 kilograms
100 kilograms
100 kilograms
100 kilograms
1 kilogram
1 kilogram
1 kilogram
1 kilogram
1 kilogram
1 kilogram
1 kilogram
1 kilogram
1 kilogram
1 kilogram
1 kilogram
1 kilogram
1 kilogram
1 kilogram
1 kilogram
1 kilogram
CAS number0
2600-69-3
78-52-4
3309-68-0
115-26-4
79-44-7
62-75-9
63917-41-9
82-66-6
298-04-4
2104-64-5
563-12-2
4301-50-2
144-49-0
462-23-7
37759-72-1
EEC number*
015-061-00-9
015-060-00-3
015-036-00-2
015-047-00-2
607-078-00-0
607-081-00-7
222

TABLE 1-3 (com)
Substance
Glycolonhrile (Hydroxyacetonitrile)
1,2,3,7,8,9-Hexachlorodiben2o-p-dioxin
Hexamethylphosphoramide
Hydropen selenide
Isobenzan
Isodrin
Juglone (5-Hydroxynaphthalene-l, 4-dione)
4,4'- Methylenebis (2-chloroaniline)
Methyl isocyanate
Mevinphos
2-Naphthy lamine
Nickel metal, oxides, carbonates,sulphides, as powders
Nickel tetracarbonyl
Oxydisulfoton
Oxygen difluoride
Paraoxon (Diethyl 4-nitrophenylphosphate)
Parathion
Parathion-methyl
Pensulfothion
Pentaborane
Phorate
Phosacetim
Phosgene (Carbonyl chloride)
Phosphamidon
Phosphine (Hydrogen phosphide)
Promurit (l-(3,4-Dichlorophenyl)-3-triazenethio-carboxamide)
1,3-Propanesultone
l-Propen-2-chloro-l,3-diol diacetate
Pyrazoxon
Quantity (forapplication of
Article 5)
100 kilograms
100 kilograms
1 kilogram
10 kilograms
100 kilograms
100 kilograms
100 kilograms
10 kilograms
ISO kilograms
100 kilograms
1 kilogram
1 tonne
10 kilograms
100 kilograms
10 kilograms
100 kilograms
100 kilograms
100 kilograms
100 kilograms
100 kilograms
100 kilograms
100 kilograms
750 kilograms
100 kilograms
100 kilograms
100 kilograms
1 kilogram
10 kilograms
100 kilograms
CAS number"
107-16-4
19408-74-3
680-31-9
7783-07-5
297-78-9
465-73-6
481-39-0
101-14-4
624-83-9
7786-34-7
91-59-8
13463-39-3
2497-07-6
7783-41-7
311-45-5
56-38-2
298-00-0
115-90-2
19624-22-7
298-02-2
4104-14-7
75-44-5
13171-21-6
7803-51-2
5836-73-7
1120-71^
10118-72-6
108-34-9
EEC number2'
602-053-00-0
602-050-00-1
615-O01-O0-7
015-020-00-5
612-022-00-3
028-001-00-1
015-096-00-X
015-034-00-1
015-035-00-7
015-090-00-7
015-033-00-6
015-092-00-8
006-002-00-8
015-022-00-6
015-023-00-1
223

TABLE 1-3 (cont)
Substance
Selenium hexafluoride
Sodium selenite
Stibine (antimony hydride)
Sulfotep
Sulphur dichloride
Tellurium hexafluoride
TEPP
2,3,7,8-Tetrachlorodibenzo-p-dioxin(TCDD)
Tetramethylenedisulphotetramine
Thionazin
Tirpate (2,4 Dimethyl-1,3-dithiolane-2-carboxaldehydeo-methylcarbamoyloxime)
Trichloromethanesulphenyl chloride
1-Tri(cyclohexyl)stannyl -H -1,2,4triazole
Triethylenemelamine
Warfarin
Group 2: Toxic substances(Quantity > 1 tonne)
Acetone cyanohydrin (2 Cyanopropan2ol)
Acrolein (2-Propenal)
Acrylonitrile
Allyl alcohol (2-Propen 1 ol)
Allyelamine
Ammonia
Bromine
Carbon disulphide
Chlorine
Ethylene dibromide (1,2-Dibromoethane)
Ethyleneimine
Quantity (forapplication of
Article 5)
10 kilograms
100 kilograms
100 kilograms
100 kilograms
1 tonne
100 kilograms
100 kilograms
1 kilogram
1 kilogram
100 kilograms
100 kilograms
100 kilograms
100 kilograms
10 kilograms
100 kilograms
200 tonnes
200 tonnes
200 tonnes
200 tonnes
200 tonnes
500 tonnes
500 tonnes
200 tonnes
25 tonnes
50 tonnes
50 tonnes
CAS number0
7783-79-1
10102-18-8
7803-52-3
3689-24-5
10545-99-0
7783-80-4
107-49-3
1746-01-6
80-12-6
297-97-2
26419-73-8
594-42-3
41083-11-8
51-18-3
81-81-2
75-86-5
107-02-8
107-33-1
107-18-6
107-11-9
7664-41-7
7726-95-6
75-15-0
7782-50-5
106-93-4
151-56-4
EEC number'
015-027-00-3
016-013-00-X
015-025-00-2
607-056-00-0
608-004-00-X
605-008-00-3
608-003-00-4
603-015-00-6
612-046-00-1
007-001-00-5
035-001-00-5
006-003-00-3
017-001-007
602-010-00-6
613-001-00-1
224

TABLE 1-3 (cont)
Substance
Formaldehyde (concentration) >90%)
Hydrogen chloride (liquefied gas)
Hydrogen cyanide
Hydrogen fluoride
Hydrogen sulphide
Methyl bromide (Bromomethane)
Nitrogen oxides
Propyleneimine
Sulphur dioxide
Sulphur trioxide
Tetraethyl lead
Tetramethyl lead
Group 3: Highly reactivesubstances
Acetylene (Ethyne)
Ammonium nitrate
Ammonium nitrate in the form offertilizers
2£ Bis(tert-butylperoxy)butane(concentration > 70%)
1,1 -Bis(tert-butylperoxy)cyclohexane(concentration > 80%)
tert-Butyl peroxyacetate(concentration > 70%)
tert-Butyl peroxyisobutyrate(concentration > 80%)
tert-Butyl peroxy isopropyl carbonate(concentration > 80%)
tert-Butyl peroxymaleate(concentration > 80%)
tert-Butyl peroxypivalate(concentration > 77%)
Dibenzyl peroxydicarbonate(concentration > 90%)
Di-sec- butyl peroxydicarbonate(concentration > 80%)
Quantity (forapplication of
Article 5)
50 tonnes
250 tonnes
20 tonnes
50 tonnes
50 tonnes
200 tonnes
50 tonnes
50 tonnes
250 tonnes
75 tonnes
50 tonnes
50 tonnes
50 tonnes
2500 tonnes
5000 tonnes
50 tonnes
50 tonnes
50 tonnes
50 tonnes
50 tonnes
50 tonnes
50 tonnes
50 tonnes
50 tonnes
CAS number"
50-00-0
7647-01-0
74-90-8
7664-39-3
7783-06-04
74-83-9
11104-93-1
75-55-8
7446-09-5
7446-11-9
78-00-2
75-74-1
74-86-2
6484-52-2
2167-23-9
3006-86-8
107-71-1
109-13-7
2372-21-6
1931-62-0
927-07-1
2144-45-8
19910-65-7
EEC number'
605-001-01-2
017-002-00-2
006-006-OO-X
009-002-00-6
016-001-00-4
602-002-00-3
016-011-00-9
601-015-00-0
225

TABLE 1-3 (com)
Substance
Diethyl peroxydicarbonate(concentration > 30%)
2,2 Dihydroperoxypropane(concentration > 30%)
Di-isobutyl peroxide(concentration > 50%)
Di-n-propyl peroxydicarbonate(concentration > 80%)
Ethylene oxide
Ethyl nitrate
3,3,6,6,9,9-Hexamethyl-1,2,4,5,-tetroxacyclononane(concentration > 75%)
Hydrogen
Methyl ethyl ketone peroxide(concentration > 60%)
Methyl isobutyl ketone peroxide(concentration > 60%)
Liquid oxygen
Peracetic acid(concentration > 60%)
Propylene oxide
Sodium chlorate
Group 4: Explosive substances
Barium azide
Bis (2,4,6-trinitrophenyl)amine
Chlorotrinitrobenzene
Cellulose nitrate (containing>12.6%nitrogen)
Cyclotetramethylenetetranitramine
Cyclotrimethylene trinitramine
Diazodinitrophenol
Diethylene glycol dinitrate
Dinitrophenol, salts
Ethylene glycol dinitrate
Quantity (forapplication of
Article 5)
50 tonnes
50 tonnes
50 tonnes
50 tonnes
50 tonnes
50 tonnes
50 tonnes
50 tonnes
50 tonnes
50 tonnes
2000 tonnes
50 tonnes
50 tonnes
250 tonnes
50 tonnes
50 tonnes
50 tonnes
100 tonnes
50 tonnes
50 tonnes
10 tonnes
10 tonnes
50 tonnes
10 tonnes
CAS number0
14666-78-5
2614-76-8
3437-84-1
16066-38-9
75-21-8
625-58-1
22397-33-7
1333-74-0
1338-23-4
37206-20-5
7782-44-7
79-21-0
75-56-9
7775-09-9
18810-58-7
131-73-7
28260-61-9
9004-70-0
2691-41-0
121-82-4
7008-81-3
693-21-0
628-96-6
EEC number2'
603-023-00-X
007-007-00-8
001-001-00-9
008-001-00-8
607-094-00-8
603-055-00-4
017-005-00-9
612-018-00-1
610-004-00-X
603-037-00-6
603-033-00-4
609-017-00-3
603-032-00-9
226

TABLE 1-3 (cont)
Substance
1 -Guanyl-4-n itrosaminoguany 1-1 -tetrazene
2,2', 4,4', 6,6'-Hexanitrosti)bene
Hydrazine nitrate
Lead azide
Lead styphnate (Lead 2,4,6trinitroresorcinoxide)
N-Methyl-N, 2,4,6 -N-tetranhroaniline
Nitroglycerine
Pentaerytfaritol tetranitrate
Picric acid (2,4,6-TrinitrophenoI)
Sodium picramate
Styphinc acid (2,4,6-Trinitroresorcinol)
1,3,5-Triamono-2,4,6-trinitrobenzene
Trinitroaniline
2,4,6 Trinitroanisole
Trinitrobenzene
Trinitrobenzoic acid
Trinitrocresol
2,4,6 Trinitrophenetole
2,4,6-Trinitrotoluene
Group 5: Flammable substances
Flammable substances as defined inArtide 1, para (cXO
Flammable substances as defined inArticle 1, para (c)(ii)
Flammable substances as defined inArticle 1, para (cXiii)
Quantity (forapplication of
Article 5)
10 tonnes
50 tonnes
50 tonnes
50 tonnes
50 tonnes
50 tonnes
10 tonnes
50 tonnes
50 tonnes
50 tonnes
50 tonnes
50 tonnes
50 tonnes
50 tonnes
50 tonnes
50 tonnes
50 tonnes
50 tonnes
50 tonnes
200 tonnes
50000 tonnes
200 tonnes
CAS number"
109-27-3
20062-22-0
13464-97-6
13424-46-9
15245-44-0
479-45-8
55-63-0
78-11-5
88-89-1
831-52-7
82-71-3
3058-38-6
26952-42-1
606-35-9
25377-32-6
35860-50-5129-66-8
28905-71-7
4732-14-3
118-96-7
EEC number'
082-003-00-7
609-019-00-4
612-017-00-6
603-034-00-X
603-035-00-5
609-009-00-X
609-018-00-9
609-011-00-0
609-005-00-8
609-012-00-6
609-008-00-4
l} CAS Number (Chemical Abstracts Number) means the number assigned to the substance by theChemical Abstracts Service, details of which can be obtained from the United Kingdom Chemical InformationService, University of Nottingham, Nottingham.2> EEC Number means the number assigned to the substance by the Commission of the EuropeanCommunities, details of which can be obtained from its office at 20 Kensington Palace Gardens, London W84QQ.
227

establishment or group of stores belonging to the same manufacturer where the distance between thestores is not sufficient to avoid, in foreseeable circumstances, any aggravation of major accidenthazards. These quantities apply in any case to each group of stores belonging to the same manufacturerwhere the distance between the stores is less than 500 m.
The quantities to be considered are the maximum quantities which are, or are liable to be, instorage at any one time.
228

Annex II
AWARENESS AND PREPAREDNESS FOR EMERGENCIES AT LOCAL LEVEL(APELL)
II-1. FRAMEWORK OF THE APELL PROCESS
The Industry and Environment Office of the United Nations Environment Programme (UNEP)has developed, in co-operation with industry, a process for Awareness and Preparedness forEmergencies at Local Level (APELL). The process, detailed in a handbook, is designed to assistdecision-makers and technical personnel in improving awareness of hazardous installations at the levelof a local community and to prepare adequate plans should unexpected events at the installationsendanger life, property or the environment. The process heavily relies on ensuring strong and effectiveco-ordination between the three main parties: local authorities, industry and the local community andinterested groups. Provisions are made for the local community in particular to participate in theprocess, with the right to be informed about the nature and extent of hazards applicable in their areaand to participate in response planning for hazardous events. A co-ordinating group with communityparticipation and with responsibilities to gather facts, assess risks, establish priorities, organize humanand other resources to implement emergency response actions, is the key organizational step to makethe APELL process work.
The main goal of APELL is to protect the community against loss of life and damage toproperty and the environment
• Establishing an emergency response plans in the local area.
• Integrating industry emergency plans with local emergency response plans in a single plan.
• Involving members of the local community in the process of the overall emergency responseplan.
• Providing information on the hazards involved in industrialoperations on the site, and the measures taken to reducethese risks.
n-1.1. Responsibilities of the Different Parties nnder APELL
Specific responsibilities and roles of APELL partners are the following:
* Industrial Facilities: the plant manager is normally responsible for safety and accidentprevention precautions and specific emergency preparedness measures within the plantboundaries. Members of the public may also seek information on hazards and risks from thelocal plant manager. The plant manager must be prepared to respond to these inquiries. Withinthe framework of the APELL process, all industrial facilities have a responsibility to establishand implement a "facility emergency response plan." A safety review of facility operations playsa fundamental role.
* Local Authorities: have the basic duty to develop awareness of and preparation for emergenciesat local level.
* Community Leaders: they serve to attract the attention of industry and government andrepresent the concerns of the community on hazardous activities. Fig. II-1 presents the APELLinformation and organization flow chart.
229

Co-ordinating Group: provides the bridge between industry and local government with the co-operation of community leaders to develop a unified and co-ordinated approach to emergencyresponse planning and communication with the community (see Fig. II-2).
• National Governments: have the responsibility of organizing, maintaining and reviewing plansfor an adequate level of preparedness in emergency conditions. They are encouraged to establisha climate conducive to the implementation of the APELL process.
II-1.2. Scope and Content of APELL
Specific issues have to be addressed in emergency preparedness planning according to theAPELL framework:
• identify local agencies (e.g. fire department, police, public health agency, environmental agency,NGO etc.) making up the community's potential local awareness and response preparednessnetwork;
• identify the hazards (e.g. industrial, transportation) that may produce an emergency situation;
• establish the current status of community planning and co-ordination for hazardous materialsemergency preparedness and assure that potential overlaps in planning are avoided;
• identify the specific community points of contact and their responsibilities in an emergencysituation;
identify the equipment and materials available at the local level to respond to emergencies;
• identify organizational structure for handling emergencies (e.g. the Co-ordinating Group, chain-of-command);
• verify if the community has specialized emergency response teams to respond to hazardousmaterials releases;
define and verify the operability of the community emergency transportation network;
set up community procedures for protecting citizens during emergencies;
• set up a mechanism that enables responders to exchange information or ideas during anemergency with other entities.
It should be clear that the Co-ordinating Group has not itself a direct operational role during anemergency, but is preparing the various parties involved to be ready and know their tasks should anaccident occur.
The practical experience of dealing with emergency situations leads to a ten step approach forthe APELL process for planning for emergency preparedness. The corresponding flow chart forimplementation is given in Fig. II-3.
Criteria for assessing local preparedness reflect the basic elements judged to be important fora successful emergency preparedness programme. The criteria are separated into six categories (hazardsanalysis, authority, organizational structure, communications, resources and emergency planning) allof which are closely interrelated.
Emergency response planning elements considered within the APELL process are: organizationalresponsibilities, risk evaluation, notification procedures and communication systems, emergency
230

Centralgovernment
I
Nationalindustryassoc.
1
11I
1
I
I
I
I
I
I
Researchdevelopmentagencies
Localgovernment
COORDINATING GROUP
Load authority officials
roolity monocjers
Community emergencyresponse agency officials(Fire, FoEce, Heanh, etc)
Community leaders
Non-gov.organizationsServiceorganizations
localcommunity
FIG. II-J. APELL information and organization flow chart
231

INDUSTRYRESPONSIBILITIES
1. Assure safe work practices.2. Assure personal safety of
employees and visitors.3. Establish safety programmes.4. Protect lives and property
on-site.5. Co-ordinate all plant
personnel during anemergency.
6. Develop plans andprocedures to respond toemergencies.
7. Provide security, safetyequipment, training, andinformation on chemicalhazards.
V
COORDINATING GROUPBRIDGING ACTIONS
* Open lines ofcommunicationsInformation sharingCo-ordinate emergency plansand proceduresInteract with otheremergencyresponse agenciesJoint .education and training
"Common problem solvinggroupMutual aid assistance
LOCAL GOVERNMENTRESPONSIBILITY
1. Provide a safe community.2. Assure the safety and
well-being of all residentsand transients withincommunity.
3. Establish public safetyprogrammes.
4. Protect lives, as well asprivate and public property.
5. Co-ordinate communityemergency response forcesduring an emergency.
6. Develop plans andprocedures to respond toemergencies.
7. Conduct training, drills,and exercises withother response agencieswithin the community,area, or state.
8. Maintaincommunication channelswith national governments.
FIG. II-2. Responsibility bridge
equipment and facilities assessment capabilities, protective action procedures, post-emergencyprocedures, training and programme maintenance. The status of each item has to be evaluated inaccordance with a specified structure which outlines the issues for each planning element. A checklistfor evaluation of the emergency response plan is meant to determine if the plan that does existadequately addresses theneeds of the community or entity for which the plan was developed. A matrixapproach for emergency response plan evaluation is presented in Fig. II-4. The APELL processrecommends status reports for industry as well as for local authorities.
II-2. EMERGENCY PLANNING AND PROCEDURES AT THE SITE LEVEL
II-2.1. Overall Framework
This section outlines specific guidelines for the preparation of emergency plans and proceduresfor premises which process, store or transport hazardous materials. These plans and procedures shouldbe developed and tailored to the specific needs and hazards at each site. A clear understanding ofpotential hazards will aid the development of preventive measures.
Emergency plans should be simple but complete. The emergency plans will deal in detail withon-site emergencies but consideration must also be given to the extent possible to off-site effects.Actions to control and minimize off-site effects must be listed. Access to adjacent properties may berequired to implement the emergency plans under some circumstances and arrangements to achievethis should be clearly stated. Response actions in the plan must be clear and easy to implementpromptly. The emergency plans should be in a simple format to allow revision.
232

IDENTIFYPARTICIPANTS
AND ESTABLISHCOMMUNICATIONS
EVALUATERISKS OFFSITE
REVIEWEX1STINC PLANSAND IDENTIFYWEAKNESSES
1 f
TASKID.ENTIFICATION
MATCH TASKSAND RESOURCES
I
i
INTEGRATEINDIVIDUAL PLAN
INTO OVERALLPLAN AND REACH
ACREEMENT
PREPARE FINALPLAN AFlt) O b i AlN
APPROVALS
TRAINING
4 1
^
TESTING. REVIEWAND UPDATING
I
nmuc:KDUCATION
\
FIG. II-3. Community emergency plan implementation flow chart
II-2.1.1. Essential Elements of Emergency Plans
The critical elements of an emergency plan are:
The clear identification of the site and its location;Clear identification of hazardous materials and their quantities;Clear site specific identification of the nature and extent of potential hazardous incidents andemergency situations;
233

Plans evaluated
Planning Elements
^^f OOOlZOtlOOOl
Responsibilities
Risk Evaluation
Notification Proceduresand CommunicationsSystems
Core elements in PlaceOIMJ uiMSf^siicy oo^Mpmenrend lucjUMes KBoatness
A i u n m a n l f~V»-w-il-JfowK
Protective ActionProcedures
Pubhc Education and•wocmonon
Post uueiyencyProcedures
Irouvngond Drifls
r* t i * • , ,
Regional local Governments(Counfry/Gfy/Town)
Other(industrial/institutional
KEY:A-AcceptableB - Minimal work neededC - Substantial wHc neededN-No* applicable
FIG. U-4. Emergency response plan evaluation matrix
• Clear definition of authority in the plan's command structure and authority for its preparationand revision;
• Demonstrable company commitment to the plan;Clear exercise, review and revision arrangements to test the plan and keep it operational.
11-2.1.2. Principles Applying to Emergency Plans
The following principles apply to the development of an emergency plan and must beincorporated in the plan.
234

Emergency Control: every effort must be made to control, reduce or stop the cause of anyemergency provided it is safe to do so. For example, if there is a fire, isolate the fuel supply and limitthe propagation of the fire by cooling the adjacent areas. Then confine and extinguish the fire (whereappropriate) making sure that re-ignition cannot occur. If it is a gas fire it is usually appropriate toisolate the fuel and let it burn itself out but keep everything around the fire cool.
Damage Control: every effort must be made to minimize any secondary damage and to preventthe propagation of damage after the initial emergency.
Rescue and First-Aid: the basis of good first-aid in an emergency is to reconnoitre the area andcommence rescue with the aim of doing the greatest good for the greatest number of people. All thepeople who were on-site must be accounted for. If someone cannot be accounted for after anexhaustive check a rescue search must be commenced immediately.
Rescue operations must never endanger the safety of the rescuers.
The rescue team must have adequate personal protection to carry out the search safety.
Any injured people who can be moved safely or are likely to sustain further injury must be takento safety for treatment. Those people who are trapped or unable to be moved immediately must begiven first-aid on the spot.
Care must be taken in selecting the treatment area to ensure that the area is safe and that thereis adequate vehicle access.
Communications: effective communications are usually the most difficult and demanding aspectof any emergency. The need for simple standard procedures, frequent training, testing and retrainingcannot be over-stressed.
Time: the plan must be based on the likely event of an emergency occurring at any time, notonly during normal business hours.
Stages in a Planned Emergency Response: Fig. II-5 shows in a generalized form the stagesin a planned emergency response. The elements in Fig. II-5 should be taken into account in draftingthe company plan.
U-2J2. Scope and Content of Emergency Plan
The following information should ideally be included in the formalized emergency plans (seebox).
Scope and Content of an Emergency Plan at the Plant Level
Plant size and layout of the facility• Definition of situations covered under emergency• The aims of plan preparation
Purpose of the plan• Inventory of hazardous materials on the site
Details of the types of emergency
(i) The Site Plan
A brief description of the facility covered by the plan should be included together withappropriate site layout.
235

EviCUtU IS Ml* »U*rt**f (Mil
M e t )
AIMI I enutMa* and mail*t»<op(*«u ratanafc
«iMft«ney
INTERNAL EMER0EN6Y PROCEDURESACTIVATED BY NOTFYNO
R«l«vanl Company Panoftnat
Ntlgntowlno. PUnlt
Company Emtngmcr Cefflmmdw•t iuiMt HipmiMhy UMI i»pnp(liltCflMiftneir Stnte* Offlnr Uk»» eoMreld Iht i0*cMe «m*ivMiqr.1>>* Comptn)f
OOnwnifiMf mufi Ml M MPvMb EmMptncy Conm-
to Aaw
beW* H U M
«p«itlbM
huttul Mte
4k*di praeadwal to Mlum tonoimil optiaitont.
EMERGENCY DISOOVEflEO
ALARM HAISED
SUnd by Ttchnlul Ptnenndt« b* •) gM» » niMi *ndbritl emtigtncr 6»rvte«i
ptnent Item t t • t i l totntMtln eoml«rt contact «ViEmaiginey Cornnandtf andEmaiganey Santo* PansnMl
MMEOWTELY HOTFY 000 PDAAPPROPRIATE EMERGENCYSERVICE ORQANtSATKM
Enxigtflqr S*nlM
End of g y•ml final dabttoflnj
f el tf/llenon • iMp—OWPert Oo»<alb<w C*rtm24 houn
Emanjtney SaMettRaqwii teplletbla aanto*(La.FVa Brtgad*. Pofc»_)K K
Nalur* of fl»
Nam*. tVMl. lubwb, natmtCrost MfMl / p
Siau wti«th»( e» rel ptnsraan Irapp*tf/lr(via4
Tal«pf>»nt tentad nvmb*f
Wh*>a aV*d ewnad nth tn•ipanbalen h*> ba*naiMntlal 0>an V M a«*a* t« yTtM'OOO* ayittm k dat^natf •> hto hand* mulbU tk / ra tor l » taiwIneldaAl.
F/G. 11-5. Stages in emergency response

(ii) Definition of Situations Covered
A clear, simple definition of what constitutes an emergency on the site and the various levelsof emergency which are possible must be adopted.
An emergency can be described as an abnormal and dangerous situation needing prompt actionto control, correct and return to a safe condition. An emergency is a situation which may not becontained immediately by the people on duty using the available resources, where injuries have orcould be incurred, where damage has occurred or property is placed in jeopardy or where the impacthas the potential to result in serious environmental consequences.
The suggested levels of emergency are:
Local Alert for any situation which threatens life, property or the environment;Site Alert where effects may spread to other areas on the site;External Alert where effects may spread and impact on the people, property or the environmentoutside the site or cannot be contained by site resources.
The plan should make it clear that, if in doubt, the event should be treated as an emergency. Forexample, all fires must be treated as emergencies.
(iii) The Aims of the Preparation of the Plan
A simple statement of aims would usually include the following elements:
• to decrease the level of risk to life, property and the environment;• to control any incident and minimize its effects;• to provide the basis for training and preparedness for all people who could be involved in any
emergency at the site.
(iv) Purpose of Plan
The intent of the plan should be set out along the following lines:
• to control or limit any effect that an emergency or potential emergency may have on the site oron neighboring areas;
• to facilitate emergency response and to provide such assistance on the site as is appropriate tothe occasion;to ensure communication of all vital information as soon as possible;to facilitate the reorganization and reconstruction activities so that normal operations can beresumed;to provide for training so that a high level of preparedness can be continually maintained; andto provide a basis for updating and reviewing emergency procedures.
(v) Hazardous Materials, Manufactured, Stored or Used On-Site
A list of hazardous materials and harmful substances should be prepared with the associatedinformation on: international code, safety data sheet, average/maximum inventory in storage,average/maximum inventory in process, the location of each of these materials clearly indicated andcross referenced to the site layout diagram.
The place where the Material Safety Data Sheets are stored must be nominated. It is prudent tohave at least two sets of Safety Data Sheets to provide for a situation when the initial set cannot beaccessed safely.
237

Each company of the industrial complex (plant) must prepare its own lists of dangerous goods.
All people who could be involved in any emergency must be familiar with the informationcontained in the Material Safety Data Sheets. Training and retraining will be required.
Note: Accurate and up-to-date information on hazardous materials is vital to the plan.
(vi) Types of Accident and Emergency Response
The types of accidents and emergencies are the crux of the plan. If they are not properlyidentified the plan cannot be developed on a sound base.
This section of the emergency plan must include consideration of the following emergencies andtheir potential impact on the site:
Fire (Including toxic combustion products)ExplosionSpills (Liquids, solids, radioactive or other dangerous materials)Gas Leak - toxic
Natural Events: (which initiate other on-site events)
Flood, grass fire, bush fireEarthquakeCyclones, wind and electric stormsTsunamis (seismic sea-waves)Exotic stock/plant diseaseHuman epidemic/plagueLand slip/subsidence
Impact Events
Road vehiclesRailwaysAircraft
Civil Disturbances
RiotsBomb threats.
For all these cases initiating and secondary events must be considered, e.g. an LPG explosionor fire which causes a nearby vessel to fail and release flammable or toxic materials; a windstormcausing structural damage which results in a liquid spill.
This emergency identification requires a systematic approach such as formal hazard identificationand consequence analysis (see Chapters 3 and S). Frequency/probability analysis and quantified riskassessment may also be useful in determining appropriate levels of preparedness.
All plants must have intrinsically safe operating conditions if any of their services areinterrupted. The intrinsic safety of the plant when services fail must be tested on a regular basis andthe results of these tests recorded.
Risks may be higher at specific times or during particular operations, e.g. loading or unloading.
238

(vii) Alarm Initiation
This section of the emergency plan must include a description of the alarm systems installed,how they are operated, when they are tested and details of the test records.
An alarm is a communication act to which there must always be an appropriate response.
The plan must indicate that any person discovering an emergency situation or a situation whichis likely to give rise to an emergency must activate the alarm procedure and then immediately contacta supervisor or senior person.
If in doubt the alarm should always be activated first and then the doubt clarified.
If the site supervisor is on-site he/she or a specifically nominated person will become the on-siteemergency commander, who will authorize or confirm the level of emergency.
The section on alarm initiation must cover:
who can raise alarm (alarm points must be clearly identified);what does alarm activate;
• identification of signal:
Visual (e.g. flashing red light),Audio (e.g. siren),Hard copy (e.g. printed message);
• who receives alarm (e.g. Fire Brigade);what are actions on receipt of alarm (this should be a pre-planned response);how alarm is raised;
• how is raising of alarm confirmed;duplication of alarm system (will system work in power failure?);how and when is the alarm system tested;
• how test results are recorded and by whom;• arrangements for independent verification of alarm testing and recording by person within
organization.
The ability of the alarm system to reach all relevant people under all operating conditions mustbe tested regularly.
(viii) Emergency Response and Control
The plan must identify clearly who will be the Company Emergency Commander and how thatperson can be recognized at all times. The functions of a Company Emergency Commander arepresented in Fig. II-6.
The Company Emergency Commander must have:
site knowledge;current knowledge of materials on-site;knowledge of processes used on-site;
• adequate personal protection for all possible emergencies.
The plan must also nominate the location of the site command center.
239
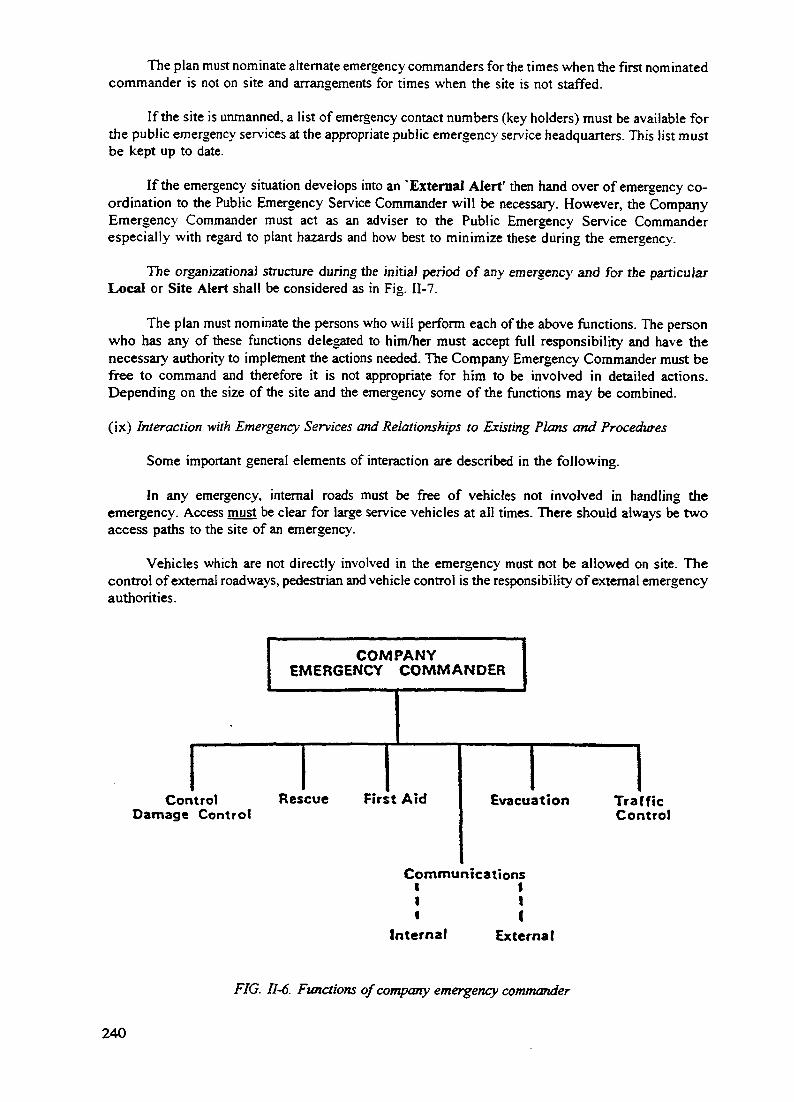
The plan must nominate alternate emergency commanders for the times when the first nominatedcommander is not on site and arrangements for times when the site is not staffed.
If the site is unmanned, a list of emergency contact numbers (key holders) must be available forthe public emergency services at the appropriate public emergency service headquarters. This list mustbe kept up to date.
If the emergency situation develops into an External Alert' then hand over of emergency co-ordination to the Public Emergency Service Commander will be necessary. However, the CompanyEmergency Commander must act as an adviser to the Public Emergency Service Commanderespecially with regard to plant hazards and how best to minimize these during the emergency.
The organizational structure during the initial period of any emergency and for the particularLocal or Site Alert shall be considered as in Fig. II-7.
The plan must nominate the persons who will perform each of the above functions. The personwho has any of these functions delegated to him/her must accept full responsibility and have thenecessary authority to implement the actions needed. The Company Emergency Commander must befree to command and therefore it is not appropriate for him to be involved in detailed actions.Depending on the size of the site and the emergency some of the functions may be combined.
(ix) Interaction with Emergency Services and Relationships to Existing Plans and Procedures
Some important general elements of interaction are described in the following.
In any emergency, internal roads must be free of vehicles not involved in handling theemergency. Access must be clear for large service vehicles at all times. There should always be twoaccess paths to the site of an emergency.
Vehicles which are not directly involved in the emergency must not be allowed on site. Thecontrol of external roadways, pedestrian and vehicle control is the responsibility of external emergencyauthorities.
COMPANYEMERGENCY COMMANDER
ControlDamage Control
Rescue First Aid Evacuation TrafficControl
CommunicationsI II 1f f
Internal External
FIG. II-6. Functions of company emergency commander
240

EMERGENCY DISCOVERED
1ALARM RAISED
Local AMI
Local RoudntYts
Slw noudm
ExlmralAtat DU
REQUEST EMERGENCY OR6AMSAT1ONS
ACTION TO RETURN SITETO SAFE CONDITION
ACTIONfO REFORM LOCALAREA TO SAFE CONDITION
ARRIVAL OF EMERGENCY ORGANISATION
HAND OVER CONTROL TO PUBLIC
EMERGENCY SERVICE OOM4ANDER
COMPANYEMERGEHCYCOMMANDERAS TECHMCAL ADVISER
rL
CONTROL\ DAMAGE CONTROL
RESCUE
FIRST AH)
• •< j OXAIUMC^TI0NSWrERNAL\ EXTERNAL
J ^ [EVACUATION
TRAFFIC CONTROL
JENDOFEMEMENCY
HAND OVER CONTROL TO
C0M>ANY»EnGENCYCOWMANDER
•KJOEHTroN
FIG. II-7. Sample emergency organization flow chart
241

If the emergency operations control centre is activated, the public emergency servicecommanders would attend there and control the operation from that centre. All externalcommunications, directions or requests would then be relayed to and from emergency co-ordinationcentre.
The company emergency commander will remain at the site.
Where it is apparent that a serious incident has taken place which has or may result in seriousinjury or death to a significant number of people, immediate steps are to be taken to initiate a disastermedical plan.
(x) Notification of Authorities
The plan must set out the procedures for contacting, where necessary, the public emergencyservices, adjacent companies and other neighbors.
Emergency services: Direct telephone contacts or alarm systems should be made available tothe emergency services. The communication system must be designed such as to handle multiplealarms for the same incident.
Neighbouring companies: notification procedures for adjacent companies, other neighbors andthe public in the area need to be developed specifically for each site. Contact people, phone numbersor alternative communication systems should be mutually agreed and documented. Notificationprocedures should cater for emergencies outside normal operating hours of the company and itsneighbors.
(xi) Internal Emergency Resources
All internal emergency resources that are available should be listed and their locations shown.
e.g. - Emergency vehicle(s)Fire teamsSelf-contained breathing apparatus, etc.Fire fighting equipmentFire control media, i.e. foams, etc.First-Aid RoomTrained First-AidersMedical Staff, etc.
Rescue teamsSpecialist equipment (e.g. ladders, cutting equipment, gas detectors, etc.)
The adequacy of these resources should be tested against the emergencies identified. It isessential that the emergency resources are well maintained and regularly tested.
(xii) Emergency Communications
Effective communications are usually the most difficult and demanding aspect of any emergency.The need for simple standard procedures, frequent training, testing and retraining cannot be overstressed.
The company emergency commander 'must' set up a pre-planned command centre from wherehe will be able to manage and control the emergency. He 'must' have means for internal and externalcommunications available.
242

The type, quantities location and limitations of internal and external emergency communicationsequipment must be listed.
A back-up communications system must be available and able to be operated in a power failure.It is essential that equipment is robust and reliable.
Note: some communications equipment may be a source of ignition and therefore may notbe intrinsically safe for ail uses particularly when flammable vapor/gas mixtures may be present.
(xiii) Evacuation
Procedures for evacuation of people on-site and off-site must be established.
Personnel on Site: the company procedures must provide for the evacuation of its employees.People should be moved in an orderly fashion and the numbers accounted for before and after eachmove. Visitors and contractors must not be overlooked. The procedures should specify who isresponsible for making the decision to evacuate any section of the site.
Nearby People Who May be Affected: if the emergency is an external Alert then a proceduremust be set out to make the people potentially affected safe.
Any evacuation of people outside the site is the responsibility of the relevant emergencyauthorities in the country (police, fire brigade...); control of external roadways, pedestrian and vehiclecontrol is the responsibility of those authorities. The plan must make adequate provisions for co-ordinating actions between the company concerned and external emergency authorities in this regard.
(xiv) Procedure for Terminating an Emergency
When the Public Emergency Service Commander's role is complete he will hand back controlto the Company emergency commander.
The Company Emergency Commander will carefully consider the overall situation. He mayrequire additional actions to be completed before he declares the emergency complete. His task willthen be to facilitate the reorganization and reconstruction activities so that normal operation can beresumed.
This section of the plan must include provision for clean up, safe storage and disposal of allcontaminated material.
(xv) Public Relations and Debriefing
It is important that communications to the news media during an emergency are well planned.The news media can be very helpful during an emergency. In planning the public information system,consideration must be given to the proper drafting of news releases, provision for clearances of allreleases by a responsible company executive and the expeditious distribution of releases to all media.Consideration must be given to providing a Company spokesperson for radio and television. Thisspokesperson may require training to discharge adequately this important function. A careless answeron the news media can destroy public confidence and exacerbate the emergency.
The ideal media release should include:
(a) cause of the emergency;(b) action taken;
243

(c) effectiveness of corrective action;(d) expected time when emergency will be terminated; and(e) co-operation needed from the media.
Note: Only state facts.
(xvi) Statutory Investigation
There may be a statutory investigation into any emergency.
A coroner's enquiry may be held in the case of fire and will be held in the case of fatalities.
Relevant government authorities may also require investigations.
The plan must provide for co-operation in these investigations and in particular should ensurethat evidence is preserved.
The Company Emergency Commander must ensure that there is no interference with evidenceand that any cleaning up, movement of bodies, repairs etc., apart from that necessary to bring theemergency under control does not occur without approval of the investigating officers.
(xvii) Written Report on Emergency and Review of Plan
The plan must provide that immediately the emergency is complete, steps must be taken toensure that a written report os the incident is produced.
It is prudent after any real emergency to review and revise the existing emergency plan. Theplan should specify how and when this should be done.
(xviii) Training and Evaluation
As the plan is being written a training syllabus and schedule must be prepared for all of thepeople who could be involved in an emergency at the site. Some specialist training may be requirede.g. fire control, the use of self-contained breathing apparatus, first-aid etc. Training for new peoplewho join the organization must be provided and records of training kept. Retraining is also an ongoingneed.
The best method to evaluate an emergency plan is to simulate an emergency and have severalobservers watch and record what actually happens. Simulated emergencies are excellent training aids.The plan and, where applicable specific emergency procedures and sub-routines should be regularlyexercised by way of simulated emergency. Exercising should be carried out as frequently as isnecessary to maintain the effectiveness of the plan.
(xix) Review and Revision of the Emergency Plan
In addition to review and revision arising from real emergency situations and training exercises,the plan will require regular amendments to take account of all significant changes affecting the planand periodic review and revision to ensure that it is still up-to-date, effective and in line with changingcommunity standards. The plan should set out the procedures for such review and amendments andthe frequency of periodic review. It should indicate how amendments will be made and who willauthorize them.
It is essential for there to be periodic arrangements for independent auditing of the plan. Thiscan be carried out by an appropriately independent person within the company or by an appropriateperson from outside.
244

The format should be suitable for any amendment. Individual pages should show date of issueand person issuing.
(xx) Distribution List
An up-to-date list of all persons supplied with a copy of the plan should be included. Thepreparation and updating of the distribution list should ensure that all people who should receive acopy are considered. This list is also necessary to ensure that revisions and updates are provided toeveryone holding the plan.
Typical components of a plant emergency plan whereas a chemical plant's emergency plan drawsupon all of the site's disciplines, it is top management's leadership role, by example, that is of primeimportance to long lasting success.
Accident prevention programmes must be firmly in place, they include technology selection,plant design, construction, and operation as well as operator selection and training. Prevention mustbe backed up with an emergency plan involving all site people and co-ordinated with the localcommunity. The plans should be tested under hypothetical conditions at least annually. Each testshould be documented.
Every industrial site should have positive answers to the following questions:
- Has site management considered all potential emergency types and decided what to do, forexample, in the case of toxic gas release, fire, explosion, severe weather, utility failure, bombthreats, etc.?
- Is there a formalized emergency plan, is it up to date, what is the last revision date?- Who is responsible for keeping the plan up to date?- Are tests run regularly? What frequency? Are they documented?- Does the plan consider emergencies in neighboring plants?- Does the site have an effective emergency alarm system?- Does the site have an emergency control centre and backup?- Does the centre have adequate communication devices, underground drawings, personnel lists,
etc.?- Does the site have access to adequate emergency control equipment above that which is
available at the plant?- What is the system to inform emergency crews of the potential emergency scene hazards?
(toxicity, reactivity, etc.)?- Are emergency block valves, including underground key service shut-off valves to each plant
identified and accessible in an emergency?- Have those pieces of process equipment been identified that require back up power in the event
of power failure what about emergency lighting for key plants laboratories and buildings?- Has the site identified a public relations contact man for emergencies?- Are vital records secured from possible loss?- . Are first responders trained adequately in medical and first aid?- Are on- and off-site medical resources and facilities inventories, trained and involved in
emergency planning and practice?
H-3 EMERGENCY PLANNING AND PROCEDURES ON AN INDUSTRIAL AREA BASIS
II-3.1 Overview
Emergency procedures and plans at the site level are limited to the locality in the immediatevicinity of the plant. At the larger industrial area level, it is essential to formulate emergencyprocedures and plans that account for the overall cumulative emergency requirements, specific to thehazards in the area, and with specific provisions (organizational and operational) for the co-ordination
245

of the individual emergency plans at the plant level. Emergency response strategies with associatedresources and infrastructure needs will have to be formulated and tested on a regional basis. This off-site area planning is the responsibility of the civil authorities although the management of the varioussites involved can clearly assist.
The plan should specify how the company's emergency response operates in relation to thevarious emergency services.
Related Plans and ProceduresThe Operational Plan- Alerting Procedures- Command- Control Centers- Access to Technical Information- Response- Evacuation- Incident Public Relations- Terminating an Emergency
• Resources• Training and Testing• Review and Revision
(i) Purpose: The main purpose(s) and objectives of the plan should be specified. Such purposesinclude: to help ensuring that emergency preparedness, response and recovery for incidentsinvolving hazardous materials are adequate and appropriate for the whole area underconsideration. The objectives of the plan should be clearly specified. Such objectives mayinclude:
To identify and test the adequacy of response resources and response capacity in the area formajor emergencies;
• To encourage/facilitate the development of measures to reduce impacts of hazardous incidents;To ensure that information on hazards, emergency planning, and incidents is effectivelycommunicated to people living and working in the area;
• To provide for inter-actions with other plans;To develop and communicate a clear understanding of roles and responsibilities for emergencyresponse and control.
(ii) Scope of the Plan: This should specify:
The area to which the plan applies, including the range of activities and maps/plans for the areaand its boundaries.The definition of emergency, in the context of the plant.
(iii) Authority. The government authority(ies) or committee which is responsible for the preparationand administration of the plan should be identified. Any statutory reference in the administrationof the plan should be indicated.
(iv) Co-ordinating Group: The formulation, administration, implementation, update and reviewshould be undertaken by the APELL Co-ordinating Group comprising representatives of allrelevant organizations, ideally: emergency service organizations (police, fire brigade, ambulance),industry (operating plants in the area), health authorities, local councils and community groups.In addition to the preparation of the overall plan, the group should be responsible for itscontinuous update. The group also has the responsibility for vetting and reviewing the individualindustry plans and other sub-plans and for ensuring consistency with other related plans.
246

(v) Plant Area Characteristics: The subject area and its characteristics should be comprehensivelydescribed in the emergency plan document, with associated support maps. Information to beconsidered includes a description of the location, type, nature and characteristics of industrialdevelopments, residential, commercial and other land uses, open space areas, roadways,demographic characteristics associated with population, environmental characteristics of the areaincluding ecosystem, natural elements, etc.
(vi) Hazardous Materials: The central element of the hazards identification for the area emergencyplan is the identification of the hazardous materials stored, in-process, or transported through thearea. The location and quantities of such materials should be identified by categories andtransport routes.
(vii) Types of Emergencies: For emergency planning it is important to comprehensively identify andquantify, as far as possible, the type, scale and nature of possible events requiring emergencyresponse, the nature and scale of impacts and the required response. In addition, the plan shouldcontain a comprehensive and systematic set of hazardous incident scenarios and theconsequences, the magnitude and nature of harm, to both people and environment, should becomputed.
Emergency situations can broadly be divided into three categories:
(i) hazardous materials incidents; (ii) natural events; (iii) incidents caused by man-madetechnology. From the inventory and location of hazardous materials and processes in the area,it is possible to estimate the area of fatality or injury impacts and the number of people affectedfrom incident scenarios, under various postulated conditions of: fire, BLEVE/fireball, flash fires,vapour cloud explosions, releases with fire or explosion potential, dust explosion, toxic gasrelease, release of toxic vapours, toxic reaction during the production of combustion products,release with potential contamination of the environment and release of otherhealth/environmentally hazardous materials.
The estimation of the area and number of people that may be affected provide a sound basis forestimating emergency response needs. It is important as well to have an appreciation of thelikelihood (or probability) of such events occurring in practice, so that the allocation of resourcesto emergency response reflect realistic assumptions. An evaluation of the impact and likelihoodof natural events which may need emergency preparedness should be included to enableemergency preparedness and planning. Other technological events that may have to beconsidered include: aircraft crashes, shipping accidents, building/bridge/tunnel collapse, craneor other equipment collapse/failure.
(viii) Related Plans and Procedures: The overall area plan should relate to and refer whereverpossible to other emergency plans or procedures applicable to the area. Most importantly, theoverall plan should ensure the integration of all individual emergency plans at the plant level.
(ix) The Operational Plan: This section of the plan should formulate and document the specificmeasures to be followed in the case of an emergency, including co-ordination between thevarious emergency organizations and industry, the roles and functions of the various parties andspecific evacuation and associated measures. The following outlines the most essential elementsto be covered:
Alerting Procedures: specifying the prompt mechanisms for alerting and thepeople/organization to be alerted. Alarm mechanisms, telephone contact numbers and otheralerting mechanisms should be clearly stated.Command: specifying the structure, functions and co-ordinating mechanisms of a specific chainof command during the emergency. The responsibility of each command level should be clearlyspecified at each level.
247

Control Centers: to be established and specified in the plan. The function of these centers) isto act as the center for communication and co-ordination during emergencies.Access to Technical Information: access to accurate data on the chemicals at the time of anincident is essential. The operating plan should make provisions for the location and access toupdated data sheets and relevant information.Response: the operating plan should specify response actions needed for the different postulatedincident scenarios. The type of emergencies, impacts and responses required should be outlined.It should be noted that evacuation is not always the best response to a situation. The functionsand duties of all personnel involved in the emergency response action should be specified. Suchpersonnel include site personnel, transport personnel, general public, emergency servicepersonnel.
• Evacuation: procedures should be specified. This should include on-site and off-site evacuationprocedures, traffic control points, evacuation routes and assembly points. The conditions forwhich evacuation may be essential should be stipulated.Incident Public Relations: the operating plan should specify procedures for public notificationand information during and after an emergency.
• Terminating an Emergency: the re-establishment of safe stable conditions will be the mainfactor in determining the timing of the termination of an emergency. The operating plan shouldspecify the conditions and procedures for terminating the emergency.
(x) Resources: The Co-ordinating Group should maintain an up-to-date resource list to bemaintained in the site plans and in related plans and procedures. The adequacy of resourcesagainst the range of emergencies should be carefully considered.
(xi) Training and Testing: The hazard, emergency identification and response requirements identifiedin the plan should be integrated into the training of company and emergency service personnel.At least once a year a major field exercise of the plan based on a realistic scenario to test theeffectiveness of the plan should be undertaken. Other 'table top' exercises should be held asfrequently as necessary to test and maintain the viability of the plan. Site plans should be testedat least once a year.
(xii) Review and Revision: The plan should be reviewed as periodically as possible to identifychanges in hazards, resources, personnel, etc. Deficiencies should be identified and rectified. Theplan should be reviewed:
after every major incident;• after every significant change in hazards, resources and other factors;• after each annual exercise.
Table top exercises involving reviews of particular scenarios should be conducted from time totime.
II-33. Co-ordination of On- and Off-Site Emergency Plans
Liaison between site management and the civil authorities should ensure that:
There is a properly co-ordinated set of plans which will be effectively controlled;• Works procedures are in harmony with plans developed by outside authorities;
Outside services understand the nature of the risks and have appropriate knowledge, equipmentand materials to deal with them;The equipment of the works and outside services is compatible;
• The personnel of the works and outside services who are likely to have to co-operate in anemergency already know each other;The appropriate type and number of outside services reach the scene promptly.
248

Annex HI
FIRE PREVENTION AND PROTECTION
III-l. INTRODUCTION
The provisions of adequate facilities and infrastructure for the prevention of major fires and theprotection of people, property and the environment from the effect of such fires, should they occur,are essential elements of safety management. This applies at both levels of the individual plant as wellas at the overall industrial area level where cumulative infrastructure requirements should beconsidered. The basic principle is that each industrial facility handling hazardous materials shouldaccommodate adequate design, equipment, operational and organizational measures commensurate withthe level of risk on-site. Every attempt should be made for each facility to be self-sufficient in thisregard, ensuring the relevance and appropriateness of fire prevention and protection measures.
An adequate level of fire protection at the plant level however, cannot be achieved in most caseswithout appropriate support infrastructure external to the plant. This becomes particularly importantand relevant when considering the safety management of an entire industrial area with a concentrationof hazardous plants, where cumulative requirements need to be considered. The adequate provisionsof fire prevention and protection infrastructure at an area level should complement on-site plant levelprovisions and be an integral part of the overall safety management process.
This Annex provides an overall guidance as to the safety management aspects of fire protectionand prevention at both the plant and the area levels.
III-2. THE OBJECTIVES AND PRINCIPLES OF FIRE PREVENTION AND PROTECTION
There are two components to a fire 'system1: the physical or hardware components (e.g. smokedetectors, alarms, fire sprinklers) and the operational arrangements or software (e.g. maintenance andtesting, training, emergency planning).
The principle of fire prevention and protection is that the fire safety 'system' should be basedon a specific analysis of hazards and consequences and that the elements of the proposed or existingsystem should be tested against that analysis. This should always produce a better outcome than theapplication of generalized codes and standards alone.
Defining the hazard potential of an area, plant and/or operation involves the process of hazardidentification and estimation of the potential consequences of credible incidents.
In addition to the hazard potential a number of other factors must be taken into account in theselection of the system. These include:
(i) Land use safety considerations: the impact of incidents on the surrounding land uses, and thesensitivity of these land uses (both at the individual process level and from postulated majorincidents on an area level).
(ii) Infrastructure available: e.g. water mains supply, area emergency planning, fire brigaderesponse times and access;
(iii) External factors: effects from surrounding land use (e.g. other hazardous industries, bush fires),weather, etc;
(iv) Regulations: requirements of statutory bodies.
249

Too often fire safety systems are seen merely as an adjunct to a facility and are not integratedinto design and management. The importance of prevention in the overall system cannot beemphasized enough. The hazard potential and the risk of death or injury, property loss, or damage tothe biophysical environment are at least as dependent on the design and layout and the managementof a facility as on the nature of the activities involved and the nature and quantity of hazardousmaterials.
The fire protection and prevention system should be concerned with all the effects of fire. Ittherefore should not only address the direct effects of flame, radiant heat and explosion but also thepotential for the release of toxic materials and toxic combustion products in the event of fire and thepotential for the release of contaminated fire fighting water.
The fire protection requirement should be based on the worst case scenario(s); the step approachfor a fire safety study is given in Fig. 1II-1.
•didemmcolion
-incident/
Analysis of consequences
oc incidents
feedbackon problemareas
1i hurt*" nf i / J * •MjaiiiiimjBuii/ocwoopnicni
fire pfotodionstrategy/measures
1Af IQI ffB Of fBQOtfWTHntS
tor tws octedion ond
protection rooosurcs
Selection of measures
to be implemented
if inadequateGoJcuiofiou or fire
fighting water demand
if cannotdevelopadequatedesign
of supply (mains & italic)
Analysis and selection ofcontaminated fire water
1 I
SefeoSonoffintoidfcp. QfTongomcnts
rJftfirl?n..«or wnomgt
FIG. III-l. Flow diagram for afire safety study
250

IH-3. IDENTIFICATION OF FIRE HAZARDS
This is the first step in the study, involving the identification of all possibly hazardous materials,processes and incidents. The possible internal and external causes of incidents should also beidentified.
For example, if a storage terminal has tanks containing flammable liquids, such as petrol, thenthe possibility of tank fires, bund fires, fires due to pipe and pump failure and fire in loading or drumfilling operations, etc. must be considered. Similarly, if a plant processes and stores large quantitiesof liquified flammable gases then the possibility of jet fires, vapor cloud explosions, flash fires andBLEVEs must be addressed. In the case of storage of materials with potential for generating toxiccombustion products and/or contaminated water run off, these hazards must be addressed.
On an area basis, it may be appropriate to postulate worst case accident scenarios for the majorinventory of hazardous materials stored or in process in the area. The possibility of a domino effect,that is an incident at one installation in the area triggering a hazardous event at an adjacent installation,should also be considered.
The analysis should cover the nature of the materials and quantities involved, the nature ofhazardous events (e.g. loss of containment), potential initiating events, ignition sources, etc.
It is important that the possibility of the site and the area being exposed to hazards external tothe site is dealt with.
Word diagrams may be useful in the hazard identification, (see Table III-1 >
III-4. ANALYSIS OF CONSEQUENCES OF INCIDENTS
Once the hazards have been identified, the consequences of incidents can be estimated. Theconsequence analysis should address both the direct impacts of incidents and the potential forpropagation and secondary incidents, particularly on an area basis.
The analysis should relate selected targets (people, equipment, buildings, etc.) to specific timerelated exposures (heat flux, explosion overpressure, toxic concentrations, etc.).
Justification must be given for the selection of targets, exposures and models and assumptionsused in the consequence calculation.
There are various models available for estimating the consequences of events. Generally, eachmodel has a range of applicability outside of which its use is inappropriate.
Note: If a quantified risk assessment study has been carried out for the site, the hazardidentification and consequence analysis components of the fire safety study should belargely drawn from that study.
III-5. FIRE PREVENTION STRATEGIES/MEASURES
The most basic element of fire safety is prevention. Appropriate design and layout of the facilityand operating procedures and arrangements are essential to fire prevention. The study should movefrom the hazard identification and consequence analysis to identifying measures which minimize thelikelihood of fires and/or reduce their severity or extent.
251

Examples of matters which should be considered as part of fire prevention include:
building design and compliance with building regulations;elimination/minimization of hazardous materials in storage or in process:elimination of ignition sources;
• bund design, construction and capacity;type of medium suitable for the hazard (e.g. minimizing use of fire fighting water);separation of incompatible materials;
• housekeeping, etc.
Site security has implications for fire safety, as fire preconditions and fires themselves are oftencaused by intruders. The provision of physical barriers such as fencing and intruder detection systems(alarms) should be considered together with the staffing and operational arrangements.
The location of gatehouses, patrolling of the site, who responds to alarms, etc. should beconsidered. Arrangements to restrict access to critical areas or plant components should also beconsidered in order to reduce the possibility of employee or visitor actions which could lead to fireor fire pre-conditions (e.g. locking of valves, etc.).
TABLE III-l. SAMPLE HAZARD IDENTIFICATION WORD DIAGRAM
Facility/Event
Tank Farm
Petroleum tank fire
Petroleum bund fire
Petrochemicaltanks(cool fire)
Cause/Comments
Static electricity buildup and spark due to fastfilling
Pressure vent valvefails, tank roof fails andignition
Corrosion tankbase/floor
Pipeline/pumpleakage/rupture
Tank overfilled
Adjacent tank fire orbund fire heating tankcontents todecomposition
Possible ResultsConsequences
Tank roof may fail, fireof entire roof area if notcontrolled orextinguished may involveother tanks in samecompound
Leakage of tank contentsinto bund. If ignited mayresult in pool or bundfire
Emission or toxicproducts or vapours.Downwind effectsdepend on toxicantreleased andwind/stability conditions
Prevention/Detection/Protection Required
Pressure vent valveschecked prior tofill/discharge
Foam injection systemin all class 3(a) tanks
Water cooling systemon each tank
Tanks cleaned,inspected, integritytested annually
Adequate foam stockson site
High level alarms to beprovided on all storagetanks
Foam/monitors to beprovided in and aroundbund compound
Tanks placed inseparate bund
Cooling system on alltanks
252

TABLE III-1. (com)
Facility/Event
LPG Road TankerFacility
Flexible hose failure
Pipe failure
Pump seal failure
WarehouseDangerousGoods Store
Warehouse fire
LPG Storage
Cause/Comments
Road tanker drivesaway whilst stillconnected
Third party damage orexcessive wear
Mechanical impact
Corrosion
Pump not maintained
Pump run dry
Wiring not flameproof
Handling equipment notintrinsically safe
Shrink wrapping firedby LPG, undertaken onsite
Arson
Lighting notintrinsically safe
Unsafe storage ofdrums
Possible ResultsConsequences
Gas disperses. If ignitedmay result in flash fire.Impact local
Fire involving warehousecontentsExploding drums/packetsdepending on materialstored
Toxic combustionproducts evolved
Prevention/Detection/Protection Required
Fixed deluge system atroad tanker bay
Scully system on tankerloading
Area drained
Gas detectors aroundperimeter of LPG area
Pump shut off at twolocations, local andremote
Isolation systems onmain liquid lines
All products segregatedby class
Thermal/smokedetectors provided,linked to alarm andlocal brigade
Warehouse sprinklersystem provided
Area bunded
flameproof wiring usedin dangerous goodsstore
Diesel fork lifts only
Security firm employedafter hours
All lighting intrinsicallysafe
Drum storage racked ordrum height restricted
253

TABLE III-l. (com)
Facility/Event
Catastrophic vesselfailure
Large leak
Cause/Comments
Direct flameimpingement on tank,from pipes, tank fittingsor pump failure andignition
Mechanical impact
Corrosion
Failure of tank orassociated fittings,pump or pipework andignition
Possible ResultsConsequences
Pressure inside tankrises, if fire notextinguished, vessel mayweaken and fail resultingin a BLEVE/fireball.Damage widespread
On dispersion vapourmay form a gas cloud. Ifignited may result inUVCE or flash fire
Prevention/Detection/Protection Required
Vessel fitted withpressure relief valves,discharge vertical toatmosphere
Deluge system
Isolation valves fitted toall main liquid lines
Pump shut off at twolocations
Isolation valves on allmain liquid lines
Pump shut offs at twolocations, local andremote
Gas detection onperimeter of LPG area
Fog nozzles provided
Crash barriers providedaround tank
Site upkeep (housekeeping) can be particularly important. Issues include removal of trade wastes;regular maintenance of installed facilities and equipment; clearance and checking of drains andcollection pits.
Safe work practices, including observance of standards, codes and regulations, provision ofmaterial data including safety data sheets and company policies and procedures, all have importantbearing on fire safety and should be explicitly addressed.
Procedures and practices covering contract work should be carefully considered, especially hotwork controls and permits and gas/vapor checks.
Appropriate emergency plans and procedures are an important part of fire prevention.Appropriate and early action can prevent small incidents developing into serious situations and canlimit the scale and extent of the impact of incidents. The development or analysis of fire preventionstrategies and measures should therefore be integrated with emergency planning.
III-6. ANALYSIS OF REQUIREMENTS FOR FIRE DETECTION AND PROTECTION
From the consideration of prevention measures, the analysis should move to the requirementsfor fire detection and protection. This should include detection of pre-conditions for fire, such asflammable atmosphere detection, and physical protection measures such as purging of vapor spaceswith inert gases.
254

Issues to consider include:
Prevention of fire pre-conditions, e.g. inert vapor spaces;Detection of fire pre-conditions, e.g. leaks and spills of flammables, flammable or explosiveatmospheres, overheating in process vessels, etc;
• Explosion suppression;Detection of combustion, smoke, flame - early warning systems, thermal alarm systems;
• Fire suppression, e.g. automatic sprinkler systems, foam systems (type of foam), gas flooding,(Halon, CO,, hydrant systems, hose reel systems; monitors (water and foam);Prevention of propagation, e.g. cooling, deluge systems, drencher systems;Isolation of fuel supply, especially means of control of gas or liquid flows from storage vessels,including pump controls, valves, switch or control actuators (local or remote).
Road and rail vehicles and ship loading and discharge facilities should be fully covered in theprotection systems.
In some cases it may be better to contain rather than extinguish a fire, e.g. it is generally bestto let LPG jet fires burn rather than extinguish the fire and allow the possibility of a vapor cloudexplosion.
The type of extinguishing or control medium needs to be carefully considered as not all firescan be extinguished or controlled with water. Some require foam, dry powder, CO,, even water invarious forms, e.g. fog, jet or spray.
Another consideration is that water may be used for cooling of exposures but a different mediumused for extinguishing or control. Where this is the case, compatibility between the two mediums isessential. If, for example, water breaks down the foam applied, the design foam application rates needto allow for foam breakdown, or alternatives to cooling water have to be used.
The use of halons for proposed as well as existing developments should be re-examined. Becauseof their contribution to ozone depletion and the greenhouse effect the future use of these materials willbe restricted. However, while alternatives should be sought, in some cases halons may be the onlyfeasible solution.
The need to control spillage and drainage from the area in the event of fire should be built intothe analysis, including the need to contain or limit run-off of contaminated fire-fighting water.
Ventilation can be a factor in confined places. Control of smoke or toxic releases also needs tobe addressed.
Design features identified through the fire prevention measures analysis, such as mounding ofpressure vessels, increased separation distances, in-built safety features etc. can reduce the need forfire protection. For example, reducing the number of tanks in any one bunded area may reduce therequirement for foam and/or water.
III-7. FIRE FIGHTING WATER DEMAND AND SUPPLY
A crucial part of the fire protection system is ensuring that the hydraulic design is sufficientlysatisfactory to cope with the hazards and consequences. There are three elements: fire fighting waterdemand, fire fighting water supply and contaminated water containment and disposal. The demandcalculation is based on the protection system selected. If the supply cannot be made sufficient to meetthe demand, or the contaminated water systems cannot cope with water applied, the choices ofprotection systems will need to be reviewed.
255

Once the protection systems have been selected, the fire fighting water demand can becalculated. This calculation should be based on the worst case fire scenario(s) and its/theirfoam/cooling water requirements. The demand will depend on the duration and intensity of potentialfire(s), the prevention measures including facility design and the protection systems selected. Demandwill be particularly influenced by choice of fire fighting media and facility layout (especially inrelation to cooling water). Other features of particular significance include fire rated construction,vapor barriers, and compartmentalizing of storage (including separate bunding).
Analysis of supply should cover details of the fire water pumps. This would include the numberof pumps and their configuration, power supply; pump details including capacity, type etc.; pumpcurves, backup, etc.
The calculations justifying the fire protection should show pressure and flows on operation ofany and all fire fighting facilities in the area under review.
Where appropriate the facility should be divided into fire areas and the water requirementscalculated for each area.
The design of the water supply system must be assessed against the calculated water demand.
The adequacy of the water supply available from town mains should be assessed based onwritten advice from the local water authority.
Where the mains water supply is not adequate in terms of quantity or reliability the need forstatic water supplies should be considered and the size and type of storage identified with drawingsshowing location of mains, size and street hydrants.
On-site water storage should be calculated to meet worst case demand. The minimumrequirement is generally 90 minutes supply.
The analysis needs to include careful consideration of the effect of potentially competingdemands for reticulated and static water supply.
In most cases the supply of fire water to the site is achieved by a combination of static waterstorage (on the site) supplemented by town mains water supply.
III-8. CONTAINMENT OF CONTAMINATED FIRE FIGHTING WATER
The importance of the containment of contaminated water will depend on the nature of thematerials held on site and where the site drains to. For example, if substantial quantities of biocidesare involved and/or the site drains to a sensitive environmental area then special attention would bewarranted.
Factors that need to be taken into account in the design of the retention system include control,drainage, storage and disposal.
The design of the contaminated water containment and disposal system should be based, whereappropriate, on a probabilistic analysis. The analysis should account for not only the total containmentof the calculated run-off of potentially significantly contaminated water from the worst case scenariofire but also the availability of the retention capacity as affected by rain, testing, treatment and disposalarrangements. The possibility of soil and groundwater contamination should be considered in theanalysis.
256

III-9. FIRST AID FIRE PROTECTION ARRANGEMENTS AND EQUIPMENT
In addition to fixed fire protection systems, provision for first aid fire protection equipment andoperational arrangements must be considered.
Relevant matters to be covered would include:
Provision of portable fire extinguishers - size, type, medium, number, location, testing andmaintenance.Provision of hose reels - number, location, type, testing and maintenance. Installed hose reelscan remove the need for water type extinguishers.Provision of warning signs (including exit signs and first aid fire fighting equipment useinstruction signs) - location, type, size.
• Site fire crews - formation, training, responsibilities and drills.Training of operators/staff - knowledge of plant, materials, emergency action/shut downprocedures.Road vehicles measures - extinguishers, driver/operator instruction, placarding, vehiclemaintenance, etc.
The interaction of these matters with emergency planning should be carefully considered.
Ill-10. ADDITIONAL CONSIDERATION FOR FIRE PREVENTION AND PROTECTION ON ANAREA BASIS
In addition to the above, it is essential to ensure that adequate fire prevention and protectioninfrastructure is available on an area basis, accounting for the cumulative requirements of the variousplants. The following safety management principles apply in this regard:
• An adequate fire water reticulation and water supply/piping system should be available to coverthe entire area. Two critical factors are important: the flow and pressure of water supply shouldbe such as to adequately meet the requirement of each installation based on the installed staticwater storage. Hydraulic computations should also account for con-current demand by at leasttwo installations simultaneously under worst accident scenarios. The second factor relates to thereliability and security of the main fire water supply system. In addition to regular testing andmaintenance of that system, it is important to ensure that an alternative system is availableshould failure occur to the main fire water supply system.Adequate access provisions should be made throughout the area, including the provision ofroadways, to ensure fire brigade attendance under emergency conditions.It is useful in many cases to provide for a centralized shared facility for appropriate fire fightingmedia such as foam, dry powder, emergency equipment, etc. The facility location should beoptimized in terms of accessibility to the different joint users.
• The formation of a mutual aid group to co-ordinate joint fire prevention and protection amongstthe different industrial organizations including the sharing of information should be encouraged.Adequate documentation on hazardous substances, location of fire fighting media and equipmentshould be available on a centralized basis for all facilities in the industrial area underconsideration.
NEXT PAQE(S) Ileft BLANK I
• 257

ABBREVIATIONS
AADTACDSACMHAIChEAIHAAPELLBLEVEBODBtuCASCE.CECCFCCFRCIMAHDOEDOTDWTEEGLEISEPAERDSERPGFMEAFTAHASAWAHAZOPHSCHSEIARCIDLHIHIELOISOLCLDLNGLPGMFMHAUMHIDASMORNGONIHHSNIOSHNOAELNRCNTPOECDPCBPCUPHI
Annual average daily trafficAdvisory Committee on Dangerous SubstancesAdvisory Committee on Major HazardsAmerican Institute of Chemical EngineersAmerican Industrial Hygiene AssociationAwareness and Preparedness for Emergencies at Local LevelBoiling Liquid Expanding Vapour ExplosionBiochemical Oxygen DemandBritish thermal unitChemical Abstracts NumberCoal EquivalentCommission of the European CommunitiesChlorofluorocarbonsCode of Federal Regulations (USA)Control of Industrial Major Accidents Hazards RegulationsDepartment of Energy (USA)Department of Transportation (USA)DeadweightEmergency Exposure Guidance LevelEnvironmental Impact StatementEnvironmental Protection Agency (USA)Event Recording Data SystemEmergency Response Planning GuidelinesFailure Mode and Effects AnalysisFault Tree AnalysisHealth and Safety at Work etc. Act (UK)Hazard and Operability StudyHealth and Safety Commission (UK)Health and Safety Executive (UK)International Agency for Research on CancerImmediately Dangerous to Life or HealthInitial Hazard IdentificationInternational Labour OrganisationInternational Organization for StandardizationLethal ConcentrationLethal DoseLiquified Natural GasLiquified Petroleum GasManagement FactorMajor Hazards Assment UnitSRD/HSE Major Hazards Incidents Data SourceModification of RiskNon-Governmental OrganizationNotification of Installations Handling Hazardous SubstancesNational Institute for Occupational Safety and HealthNo Observed Adverse Effect LevelNuclear Regulatory CommissionNational Toxicity ProgramOrganization of Economic Co-operation and DevelopmentPolychlorinated BiphenylsPassenger Car UnitPotential Hazard Index
259

PMPSCQHAQRAS.I.SMSSPEGLSRDSRSSTELTDSTLVTNOTNTTOCTPTPDTSPTTOUKAEAUNECEUNEPUNIDOUSNOAAUVCEVCEVOCVROM
WHO
Paniculate MatterProbabilistic Safety CriteriaQuantified Hazard AnalysisQuantified Risk AnalysisSeverity IndexSafety Management SystemShort-Term Public Emergency Guidance LevelSafety and Reliability Directorate (UK)Systems Reliability ServiceShort-Term Exposure LimitTotal Dissolved SolidsThreshold Limit ValuesThe Netherlands Organization of Applied Scientific ResearchTrinitrotalueneTotal Organic CarbonThoracic ParticlesTon per dayTotal Suspended ParticulatesTotal Toxic OrganicsUnited Kingdom Atomic Energy AuthorityUnited Nations Economic Commission for EuropeUnited Nations Environment ProgrammeUnited Nations Industrial Development OrganizationNational Oceanic and Atmospheric AdministrationUnconfined Vapour Cloud ExplosionVapour Cloud ExplosionVolatile Organic CarbonMinistry van Volkshuisvesting, Ruimtelijke Ordening en Milieubeheer(Netherlands)World Health Organization
260

CONTRIBUTORS TO DRAFTING AND REVIEW
Anguenot, F.
Borysiewicz, J.
Blokker, E.
Brandberg, G.S.
Carcassi, M.
Carlson, L.(Scientific Secretary)
Cassidy, K.
Christiana, IZ.
Clifton, JJ.
Cohen, B.
Constantinescu, T.
Daimor, Y.
Dayan, U.
Densow, D.
Dolev, E.
Dones, R.(Scientific Secretary)
Dryden, P.
Drymael, H.
Eremenko, V.A.
Francisco, M.G.
Commissariat à l'Energie Atomique/Centre d'Etudes Nucléaires,France
Institute of Atomic Energy, Poland
DCMR, The Netherlands
Kemakta Konsult AB, Sweden
Dipartimento Costruzioni Meccaniche e Nucleari,Universita di Pisa, Italy
International Atomic Energy Agency
Health and Safety Executive, UK
Ministry of Industry-Directorate of Ecology, Romania
Culcheth, Warrington, Cheshire, UK
Israel Electric Corporation, Israel
Ministry of Industry-Directorate of Ecology, Romania
Israel Electric Corporation, Israel
Soreq Nuclear Research Center, Israel
Institute of Occupational and Social Medicine,University of Ulm, Germany
Oil Refineries Ltd, Israel
International Atomic Energy Agency
NSW Department of Planning, Australia
AIB-Vinçotte Nucléaire, Belgium
Russian Research Centre, Kurchatov Institute,Russian Federation
Environmental Management Bureau, Philippines
261

Gaafar, M.A.
Gat, Y.
Gavrisha, L.
Gheorghe, A.(Scientific Secretary)
Ghosh, P.K.
Griffiths, D.
Haddad, S.(Scientific Secretary)
Hassib, G.M.
Ilberg, D.
Kadlec, J.
King,F.(Scientific Secretary)
Kisic, Z.
Kuz'min, I.
Lako, P.
Lederman, L.
Malevannaya, N.B.
Maltezou, S.
Molag, M.
Morici, A.
AEA Regulatory and Safety Center, Egypt
Israel Electric Corporation, Israel
Municipality of Ventspils Town, Latvia
International Atomic Energy Agency
Atomic Energy Regulatory Board, India
ICI Australian Engineering, Australia
International Atomic Energy Agency
National Center for Nuclear Safety, Atomic Energy Authority,Egypt
Soreq Nuclear Research Center, Israel
VUPEK Research, Engineering and Consulting Institute,Czech Republic
International Atomic Energy Agency
EKONERG, Energy Research & Environmental ProtectionInstitute, Croatia
The National Scientific Centre, Kurchatov Institute, RussianFederation
Netherlands Energy Research Foundation (ECN), TheNetherlands
International Atomic Energy Agency
Scientific Research Institute for Testing of OptoelectronicDevices, Russian Federation
United Nations Industrial Development Organization
TNO, Environmental and Energy Technology, The Netherlands
Italian National Agency for Environmental Protection, Italy
262

Morton, J.
Ozolins, G.
Papazoglou, I.
Pfeiffer, K.F.
Pipatti, R.K.
Pitblado, R.M.
Rapaport, H.
Sachs, I.
Schoolmeesters, P.
Schubach, S.A.
Schwela, D.
Seüer, H.
Sergeev,
Skanata,D.
Skogh, G.
Soloveitchik, D.
Stevens, J.
Storey, P.
Strupczewski, A.
Sugavanam, 6.
Supetran, A.D.D.
Swaton, E.
Tamari, A.
United Nations Environmental Programme
World Health Organization, Switzerland
Greek Atomic Energy Commission, Greece
Gesellschaft für Anlagen, Reaktorsicherheit mbH (GRS),Germany
VTT Energy, Energy and Power Systems, Finland
DNVTechnicaLtd,UK
Gadot Petrochemical Industries Ltd, Israel
Bromine Compounds Ltd, Israel
Cabinet du Ministre de l'Intérieur, Belgium
Quantarisk, Australia
World Health Organization, Switzerland
Polyproject, Risk & Safety of Technological Systems, ETHZentrum, Switzerland
Moscow, Russian Federation
Hazardous Waste Management Agency, Croatia
Association Internationale pour l'Etude de l'Economie del'Assurance, Sweden
Ministry of Energy and Infiastructure, Israel
United Nations Environmental Programme
European Union, Brussels
International Atomic Energy Agency
United Nations Industrial Development Organization
Environmental Management Bureau, Philippines
International Atomic Energy Agency
Israel Ministry of Energy and Infrastructure, Israel
263

Tarana, A. Ministry of Industry-Directorate of Ecology, Romania
Thwaites, D. United Nations Environmental Programme
Tweeddale, M. Department of Chemical Engineering, University of Sydney,
Australia
Van den Brand, D. Ministry of Environmental Affairs, Netherlands
Verstraete, P. Ecole Polytechnique Federal de Lausanne, Switzerland
Yanovski, M. Dor Chemicals Ltd, Israel
Ziedina, I. Ventspils Town Board, Latvia
Consultants Meetings
Vienna, Austria
12 - 15 November 1991; 22 - 27 November 1992; 6 - 10 July 1992;25 - 26 November 1993; 12 - 16 September 1994
Technical Committee Meetings
Tel Aviv, Israel: 1 8 - 2 2 November 1991Vienna, Austria: 1 2 - 1 6 September 1994
o
264