guide to low thermal energy demand for large buildings
TRANSCRIPT
Guide to Low Thermal Energy Demand for Large Buildings

BC Housing gratefully acknowledges the invaluable support
and funding contribution of Canada Mortgage and Housing
Corporation (CMHC) and Natural Resources Canada (NRCan)
through its Program of Energy Research and Development
(PERD) in the production of this publication. This guide was
prepared by Morrison Hershfield.
Disclaimer
The greatest care has been taken to confirm the accuracy of the content. However, the authors, funders, publisher or other contributors assume no liability for any damage, injury, loss or expense that may be incurred or suffered as a result of the use of this publication, including products, building techniques or practices. The views expressed do not necessarily represent those of any individual contributor, BC Housing, CMHC or NRCan.
Building science, products and construction practices change and improve over time and it is advisable to regularly consult up-to-date technical publications on building enclosure science, products and practices rather than relying solely on this publication. It is also advisable to seek specific information on the use of products, the requirements of good design and construction practices, and the requirements of the applicable building codes before undertaking a construction project. Refer to the manufacturer’s instructions for construction products, and also speak with and retain consultants with appropriate engineering and/or architectural qualifications, and appropriate municipal and other authorities, regarding issues of design and construction practices.
Most provisions of the building codes (British Columbia Building Code and the Vancouver Building By-law) have not been specifically referenced. Always review and comply with the specific requirements of the applicable building codes and bylaws for each construction project. Nothing in this publication is an endorsement of any particular product or proprietary building system.
©2018 BC Housing
Acknowledgements

i
ABOUT THIS GUIDE
This publication was prepared by
Morrisonhershfield.com
April 2018
This guide aims to broaden the common understanding of how large buildings can meet
higher levels of performance as required by Passive House, BC Energy Step Code, City of
Vancouver Zero Emission Building Plan and City of Toronto Zero Emissions Building
Framework. This guide has a focus on current Canadian code requirements, construction
practice and tested systems.

ii
TABLE OF CONTENTS Chapter 1 Overview
INTRODUCTION OF TEDI TO CANADIAN CODES AND STANDARDS .......1.2
Chapter 2 Methodologies for Determining Thermal Transmittance
INTRODUCTION............................................................................................2.1
COMPARIONS OF CALCULATION METHODOLOGIES ..............................2.2
BOUNDARY CONDITIONS AND AIR SPACES .............................................2.7
BOUNDARY TEMPERATURES ........................................................................2.7
BOUNDARY AIR FILMS................................................................................2.7
AIR SPACES ..............................................................................................2.7
COMBINED IMPACT OF BOUNDARY CONDITIONS AND AIR SPACES................2.8
INTERIOR VERSUS EXTERIOR DIMENSIONS..................................................2.8
SLAB-ON-GRADE THERMAL TRANSMITTANCE ...........................................2.9
WINDOW TO WALL INTERFACES...............................................................2.10
2D VERSUS 3D ANALYSIS ...........................................................................2.11
DISCRETE THERMAL BRIDGES ....................................................................2.12
LINEAR THERMAL BRIDGES AND INTERFACE DETAILS ....................................2.14
OPAQUE GLAZING SPANDRELS SYSTEMS....................................................2.15
SURFACE TEMPERATURES ..........................................................................2.16
DETAILED VERSUS SIMPLIFIED GEOMETRY................................................2.18

iii
TABLE OF CONTENTS SIMPLIFIED APPROACH ............................................................................2.18
INTERMEDIATE APPROACH .......................................................................2.19
DETAILED APPROACH..............................................................................2.19
WHEN ARE 2D SIMPLIFICATIONS ADEQUATE?.........................................2.20
Chapter 3 Heat Recovery Ventilators
INTRODUCTION............................................................................................3.1
OVERVIEW OF STANDARDS ........................................................................3.2
KEY METRICS ............................................................................................3.3
THIRD PARTY METHODOLOGIES .................................................................3.4
RECOMMENDED METHODOLOGY ............................................................3.5
FANS............................................................................................................3.10
DEFROST .....................................................................................................3.10
HRV STANDARDS IN CONTEXT ..................................................................3.12
Chapter 4 Whole Building Context
INTRODUCTION............................................................................................4.1
CHARACTERISTICS OF LOW ENERGY BUILDINGS ......................................4.3
INTERNAL GAINS .......................................................................................4.4
BUILDING SHAPE .......................................................................................4.5

iv
TABLE OF CONTENTS THERMAL TRANSMITTANCE OF THE OPAQUE BUILDING ENVELOPE...................4.6
GLAZING..................................................................................................4.7
WINDOW HEAT BALANCE ...........................................................................4.9
COOLING LOADS AND OVERHEATING ......................................................4.10
AIR INFILTRATION.....................................................................................4.11
VENTILATION...........................................................................................4.12
PATHS TO LOW ENERGY BUILDINGS.........................................................4.13
CLIMATE ZONE 4 DESIGN MEASURES ........................................................4.14
CLIMATE ZONE 5 DESIGN MEASURES ........................................................4.15
CLIMATE ZONE 6 DESIGN MEASURES ........................................................4.16
CLIMATE ZONE 7A DESIGN MEASURES ......................................................4.17
CORRIDOR PRESSURIZATION .....................................................................4.18
COST .....................................................................................................4.18
SOFTWARE TOOLS......................................................................................4.18
Chapter 5 Design and Construction
INTRODUCTION............................................................................................5.1
DESIGN PRINCIPLES .....................................................................................5.1
FIRE PROTECTION AND COMBUSTIBILITY......................................................5.2
NON-METALIC STRUCTURAL SUPPORTS .................................................5.3
COMBUSTIBLE WINDOW FRAMES.........................................................5.7
FOAM INSULATION .............................................................................5.7
ENVIRONMENTAL SEPARATION ..................................................................5.9
STRUCTURAL SUPPORT ............................................................................5.10
DURABILITY............................................................................................5.11
CONSTRUCTABILITY ................................................................................5.12

v
TABLE OF CONTENTS SITE BUILT EXTERIOR INSULATED WALL ASSEMBLIES ...............................5.12
PRE-FABRICATED PANELIZED WALLS ..................................................5.13
EXAMPLE LOW THERMAL TRANSMITTANCE DETAILS ...............................5.14
DETAIL 1: WALL TO ROOF INTERFACE.......................................................5.16
DETAIL 2: INTERMEDIATE FLOOR ...............................................................5.17
DETAIL 3: AT-GRADE TO BELOW-GRADE PARKING GARAGE INTERFACE.......5.18
DETAIL 4: WINDOW TO WALL INTERFACE..................................................5.19
DETAIL 5: DOOR WITH INTERMITTENTLY ATTACHED BALCONY INTERFACE ......5.23
Chapter 6 Future Horizons
THERMAL TRANSMITTANCES........................................................................6.1
HEAT RECOVERY VENTILATORS (HRV) PROTOCOLS.................................6.2
TEDI IN THE CONTEXT OF WHOLE BUILDING ENERGY ...............................6.3
DESIGN AND CONSTRUCTION....................................................................6.4
EXAMPLE 1 – EXPECTATIONS FOR INTERFACE DETAILS.................................6.4
EXAMPLE 2 – IMPACT OF BALCONIES .......................................................6.5
EXAMPLE 3 – IMPACT OF GLAZING SIZE ....................................................6.7
References
Appendix A: Material Data Sheets
Appendix B: HRV Correlations

M O R R I S O N H E R S H F I E L D | Guide to Low Thermal Energy Demand for Large Buildings
Chapter
OVERVIEW
1
There is strong interest in Canada for the next generation of high performance energy
standards – like Passive House or Net-Zero – to meet energy and emission goals. While
the majority of Passive House and Net-Zero projects have been single family homes and
low-rise buildings, there is momentum in industry to apply these standards to larger
buildings. How to adapt these standards to large multi-unit residential buildings (MURBs)
has not been widely studied nor are there many examples of completed buildings.
This guide aims to broaden the understanding of how high-rise residential buildings can
meet the next generation of Net-Zero or Net-Zero ready standards that are applicable to
Canadian climates and build upon current design requirements and construction
practice in Canada. A new metric called Low Thermal Energy Demand Intensity (TEDI) is
used in this document to discuss viable approaches to designing and constructing Net-
Zero ready high-rise residential buildings. See the side bar for more explanation on the
concept of TEDI that the next generation of energy codes and standards are adopting.
Examples of how TEDI is being introduced in Canadian codes and standards follow later
in this chapter.
Minimizing the impact of thermal bridging and
ventilation heat recovery are critical to low
TEDI buildings. Standard practice for high-rise
residential buildings will continue to evolve to
address both of these requirements.
Moreover, standardization of thermal bridging
calculations and testing for heat recovery
ventilators (HRVs) in the context of Canadian
high-rise residential buildings is not yet
completed.
To help with the process of standardization
and provide guidance to industry this
document provides insight into:
• Thermal Bridging Calculation
Methodologies, including the Building
Envelope Thermal Bridging (BETB) Guide,
ASHRAE-1365-RP, ISO 10211, ISO 14683 and
Passive House Institute (PHI)
• HRV Testing Protocols, including PHI, the
Home Ventilating Institute (HVI) and the Air-
Conditioning, Heating and Refrigeration
Institute (AHRI)
WHAT IS TEDI?
TEDI is a metric that represents the
annual heating load per floor area of a
building. This is the amount of heat
needed to offset the heat loss through
the building envelope and condition the
ventilation air.
TEDI is derived from energy simulations.
Any parameter that impacts the heating
load is captured by TEDI, including
exterior surface area, thermal
transmittance of building envelope
components, airtightness, solar radiation,
internal gains, heat recovery and
ventilation.
The TEDI concept has been applied by
Passive House Institute and European
jurisdictions to focus industry on
minimizing heating load, dependence
on large and complex mechanical
systems, and increase occupant
comfort in buildings.

C H A P T E R 1 | Overview
1.2
• TEDI in the Context of Whole Building Energy, including a discussion on software
implications
• Design and Construction requirements of low TEDI high-rise residential buildings
applicable to Canadian climates and practice
Introduction of TEDI to Canadian Codes and Standards
Building codes are evolving to meet multiple objectives, including reducing energy
consumption, reducing greenhouse gas emissions, increasing resiliency and passive
survivability. The City of Toronto, City of Vancouver and the Province of British Columbia
have included TEDI into policy, along with other metrics to meet one or all of these
objectives. These forward thinking policy directives are Toronto’s “Zero Emissions Building
Framework”, City of Vancouver’s “Zero Emission Building Plan” and the Province of British
Columbia through the “BC Energy Step Code”.
TEDI has attracted interest from policy makers in an effort to promote better building
envelopes without being overly prescriptive on requirements. Under current energy
codes like ASHRAE 90.1 (ASHRAE, 2007) or NECB (NRC, 2011), there is substantial room to
trade-off mechanical and electrical efficiencies with lower performing envelopes. A
metric like TEDI elevates the importance
of the building envelope, which is viewed
as one of the more robust energy saving
measures in a building. Unlike
mechanical and electrical systems, the
building envelope is typically not prone to
user or operator error, thereby more likely
to realize its projected energy savings.
Moreover, many components of the
building envelope typically last the
service life of the building, making its initial
make-up and performance critical for the
building’s long-term performance. Finally,
efficient building envelopes can provide
additional benefits to energy and
greenhouse gas emissions reductions, as
shown in the “Zero Emissions Building
Framework” (City of Toronto, 2017). The
analysis done to support this policy
showed how improved building
envelopes can perform substantially
better in power outages and maintain
livable space temperatures, even under
extended cold periods.
WELCOME TO CANADA, TEDI
BC Energy Step Code and City of Toronto Zero
Emissions Building Framework requirements for
TEDI for high-rise multi-unit residential buildings is
outlined below. Both of these policies include
additional requirements not covered in this
document.
A TEDI of 15 kWh/m2/year is a net-zero ready or
near net-zero building. The stated intent of
some jurisdictions is that this level of
performance will be met by all new buildings
by 2032.
BC Energy Step Code Toronto Zero Building
Emissions Framework
Step
TEDI
Requirement
(kWh/m2/year)
Tier
TEDI
Requirement
(kWh/m2/year)
1 None 1 70
2 45 2 50
3 30 3 30
4 15 4 15

M O R R I S O N H E R S H F I E L D | Guide to Low Thermal Energy Demand for Large Buildings
Chapter
METHODOLOGIES FOR DETERMINING
THERMAL TRANSMITTANCE
2
Introduction
A key to meeting low thermal energy demand intensity (TEDI) for buildings is a holistic
assessment of thermal bridging for thermal transmittance calculations. An awareness of
how thermal transmittance is determined by various approaches is helpful when utilizing
and comparing results from various sources. This section summarizes and contrasts
methodologies for quantifying thermal transmittance for the opaque building envelope
elements with reference to the following guideline documents and standards:
• ISO Standard 10211: 2007 (E) Thermal Bridges in building construction – Heat flows and
surface temperature – Detailed calculations – Provides procedures for thermal
transmittance calculations by numerical methods.
• ISO Standard 14683: 2007 (E) Thermal Bridges in building construction – Linear thermal
transmittance – Simplified methods and default values – Provides simplified methods and
default thermal transmittance values.
• Building Envelope Thermal Bridging (BETB) Guide and ASHRAE-1365-RP – Provides
procedures for calculating thermal transmittances that combines North American
conventions with the ISO 10211 methodology and some refinements to more accurately
simulate steel-framed assemblies. The BETB Guide provides a catalogue of 3D
construction details applicable to North America.
• Passive House Institute Standard (PHI) – References ISO 10211. Transmittance values are
available on the PHI website for certified products that are mostly European.
The BETB Guide, ISO 14683, and PHI draw
significantly from ISO 10211 in calculating
thermal transmittance. Nevertheless,
variations in the calculation procedures
between these documents result in some
differences in thermal transmittance. This
chapter provides clarity as to what
differences in methodology are
insignificant and which variables that are
significant to thermal transmittance. This
information will provide insight for
comparing details from different
methodologies and sources objectively.

C H A P T E R 2 | Methodologies for Determining Thermal Transmittance
2.2
Comparions of Calculation Methodologies
Many of the differences in the ISO 10211, PHI or the BETB Guide methodologies result in
minor impacts on thermal transmittance. A more significant source of variation of
thermal transmittances is the level of detail accounted for in the model, which is not
explicitly different between these documents.
ISO 14683 provides insight in Section 5 to the expected accuracy from various sources of
thermal transmittance data, ranging from details that are directly simulated to default
catalogues. Examples of how these ranges apply to the BETB Guide and calculation
approaches outlined in the ASHRAE Handbook of Fundamentals is provided to offer
insight to how the accuracy expectations apply in practice.
±5% Numerical simulations of specific details. This accuracy is expected when
using results in Appendix B of the BETB Guide for project details that exactly
match the scenario and assumptions outlined in Appendix A.
±5-
20%
Generic details from a catalogue. The range accounts for catalogue details
that do not exactly match the detail being considered. This range of
accuracy is expected when using the visual summary at the beginning of
Appendix B in the BETB Guide.
±5-
20%
Manual calculations. Examples are the parallel path or isothermal planes
methods detailed in the ASHRAE Handbook of Fundamentals. Accuracy
depends on the type of assembly.
+50%
Default values. An example is ISO 14683 or the Tables in Section 4.2 of the
BETB Guide. These represent simplified assemblies and/or an expected
range based on a catalogue of details. Use these values when the results of
more detailed calculations is not available and ballpark estimates are
acceptable.
GLAZING THERMAL TRANSMITTANCE The focus of this chapter is on thermal transmittance of opaque elements.
There are also differences between methodologies for transparent glazing
assemblies (i.e. ISO 10077 vs NFRC-100), which are not specifically
addressed in this document. These differences are important to recognize
when determining TEDI and peak heating loads within the whole building
context. Some differences in calculating glazing performance is discussed
in this chapter in the context of thermal bridging. For more information on
comparisons between common window standards, see the 2014
International Window Standards Final Report from RDH and BC Housing.

C H A P T E R 2 | Methodologies for Determining Thermal Transmittance
2.3
Table 2.1 provides a high level overview of the procedures and parameters that can
impact thermal transmittance calculations. The procedure and parameters are
categorized either as minor differences or potentially significant differences for the
various methodologies discussed in this chapter.
Table 2.1: Overview of Procedures and Parameters that Impact Thermal Transmittance
Minor Differences Potential Significant Differences
Boundary conditions and airspaces Window to wall interface
Interior vs exterior dimensions Two-dimensional (2D) and
geometry simplifications
Cut-off planes Contact resistance
Slab-on-grade heat loss Designs and details to minimize
thermal bridging
Table 2.2 provides more detail to how much and why there are differences in the thermal
transmittance calculations. More detailed discussion and examples follow these tables.
These sections provide insight to when thermal transmittance values from various sources
are appropriate and comparable.
Table 2.2: Description Procedures and Parameters that Impact Thermal Transmittance
Procedure or Parameter Impact on Thermal
Transmittance
Bo
un
da
ry T
em
pe
ratu
re
No impact for steady-
state calculations when
using constant material
properties.
Air F
ilms
Less than 2% impact on
clear field U-value and
linear transmittances for
insulated assemblies >
R-5 (RSI-0.88).

C H A P T E R 2 | Methodologies for Determining Thermal Transmittance
2.4
Procedure or Parameter Impact on Thermal
Transmittance A
ir S
pa
ce
s
Less than 2% impact on
clear field U-value and
linear transmittances for
insulated assemblies >
R-5 (RSI-0.88).
Inte
rio
r v
s Exte
rio
r
Dim
en
sio
n V
alu
es
10211 allows for either
approach
14683 provides values for
interior, exterior and
midplane dimensions
BETB Guide provides
values for interior
dimensions
PHI uses exterior
dimensions
No impact when
following consistent
conventions.
If mismatched, thermal
transmittance may be
different depending on
the construction and
the quantity of the
interface. Order of
magnitude of 15%
variation for low/mid-rise
and 5% for high-rise
construction is
expected in the overall
thermal transmittance.
Sla
b-o
n-G
rad
e V
alu
es
ISO 10211, PHI splits the
thermal transmittance
through the floor slab
(L2Da) and perimeter
footing thermal
transmittance (Ψg) as
two separate values.
The at-grade interface
between the footing
and wall is presented
as a separate linear
transmittance (Ψ).
ISO 14683 provides Ψ
values for the at-grade interface only.
BETB Guide provides combined heat loss of the slab and
footing as one value (Lf) and provides a separate (Ψ) for
the at-grade interface.
No difference, except
how values are
presented and inputted
into calculations.
C H A P T E R 2 | Methodologies for Determining Thermal Transmittance
2.5
Procedure or Parameter Impact on Thermal
Transmittance C
ut-
off
Pla
ne
s
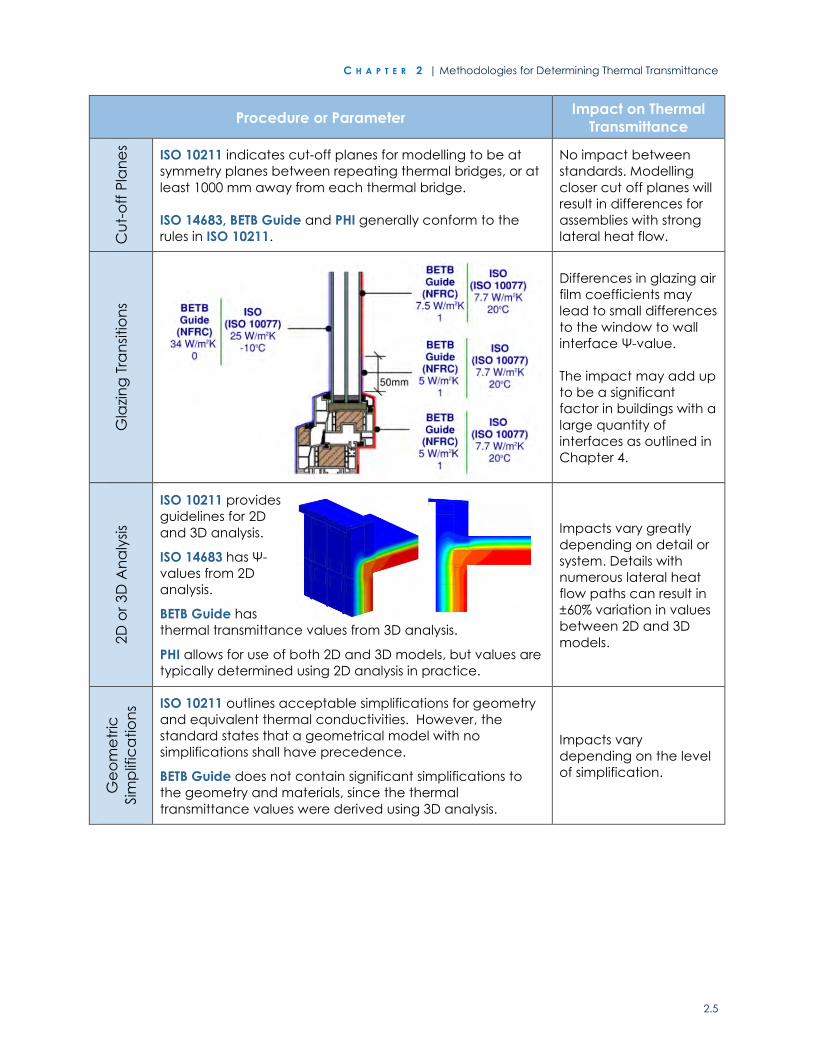
ISO 10211 indicates cut-off planes for modelling to be at
symmetry planes between repeating thermal bridges, or at
least 1000 mm away from each thermal bridge.
ISO 14683, BETB Guide and PHI generally conform to the
rules in ISO 10211.
No impact between
standards. Modelling
closer cut off planes will
result in differences for
assemblies with strong
lateral heat flow.
Gla
zin
g T
ran
sitio
ns
Differences in glazing air
film coefficients may
lead to small differences
to the window to wall
interface Ψ-value.
The impact may add up
to be a significant
factor in buildings with a
large quantity of
interfaces as outlined in
Chapter 4.
2D
or
3D
An
aly
sis
ISO 10211 provides
guidelines for 2D
and 3D analysis.
ISO 14683 has Ψ-
values from 2D
analysis.
BETB Guide has
thermal transmittance values from 3D analysis.
PHI allows for use of both 2D and 3D models, but values are
typically determined using 2D analysis in practice.
Impacts vary greatly
depending on detail or
system. Details with
numerous lateral heat
flow paths can result in
±60% variation in values
between 2D and 3D
models.
Ge
om
etr
ic
Sim
plif
ica
tio
ns ISO 10211 outlines acceptable simplifications for geometry
and equivalent thermal conductivities. However, the
standard states that a geometrical model with no
simplifications shall have precedence.
BETB Guide does not contain significant simplifications to
the geometry and materials, since the thermal
transmittance values were derived using 3D analysis.
Impacts vary
depending on the level
of simplification.

C H A P T E R 2 | Methodologies for Determining Thermal Transmittance
2.6
Procedure or Parameter Impact on Thermal
Transmittance D
efa
ult V
alu
es
Default linear
transmittance values
from ISO 14383 represent
worst-case scenarios
determined using 2D
numerical analysis in
accordance with ISO
10211.
These values cautiously overestimate the impact of thermal
bridging and are intended to be used when more precise
values are not available. ISO 14383 default values are
generally higher than the values found in the BETB Guide,
except for assemblies with complex heat flow paths.
Significant differences in
values, up to +20%, due
to simplification. Can be
used as initial
conservative baseline if
nothing else available.
Use default values with
caution for systems with
metal framing.
Su
rfa
ce
Te
mp
era
ture
s
Surface temperatures in ISO 10211, PHI are expressed as
temperature factors, fRSI and in BETB Guide as temperature
indices, Ti.
ISO 10211, PHI allow for temperatures to be determined by
2D or 3D modelling. BETB Guide values are primarily from 3D
analysis.
Differences are related
to boundary conditions
and film coefficients.
The differences
between 2D and 3D
analysis may have
significant impact for
evaluating the risk of
condensation.
Co
nta
ct
Re
sist
an
ce
The BETB Guide is based on research from ASHRAE 1365-RP.
This work included validation to the reference cases in
Annex A of ISO 10211:2007 (E) to demonstrate accuracy for
well-defined problems. Simulations were also compared to
the guarded hot-box measurements as part of ASHRAE
1365-RP and subsequent studies on cladding attachments
and spandrels. The comparisons to lab measurements
highlights the impact of natural phenomena, such as
contact resistance, that is not explicitly covered by ISO and
PHI.
Contact resistance,
such as between steel
studs and the sheathing,
can result in a
difference in thermal
resistance in the order
of magnitude of 5-20%
depending on the
assembly components.
De
sig
ns
an
d D
eta
ils t
o M
inim
ize
The
rma
l Brid
gin
g
The biggest impact to thermal transmittance is how thermal
bridging is mitigated at interface details.
Many of the assemblies covered by the BETB Guide are
representative of conventional practice. Many details
have linear transmittances greater than 0.5 W/m K.
Mitigated scenarios are considered below 0.2 W/m K.
Passive House has much higher expectations with regard to
minimizing thermal bridging with a goal of 0.01 W/m K as
outlined in the introduction to Chapter 5. For low TEDI
buildings, mitigating thermal bridging to 0.1 W/m k is
mediocre and exploring gains by improved details is a
worthwhile exercise.
Examples of low TEDI
details is provided in
Chapter 5.

C H A P T E R 2 | Methodologies for Determining Thermal Transmittance
2.7
Boundary Conditions and Air Spaces
BOUNDARY TEMPERATURES
Thermal transmittance is calculated for a temperature difference across the assembly for
all the methodologies. ISO 10211 does not dictate specific temperatures to use. PHI
analysis is done at -10oC exterior and 20oC interior conditions. The BETB Guide uses a non-
dimensional unit temperature.
ISO 10211, PHI and the BETB Guide generally use constant thermal properties and steady-
state analysis. This allows the thermal transmittance values of highly insulated building
envelope assemblies to be not climate or temperature specific. The temperature
dependency of materials, such as found for some insulations, is generally not part of
thermal transmittance calculations. Consequently, the simulated boundary
temperatures do not have an impact on thermal transmittance (U-values, Ψ-values and
χ-values).
BOUNDARY AIR FILMS
Air movement over the exterior and interior surfaces is a complex interaction of
conduction, convection and radiation heat flow. All the methodologies use
standardized film coefficients or heat transfer coefficients to estimate the heat flow at
the boundary layer at the interior and exterior surface.
For PHI, air films for opaque surfaces are taken from ISO 6946. The values are RSI-0.04 for
the exterior surfaces, based on a 5 m/s wind speed, and range from RSI-0.10 to 0.17 for
interior surfaces depending on the surface orientation. For the BETB Guide, air films for
opaque surfaces are taken from the ASHRAE Handbook of Fundamentals. The values are
RSI-0.03, based on a 6.7 m/s wind speed, and range from RSI-0.10 to 0.16 for the interior
surfaces.
These small differences in the air film resistances are minor (at most an R-0.2, RSI-0.03
difference) when compared to the rest of the insulated assembly resistance. Air film
resistances have a greater impact on glazing assemblies due to the comparatively low
overall thermal resistance of glazing. More discussion follows later in this chapter.
AIR SPACES
For ISO 10211, PHI and BETB Guide methodologies, still air spaces within the assembly are
treated in two different approaches, depending on the size and location.
For planar airspaces, such as in uninsulated stud cavities, all the standards treat air spaces
as a constant material by combining the effects of radiation, convection and
conduction in the cavity into an equivalent thermal conductivity. The equivalent
conductivity depends on cavity depth, direction of heat flow and temperature
difference. ISO 10211 and PHI reference ISO 6946 which contains design values for air

C H A P T E R 2 | Methodologies for Determining Thermal Transmittance
2.8
spaces that are irrespective of temperature difference, which result in an airspace
resistance of up to R-1.3 (RSI-0.23). The BETB Guide references similar tabulated values for
airspaces within the ASHRAE Handbook of Fundamentals, but are assumed to be R-0.9
(RSI-0.16) as a conservative approach so that the thermal transmittance is not
dependent on temperature. This allows results to be applied to many climates without
sacrificing accuracy.
For small ventilated or unventilated airspaces, like those within glazing frames, ISO 10211,
PHI and the BETB Guide all follow ISO 10077-2. The conductivity of air is calculated based
on correlations using the depth, width and emissivity across the airspace.
COMBINED IMPACT OF BOUNDARY CONDITIONS AND AIR SPACES
For highly insulated assemblies, air boundary conditions and air spaces contribute only
a small portion to the overall thermal resistance in comparison to the rest of the
assembly components. The variation in boundary temperatures, heat transfer
coefficients (air films) and equivalent conductivities of air gaps, results in minor impacts
in the clear field U-value and even smaller differences in linear transmittance of
interface details. This is illustrated for an example intermediate floor in Figure 2.1.
Figure 2.1: Example Differences in Thermal Transmittance due to Varying Boundary
Conditions at an Intermediate Concrete Floor
Interior versus Exterior Dimensions
For details where the clear field assemblies meet at angles and have different interior
and exterior surface areas, like corners and wall to roof interfaces, linear transmittances
may appear to be significantly different from various sources. The difference can be
simply due to differences in reporting conventions as shown in Figure 2.2.
The additional heat flow from a geometric thermal bridge, like corners, can be

C H A P T E R 2 | Methodologies for Determining Thermal Transmittance
2.9
accounted for by adding the interface
linear transmittance to the clear field
transmittance using either the exterior
or interior dimensions.
Linear transmittance based on exterior
dimensions can be negative since the
clear field area is over accounted for.
Conversely, linear transmittance based
on interior dimensions are positive and
larger because less clear field area is
not over estimated in the calculation.
The overall heat flow will be the same
either way, as long as the take-off for
the clear field area matches the
corresponding linear transmittance reporting convention.
ISO 10211, PHI and the BETB Guide allow for any of these approaches; however, the
values presented in the BETB Guide catalogue are based on interior dimensions. This
allows for the BETB database to have a single transmittance value and will lead to
conservative estimates if conventions are mismatched in practice.
Slab-on-Grade Thermal Transmittance
Determination of thermal transmittance for slab-on-grade and foundation are the same
in the BETB Guide and PHI as both follow ISO 10211. However, the methodologies deviate
in how the values are reported. In all these methodologies, the thermal bridging elements
from the footing are evaluated by steady-state calculations according to ISO 10211.
In ISO 10211 the incremental thermal transmittance between the above grade wall and footing is presented as a linear transmittance, Ѱ. The thermal transmittance of the
foundation below-grade is presented as separate thermal values for the slab L2Da and
footing Ѱg as shown in Figure 2.3.
SINGLE PLANE ASSEMBLIES
The interior/exterior convention has no
impact on the linear transmittance
value for assemblies in a single plane,
like the intermediate floor shown to the
left. This is due to the fact that there is
no difference in areas or lengths
between inside and outside.
Figure 2.2: Interior versus Exterior Dimensions for
Thermal Transmittance Calculations

C H A P T E R 2 | Methodologies for Determining Thermal Transmittance
2.10
The BETB Guide provides the
slab-on-grade to wall
interface as a linear
transmittance. The slab-on-
grade and footing
transmittance are included in
a linear value, Lf. This
perimeter transmittance is
consistent with how energy
simulation software model
ground heat flow.
See Figure 2.3 for how ground
heat flow is determined for ISO
10211 and BETB Guide.
Regardless of reporting
conventions, the overall
thermal transmittance of slab-
on-grade are the same.
Window to Wall Interfaces
The BETB Guide utilizes NFRC-100 assumptions for calculating glazing performance as part
of calculating window to wall linear transmittances. To calculate Ψinstall, the entire
window is modelled with the glass, spacer and frame to determine Uw. The same
procedures as ISO 10211 are then followed to determine the interface Ψ-value.
PHI uses ISO 10077 to determine the glazing thermal transmittance and ISO 10211 to
calculate the linear transmittance of the install detail. The glazing U-value (Uw) is
calculated by combining the centre of glass U-value with the spacer and frame
transmittances. Using ISO 10211, the glazing assembly is then subtracted from the window
transition detail, along with the adjacent clear wall, to get the Ψinstall of the transition.
Figure 2.3: Approaches to Ground Heat Flow
FRAME AND SPACER
In PHI, the window transmittance is
calculated using multiple sections to
determine Ѱspacer and Uframe. These values
are calculated by comparing the window
section with the spacer to an idealized
window with a thermal block of the same
U-value as the centre-of-glass. The BETB
Guide does not determine these values
separately and instead simulates the
window section together.

C H A P T E R 2 | Methodologies for Determining Thermal Transmittance
2.11
Figure 2.4 outlines the boundary
conditions and air films. PHI and ISO
10211 use the air films from ISO 10077
and the BETB Guide uses air films from
NFRC-100. While not significant to the
opaque elements, differences in
boundary conditions and air cavities
can have an impact on glazing
thermal transmittance. Studies such
as the International Window
Standards study (RDH Building
Science, 2014), have shown that
triple glazing and low conductivity
frames may have product U-values
that differ by as much as 25% between PHI (ISO 10077) and NFRC-100. This can lead to
some confusion if product U-values are compared side by side that are based on
different methodologies.
Differences in assumed air film coefficients for glazing has a small impact on the linear
transmittance (Ψinstall) of the window to wall interface. This small difference can add up
to be significant over a large interface length for all the windows in a building. An
example is presented for a vinyl window installed in a steel-framed wall for the head,
jamb and sill sections below in Table 2.3.
Table 2.3: Comparison of Window to Wall Interface Transmittances
Head Jamb Sill
Approach Linear Transmittance W/m K (BTU/ft hroF)
Head Jamb Sill
BETB Guide 0.047 (0.027) 0.109 (0.063) 0.099 (0.057)
ISO 10077/10211 0.038 (0.022) 0.096 (0.055) 0.088 (0.051)
2D versus 3D Analysis
Differences between two-dimensional (2D) and three-dimensional (3D) analysis can be
significant to thermal transmittance and surface temperature. This section outlines the
Figure 2.4: Glazing Air Films for PHI and BETB

C H A P T E R 2 | Methodologies for Determining Thermal Transmittance
2.12
impact on thermal transmittance and the following section outlines the impact on
surface temperatures. The relative difference is dependent on how the wall, roof, or floor
construction is simplified in a 2D model and if heat flow paths exist in multi-directions.
The approach to 2D analysis depends on the detail that is being evaluated and the
following factors:
• Type of thermal bridge - linear or discrete points,
• If there are multiple thermal bridges, and
• If the thermal bridges are in multi-directions.
For example, a wall assembly with intermittent brackets and steel studs has two types of
thermal bridges in one direction. A parapet with a concrete roof deck with the same
wall assembly has additional thermal bridges (difference in interior and exterior surface
areas and the concrete roof deck) and has heat flow in multi-directions.
DISCRETE THERMAL BRIDGES
An example of how discrete thermal bridges are included in 2D calculations follows for
an intermittent cladding support bracket and a steel-framed wall. The intermittent
cladding attachment system is shown in Figure 2.5.
Figure 2.5: Example Bracket and Rail Cladding Attachment System
A single 2D section cannot fully represent the heat flow through the assembly for the
intermittent bracket. The studs and rails are continuous and can be represented in a
horizontal section. The brackets can be incorporated into 2D simulations as outlined by
the following three approaches.

C H A P T E R 2 | Methodologies for Determining Thermal Transmittance
2.13
Three-dimensional analysis allows components to be modelled directly where the actual
heat flow paths are simulated. Table 2.4 shows the differences in calculated thermal
transmittances for the example assembly when the brackets are made of fibre-
reinforced plastic (FRP) and aluminum.
Approach 1:
Averaged By
Volume
An average conductivity is
calculated for the exterior
insulation and brackets
based on the percent
volume of the brackets, rails
and insulation. A single
homogenous block with an
averaged conductivity is
included in the 2D model.
The steel studs are directly
modelled.
Approach 2:
Effective
Conductivity
for Intermittent
Components
An effective conductivity is
determined for the
intermittent brackets, based
on area weighting of the
bracket to insulation in the
3rd dimension. The rest of the
section and components
(rail, studs, insulation) are
directly modelled with
corresponding thermal
conductivities.
Approach 3:
Linear and
Point
Transmittances
Linear and point
transmittances are found for
the rail and bracket using 2D
sections. These linear and
point transmittances are
combined with the wall
thermal transmittance with
no brackets or rails in the
exterior layer.

C H A P T E R 2 | Methodologies for Determining Thermal Transmittance
2.14
Table 2.4: Comparison of Thermal Transmittance using 3D Analysis and Various 2D
Approaches for an Exterior Insulated Steel Stud Assembly with Intermittent Brackets
Bracket
Material Approach
Thermal
Transmittance
W/m2K
(BTU/ft2hroF)
Effective R-value
m2K/W
(ft2hroF/BTU)
Percent
Difference
Compared to
3D Analysis
1D Nominal 0.090 (0.016) 11.1 (62.8) -
FR
P
3D Analysis 0.118 (0.021) 8.5 (48.3) -
2D – Approach 1 0.267 (0.047) 3.8 (21.3) -56%
2D – Approach 2 0.117 (0.021) 8.6 (48.6) 1%
2D – Approach 3 0.116 (0.020) 8.7 (49.1) 2%
Alu
min
um
3D Analysis 0.216 (0.038) 4.6 (26.3) -
2D – Approach 1 0.390 (0.069) 2.6 (14.6) -45%
2D – Approach 2 0.368 (0.065) 2.7 (15.4) -41%
2D – Approach 3 0.159 (0.028) 6.3 (35.8) 36%
LINEAR THERMAL BRIDGES AND INTERFACE DETAILS
Calculating linear thermal transmittances using 2D analysis requires repeating thermal
bridges parallel to the cross section of the interface detail to be simplified or ignored. For
example, the cladding attachments and studs are parallel to the modelled cross section
REPEATING THERMAL ANOMALIES
ISO 10211 provides a framework to allow repeating thermal
bridges to be accounted for separately by linear or point
transmittances or to be combined into the clear field U-
value. ISO 14683 does not address assemblies with
repeating thermal bridges. The BETB Guide incorporates
repeating thermal bridges directly into the clear wall U-
value. PHI allows for both approaches; however, linear and
point transmittances of components are often calculated to
assess if the component is thermal bridge free (see Chapter
5 for more discussion).
Caution is required when assessing point transmittances
using theoretical spacing of components for systems with a
combination of brackets and rails. The spacing of
components varies significantly on projects and closely
spaced components can influence the transmittance
values of repeating thermal bridges.

C H A P T E R 2 | Methodologies for Determining Thermal Transmittance
2.15
for the intermediate floor. This approach misses the impact of any lateral heat flow paths,
such as heat flow from the floor, through the studs and out the cladding attachments.
Comparisons between 2D and 3D analysis are shown in Table 2.5.
Table 2.5: Comparison of 3D and 2D Analysis for an Intermediate Floor and Parapet
Intermediate Floor
3D Analysis
Simplified 2D Analysis
Parapet
3D Analysis
Simplified 2D Analysis
Detail 3D Analysis
W/mK ((btu/ft.hr.oF)
Simplified 2D Analysis
W/mK ((btu/ft.hr.oF)
Intermediate Floor 0.015 (0.008) 0.011 (0.006)
Parapet 0.061 (0.035) 0.051 (0.030)
OPAQUE GLAZING SPANDRELS SYSTEMS
Insulated opaque glazing spandrels for curtain wall or window wall are examples where
there is significant lateral heat flow through aluminum framing and metal back-pans that
are not fully accounted for by 2D analysis. Insulated curtain wall spandrel assemblies
evaluated in 2D according to NFRC-100 can overestimate the thermal performance by
20-33% compared to what is measured in hotbox tests (Norris et al, 2015).
The NFRC-100 2D modelling approach can be modified to better account for edges,
distances and other unique aspects of spandrel systems. However, modified NFRC-100
2D analysis still does not fully capture the complex heat flow paths of spandrel panels
and can result in thermal transmittances 16 to 25% lower than measured by a guarded
hotbox. A 3D spandrel model can directly capture the lateral heat flow and can provide
results within 5% of measured guarded hotbox values. Table 2.6 shows the results from
one scenario of evaluated scenarios from the referenced paper.

C H A P T E R 2 | Methodologies for Determining Thermal Transmittance
2.16
Table 2.6: Comparison of 2D and 3D Analysis to Hotbox Measurements for a Highly
Insulated Curtain Wall Spandrel
Hotbox Lab Measurement 3D Analysis 2D Analysis
Approach
Thermal Transmittance
W/m2K (BTU/ft2hroF)
Effective R-value m2K/W
(ft2hroF/BTU)
Percent Difference Compared to
Hotbox Measurement
Hotbox Measurement 0.87 (0.153) 1.2 (6.5) -
3D Analysis 0.87 (0.153) 1.2 (6.5) 0%
2D NFRC-100 0.63 (0.111) 1.6 (9.0) 32%
2D NFRC Modified 0.68 (0.120) 1.5 (8.3) 24%
SURFACE TEMPERATURES
Surface temperatures can assist in determining condensation risk and thermal comfort.
The method in determining surface temperatures are similar in ISO 10211, PHI and the
BETB Guide. Surface temperatures are expressed as temperature indices in the BETB
Guide and temperature factors, fRSI in ISO 10211 and PHI. Both values are ratios of the
surface temperature relative to the interior and exterior temperatures. Differences in
surface temperatures arise due to different assumptions for air films. For highly insulated
assemblies, the difference in surface temperatures are minor. However, there is a much
greater impact on surface temperatures for lower resistance assemblies, such as glazing,
since air films account for a greater portion of the total thermal resistance.
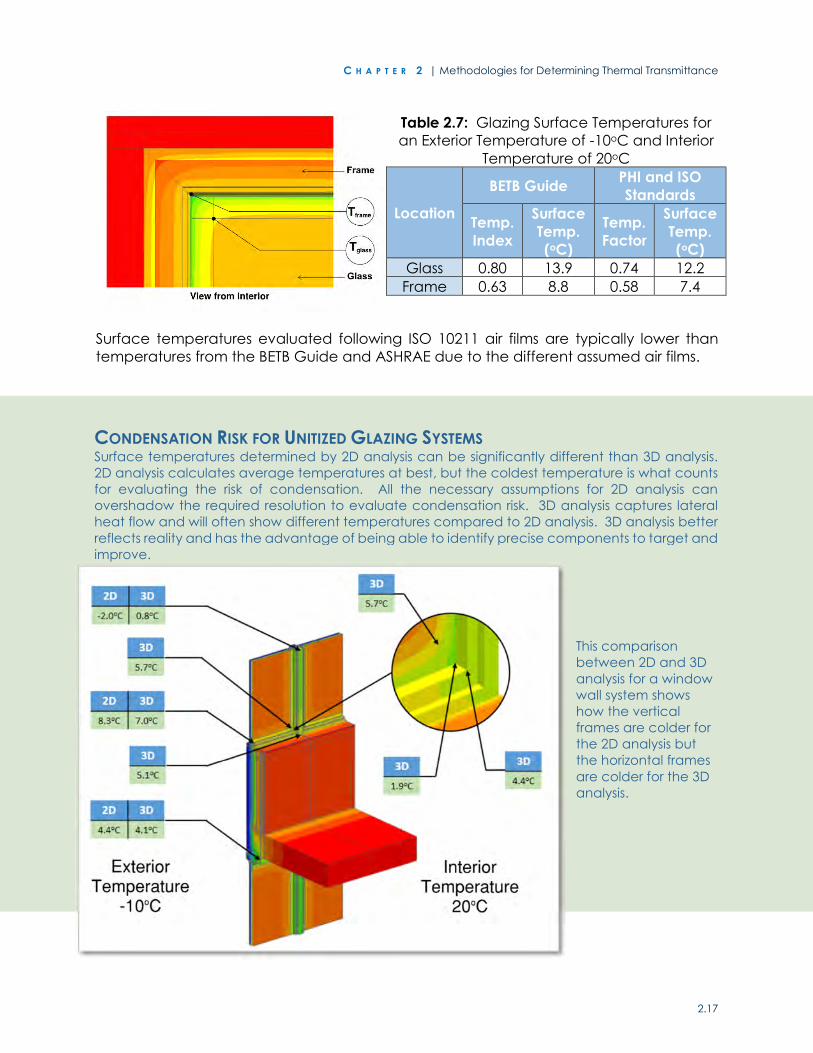
Table 2.7 shows an example where the difference in surface temperatures (exterior
temperature of -10oC and an interior temperature of 20oC) at the coldest location of a
window to wall interface at the head-jamb corner. The temperature locations were
taken at the edge of glass, 50 mm (2 inch) away from the sight edge. At this condition
the framing is 7.4oC using assumptions outlined by PHI and 8.8oC using the film coefficients
in the BETB Guide. This difference may seem minor, but may be significant for evaluating
condensation risk.
C H A P T E R 2 | Methodologies for Determining Thermal Transmittance
2.17
Table 2.7: Glazing Surface Temperatures for
an Exterior Temperature of -10oC and Interior
Temperature of 20oC
Location
BETB Guide PHI and ISO
Standards
Temp.
Index
Surface
Temp.
(oC)
Temp.
Factor
Surface
Temp.
(oC)
Glass 0.80 13.9 0.74 12.2
Frame 0.63 8.8 0.58 7.4
Surface temperatures evaluated following ISO 10211 air films are typically lower than
temperatures from the BETB Guide and ASHRAE due to the different assumed air films.
CONDENSATION RISK FOR UNITIZED GLAZING SYSTEMS Surface temperatures determined by 2D analysis can be significantly different than 3D analysis.
2D analysis calculates average temperatures at best, but the coldest temperature is what counts
for evaluating the risk of condensation. All the necessary assumptions for 2D analysis can
overshadow the required resolution to evaluate condensation risk. 3D analysis captures lateral
heat flow and will often show different temperatures compared to 2D analysis. 3D analysis better
reflects reality and has the advantage of being able to identify precise components to target and
improve.
This comparison
between 2D and 3D
analysis for a window
wall system shows
how the vertical
frames are colder for
the 2D analysis but
the horizontal frames
are colder for the 3D
analysis.

C H A P T E R 2 | Methodologies for Determining Thermal Transmittance
2.18
Detailed versus Simplified Geometry
Assumptions of how geometry is idealized in thermal
models results in varying impacts on linear
transmittance from minor to significant, depending on
the complexity of the interface. An example of a
complex window to wall interface as shown in Figure
2.6 is outlined in this section where the differences
between a simplified, intermediate, and detailed
approach are significant. Examples of simple
geometry without significant differences are outlined
in the final section.
SIMPLIFIED APPROACH
With the simplified approach the head, sill, and jamb
linear transmittances are calculated based on
idealized geometry for a section modeled without
studs and brackets as shown in Figure 2.7. An example of the simplified section is shown
below. The simplified approach is frequently used when evaluating thermal bridging at
window to wall interfaces with 2D finite element modelling programs such as THERM.
Figure 2.7: Modelled Sections Window to Wall Interfaces for the Simplified Approach
Figure 2.6: Window to Wall
Interface

C H A P T E R 2 | Methodologies for Determining Thermal Transmittance
2.19
INTERMEDIATE APPROACH
Similar to the simplified approach, the head, sill and jamb linear transmittances are
calculated using idealized geometry. However, the modelled sections now include the
studs and brackets at the uniform spacing. For example, the width of the head and sill
modelled sections are 406 mm (16 inches) wide based on the spacing of the steel studs
and 457 mm (18 inches) high based on the 914 mm (36 inch) vertical spacing of the
brackets. Figure 2.8 shows these assumptions for the example window.
Figure 2.8: Modelled Sections Window to Wall Interfaces for the Intermediate Approach
The complication is that the impact of the studs and brackets can be overestimated
once applied to the overall window to wall interface. The example window is 1219 mm
(48 inches) wide and 1524 mm (60 inches) high. Essentially an extra stud and bracket is
factored into the calculation when the head and sill linear transmittance are applied to
a 1219 mm (48 inch) interface length. Similarly the impacts of the brackets are
overestimated at the jamb when applied to a 1524 mm (60 inch) interface length for the
jamb.
DETAILED APPROACH
The window to wall interface linear transmittance is determined using a 3D model of a
specific geometry and window size. The drawback of this approach is that the window
to wall linear transmittance is averaged over the entire interface, including the head, sill
and jamb.
The intent of separating the head, sill and jamb linear transmittances is to allow the
individual transmittances to be applied to any window size when there are significant
differences between the details of the head, sill and/or jamb.
Table 2.8 summarizes the difference between the simplified, intermediate and detailed
approaches for the steel-framed wall shown in Figure 2.6. An interior insulated poured-
in-place concrete wall with insulation uninterrupted by metal framing is included for
comparison using data from detail 6.3.11 of the BETB Guide (Version 1.2, 2016). The

C H A P T E R 2 | Methodologies for Determining Thermal Transmittance
2.20
difference between all three approaches is significant for the steel-framed wall with
complex framing, but minor for the concrete wall because there is not significant thermal
bridges through the insulation layer at the window to wall interface.
When are 2D Simplifications Adequate?
Default linear transmittance values from ISO 14383 are intended to represent worst-case
scenarios determined by 2D numerical modelling in accordance with ISO 10211. In
general the ISO 14383 default values are higher than the values found in the BETB Guide.
However, there are cases where 3D values contained in the BETB Guide are higher than
the default values for assemblies with strong lateral heat flow paths and discrete thermal
bridges, such as is the case with steel studs and cladding sub-framing.
The scenarios that the ISO 14383 default values are good approximations are for
concrete structures with single insulation layers, simple interface details and thermal
bridges that can be captured by a single section. Examples where ISO 14383 default
values closely match the BETB Guide details are illustrated in Figure 2.9.
Figure 2.9: Comparison of Interior Transmittance Values (Ψi) Between BETB Guide 3D
Analysis and ISO 14683 Default Values
Table 2.8: Window to Wall Linear Transmittance for Detailed and Simplified
Approaches
Assembly and
Approach
Linear Transmittance W/m K (BTU/ft hroF)
Head Jamb Sill Entire
Interface
Ste
el-
Fra
me
d Simplified 0.039 (0.022) 0.044 (0.025) 0.024 (0.014) 0.038 (0.022)
Intermediate 0.047 (0.027) 0.109 (0.063) 0.081 (0.047) 0.087 (0.050)
Detailed N/A N/A N/A 0.041 (0.024)
Co
nc
rete
Simplified 0.139 (0.080) 0.088 (0.051) -0.040 (-0.023) 0.067 (0.039)
Intermediate Does not apply because there is no multidirectional framing
Detailed N/A N/A N/A 0.066 (0.038)

M O R R I S O N H E R S H F I E L D | Guide to Low Thermal Energy Demand for Large Buildings
Chapter
HEAT RECOVERY VENTILATORS 3
Introduction
All buildings must be ventilated as required by the applicable building code. There are
many ways in which a multi-unit residential building (MURB) can be ventilated, but for
buildings attempting to achieve low thermal energy demand intensity (TEDI), heat
recovery on ventilation air is essential. For MURBs, this is often through individual suite
energy or heat recovery ventilators (ERV/HRV), however, central or floor by floor
ventilation systems with heat recovery are also possible. HRVs are self-contained
ventilation systems designed to provide outdoor air to spaces, but also to temper that air
via heat exchanger, which transfers heat from outgoing exhaust air to the incoming
outdoor air. Figure 3.1 shows a diagram of a typical HRV. Energy recovery ventilators
(ERVs) are similar, but they also recover latent energy from exhaust air, as well as
managing humidity.
Figure 3.1: Typical HRV Schematic
HRVs directly reduce a suite or building’s overall heating energy demand due to the
tempering of incoming air. They also consume energy due to the fans (typically two),
which are built-in and serve as drivers of supply and exhaust flows. Additional energy
consumption by HRVs includes the potential requirement for preheat coils to prevent frost
from building up within the unit. Preheat may be required when outdoor conditions are
below the manufacturer’s recommended operating limits of the unit. However, the
overall net effect is a reduction in energy consumption because the savings in heating
energy is typically significantly higher than the losses due to fans and auxiliary coils.
This section provides a brief overview of HRV rating methods and direction on how to
properly represent HRVs in whole building energy modelling software depending on its
rating method and software capabilities, with the goal of representing their benefit as
accurately as possible.
C H A P T E R 3 | Heat Recovery Ventilators
3.2
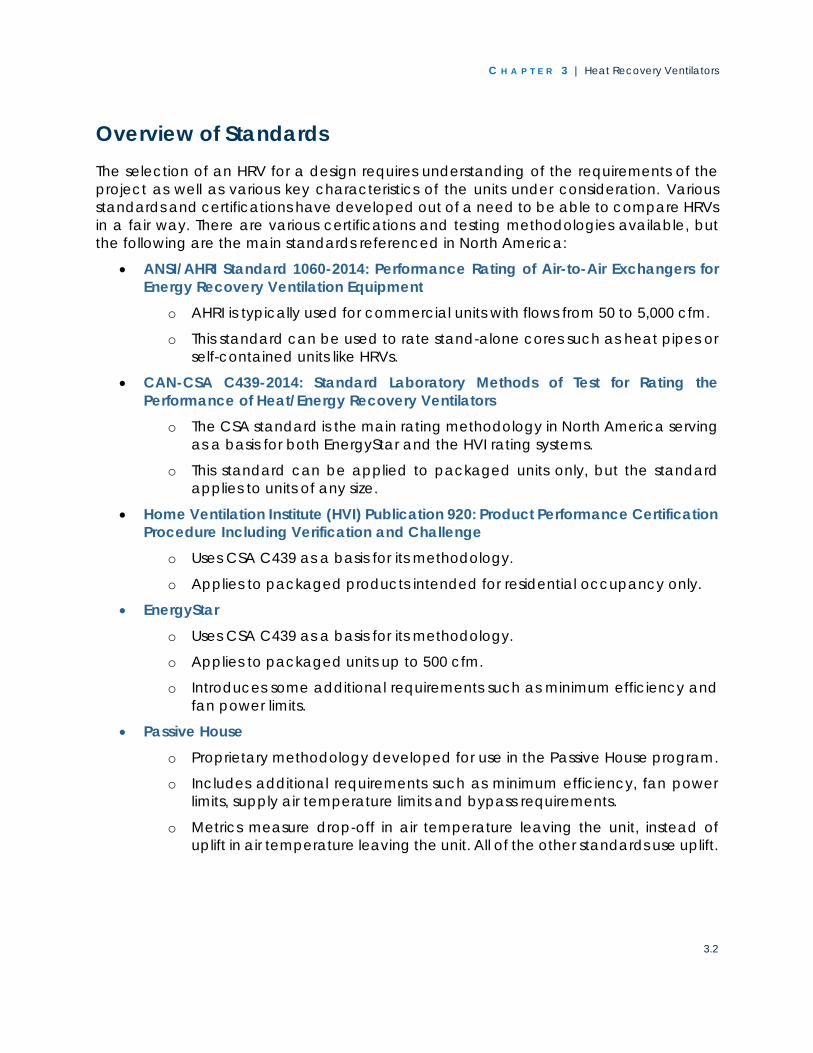
Overview of Standards
The selection of an HRV for a design requires understanding of the requirements of the
project as well as various key characteristics of the units under consideration. Various
standards and certifications have developed out of a need to be able to compare HRVs
in a fair way. There are various certifications and testing methodologies available, but
the following are the main standards referenced in North America:
ANSI/AHRI Standard 1060-2014: Performance Rating of Air-to-Air Exchangers for
Energy Recovery Ventilation Equipment
o AHRI is typically used for commercial units with flows from 50 to 5,000 cfm.
o This standard can be used to rate stand-alone cores such as heat pipes or
self-contained units like HRVs.
CAN-CSA C439-2014: Standard Laboratory Methods of Test for Rating the
Performance of Heat/Energy Recovery Ventilators
o The CSA standard is the main rating methodology in North America serving
as a basis for both EnergyStar and the HVI rating systems.
o This standard can be applied to packaged units only, but the standard
applies to units of any size.
Home Ventilation Institute (HVI) Publication 920: Product Performance Certification
Procedure Including Verification and Challenge
o Uses CSA C439 as a basis for its methodology.
o Applies to packaged products intended for residential occupancy only.
EnergyStar
o Uses CSA C439 as a basis for its methodology.
o Applies to packaged units up to 500 cfm.
o Introduces some additional requirements such as minimum efficiency and
fan power limits.
Passive House
o Proprietary methodology developed for use in the Passive House program.
o Includes additional requirements such as minimum efficiency, fan power
limits, supply air temperature limits and bypass requirements.
o Metrics measure drop-off in air temperature leaving the unit, instead of
uplift in air temperature leaving the unit. All of the other standards use uplift.

C H A P T E R 3 | Heat Recovery Ventilators
3.3
KEY METRICS
When comparing the standards, it is important to understand that there are differences
in terminology for the key metrics involved. The terms efficiency and effectiveness are
used throughout these standards. Both are an attempt to measure the useful heat
transfer provided by the HRV as a fraction of the theoretical maximum energy that can
be extracted. The higher the efficiency, the more energy is recovered and used to
temper incoming air. The differences arise in what is included in the theoretical maximum
energy that can be extracted and what is considered useful heat. Table 3.1 summarizes
the differences between how the terms are used in each standard. HVI’s Sensible
Recovery Efficiency (SRE) and Passive House’s efficiency are the metrics most applicable
to energy modelling and are referenced later in this chapter.
Table 3.1: Summary and Comparison of Key Metrics
Metric HVI/CSA PH AHRI Theoretical Energy
Available
Difference in temperature between air extracted from space and
incoming outdoor air.
Effectiveness
Includes air leakage,
cross contamination
and fan power.
(Apparent Sensible
Recovery Effectiveness:
ASRE)
n/a
Includes air leakage,
cross contamination
and fan power. Fan
power is not accounted
for in stand-alone cores.
Net Effectiveness n/a n/a
Removes effects of
cross contamination,
but still includes fans, if
present.
Effectiveness (Low
Temperature Rating)
Includes air leakage,
cross contamination,
fan power and
defrost/bypass effects.
n/a n/a
Efficiency
Removes effects of air
leakage, cross
contamination, defrost
and supply fan power.
(Sensible Recovery
Efficiency: SRE)
Includes air
leakage, cross
contamination
and fan
power.
n/a
The metrics are derived from measurements taken at particular temperatures and flows.
It is important to use the metric measured at the flow closest to the design flow rate of
the HRV being modelled. For example, HVI often provides efficiency values for a range
of flows, in contrast to Passive House efficiencies, which are always provided at a specific
flow rate. For a multi-speed unit, this would be a calculated flow rate, depending on the
minimum and maximum flows. This calculated value is not directly an average, so this
can make comparisons between Passive House and other ratings difficult for multi-speed
units. See the Passive House documentation for details (PHI, 2009).

C H A P T E R 3 | Heat Recovery Ventilators
3.4
The largest difference between Sensible Recovery Efficiency (SRE) and Apparent Sensible
Recovery Effectiveness (ASRE) (from Table 3.1) is the inclusion of supply fan heat effects,
leakage and cross contamination. A comparison of the differences between SRE and
ASRE for several hundred HRVs from the HVI product database is shown in Figure 3.2.
There is a strong relationship between SRE/ASRE difference and fan power, as would be
expected.
Figure 3.2: Effects of Fan Power on SRE vs ASRE
Third Party Methodologies
Methodologies for interpreting HRV ratings and modelling HRVs vary. Moreover,
additional requirements related to HRVs that are not directly related to a particular HRV
rating methodology may also be required in projects. For example, the supply air
temperature for Passive House is not allowed to drop below certain comfort limits. There
is also a requirement that HRV effectiveness be de-rated by 12% if the unit is not an
officially certified Passive House HRV.
The Passive House Institute of the US (PHIUS) studied HRV ratings in the context of Passive
House in the report “PHIUS Technical Committee ERV/HRV Modeling Protocols” (PHIUS,
2015). The intent was to find a more equitable representation of HVI rated HRVs for the
North American industry. The report recommends to manually adjust for fan power using
HVI rated conditions for efficiency (not effectiveness). This means that the effects of
leakage and cross contamination are not accounted for and the effect of fan heat is
approximated. This is generally a good approach, but the PHIUS method is specifically
designed to recreate a Passive House rating for use in the Passive House software only.
While the above methods may not be ideal representations of HRVs in actual operation,
they are required to support specific methodologies like Passive House, and are to be
0
2
4
6
8
10
12
14
16
18
20
- 0.5 1.0 1.5 2.0 2.5
Diffe
ren
ce
Be
twe
en
SR
E a
nd
ASR
E
(%)
Fan Power (W/cfm)
Difference Between SRE and ASRE vs Fan Power

C H A P T E R 3 | Heat Recovery Ventilators
3.5
used in conjunction with specific tools that support these methodologies and associated
assumptions.
Recommended Methodology
There are various methodologies and standards with different terminology and focus. This
can lead to significant confusion and controversy relating to which one is “best”.
Fundamentally, all of the examined standards provide useful information when used with
understanding of its context and when trying to answer the question “How will this HRV
impact my building’s energy consumption?” The primary goal, when trying to answer this
question, is to accurately model the energy impacts of the HRV on the design. In order
to do this, all of the energy-related impacts should be represented.
At first, it may appear that the ASRE is the most desirable metric because it includes as
many “real world” effects as possible. There are several problems with this approach.
Leakage of air into the HRV and transfer of heat through the HRV casing affect the
temperature of air being provided to the space, however, they occur at the expense of
additional load on the space itself. This leads to no overall net savings in heating energy
so it is not appropriate to include this in a metric designed to help assess overall energy
consumption. Cross contamination between supply and exhaust flows does lead to a net
reduction in energy consumption
because the air would otherwise leave
the building and be lost. However,
allowing “credit” for this in a metric
endorses energy savings at the cost of air
quality.
The recommended approach is to use
the SRE for energy modelling exercises.
However, this is not without issues
because supply fan power is not included
in the SRE. Fan power directly offsets
heating load, at the cost of Energy Use
Intensity (EUI), which is a real and
necessary impact that should be accounted for in an energy model. Fan power should
be modelled directly, if possible, or the SRE can be adjusted to account for fan power. A
description of the potential adjustment is included later in this chapter.
When comparing HRVs, it is important to understand if a particular metric gives “credit”
for one effect or another (poorly performing fans, leakage, etc.), but when judging its
impact on a building, what matters most is that the metric is used correctly in the tool.
The challenge is that different energy modelling tools make different basic assumptions
and have different defaults, which can make accurately using the available metrics a
challenge. Several key points should be understood:
CONTEXT IS KEY
The various rating methodologies differ in their
intent, context and assumptions, so it is a
challenge to use them for fair comparisons
between HRVs. However, they all provide metrics
useful for judging real-world annual energy use
when used in their intended way. Fundamentally,
the different methodologies are all “correct” for
their given contexts. The key is to use them
appropriately.

C H A P T E R 3 | Heat Recovery Ventilators
3.6
1. Energy modelling software will either assume a location for the fans in a heat
recovery device or start with a default fan arrangement. These assumptions
and/or defaults may not match the actual fan placement of the HRV in question.
The energy modeller must understand these differences and adjust for them if
necessary.
2. The impacts of defrost and other control methods, such as summer bypass, will not
already be accounted for by default in an energy model, so the energy modeller
must implement these effects separately. Modelling controls separately is
desirable because they can vary between projects even with identical HRVs. The
details of how this is done depends on the software.
3. When modelling a heat recovery system using an hourly simulation program such
as EnergyPlus or eQuest, the energy modeller must determine if an adjustment to
efficiency is required. The flow charts in Figure 3.3 and Figure 3.4 provide a more
detailed description of this process, but the modeller must do one of the following:
o Ensure that modelled fan placement matches the HRV’s design,
o Adjust the effects of fan heat on the airstream of the modelled HRV to
match the effects of the fans in the actual HRVs, and
o Adjust the efficiency up or down appropriately so that when/if the energy
model adds fan heat, the overall efficiency matches the HRV’s rated
efficiency.
4. Use the efficiency metric measured at the design flow rate of the HRV, if available.
5. Fan power is not included in an AHRI rating for a stand-alone core regardless of
the use of effectiveness or efficiency.
6. HVI/CSA’s effectiveness and low temperature rating efficiency are similar in that
they both take into account defrost cycling time. These values should not be used
directly because defrost and its effect on heat recovery is modelled explicitly
elsewhere through bypass controls, pre-heat coils or other software-dependent
approaches.
The following flow charts (Figure 3.3 and Figure 3.4) demonstrate the recommended
approach to HRV modelling when HVI/CSA and AHRI metrics are available. These flow
charts apply to projects pursuing conventional high performance building targets. If a
project is pursuing Passive House certification, then the Passive House metrics and
methodology must be used.

C H A P T E R 3 | Heat Recovery Ventilators
3.7
Figure 3.3: HRV Modelling Flow Chart (AHRI)

C H A P T E R 3 | Heat Recovery Ventilators
3.8
Figure 3.4: HRV Modelling Flow Chart (CSA/HVI)

C H A P T E R 3 | Heat Recovery Ventilators
3.9
The following equation can be used to adjust the rated efficiency. The constants shown
here are the combinations of conversions of units and the rated difference in
temperatures required by the methodology in question. More details about the
derivation of these formulas can be found in Appendix B.
𝜀𝐴𝑑𝑗𝑢𝑠𝑡𝑒𝑑 = 𝜀𝑅𝑎𝑡𝑒𝑑 ± 𝐴𝑆𝐹 − 𝐴𝐸𝐹 (Equation 1)
Where ASF is the adjustment for the supply fan and AEF is the adjustment for the exhaust
fan. ASF will be positive in cases when the energy modeller is trying to add the effects of
fan heat and negative when trying to remove the effects of fan heat. In order to decide,
the energy modeller must understand the software being used and whether fan heat is
already accounted for in the energy model. The end goal is to account for fan heat fairly,
in the appropriate place and only once. AEF will always be negative or zero because the
metric being adjusted will already include the effects of the exhaust fan.
𝐴𝑆𝐹 = ±(
𝑊𝑆𝐹𝑐𝑓𝑚
)
12.5497+(𝑊𝐸𝐹𝑐𝑓𝑚
) (Equation 1a)
𝐴𝐸𝐹 = 0.07968 × 𝜀𝑟𝑎𝑡𝑒𝑑 × (𝑊𝐸𝐹
𝑐𝑓𝑚) (Equation 1b)
𝑊𝑆𝐹 𝑎𝑛𝑑 𝑊𝐸𝐹 = 𝑅𝑎𝑡𝑒𝑑 𝑝𝑜𝑤𝑒𝑟 𝑐𝑜𝑛𝑠𝑢𝑚𝑝𝑡𝑖𝑜𝑛 𝑜𝑓 𝑡ℎ𝑒 𝑠𝑢𝑝𝑝𝑙𝑦 𝑎𝑛𝑑 𝑒𝑥ℎ𝑎𝑢𝑠𝑡 𝑓𝑎𝑛𝑠 𝑟𝑒𝑠𝑝𝑒𝑐𝑡𝑖𝑣𝑒𝑙𝑦.
𝑐𝑓𝑚 = 𝑅𝑎𝑡𝑒𝑑 𝑓𝑙𝑜𝑤 𝑟𝑎𝑡𝑒 𝑜𝑓 𝑢𝑛𝑖𝑡 𝑖𝑛 𝑐𝑢𝑏𝑖𝑐 𝑓𝑒𝑒𝑡 𝑝𝑒𝑟 𝑚𝑖𝑛𝑢𝑡𝑒
𝜀𝑟𝑎𝑡𝑒𝑑 = 𝑅𝑎𝑡𝑒𝑑 𝑒𝑓𝑓𝑖𝑐𝑖𝑒𝑛𝑐𝑦 𝑎𝑠 𝑎 𝑓𝑟𝑎𝑐𝑡𝑖𝑜𝑛 (𝑆𝑅𝐸 𝑓𝑜𝑟 𝐶𝑆𝐴/𝐻𝑉𝐼) 𝑜𝑟 𝑛𝑒𝑡 𝑒𝑓𝑓𝑒𝑐𝑡𝑖𝑣𝑒𝑛𝑒𝑠𝑠 (𝐴𝐻𝑅𝐼)
The fan powers in the equations above should be considered zero if the fan motor is not
in the same airstream as the fan itself. If one motor serves two fans, the entire fan power
should be allocated to the appropriate airstream. There is a small difference between
calculating the effects of the supply and return fans individually or together. However,
this difference is small, and decreases as fan power decreases, so is not considered here.
Adjusting efficiency using Equation 1 brings the SRE metric closer to the ASRE metric. The
remaining differences are primarily due to leakage and cross contamination. Figure 3.5
shows the differences between the adjusted SRE and ASRE versus unadjusted SRE for
several hundred HRVs from the HVI database. Most HRVs have 2-4% difference after
adjustment. The more efficient units differ by at most 2%. Several outliers are present.
These represent HRVs with particularly inefficient fans or HRVs where the fan arrangement
is not typical.

C H A P T E R 3 | Heat Recovery Ventilators
3.10
Figure 3.5: Difference between Adjusted SRE and ASRE versus SRE
The primary differences between metrics are due to fans, leakage and cross
contamination. Fan heat is accounted for in the energy model or adjusted using Equation
1, air leakage from the room into the HRV will not affect energy use in reality and cross
contamination is energy savings at the expense of air quality.
Fans
A key difference between the standards is the assumption of when/if fan energy is
“useful”. In the Passive House method, all fan heat (supply and exhaust) is assumed to
contribute to offsetting heating loads. This may or may not be appropriate for a given
project. In the other methodologies, the supply fan contributes to heating during heating
season, but applies a penalty during cooling season. Also, if the exhaust fan is upstream
of the heat recovery core, its impact will be included in the effectiveness, while if it is
downstream it will not.
In all methodologies that include fan power, inefficient fans can inflate the results. Passive
House is the only method to also limit fan power as a requirement to meeting the
standard. Passive House requires that HRVs not exceed 0.45 Wh/m3 (~0.26 W/cfm) at the
tested flow rate. By limiting fan power, Passive House reduces the heating effects of low-
efficiency fans. In any methodology, the fan power must be considered due to its effect
on overall energy consumption.
Defrost
Defrost strategies can play an important role in a heat recovery system for Canadian
climates. All heat recovery devices have a low limit on their operating temperatures,
meaning they will automatically shut off or take some action to prevent damage due to
-2
0
2
4
6
8
10
12
14
16
40 50 60 70 80 90 100
Diffe
ren
ce
Be
twe
en
ASR
E a
nd
Ad
just
ed
SR
E (
%)
SRE (%)
Difference Between Adjusted SRE and ASRE vs SRE

C H A P T E R 3 | Heat Recovery Ventilators
3.11
frost or low temperatures. The minimum operating temperature differs between units, with
higher efficiency units typically having lower minimums. The defrost strategy can
significantly impact thermal energy demand in a building because the measures taken
to mitigate frost will often reduce heat recovery effectiveness or temporarily disable heat
recovery completely. The following are common strategies for frost control in HRVs:
Bypass: Internal or external to the HRV, a bypass system will allow outdoor air to be
supplied without it passing through the heat recovery core. This ensures that
ventilation air is provided, but provides no heat recovery. This method will put all
ventilation air heating load directly onto the mechanical system and could also
lead to comfort issues when cold air is introduced directly into the heated space.
Recirculation: Exhaust air is recirculated as supply air, warming the heat recovery
core and reducing frost. The disadvantage to this method is that there is no
ventilation air during recirculation mode. This is a simple method, but there is no
heat recovery during recirculation and some codes do not allow ventilation to be
stopped in this way.
Exhaust Only: Using this method involves stopping the flow of outdoor air through
the heat recovery core, but continuing to exhaust air from the building. This allows
the core to warm up without cold outdoor air entering, but means there is no
ventilation during this period. It also leads to an imbalance of air pressures within
the building, which is undesirable.
Outdoor Air Preheat: Incoming outdoor air is preheated to ensure the air is always
above the minimum operating temperature of the HRV. This allows heat recovery
and ventilation at all times, but introduces additional heating energy for the
preheat coil. This is the optimal method of defrost because the amount of
additional heating energy will likely be lower than the amount of heat recovery
gained.
It is generally recommended that ventilation is provided continuously for MURBs,
therefore, the outdoor air preheat method is generally recommended. Some jurisdictions
allow certain exceptions to this and/or include additional requirements. Nevertheless, the
energy required to preheat the incoming air is important to consider. Table 3.2 shows the
penalty a building will incur due to preheating the outdoor air up to the low limit of an
HRV for typical MURB ventilation rates. When comparing HRVs of similar efficiency, the
unit with the lower temperature limit will result in a lower TEDI due to less preheat. It is clear
that the penalties can be significant in colder climates so design teams should carefully
consider the temperature rating of the project’s HRVs.
It is important to understand that ensuring constant ventilation may result in a penalty,
but will also ensure that the heat recovery device is available at all times because it
would otherwise be bypassed. This can lead to an overall net reduction in TEDI even after
the preheat penalty, depending on the efficiency of the HRV and the climates.

C H A P T E R 3 | Heat Recovery Ventilators
3.12
The scenarios discussed in this chapter and the next chapter assume that an HRV is rated
for operating conditions matching the typical outdoor temperature of the given climate,
so that preheat is not required. If the unit had a lower limit than this, the penalties in Table
3.2 would apply to these scenarios as well.
Table 3.2: TEDI Penalty Due to Preheat Coil by Climate Zone
Preheat Coil Setpoint (°C)
(HRV Low Limit Rating)
Preheat Coil TEDI Penalty (kWh/m2) by Climate Zone
4 5 6 7a
0 0.2 3.9 7.7 14.1
-5 0 1.6 4.0 9.1
-10 0 0.5 2.0 5.6
-15 0 0.1 0.9 3.1
-20 0 0 0.4 1.4
-25 0 0 0.1 0.5
Regardless of the method, the energy impacts of defrost must be included in energy
models. The approach varies depending on the software, so the energy modeller must
understand the design defrost strategy and how to implement this in the software being
used on a project.
HRV Standards in Context
For most projects, there will be no choice in which standard to use. Requirements are
imposed by the authority having jurisdiction or by the building rating system being used.
In a design with low thermal demand, the assumptions around which metric to use, and
the resulting impact on overall building energy use and TEDI, may not be significant. Table
3.3 summarizes the effects of modelling HRVs in climate zone 7A using various rating
methodologies. The “Max Difference” column shows the maximum difference in TEDI
resulting from modelling the HRV for the various methodologies. The Passive House rating,
the HVI ASRE rating and Adjusted SRE were modelled in EnergyPlus. Some of the units
examined have both Passive House and HVI ratings available.
The differences between the ratings are small and consequently the differences in TEDI
are also small. As the efficiency of the units increases and the fan power decreases,
potential differences between standards are marginalized for low TEDI buildings.
Table 3.3: Summary of Impact on TEDI of Various Standards
HRV
PH
Rating
(%)
HVI ASRE
Rating
(%)
HVI SRE Rating
Adjusted using
Equation 1 (%)
Total Fan
Power
(Watts/cfm)
Max Difference in
TEDI (kWh/m2)
For Climate Zone 7A
1 92 90 88 0.52 1.71
2 84 88 87 0.39 1.74
3 - 83 79 0.88 1.77
4 - 81 76 0.77 2.22
5 - 64 60 1.01 1.86

M O R R I S O N H E R S H F I E L D | Guide to Low Thermal Energy Demand for Large Buildings
Chapter
WHOLE BUILDING CONTEXT
4
Introduction
A primary focus of this guide is to illustrate how to meet the challenges of low energy
demand intensity (TEDI) for high-rise multi-unit residential buildings (MURBs) by
understanding and mitigating the impact of thermal bridges at interface details, such as
the wall to roof, wall to window and intermediate floor intersections. Other components
that are important to reducing thermal loads are supported by available products (e.g.
triple-glazed windows, HRVs) and better understood by current resources (e.g. “Illustrated
Guide: Achieving Airtight Buildings” (RDH, 2017)). This chapter aims to put the thermal
transmittance of the opaque building envelope in context with these other key
parameters and identify design strategies that must be employed to achieve a low TEDI
for high-rise residential buildings.
TEDI alone does not provide a complete representation of overall building energy
consumption. Overall energy use, often presented as energy per building area or energy
use intensity (EUI) encompasses the effects of all building systems, such as lighting,
heating and domestic hot water. Many of these building systems interact with each
other, with some loads impacting TEDI, but are not part of a low thermal demand
strategy. For example, lighting and equipment add heat to a space and lower TEDI, but
should be minimized to reduce overall EUI. Achieving both a low TEDI and EUI is important
to achieve multiple high performance objectives, including lower energy use and cost,
reduction of greenhouse gas emissions and improved thermal comfort. Various
standards now have separate requirements for TEDI and EUI to manage this balance. For
examples, see the City of Vancouver’s “Zero Emissions Building Plan” (City of Vancouver,
2016), the City of Toronto’s “Toronto Green Standard” (City of Toronto, 2017), “BC Energy
Step Code” (Province of BC, 2017) and
Passive House (Passive House Institute,
2016)). For the purposes of this chapter,
many of these variables not directly
linked to low thermal energy demand
strategies (i.e. lighting, plug loads,
operating schedules, etc.) are fixed, in
line with industry standard “energy
modelling guidelines” (City of
Vancouver, 2017) referenced by “BC
Energy Step Code” (Province of BC,
2017).
TEDI – ONE OF MANY
A building with low TEDI is only one of many
performance criteria that are needed for low
energy buildings. When TEDI is drastically reduced,
loads other than heating become much more
significant. Other loads, such as internal gains, can
also impact TEDI. More people and lights, for
example, reduce a building’s TEDI. To avoid
optimizing TEDI at the expense of other building
systems, TEDI, when referenced in codes, is usually
accompanied by rules around internal gains
and/or EUI requirements.

C H A P T E R 4 | Whole Building Context
4.2
As discussed in Chapter 1, the most well-known standards that currently employ a TEDI
requirement include the “Zero Emissions Building Plan and Framework” in the cities of
Vancouver and Toronto respectively (City of Vancouver, 2016) (City of Toronto, 2017),
and the “BC Energy Step Code” (Province of BC, 2017). For high-rise residential buildings,
the most stringent TEDI requirements have a maximum TEDI of 15 kWh/m2/year, a limit
generally representing net-zero ready or near net-zero ready buildings.
Figure 4.1 shows a sample end-use breakdown for a low energy building in Climate Zone
6 with a TEDI of 16.0 kWh/m2 and an EUI of 85.9 kWh/m2. This example building has a 100%
efficient heating system (e.g. electric baseboard heating), 0.284 W/m2K overall thermal
transmittance of the walls (Effective R-20), triple-glazed windows, increased airtightness
and premium HRVs. Less than a quarter of the building’s energy use is related to space
and ventilation heating for this example. The space heating is affected by several
parameters as broken out in the graphs, including window, wall, ventilation and
infiltration losses.
Figure 4.1: End-use Breakdown for a Low Energy MURB in Climate Zone 6
Figure 4.2 shows a sample breakdown of the heat gains and losses of a high-rise MURB
with low thermal demand. Ventilation and windows have the highest heat losses, but also
can provide the highest heat gains through the use of heat recovery and solar energy,
respectively.
The breakdown shown in Figure 4.2 depends on the building design, with the balance of
the loads being affected by the heating balance point, climate and building envelope
design. An important observation is that the internal gains from occupant-controlled
sources are almost as large as the heat recovery component of the gains. As the loads
in low TEDI buildings are reduced, these occupant-related gains become dominant.
These internal gains are typically fixed to comply with codes and standards, but there is
more of an incentive to reduce these loads when their share becomes relatively larger
Window Losses
6.5%
Wall Losses
4.3%
Ventilation Losses
6.6%
Infiltration Losses
1.2%
Lighting
19.0%
Plug Loads
20.6%
Other Equipment
2.9%
DHW
28.4%Fans
10.4%
Heating
18.6%

C H A P T E R 4 | Whole Building Context
4.3
for low TEDI buildings. When reductions to internal gains can be realized, the need for
better performing building envelopes becomes even more critical.
Figure 4.2: Example Breakdown of Heating Load Components
Characteristics of Low Energy Buildings
Achieving a low energy building requires making a significant number of design
decisions, many of which are interrelated. A large number of design options, based on
an archetype MURB (see BuildingPathfinder.com for details (OGBS, 2017)), were
simulated to identify which combinations of options could meet the required
performance targets. An interactive data visualization tool was used to visually represent
the impact of combinations of design options on specified metrics, in this case TEDI. A
screenshot of the tool is shown in Figure 4.3, where each line represents one simulation,
and each axis represents a parameter in the simulation or an output from it. The location
where the lines cross the axes corresponds to the value of that parameter or output for
the given simulation.
A range of the major design parameters that govern TEDI were simulated to understand
relative impacts and interactions between parameters. These parameters are discussed
in more detail later in this chapter and include:
• Internal Gains
• Building Shape
• Opaque Envelope
• Glazing
• Overheating
• Air Infiltration
• Ventilation (See Chapter 3)
Window Losses (35.0%)
Wall Losses (23.1%)
Ventilation Losses (35.5%)
Infiltration Losses (6.5%)
Heat Recovery Gains
(27.7%)
People Gains (7.0%)
Lighting Gains (13.4%)
Equip Gains (17.3%)
Solar Gains (22.6%)
Heating Output (12.0%)
Gains
Losses

C H A P T E R 4 | Whole Building Context
4.4
Figure 4.3: Example of Visualization of Simulation Results
INTERNAL GAINS
The term internal gains refers to the heat released by people, lighting and equipment in
a building. Internal gains, when coincident with heating loads, can directly offset a
building's thermal energy demand. Therefore, it is important to understand and account
for these loads properly during the design process and evaluation of energy-use.
Occupant, equipment and lighting loads and schedules are typically assumptions
defined by standards. Assumptions can vary significantly between standards and
methodologies. The Passive House
methodology, for example, uses a highly
detailed adjustment factor to calculate
the portion of internal energy
consumption that contributes to offsetting
heating loads. Standards such as “ASHRAE
Standard 90.1-2007: Energy Standard for
Buildings except Low-Rise Residential
Buildings” (ASHRAE, 2007) and National
Energy Code of Canada for Buildings (NECB) (NRC, 2011) assume virtually all internal
energy use offsets heating loads directly. These two different approaches can make a
significant difference on the building’s thermal demand, so a project’s goals must be
clearly defined when evaluating TEDI.
Specific loads and schedules often come from accepted third parties like NECB or
ASHRAE. There are also City of Vancouver, City of Toronto and BC Step Code energy
modelling guidelines (City of Vancouver, 2017) (City of Toronto, 2017), which prescribe
the loads and schedules. These guidelines generally agree with other published data
such as the report “Energy Consumption and Conservation in Mid- and High-Rise Multi-
Unit Residential Buildings in British Columbia” (RDH, 2012).
Design Parameters/Model Inputs Output/Result
Individual Simulations
KEY ASSUMPTIONS
Internal gains are important, but are often
prescribed by specific code or standard.
Assumptions must be appropriate for the
project and to support the required outcome
(e.g. BC Energy Step Code Compliance).

C H A P T E R 4 | Whole Building Context
4.5
An example of the impact of internal gains is demonstrated when comparing the
assumptions used by Passive House and those from the City of Vancouver’s “Energy
Modelling Guidelines” (City of Vancouver, 2017) used by the “BC Energy Step Code”
(Province of BC, 2017). The same building was modelled both ways and, after controlling
for other factors, the results revealed different heating loads due to the differing
assumptions for internal gains. Passive House significantly discounts peak internal gains
(reducing their effect) to approximate variable internal gains that follow a schedule.
For an example building with low thermal demand, the annual heating load calculated
using City of Vancouver’s “Energy Modelling Guidelines” (City of Vancouver, 2017) for
internal gains and associated schedules resulted in a TEDI that was approximately 8
kWh/m2 lower than the same building using internal gains following the Passive House
methodology. Since the impact is significant, assumptions for internal heat gain have to
match the project objectives, be well understood by the energy modeller and be well
documented for the rest of the project team.
BUILDING SHAPE
A building’s vertical surface area to floor area ratio (VFAR) is a significant influential factor
on the heating energy use of a building, especially when the TEDI target is normalized for
floor area. This metric is similar to a more common metric of surface area to volume ratio.
However, for high-rise MURBs, the majority of heat loss occurs in the vertical surface areas
due to the relative high percentage surface area compared to total exposed surfaces
and due to the difficulty of effectively insulating vertical assemblies that also meet the
other design requirements as outlined in Chapter 5. As such, VFAR has a more direct
relationship with TEDI than surface area to volume ratio and has been used as the primary
shape metric for consideration.
Complex and/or narrow shapes have more vertical surface area per floor area, leading
to greater heat losses per unit floor area. Complex shapes with significant articulation
have about 40% more vertical surface area per floor area than simple shapes like a
square, while narrow shapes have about 80% more. Table 4.1 demonstrates a selection
of building shapes and their associated VFAR. Very small or narrow buildings will likely
require improved envelope systems to compensate for higher vertical surface areas. A
single family detached home typically has a VFAR between 1.2 and 1.5, while a high-rise
MURB has a VFAR in the range of 0.5 to 0.65. The floor plates in Table 4.1 are 600 m2 and
the TEDI values are for Climate Zone 6. When all other design elements are kept constant,
TEDI increases as VFAR increases.
A building’s shape can also impact the building envelope thermal transmittance
because complex architecture often increases both the complexity and quantity of
interfaces that lead to thermal bridging.

C H A P T E R 4 | Whole Building Context
4.6
Table 4.1: VFAR for Example Building Shapes and Floor Plate Sizes
Square Articulated Narrow
VFAR 0.49 0.59 0.7
TEDI (kWh/m2) 15.1 20.3 26.1
THERMAL TRANSMITTANCE OF THE OPAQUE BUILDING ENVELOPE
A building envelope with low thermal transmittances or highly effective R-values is critical
to achieving low thermal energy demand. This is achieved by well insulated assemblies
and minimizing thermal bridging. Thermal bridging is best minimized and avoided early in
the design process by evaluating the impact using default values founds in catalogues,
such as the Building Envelope Thermal Bridging (BETB) Guide or ISO 14683. Assumptions
can then be revisited and refined with project specific values as the design evolves and
the other design requirements become more tangible.
Table 4.2 and Table 4.3 shows the difference in overall wall thermal transmittance or
effective R-value between a conventional and a low TEDI building using the MURB
archetype building from the BETB Guide (Morrison Hershfield, 2016) for quantity takeoffs.
The baseline case has an effective R-6.2 for the opaque wall compared to the low TEDI
scenario of R-27.0 using details outlined in
Chapter 5. The improvement is due to the
combined improvement in the details and
more insulation. This examples illustrates
the potential for optimization on projects
with a broad range of possibilities to
mitigate thermal bridging. See Chapter 6
for more examples that highlight the
impact of using the details presented in
Chapter 5.
TIGHTLY COUPLED DESIGN PARAMETERS
Building envelope thermal transmittance and
building shape are tightly coupled, each influencing
the other. These characteristics should be
considered early in the design as they can have a
large impact on TEDI.

C H A P T E R 4 | Whole Building Context
4.7
Table 4.2: Wall Thermal Transmittance for Conventional Assemblies and Details
Detail Area or
Length
Transmittance
Value
Heat Flow
(W/K)
Percent of Total
Heat Flow (%) Steel Stud Wall 5903 m2 0.35 W/m2K 2066 36.7%
Balcony Slab at Door 226 m2 4.72 W/m2K 1068 18.9%
Parapet at Wall 55 m 0.78 W/m K 43 0.8%
Parapet at Glazing 73 m 0.98 W/m K 72 1.3%
Intermediate Floor at Wall 616 m 0.20 W/m K 123 2.2%
Intermediate Floor at Balcony 778 m 1.06 W/m K 825 14.6%
Intermediate Floor at Glazing 1536 m 0.20 W/m K 307 5.5%
Window to Wall 5559 m 0.20 W/m K 1112 19.7%
Interior Wall Separation 988 m 0.20 W/m K 20 0.4%
Overall Thermal Transmittance (W/m2 K) 0.92
Effective R-Value (hr·ft2·F/BTU) 6.2
Table 4.3: Wall Thermal Transmittance for Low TEDI Assemblies and Details
Detail Area or
Length
Transmittance
Value
Heat Flow
(W/K)
Percent of Total
Heat Flow (%) Wall with FRP Brackets 6129 m2 0.142 W/m2K 870 67.4%
Delta U for Aluminum Brackets 6129 m2 0.041 W/m2K 251 19.5%
Wall to Roof 128 m 0.171 W/m K 22 1.7%
Intermediate Floor 2930 m 0.003 W/m K 10 0.8%
Window to Wall 5559 m 0.024 W/m K 133 10.3%
Interior Wall Separation 988 m 0.003 W/m K 3 0.3%
Overall Thermal Transmittance (W/m2 K) 0.21
Effective R-Value (hr·ft2·F/BTU) 27.0
GLAZING
Window to wall ratio is the percent of the total above grade wall surface area that is
made up of windows. Glazing generally has higher thermal transmittance (U-value) than
walls, but glazing also admits solar radiation that can offset heating loads. Accordingly,
wall and glazing performance should generally not be compared directly in terms of U-
value but rather assessed independently in the context of whole building energy use.
The interface quantity and arrangement of glazing can significantly influence the impact
of thermal bridging at the window to wall interface. Typically, a balance of both window
area and window shape should be considered when trying to achieve low TEDI. Figure
4.4 illustrates four generic orientations and glazing layouts that lead to different outcomes
for thermal transmittance due to the quantity of the window to wall interface.
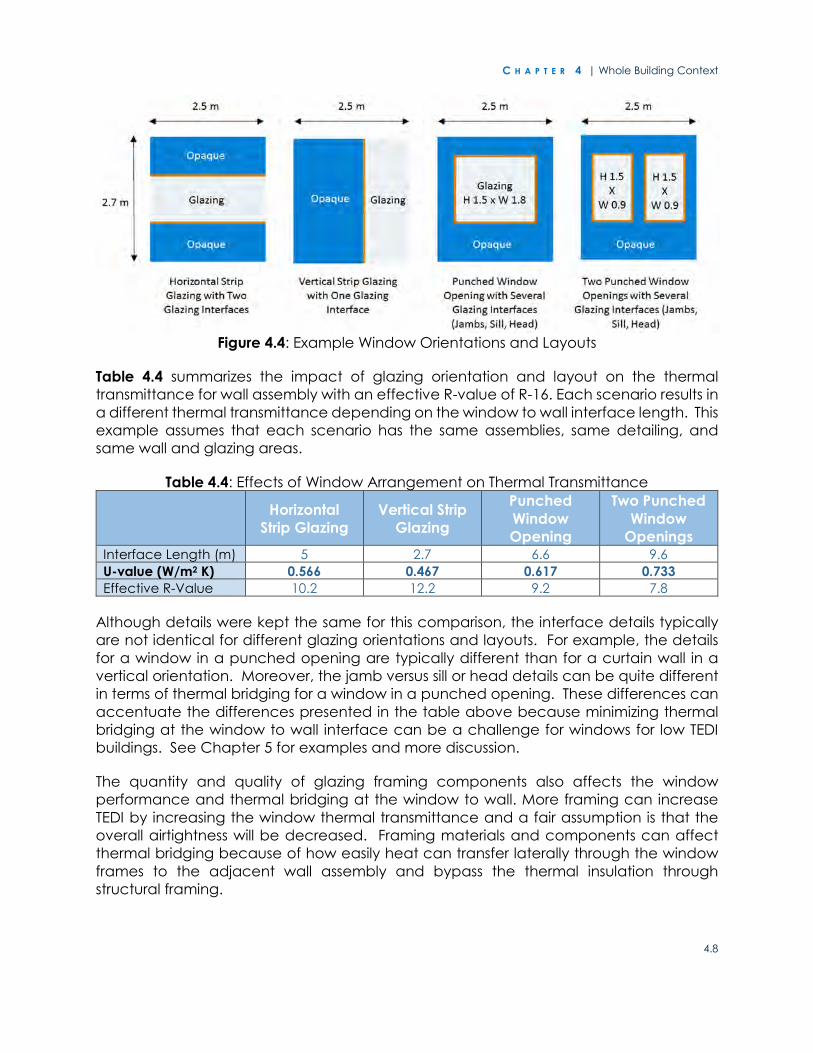
C H A P T E R 4 | Whole Building Context
4.8
Figure 4.4: Example Window Orientations and Layouts
Table 4.4 summarizes the impact of glazing orientation and layout on the thermal
transmittance for wall assembly with an effective R-value of R-16. Each scenario results in
a different thermal transmittance depending on the window to wall interface length. This
example assumes that each scenario has the same assemblies, same detailing, and
same wall and glazing areas.
Table 4.4: Effects of Window Arrangement on Thermal Transmittance
Horizontal
Strip Glazing
Vertical Strip
Glazing
Punched
Window
Opening
Two Punched
Window
Openings Interface Length (m) 5 2.7 6.6 9.6
U-value (W/m2 K) 0.566 0.467 0.617 0.733
Effective R-Value 10.2 12.2 9.2 7.8
Although details were kept the same for this comparison, the interface details typically
are not identical for different glazing orientations and layouts. For example, the details
for a window in a punched opening are typically different than for a curtain wall in a
vertical orientation. Moreover, the jamb versus sill or head details can be quite different
in terms of thermal bridging for a window in a punched opening. These differences can
accentuate the differences presented in the table above because minimizing thermal
bridging at the window to wall interface can be a challenge for windows for low TEDI
buildings. See Chapter 5 for examples and more discussion.
The quantity and quality of glazing framing components also affects the window
performance and thermal bridging at the window to wall. More framing can increase
TEDI by increasing the window thermal transmittance and a fair assumption is that the
overall airtightness will be decreased. Framing materials and components can affect
thermal bridging because of how easily heat can transfer laterally through the window
frames to the adjacent wall assembly and bypass the thermal insulation through
structural framing.

C H A P T E R 4 | Whole Building Context
4.9
WINDOW HEAT BALANCE
The balance between solar heat gain coefficient (SHGC) and thermal transmittance (U-
value) for a window is a critical design consideration. The concept of the heat balance
of windows can help in understanding this balance. Each window installed in a building
will increase TEDI, relative to U-value, but decrease TEDI relative to the SHGC. When the
gain is greater than the loss the window has a positive heat balance, otherwise it is a net
loss to the building and considered to have a negative heat balance. Shading is also a
factor in the heat balance of a window, because an ineffective shading strategy can
block too much solar gain, which can lead to a net-negative window.
Table 4.5 and Table 4.6 show how the window SHGC and U-value for different orientations
will have positive or negative contribution to TEDI depending on the solar gains. The
example is for a high-rise MURB with wall thermal transmittance of 0.35 W/m2K
(approximately R-16 effective R-value), R-30 roofs and 50% window to wall ratio.
Table 4.5: Net Contribution of Windows on TEDI for High-Rise MURB for Climate Zone 4
Orientation Net Contribution of Windows on TEDI
(kWh/m2) U-0.15 and SHGC 0.25 U-0.45 and SHGC 0.4
South 0.2 -1.7
East -0.3 -3.6
North -0.4 -3.9
West -0.3 -2.9
Overall -0.8 -12.1
Table 4.6: Net Contribution of Windows on TEDI for High-Rise MURB for Climate Zone 6
Orientation Net Contribution of Windows on TEDI
(kWh/m2) U-0.15 and SHGC 0.25 U-0.45 and SHGC 0.4
South 0.1 -3.3
East -1.1 -6.1
North -1.4 -7.0
West -1.0 -5.8
Overall -3.4 -22.3
Other design requirements, such as daylighting and views, typically constrain the
placement and amount of windows per orientation. As a result, similar window areas
and arrangements are typically provided on each façade orientation for high-rise
construction. With TEDI becoming a more important design criteria, however, there are
opportunities to optimize window placement, U-value and SHGC for low TEDI buildings,
while balancing overall impacts on EUI.

C H A P T E R 4 | Whole Building Context
4.10
COOLING LOADS AND OVERHEATING
Various measures for reducing TEDI may reduce building heating energy consumption,
but can negatively affect cooling loads. In buildings without cooling, overheating is also
a concern. This means there are both overall energy use (EUI) and thermal comfort issues
(overheating) that must be considered when designing to low TEDI targets. Various
passive cooling measures are typically required to manage overheating, with the most
critical being shading and windows of appropriate size and number for natural
ventilation. Other measures to counter increased cooling load or overheating, while
preserving low TEDI include:
• Careful balance between SHGC and window U-values
• Bypassing heat recovery cores in the summer to provide outdoor air without
tempering
• Air or water economizers to reduce cooling energy consumption, after cooling
loads are reduced by the measures outlined above
• Night-time pre-cooling can limit cooling loads for the next day
A recent study for the City of Vancouver titled “Passive Cooling Measures for Multi-Unit
Residential Buildings” (Morrison Hershfield, 2017) showed that bypassing heat recovery in
the summer, proper design of shading reduced and openings for natural ventilation were
effective in reducing overheating. Table 4.7 and Figure 4.5 use data from the report
mentioned above to demonstrate some likely overheating solutions and their impact on
potential overheated hours.
Table 4.7: Summary of Solutions to Overheating and Related Impacts
Cumulative Scenario (Each
Includes the Previous)
Potential Overheated
Hours
Reduction in Overheated
Hours
None 1940 -
Natural Ventilation 315 1625
Balcony Shading 200 115
Reduced SHGC 110 90
Movable Exterior Screens 40 70
HRV Bypass 10 30

C H A P T E R 4 | Whole Building Context
4.11
Figure 4.5: Cumulative Effects of Measures to Reduce Overheating
AIR INFILTRATION
Air infiltration significantly affects TEDI and is proportionally related to climate. Accurately
accounting for infiltration can thus be a challenge that warrants concentrated effort to
reflect “as built” reality. Several methodologies are available, including the ASHRAE
Handbook – Fundamentals (ASHRAE, 2017). Reducing air infiltration in practice requires
careful consideration to air-barrier requirements as outlined in Chapter 5 and testing to
verify the level of airtightness. High levels of airtightness can significantly reduce TEDI as
shown in Figure 4.6. The figure shows the impact on TEDI of Code (2.0 L/s/m2 @ 75 Pa),
Airtight (0.8 L/s/m2 @ 75 Pa) and Passive House (0.08 L/s/m2 @ 75 Pa) infiltration rates.
0
200
400
600
800
1000
1200
1400
1600
1800
2000
None Natural
Ventilation
Balcony
Shading
Reduced
SHGC
Movable
Exterior
Screens
HRV Bypass
Po
ten
tia
l O
ve
rhe
ate
d H
ou
rs
Figure 4.6: Impact of Air Infiltration on TEDI
0
5
10
15
20
25
30
35
40
45
50
4 5 6 7a
TED
I (k
Wh
/m2)
Climate Zone
Passive House
Airtight
Code

C H A P T E R 4 | Whole Building Context
4.12
VENTILATION
Ventilation and heat recovery play a strong role in a low TEDI building, but the relative
impact is reduced with increasing effectiveness of heat recovery. Figure 4.7 illustrates the
impact of heat recovery effectiveness on the ventilation component of TEDI for different
climates. All other building parameters are the same for this comparison. The impact of
heat recovery effectiveness is reduced for warmer climates, but remains a critical
consideration to meet low TEDI for targets of 15 kWh/m2 regardless of climate.
Additionally, once a premium efficiency HRV (85% or greater) is used, the ventilation load
is small regardless of the climate.
The benefits of premium HRVs are clear from a TEDI perspective, but technologies that
allow HRVs to achieve higher efficiencies are also bigger units. A 70% efficient unit can
be approximately 57 cm x 55 cm x 26 cm (22 in x 21 in x 10 in) in comparison to a premium
90% efficient unit that can be
approximately 70 cm x 84 cm x
57 cm (28 in x 34 in x 23 in). This
larger size can have
implications on where an HRV
can be placed in a suite.
KEYS TO A LOW THERMAL DEMAND MURB
High efficiency heat recovery ventilators, high R-value walls,
triple-glazing and decreased air infiltration are key
characteristics of low thermal demand MURBs.
0
2
4
6
8
10
12
14
16
18
20
60 70 80 90
Ve
ntila
tio
n C
on
trib
utio
n t
o T
ED
I
(kW
h/m
2/y
ea
r)
Heat Recovery Effectiveness (%)
Climate Zone 7a
Climate Zone 6
Climate Zone 5
Climate Zone 4
Figure 4.7: Impact of HRV Effectiveness on Ventilation Component of TEDI

C H A P T E R 4 | Whole Building Context
4.13
Paths to Low Energy Buildings
There are many possible combinations using the strategies presented in this chapter to
achieve a low TEDI. Figure 4.8 demonstrates over 275 possible options that meet a TEDI
target of 15 kWh/m2 for Climate Zone 6. The particular path that a project takes depends
on a variety of factors, such as the building envelope systems, climate and site restrictions.
The output metric is TEDI (kWh/m2/year) and the design criteria (inputs) examined here
include:
• Climate Zone: NBC Zones 4, 5, 6 and 7a
• Shape: Baseline (VFAR 0.5), complex (VFAR 0.7) and narrow (VFAR 0.9)
• Wall Thermal Transmittance: presented as effective R-values from R-10 to R-20 (hr
ft² °F/BTU) for the opaque elements and including all thermal bridging
• Window Thermal Transmittance: U-values from 0.15 to 0.35 (BTU/ hr ft² °F),
representing premium triple-glazed to good double-glazed windows
• Window Solar Heat Gain Coefficient: SHGC from 0.2 to 0.4
• Heat Recovery Effectiveness: 70, 80 or 90% effectiveness, representing good to
premium HRVs
• Infiltration: Code (2 L/s/m2 @ 75 Pa), Airtight (0.8 L/s/m2 @ 75 Pa) and Passive House
(0.6 ACH @ 50 Pa or approximately 0.08 L/s/m2 @ 75 Pa)
Figure 4.8: Various Paths to Low Energy Buildings in Climate Zone 6
Figures 4.9 to 4.12 illustrate designs that will lead to low energy buildings for four major
NEBC Climate Zones for cities such as Victoria, BC (Zone 4), Kamloops, BC (Zone 5),
Ottawa, Ontario (Zone 6) and Edmonton, Alberta (Zone 7a). The design options are not
exhaustive, but illustrate the likely measures needed to achieve a TEDI below 15 kWh/m2.
All options include window to wall ratio of 40% and loads are simulated in accordance
with the City of Vancouver’s “Energy Modelling Guidelines” (City of Vancouver, 2017).

C H A P T E R 4 | Whole Building Context
4.14
CLIMATE ZONE 4 DESIGN MEASURES
Climate Zone 4 is the easiest climate in Canada to achieve a low TEDI. Various paths
are possible, including options that would not require a significant deviation from
current practice for wall assemblies and glazing when high performance HRVs are
provided. The examples shown in Figure 4.9, which meet a TEDI target of 15 kWh/m2,
include:
Orange
Line
Double-glazed windows (0.35 U-value) are feasible when the following is
provided:
• Window SHGC of 0.4
• A highly insulated wall with mitigated thermal bridging (R-20)
• High efficiency HRV (80%)
• Improved airtightness (0.8 L/s/m2 @ 75 Pa)
Green
Line
Wall assemblies with moderate levels of insulation and mitigated thermal
bridging (R-15) are feasible when the following is provided:
• Triple-glazed windows (0.25 U-value and 0.3 SHGC)
• High efficiency HRV (80%)
• Improved airtightness (0.8 L/s/m2 @ 75 Pa)
Blue
Line
Wall assemblies that are not a stretch from current practice (R-10) are
feasible when the following is provided:
• Premium triple-glazed windows (0.15 U-value)
• Medium efficiency HRV (70%)
• Improved airtightness (0.8 L/s/m2 @ 75 Pa)
Figure 4.9: Example Paths to Low Energy Buildings in Climate Zone 4

C H A P T E R 4 | Whole Building Context
4.15
CLIMATE ZONE 5 DESIGN MEASURES
There are fewer potential solutions for achieving a TEDI of 15 kWh/m2 in Climate Zone 5
but it is still achievable. Most options available in this zone require a building shape with
a VFAR less than 0.5. Complex or narrow shapes have limited options. Very few options
are available without mid-to-higher performance HRVs. The examples shown in Figure
4.10, which meet a TEDI target of 15 kWh/m2, include:
Orange
Line
High quality double-glazed windows (0.3 U-value) are feasible when the
following is provided:
• Window SHGC of 0.3
• A highly insulated wall with mitigated thermal bridging (R-20)
• Premium efficiency HRV (90%)
• Passive House level of airtightness (0.08 L/s/m2 @ 75 Pa)
Green
Line
Wall assemblies with moderate levels of insulation and mitigated thermal
bridging (R-15) are feasible when the following is provided:
• Triple-glazed windows (0.25 U-value and 0.3 SHGC)
• Premium efficiency HRV (90%)
• Improved airtightness (0.8 L/s/m2 @ 75 Pa)
Blue
Line
Wall assemblies that are not a stretch from current practice (R-10) are
feasible when the following is provided:
• Premium triple-glazed windows (0.15 U-value)
• Premium efficiency HRV (90%)
• Improved airtightness (0.8 L/s/m2 @ 75 Pa)
Figure 4.10: Example Paths to Low Energy Buildings in Climate Zone 5

C H A P T E R 4 | Whole Building Context
4.16
CLIMATE ZONE 6 DESIGN MEASURES
The options for achieving a TEDI of 15 kWh/m2 in Zone 6 are constrained, but a low TEDI is
still achievable. Very few paths include complex or narrow building shapes. The
examples shown in Figure 4.11, which meet a TEDI target of 15 kWh/m2, include:
Orange
Line
Standard triple-glazed windows (0.25 U-value) are feasible when the
following is provided:
• Window SHGC of 0.35
• A highly insulated wall with mitigated thermal bridging (R-20)
• Premium efficiency HRV (90%)
• Passive House level of airtightness (0.08 L/s/m2 @ 75 Pa)
Green
Line
Wall assemblies with moderate levels of insulation and mitigated thermal
bridging (R-15) are feasible when the following is provided:
• High quality triple-glazed windows (0.2 U-value and 0.3 SHGC)
• Premium efficiency HRV (90%)
• Passive House level of airtightness (0.08 L/s/m2 @ 75 Pa)
Blue
Line
Wall assemblies that are not a stretch from current practice (R-10) are
feasible when the following is provided:
• Premium triple-glazed windows (0.15 U-value and 0.35 SHGC)
• Premium efficiency HRV (90%)
• Passive House level of airtightness (0.08 L/s/m2 @ 75 Pa)
Figure 4.11: Example Paths to Low Energy Buildings in Climate Zone 6

C H A P T E R 4 | Whole Building Context
4.17
CLIMATE ZONE 7A DESIGN MEASURES
There are significant challenges in achieving a low TEDI for Climate Zone 7a. A design
needs to incorporate all of the high performance elements mentioned in this section, in
addition to premium efficiency heat recovery and Passive House levels of airtightness.
Premium quality triple-glazed windows with moderate SHGC are required. Wall R-values
greater than the R-20 shown here are possible (up to R-40 was examined) and may
reduce the pressure on other design elements, such as SHGC, but the other previously
mentioned requirements remain. The examples shown in Figure 4.12, which meet low
energy building requirements include:
Orange
Line
High quality triple-glazed windows (0.2 U-value) are feasible when the
following is provided:
• Window SHGC of 0.35
• A highly insulated wall with mitigated thermal bridging (R-20)
• Premium efficiency HRV (90%)
• Passive House level of airtightness (0.08 L/s/m2 @ 75 Pa)
Green
Line
Wall assemblies with moderate levels of insulation and mitigated thermal
bridging (R-15) are feasible when the following is provided:
• Premium triple-glazed windows (0.15 U-value and 0.3 SHGC)
• Premium efficiency HRV (90%)
• Passive House level of airtightness (0.08 L/s/m2 @ 75 Pa)
Blue
Line
Wall assemblies that are not a stretch from current practice (R-10) are
feasible when the following is provided:
• Premium triple-glazed windows (0.15 U-value and 0.35 SHGC)
• Premium efficiency HRV (90%)
• Passive House level of airtightness (0.08 L/s/m2 @ 75 Pa)
Figure 4.12: Example Paths to Low Energy Buildings in Climate Zone 7a

C H A P T E R 4 | Whole Building Context
4.18
Table 4.8 below summarizes the example paths to low energy buildings described above.
Visit BuildingPathfinder.com to explore more options for meeting low TEDI using the same
archetype buildings and methodology presented in this chapter.
Table 4.8: Summary of Example Paths to Low Energy Buildings
NBC
Climate
Zone
Shape Wall R-Value
(hr·ft2·°F)/BTU
Window U-
Value
BTU/(hr·ft2·°F)
Window
SHGC
Heat Rec
Efficiency
%
Infiltration
Rate
TEDI
kWh/m2
4 Typical 20 0.35 0.4 80 Airtight 14
4 Typical 15 0.25 0.3 80 Airtight 11
4 Typical 10 0.15 0.2 70 Airtight 12
5 Typical 20 0.3 0.35 90 PH 12
5 Typical 15 0.25 0.3 90 Airtight 15
5 Typical 10 0.15 0.25 90 Airtight 13
6 Typical 20 0.25 0.35 90 PH 14
6 Typical 15 0.2 0.3 90 PH 13
6 Typical 10 0.15 0.3 90 PH 14
7a Typical 20 0.2 0.35 90 PH 15
7a Typical 15 0.15 0.3 90 PH 13
7a Typical 10 0.15 0.35 90 PH 15
CORRIDOR PRESSURIZATION
The above paths assume ventilation rates are strictly code-compliant. However, it is
common industry practice to provide additional ventilation through corridor
pressurization. The degree of additional air provided and whether there is heat recovery
on this air will significantly affect the additional thermal energy demand added to the
building. A high-rise MURB in Vancouver with 20 cfm/suite of additional ventilation could
see approximately 9 kWh/m2 of additional TEDI. This makes reaching a target of 15
kWh/m2 significantly more difficult so the design team will need to carefully consider the
implications of utilizing corridor pressurization.
COST
The recent “BC Energy Step Code Metrics Research Report” (Integral Group et al, 2017)
studied the cost premium of achieving various levels of the new BC Step Code. This code
has absolute targets for EUI and TEDI for which the highest step is equivalent to a net-zero
ready building. The report found that the low thermal demand targets could be met in
most cases with a cost premium of no more than 4%.
Software Tools
Various components affecting building energy consumption have been discussed in
previous sections, such as internal gains, domestic hot water (DHW) and envelope-
related characteristics. Ventilation was addressed in Chapter 3, but heating and cooling

C H A P T E R 4 | Whole Building Context
4.19
systems also require careful consideration when overall energy use reduction is a goal.
Complex heating systems are not required for high-rise MURBs, but they are becoming
more common as design teams strive to meet current energy standards. These systems,
such as central plants, heat pumps and variable refrigerant systems, require more
advanced understanding of engineering principles and usually more advanced
software tools (EnergyPlus, IES, etc.) as well.
The degree of complexity of the tool used will depend on the degree of complexity of
the building in question. These tools must at a minimum, have the capability to assess the
impact and interactions between equipment loads, occupancy, lighting, schedules,
outdoor temperatures, envelope, equipment part-load performance and ventilation
rates, and must do so within short time-steps, preferably hourly or more frequently. One
example to consider is dynamic shading (e.g. operable shading or dynamic glass) that
has the ability to allow or block solar gains based on solar exposure and/or user input.
The amount of solar radiation
entering the building would be
highly dependent on the
position of the shading device,
which can change several
times throughout the day.
Only an hourly simulation
could capture this constantly
changing variable and its
impact on the heat balance
within a building.
Passive House is referenced several times in this report due to its key low thermal energy
demand requirement. Passive House certification requires using the PHPP spreadsheet
based tool to assess the thermal energy and overall energy criteria specified by Passive
House. PHPP and Passive House methodologies were studied as part of this report and
the basic first-principles applied are common to other energy analysis tools such as
envelope losses, accounting for solar gains, and accounting for occupant and
equipment loads. However, PHPP uses various adjustment factors and correlations to
estimate variances in schedules, daily temperature swings, occupant behavior and other
factors. These assumptions may hold true for certain applications for which the tool was
originally designed, but it is difficult to assess how well they would hold for larger, more
complex buildings, where these adjustments and correlations start to deviate from
“typical” to project specific assumptions.
DYNAMIC SIMULATIONS AND COMPLEX MECHANICAL
SYSTEMS
Understand the tools available and the types of mechanical,
ventilation and other systems that they can simulate. When
more complex HVAC systems are being considered and/or
when design intent varies from a given tool’s “default”
assumptions or capabilities, it will likely be necessary to use a
fully dynamic, hourly simulation software.
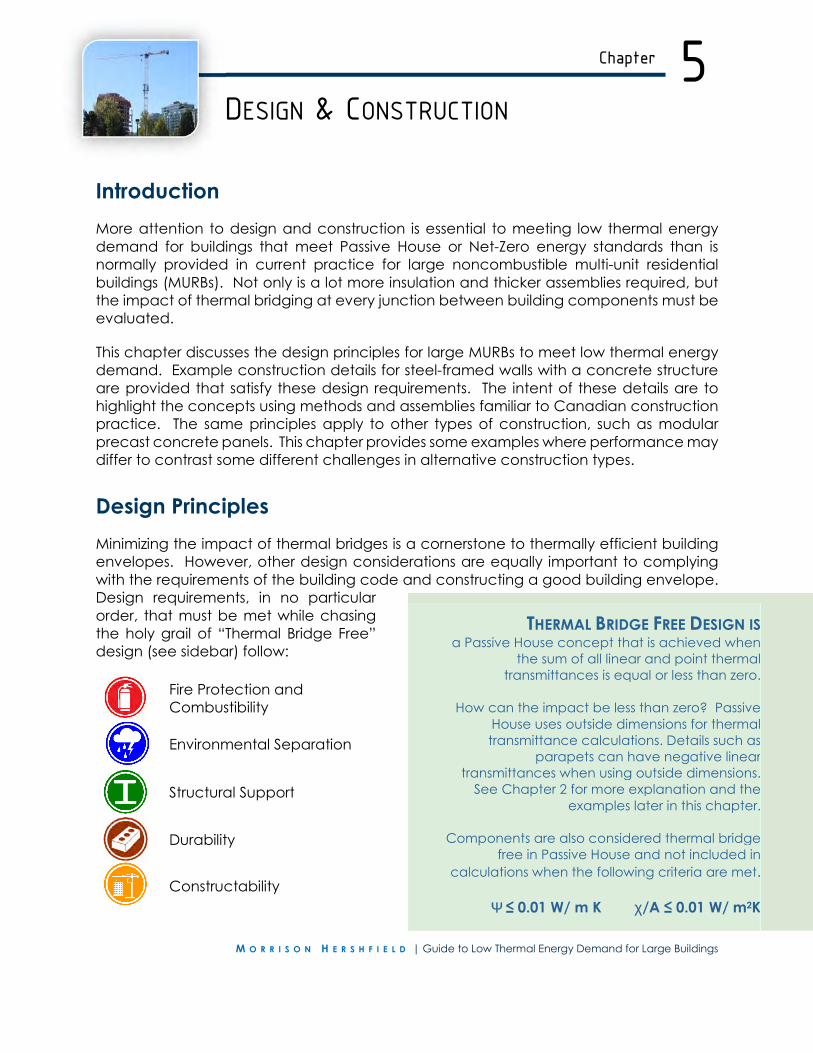
M O R R I S O N H E R S H F I E L D | Guide to Low Thermal Energy Demand for Large Buildings
Chapter
DESIGN & CONSTRUCTION
5
Introduction
More attention to design and construction is essential to meeting low thermal energy
demand for buildings that meet Passive House or Net-Zero energy standards than is
normally provided in current practice for large noncombustible multi-unit residential
buildings (MURBs). Not only is a lot more insulation and thicker assemblies required, but
the impact of thermal bridging at every junction between building components must be
evaluated.
This chapter discusses the design principles for large MURBs to meet low thermal energy
demand. Example construction details for steel-framed walls with a concrete structure
are provided that satisfy these design requirements. The intent of these details are to
highlight the concepts using methods and assemblies familiar to Canadian construction
practice. The same principles apply to other types of construction, such as modular
precast concrete panels. This chapter provides some examples where performance may
differ to contrast some different challenges in alternative construction types.
Design Principles
Minimizing the impact of thermal bridges is a cornerstone to thermally efficient building
envelopes. However, other design considerations are equally important to complying
with the requirements of the building code and constructing a good building envelope.
Design requirements, in no particular
order, that must be met while chasing
the holy grail of “Thermal Bridge Free”
design (see sidebar) follow:
Fire Protection and
Combustibility
Environmental Separation
Structural Support
Durability
Constructability
THERMAL BRIDGE FREE DESIGN ISa Passive House concept that is achieved when
the sum of all linear and point thermal
transmittances is equal or less than zero.
How can the impact be less than zero? Passive
House uses outside dimensions for thermal
transmittance calculations. Details such as
parapets can have negative linear
transmittances when using outside dimensions.
See Chapter 2 for more explanation and the
examples later in this chapter.
Components are also considered thermal bridge
free in Passive House and not included in
calculations when the following criteria are met.
Ψ ≤ 0.01 W/ m K χ/A ≤ 0.01 W/ m2K

C H A P T E R 5 | Design and Construction
5.2
Requirements for high-rise residential
buildings make goals for “Thermal Bridge
Free” design not practical for many
common types of construction and
architectural designs. Nevertheless, low
thermal energy demand can be achieved
for large MURBs following familiar
construction practices, with proven track
records in meeting the challenges of
Canadian climates, and have all the
relevant testing completed to Canadian
standards. Importing technology and
systems from Europe is not necessary to
meeting low thermal energy demand,
irrespective of potentially easier paths to
certification.
The following sections outline how design selections, such as the type of insulation,
cladding, glazing, as well as window detailing and insulation placement correspond to
code requirements in the Canadian context for Part 3 noncombustible buildings. A
consistent example assembly is used to illustrate the concepts presented in this section
as illustrated by Figure 5.1.
Figure 5.1: Example Window in a Punched Opening of a Steel-Framed Wall Assembly
with Concrete Structure
FIRE PROTECTION AND COMBUSTIBILITY
Fire protection and combustibility requirements for high-rise residential buildings is a
significant differentiator from being able to rely on past design examples for guidance
and left wondering where to start when challenged with delivering a building that will
have low thermal energy demand. The challenge is that many components relied upon
Many in industry are wondering how we will be
building in the future when low thermal energy
demand is a requirement. Feasible solutions
derived from Canadian practice and current
building code requirements are a focus of this
guide.

C H A P T E R 5 | Design and Construction
5.3
to reduce thermal bridging and/or minimize wall thickness have combustible
components. Examples of components are window frames, foam insulation, cladding
attachments and thermal breaks.
NON-METALIC STRUCTURAL SUPPORTS, ATTACHMENTS AND THERMAL BREAKS
Many new systems and products have been developed that incorporate low thermal
conductive combustible materials, such as plastic or fiberglass, to reduce thermal
bridging. While plastic, fiberglass and other combustible materials can be manufactured
with low flame spread and with limited risk of ignition, these combustible materials will
ignite in the right
conditions, can provide
fuel for a fire, and raise
questions about the
potential loss of
structural integrity
during a fire.
This section gives an
overview of the Building
Code requirements for
non-metallic supports,
attachments and
thermal breaks that are
used in a structural
capacity for non-
combustible
construction.
References to the
National Building Code
(NBC) are provided in
the discussion1 with
applicability to broad range of products and components.
To help with connecting products to the concepts presented in this section, common
non-metallic components are grouped together based on common characteristics,
such as structural function and connection, potential contribution to fire growth and
spread, and position within the assembly.
1 Requirements of other Canadian jurisdictions might slightly differ, but the concepts generally apply regardless of the jurisdiction.
CAN NON-METALLIC COMPONENTS BE USED IN A
NONCOMBUSTIBLE BUILDING?
The short and simple answer is ….YES, by any of the following
pathways. More information is provided in this section for the
obstructed paths.
Cle
ar
Path
s 1
The non-metallic component has passed either
a. CAN/ULC-S114 (noncombustibility test )
b. ULC-S135 (limited combustibility test)
2
The assembly has passed CAN/ULC-134 “Fire Test of
Exterior Wall Assemblies” and the building is
sprinklered, if over three storeys in height.
Ob
str
ucte
d
Path
s
3
The non-metallic components are deemed similar
to the “minor combustible components” listed in
NBC 3.1.5.2.(1) and the local Authorities Having
Jurisdiction (AHJ) agrees
4 An alternative solution is provided for the project
and is accepted by the local AHJ.

C H A P T E R 5 | Design and Construction
5.4
Types of Combustible Components for Supports, Attachments and
Thermal Breaks
Type 1 - Shims: A combustible material functions as a shim, often 5
mm to 20mm (2/5 inches to 3/4 inches) in depth, where metal
fasteners connect a metal structural component through to
another component. The shims can be buried in the insulation at
the sheathing, anywhere in the insulation to connect together two
components of the support system, or between the cladding and
cladding support system.
Type 2 - Thermal Spacers: The combustible material is larger than
shims, is the full depth of the insulation, and functions as a rigid
spacer for the connection of long metal fasteners through the
insulation back to the structure. The outer rail or sub-girt is
completely outboard of the thermal spacer for the metal fasteners
to function as the primary structural attachment. This type of
system also often requires plastic shims at the sheathing to plumb
the cladding.
Type 3 - Glazing Type Thermal Breaks: Aluminum support brackets
have plastic thermal breaks similar to thermally broken windows.
The outer metal rail or sub-girt can partially penetrate the insulation
or be entirely in the cavity behind the cladding, which may also
have a plastic shim between the metal bracket and outer metal
rail or sub-girt.
Type 4 - Combustible Brackets or Girts: The combustible material
functions as the primary structural support to attach the cladding
to the structure. Combustible brackets are either completely
buried in the insulation or only exposed at the outer most surface
depending on the type of the exterior outer metal rail or sub-girt.
The exterior metal rail or sub-girt can partially penetrate the
insulation or be entirely in the cavity behind the cladding.
Combustible girts have the exterior flange exposed to the cladding
cavity.
Red – combustible component
Black – metal component
Brown – Insulation
Blue - Substrate

C H A P T E R 5 | Design and Construction
5.5
Pathway three is an obstructed path because NBC Article 3.1.5.2 allows interpretations
to what is deemed “similar minor components” compared to a list of specific permitted
combustible components.
There are a wide variety of interpretations of what is deemed “similar”, but there are two
commonalities from the listed of permitted components that lead to two criteria for
judging what is deemed “similar minor components”:
Criterion 1: The combustible component is limited in quantity of combustible material.
Criterion 2: Life safety is not compromised if the combustible component fails in a fire.
Criterion one is based on the intent statement explaining that certain combustible
materials are permitted since “they are deemed to insignificantly contribute to fire
growth and spread”. The non-metallic components outlined in this section have a limited
amount of combustible material and clearly meet Criterion one.
Criterion two is not explicitly stated in the code and is an interpretation based on the
function of the listed minor combustible components. Criterion two is not satisfied for
some non-metallic components and cannot be automatically considered “similar” minor
combustible components. The likelihood that alternative compliance paths will be
required increases as follows.
Minor
Combustible
Component
Not a Minor
Combustible
Component
Type 1 – Shims clearly complies with both criteria and is a minor
combustible component.
Type 2 – Thermal Spacers meets Criterion one. An argument can be
that Criterion two is met because the cladding may sag in a fire but will
be held in place by the fasteners. However, there is a possibility that
an Authority Having Jurisdiction (AHJ) will not accept this argument
without testing.
Type 3 – Glazing Type Thermal Breaks meets Criterion one. Criterion
two is not satisfied if the cladding weight is supported by this
component. The same technology and risk exists for aluminum
windows, where the glass and exterior frame will fall out if the thermal
break was compromised by fire. There is a moderate probability that
an AHJ will not consider this type of component to be a minor
combustible component.
Type 4 – Combustible Brackets or Girts: meets Criterion one, but not
Criterion two. There is a high probability that an AHJ will not consider
this type of component to be a minor combustible component.
PATHWAY

C H A P T E R 5 | Design and Construction
5.6
Criterion two for Type 3 and 4 non-metallic components can be met if the fixed points in
a cladding attachment system are metallic and support the full weight of the cladding
and the non-metallic components resist wind loads and accommodate movement as
shown in Figure 5.2 below.
An Alternative Solution (also called a variance in some jurisdictions) is a potential path if
all other paths are not feasible. Alternative Solutions are permitted under the NBC if it
can be demonstrated that the same level of performance as NBC Division B is provided.
An Alternative Solution is typically site and building specific. Path four is an obstructed
path because there is no guarantee that the AHJ will accept this solution.
There are measures to reduce the risk of fire growth and spread, at and in the exterior
wall assembly, to support an Alternative Solution. This is a potential option when all other
pathways are not viable; for instance the assembly has NOT been tested to CAN/ULC-
S134, the combustible components will not pass ULC-S114 or ULC-S135, and the AHJ will
not consider the supports as minor combustible components.
The following combination of mitigating features may form the basis of an Alternative
Solution to the criteria outlined in NBC Article
3.1.5.6:
• Interior layer of gypsum board reduces
the risk of high heat exposure to
cladding supports from an interior fire.
• Noncombustible exterior cladding
reduces the risk of an exterior fire (i.e.
barbeque, car, arson) propagating on
the exterior surface and directly
exposing combustible supports.
• Exterior mineral wool insulation
surrounding all supports reduces the risk
of direct flame exposure and radiant
heat flux to the supports.
• Include noncombustible attachment
back to the structure so that failure of
the combustible element may lead to
sagging, but the cladding will stay in-
place during a fire.
PATHWAY
Figure 5.2: Cladding System with
Metallic and Combustible Support
Brackets

C H A P T E R 5 | Design and Construction
5.7
The Alternative Solution will outline how the wall assembly would be expected to pass the
ULC-S134 exterior wall fire test if it was tested including the non-metallic cladding
supports. The local AHJ may require submission of detailed cladding support
documentation, structural failure analysis, and/or further quantitative analysis to show
how insignificant the contribution of the supports to fire growth and spread.
COMBUSTIBLE WINDOW FRAMES
Combustible window sashes and frames, including vinyl and fiberglass, are permitted on
noncombustible buildings provided the requirements of NBC Clause 3.1.5.4.(5) are met
as outlined in Figure 5.3.
Figure 5.3: Combustible Window Frames in Noncombustible Construction
Design freedom is restricted by limitations on the size and spacing of combustible window
frames and often leads to Alterative Solutions on projects. Some industry stakeholders
are also proposing changes to the requirements for combustible window frames based
on testing and analysis of both thermally broken aluminum and combustible window
frames.
FOAM INSULATION
Overall wall thickness can be a challenge when designing low thermal energy buildings
when viewed from conventional perspectives of constructability, cost and useable floor
space if constrained. Foam insulation with lower conductivity per unit thickness (high

C H A P T E R 5 | Design and Construction
5.8
R/inch) can help reduce the overall wall thickness and is well-suited to incorporate into
panelized systems as outlined in the construability section.
Foamed plastic insulation needs to be protected by a thermal barrier as outlined in NBC
Article 3.1.5.15 for noncombustible construction. Thermal barrier requirements vary
depending on flame–spread rating, if the building is sprinklered and building height.
Additional consideration in detailing might be required compared to conventional wall
assemblies to protect thick layers of combustible insulation from adjacent spaces. For
example, minimizing thermal bridging at window interfaces might expose foam insulation
in a precast sandwich panel and require an additional thermal barrier at the window
perimeter as shown in Figure 5.4.
Figure 5.4: Thermal Barrier over Foam Plastic Insulation at Window Jamb in Precast
Sandwich Wall Panel
The features leading to the need for additional protection in this detail are the insulation
thickness, window positioning, over-insulating the window frame and maximizing the
insulation at the window perimeter. Strategies to minimize thermal bridging at glazing
interfaces is discussed in the example construction details later in this chapter.

C H A P T E R 5 | Design and Construction
5.9
Requirements for environmental
separation for low thermal
energy demand high-rise
residential buildings are the
same as for conventional
practice with regard to the
control of condensation,
precipitation, vapour diffusion
and sound transmission. The
challenges are meeting the
requirements for low thermal
transmission and high levels of
airtightness.
Control layers and environmental separation requirements that must be met are outlined
in the adjacent figure and Table 5.1 below.
Table 5.1: Control Layers and Environmental Separation Requirements
Rainwater
Management
• Deflect rainwater at exterior surface
• Capillary gap behind cladding to restrict moisture transfer across
the wall
• Drained cavity to drain moisture at the backside of the cladding
Moisture or
Weather
Resistive Barrier
• Membrane to resist water penetration
• Secondary drainage plane
Air Barrier
• Continuous barrier
• Low air permeance materials
• Resist full wind pressure and transfer to the structure
• Allowance for movement from cyclic thermal and moisture loads,
interstory drift and structural deflection
• Building envelope airtightness testing
Vapour Control • Sufficiently low permeance
• Positioned within the assembly to avoid moisture accumulation
Resistance to
Heat Transfer
• Control the risk of condensation
• Low thermal transmittance
• Minimize thermal bridging
• Occupant comfort
ENVIRONMENTAL SEPARATION

C H A P T E R 5 | Design and Construction
5.10
Design teams require a holistic viewpoint and higher level of collaboration among
disciplines to meet the challenge of low thermal energy demand. From a structural
perspective these prerequisites present some challenges and may require a deviation
from conventional practice. Some designs that are easy and efficient from a structural
perspective are not feasible when thermal bridging is fully factored into decisions and
low thermal energy demand is a requirement.
For example, interior insulated cast-in-place concrete walls that are preferred for
residential high-rise construction in some markets, are not feasible for buildings required
to meet a low thermal energy demand. Wall systems that maintain the continuity of the
thermal insulation across the building structure are the only option. Examples include
exterior insulated walls, precast concrete panels, or any wall system that is hung outboard
of the structure with continuous insulation, such as insulated metal panels. These wall
systems are not complicated from a structural design perspective but are not as easy as
painting a concrete wall or column and adding some insulation inboard the wall
structure.
Figure 5.5: Examples Maintain the Continuity of the Thermal Insulation across the
Building Structure
Challenges from a structural perspective for designing low thermal energy demand
buildings are:
1. How to effectively introduce thermal breaks or insulation into joints and transfer
loads to the structure where conventional practice depends on intimate contact.
STRUCTURAL SUPPORT

C H A P T E R 5 | Design and Construction
5.11
2. Providing redundant supports for cladding systems with combustible components
to address fire protection and combustibility concerns, while optimizing overall
wall thickness and thermal performance.
3. Positioning windows and doors within the exterior insulation, outboard the back-
up wall, to minimize thermal bridging
4. Accommodating more complicated point connections than compared to
conventional practice for components that bypass the insulation, such as for
balconies or overhangs.
DURABILITY
Assemblies and components must be designed with Canada’s climate and construction
practice in consideration for their expected service life. Material deterioration occurs
when components are exposed to UV, wind, extreme temperature changes and
moisture. Any forgiveness associated with higher energy flows does not exist for buildings
with low thermal energy demand and more consideration is needed to assess the
durability of components. In the past, there was enough energy transferred through the
building envelope to compensate for some deficiencies or inadequate material choices
to keep susceptible materials sufficiently warm and dry. For example, the corrosion
resistance of components in a rain-screen cavity should be specified for a wet
environment with extreme temperature fluctuations.
Standards such as CAN/CSA S478 – Guideline on Durability in Buildings and ISO 13823
provide recommendations to assist designers by providing a framework to determine
durability targets and criteria for specifying durability requirements. The standards also
provide advice on environmental and design factors that affect the durability of building
components and materials. The goal of durable building design is to meet the intended
design service life of the building. Components that are covered and cannot be easily
maintained or accessed must last the life of the assembly.
Durability extends beyond design and selection of materials. Durability is also a function
of construction, maintenance and operation of a building. Quality control and assurance
activities should include design reviews, shop drawing reviews, mock-ups, field reviews,
testing and verification.
A steel stud assembly with all the insulation outboard the exterior sheathing is more
durable because the structure is kept warm and dry. They are straightforward to design
because one membrane can provide the air, vapour, and moisture control, and
manages water effectively via a drained cavity outboard of the insulation. The examples
in this chapter present scenarios with and without batt insulation in the stud cavity.
Nevertheless, even with the batt insulation in the stud cavity the ratio of outboard to
inboard thermal resistance is such that the structure will be relatively warm or above
freezing for exterior temperatures down to -40oC, except at the location of the metal
brackets through the exterior insulation.

C H A P T E R 5 | Design and Construction
5.12
Constructability is critical to realizing low thermal energy demand from a quality control
and cost perspective in the context of high-rise residential development.
This guide provides examples of site-built details and assemblies that are common in
current practice when high performance assemblies are required. These assemblies can
be built using components that are readily available, have relevant Canadian testing,
and supported by many trades, suppliers and manufacturers able to deliver these
systems. Non-exclusive examples which will be discussed further in this section include
site built exterior insulated wall assemblies, pre-fabricated paneled walls and precast
sandwich panels.
SITE BUILT EXTERIOR INSULATED WALL ASSEMBLIES
The advantages of a site built exterior insulated wall assembly include:
1. Familiar construction practices in the Canadian market
2. A broad spectrum of façades are possible due to the extensive selection of
available panels and cladding
3. Field review and testing can occur as the critical layers are constructed in a
manner that enables
easier resolution of
construction issues
4. Quality control of the
critical barriers is
straightforward and
performance targets
can confidentially be
met, particularity when
continuity matters for
hard targets such as
airtightness
The main disadvantage
compared to other assemblies
ubiquitous for high-rise
residential construction, such as
window-wall, is that a higher
level of construction
sequencing and exterior
access is required during
construction. The costs are
Figure 5.6: Detailing of Window with a Wood Box
CONSTRUCTABILITY

C H A P T E R 5 | Design and Construction
5.13
more than compared to window-wall for high-rise construction, but the biggest cost
differential is related to cladding choice, which is often driven by architecture.
There are challenges compared to conventional practice at some details when the
objective is to fully minimize thermal bridging. For example, detailing the air and moisture
barrier can be seen as more difficult at windows when a wood liner is used to position the
window in the plane of the exterior insulation as shown in Figure 5.6. Wrapping a self-
adhesive membrane around a wood liner can be a challenge, but there are alternative
liquid applied membranes that will allow for easier application around wood liners. Some
contractors could turn this challenge into an opportunity by pre-fabricating a wood box
that is installed into the rough opening with the window and/or membranes pre-installed
into the wood box.
PRE-FABRICATED PANELIZED WALLS
Some industry stakeholders are interested in developing or importing pre-fabricated
panelized wall systems for Passive House or Net-Zero buildings.
Some of this interest appears to be
derived from the perception that
panelized systems are needed to
meet high levels of airtightness based
on European experience and
practice. The opposite has shown to
be true in the Canadian context for
some panelized or unitized systems
because of the quantity and
complexity of joints that do not
sufficiently accommodate
construction tolerances and
movement.
Nevertheless, panelized or unitized
systems can result in better quality
control of components, such as
reduced cracking of concrete, and
can speed up construction schedules
when adequately designed and
tested. Systems that speed up
construction are ones that limit
exterior access work to a bosun chair, such as applying sealants, and have durable
finishes that can withstand the harsh conditions of construction. Panelized systems that
require cranes can be disruptive to some construction practices where a crane is heavily
used to form the concrete structure. Implications are additional cranes or other
approaches to concrete forming will be required.
Figure 5.7: Example Precast Sandwich Panel
with Enhanced Detailing

C H A P T E R 5 | Design and Construction
5.14
An example of a system that is well positioned in the Canadian market to meet the
requirements of low thermal energy demand with the benefits of an accelerated
construction schedule is a precast sandwich panel as illustrated in Figure 5.7. Enhanced
detailing at intermediate floors, window interfaces, and the connectors is necessary to
meet the higher design requirements, but can be realistically achieved. Moreover, there
are local suppliers geared up to deliver these systems that have the engineering and
testing to support panels with thick insulation layers and minimal thermal bridging.
Example Low Thermal Transmittance Details
Low thermal transmittance assemblies or highly effective R-values are achieved by high
levels of insulation and minimizing thermal bridging. The assemblies and details presented
in this chapter follow the design principles presented earlier in the chapter.
The clear wall assembly included in all the details is a 2x6 steel stud wall assembly with
250 mm (10 inches) of semi-rigid mineral wool insulation (R-42) outboard of the exterior
sheathing. The cladding is a composite metal panel system that is attached back to the
steel studs with a bracket and rail sub-framing system. The brackets are combination of
aluminum and fibre reinforced plastic (FRP) spaced at 910 mm (36 inches) o.c. vertically
and 400 mm (16 inches) o.c. horizontally. The aluminum brackets are fixed points located
between floors that are designed to support the cladding dead load. The control layers
are identified in the graphics below.
Two scenarios were evaluated, with and without R-19 fiberglass batt insulation in the stud
cavity. The results for the clear field wall assembly are presented in Table 5.2.

C H A P T E R 5 | Design and Construction
5.15
Table 5.2: Clear Field Wall Assembly Thermal Transmittance
Scenario
Exterior
Insulation
Nominal
R-value
hr.ft2.oF/Btu
(m2K/W)
Assembly
R-value
hr.ft2.oF/Btu
(m2K/W)
Assembly
U-value
Btu/ hr.ft2.oF
(W/m2K)
Air in stud cavity 42.0 (7.40) 40.0 (7.04) 0.025 (0.142)
R-19 (3.35 RSI) insulation in
stud cavity 42.0 (7.40) 48.3 (8.51) 0.021(0.118)
The clear field assembly does not include the impact of the aluminum bracket. The
incremental additional heat loss for the aluminum brackets are provided as point
transmittances (χ) since the spacing of the fixed brackets varies depending on the floor
to floor height.
Table 5.3: Aluminum Bracket Point Transmittance Between Intermediate Floors
Scenario
Point
Transmittance per
Bracket χ
Btu/hr.ft.oF (W/K)
Thermal Bridge
Free? (χ/A < 0.01 W/m2K)
Air in stud cavity 0.013 (0.026) Yes, for tributary areas
> 28 ft2 (2.6 m2)
R-19 (3.35 RSI)
insulation in stud cavity 0.024 (0.045)
Yes, for tributary areas > 48 ft2 (4.5 m2)
The example details include:
• Wall to roof interface (Detail 1)
• Intermediate floor (Detail 2)
• At-grade to below-grade parking garage interface (Detail 3)
• Window to wall interface (Detail 4)
• Door with intermittently attached balcony interface (Detail 5)
The thermal transmittance values presented in this chapter are based on BETB Guide
methodology and linear transmittances are calculated based on interior and exterior
dimensions.

C H A P T E R 5 | Design and Construction
5.16
DETAIL 1: WALL TO ROOF INTERFACE
The roof assembly is a protected membrane or
inverted roof on a concrete deck with 200 mm (8
inches) or R-40 rigid foam insulation. The wall
assembly is outlined at the beginning of this section.
The concrete parapet has a structural thermal break
that allows 127 mm (5 inches) of rigid insulation to
carry through to the wall insulation. Railing loads are
transferred to the structure through the concrete
parapet and thermal break modules with stainless
steel reinforcing spaced at 1220 mm (4 feet) o.c. The
aluminum bracket is located above the insulation so
that the impact of the bracket is minimized.
Table 5.4: Wall to Roof Interface Linear Transmittance
Scenario
Ѱparapet
Btu/hr.ft.oF (W/mK) Thermal Bridge
Free?
(Ѱ< 0.01 W/mK) Inside
Dimensions
Outside
Dimensions
Uninsulated stud
cavity
Sloped deck 0.099 (0.171) 0.030 (0.051) No
With concrete
topping 0.108 (0.187) 0.039 (0.067) No
R-19 (3.35 RSI)
insulation in stud
cavity
Sloped deck 0.099 (0.171) 0.035 (0.061) No
With concrete
topping 0.108 (0.186) 0.044 (0.076) No

C H A P T E R 5 | Design and Construction
5.17
DETAIL 2: INTERMEDIATE FLOOR
The intermediate floor interface includes exterior insulation installed over a concrete floor
slab edge with self-adhered membrane applied to the insulation for through wall flashing
in lieu of metal flashing. The insulation at the slab edge should be rigid to adhere to and
support the membrane. Movement is accommodated at the intermediate floor with
double nested steel tracks, sliding point brackets and cladding, and the rails end at this
location.
Table 5.5: Intermediate Floor Linear Transmittance
Scenario Ѱfloor
Btu/hr.ft.oF (W/mK)
Thermal Bridge Free?
(Ѱ< 0.01 W/mK)
Uninsulated stud cavity 0.002 (0.003) Yes
R-19 (3.35 RSI) insulation in
stud cavity 0.008 (0.015) Close
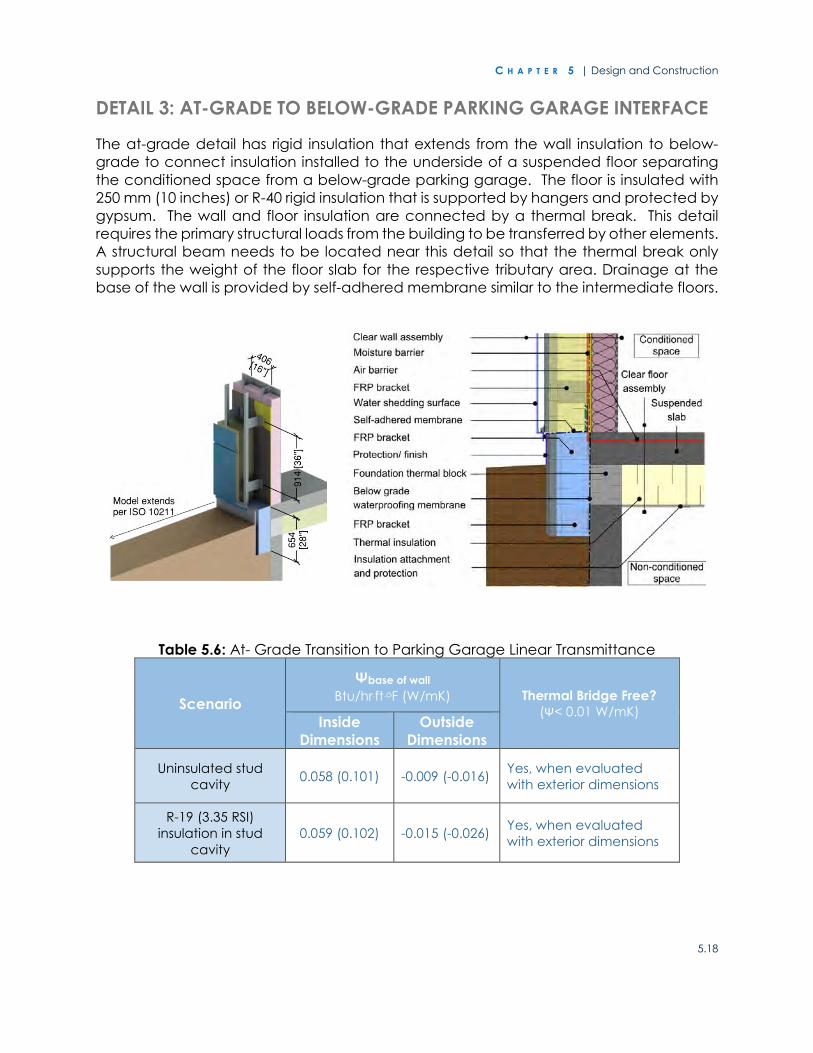
C H A P T E R 5 | Design and Construction
5.18
DETAIL 3: AT-GRADE TO BELOW-GRADE PARKING GARAGE INTERFACE
The at-grade detail has rigid insulation that extends from the wall insulation to below-
grade to connect insulation installed to the underside of a suspended floor separating
the conditioned space from a below-grade parking garage. The floor is insulated with
250 mm (10 inches) or R-40 rigid insulation that is supported by hangers and protected by
gypsum. The wall and floor insulation are connected by a thermal break. This detail
requires the primary structural loads from the building to be transferred by other elements.
A structural beam needs to be located near this detail so that the thermal break only
supports the weight of the floor slab for the respective tributary area. Drainage at the
base of the wall is provided by self-adhered membrane similar to the intermediate floors.
Table 5.6: At- Grade Transition to Parking Garage Linear Transmittance
Scenario
Ѱbase of wall
Btu/hr.ft.oF (W/mK) Thermal Bridge Free?
(Ѱ< 0.01 W/mK) Inside
Dimensions
Outside
Dimensions
Uninsulated stud
cavity 0.058 (0.101) -0.009 (-0.016)
Yes, when evaluated
with exterior dimensions
R-19 (3.35 RSI)
insulation in stud
cavity
0.059 (0.102) -0.015 (-0.026) Yes, when evaluated
with exterior dimensions

C H A P T E R 5 | Design and Construction
5.19
DETAIL 4: WINDOW TO WALL INTERFACE
The window to wall interface is the most challenging detail to minimize thermal bridging
and has the biggest impact for noncombustible residential buildings. Even small
improvements can have a big impact when the quantity of this interface is factored into
the overall thermal transmittance. PHI guidelines include guidance and principles to
minimizing the impact of thermal bridging at window to wall interfaces. However, these
principles deviate from current practice for noncombustible buildings and some design
optimization is required to satisfy all the requirements, while mitigating thermal bridging.
Guidelines to minimizing thermal bridging at the window to wall interface follows.
Minimize the
window
perimeter
and frame
length by
maximizing
the size of
glass per
opening
Use glazing
systems that
have large
thermal
breaks and
insulation in
the glazing
framed
cavities

C H A P T E R 5 | Design and Construction
5.20
Place the
window as
close to the
centre of
insulation
layer as
feasible
Over insulate
the frames
and
minimize
metal
flashing and
closures
Additional support may be
required at windows and
doors to position over the
exterior insulation for
structural or fire protection
purposes as shown in Figure
5.8. In this configuration, the
wood at the sill may take the
weight of the window but the
structural loads are
transferred to the steel studs
at the jamb and the straps at
the jamb and head that hold
the window in place.
The window to wall interface presented in this chapter features a tilt and turn operable
Passive House certified vinyl window with triple-glazing. The windows are positioned in
the middle of the exterior insulation to minimize heat loss through thermal bridging as a
base case scenario. The impact of window positioning is illustrated in Figure 5.9.
Figure 5.8: Support Angle below Window and Wood
Liner

C H A P T E R 5 | Design and Construction
5.21
Window aligned with
insulation, without support
angle, air in stud cavity
Window aligned with edge
of insulation, without support
angle, air in stud cavity
Window aligned with
steel framing, air in stud
cavity
Ѱinstall: 0.062 W/mK
(0.036 Btu/hr.ft.oF)
Ѱinstall: 0.116 W/mK
(0.067 Btu/hr.ft.oF)
Ѱinstall: 0.164 W/mK
(0.095 Btu/hr.ft.oF)
Figure 5.9: Impact of Window Positioning on Linear Transmittance
The following figures shows how the design requirements presented at the beginning of
this chapter can be met and how to minimize thermal bridging as much as possible for
the interface of glazing with a conductive cladding such as composite metal panels. For
example, the window head is over insulated because drainage is not restricted, but the
sill details have sloped metal flashing. Four scenarios were evaluated including with and
without batt insulation in the stud cavity and with and without R-4 aerogel blanket around
the window opening. Results are shown in Table 5.7 and Table 5.8.
Head

C H A P T E R 5 | Design and Construction
5.22
Jamb
Sill
Table 5.7: Window to Wall Linear Transmittance with Uninsulated Stud Cavity
Scenario Ѱ Sill1
Btu/hr.ft.oF
(W/mK)
Ѱ Jamb Btu/hr.ft.oF
(W/mK)
Ѱ Head Btu/hr.ft.oF
(W/mK)
Ѱ Total2 Btu/hr.ft.oF
(W/mK)
Thermal
Bridge
Free? (Ѱ<
0.01 W/mK) Sill
Angle
R-4
Blanket
Yes
No 0.048 (0.083) 0.050 (0.087) 0.020 (0.034) 0.014 (0.024) No
Yes 0.044 (0.075) 0.031 (0.053) 0.014 (0.024) 0.009 (0.016) Close
No No 0.036 (0.062) 0.050 (0.087) 0.020 (0.034) 0.011 (0.019) No
Yes 0.030 (0.052) 0.031 (0.053) 0.014 (0.024) 0.006 (0.010) Yes
Table 5.8: Window to Wall Linear Transmittance with R-19 in Stud Cavity
Scenario Ѱ Sill
Btu/hr.ft.oF
(W/mK)
Ѱ Jamb Btu/hr.ft.oF
(W/mK)
Ѱ Head Btu/hr.ft.oF
(W/mK)
Ѱ Total Btu/hr.ft.oF
(W/mK)
Thermal
Bridge
Free? (Ѱ<
0.01 W/mK) Sill
Angle
R-4
Blanket
Yes No 0.057 (0.099) 0.063 (0.109) 0.027 (0.047) 0.026 (0.046) No
Yes 0.049 (0.084) 0.039 (0.067) 0.021 (0.036) 0.020 (0.035) No
No No 0.047 (0.081) 0.063 (0.109) 0.027 (0.047) 0.024 (0.041) No
Yes 0.040 (0.069) 0.039 (0.067) 0.021 (0.036) 0.018 (0.030) No
1 Transmittances do not include the impact of the aluminum brackets. The separate head, sill, and jamb
transmittances were derived using the intermediate approach outlined in Chapter 2. 2 Total linear transmittances are derived using the detailed approach outlined in Chapter 2.
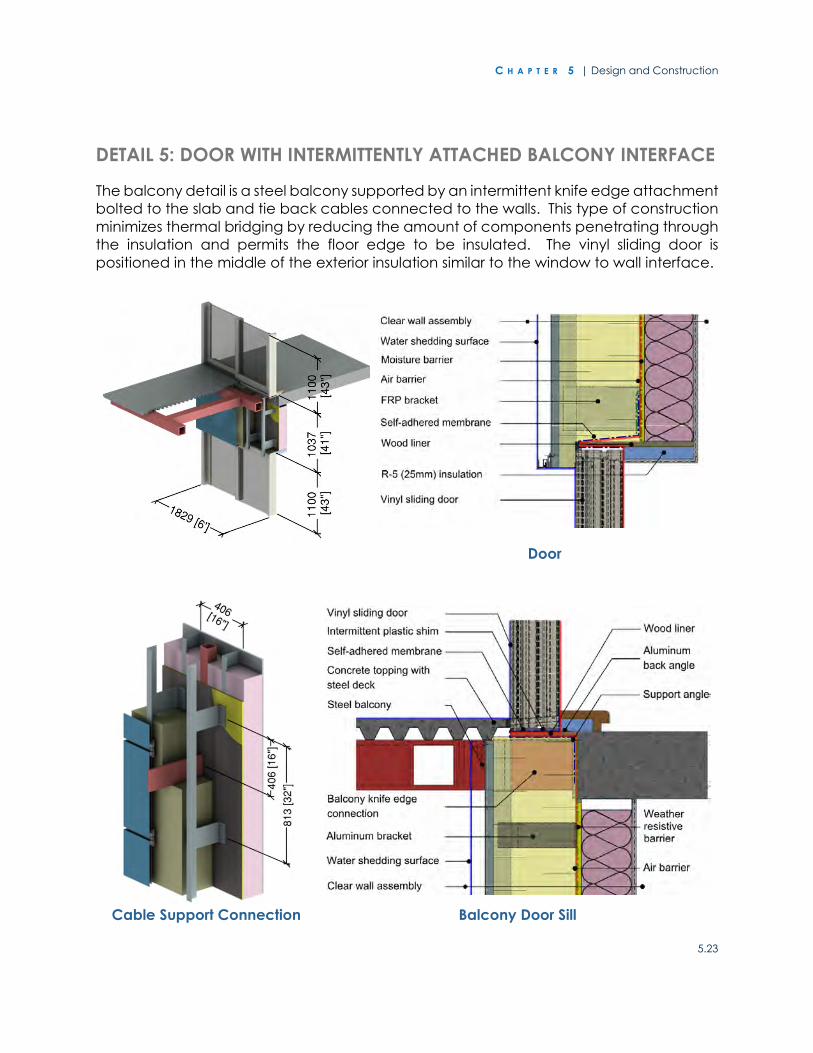
C H A P T E R 5 | Design and Construction
5.23
DETAIL 5: DOOR WITH INTERMITTENTLY ATTACHED BALCONY INTERFACE
The balcony detail is a steel balcony supported by an intermittent knife edge attachment
bolted to the slab and tie back cables connected to the walls. This type of construction
minimizes thermal bridging by reducing the amount of components penetrating through
the insulation and permits the floor edge to be insulated. The vinyl sliding door is
positioned in the middle of the exterior insulation similar to the window to wall interface.
Door
Cable Support Connection Balcony Door Sill

C H A P T E R 5 | Design and Construction
5.24
Table 5.9: Door with Intermittently Attached Balcony Thermal Transmittances
Scenario
Door Interface Beam Connection to Floor
Ѱdoor sill1
Btu/hr.ft.oF
(W/mK)
Ѱdoor head Btu/hr.ft.oF
(W/mK)
Thermal
Bridge Free?
(Ѱ< 0.01
W/mK)
χknife
edge
Btu/hr.oF
(W/K)
Thermal Bridge
Free? (χ/A< 0.01
W/m2K)
Uninsulated
Stud Cavity 0.024 (0.042) 0.044 (0.076) No
0.048
(0.271) No
R-19 (3.35 RSI)
Insulation in
stud cavity
0.035 (0.061) 0.041 (0.071) No 0.046
(0.261) No
Table 5.10: Cable Connection to Wall Thermal Transmittances
Scenario Ѱcolumn1
Btu/hr.ft.oF
(W/mK)
Thermal Bridge
Free? (Ѱ< 0.01
W/mK)
χknife edge
Btu/hr.oF
(W/K)
Thermal Bridge Free?
(χ/A < 0.01 W/m2K)
Uninsulated Stud
Cavity 0.000 (0.000) Yes 0.026 (0.147) No
R-19 (3.35 RSI)
Insulation in stud
cavity
0.001 (0.001) Yes 0.012 (0.071) No
1 Linear transmittance values do not include the effect of the knife edge connection

M O R R I S O N H E R S H F I E L D | Guide to Low Thermal Energy Demand for Large Buildings
Chapter
FUTURE HORIZONS 6
The Guide to Low Thermal Energy Demand Intensity (TEDI) for Large Buildings, or
abbreviated to The Low TEDI Guide, is an initial attempt to provide insight into how high-
rise residential buildings can meet low TEDI targets in Canada. There is no doubt that
more examples will help practitioners efficiently and effectively optimize designs to meet
low TEDI targets. For example, more analysis can be done to show how thermal bridging
can be minimized for other construction types and details, such as for pre-cast concrete
sandwich panels, as well as how the same principles can be applied to other non-
combustible building type. Nevertheless, the concepts outlined in The Low TEDI Guide
apply broadly and provide a starting point for a playbook on the integrated design of
low TEDI buildings. The common understanding of what is needed and expected is likely
the most challenging hurdle that a design team will face when presented with the
opportunity to deliver a low TEDI Multi-unit Residential Buildings (MURB).
This final chapter summarizes the highlights of the Low TEDI Guide so that practitioners
can start to implement these principles in practice, and provides examples of the impact
of utilizing the concepts presented in Chapter 5.
Thermal Transmittances
An awareness of how thermal transmittance is determined by various approaches is
helpful when using and comparing results from various sources. The key guidance from
Chapter 2 are:
1. The window to wall interface demands the greatest attention for thermal
transmittance calculations because of the potential variation in values and
impact on the overall thermal transmittance.
2. Two-dimensional simplifications are sufficient for moderately conductive
structures with simple heat flow paths, such as concrete structures with single
insulation layers.
3. Three-dimensional analysis is recommended for thermal analysis of assemblies
with highly conductive and complex heat flow paths, such as intermittent
cladding attachments, metal framing intersections with multidirectional
conductive heat flow paths, and for evaluating the risk of condensation at
interface details.
4. Assumptions for air spaces and boundary conditions do not have a significant
impact on opaque thermal transmittances. Thermal values from various sources
with slight variations in assumptions are generally comparable for low TEDI
buildings, except at the window to wall interface.
5. The biggest impact to realizing low thermal transmittance is the quality of the
details and design teams aggressively minimizing thermal bridging.

C H A P T E R 6 | Future Horizons
6.2
Meeting low TEDI targets is difficult to achieve without higher thermal quality details as
outlined in Chapter 5 and the examples at the end of this chapter. Using a detail that is
categorized as “efficient” by the BETB Guide based on conventional practice will make
meeting low TEDI targets difficult. Accordingly, adjusted performance categories are
needed for low TEDI buildings to reflect higher expectations for linear transmittances.
Figure 6.1 outlines the necessary refinements to the BETB performance categories to
reflect the expectations of low TEDI buildings.
Figure 6.1: Refined Performance Categories for Low TEDI Expectations
Heat Recovery Ventilators (HRV) Protocols
Chapter 3 outlines how HRVs are critical to achieving low TEDI buildings and how focusing
too much on protocol differences is not productive to realizing low TEDI buildings.
There is often no choice as to which standard to use, due to available data or project
requirements, and a capable energy modeller is able to accurately model the energy-
related impact using data derived from any of the protocols summarized by this Guide.
However, an energy modeller needs to fully understand the objectives and context of
the various standards.
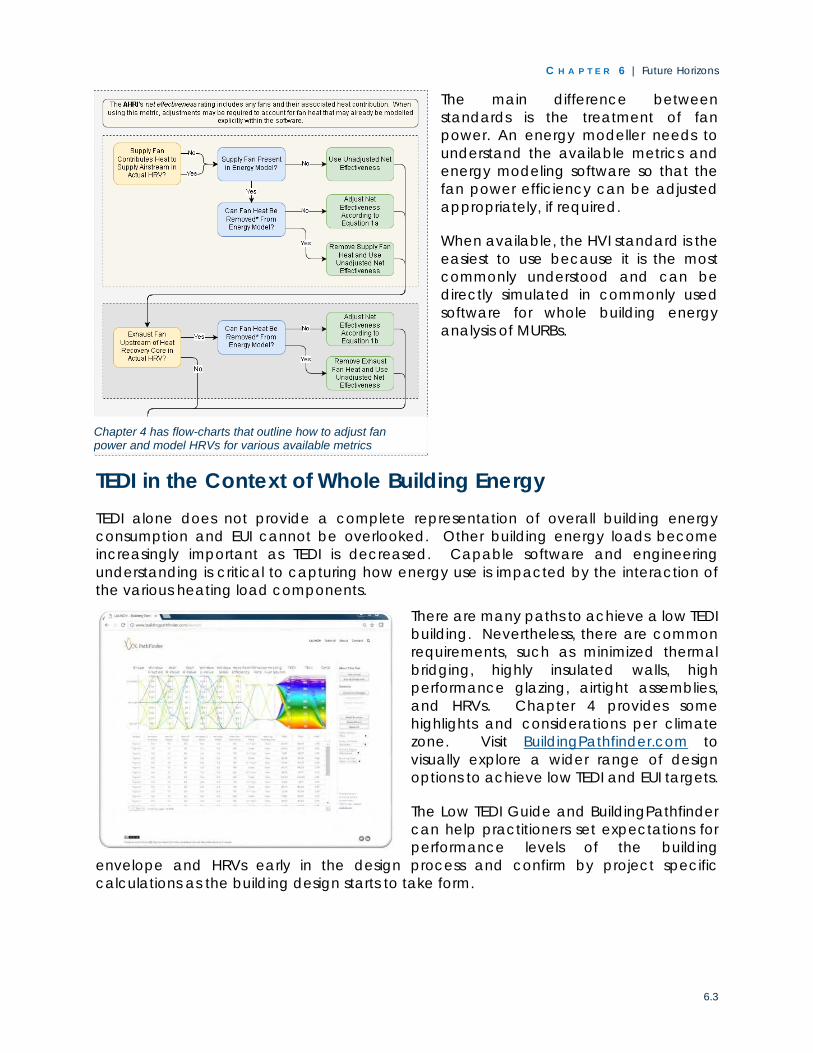
C H A P T E R 6 | Future Horizons
6.3
The main difference between
standards is the treatment of fan
power. An energy modeller needs to
understand the available metrics and
energy modeling software so that the
fan power efficiency can be adjusted
appropriately, if required.
When available, the HVI standard is the
easiest to use because it is the most
commonly understood and can be
directly simulated in commonly used
software for whole building energy
analysis of MURBs.
TEDI in the Context of Whole Building Energy
TEDI alone does not provide a complete representation of overall building energy
consumption and EUI cannot be overlooked. Other building energy loads become
increasingly important as TEDI is decreased. Capable software and engineering
understanding is critical to capturing how energy use is impacted by the interaction of
the various heating load components.
There are many paths to achieve a low TEDI
building. Nevertheless, there are common
requirements, such as minimized thermal
bridging, highly insulated walls, high
performance glazing, airtight assemblies,
and HRVs. Chapter 4 provides some
highlights and considerations per climate
zone. Visit BuildingPathfinder.com to
visually explore a wider range of design
options to achieve low TEDI and EUI targets.
The Low TEDI Guide and BuildingPathfinder
can help practitioners set expectations for
performance levels of the building
envelope and HRVs early in the design process and confirm by project specific
calculations as the building design starts to take form.
Chapter 4 has flow-charts that outline how to adjust fan power and model HRVs for various available metrics

C H A P T E R 6 | Future Horizons
6.4
Design and Construction
Chapter 5 discusses the design principles for large MURBs to meet Low TEDI Buildings.
Requirements for Fire Protection and Combustibility, Environmental Separation, Structural
Support, Durability, and Constructability are outlined using example details that minimize
thermal bridging using methods and assemblies familiar to Canadian construction
practice. Thermal transmittance values are provided with and without batt insulation in
the stud cavity.
A fundamental question that will be asked during the early days of designing low TEDI
MURBs will be how thick the walls need to be to meet the new targets. This will be more
challenging to answer than in the past as the ultimate wall thickness is dependent on not
only insulation effectiveness for the clear field assembly but also on
the quantity and quality of interfaces between building components.
The following examples highlight how this question can be answered,
putting low TEDI transmittances into perspective, and highlight
utilization of the values presented in Chapter 5.
The MURB presented in the examples has the following baseline
characteristics:
Based on the BETB Guide High-rise MURB architype
40 storey building with identical layouts and footprint on each
floor
Concrete structure with steel-framed infill per Chapter 5 assembly
and details
30% glazing with 1.8 m x 1.5 m (6’x5’) windows (windows varied in
example 3)
EXAMPLE 1 – EXPECTATIONS FOR INTERFACE DETAILS
Essentially the expectations for linear transmittances should be an order of magnitude
higher for low TEDI buildings than conventional practice if minimizing wall thickness is a
consideration. For example, Figure 6.2 shows how a target of 0.28 W/m2K (R-20 effective)
for the opaque wall can be met for various combinations of transmittances and the
impact on wall thickness. Only the window to wall (glazing) interface and clear field
transmittances were varied for this example. All the other transmittances are constant
using values from Chapter 5. This example does not include the impact of balconies,
which is outlined in the following example.
The 0.28 W/m2K target can only be met for the “Efficient Glazing Interface” scenario with
a 492 mm (19.5 inch) thick wall and R-19 cavity insulation within the 6 inch steel studs. The
window to wall interface linear transmittance for the “Efficient Glazing Interface”
scenario is 0.1 W/m K. In comparison, this target can be met with a 16.5mm (14.5 inch)
thick wall with R-19 cavity insulation or a 16.5 inch (416 mm) thick wall for a fully exterior
insulated wall using any of the scenarios for Detail 4 in Chapter 5 (0.024 W/m K for the
uninsulated stud cavity and 0.046 W/m K for the R-19 scenarios).

C H A P T E R 6 | Future Horizons
6.5
Figure 6.2: Impact of Window to Wall (Glazing) Interface Transmittance on Wall
Thickness for a Target of 0.28 W/m2K (R-20 effective)1
For this example there is no rational wall thickness (i.e. greater than 1 m) that meets the
0.28 W/m2K target for a window to wall interface linear transmittance of 0.2 W/m K, which
is the upper end of the “Efficient” Category in the BETB Guide Version 1.1 (2016) based
on conventional practice. Recognition of this reality is part of the reason why the
transmittance expectations for interface details needs to be refined for low TEDI buildings
as outlined at the beginning of this chapter.
EXAMPLE 2 – IMPACT OF BALCONIES
Components such as balconies add thermal bridging that must be compensated for by
thicker walls for fixed thermal transmittance targets. Accounting for thermal bridging
related to intermittently attached balconies2 is slightly more complicated than required
for conventional cantilevered concrete balconies. The beam connection to
intermediate floor and cable support are accounted for separately in the overall thermal
transmittance calculation. Also, point transmittances are accounted for on a number of
components basis, which takes more consideration for quantity take-offs than required
for a linear value.
1 The target is met when the thermal transmittance is below the red bar shown on the chart 2 Values presented in Detail 5 in Chapter 5

C H A P T E R 6 | Future Horizons
6.6
A comparison between an intermittently attached and a cantilevered concrete balcony
is presented in Figure 6.3 and Table 6.1. This example not only highlights the impact of
balconies on the overall thermal transmittance but also shows how the transmittances
values for Detail 5 can be incorporated into overall thermal transmittance calculations.
For the cantilevered concrete balcony scenario, the concrete slab bypasses the thermal
insulation and the interface length is the width of the balcony. The beam and cable
penetrations for the intermittently attached balcony are outlined in Figure 6.3.
Figure 6.3: Balcony Layout and Quantities for a Floor for Example Thermal Transmittance
Calculation (25% of floor shown)
Table 6.1: Comparison of the Impact of Intermittently Attached to Cantilevered Concrete Balconies for Low TEDI Glazing Interfaces and R-19 Cavity Insulation Scenarios
Scenario Detail Quantity Transmittance
Value
Heat
Flow
(W/K)
%
Total
Heat
Flow
Overall
Transmittance
Intermittently
Attached
Balcony
Clear Field 7087 m2 0.142 W/m2K 1004 56%
0.254 W/m2K
(R-22 Effective)
Beam
Connection 812 0.271W/K 220 12%
Cable
Connection 580 0.147 W/K 85 5%
Other
Interfaces - - 488 27%
Cantilevered
Concrete
Balcony
Clear Field 7087 m2 0.142 W/m2K 1004 36%
0.390 W/m2K
(R-15 Effective) Balcony 1414 m 0.9 W/m K 1273 46%
Other
Interfaces - - 488 18%

C H A P T E R 6 | Future Horizons
6.7
The 0.28 W/m2K target can only be met with intermittently attached balconies using the
low TEDI details with a 492 mm (19.5 inch) thick wall and R-19 cavity insulation as seen in
Figure 6.4. The exterior insulation will need to be upwards of 330 mm (13 inches) thick or
572 mm (20.5 inches) total wall thickness for the “efficient glazing interface” scenario
with R-19 cavity insulation to meet the 0.28 W/m2K target.
Figure 6.4: Impact of Balconies on Wall Thickness for a Target of 0.28 W/m2K (R-20
effective) for Low TEDI Glazing Interfaces and R-19 Cavity Insulation Scenarios
EXAMPLE 3 – IMPACT OF GLAZING SIZE
Minimizing the window perimeter and frame length by maximizing the size of glass per
opening was introduced in Chapter 5 and is illustrated in the graphics above. Figure 6.5
outlines the impact of glazing size on thermal transmittance and overall wall thickness for

C H A P T E R 6 | Future Horizons
6.8
a fixed glazing ratio of 30%. The only difference between the two scenarios is the
difference in interface length for one window versus two smaller windows. All the
scenarios have R-19 cavity insulation.
Similar to the impact of balconies, meeting the 0.28 W/m2K target for the opaque walls is
a challenge for the “efficient glazing interface” scenarios and the wall will need to be
slightly thicker for the low TEDI glazing scenarios. Moreover, there are opportunities to
refine and optimize opaque targets on projects in conjunction to the window thermal
transmittances as outlined in Chapter 4 using whole building energy analysis.
Figure 6.5: Impact of Window Size for a Fixed Glazing Ratio on Wall Thickness for a
Target of 0.28 W/m2K (R-20 effective)

M O R R I S O N H E R S H F I E L D | Guide to Low Thermal Energy Demand for Large Buildings
REFERENCES
ANSI/AHRI Standard 1060-2014. Performance Rating of Air-to-Air Exchangers for Energy
Recovery Ventilation Equipment. Arlington, VA.
ANSI/NFRC 100-2014. Procedure for Determining Fenestration Product U-Factors.
National Fenestration Rating Council, Inc. Greenbelt, MD.
ASHRAE. 2017. ASHRAE Handbook—Fundamentals. American Society of Heating,
Refrigerating and Air-conditioning Engineers, Inc. Atlanta, Georgia.
ASHRAE. 2007. ANSI/ASHRAE/IESNA Standard 90.1-2007, Energy Standard for Buildings
except Low-Rise Residential Buildings. American Society of Heating, Refrigerating
and Air-conditioning Engineers, Inc. Atlanta, Georgia.
CAN/ULC-S114-2005. Standard Method of Test for Determination of Non-combustibility in
Building Materials. Ottawa, Ontario.
CAN/ULC-S134-1992. Standard Method of Fire Test of Exterior Wall Assemblies. Ottawa,
Ontario.
CAN/ULC-S135-2004. Standard Method of Test for Determination of Degrees of
Combustibility of Building Materials Using an Oxygen Consumption Calorimeter
(Cone Calorimeter). Ottawa, Ontario.
CAN/CSA-C439-2009 (R2014). Standard Laboratory Methods of Test for Rating the
Performance of Heat/Energy Recovery Ventilators. Ottawa, Ontario.
CAN/CSA-S478-1995 (R2007). Guideline on Durability in Buildings. Toronto, Ontario.
City of Toronto. 2017. Toronto Green Standard. Toronto, Ontario.
City of Toronto. 2017. Zero Emissions Framework. Toronto, Ontario.
City of Vancouver. 2016. Zero Emissions Building Plan. Vancouver, BC.
City of Vancouver. 2017. Energy Modelling Guidelines. Vancouver, BC.
Home Ventilation Institute (HVI) Publication 920. 2009. HVI Product Performance
Certification Procedure Including Verification and Challenge. Wauconda, IL.
Integral Group, Morrison Hershfield, E3 Eco Group. 2017. Energy Step Code – 2017
Metrics Research Full Report. BC Housing. Burnaby, BC.
https://www.bchousing.org/research-centre/library/residential-design-
construction
ISO 10077-2:2003 (E). Thermal performance of windows, doors and shutters – Calculation
of thermal transmittance – Part 2: Numerical method for frames. Geneva,
Switzerland.
ISO 10211:2007 (E). Thermal bridges in building construction – Heat flows and surface
temperatures – Detailed calculations. Geneva, Switzerland.

| References
R.2
ISO 13823:2008. General principles on the design of structures for durability. Geneva,
Switzerland.
ISO 14683:2007. Thermal Bridges in Building Construction - Linear Thermal
Transmittance - Simplified Methods and Default Values. Geneva, Switzerland.
ISO 6949:2007. Building Components and Building Elements - Thermal Resistance and
Thermal Transmittance - Calculation Method. Geneva, Switzerland.
Morrison Hershfield Limited. 2016. Building Envelope Thermal Bridging Guide. BC
Hydro. Vancouver, BC. www.bchydro.com/thermalguide
Morrison Hershfield Limited. 2017. Passive Cooling Measures for Multi-Unit Residential
Buildings. Final Report. Vancouver, BC.
National Research Council of Canada. 2015. National Building Code of Canada
2015. Ottawa, Ontario.
National Research Council of Canada. 2011. National Energy Code of Canada for
Buildings. Second Edition. Ottawa, Ontario.
Norris, N., Carbary, L. D., Yee, S., Roppel, P., & Ciantar, P. 2015. “The Reality of
Quanitfying Curtain Wall SPandrel Thermal Performance: 2D, 3D and Hotbox
Testing”. Proceedings of 4th BEST Confernce Building Enclosure Science and
Technology (Best 4). Kanas City, Missouri.
OGBS. 2017. Building Pathfinder. http://www.buildingpathfinder.com/
Passive House Institute (PHI). 2009. Requirements and testing procedures for
energetic and acoustical assessment of Passive House ventilation systems >
600 m³/h for Certification as “Passive House suitable component”. Darmstadt,
Germany. http://www.passivehouse.com/
Passive House Institute (PHI). 2016. Criteria for the Passive House, EnergPHit and PHI
Low Energy Building Standard. Version 9f Darmstadt, Germany.
http://www.passivehouse.com/
Passive House Institute US (PHIUS). 2015. PHIUS Technical Committee ERV/HRV
Modeling Protocols. PHIUS Tech Corner. Chicago, IL. www.phius.org
Province of British Columbia. 2017. BC Energy Step Code. Victoria, BC.
RDH Building Engineering Ltd. 2012. Energy Consumption and Conservation in Mid-
and High-Rise Multi-Unit Residential Buildings in British Columbia. Vancouver,
BC. https://www.bchousing.org/research-centre/library/building-science-
reports
RDH Building Engineering Ltd. 2014. International Window Standards – Final Report.
Vancouver, BC https://www.bchousing.org/research-centre/library/building-
science-reports
RDH Building Science Inc. 2017. Illustrated Guide: Achieving Airtight Buildings. BC
Housing. Burnaby, BC. https://www.bchousing.org/research-
centre/library/residential-design-construction

| References
R.3
Roppel, P., Lawton, M. 2011. Thermal Performance of Building Envelope Details for
Mid- and High-Rise Buildings. ASHRAE Research Project 1365-RP Final Report.
American Society of Heating, Refrigerating and Air-conditioning Engineers, Inc.
Atlanta, Georgia.

M O R R I S O N H E R S H F I E L D | Guide to Low Thermal Energy Demand for Large Buildings
Appendix
MATERIAL DATA SHEETS A

A P P E N D I X A | Data Sheets
A.2
Detail A Clear Wall
1 Value selected from table 1, p. 26.1 of 2009 ASHRAE Handbook – Fundamentals depending on surface orientation
ID Component
Thickness
Inches
(mm)
Conductivity
Btu·in / ft2·hr·oF
(W/m K)
Nominal Resistance
hr·ft2·oF/Btu
(m2K/W)
Density
lb/ft3
(kg/m3)
1 Interior Films1 - - R-0.7 (0.12 RSI) -
2 Gypsum Board 1/2" (13) 1.1 (0.16) R-0.5 (0.08 RSI) 50 (800)
3 2” x 6” Steel Studs 18 Gauge 430 (62) - 489 (7830)
4 Air or Fiberglass Batt in Stud Cavity 6” (152) - R-0.9, R-19 (0.16, 3.35 RSI) -
5 Exterior Sheathing 1/2" (13) 1.1 (0.16) R-0.6 (0.10 RSI) 50 (800)
6 FRP Bracket - 4.85 (0.7) - 110 (1760)
7 Aluminum Bracket - 1109 (160) - 171 (2739)
8 Stainless Steel Fastener - 118 (17) - 500 (8000)
9 Mineral Wool Semi Rigid Exterior
Insulation 10” (254) 0.24 (0.034) R-42 (7.40 RSI) 4.5 (72)
10 Vertical Aluminum L-Rail 0.09” (2.2) 1109 (160) - 171 (2739)
11 Metal Cladding with 1/2” vented airspace incorporated into exterior heat transfer coefficient
12 Exterior Film1 - - R-0.7 (0.12 RSI) -

A P P E N D I X A | Data Sheets
A.3
Detail 1 Wall to Roof Interface
1 Value selected from table 1, p. 26.1 of 2009 ASHRAE Handbook – Fundamentals depending on surface orientation
ID Component
Thickness
Inches
(mm)
Conductivity
Btu·in/ft2·hr·oF
(W/m K)
Nominal Resistance
hr·ft2·oF/Btu
(m2K/W)
Density
lb/ft3
(kg/m3)
1 Interior Film1 - - R-0.6 (0.11 RSI) to
R-0.7 (0.12 RSI) -
2 Gypsum Board 1/2" (13) 1.1 (0.16) R-0.5 (0.08 RSI) 50 (800)
3 2” x 6” Steel Studs with Top Track 18 Gauge 430 (62) - 489 (7830)
4 Air or Fiberglass Batt in Stud Cavity 6” (152) - R-0.9, R-19 (0.16, 3.35 RSI) -
5 Exterior Sheathing 1/2" (13) 1.1 (0.16) R-0.6 (0.10 RSI) 50 (800)
6 FRP Bracket - 4.85 (0.7) - 110 (1760)
7 Aluminum Bracket - 1109 (160) - 171 (2739)
8 Semi Rigid Exterior Insulation 10” (254) 0.24 (0.034) R-42 (7.40 RSI) 4.5 (72)
9 Vertical Aluminum L-Rail 0.09” (2.2) 1109 (160) - 171 (2739)
10 Metal Cladding with 1/2” vented airspace incorporated into exterior heat transfer coefficient
11 Concrete Slab and Parapet 8” (203) 12.5 (1.8) - 140 (2250)
12 Stainless Steel Rebar - 118 (17) - 48.1 (7700)
13 Polystyrene Foam Insulation 5” (127) 0.22 (0.031) R-22 (3.87 RSI) 66 (1060)
14 Wood Blocking 5/8” (16) 0.69 (0.10) R-1.0 (0.18 RSI) 31 (500)
15 Aluminum Cap Flashing 18 Gauge 1109 (160) - 171 (2739)
16 Rigid Roof Insulation 8” (203) 0.20 (0.029) R-40 (7.04 RSI) 1.8 (28)
17 Flashing & roof finish material are incorporated into exterior heat transfer coefficient
18 Exterior Film1 - - R-0.2 (0.03 RSI) to
R-0.7 (0.12 RSI) -

A P P E N D I X A | Data Sheets
A.4
Detail 2 Intermediate Floor Intersection
1 Value selected from table 1, p. 26.1 of 2009 ASHRAE Handbook – Fundamentals depending on surface orientation
ID Component
Thickness
Inches
(mm)
Conductivity
Btu·in/ft2·hr·oF
(W/m K)
Nominal Resistance
hr·ft2·oF/Btu
(m2K/W)
Density
lb/ft3
(kg/m3)
1 Interior Films1 - - R-0.6 (0.11 RSI) to
R-0.9 (0.16 RSI) -
2 Gypsum Board 1/2" (13) 1.1 (0.16) R-0.5 (0.09 RSI) 50 (800)
3 2” x 6” Steel Studs with Tracks 18 Gauge 430 (62) - 489 (7830)
4 Air or Fiberglass Batt in Stud Cavity 6” (152) - R-0.9, R-19 (0.16, 3.35 RSI) -
5 Exterior Sheathing 1/2" (13) 1.1 (0.16) R-0.6 (0.10 RSI) 50 (800)
6 FRP Bracket - 4.85 (0.7) - 110 (1760)
7 Mineral Wool Semi Rigid Exterior
Insulation 10” (254) 0.24 (0.034) R-42 (7.40 RSI) 4.5 (72)
8 Vertical Aluminum L-Rail 0.09” (2.2) 1109 (160) - 171 (2739)
9 Concrete Slab 8” (203) 12.5 (1.8) - 140 (2250)
10 Metal Cladding with 1/2" vented airspace incorporated into exterior heat transfer coefficient
11 Exterior Film1 - - R-0.7 (0.12 RSI) -

A P P E N D I X A | Data Sheets
A.5
Detail 3 At-Grade to Below-Grade Parking Garage Interface
1 Value selected from table 1, p. 26.1 of 2009 ASHRAE Handbook – Fundamentals depending on surface orientation
ID Component
Thickness
Inches
(mm)
Conductivity
Btu·in/ft2·hr·°F
(W/m K)
Nominal Resistance
hr·ft2·°F/Btu
(m2K/W)
Density
lb/ft3
(kg/m3)
1 Interior Film1 - - R-0.7 (0.12 RSI) to
R-0.9 (0.16 RSI) -
2 Gypsum Board 1/2" (13) 1.1 (0.16) R-0.5 (0.08 RSI) 50 (800)
3 2” x 6” Steel Studs with Tracks 18 Gauge 430 (62) - 489 (7830)
4 Air or Fiberglass Batt in Stud Cavity 6” (152) - R-0.9, R-19 (0.16, 3.35 RSI) -
5 Exterior Sheathing 1/2" (13) 1.1 (0.16) R-0.6 (0.10 RSI) 50 (800)
6 FRP Bracket - 4.85 (0.7) - 110 (1760)
7 Semi Rigid Exterior Insulation 10” (254) 0.24 (0.034) R-42 (7.40 RSI) 4.5 (72)
8 Vertical Aluminum L-Rail 0.09” (2.2) 1109 (160) - 171 (2739)
9 Metal Cladding with 1/2" vented airspace incorporated into exterior heat transfer coefficient
10 Aluminum Flashing 18 Gauge 1109 (160) - 171 (2739)
11 Concrete Foundation 8” (203) 12.5 (1.8) - 140 (2250)
12 Foundation Thermal Block 8” (203) 0.20 (0.029) R-40 (7.04 RSI) 1.8 (28)
13 Slab Insulation 10” (254) 0.24 (0.034) R-42 (7.40 RSI) 4.5 (72)
14 Gypsum Thermal Protection Board 1/2" (13) 1.1 (0.16) R-0.6 (0.10 RSI) 50 (800)
15 Below Grade Rigid Insulation 8” (203) 0.20 (0.029) R-40 (7.04 RSI) 1.8 (28)
16 Cement Protection Board 1/2" (13) 12.5 (1.8) - 140 (2250)
17 Soil - 15.6 (2.25) - -
18 Exterior Film1 - - R-0.2 (0.03 RSI) to
R-0.7 (0.12 RSI) -
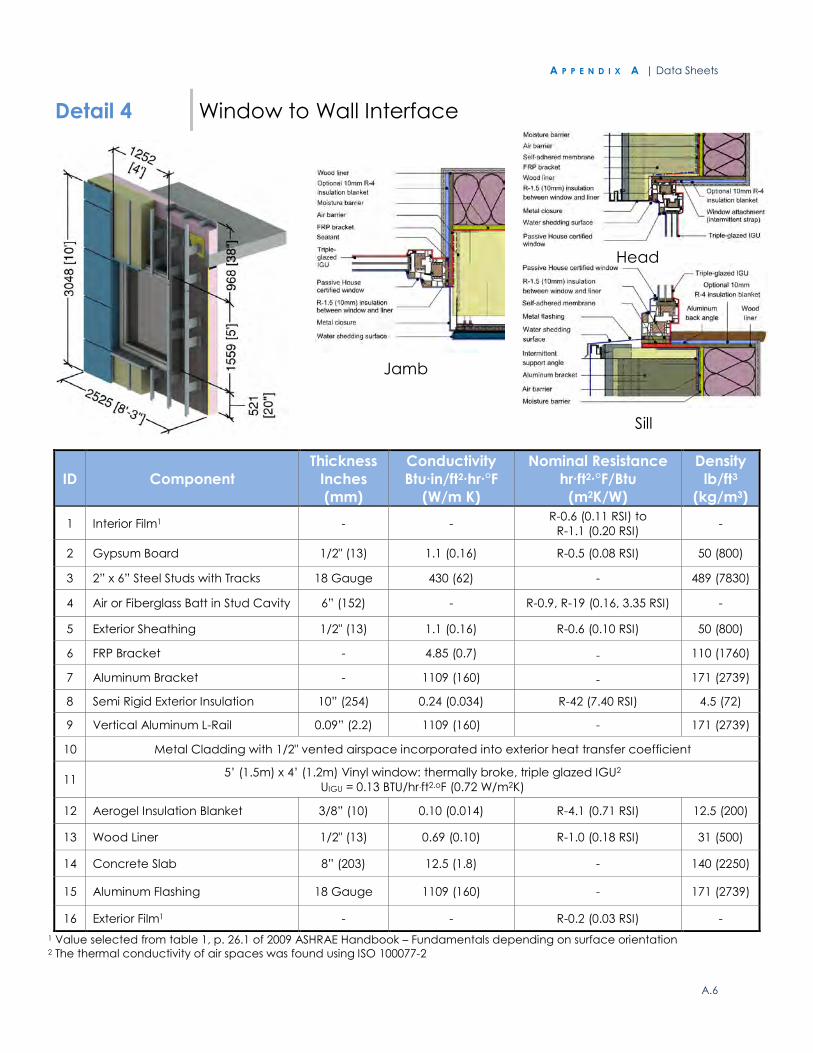
A P P E N D I X A | Data Sheets
A.6
Detail 4 Window to Wall Interface
1 Value selected from table 1, p. 26.1 of 2009 ASHRAE Handbook – Fundamentals depending on surface orientation
2 The thermal conductivity of air spaces was found using ISO 100077-2
ID Component
Thickness
Inches
(mm)
Conductivity
Btu·in/ft2·hr·°F
(W/m K)
Nominal Resistance
hr·ft2·°F/Btu
(m2K/W)
Density
lb/ft3
(kg/m3)
1 Interior Film1 - - R-0.6 (0.11 RSI) to
R-1.1 (0.20 RSI) -
2 Gypsum Board 1/2" (13) 1.1 (0.16) R-0.5 (0.08 RSI) 50 (800)
3 2” x 6” Steel Studs with Tracks 18 Gauge 430 (62) - 489 (7830)
4 Air or Fiberglass Batt in Stud Cavity 6” (152) - R-0.9, R-19 (0.16, 3.35 RSI) -
5 Exterior Sheathing 1/2" (13) 1.1 (0.16) R-0.6 (0.10 RSI) 50 (800)
6 FRP Bracket - 4.85 (0.7) - 110 (1760)
7 Aluminum Bracket - 1109 (160) - 171 (2739)
8 Semi Rigid Exterior Insulation 10” (254) 0.24 (0.034) R-42 (7.40 RSI) 4.5 (72)
9 Vertical Aluminum L-Rail 0.09” (2.2) 1109 (160) - 171 (2739)
10 Metal Cladding with 1/2" vented airspace incorporated into exterior heat transfer coefficient
11 5’ (1.5m) x 4’ (1.2m) Vinyl window: thermally broke, triple glazed IGU2
UIGU = 0.13 BTU/hr.ft2.oF (0.72 W/m2K)
12 Aerogel Insulation Blanket 3/8” (10) 0.10 (0.014) R-4.1 (0.71 RSI) 12.5 (200)
13 Wood Liner 1/2" (13) 0.69 (0.10) R-1.0 (0.18 RSI) 31 (500)
14 Concrete Slab 8” (203) 12.5 (1.8) - 140 (2250)
15 Aluminum Flashing 18 Gauge 1109 (160) - 171 (2739)
16 Exterior Film1 - - R-0.2 (0.03 RSI) -
Head
Jamb
Sill

A P P E N D I X A | Data Sheets
A.7
Detail 5 Door with Intermittently Attached Balcony Interface
1 Value selected from table 1, p. 26.1 of 2009 ASHRAE Handbook – Fundamentals depending on surface orientation 2 The thermal conductivity of air spaces was found using ISO 100077-2
ID Component
Thickness
Inches
(mm)
Conductivity
Btu·in/ft2·hr·°F
(W/m K)
Nominal Resistance
hr·ft2·°F/Btu
(m2K/W)
Density
lb/ft3
(kg/m3)
1 Interior Film1 - - R-0.6 (0.11 RSI) to
R-1.1 (0.20 RSI) -
2 Gypsum Board 1/2" (13) 1.1 (0.16) R-0.5 (0.08 RSI) 50 (800)
3 2” x 6” Steel Studs with Tracks 18 Gauge 430 (62) - 489 (7830)
4 Air or Fiberglass Batt in Stud Cavity 6” (152) - R-0.9, R-19 (0.16, 3.35 RSI) -
5 Exterior Sheathing 1/2" (13) 1.1 (0.16) R-0.6 (0.10 RSI) 50 (800)
6 FRP Bracket - 4.85 (0.7) - 110 (1760)
7 Aluminum Bracket - 1109 (160) - 171 (2739)
8 Mineral Wool Semi Rigid Exterior
Insulation 10” (254) 0.24 (0.034) R-42 (7.40 RSI) 4.5 (72)
9 Vertical Aluminum L-Rail 0.09” (2.2) 1109 (160) - 171 (2739)
10 Metal Cladding with 1/2" vented airspace incorporated into exterior heat transfer coefficient
11 Concrete Slab 8” (203) 12.5 (1.8) - 140 (2250)
12 Wood Liner 1/2" (13) 0.69 (0.10) R-1.0 (0.18 RSI) 31 (500)
13 Steel Support Angle 1/2" (13) 430 (62) - 489 (7830)
14 Steel Balcony Framing 5/8” (16) 430 (62) - 489 (7830)
15 Concrete Balcony Topping 2.5” (64) 12.5 (1.8) - 140 (2250)
16 Aluminum Back Angle 0.09” (2.2) 1109 (160) - 171 (2739)
17 Thermally broken vinyl sliding door2, triple glazed IGU UIGU = 0.13 BTU/hr.ft2.oF (0.72 W/m2K)
18 Steel Column and Knife Edge 5/8” (16) 430 (62) - 489 (7830)
19 Exterior Film1 - - R-0.2 (0.03 RSI) to
R-0.7 (0.12 RSI) -
Cable support
connection
Balcony
Door Sill
Door
Metal Balcony
connection

M O R R I S O N H E R S H F I E L D | Guide to Low Thermal Energy Demand for Large Buildings
Appendix
HRV CORRECTION DERIVATIONS B

A P P E N D I X B | HRV Correction Calculations
B.2
Adjusted HRV Efficiency
The equivalent efficiency is calculated such that after fan heat is added or removed by
the energy modelling program, the same set of temperatures will result at rated
conditions as those seen in the HVI or other testing.
The temperatures, powers and flows used here are at rated conditions and should be
available from the documentation provided by the testing authority (HVI, AHRI, etc). The
equations used to derive the equations for heat recovery adjustment are as follows:
The adjustments all start with the equation for efficiency from CSA/HVI:
������(�) = ∆����∆�����∆��� (Equation B.1)
Several terms are not shown here because they will be zero or are specifically removed
to avoid credit for undesirable affects. See HRV chapter for more background. The
desired adjustment is applied to give the following, now including supply fan heat:
������ = ∆���� + ∆���∆���� + ∆��� − !""#$%&!'
Rearranging, we get:
!""#$%&!' = ∆���� + ∆���∆���� + ∆��� − ������
This simplifies to:
!""#$%&!' = ∆���∆���� + ∆���
Then, given the following, we can derive a version relating the correction to fan power:
Where :
(��) = �!%*+"*%#-.!/#"!012..+3!"#4ℎ*21%0*'*%"*%#-$!'-&%&!'1 ∆� = �#6.#"*%2"#"&1#!0*&"1%"#*6*1126&'7*++0*'#'#"73%!%ℎ#*&"1%"#*6
The other values are conversion factors. We arrive at:
!""#$%&!' = 89:�;<=>��.@ABC�89��;<= > (Equation B.2)
The other corrections are derived in a similar manner starting with exhaust fan corrected
using:
(��) = 1.08 × $06 × ∆�3.41214

A P P E N D I X B | HRV Correction Calculations
B.3
������ = ∆����∆���� − !""#$%&!'
Leading to:
!""#$%&!' = ∆����∆���� − ������
!""#$%&!' = ������ × 8K��LMN> × 0.07968 (Equation B.3)
Equations for simultaneously adding supply fan and removing exhaust fans may not be
required, and provide similar results, but are as follows:
������ = ∆���� + ∆���∆���� − !""#$%&!'
!""#$%&!' = ∆���� + ∆���∆���� − ������
Leading to:
!""#$%&!' = 0.07968 × R������ × 8K��LMN> + 8K:�
LMN>S (Equation B.4)
Correction for simultaneously removing supply fan and exhaust fan are as follows:
������ = ∆���� − ∆���∆���� − !""#$%&!'
!""#$%&!' = ∆���� − ∆���∆���� − ������
Leading to:
!""#$%&!' = 0.07968 × R������ × 8K��LMN> − 8K:�
LMN>S (Equation B.5)