guide lidar
DESCRIPTION
lidarTRANSCRIPT

United States Department of Agriculture
Forest Service
Remote Sensing Applications Center
Geospatial Management Office
Considerations for using Lidar
Data—A Project Implementation Guide
December 2012 RSAC-10032-MAN1
Mitchell, B.; Jacokes-Mancini, R.; Fisk, H.; Evans, D. 2012. Considerations for using lidar data—a project implementation guide. RSAC-10032-MAN1. Salt Lake City, UT: U.S. Department of Agriculture, Forest Service, Remote Sensing Applications Center. 13 p.
AbstractThis document is designed to provide resource managers with recommendations and guidelines for acquiring and using lidar data for natural resource management. The document outlines four key workflow components: lidar project considerations, acquiring data, processing and disseminating data, and application development. The document also includes links to supporting documentation including reports, PowerPoint slides, and recorded presentations.
How to Use this Document
This document is intended for resource managers considering the use of lidar data to address resource information needs. It provides a framework of considerations, recommendations, and resources for successful project execution. We recommend that you read and understand the entire document before starting a project. In the initial project planning stages it is of particular importance to review section 1: Lidar Project Considerations for ideas on how to determine if lidar can be used to gather the required information. Making a wrong choice at this early stage will result in either an unsuccessful project or unnecessary expense. It is also recommended that before you begin your project that you become aware of your region’s lidar collection and data policies, as they may affect how you proceed. The remaining sections of the document provide guidelines and resources for successful implementation of the corresponding portions of your project. These are all important sections and you should be familiar with their content well in advance, but, they are less critical in the initial stages of your project.
Associated with the document is a flowchart that provides a summarized interpretation of the entire process from assessing needs to application development. The chart acts as a road map for the processes within this document. Each section within this document has links to supporting documentation for more information.
There are four main sections to this document:
1. Lidar Project Considerations2. Acquiring Lidar Data3. Processing and Disseminating Lidar Data4. Application Development
Key Wordslidar, resource management, forest structure, canopy, DEM
AuthorsBrent Mitchell is a remote sensing specialist employed by RedCastle Resources at the Remote Sensing Applications Center in Salt Lake City, UT.
Renee Jacokes-Mancini is the Remote Sensing Coordinator for the Southern Region of the USDA Forest Service in Atlanta, GA.
Haans Fisk is the Remote Sensing Evaluation, Application & Training program leader at the Remote Sensing Applications Center.
Don Evans is a contract leader and a principal of RedCastle Resources at the Remote Sensing Applications Center.
ii

iii
Table of Contents
Abstract ii
How to Use this Document ii
Introduction 1
Lidar Project Considerations 2
Assess Appropriateness of Lidar Technology 2
Planning 2
Defining Lidar Acquisition Specifications 3
Building Partnerships 4
Acquiring Lidar Data 5
Contracting and Acquisition Phase 5
Processing and Disseminating Lidar Data 6
Initial Data Processing (Basic Level Processing) 6
Deriving Canopy Metrics (Moderate Level Processing) 7
Modeling (Advanced Level Processing) 8
Disseminating Lidar Data and Derivatives 9
Application Development 9
References 11
Appendix 1: Remote Sensing Regional Coordinators Contact Information 13

iv

1 | RSAC-10032-MAN 1
IntroductionAs lidar technology becomes more established as a tool for natural resource management, resource managers need an efficient workflow for obtaining and applying lidar data (figure 1). The recommendations and guidelines presented in this document attempt to address that need and are based on the Remote Sensing
Project Considerations Acquiring Lidar Data
Processing and Disseminating Lidar Data
Determine if lidar
technology is appropriate
Determine appropriate
lidar acquisition specifications
Staffing and resource
considerations
Explore potential partnerships
*Ensure both parties agree on appropriate lidar acquisitions specifications
Contracting phase • Statement of work • RFQ • Evaluate • Award contract
Perform quality assessment
Disseminate lidar data and derivatives to
resource managers
Perform lidar data processing for additional lidar derivatives if desirable
*Moderate to advanced processing level
Integrate vendor deliverables into GIS
*Basic processing level
Application Development
Apply products to solving land
management issues
Incorporate the high resolution lidar derived bare earth surface DEM into models that consider topography
Incorporate stand level lidar vegetation metrics (canopy height, percent canopy cover, canopy surface roughness, etc.) into habitat modeling and end user maps
Model forest inventory parameters using lider canopy metrics
Figure 1—The flowchart depicts a critical workflow and key considerations for implementing a successful lidar project.
Applications Center’s (RSAC’s) recent collaborative experience with the Pacific Northwest Research Station (PNW), the Rocky Mountain Research Station (RMRS), and Forest Service Regions 1, 3, 6 and 8.
RSAC offers technical expertise and cost-reimbursable services for the entire process of using lidar
technology to address land management objectives. However, to ensure you incorporate previous experience and project knowledge from your region, your first point of contact should be your Regional Remote Sensing Coordinator. Their contact information is provided in appendix 1.
2 | RSAC-10032-MAN 1
Lidar Project Considerations
Assess Appropriateness of Lidar Technology Lidar continues to prove very useful for providing resource information; however, it is often seen as a silver bullet with information provided ready to use. In most cases, however, there must be significant additional investment to gather all of the desired information from lidar.
The first step when considering the use of lidar technology is deciding if it is appropriate for your land management objective. A clearly defined project scope and objectives provide a good start for assessing the appropriateness of lidar technology. Information needs, project area, scale of the phenomenon, desired resolution of the geospatial end products, and timing can play a key role in deciding if lidar technology is appropriate or even capable of addressing your land management objectives. Often lidar can only provide some of the geospatial data layers that you will need (e.g., lidar cannot provide tree species information—if you need that information you will need another source of data). In order to make an accurate assessment of the utility of lidar for your needs, you must have some familiarity with lidar or consult with others who have experience. This document can provide you a good starting point for making the assessment.
Planning
If you decide that lidar can provide the information you need, you then need to consider:
What lidar specifications are necessary to derive the information I need?
Are there any potential partnerships that will reduce costs without compromising critical objectives?
Even if you determine that lidar is the appropriate technology, be aware that not all lidar data is equal. For example, you may be interested in deriving detailed forest structure information from lidar. You discover the opportunity to buy into an ongoing lidar acquisition that will be used for flood mapping (or an improved DEM). However, it is quite likely that the lidar data that is appropriate for the flood mapping (or DEM update) will be relatively useless for detailed forest structure information. We’ll discuss some of the lidar specifications in a subsequent section of this document.
What other data (e.g., field plot inventory) will be required?
Are there sufficient funds for lidar acquisition, training, processing, field and computer staffing?
Are the timelines reasonable?
During the planning phase, identify similar applications of lidar that have been completed and contact the key staff involved. The project staff should be able to provide you with some insight into whether they were satisfied with the results and if they got what they expected at the conclusion of the project.
Another consideration is the minimum staffing needs to complete a successful lidar project. Do you have access to the appropriate lidar knowledge base and technical skill set? If you’re only interested in obtaining a detailed digital elevation model and canopy height model (CHM) then the lidar vendor can supply this. If you are pursuing a forest inventory modeling project, do you have staff for gathering the necessary field data to correlate with the lidar data? Are you aware of specific field plot designs appropriate for lidar modeling techniques? Do you have access to statistical expertise for exploring relationships between the lidar data and field plots? Once you have all the lidar data and derivatives,
will you have the resources to process, manage and store the data successfully? These are questions and topics you should explore before pursuing a lidar technology project. Planning, executing, and deriving end products can take as much as a year or longer, so timing is also important when considering lidar technology.
Supporting Documentation for Lidar Project Planning and Awarenesss Materials
“Introduction to Lidar”—RSAC Geotraining eLearning Tutorial (Goetz and others 2005). Link: http://fsweb.geotraining.fs.fed.us/www/index.php?view_unit=3364
“Lidar Project Time Line Overview”—PowerPoint presentation at Workshop 2 of RSAC’s Lidar Technology Transfer Web-Workshop Series, January 26, 2010 (Laes and others 2010a). Link: http://fsweb.geotraining.fs.fed.us/tutorials/Lidar_Strategy/Lidar_Project_TimeLine_Overview.pptx
“Lidar Technology Project Planning”—PowerPoint presentation at Workshop 2 of RSAC’s Lidar Technology Transfer Web-Workshop Series, January 26, 2010 (Laes and others 2010b). Link: http://fsweb.geotraining.fs.fed.us/tutorials/Lidar_Strategy/Lidar_Technology_ProjectPlanning.pptx
3 | RSAC-10032-MAN 1
“Overview of Lidar Technology and FUSION Software”—PowerPoint presentation at the Phase III Pinaleño Lidar Mapping Workshop conducted in Tucson, Arizona, August 30, 2011 (Mitchell and others 2011a). Link: http://fsweb.geotraining.fs.fed.us/www/index.php?view_unit=4110
Defining Lidar Acquisition Specifications
Deciding on the appropriate lidar acquisition specifications is a crucial step in ensuring you obtain lidar data adequate for your application. Not all
lidar data are equal. While there is a continuum of quality (which is most often defined as the quantity of pulses per square meter), we’ve classified lidar quality into three classes (table 1). Sparse lidar data (Quality Level 3 [Q3]) is very useful for updating your digital elevation models (DEMs) and for some hydrology and geomorphology applications. It will not, however, be useful for modeling forest inventory parameters (basal area, volume, biomass, canopy fuel variables, etc.). On the other hand, highly dense lidar data (Quality Level 1 [Q1]) has the potential to derive forest inventory parameters, but you
must make additional significant investments to model them (see the Modeling [Advanced Level Processing] section). Q1 data is more expensive, so it should not be specified if your need could be satisfied with Q3 data.
The specifications should be well documented so that they can be clearly communicated to contracting officers and potential vendors. The specifications will also enable you to determine which contractors have previous experience in collecting lidar data that is appropriate for your application.
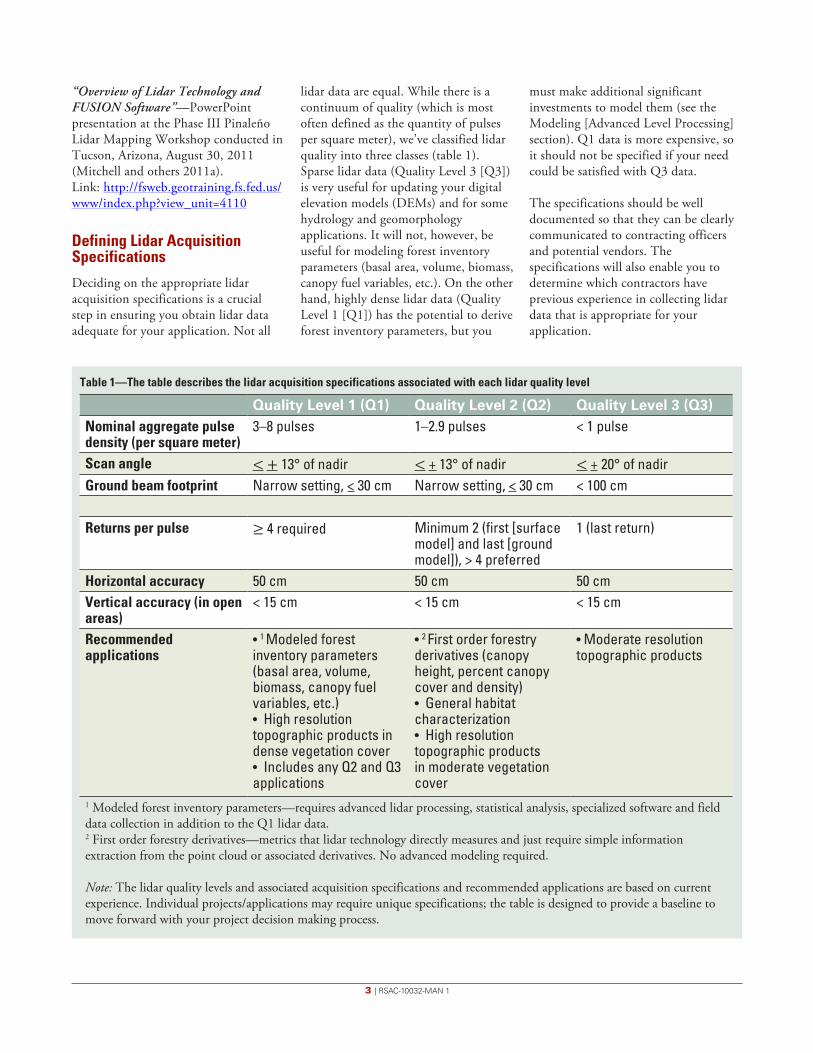
Table 1—The table describes the lidar acquisition specifications associated with each lidar quality level
Quality Level 1 (Q1) Quality Level 2 (Q2) Quality Level 3 (Q3)Nominal aggregate pulse density (per square meter)
3–8 pulses 1–2.9 pulses < 1 pulse
Scan angle < + 13° of nadir < + 13° of nadir < + 20° of nadirGround beam footprint Narrow setting, < 30 cm Narrow setting, < 30 cm < 100 cm
Returns per pulse ≥ 4 required Minimum 2 (first [surface model] and last [ground model]), > 4 preferred
1 (last return)
Horizontal accuracy 50 cm 50 cm 50 cmVertical accuracy (in open areas)
< 15 cm < 15 cm < 15 cm
Recommended applications
• 1 Modeled forest inventory parameters (basal area, volume, biomass, canopy fuel variables, etc.)• High resolution topographic products in dense vegetation cover• Includes any Q2 and Q3 applications
• 2 First order forestry derivatives (canopy height, percent canopy cover and density)• General habitat characterization• High resolution topographic products in moderate vegetation cover
• Moderate resolution topographic products
1 Modeled forest inventory parameters—requires advanced lidar processing, statistical analysis, specialized software and field data collection in addition to the Q1 lidar data.2 First order forestry derivatives—metrics that lidar technology directly measures and just require simple information extraction from the point cloud or associated derivatives. No advanced modeling required.
Note: The lidar quality levels and associated acquisition specifications and recommended applications are based on current experience. Individual projects/applications may require unique specifications; the table is designed to provide a baseline to move forward with your project decision making process.

4 | RSAC-10032-MAN 1
Having a well defined project area that is workable for the vendor is important. It is advisable to provide a shapefile, including map projection and coordinate system, to ensure there is no confusion about where the lidar acquisition will take place. Timing of the acquisition can be influenced by phenology (leaf on versus leaf off), snow cover, flight restrictions, and active fire concerns.
The technical specifications can include, but are not limited to, pulse density, beam footprint, scan angle, swath overlap, opposing flight lines, and accuracy. Relative accuracy corresponding to flightline-to-flightline accuracy is more important than the absolute accuracy for most forestry applications.
Supporting Documentation for Acquiring Lidar Data
“A guide to Lidar Data Acquisition and Processing for the Forests of the Pacific Northwest”—Report published by the Pacific Northwest Research Station (Gatziolis and Anderson, 2008). Link: http://www.fs.fed.us/pnw/pubs/pnw_gtr768.pdf
“Discrete Return Lidar in Natural Resources: Recommendations for Project Planning, Data Processing, and Deliverables”—Report published in Remote Sensing Journal (Evans and others 2009). Link: http://www.fs.fed.us/rm/pubs_other/rmrs_2009_evans_j002.pdf
“Practical Lidar–Acquisition Considerations for Forestry Applications”—Report published by RSAC (Laes and others 2008). Link: http://fsweb.rsac.fs.fed.us/index.php?option=com_docman&task=doc_download&gid=194&Itemid=255
Building Partnerships
There are a wide variety of potential lidar project cost sharing partners ranging from internal regional Forest Service partners, separate Forest Service units, universities and/or other federal, county and state agencies. Partnerships with other federal agencies such as the United States Geological Survey (USGS), Natural Resources Conservation Service (NRCS), National Park Service (NPS), and Bureau of Land Management (BLM) have been quite successful in the past.
Partnerships can lift some of the financial burden of acquiring lidar data, but also introduce additional issues to consider. Partnerships require time to establish and you will need to consider differing budget cycles. Sometimes partners may not contribute dollars to acquiring the data but can contribute staff time and expertise to the process. It should be noted that not all partners are interested in the same quality level of lidar data, so lidar acquisition specifications should be clearly stated before entering cost-sharing agreements with partners. If an agreement cannot be reached on the appropriate lidar quality level, the partnership may not be beneficial to both parties and should not be pursued further.
A successful and efficient partnership example has been demonstrated in the Pacific Northwest Region (Region 6) through their partnership with the Oregon Lidar Consortium (http://www.oregongeology.org/sub/projects/olc/default.htm), which has access to a large network of contributors to purchase lidar data and is funded by the state legislation. Another example of a successful partnership is the recently completed project “Mapping Vegetation Structure In The Pinaleño Mountains Using Lidar” (Laes and others 2009, Mitchell and others 2012) which has
been made possible by a large collaboration of partners which include: the Coronado National Forest, Pacific Southwest Region (Region 3) Regional Office, Forest Health Management (FHM), RSAC, RMRS, PNW, and the University of Arizona.
Many state, county, and local governments have decided to collect lidar data over portions of states or regional landscapes. The goal of these acquisitions is often to obtain high resolution DEMs for floodplain, terrain, engineering, and feature extraction (buildings and roads) applications. Since forestry applications often require more densely collected lidar data, there is often an additional cost associated with the acquisition. Lidar vendors will have to fly lower, slower, and with more overlap between flight lines to meet the needs of forestry applications. The Forest Service can participate in these consortiums by offering to buy-up the acquisition specifications to obtain the higher density lidar data appropriate for forestry applications.
Note: At the time of creating this document a national program for collaborating and cost sharing to acquire lidar data within the Forest Service does not exist. It is possible in the future that there will be a national program to help fund and organize the collection of lidar data.
Acquiring Lidar Data
Contracting and Acquisition PhaseOnce the lidar acquisition specifications are established, the contracting phase can begin. The components of the contracting process that require the largest contribution of lidar technical skills and knowledge are creating the statement of work, defining the

5 | RSAC-10032-MAN 1
deliverables, defining the evaluation factors, performing the vendor evaluations, and performing the quality assessment.
The statement of work is a summary of the lidar specifications already decided upon in the previous step of the process. It is recommended that the statement of work should include at least the following sections: acquisition area, purpose of study, potential acquisition problems, potential air space restrictions, technical data acquisition specifications (minimum vendor requirements), accuracy, spatial reference framework, timeframe, data ownership, deliverables and agreed upon communication channels.
The deliverables can consist of data products, reports, and processing media. It is advisable to correspond with key personnel involved in similar lidar technology projects to ensure you request all the appropriate deliverables. Below is a brief list of key deliverables recommended for forestry applications. This list is a recommendation and not complete; further exploration of your lidar technology application may lead you to request additional deliverables:
Lidar Survey Report
Aircraft trajectories
All-return point cloud (tiled *.las format raw data)
Ground-return point cloud (*.las format ground filtered raw data)
Bare Earth (BE) surface model (raster ground surface) including spatial resolution and spatial extent
First return surface model (highest hit) including spatial resolution and spatial extent (best to work with digital orthophoto quarter quadrangle [DOQQ] or digital orthophoto quadrangle [DOQ] subsets of the project area)
Intensity image
Supporting shapefiles
GPS report
Quality assessment statistics
Please refer to appendix A in “Practical Lidar–Acquisition Considerations for Forestry Applications” (Laes and others 2008) for a more detailed explanation of the above deliverables.
Evaluation criteria will be included in the request for proposal (RFP). Vendors are generally evaluated based on price and technical factors. The technical factors include past performance, prior experience, and qualifications. Lidar technical expertise may be needed to correctly and clearly define the technical evaluation factors.
Once the RFP deadline for submission has passed, an evaluation team is formed. Generally this team is comprised of the contracting officer’s representative (COR), a lidar specialist, Regional Remote Sensing Coordinator, and a land management specialist from the Forest Service. This team will evaluate each vendor based on the agreed upon criteria.
Once the contract is awarded to a particular vendor, it is advisable to conduct a pre-flight client-vendor meeting. This meeting provides an opportunity to review the contract specifications, discuss the time frame for collection, review the contractual obligations of both parties, and review the deliverables and post processing requirements.
Once all is agreed upon the vendor will create and present a flight plan to the client and proceed with the acquisition. The vendor will complete the post processing which includes quality control, assessing accuracy, and preparing deliverables.
A quality assessment will need to be conducted to ensure the deliverables meet the stated minimum specifications. Generally you will have approximately 30 days to conduct your quality assessment and discuss fixes with the vendor. This period can be flexible with mutual agreement. Outlined below is a five step quality assessment process based on RSAC’s experience.
1. Determine if the raw lidar data tiles (*.las format) meet specifications
a. Ensure data in the project area is complete
b. Ensure the density of the first returns in the project area (pulses per square meter) meets specifications
c. Check for outliers
2. Perform a visual inspection of all raster grids (creating hillshades can help you with visual inspection)
a. Check for "no data" cells
b. Check for tile boundary anomalies
3. Browse random raw data tiles
a. Check for anomalies and outliers
4. Check the scan angle range
5. Check for opposing parallel flight lines
Working through a national or regional indefinite delivery/indefinite quantity contract should make the process more efficient. Another alternative is to work through a consortium that will take care of all the contracting and quality assessment of the lidar data. For example, Region 6 works through the Oregon Lidar Consortium whenever feasible. If these scenarios are not an option, the contracting process and quality assessment should be conducted internally by the forest or region.

6 | RSAC-10032-MAN 1
Supporting Documentation for the Contracting and Acquisition Phase of Acquiring Lidar Data
“Example Request for Proposal”—Example document contained in “Practical Lidar–Acquisition Considerations for Forestry Applications.” Report published by RSAC (Laes and others 2008). Link: http://fsweb.rsac.fs.fed.us/index.php?option=com_docman&task=doc_view&gid=194&tmpl=component&format=raw&Itemid=255
“Lidar Acquisition—Mapping Vegetation Structure in the Pinaleño Mountains using Lidar”—PowerPoint presentation at the Mapping Vegetation Structure in the Pinaleño Mountains Using Lidar Workshop conducted in Tucson, Arizona, August 17–19, 2009 (Mellin and Anhold, 2009). Link: http://fsweb.geotraining.fs.fed.us/tutorials/Lidar_Strategy/Pinalenos_Lidar_Acquisition_Mellin.pptx
“Lidar Data Acquisition and Quality Assessment—Pinaleño Mountains, AZ”—PowerPoint presentation at the Mapping Vegetation Structure in the Pinaleño Mountains Using Lidar Workshop conducted in Tucson, Arizona, August 17–19, 2009 (Laes 2009a). Link: http://fsweb.geotraining.fs.fed.us/tutorials/Lidar_Strategy/R3_Lidar_deliverables_QA.pptx
Processing and Disseminating Lidar DataThe amount of lidar data processing you conduct depends upon the requested lidar deliverables and how you plan on applying the lidar data to your land management project. This can range from minimal processing, such as using vendor delivered raster datasets in your GIS, to extensive processing for tasks such as developing allometric relationships between forest
plots and lidar derivatives. Lidar data processing can be organized in three categories: initial data processing (basic level processing), deriving general canopy metrics (moderate level processing), and modeling (advanced level processing).
Initial Data Processing (Basic Level Processing)
General vendor deliverables that can be used immediately with minimal or no processing are the BE surface model and the canopy surface model (CSM).
The BE surface model, analogous to a DEM, is a key product for any lidar technology project. It is recommended, if funds allow, that you request a BE surface model as a deliverable from the vendor. Generally the vendor has more experience and software resources to efficiently create an accurate BE surface model. If the funds are not available to purchase a BE surface model, FUSION software can be used to create a BE surface model from the raw lidar data that is adequate for most vegetation based forestry applications (McGaughey 2012). A tiling scheme should be implemented by the vendor or the regional lidar analyst to ensure the BE surface models can be used efficiently in GIS software and modeling. Tiling the BE surface model to DOQQ pieces has
proven effective in RSAC’s experience. Creating a hillshade from the BE surface model is easily done in ArcGIS and is a good visualization product that can be immediately used as an information source.
The CSM, also known as the highest hit surface, is a digital elevation model that includes the topography and all the objects present on the surface of the earth (trees, roads, power lines, structures, etc.). A hillshade can be created from the CSM and is a good and informative visualization product.
The BE surface model and the CSM can both be displayed and explored in ArcScene as high resolution 3-D visualizations (figure 2).
Deriving Canopy Metrics (Moderate Level Processing)
The capability of lidar technology to penetrate the vegetation canopy and sample information about the ground surface and the vegetation canopy simultaneously enables the technology to be used for deriving vegetation structural information. By using the information contained within the BE surface model we can normalize the topography (elevation) which enables us to compare and contrast canopy structure across the landscape.
Figure 2—One meter BE surface model, displayed in ArcScene, from the Pinaleño Mountains Lidar Project, Coronado National Forest in Arizona.

7 | RSAC-10032-MAN 1
Figure 3—Three surfaces are depicted in the graphic above. The CHM is created by subtracting the BE surface model from the CSM. The CSM and BE model have Z values representing elevation (height above sea level). By subtracting the two you normalize the topography and the CHM represents vegetation height above ground (Laes and others 2009).
Canopy Surface Model (CSM)
Canopy Height Model (CHM)
The simplest processing step for obtaining canopy information is to subtract the BE surface model from the CSM to obtain a CHM (figure 3). This processing can be accomplished using the Spatial Analyst ToolBox in ArcMap or alternatively in FUSION.
Additional canopy metrics can be calculated using FUSION in conjunction with the BE surface model and raw lidar data files. To pursue this processing workflow the BE surface
model will need to be converted into a DTM format (binary format Digital Terrain Model). The BE surface model DTM can then be used to display the ground surface model together with the point cloud visualization, normalize the point cloud to height above ground, and as input into FUSION utilities that create canopy metrics. FUSION is capable of creating canopy metrics based on any input cell size and a number of other parameters. FUSION is also capable of
outputting canopy metrics that represent how lidar technology samples vegetation height distributions, vegetation density, percent canopy cover, canopy roughness, and canopy volume. For a full list and detailed description of available metrics please refer to the FUSION manual (http://forsys.cfr.washington.edu/fusion/fusionlatest.html). Figure 4 represents an example of a percent canopy cover grid created using FUSION.
Bare Earth (BE) Surface Model

8 | RSAC-10032-MAN 1
Modeling (Advanced Level Processing)
By combining forestry field plot data and lidar canopy metrics, one can create reasonable models to predict forestry inventory parameters such as basal area, volume, and biomass, among others. This modeling approach requires a financial commitment to field data collection in addition to lidar acquisition. Consideration must be given to the following key components:
Collection of field data to facilitate forest attribute modeling from lidar data. Related issues include:
Limitations of existing inventory data for lidar modeling
Appropriate number of samples
Accuracy of plot locations (adequate GPS receiver and data collection method)
Timing of lidar acquisition relative to field measurements
Plot configuration or sampling strategy
Appropriate representation of forest conditions on plots
Plot measurement protocol
Figure 4—The above figure illustrates how lidar technology can be used to characterize canopy structure (percent canopy cover in this example). Image A represents a lidar point cloud with a varying amount of vegetation across the landscape (point cloud colored by height). Image B incorporates a 3-D visualization of an output surface created from the point cloud with the Z axis representing percent canopy cover. The surface can be output into a GIS for additional modeling (Mitchell and others 2009).
AB
A B
Preparation of required data sets for integration into a single table before modeling:
Field plot data must be processed to generate tree-level forest variables for plot-level summarization
GPS data must be post processed to ensure 1- to 2-meter plot location accuracy
Lidar data must be processed to extract plot metrics correlating with the field plot size and locations and grid metrics for the entire study area
Development and application of mathematical relationships between variables derived from ground plots and the corresponding plot metrics derived from lidar data:
Mathematical relationships may be developed using regression models or other statistical methods
The relationships can then be applied to the lidar grid metrics to generate spatially-explicit estimated forest inventory attribute maps
If one is interested in pursuing a modeling objective with lidar technology, careful consideration must be given to the cost and commitment of collecting appropriate field data. Field data is best collected within one growing season of the lidar data, so as to create valid statistical models that represent the relationship between the two data sets with minimal error.
Disseminating Lidar Data and Derivatives
Regardless of the level of processing you complete you will need to consider making the data available to the land resource specialist within your forest or region. At the current moment there is no protocol for disseminating lidar data products within the Forest Service. Region 6 has taken the approach of putting the BE surface model and CSM and their associated hillshades (visualization products) on their regional server and disseminating the canopy structure products on a case-by-case basis. Regardless of the dissemination strategy you decide upon, the key is to ensure that Forest Service personnel are aware of the data products and can easily obtain them to incorporate the data into their land management projects. Disseminating the lidar data products is an important part of the overall process and should
9 | RSAC-10032-MAN 1
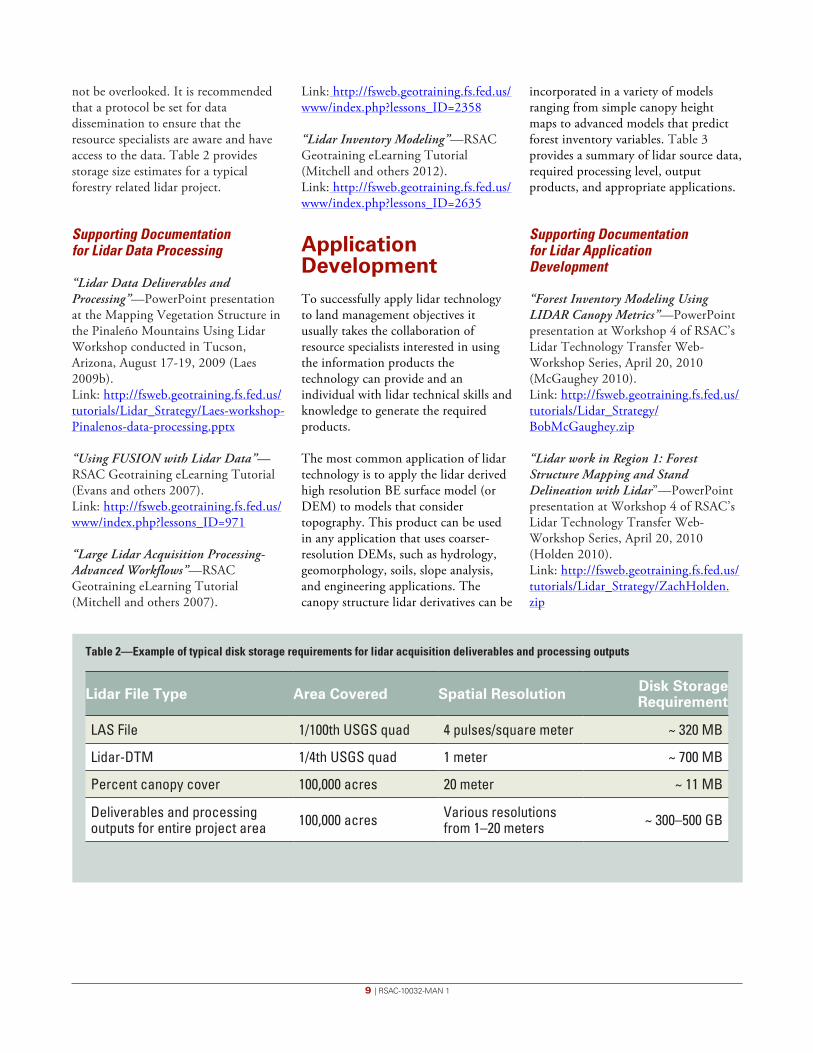
not be overlooked. It is recommended that a protocol be set for data dissemination to ensure that the resource specialists are aware and have access to the data. Table 2 provides storage size estimates for a typical forestry related lidar project.
Supporting Documentation for Lidar Data Processing
“Lidar Data Deliverables and Processing”—PowerPoint presentation at the Mapping Vegetation Structure in the Pinaleño Mountains Using Lidar Workshop conducted in Tucson, Arizona, August 17-19, 2009 (Laes 2009b). Link: http://fsweb.geotraining.fs.fed.us/tutorials/Lidar_Strategy/Laes-workshop-Pinalenos-data-processing.pptx
“Using FUSION with Lidar Data”—RSAC Geotraining eLearning Tutorial (Evans and others 2007). Link: http://fsweb.geotraining.fs.fed.us/www/index.php?lessons_ID=971
“Large Lidar Acquisition Processing-Advanced Workflows”—RSAC Geotraining eLearning Tutorial (Mitchell and others 2007).
Lidar File Type Area Covered Spatial Resolution Disk Storage Requirement
LAS File 1/100th USGS quad 4 pulses/square meter ~ 320 MB
Lidar-DTM 1/4th USGS quad 1 meter ~ 700 MB
Percent canopy cover 100,000 acres 20 meter ~ 11 MB
Deliverables and processing outputs for entire project area 100,000 acres Various resolutions
from 1–20 meters ~ 300–500 GB
Table 2—Example of typical disk storage requirements for lidar acquisition deliverables and processing outputs
Link: http://fsweb.geotraining.fs.fed.us/www/index.php?lessons_ID=2358
“Lidar Inventory Modeling”—RSAC Geotraining eLearning Tutorial (Mitchell and others 2012). Link: http://fsweb.geotraining.fs.fed.us/www/index.php?lessons_ID=2635
Application DevelopmentTo successfully apply lidar technology to land management objectives it usually takes the collaboration of resource specialists interested in using the information products the technology can provide and an individual with lidar technical skills and knowledge to generate the required products.
The most common application of lidar technology is to apply the lidar derived high resolution BE surface model (or DEM) to models that consider topography. This product can be used in any application that uses coarser-resolution DEMs, such as hydrology, geomorphology, soils, slope analysis, and engineering applications. The canopy structure lidar derivatives can be
incorporated in a variety of models ranging from simple canopy height maps to advanced models that predict forest inventory variables. Table 3 provides a summary of lidar source data, required processing level, output products, and appropriate applications.
Supporting Documentation for Lidar Application Development
“Forest Inventory Modeling Using LIDAR Canopy Metrics”—PowerPoint presentation at Workshop 4 of RSAC’s Lidar Technology Transfer Web-Workshop Series, April 20, 2010 (McGaughey 2010). Link: http://fsweb.geotraining.fs.fed.us/tutorials/Lidar_Strategy/BobMcGaughey.zip
“Lidar work in Region 1: Forest Structure Mapping and Stand Delineation with Lidar”—PowerPoint presentation at Workshop 4 of RSAC’s Lidar Technology Transfer Web-Workshop Series, April 20, 2010 (Holden 2010). Link: http://fsweb.geotraining.fs.fed.us/tutorials/Lidar_Strategy/ZachHolden.zip

10 | RSAC-10032-MAN 1
Tabl
e 3
—Th
e ta
ble
sum
mar
izes
the
rang
e of
lida
r tec
hnol
ogy
data
sou
rces
, pro
cess
ing
leve
ls a
nd a
ppro
pria
te a
pplic
atio
ns
So
urc
e D
ata
and
*P
roce
ssin
g L
evel
Pro
cess
ing
Req
uir
ed S
oft
war
eO
utp
ut
Pro
du
cts
Ap
plic
atio
n
Lida
r poi
nt c
loud
*Bas
ic L
evel
Pr
oces
sing
Gene
rate
a ra
ster
at t
ree
leve
l cel
l size
(2.5
to 3
m)
from
the
high
est p
oint
sFU
SION
CSM
Visu
al in
terp
reta
tion
info
rmat
ion
and
view
shed
m
odel
ing
Inte
rpol
ate
grid
from
fil
tere
d gr
ound
poi
nts
Best
don
e by
ven
dor
with
Ter
raSc
an
softw
are.
Can
be d
one
with
FU
SION
in-h
ouse
.
BE
surf
ace
mod
el
Hydr
olog
y/w
ater
shed
ana
lysi
s, g
eom
orph
olog
y,
flood
map
ping
, for
estry
, arc
heol
ogy,
trai
ls
map
ping
, tra
nspo
rtatio
n
Poin
t clo
ud a
nd B
E su
rface
mod
el*M
oder
ate
Leve
l Pr
oces
sing
Nor
mal
ize li
dar p
oint
cl
oud
to th
e gr
ound
su
rface
FUSI
ONCH
MFo
rest
ry (c
anop
y st
ruct
ure)
—St
ruct
ure
extra
ctio
n (b
uild
ings
, roa
ds)
Calc
ulat
e pe
rcen
t of f
irst
retu
rns
abov
e a
certa
in
heig
ht b
reak
FUSI
ONPe
rcen
t can
opy
cove
r In
dica
tion
of o
penn
ess
of s
tand
can
opy,
hab
itat
mod
elin
g, s
tream
sha
ding
CSM
*Mod
erat
e Le
vel
Proc
essi
ng
Stan
dard
dev
iatio
n of
ou
ter c
anop
y su
rface
ca
lcul
ated
at c
anop
y le
vel
ArcG
IS &
FUS
ION
O
uter
can
opy
roug
hnes
s m
odel
Fore
stry
—Ev
enne
ss o
f sta
nd o
uter
sur
face
in
form
atio
n—po
tent
ial s
ucce
ssio
n in
form
atio
n w
hen
com
bine
d w
ith C
HM a
nd h
abita
t m
odel
ing
Poin
t clo
ud a
nd B
E su
rface
mod
el*M
oder
ate
Leve
l Pr
oces
sing
Grid
met
ric c
alcu
latio
ns
at c
anop
y le
vel (
25 to
30
m)
FUSI
ON
Stat
istic
al s
umm
arie
s of
th
e lid
ar p
oint
clo
ud fo
r ea
ch g
rid c
ell i
nclu
ding
he
ight
dis
tribu
tions
, de
nsiti
es, p
erce
nt c
over
, ro
ughn
ess,
and
vol
ume
para
met
ers
Fore
st v
ertic
al s
truct
ure—
Indi
vidu
al m
etric
s ha
ve li
mite
d ap
plic
atio
ns b
y th
emse
lves
, but
be
com
e th
e in
put p
aram
eter
s fo
r pro
ject
-wid
e m
odel
ing
afte
r rel
atio
nshi
ps a
re m
odel
ed fr
om
com
bini
ng th
e fie
ld p
lots
with
thei
r poi
nt c
loud
eq
uiva
lent
s
Fiel
d da
ta a
nd li
dar
plot
met
rics
*Adv
ance
d Le
vel
Proc
essi
ng
Regr
essi
on a
naly
sis
Stat
istic
al s
oftw
are
(R)
Regr
essi
on e
quat
ions
Equa
tions
hav
e lim
ited
mer
its o
n th
eir o
wn;
to
be
used
in c
ombi
natio
n w
ith th
e eq
uiva
lent
de
rived
grid
met
ric p
aram
eter
s
Regr
essi
on e
quat
ions
an
d lid
ar g
ridm
etric
s*A
dvan
ced
Leve
l Pr
oces
sing
Regr
essi
on m
odel
ap
plic
atio
nAr
cGIS
Heig
ht, v
olum
e, D
BH,
dens
ity, b
asal
are
a, a
nd
biom
ass
map
s fo
r the
en
tire
stud
y ar
ea
Fore
stry
, hab
itat m
odel
ing,
fuel
s, e
tc.
Info
rmat
ion
mod
eled
for l
arge
r are
as b
y ap
plyi
ng re
gres
sion
equ
atio
ns to
the
area
usi
ng
the
grid
met
ric p
aram
eter
s as
inpu
t var
iabl
es

11 | RSAC-10032-MAN 1
“Modeling Forest Structure and Canopy Fuel Attributes Using Lidar Technology”—PowerPoint presentation presented during RSAC Technology Transfer Session, May 9, 2011 (Mitchell 2011b). Link: http://fsweb.geotraining.fs.fed.us/www/index.php?view_unit=4092
“Mapping Vegetation Structures in the Pinaleno Mountains Using Lidar—Phase 3: Forest Inventory Modeling”—Report published by RSAC (Mitchell and others 2012). Link: http://fsweb.rsac.fs.fed.us/index.php?option=com_docman&task=doc_download&gid=442&Itemid=255
“Processing DEM’s to Obtain Drainage Lines and Watersheds”—PowerPoint presentation at Workshop 3 of RSAC’s Lidar Technology Transfer Web-Workshop Series, February 23-25, 2010 (Trudell 2010). Link: http://fsweb.geotraining.fs.fed.us/tutorials/Lidar_Strategy/LiDAR_HecGeoRAS_WM.pptx
“Using Lidar to delineate stream channels in the Storrie Fire area of the Plumas and Lassen National Forest”—PowerPoint presentation at Workshop 4 of RSAC’s Lidar Technology Transfer Web-Workshop Series, April 20, 2010 (Coppoletta 2010). Link: http://fsweb.geotraining.fs.fed.us/tutorials/Lidar_Strategy/MichelleCoppoletta.zip
“Using Lidar Derivatives to Provide Improved Scenic Viewshed Models”—PowerPoint presentation at Workshop 4 of RSAC’s Lidar Technology Transfer Web-Workshop Series, April 20, 2010 (Sorgman 2010). Link: http://fsweb.geotraining.fs.fed.us/tutorials/Lidar_Strategy/NormaJoSorgman.zip
“Wayne NF Benefits from Imaging Programs”—White Paper published by the Wayne National Forest (Burk and others 2009). Link: http://fsweb.geotraining.fs.fed.us/tutorials/Lidar_Strategy/Wayne_Lidar_story.pdf
ReferencesBurk, A.; Lowery, S.; Stump, N. 2009. Wayne National Forest benefits from imaging program. White Paper published by U.S. Department of Agriculture, Forest Service, Wayne National Forest. Nelsonville, OH.
Coppoletta, M. 2010. Using lidar to delineate stream channels in the Storrie Fire area of the Plumas and Lassen National Forests. Workshop 4 in the Lidar Technology Transfer Web-Workshop Series, April 20, 2010, Salt Lake City, UT. PowerPoint presentation on file at Remote Sensing Applications Center.
Evans, J.S.; Hudak, A.T.; Faux, R.; Smith, A.M.S. 2009. Discrete return lidar in natural resources: recommendations for project planning, data processing, and deliverables. Remote Sens. 1(4): 776–794.
Evans, D.; Laes, D.; Mitchell, B. 2008. Introduction to FUSION, view and analyze lidar data [eLearning Tutorial]. U.S. Forest Service Remote Sensing Application Center [online]. Available: http://fsweb.geotraining.fs.fed.us/www/index.php?view_unit=3365 [October 30, 2012].
Gatziolis, D.; Andersen, H. 2008. A guide to lidar data acquisition and processing for the forests of the Pacific Northwest. Gen. Tech. Rep. PNW-GTR-768. Portland, OR: U.S. Department of Agriculture, Forest Service, Pacific Northwest Research Station. 32 p.
Goetz, W.; Laes, D.; Maus, P.; Lachowski, H.; Evans, D. 2005. Introduction to lidar [eLearning Tutorial]. U.S. Forest Service Remote Sensing Application Center Website [online]. Available: http://fsweb.geotraining.fs.fed.us/www/index.php?view_unit=3364 [October 30, 2012].
Holden, Z. 2010. Lidar work in Region 1: Forest structure mapping and stand delineation with lidar. Workshop 4 in the Lidar Technology Transfer Web-Workshop Series, April 20, 2010, Salt Lake City, UT. PowerPoint presentation on file at Remote Sensing Applications Center.
Laes, D. 2009a. Lidar data acquisition and quality assessment—Pinaleño Mountains, Az. Mapping Vegetation Structure in the Pinaleño Mountains Using Lidar Workshop, August 17-19, 2009, Tucson, AZ. PowerPoint presentation on file at Remote Sensing Applications Center.
Laes, D. 2009b. Lidar data deliverables and processing. Mapping Vegetation Structure in the Pinaleño Mountains Using Lidar Workshop, August 17-19, 2009, Tucson, AZ. PowerPoint presentation on file at Remote Sensing Applications Center.
Laes, D.; Mellin, T.; Wilcox, C.; Anhold, J.; Maus, P.; Falk, D.A.; Koprowski, J.; Drake, S.; Dale, S.; Fisk, H.; Joria, P.; Lynch, A.M.; Alanen, M. 2009. Mapping vegetation structure in the Pinaleño Mountains using lidar. RSAC-0118-RPT1. Salt Lake City, UT: U.S. Department of Agriculture, Forest Service, Remote Sensing Applications Center. 84 p.
Laes, D.; Mitchell, B.; Dale, S.; Trudell, R.A.; Maus, P.; Fisk, H. 2010a. Lidar project time line overview. Workshop 2 in the Lidar Technology Transfer Web-Workshop Series, January 26, 2010, Salt Lake City, UT. PowerPoint presentation on file at Remote Sensing Applications Center.
Laes, D.; Reutebuch, S.; McGaughey, B.; Maus, P.; Mellin, T.; Wilcox, C.; Anhold. J.; Finco, M.; Brewer, K. 2008. Practical lidar acquisition considerations for forestry applications. RSAC-0111-BRIEF1. Salt Lake City, UT: U.S. Department of Agriculture, Forest Service, Remote Sensing Applications Center. 7 p.
Laes, D.; Trudell, R.A.; Mitchell, B.; Dale, S.; Maus, P.; Fisk, H. 2010b. Lidar technology project planning. Workshop 2 in the Lidar Technology Transfer Web-Workshop Series, January 26, 2010, Salt Lake City, UT. PowerPoint presentation on file at Remote Sensing Applications Center.
McGaughey, R. 2012. FUSION/LDV: software for lidar data analysis and visualization. Version 3.21. Seattle, WA: U.S. Department of Agriculture, Forest Service, Pacific Northwest Research Station [online]. Available: http://forsys.cfr.washington.edu/fusion/FUSION_manual.pdf [October 30, 2012].
McGaughey, R. 2010. Forest inventory modeling using lidar canopy metrics. Workshop 4 in the Lidar Technology Transfer Web-Workshop Series, April 20, 2010, Salt Lake City, UT. PowerPoint presentation on file at Remote Sensing Applications Center.

12 | RSAC-10032-MAN 1
For additional information, contact:
Haans Fisk, RSEAT Program Leader Remote Sensing Evaluation, Applications & Training Remote Sensing Applications Center 2222 West 2300 South Salt Lake City, UT 84119
phone: (801) 975-3750 e-mail: [email protected]
This publication can be downloaded from the RSAC Web site: http://fsweb.rsac.fs.fed.us
The Forest Service, United States Department of Agriculture (USDA), has developed this information for the guidance of its employees, its contractors, and its cooperating Federal and State agencies and is not responsible for the interpretation or use of this information by anyone except its own employees. The use of trade, firm, or corporation names in this document is for the information and convenience of the reader. Such use does not constitute an official evaluation, conclusion, recommendation, endorsement, or approval by the Department of any product or service to the exclusion of others that may be suitable.
The U.S. Department of Agriculture (USDA) prohibits discrimination in all its programs and activities on the basis of race, color, national origin, age, disability, and, where applicable, sex, marital status, familial status, parental status, religion, sexual orientation, genetic information, political beliefs, reprisal, or because all or part of an individual’s income is derived from any public assistance program. (Not all prohibited bases apply to all programs.) Persons with disabilities who require alternative means for communication of program information (Braille, large print, audiotape, etc.) should contact USDA’s TARGET Center at (202) 720–2600 (voice and TDD). To file a complaint of discrimination, write to USDA, Director, Office of Civil Rights, 1400 Independence Avenue, S.W., Washington, D.C. 20250–9410, or call (800) 795–3272 (voice) or (202) 720–6382 (TDD). USDA is an equal-opportunity provider and employer.
Mellin, T.; Anhold, J. 2009. Lidar acquisition – mapping vegetation structure in the Pinaleño Mountains using lidar. Mapping Vegetation Structure in the Pinaleño Mountains Using Lidar Workshop, August 17-19, 2009, Tucson, AZ. PowerPoint presentation on file at Remote Sensing Applications Center.
Mitchell, B.; Laes, D.; Evans, D. 2010. Large lidar acquisition processing-advanced workflows [eLearning Tutorial]. U.S. Forest Service Remote Sensing Application Center Website [online]. Available http://fsweb.geotraining.fs.fed.us/www/index.php?lessons_ID=2358 [March 23, 2012].
Mitchell, B.; Laes, D.; Dale, S.; Trudell, R.A.; Maus, P.; Fisk, H. 2011a. Overview of lidar technology and FUSION software. Phase III Pinaleño Lidar Workshop, August 30, 2011, Tucson, AZ. PowerPoint presentation on file at Remote Sensing Applications Center.
Mitchell, B.; Walterman, M.; Mellin, T.; Wilcox, C.; Lynch, A.M.; Anhold, J.; Falk, D.A.; Koprowski, J.; Laes, D.; Evans, D.; Fisk, H. 2011b. Modeling Forest Structure and Canopy Fuel Attributes Using Lidar Technology. RSAC Technology Transfer presentation May 9, 2011, Salt Lake City, UT. PowerPoint presentation on file at Remote Sensing Applications Center.
Mitchell, B.; Walterman, M.; Mellin, T.; Wilcox, C.; Lynch, A.M.; Anhold, J.; Falk, D.A.; Koprowski, J.; Laes, D.; Evans, D.; Fisk, H. 2012. Mapping vegetation structure in the Pinaleño Mountains using lidar—phase 3: forest inventory modeling. RSAC-10007-RPT1. Salt Lake City, UT: U.S. Department of Agriculture, Forest Service, Remote Sensing Applications Center. 17 p.
Sorgman, N. 2010. Using lidar derivatives to provide improved scenic viewshed models. Workshop 4 in the Lidar Technology Transfer Web-Workshop Series, April 20, 2010, Salt Lake City, UT. PowerPoint presentation on file at Remote Sensing Applications Center.
Trudell, R. 2010. Processing DEMs to obtain drainage lines and watersheds. Workshop 4 in the Lidar Technology Transfer Web-Workshop Series, April 20, 2010, Salt Lake City, UT. PowerPoint presentation on file at Remote Sensing Applications Center.

13 | RSAC10032-MAN 1-Appendix
Appendix 1: Remote Sensing Regional Coordinators Contact Information
Region Remote Sensing Coordinator E-mail Phone Number
1 Steve Brown [email protected] (406) 329-3514
2 Melinda McGann [email protected] (303) 275-5211
3 Thomas Mellin [email protected] (505) 842-3845
4 Sanford Moss [email protected] (801) 625-5219
5 Carlos Ramirez [email protected] (916) 640-1275
6 Jim Muckenhoupt (acting) [email protected] (503) 808-2857
8 Renee Jacokes-Mancini [email protected] (404) 347-2588
9 Dan Wendt [email protected] (414) 297-3381
R10 Mark Riley [email protected] (907) 586-8759