guide for texas instruments ti-86 graphing...
TRANSCRIPT

Copyright © Houghton Mifflin Company. All rights reserved. B-1
Part B
Guide for Texas Instruments TI-86 Graphing Calculator This Guide is designed to offer step-by-step instruction for using your TI-86 graphing calculator with the third edition of Calculus Concepts: An Informal Approach to the Mathematics of Change. A technology icon next to a particular example or discussion in the text directs you to a specific portion of this Guide. You should also utilize the table of contents in this Guide to find specific topics on which you need instruction. Setup Instructions
Before you begin, check the TI-86 setup and be sure the settings described below are chosen. When- ever you use this Guide, we assume (unless instructed otherwise) that your calculator settings are as shown in Figures 1, 2, and 3.
• Press 2nd MORE (MODE) and choose the settings shown in Figure 1 for the basic setup.
• Check the window format by pressing GRAPH MORE F3 (FORMT) and choose the settings shown in Figure 2.
! If you do not have the darkened choices shown in Figure 1 and Figure 2, use the arrow keys to move the blinking cursor over the setting you want to choose and press ENTER .
! Return to the home screen with EXIT or 2nd EXIT (QUIT). Note that EXIT
EXIT clears the menus from the bottom of the screen.
• Specify the statistical setup as shown in Figure 3 by pressing 2nd − (LIST) F5 [OPS] MORE
MORE MORE F3 [SetLE] ALPHA 7 (L) 2 , ALPHA 7 (L) 2 , ALPHA 7 (L) 3 , ALPHA
7 (L) 4 , ALPHA 7 (L) 5 , ENTER . You need this setup for some of the programs referred to in this Guide to execute properly.
TI-86 Basic Setup TI-86 Window Setup TI-86 Statistical Setup
Figure 1 Figure 2 Figure 3

B-2 Chapter 1
Copyright © Houghton Mifflin Company. All rights reserved.
Basic Operation
You should be familiar with the basic operation of your calculator. With your calculator in hand, go through each of the following.
1. CALCULATING You can type in lengthy expressions; just make sure that you use parentheses when you are not sure of the calculator's order of operations. Always enclose in parentheses any numerators and denominators of fractions and powers that consist of more than one term.
Evaluate 1
4 15 8957
* +. Enclose the denominator in parentheses so
that the addition is performed before the division into 1. It is not necessary to use parentheses around the fraction 895/7.
Evaluate ( 3).
4− −+
58 1456
≈ 8.037. Use (−) for the negative symbol and −
for the subtraction sign. To clear the home screen, press CLEAR .
NOTE: The numerator and denominator must be enclosed in parentheses and −34 ≠ (−3)4.
Now, evaluate e3*0.027 and e3*0.027. Type e^ with 2nd LN (ex).
The TI-86 will assume you mean e3*0.027 unless you use paren-theses around the two values in the exponent to indicate e3*0.027.
2. USING THE ANS MEMORY Instead of again typing an expression that was just evaluated, use the answer memory by pressing 2nd (−) (ANS).
Calculate 1
4 15 8957
1
* +
FHGG
IKJJ
−
using this nice shortcut.
Type Ans-1 by pressing 2nd (−) (ANS) 2nd EE (x−1).
3. ANSWER DISPLAY When the denominator of a fraction has no more than three digits, your calculator can provide the answer in the form of a fraction. When an answer is very large or very small, the calculator displays the result in scientific notation.
The �to a fraction� key is obtained by pressing 2nd ! (MATH)
F5 [MISC] MORE F1 [!Frac].
The calculator�s symbol for times 1012 is E12. Thus, 7.945E12 means 7,945,000,000,000.
The result 1.4675E−6 means 1.4675*10−6, which is the scientific notation expression for 0.0000014675.

TI-86 Guide B-3
Copyright © Houghton Mifflin Company. All rights reserved.
4. STORING VALUES It may be beneficial to store numbers or expressions for later recall. To store a number, type it, press STO!!!! (note that the cursor changes to the alphabetic cursor A ), press the key corresponding to the capital letter(s) naming the storage location, and then press ENTER . To join several short commands together, use 2nd . ( : ) between the statements.
Note that when you join statements with a colon, only the value of the last statement is shown.
WARNING: The STO!!!! key locks the upper-case alphabetic cursor and ALPHA unlocks it. Always look at the screen when you are typing to be certain that you are not entering numbers when you intend to type letters and vice-versa.
Store 5 in A and 3 in B, and then calculate 4A � 2B. (Press ALPHA
to return to the regular cursor.) To recall a value, press ALPHA ,
type the letter in which the value is stored, and then press ENTER .
• Storage location names on the TI-86 can be from one to eight characters long, but they must begin with a letter. You cannot name what you are storing with the exact name the TI-86 already uses for a built-in variable (such as LOG).
• Whatever you store in a particular memory location stays there until it is replaced by some-thing else either by you or by executing a program containing that name.
NOTE: The TI-86 allows you to enter upper and lower case letters, and it distinguishes between them. For instance, VOL, Vol, VOl, vol, voL, and so forth are all different names to the TI-86. To type a lower case letter, press 2nd ALPHA before pressing a letter key (note that the cursor
changes to a ). If you cannot remember which combination of upper- and lower-case letters you
used for a name, press 2nd CUSTOM [CATLG-VARS] F2 [ALL] and then press the key of the
first letter of the name. Use ▼ to move the cursor next to the name and then press ENTER . 5. ERROR MESSAGES When your input is incorrect, the TI-86 displays an error message.
If you have more than one command on a line without the commands sepa-rated by a colon (:), an error message results when you press ENTER .
• When you get an error message, press F1 [Goto] to position the cursor to where the error
occurred so that you can correct the mistake or choose F5 [Quit] to begin a new line on the home screen. When you are executing a program, you should always choose the 1: Quit option upon receiving an error message. Choosing 2: Goto will call up the program code, and you may inadvertently change the program so that it will not properly execute.
A common mistake is using the negative symbol (−) instead of
the subtraction sign − or vice-versa. The TI-86 does not give an error message, but a wrong answer results. The negative sign is shorter and raised slightly more than the subtraction sign.

B-4 Copyright © Houghton Mifflin Company. All rights reserved.
Chapter 1 Ingredients of Change: Functions and Linear Models
1.1 Models, Functions, and Graphs Graphing a function in an appropriate viewing window is one of the many uses for a function that is entered in the calculator�s graphing list. Because you must enter a function formula on one line (that is, you cannot write fractions and exponents the same way you do on paper), it is very important to have a good understanding of the calculator�s order of operations and to use parentheses whenever they are needed. NOTE: If you are not familiar with the basic operation of the TI-83, you should work through pages A-1 through A-3 of this Guide before proceeding with this material.
1.1.1a ENTERING AN EQUATION IN THE GRAPHING LIST The graphing list contains space for 99 equations (if memory is available), and the output variables are called by the names y1, y2, ..., y99. To graph an equation, enter it in the graphing list. You must use x as the input variable if you intend to draw the graph of the equation or use the TI-86 table. We illustrate graphing using the equation in Example 3 of Section 1.1: v(t) = 3.622(1.093t).
Press GRAPH F1 [y(x)=] to access the graphing list.
If there are any previously entered equations that you will no longer use, delete them from the graphing list with F4 [DELf].
To clear, but not delete, the location of an equation in the y(x)= list, position the cursor on the line with the equation and press CLEAR .
For convenience, we use the first, or y1, location in the list. We intend to graph this equation, so the input variable must be called x, not t. Enter the right-hand side of the equation, 3.622(1.093x), with 3 . 6 2 2 ( 1 . 0 9 3 ^ x-VAR )
You should use the x-VAR key for x, not the times sign key,
! , nor the capital letter X obtained with ALPHA + (X).
CAUTION: Plot1, Plot2, and Plot3 at the top of the y(x)= list should not be darkened when you are graphing an equation and not graphing data points. If any of these is darkened, use ▲
until you are on the darkened plot name. Press ENTER to make the name(s) not dark (that is, to deselect the plot). If you do not do this, you may receive a STAT PLOT error message.
1.1.1b DRAWING A GRAPH As is the case with most applied problems in Calculus Concepts,
the problem description indicates the valid input interval. Consider Example 3 of Section 1.1: The value of a piece of property between 1985 and 2005 is given by v(t) = 3.622(1.093t) thousand dollars where t is the number of years since the end of 1985.
The input interval is 1985 (t = 0) to 2005 (t = 20). Before drawing the graph of v on this inter-val, enter the v(t) equation in the y(x)= list using x as the input variable. (See Section 1.1.1a of this Guide.) We now draw the graph of the function v for x between 0 and 20.

TI-86 Guide B-5
Copyright © Houghton Mifflin Company. All rights reserved.
Press GRAPH F2 [WIND] to set the view for the graph. Enter 0 for xMin and 20 for xMax. (For 10 tick marks between 0 and 20, enter 2 for Xscl. If you want 20 tick marks, enter 1 for xScl, etc. xScl does not affect the shape of the graph.
xMin and xMax are, respectively, the settings of the left and right edges of the viewing screen, and yMin and yMax are, respectively, the settings for the lower and upper edges of the viewing screen. xScl and yScl set the spacing between the tick marks on the x- and y-axes. (Leave xRes set to 1 for all applications in this Guide.) We now set the values to determine the output view.
To have the TI-86 determine the output view, press F3 [ZOOM] MORE F1
[ZFIT] ENTER .
Note that any vertical line drawn on this graph intersects it in only one point, so the graph does represent a function. ( CLEAR removes the menu from the bottom of the screen if you want to see the entire graphics screen.)
Press GRAPH F2 [WIND] to see the view set by ZFIT. The view has 0 ≤ x ≤ 20 and 3.622 ≤ y ≤ 21.446... . (Note that ZFIT did not change the x-values you manually set.)
We just saw how to have the TI-86 set the view for the output variable. Whenever you draw a graph, you can also manually set or change the view for the output variable.
1.1.1c MANUALLY CHANGING THE VIEW OF A GRAPH We just saw how to have the TI-86 set the view for the output variable. Whenever you draw a graph, you can also manually set or change the view for the output variable. If for some reason you do not have an acceptable view of a graph or if you do not see a graph, change the view for the output variable with one of the ZOOM options or manually set the window until you see a good graph. (We will later discuss other ZOOM options.) We continue using the function v that is given in Example 3 of Section 1.1, but here assume that you have not yet drawn the graph of v.
Press GRAPH F2 [WIND], enter 0 for xMin and 20 for xMax, and (assuming we do not know what is the vertical view), enter some arbitrary values for yMin and yMax. (The graph to the right was drawn with yMin = −5 and yMax = 5.) Press F5 [GRAPH].
Evaluating Outputs on the Graphics Screen: First, press F4 [TRACE]. Recall we are given that the input is between 0 and 20. If you now type the number that you want to substitute in the function whose graph is drawn, say 0, you see the screen to the right. A 1 appears at the top of the screen because the equation of the function whose graph you are drawing is in y1.
Press ENTER and the input value is substituted in the function. The input and output values are shown at the bottom of the screen. (This method works even if you do not see any of the graph on the screen.)

B-6 Chapter 1
Copyright © Houghton Mifflin Company. All rights reserved.
Substitute the right endpoint of the input interval into the function by pressing 20 ENTER . We see that two points on this function are approximately (0, 3.622) and (20, 21.446).
Press GRAPH F2 [WIND], enter 3.5 for yMin and 22 for yMax,
and press F5 [GRAPH]. If the graph you obtain is not a good view of the function, repeat the above process using x-values that are in between the two endpoints in order to see if the output range should be extended in either direction. (Note that the choice of the values 3.5 and 22 was arbitrary. Any values close to the outputs in the points you find are also acceptable.)
NOTE: Instead of using TRACE with the exact input to evaluate outputs on the graphics screen, you could use the TI-86 TABLE or evaluate the function at 0 and 20 on the home screen. We next discuss using these features.
1.1.1d TRACING TO ESTIMATE OUTPUTS You can display the coordinates of certain points
on the graph by tracing. Unlike the substitution feature of TRACE that was discussed on the previous page, the x-values that you see when tracing the graph depend on the horizontal view that you choose. The output values that are displayed at the bottom of the screen are calcu-lated by substituting the x-values into the equation that is being graphed. We again assume that you have the function v(x) = 3.622(1.093x) entered in the y1 location of the y(x)= list.
With the graph on the screen, press F4 [TRACE], press and
hold ► to move the trace cursor to the right, and press and
hold ◄ to move the trace cursor to the left.
• Again note that the number corresponding to the location (in the y(x)= list) of the equation that you are tracing appears in the top right corner of the graphics screen.
Trace past one edge of the screen and notice that even though you cannot see the trace cursor, the x- and y-values of points on the line are still displayed at the bottom of the screen. Also note that the graph scrolls to the left or right as you move the cursor past the edge of the current viewing screen.
Use either ► or ◄ to move the cursor near x = 15. We estimate that y is approximately 13.8 when x is about 15.
It is important to realize that trace outputs should never be given as answers to a problem unless the displayed x-value is identically the same as the value of the input variable.
1.1.1e EVALUATING OUTPUTS ON THE HOME SCREEN The input values used in the eval-
uation process are actual values, not estimated values such as those that are generally obtained by tracing near a certain value. Actual values are also obtained when you evaluate outputs from the graphing screen using the process that was discussed in Section 1.1.3 of this Guide.
We again consider the function v(t) = 3.622(1.093t) that is in Example 3 of Section 1.1.

TI-86 Guide B-7
Copyright © Houghton Mifflin Company. All rights reserved.
Using x as the input variable, enter y1 = 3.622(1.093^ x). Return to the home screen by pressing 2nd EXIT (QUIT). Substitute
15 into the function with 2nd ALPHA (alpha) 0 (Y) 1 ( 15 )
Find the value by pressing ENTER .
NOTE: You do not have to have the closing parenthesis on the right if nothing else follows it. To choose another graphing list location, say y2, just type the number corresponding to that function�s location, 2, following the lower-case y. WARNING: You must use a lower case, not upper case, y in order for the TI-86 to recognize the function in the graphing list. You must also use a lower-case x for the x-variable.
To now evaluate the function at other inputs, first recall the previous entry with 2nd ENTER (ENTRY). Then edit the expression to the new value.
For instance, press 2nd ENTER (ENTRY), change 15 to 20 by
pressing ◄ ◄ ◄ and typing 20, and then press ENTER to evaluate the function at x = 20. Evaluate y1 at x = 0 by recalling the previous entry with 2nd ENTER (ENTRY), change 20 to 0
with ◄ ◄ ◄ DEL , and then press ENTER .
1.1.1f EVALUATING OUTPUTS USING THE TABLE Function outputs can be determined by
evaluating on the graphics screen, as discussed in Section 1.1.1c, or by evaluating on the home screen as discussed in Section 1.1.1e of this Guide. You can also evaluate functions using the TI-86 TABLE. When you use the table, you can either enter specific input values and find the outputs or generate a list of input and output values in which the inputs begin with a value called TblStart and differ by a value called ∆Tbl.
Let�s use the TABLE to evaluate the function v(t) = 3.622(1.093t) at t = 15. Even though you can use any of the function locations, we again choose to use y1. Press GRAPH F1 [y(x)=], clear the function locations, and enter 3.622(1 .093^ x) in location y1 of the y(x)= list.
After entering the function v in y1, choose the TABLE SETUP menu by pressing TABLE F2 [TBLST]. To generate a list of values beginning with 13 such that the table values differ by 1, enter 13 in the TblStart location and 1 in the ∆Tbl location. Then choose AUTO in the Indpnt: location by having the cursor on that word and pressing ENTER .
Press F1 [TABLE], and observe the list of input and output
values. Notice that you can scroll through the table with ▼ ,
▲ , ◄ , and/or ► .
• The table values may be rounded in the table display. You can see more of the output by highlighting a particular value and viewing more decimal places at the bottom of the screen.

B-8 Chapter 1
Copyright © Houghton Mifflin Company. All rights reserved.
Return to the table set-up screen with F1 [TBLST]. To compute specific outputs rather than a list of values, choose ASK in the Indpnt: location. Press ENTER . (Note that when using ASK, the settings for TblStart and ∆Tbl do not matter.)
Press F1 [TABLE], type in the x-value(s) at which the function
is to be evaluated, and press ENTER . Unwanted entries or
values from a previous problem can be cleared with DEL .
NOTE: If you are interested in evaluating a function at inputs that are not evenly spaced and/ or you only need a few outputs, you should use the ASK feature of the table instead of AUTO.
1.1.1g FINDING INPUT VALUES USING THE SOLVER Your calculator solves for the input
values of any equation that is in the form "expression = constant". This means that all terms involving the variable must be on one side of the equation and constant terms must be on the other side before you enter the equation into the calculator. The expression can, but does not have to, use x as the input variable.
The TI-86 offers several methods of solving for input variables. We first illustrate using the SOLVER. (Solving using graphical methods will be discussed after using the SOLVER is explored.) You can refer to an equation that you have already entered in the y(x)= list or you can enter the equation in the solver.
Return to the home screen with 2nd EXIT (QUIT). Access
the solver by pressing 2nd GRAPH (SOLVER). If there are no equations stored in the solver, you will see the screen displayed on the right − or
− if the solver has been previously used, you will see a screen similar to the one shown on the right. If this is the case, press ▲ until only the eqn: line is on the screen and CLEAR to
delete the old equation. You should then have the screen that is shown in the previous step.
Let�s now use the solver to answer the question in part e of Example 3 in Section 1.1: �When did the land value reach $20,000?� Because the land value is given by v(t) = 3.622(1.093t) thousand dollars where t is the number of years after the end of 1985, we are asked to solve the equation 3.622(1.093t) = 20. That is, we are asked to find the input value t that makes this equation a true statement.
If you already have y1 = 3.622(1.093^ x) in the graphing list, you can refer to the function as y1 in the SOLVER. (Note that y1 can be entered by pressing the F-key under its location in the menu at the bottom of the screen.) If not, enter 3.622(1.093^ x) instead of y1 in the eqn: location. Press ENTER . Enter 20 in the exp: location under y1 to tell the TI-86 the rest of the equation.
TI-86 Guide B-9
Copyright © Houghton Mifflin Company. All rights reserved.
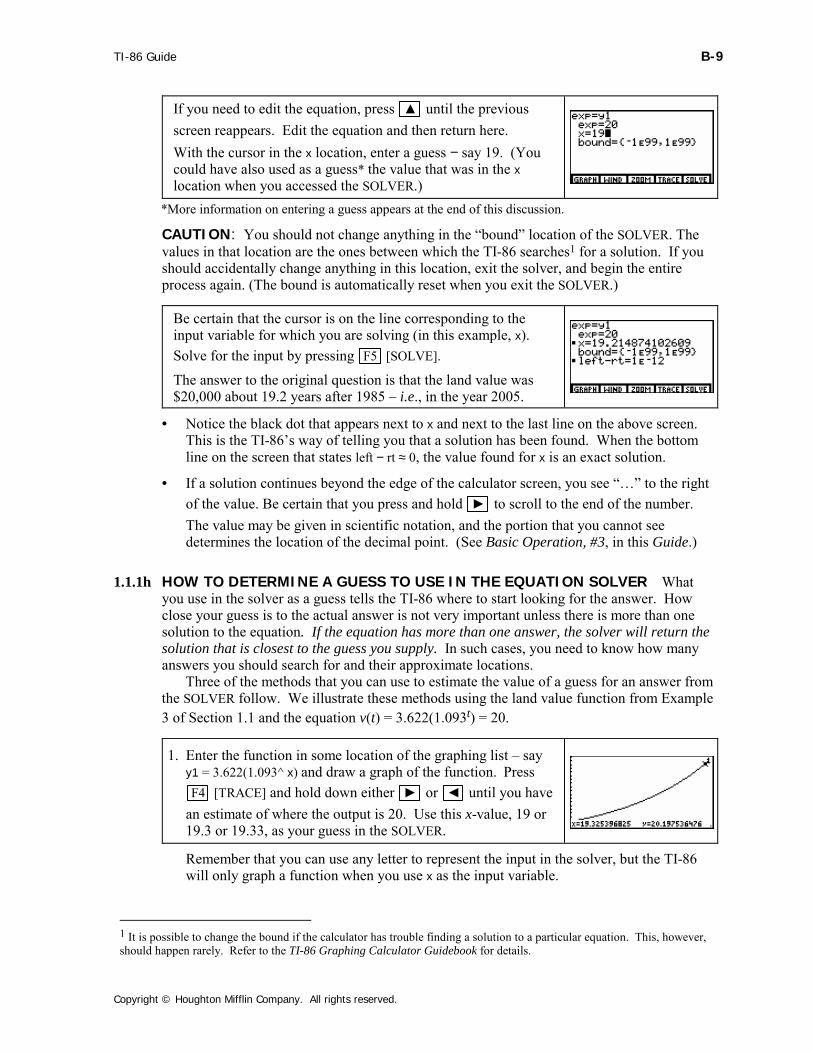
If you need to edit the equation, press ▲ until the previous screen reappears. Edit the equation and then return here. With the cursor in the x location, enter a guess − say 19. (You could have also used as a guess* the value that was in the x location when you accessed the SOLVER.)
*More information on entering a guess appears at the end of this discussion.
CAUTION: You should not change anything in the �bound� location of the SOLVER. The values in that location are the ones between which the TI-86 searches1 for a solution. If you should accidentally change anything in this location, exit the solver, and begin the entire process again. (The bound is automatically reset when you exit the SOLVER.)
Be certain that the cursor is on the line corresponding to the input variable for which you are solving (in this example, x). Solve for the input by pressing F5 [SOLVE].
The answer to the original question is that the land value was $20,000 about 19.2 years after 1985 � i.e., in the year 2005.
• Notice the black dot that appears next to x and next to the last line on the above screen. This is the TI-86�s way of telling you that a solution has been found. When the bottom line on the screen that states left − rt ≈ 0, the value found for x is an exact solution.
• If a solution continues beyond the edge of the calculator screen, you see ��� to the right of the value. Be certain that you press and hold ► to scroll to the end of the number. The value may be given in scientific notation, and the portion that you cannot see determines the location of the decimal point. (See Basic Operation, #3, in this Guide.)
1.1.1h HOW TO DETERMINE A GUESS TO USE IN THE EQUATION SOLVER What
you use in the solver as a guess tells the TI-86 where to start looking for the answer. How close your guess is to the actual answer is not very important unless there is more than one solution to the equation. If the equation has more than one answer, the solver will return the solution that is closest to the guess you supply. In such cases, you need to know how many answers you should search for and their approximate locations.
Three of the methods that you can use to estimate the value of a guess for an answer from the SOLVER follow. We illustrate these methods using the land value function from Example 3 of Section 1.1 and the equation v(t) = 3.622(1.093t) = 20.
1. Enter the function in some location of the graphing list � say y1 = 3.622(1.093^ x) and draw a graph of the function. Press F4 [TRACE] and hold down either ► or ◄ until you have
an estimate of where the output is 20. Use this x-value, 19 or 19.3 or 19.33, as your guess in the SOLVER.
Remember that you can use any letter to represent the input in the solver, but the TI-86 will only graph a function when you use x as the input variable.
1 It is possible to change the bound if the calculator has trouble finding a solution to a particular equation. This, however, should happen rarely. Refer to the TI-86 Graphing Calculator Guidebook for details.

B-10 Chapter 1
Copyright © Houghton Mifflin Company. All rights reserved.
2. Enter the left- and right-hand sides of the equation in two dif-ferent locations of the y(x)= list � say y1 = 3.622(1.093^ x) and y2 = 20. With the graph on the screen, press F4 [TRACE] and
hold down either ► or ◄ until you get an estimate of the X-value where the curve crosses the horizontal line represent-ing 20.
3. Use the AUTO setting in the TABLE, and with ▲ or ▼scroll through the table until a value near the estimated out-put is found. Use this x-value or a number near it as your guess in the SOLVER. (Refer to Section 1.1.1f of this Guide to review the instructions for using the TABLE.)
The TI-86 lets you draw a graph from which to estimate a guess for the SOLVER from within the SOLVER. When you use this feature, you are using a combination of all three of the above methods because the calculator draws a graph of left side of equation – right side of equation at each x-value between xMin and xMax and displays the value of the difference of the two sides of the equation as you trace the graph.
Enter the SOLVER with 2nd GRAPH (SOLVER) and press
F2 [WIND]. Set window values similar to those shown to the right. (Note that some, but not all, the ZOOM options are avail-able on the menu in the SOLVER.)
Press F1 [GRAPH] and then press F4 [TRACE]. Use ► to trace the graph* to a point near the x-intercept. Notice that the value of left−rt is also given as you trace.
To bring back the menu, press EXIT . To return to the SOLVER,
press F1 [EDIT]. Note that the value of x as well as the value of left−rt in the SOLVER have been updated to the last-used TRACE values. To finish solving, press F5 [SOLVE].
*It is not easy to set a good window for this graph. However, you can still trace the graph, even if you do not see any of it on the screen. If this is the case, carefully check the left � right values to see in which direction to trace. Remember that you are looking for an input where left � right is approximately zero.
1.1.1i GRAPHICALLY FINDING INTERCEPTS Finding the input value at which the graph of
a function crosses the vertical and/or horizontal axis can be found graphically or by using the SOLVER. Remember the process by which we find intercepts: • To find the y-intercept of a function y = f(x), set x = 0 and solve the resulting equation. • To find the x-intercept of a function y = f(x), set y = 0 and solve the resulting equation.
An intercept is the where the graph crosses or touches an axis. Also remember that the x- intercept of the function y = f(x) has the same value as the root or solution of the equation f(x) = 0. Thus, finding the x-intercept of the graph of f(x) – c = 0 is the same as solving the equation f(x) = c.

TI-86 Guide B-11
Copyright © Houghton Mifflin Company. All rights reserved.
We illustrate this method with a problem similar to the one in Activity 36 in Section 1.1 of Calculus Concepts. Suppose we are asked to find the input value of f(x) = 3x � 0.8x2 + 4 that corresponds to the output f(x) = 2.3. That is, we are asked to find x such that 3x � 0.8x2 + 4 = 2.3. Because this function is not given in a context, we have no indication of an interval of input values to use when drawing the graph. So, we use the ZOOM features to set an initial view and then manually set the WINDOW until we see a graph that shows the important points of the function (in this case, the intercept or intercepts.) You can solve this equation graphically using either the x-intercept method or the intersection method. We present both, and you should use the one you prefer.
X-INTERCEPT METHOD for solving the equation f(x) – c = 0:
Press GRAPH F1 [y(x)=] and clear all locations with CLEAR . Enter the function 3x � 0.8x2 + 4 � 2.3 in y1. You can enter x2 with x-VAR x2 or enter it with x-VAR ^ 2. Remember to
use − , not (−) , for the subtraction signs.
NOTE: Whenever there are two menus at the bottom of the display screen, press EXIT to
delete the bottom menu or press 2nd before pressing the F-key you want to access a certain command in the top menu. We give instructions assuming there is only one menu.
Draw the graph with F3 [ZOOM] MORE F4 [ZDECM] or
F4 [ZSTD]. If you use the former, press F2 [WIND] and reset yMax to 5 to get a better view of the graph. (If you reset the window, press F5 [GRAPH] to draw the graph.)
To graphically find an x-intercept, i.e., a value of x at which the graph crosses the horizontal axis, press MORE F1 [MATH]
F1 [ROOT]. Press and hold ◄ until you are near, but to the
left of, the leftmost x-intercept. Press ENTER to mark the location of the left bound for the x-intercept.
Notice the small arrowhead (!!!!) that appears above the location to mark the left bound. Now press and hold ► until you are to
the right of this x-intercept. Press ENTER to mark the location of the right bound for the x-intercept.
For your �guess�, press ◄ to move the cursor near to where
the graph crosses the horizontal axis. Press ENTER .
The input of the leftmost x-intercept is displayed as x = −0.5. Note that if this process does not return the correct value for the intercept you are trying to find, you have probably not included the place where the graph crosses the axis between the two bounds (i.e., between the !!!! and """" marks on the graph.)

B-12 Chapter 1
Copyright © Houghton Mifflin Company. All rights reserved.
Repeat the above procedure to find the other x-intercept. Confirm that it occurs where x = 4.25.
INTERSECTION METHOD for solving the equation f(x) = c:
Press GRAPH F1 [y(x)=] and clear all locations with CLEAR . Enter one side of the equation, 3x � 0.8x2 + 4 in y1 and the other side of the equation 2.3, in y2.
Draw the graphs with F3 [ZOOM] MORE F4 [ZDECM] or
F4 [ZSTD]. If you use the former, press F2 [WIND] and reset yMax to 8 to get a better view of the graph. (If you reset the window, press F5 [GRAPH] to draw the graph.)
To graphically find where y1 = y2, press MORE F1 [MATH]
MORE F3 [ISECT]. Note that the number corresponding to the function�s location in the y(x)= list is shown at the top right of the screen. Press ENTER to mark the first curve.
The cursor jumps to the other function � here, the line. Note that the number corresponding to the function�s location in the y(x)= list is shown at the top right of the screen. Next, press ENTER to mark the second curve.
Next, supply a guess for the point of intersection. Use ◄ to move the cursor near the intersection point you want to find � in this case, the leftmost point. Press ENTER .
The value of the leftmost x-intercept has the x-coordinate x = −0.5. Repeat the above procedure to find the rightmost x-intercept. Confirm that it is where x = 4.25.
• Practice using each of the above methods by solving the equation 3.622(1.093x) = 20. Obtain further practice by solving the equation given above using the SOLVER.
1.1.1j SUMMARY OF ESTIMATING AND SOLVING METHODS Use the method you prefer.
When you are asked to estimate or approximate an output or an input value, you can: • Trace a graph entered in the y(x)= list (Section 1.1.1d) • Trace a graph showing values of the left � right sides of an equation
that is entered in the SOLVER (Section 1.1.1h) • Use close values obtained from the TABLE (Section 1.1.1f)
When you are asked to find or determine an output or an input value, you should: • Evaluate an output on the graphics screen (Section 1.1.1c)

TI-86 Guide B-13
Copyright © Houghton Mifflin Company. All rights reserved.
• Evaluate an output on the home screen (Section 1.1.1e) • Evaluate an output value using the table (Section 1.1.1f) • Find an input using the solver (Sections 1.1.1g, 1.1.1h) • Find an input value from the graphics screen (using the x-intercept
method or the intersection method) (Section 1.1.1i) 1.2 Constructed Functions
Your calculator can find output values of and graph combinations of functions in the same way that you do these things for a single function. The only additional information you need is how to enter constructed functions in the graphing list.
1.2.1a FINDING THE SUM, DIFFERENCE, PRODUCT, QUOTIENT, OR COMPOSITE FUNCTION Suppose that a function f has been entered in y1 and a function g has been entered in y2. Your calculator will evaluate and graph these constructed functions: Enter y1 + y2 in y3 to obtain the sum function (f + g)(x) = f(x) + g(x). Enter y1 � y2 in y4 to obtain the difference function (f – g)(x) = f(x) � g(x). Enter y1*y2 in y5 to obtain the product function (f ⋅ g)(x) = f(x) ⋅ g(x).
Enter y1/y2 in y6 to obtain the quotient function (f ÷ g)(x) = f xg x
( )( )
.
Enter y1(y2) in y7 to obtain the composite function (f o g)(x) = f(g(x)).
The functions can be entered in any location in the y(x)= list. Although the TI-86 will not give an algebraic formula for a constructed function, you can check your final answer by evaluat-ing your constructed function and the calculator-constructed function at several different points to see if they yield the same outputs.
1.2.1b FINDING A DIFFERENCE FUNCTION We illustrate this technique with the functions that are given on page 19 of Section 1.2 of Calculus Concepts: Sales = S(t) = 3.570(1.105t) million dollars and costs = C(t) = −39.2t2 + 540.1t + 1061.0 thousand dollars t years after 1996.
Press GRAPH F1 [y(x)=], and clear each previously-entered
equation with CLEAR or F4 [DELf]. Enter S in y1 with 3 .
570 ( 1 . 105 ^ x-VAR ) ENTER . Enter C in y2 with (−)
39 . 2 x-VAR x2 + 540 . 1 x-VAR + 1061 ENTER .
The difference function, the profit P(x) = S(x) � 0.001C(x) = y1 � 0.001 y2, is entered in y3 with 2nd ALPHA (alpha) 0 (y) 1
− . 001 2nd ALPHA (alpha) 0 (y) 2.
• Note that you can also type y when entering the third function in the graphing list by pressing the F-key corresponding to its position on the menu bar.
To find the profit in 1998, evaluate y3 when x = 2. You can evaluate on the home screen, the graphics screen, or in the table. We choose to use the home screen.

B-14 Chapter 1
Copyright © Houghton Mifflin Company. All rights reserved.
Return to the home screen with 2nd EXIT (QUIT). Press
2nd ALPHA (alpha) 0 (y) 3 ( 2 ) ENTER to see the result. We find that the profit in 1998 was P(2) ≈ $2.375 million.
1.2.1c FINDING A PRODUCT FUNCTION We illustrate this technique with the functions that
given on page 21 of Section 1.2 of Calculus Concepts: Milk price = M(x) = 0.007x + 1.492 dollars per gallon on the xth day of last month and milk sales = G(x) = 31 � 6.332(0.921x) gal-lons of milk sold on the xth day of last month.
Press GRAPH F1 [y(x)=], and clear each previously entered
equation with CLEAR or F4 [DELf]. Enter M in y1 using .
007 x-VAR + 1 . 492 ENTER and enter G in y2 with 31
− 6 . 332 ( . 921 ^ x-VAR ) ENTER .
Enter the product function T(x) = M(x) ⋅ G(x) = y1⋅y2 in y3 with the keystrokes 2nd ALPHA (alpha) 0 (y) 1 ! 2nd ALPHA (alpha) 0 (y) 2.
NOTE: You do not have to use ! between y1 and y2 to indicate a product function. You cannot use parentheses to indicate the product function because the TI-86 will think that you are entering y3 as a composite function.
To find milk sales on the 5th day of last month, evaluate y3 at x = 5. We choose to do this on the home screen. Return to the home screen with 2nd MODE (QUIT). Press 2nd ALPHA
(alpha) 0 (y) 3 ( 5 ) ENTER to see the result. We find that milk sales were T(5) ≈ $40.93.
1.2.2a CHECKING YOUR ANSWER FOR A COMPOSITE FUNCTION We illustrate this
technique with the functions that are given on page 23 of Section 1.2 of Calculus Concepts: altitude = F(t) = −222.22t3 + 1755.95t2 + 1680.56t + 4416.67 feet above sea level where t is the time into flight in minutes and air temperature = A(F) = 277.897(0.99984F) � 66 degrees Fahrenheit where F is the number of feet above sea level. Remember that when you enter functions in the y(x)= list, you must use x as the input variable.
Clear the functions from the y(x)= list. Enter F in y1 by pressing (−) 222 . 22 x-VAR ^ 3 + 1755 . 95 x-VAR x2 + 1680
. 56 x-VAR + 4416 . 67 ENTER . Enter A in y2 by pressing
277 . 897 ( . 99984 ^ x-VAR ) − 66 ENTER .
Enter the composite function (AoF)(x) = A(F(x)) = y2(y1) in y3 with 2nd ALPHA (alpha) 0 (y) 2 ( 2nd ALPHA (alpha) 0
(y) 1 ) ENTER .
TI-86 Guide B-15
Copyright © Houghton Mifflin Company. All rights reserved.
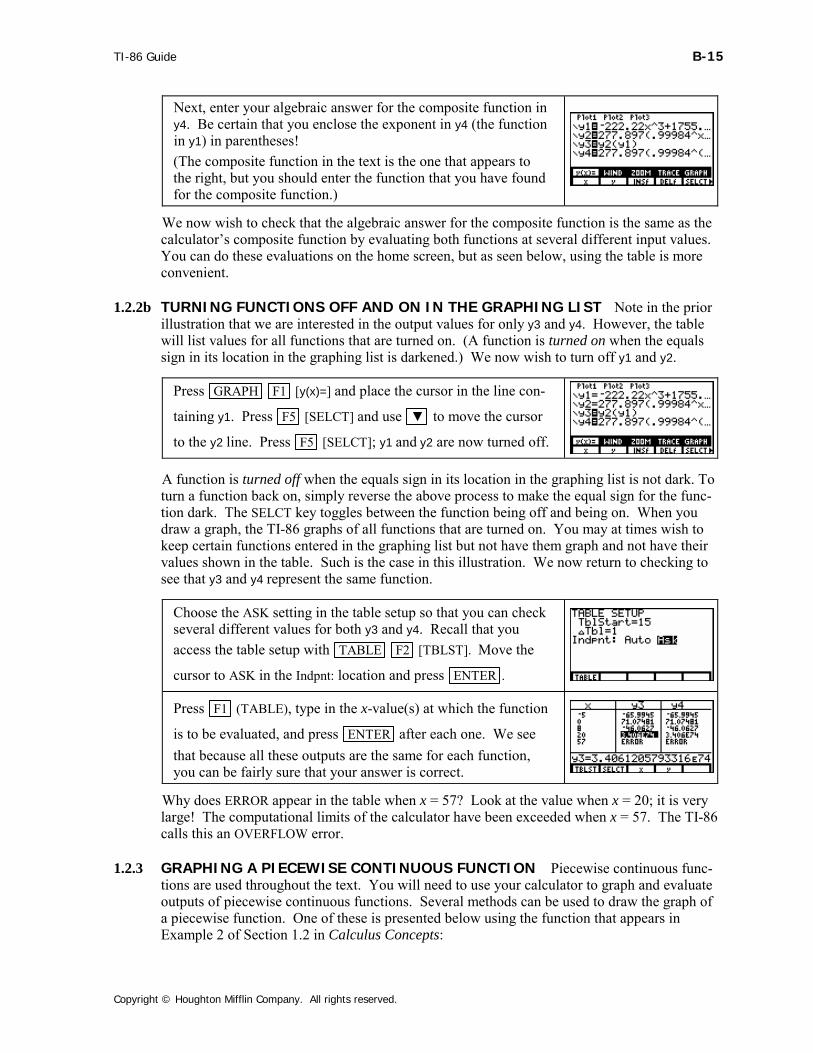
Next, enter your algebraic answer for the composite function in y4. Be certain that you enclose the exponent in y4 (the function in y1) in parentheses! (The composite function in the text is the one that appears to the right, but you should enter the function that you have found for the composite function.)
We now wish to check that the algebraic answer for the composite function is the same as the calculator�s composite function by evaluating both functions at several different input values. You can do these evaluations on the home screen, but as seen below, using the table is more convenient.
1.2.2b TURNING FUNCTIONS OFF AND ON IN THE GRAPHING LIST Note in the prior illustration that we are interested in the output values for only y3 and y4. However, the table will list values for all functions that are turned on. (A function is turned on when the equals sign in its location in the graphing list is darkened.) We now wish to turn off y1 and y2.
Press GRAPH F1 [y(x)=] and place the cursor in the line con-
taining y1. Press F5 [SELCT] and use ▼ to move the cursor
to the y2 line. Press F5 [SELCT]; y1 and y2 are now turned off. A function is turned off when the equals sign in its location in the graphing list is not dark. To turn a function back on, simply reverse the above process to make the equal sign for the func-tion dark. The SELCT key toggles between the function being off and being on. When you draw a graph, the TI-86 graphs of all functions that are turned on. You may at times wish to keep certain functions entered in the graphing list but not have them graph and not have their values shown in the table. Such is the case in this illustration. We now return to checking to see that y3 and y4 represent the same function.
Choose the ASK setting in the table setup so that you can check several different values for both y3 and y4. Recall that you access the table setup with TABLE F2 [TBLST]. Move the
cursor to ASK in the Indpnt: location and press ENTER .
Press F1 (TABLE), type in the x-value(s) at which the function
is to be evaluated, and press ENTER after each one. We see that because all these outputs are the same for each function, you can be fairly sure that your answer is correct.
Why does ERROR appear in the table when x = 57? Look at the value when x = 20; it is very large! The computational limits of the calculator have been exceeded when x = 57. The TI-86 calls this an OVERFLOW error.
1.2.3 GRAPHING A PIECEWISE CONTINUOUS FUNCTION Piecewise continuous func-
tions are used throughout the text. You will need to use your calculator to graph and evaluate outputs of piecewise continuous functions. Several methods can be used to draw the graph of a piecewise function. One of these is presented below using the function that appears in Example 2 of Section 1.2 in Calculus Concepts:

B-16 Chapter 1
Copyright © Houghton Mifflin Company. All rights reserved.
The population of West Virginia from 1985 through 1999 can be modeled by
P tt t
t t t( )
thousand people when
thousand people when =
− + ≤ <
− + − ≤ ≤
RS|T|23373 3892 220 85 90
1013 193164 7387 836 90 992
. .
. . .
where t is the number of years since 1900.
Clear any functions that are in the y(x)= list. Using x as the input variable, enter each piece of the function in a separate location. We use locations y1 and y2. Next, we form the formula for the piecewise function in y3.
Parentheses must be used around the function portions and the inequality statements that tell the calculator which side of the break point to graph each part of the piecewise function.
Have the cursor in y2 and press ▼ to place the cursor in y3.
Press ( 2nd ALPHA (alpha) 0 (Y) 1 ) ( x-VAR 2nd 2
(TEST) F2 [<] 90 ) + ( 2nd ALPHA (alpha) 0 (Y) 2 ) (
x-VAR 2nd 2 (TEST) F5 [≥] 90 ) ENTER .
Your calculator draws graphs by connecting function outputs wherever the function is defined. However, this function breaks at x = 90. The TI-83 will connect the two pieces of P unless you tell it not to do so. Whenever you draw graphs of piecewise functions, set your calculator to Dot mode as described below so that it will not connect the function pieces at the break point.
Turn off y1 and y2 and place the cursor on y3. Press MORE
F3 [STYLE]. Press F3 five more times and the slanted line2 to the left of y3 should be a dotted line (as shown to the right). The function y3 is now in Dot mode.
NOTE: The method described above places individual functions in Dot mode. The functions return to standard (Connected) mode when the function locations are cleared. If you want to put all functions in Dot mode at the same time, press GRAPH F2 [WIND] MORE F3
[FORMT], choose DrawDot in the third line, and press ENTER . However, if you choose to set DOT mode in this manner, you must return to the window format screen, select DrawLine instead of DrawDot, and press ENTER to take the TI-86 out of Dot mode.
Now, set the window. The function P is defined only when the input is between 85 and 99. So, we evaluate P(85), P(90), and P(99) to help when setting the vertical view.
Note that if you attempt to set the window using ZFIT as described in Section 1.1. 1b of this Guide, the picture is not very good and you will probably want to manually reset the height of the window as described below.
2 The different graph styles you can draw from this location are described in more detail on page 79 in your TI-86 Graphing Calculator Guidebook.

TI-86 Guide B-17
Copyright © Houghton Mifflin Company. All rights reserved.
We set the lower and upper endpoints of the input interval as xMin and xMax, respectively. Press GRAPH F2 [WIND], set xMin = 85, xMax = 99, yMin ≈ 1780, and yMax ≈ 1910. Press F5 [GRAPH] and use CLEAR to remove the menu.
Reset the window if you want a closer look at the function around the break point. The graph to the right was drawn using xMin = 89, xMax = 91, yMin = 1780, and yMax = 1810.
You can find function values by evaluating outputs on the home screen or using the table. Either evaluate y3 or carefully look at the inequalities in the function P to determine whether y1 or y2 should be evaluated to obtain each particular output.
1.3 Limits: Functions, Limits, and Continuity The TI-86 table is an essential tool when you estimate end behavior numerically. Even though rounded values are shown in the table due to space limitations, the TI-86 displays at the bottom of the screen many more decimal places for a particular output when you highlight that output.
1.3.1a NUMERICALLY ESTIMATING END BEHAVIOR Whenever you use the TI-86 to
estimate end behavior, set the TABLE to ASK mode. We illustrate using the function u that appears in Example 1 of Section 1.3 in Calculus Concepts:
Press GRAPH F1 [y(x)=] and use F4 [DELf] to delete all
previously-entered functions. Enter u(x) = 310 3 2
2
2x x
x x+
+ + . Be
certain to enclose both numerator and denominator of the fraction in parentheses.
Press TABLE F2 [TBLST]. Choose Ask in the Indpnt: location
by placing the cursor over Ask and pressing ENTER . Press F1 [TABLE]. Delete any values that appear by placing the cursor over the first x value and repeatedly pressing DEL . To numerically estimate lim
x→ ∞ u(x), enter increasingly large values of x.
NOTE: The values you enter do not have to be those shown in the text or these shown in the above table provided the values you input increase without bound.
CAUTION: Your instructor will very likely have you write the table you construct on paper. Be certain that if necessary, you highlight the rounded values in the output column of the table and look on the bottom of the screen to see what these values actually are. ROUNDING OFF: Recall that rounded off (also called rounded in this Guide) means that if one digit past the digit of interest if less than 5, other digits past the digit of interest are dropped. If one digit past the one of interest is 5 or over, the digit of interest is increased by 1 and the remaining digits are dropped.

B-18 Chapter 1
Copyright © Houghton Mifflin Company. All rights reserved.
RULE OF THUMB FOR DETERMINING LIMITS FROM TABLES: Suppose that you are asked to give lim
x→ ∞ u(x) accurate to 3 decimal places. Observe the y1 values in the table until you see
that the output is the same value to one more decimal place (here, to 4 decimal places) for 3 consecu-tive outputs. Then, round the last of the repeated values off to the requested 3 places for the desired limit. Your instructor may establish a different rule from this one, so be sure to ask.
Using this Rule of Thumb and the results that are shown on the last calculator screen, we estimate that, to 3 decimal places, lim
x→ ∞ u(x) = 0.300. We now need to estimate lim
x→ −∞ u(x).
Delete the values currently in the table with DEL . To estimate the negative end behavior of u, enter negative values with increasingly large magnitudes. (Note: Again, the values that you enter do not have to be those shown in the text or these shown to the right.)
Because the output 0.2999� appears three times in a row, we estimate limx→ −∞
u(x) = 0.300.
CAUTION: It is not the final value, but a sequence of several values, that is important when determining limits. If you enter a very large or very small value, you may exceed the limits of the TI-86�s capability and obtain an incorrect number. Always look at the sequence of values obtained to make sure that all values that are found make sense.
1.3.1b GRAPHICALLY ESTIMATING END BEHAVIOR The graph of the function u can be used to confirm our numerically estimated end behavior. Even though the ZOOM menu of the TI-86 can be used with this process for some functions, the graph of u is lost if you use ZOUT in the ZOOM menu. We therefore manually set the window to zoom out on the horizontal axis.
Have u(x) = 310 3 2
2
2x x
x x+
+ +
in the y1 location of the y(x)= list. (Be
certain that you remember to enclose both the numerator and denominator of the fraction in parentheses.) A graph drawn with GRAPH F3 [ZOOM] MORE F4 [ZDECM] is a starting point.
We estimated the limit as x gets very large or very small to be 0.3. Now, u(0) = 0, and it does appears from the graph that u is never negative. Set a window with values such as xMin = −10, xMax = 10, yMin = 0, and yMax = 0.35. Press F5 [GRAPH].
To examine the limit as x gets larger and larger (i.e., to zoom out on the positive x-axis), change the window so that xMax = 100, view the graph with F5 [GRAPH], change the window so
that xMax = 1000, view the graph with F5 [GRAPH], and so
forth. Press F4 [TRACE] and hold down ► on each graph screen to view the outputs.
The sequence of observed output values confirm our numerical estimate.
Repeat the process as x gets smaller and smaller, but change xMin rather than xMax after drawing each graph. The graph to the right was drawn with xMin = −10,000, xMax = 10, yMin = 0, and yMax = 0.35. Press F4 [TRACE] and hold ◄ while on each graph screen to view some of the outputs and confirm the numerical estimates.

TI-86 Guide B-19
Copyright © Houghton Mifflin Company. All rights reserved.
1.3.2a NUMERICALLY ESTIMATING THE LIMIT AT A POINT Whenever you numerically estimate the limit at a point, you should again set the TABLE to ASK mode. We illustrate using the function u that appears in Example 2 of Section 1.3 in Calculus Concepts:
Have u(x) = 39 2
xx + in some location of the y(x)= list, say y1.
Have TBLST set to Ask, and press TABLE F1 [TABLE] to return to the table.
Delete the values currently in the table with DEL . To numeri-cally estimate lim
x→ −2/9− u(x), enter values to the left of, and closer
and closer to, −2/9 = −0.222222…. Because the output values appear to become larger and larger, we estimate that the limit does not exist and write lim
x→ −2/9− u(x) → ∞.
Delete the values currently in the table. To numerically estimate lim
x→ −2/9+ u(x), enter values to the right of, and closer and closer
to, −2/9. Because the output values appear to become larger and larger, we estimate that lim
x→ −2/9+ u(x) → −∞.
1.3.2b GRAPHICALLY ESTIMATING THE LIMIT AT A POINT A graph can be used to
estimate a limit at a point or to confirm a limit that you estimate numerically. The procedure usually involves zooming in on a graph to confirm that the limit at a point exists or zooming out to validate that a limit does not exist. We again illustrate using the function u that appears in Example 2 of Section 1.3 in Calculus Concepts.
Have the function u(x) = 39 2
xx + entered in some location of the
y(x)= list, say y1. A graph drawn with GRAPH F3 [ZOOM]
F4 [ZSTD] or with GRAPH F3 [ZOOM] MORE F4 [ZDECM] is not very helpful.
To confirm that limx→ −2/9− u(x) and lim
x→ −2/9+ u(x) do not exist, we are interested in values of x
that are near to and on either side of −2/9.
Choose input values close to −0.222222… for the x-view and experiment with different y values until you find an appropriate vertical view. Use these values to manually set a window such as that shown to the right. Draw the graph with F5 [GRAPH].
The vertical line appears because the TI-86 is set to Connected mode. Place the TI-86 in DrawDot mode or place the function y1 in the y(x)= list in Dot mode (see page B16) and redraw the graph.

B-20 Chapter 1
Copyright © Houghton Mifflin Company. All rights reserved.
It appears from this graph that as x approaches −2/9 from the left that the output values increase without bound and that as x approaches −2/9 from the right that the output values decrease without bound. Choosing smaller yMin values and larger yMax values in the Window and tracing the graph as x approaches −2/9 from either side confirms this result.
Graphically Estimating a Limit at a Point when the Limit Exists: The previous illustra-tions involved zooming on a graph by manually setting the window. You can also zoom with the ZOOM menu of the calculator. We next describe this method by zooming in on a function for which the limit at a point exists.
Have the function h(x) = 3 39 11 2
2
2x x
x x+
+ + entered in the y1 location of the y(x)= list. Suppose
that we want to estimate limx→−1
h(x).
Draw a graph of h with GRAPH F3 [ZOOM] MORE F4
[ZDECM]. Press F3 [ZOOM] F2 [ZIN] and use ◄ and ▲ to move the blinking cursor until you are near the point on the graph where x = −1. Press ENTER . If you look closely, you can see the hole in the graph at x = −1. (Note that we are not tracing the graph of h.)
If the view is not magnified enough to see what is happening around x = −1, have the cursor near the point on the curve where x = −1 and press ENTER to zoom in again.
Press F4 [TRACE], use ► and ◄ to trace the graph close to, and on either side of x = −1, and observe the sequence of y-values in order to estimate lim
x→−1 h(x),
Observing the sequence of y-values is the same procedure as numerically estimating the limit at a point. Therefore, it is not the value at x = −1 that is important; the limit is what the output values displayed on the screen approach as x approaches −1. It appears that lim
x→−1− h(x)
≈ 0.43 and limx→−1+ h(x) ≈ 0.43. Therefore, we conclude that lim
x→−1 h(x) ≈ 0.43.
1.4 Linear Functions and Models
This portion of the Guide gives instructions for entering real-world data into the calculator and finding familiar function curves to fit that data. You will use the beginning material in this section throughout all the chapters in Calculus Concepts.
CAUTION: Be very careful when you enter data in your calculator because your model and all of your results depend on the values that you enter! Always check your entries.

TI-86 Guide B-21
Copyright © Houghton Mifflin Company. All rights reserved.
1.4.1a ENTERING DATA We illustrate data entry using the values in Table 1.19 in Section 1.4 of Calculus Concepts:
Year 1999 2000 2001 2002 2003 2004 Tax (dollars) 2532 3073 3614 4155 4696 5237
Press 2nd + (STAT) F2 [EDIT] to access the lists that hold data. You see only the first 3 lists, (L1, L2, and L3) but you can access the other 2 lists (L4 and L5) by having the cursor on the list name and pressing ► several times. If you do not see these list names, return to the statistical setup instructions on page B-1 of this Guide.
In this text, we usually use list L1 for the input data and list L2 for the output data. If there are any data already in your lists, see Section 1.4.1c of this Guide and first delete these �old� data values. To enter data in the lists, do the following:
Position the cursor in the first location in list L1. Enter the input data into list L1 by typing the years from top to bottom in the L1 column, pressing ENTER after each entry.
After typing the sixth input value, 2004, use ► to cause the cursor go to the top of list L2. Enter the output data in list L2 by typing the entries from top to bottom in the L2 column, pressing ENTER after each tax value.
Data can also be entered from the home screen rather than in the statistical lists (as was shown above). The end result is the same, so you should choose the method that you prefer.
On the home screen, press 2nd − (LIST) F1 [{], and then type in each of the input data separated by commas. End the list with F2 [}]. Store this list to the name L1 with STO!!!! 7 (L) ALPHA
1 ENTER . Repeat the process to enter the output data, but store these data in a list named L2.
WARNING: If you do not enter and store the input data into a list named L1 and the output data into a list named L2, many of the programs in this Guide will not properly execute.
1.4.1b EDITING DATA No matter how it is entered, the easiest way to edit data is using the sta-tistical lists. If you incorrectly type a data value, use the cursor keys (i.e., the arrow keys ► ,
◄ , ▲ , and/or ▼ ) to darken the value you wish to correct and then type the correct value.
Press ENTER .
• To insert a data value, put the cursor over the value that will be directly below the one you will insert, and press 2nd DEL (INS). The values in the list below the insertion point move down one location and a 0 is filled in at the insertion point. Type the data value to be inserted over the 0 and press ENTER . The 0 is replaced with the new value.
• To delete a single data value, move the cursor over the value you wish to delete, and press DEL . The values in the list below the deleted value move up one location.

B-22 Chapter 1
Copyright © Houghton Mifflin Company. All rights reserved.
1.4.1c DELETING OLD DATA Whenever you enter new data in your calculator, you should first delete any previously entered data. There are several ways to do this, and the most convenient method is illustrated below.
Access the data lists with 2nd + (STAT) F2 [EDIT]. (You probably have different values in your lists if you are deleting �old� data.) Use ▲ to move the cursor over the name L1.
Press CLEAR ENTER . Use ► and
▲ to move the cursor over the name
L2. Press CLEAR ENTER . Repeat this procedure to clear the other lists.
1.4.1d FINDING FIRST DIFFERENCES When the input values are evenly spaced, you can use
program DIFF to compute first differences in the output values. Program DIFF is given in the TI-86 Program Appendix at the Calculus Concepts web site. Consult the Programs category in Trouble Shooting the TI-86 in this Guide if you have questions about obtaining the programs.
Have the data given in Table 1.19 in Section 1.4 of Calculus Concepts entered in your calculator. (See Section 1.4.1a of this Guide.) Exit the list menu with 2nd EXIT (QUIT).
To run the program, press PRGM [NAMES] followed by the F-
key that is under the DIFF program location, and press ENTER . The message on the right appears on your screen.
If you have not entered the data in L1 and L2, press F2 [Quit] and do so.
Otherwise, press F1 [Yes] to con-
tinue. Press F1 [1st] to compute the
first differences. Choose F4 to quit. We use the other choices in the next chapter.
You can also view the first differences in list L3.
• The first differences are constant, so a linear function gives a perfect fit to these tax data.
You will find program DIFF very convenient to use in the next chapter because of the other options it has. However, if you do not want to make use program DIFF at this time, you can use a built-in capability of your TI-86 to compute the first differences of any list.
Be certain that you have the output data entered in list L2 in your calculator. Press 2nd − (LIST) F5 [OPS] MORE
MORE F4 [Deltal] ALPHA 7 (L) 2 ) ENTER .
For larger data sets use ► to scroll to the right to see the remainder of the first
differences. Use ◄ to scroll back to the left.
NOTE: Program DIFF should not be used for data with input values (entered in L1) that are not evenly spaced. First differences give no information about a possible linear fit to data

TI-86 Guide B-23
Copyright © Houghton Mifflin Company. All rights reserved.
with inputs that are not the same distance apart. If you try to use program DIFF with input data that are not evenly spaced, the message INPUT VALUES NOT EVENLY SPACED appears and the program stops. The Deltalst option discussed above gives first differences even if the input values are not evenly spaced. However, these first differences have no interpretation when finding a linear function to fit data if the input values are not evenly spaced.
1.4.2a SCATTER PLOT SETUP The first time that you draw a graph of data, you need to set the
TI-86 to draw the type of graph you want to see. Once you do this, you never need to do this set up again (unless for some reason the settings are changed). If you always put input data in list L1 and output data in list L2, you can turn the scatter plots off and on from the y(x)= screen rather than the STAT PLOTS screen after you perform this initial setup.
Press 2nd (STAT) F3 [PLOT] to display the STAT PLOTS screen. (Your screen may not look exactly like this one.) Press F1 [PLOT1].
Press ENTER to turn Plot1 on, and choose the options shown on the right. (You can choose any of the 3 marks at the bottom of the screen.)
Choose these options: F1 [SCAT], F4 [L1],
F5 [L2], and a mark.
Press GRAPH F1 [y(x)=] and notice that Plot1 at the top of the screen is darkened. This tells you that Plot1 is turned on and ready to graph data. Press 2nd EXIT (QUIT) to return to the home screen.
• A scatter plot is turned on when its name on the y(x)= screen is darkened. To turn Plot1 off, use ▲ to move the cursor to the Plot1 location, and press ENTER . Reverse the process to turn Plot1 back on.
• You can enter the names of any data lists as the Xlist Name and the Ylist Name and draw a scatter plot. (However, it is easiest to always work with L1 and L2.) All data lists on the TI-86 can be named and stored in the calculator�s memory for later recall and use. Refer to Sections 1.4.3c and 1.4.3d of this Guide for instructions on storing data lists and later recalling them for use.
1.4.2b DRAWING A SCATTER PLOT OF DATA Any functions that are turned on in the y(x)=
list will graph when you plot data. Therefore, you should clear, delete, or turn off all func-tions before drawing a scatter plot. We illustrate how to graph data using the modified tax data that follows Example 2 in Section 1.4 of Calculus Concepts.
Year 1999 2000 2001 2002 2003 2004 Tax (in dollars) 2541 3081 3615 4157 4703 5242
Access the y(x)= graphing list. If any entered function is no longer needed, clear it by moving the cursor to its location and pressing CLEAR . If you want the function(s) to remain but not graph when you draw the scatter plot, refer to Section 1.2.2b of this Guide for instructions on how to turn function(s) off. Also be sure that Plot 1 on the top left of the y(x)= screen is darkened.
B-24 Chapter 1
Copyright © Houghton Mifflin Company. All rights reserved.
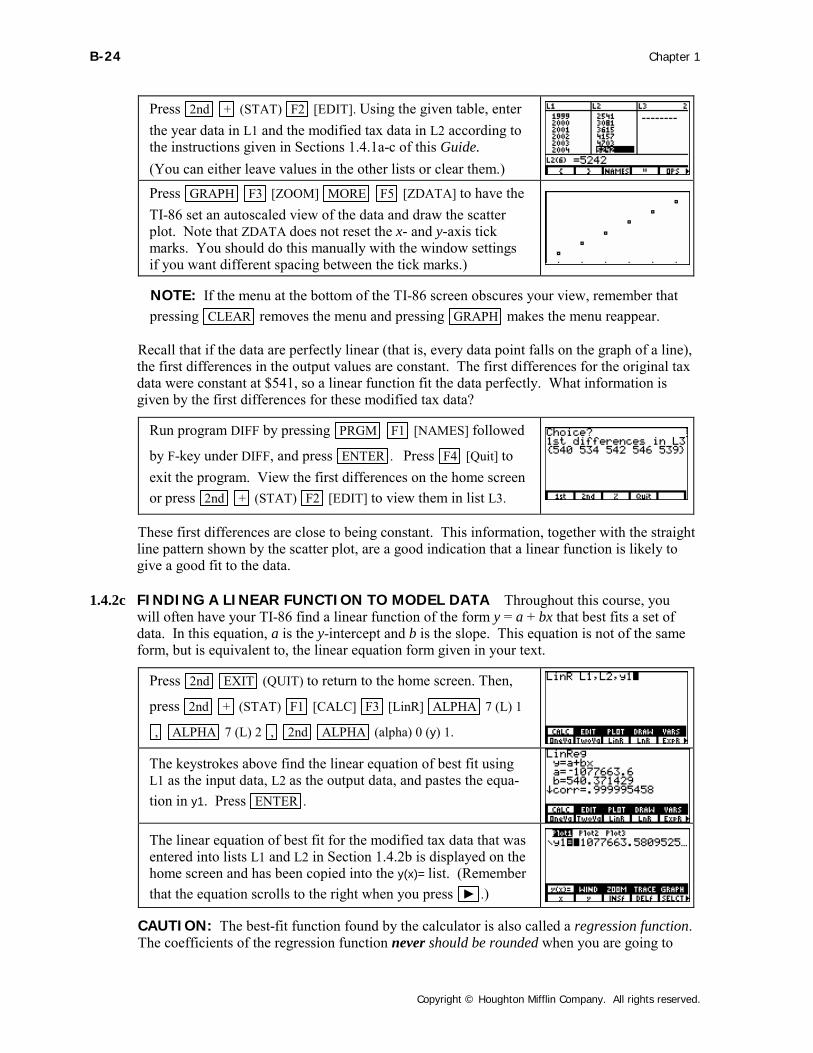
Press 2nd + (STAT) F2 [EDIT]. Using the given table, enter the year data in L1 and the modified tax data in L2 according to the instructions given in Sections 1.4.1a-c of this Guide. (You can either leave values in the other lists or clear them.)
Press GRAPH F3 [ZOOM] MORE F5 [ZDATA] to have the TI-86 set an autoscaled view of the data and draw the scatter plot. Note that ZDATA does not reset the x- and y-axis tick marks. You should do this manually with the window settings if you want different spacing between the tick marks.)
NOTE: If the menu at the bottom of the TI-86 screen obscures your view, remember that pressing CLEAR removes the menu and pressing GRAPH makes the menu reappear.
Recall that if the data are perfectly linear (that is, every data point falls on the graph of a line), the first differences in the output values are constant. The first differences for the original tax data were constant at $541, so a linear function fit the data perfectly. What information is given by the first differences for these modified tax data?
Run program DIFF by pressing PRGM F1 [NAMES] followed
by F-key under DIFF, and press ENTER . Press F4 [Quit] to exit the program. View the first differences on the home screen or press 2nd + (STAT) F2 [EDIT] to view them in list L3.
These first differences are close to being constant. This information, together with the straight line pattern shown by the scatter plot, are a good indication that a linear function is likely to give a good fit to the data.
1.4.2c FINDING A LINEAR FUNCTION TO MODEL DATA Throughout this course, you
will often have your TI-86 find a linear function of the form y = a + bx that best fits a set of data. In this equation, a is the y-intercept and b is the slope. This equation is not of the same form, but is equivalent to, the linear equation form given in your text.
Press 2nd EXIT (QUIT) to return to the home screen. Then,
press 2nd + (STAT) F1 [CALC] F3 [LinR] ALPHA 7 (L) 1
, ALPHA 7 (L) 2 , 2nd ALPHA (alpha) 0 (y) 1.
The keystrokes above find the linear equation of best fit using L1 as the input data, L2 as the output data, and pastes the equa-tion in y1. Press ENTER .
The linear equation of best fit for the modified tax data that was entered into lists L1 and L2 in Section 1.4.2b is displayed on the home screen and has been copied into the y(x)= list. (Remember that the equation scrolls to the right when you press ► .)
CAUTION: The best-fit function found by the calculator is also called a regression function. The coefficients of the regression function never should be rounded when you are going to

TI-86 Guide B-25
Copyright © Houghton Mifflin Company. All rights reserved.
use it! This is not a problem because the calculator pastes the entire equation it finds into the graphing list at the same time the function is found if you follow the instructions given above. NOTE: The TI-86 will use lists called xStat and yStat, which probably contain different data, if you do not specify lists L1 and L2 in the instruction to find the best-fit equation. It is possible to use lists other than L1 and L2 for the input and output data. However, if you do so, you must set one of the STAT PLOT locations to draw the scatter plot for those other lists (as described in Section 1.4.2b). To find the best-fit function, replace L1 and L2 by the other lists in the fit instruction. To paste the function into a location other than y1, just change the number 1 following y in the fit instructions to the number corresponding to the graphing location that you want.
CAUTION: The r that is shown on the screen that first gives the linear equation is called the correlation coefficient. This and a quantity called r2, the coefficient of determination, are numbers that you will learn about in a statistics course. It is not appropriate3 to make use of these values in a calculus course.
Graphing the Line of Best Fit: After finding a best-fit equation, you should always draw the graph of the function on a scatter plot to verify that the function provides a good fit to the data.
Press EXIT F5 [GRAPH] to overdraw the function you pasted in the graphing list on the scatter plot of the data. (As we suspected from looking at the scatter plot and the first differences, this function provides a very good fit to the data.)
1.4.2d COPYING A GRAPH TO PAPER Your instructor may ask you to copy what is on your
graphics screen to paper. If so, use the following ideas to more accurately perform this task. After using a ruler to place and label a scale (i.e., tick marks) on your paper, use the trace
values (as shown below) to draw a scatter plot and graph of the line on your paper.
Press GRAPH to return the modified tax data graph found in
Section 1.4.2c to the screen. Press F4 [TRACE] and ► . The symbol P1 in the upper right-hand corner of the screen indicates that you are tracing the scatter plot of the data in Plot 1.
Press ▼ to move the trace cursor to the linear function graph. The number in the top right of the screen tells you the location of the function that you are tracing (in this case, y1). Use ►
and/or ◄ to locate values that are as �nice� as possible and mark those points on your paper. Use a ruler to connect the points and draw the line.
• If you are copying the graph of a continuous curve rather than a straight line, you need to trace as many points as necessary to see the shape of the curve while marking the points on your paper. Connect the points with a smooth curve.
3 Unfortunately, there is no single number that can be used to tell whether one function better fits data than another. The correlation coefficient only compares linear fits and should not be used to compare the fits of different types of functions. For the statistical reasoning behind this statement, read the references in footnote 6 on page B-30.

B-26 Chapter 1
Copyright © Houghton Mifflin Company. All rights reserved.
1.4.3a ALIGNING DATA We return to the modified tax data entered in Section 1.4.2b. If you want L1 to contain the number of years after a certain year instead of the actual year, you need to align the input data. In this illustration, we shift all of the data points to 3 different posi-tions to the left of where the original values are located.
Press 2nd + (STAT) F2 [EDIT] to access the data lists. To copy the contents of one list to another list; for example, to copy the contents of L1 to L3, use ▲ and ► to move the cursor so
that L3 is highlighted. Press ALPHA 7 (L) 1 ENTER .
NOTE: This first step shown above is not necessary, but it will save you the time it takes to re-enter the input data if you make a mistake. Also, it is not necessary to first clear L3. How-ever, if you want to do so, have the symbols L3 highlighted and press CLEAR ENTER .
To align the input data as the number of years past 1999, first press the arrow keys ( ◄ and ▲ ) so that L1 is highlighted. Tell the TI-86 to subtract 1999 from each number in L1 with ALPHA 7 (L) 1 − 1999.
Press ENTER . Instead of an actual year, the input now repre-sents the number of years since 1999. Return to the home screen with 2nd EXIT (QUIT).
Find the linear function by pressing 2nd ENTER (ENTRY) as many times as needed until you see the linear fit instruction. To enter this function in a different location, say y2, press ◄ and 2.
Press ENTER and then press GRAPH F1 [y(x)=] to see the function pasted in the y2 location. Note: If you want the aligned function to be in y1, do not re-place y1 with y2 before pressing ENTER to find the equation.
To graph this equation on a scatter plot of the aligned data, first turn off the function in y1 (see page B-15 of this Guide). Press EXIT F3 [ZOOM] MORE F5 [ZDATA].
If you now want to find the linear function that best fits the modified tax data using the input data aligned another way, say as the number of years after 1900, first return to the data lists with 2nd + (STAT) F2 [EDIT] and highlight L1.
Add 99 to each number currently in L1 with ALPHA 7 (L) 1 + 99 ENTER . Instead of an actual year, the input now represents the number of years since 1900.

TI-86 Guide B-27
Copyright © Houghton Mifflin Company. All rights reserved.
• There are many ways that you can enter the aligned input into L1. One method that you may prefer is to start over from the beginning. Replace L1 with the contents of L3 by highlighting L1 and pressing ALPHA 7 (L) 3 ENTER . Once again highlight the name L1
and subtract 1900 from each number in L1 with ALPHA 7 (L) 1 − 1900.
On the home screen, find the linear function for the aligned data by pressing 2nd ENTER (ENTRY) until you see the linear regression instruction. To enter this new equation in a different location, say y3, press ◄ 3 ENTER . Press GRAPH
F1 [y(x)=] to see the function pasted in the y3 location.
• To graph this equation on a scatter plot of the aligned data, first turn off the other functions and then press EXIT F3 [ZOOM] MORE F5 [ZDATA].
• Remember, if you have aligned the data, the input value at which you evaluate the func-tion may not be the value given in the question you are asked. You can use any of the equations to evaluate function values.
1.4.3b USING A MODEL FOR PREDICTIONS You can use one of the methods described in
Section 1.1.1e or Section 1.1.1f of this Guide to evaluate the linear function at the indicated input value. Remember, if you have aligned the data, the input value at which you evaluate the function may not be the value given in the question you are asked.
CAUTION: Remember that you should always use the full model, i.e., the function you pasted in the y(x)= list, not a rounded equation, for all computations.
Using the function in y1 (the input is the year), in y2 (the input is the number of years after 1999), or in y3 (the input is the number of years after 1900), we predict that the tax owed in 2006 is approximately $6322.
You can also predict the tax in 2006 using the TI-86 table (with ASK chosen in TBLSET) and any of the 3 models found in the previous section of this Guide. As seen to the right, the predicted tax is approximately $6322.
1.4.3c NAMING AND STORING DATA You can name data (either input, output, or both) and
store it in the calculator memory for later recall. You may or may not want to use this feature. It will be helpful if you plan to use a large data set several times and do not want to reenter the data each time.
To illustrate the procedure, let�s name and store the modified tax output data that was entered in Section 1.4.2b.
Press 2nd EXIT (QUIT) to return to the home screen. You can view any list from the STAT EDIT mode (where the data is originally entered) or from the home screen. View the modi-fied tax data in L2 by pressing ALPHA 7 (L) 2 ENTER .

B-28 Chapter 1
Copyright © Houghton Mifflin Company. All rights reserved.
Pressing ► allows you to scroll through the list to see the portion that is not displayed. To store this data with the name TAX, press ALPHA 7 (L) 2 STO!!!! T A X ENTER .
CAUTION: Do not store data to a name that is routinely used by the TI-86. Such names are ANS, MATH, LOG, MODE, A, B, L1, L2, �, L6, and so forth. Note that if you use a single letter as a name, this might cause one or more of the programs to not execute properly.
1.4.3d RECALLING STORED DATA The data you have stored remains in the memory of the TI-86 until you delete it using the instructions given in Section 1.4.3e of this Guide. When you wish to use the stored data, recall it to one of the lists L1, L2, �, L5. We illustrate with the list named TAX, which we store in L2. Press 2nd − (LIST) and under NAMES, find TAX. (You
may need to press MORE until you see the list you want to recall.)
Press the F-key corresponding to the location of the list. Press STO!!!! 7 (L) ALPHA 2 ENTER . List L2 now contains the
TAX data.
1.4.3e DELETING USER-STORED DATA You do not need to delete any data lists unless your
memory is getting low or you just want to. For illustration purposes, we delete the TAX list.
Press 2nd 3 (MEM) F2 [DELET].
Next press F4 [LIST] and use ▼ to move the cursor opposite TAX.
Press ENTER . To delete another list, use ▼ or ▲ to move
the cursor opposite that list name and press ENTER . Exit this
screen with 2nd EXIT (QUIT) when finished.
WARNING: Be careful when in the DELETE menu. Once you delete something, it is gone from the TI-86 memory and cannot be recovered. If you mistakenly delete one of the lists L1, L2, �, L5, you need to redo the statistical setup as indicated on page B-1 of this Guide.
1.4.4 WHAT IS “BEST FIT”? It is important to understand the method of least squares and the
conditions necessary for its use if you intend to find the equation that best-fits a set of data. You can explore the process of finding the line of best fit with program LSLINE. (Program LSLINE is given in the TI-86 Program Appendix.) For your investigations of the least-squares process with this program, it is better to use data that is not perfectly linear and data for which you do not know the best-fitting line.
We use the data in the table below to illustrate program LSLINE, but you may find it more interesting to input some other data4.
4 This program works well with approximately 5 data points. Interesting data to use in this illustration are the height and weight, the arm span length and the distance from the floor to the navel, or the age of the oldest child and the number of years the children�s parents have been married for 5 randomly selected persons.

TI-86 Guide B-29
Copyright © Houghton Mifflin Company. All rights reserved.
x (input in L1) 1 3 7 9 12 y (output in L2) 1 6 10 16 20
Before using program LSLINE, clear all functions from the y(x)= list, turn on Plot1 by dark-
ening the name Plot1 on the y(x)= screen, and enter your data in lists L1 and L2. (If Plot 1 is not turned on, the program will not execute properly.) Next, draw a scatter plot with GRAPH
F3 [ZOOM] MORE F5 [ZDATA].
Press F2 [WIND] and reset xScl and yScl so that you can use the tick marks to help identify points when you are asked to give the equation of a line to fit the data. Press F5 [GRAPH] to draw the scatter plot and then return to the home screen.
To activate program LSLINE, press PRGM F1 [NAMES] followed by the F-key corresponding to the location of the program, and press ENTER . The program first displays the message shown to the right and pauses for you to read it.
NOTE: While the program is calculating, there is a small vertical line in the upper-right hand corner of the graphics screen that is dashed and �wiggly�. This program pauses several times during execution for you to view the screen. Whenever the program pauses, the small line is �still� and you should press ENTER to resume execution after you have looked at the screen.
The program next shows the scatter plot of the data so that you can estimate the y-intercept and slope of some line that goes �through� the data. (You should not expect to guess the best-fit line on your first try!) Use the tick marks to estimate rise divided by run and note a possible y-intercept. After pressing ENTER to resume the program, enter your guess for the slope
and y-intercept.
After pressing ENTER again, your line is drawn and the errors are shown as vertical line segments on the graph.
(You may have to wait a moment to see the vertical line segments before again pressing ENTER .)
Next the sum of squared errors, SSE, is displayed for your line. Decide whether you want to move the y-intercept of the line or change its slope to improve the fit to the data.
Press ENTER and enter 1 to choose the TRY AGAIN? option. After enter-ing another guess for the y-intercept and/or slope, the process of viewing your line, the errors, and display of SSE is repeated.

B-30 Chapter 1
Copyright © Houghton Mifflin Company. All rights reserved.
If the new value of SSE is smaller than the SSE for your first guess, you have improved the fit.
When you feel an SSE value close to the minimum value is found, enter 2 at the TRY AGAIN? prompt. The program then overdraws the line of best fit on the graph and shows the errors for the line of best fit.
The program ends by displaying the coefficients a and b of the best-fit line y = ax + b as well as the minimum SSE. Press ENTER to end the program. Use program LSLINE to explore5 the method of least squares6 that the TI-86 uses to find the line of best fit.
5 Program LSLINE is for illustration purposes only. Actually finding the line of best fit for a set of data should be done according to the instructions in Section 1.5.7 of this Guide. 6 Two articles that further explain �best-fit� are H. Skala, �Will the Real Best Fit Curve Please Stand Up?� Classroom Computer Capsule, The College Mathematics Journal, vol. 27, no. 3, May 1996 and Bradley Efron, �Computer-Intensive Methods in Statistical Regression,� SIAM Review, vol. 30, no. 3, September 1988.