guide examples for design of concrete reinforced with …€¦ · in practical design of concrete...
TRANSCRIPT

935
SP-230—53
Guide Examples for Design of ConcreteReinforced with FRP Bars
by W.K. Feeser and V.L. Brown
Synopsis:Synopsis:Synopsis:Synopsis:Synopsis: This paper presents design examples that illustrate the interaction of designparameters, to examine some of the more critical issues and challenges that arisewhen designing FRP-RC to satisfy ultimate strength and serviceability criteria using theACI 440.1R-03 Guide. A spreadsheet program was written for flexural and serviceabilityanalysis and design of concrete sections reinforced with a single layer of glass orcarbon FRP bars. Analysis and design examples were developed and design aids wereconstructed to assist in economically and efficiently sizing FRP-reinforced concretemembers. Potential difficulties that arise from the inherent nature of FRP-reinforcedconcrete failure modes have been identified and explored.
Keywords: codes and standards; concrete design; FRP reinforcement

936 Feeser and BrownWilliam K. Feeser received his Master’s degree in Civil Engineering and M.B.A. from
Widener University in May, 2005, and is currently a project manager with the T.N. Ward
Company in Ardmore, Pa.
Vicki L. Brown is an Associate Professor and Chairman of Widener University’s
Department of Civil Engineering. A member of ACI Educational Activities Committee
and Committee 440, Fiber Reinforced Polymer Reinforcement, she serves on many other
ACI educational committees and on the editorial board of ASCE’s Journal of Composites
for Construction.
INTRODUCTION
The widespread successful use of composite materials in the automotive, naval and
sporting goods industries has resulted in a technology transfer to civil infrastructure
applications. Fiber-reinforced polymers (FRP) are impacting the international concrete
industry. FRP combines high-strength glass, carbon, and aramid fibers with polymer
resins, and can be used as both internal and external reinforcement for concrete members.
FRP provides an alternative to steel reinforcement in areas where seawater, deicing salts,
and corrosives can destroy the structural integrity of a concrete member due to
deterioration of the steel reinforcement.
While there is a growing body of published research on FRP-reinforced concrete
(Bakis et al 2002) and while there are a limited number of standards and codes that
address design of FRP-reinforced concrete in Canada (CSA 1996 and CSA 2002), Europe
(fib 2001), and Japan (JSCE 1997), the lack of accepted design guidelines and code
language limits the use of FRP reinforcement in commercial concrete structures in the
United States. The American Concrete Institute’s Guide for the Design and Construction
of Concrete Reinforced with FRP Bars (ACI 2003) is not intended as a code standard at
this time, although it is anticipated that code language may evolve from this document as
the research and design community develop experience and confidence in design
methods and recommended practices. In order to facilitate code development, research
equations and analytical techniques must be successfully translated to the design office.
The objective of the work presented in this paper is to provide insight on designing
single layer internal glass and carbon FRP reinforced concrete members in accordance
with the ACI Guide. A spreadsheet program was written for flexural and serviceability
analysis of concrete sections reinforced with a single layer of glass or carbon FRP bars.
Analysis and design examples were developed and design aids were constructed to assist
in economically and efficiently sizing FRP-reinforced concrete members. Potential
difficulties arising from FRP-reinforced concrete failure modes have been identified and
explored. This paper also addresses potential problems and misconceptions due to the
differences in designing concrete with FRP reinforcement rather than with steel. The
spreadsheets and all design examples are based on recommendations in the American
Concrete Institute’s Guide for the Design and Construction of Concrete Reinforced with
FRP Bars (ACI 2003). The design and analysis examples and design aids are intended to
cover typical concrete construction. The design examples also serve to illustrate
FRPRCS-7 937application of the recommended design procedures. All design aids and examples were
developed using minimum concrete cover requirements from the ACI Guide.
FRP-REINFORCED CONCRETE DESIGN PHILOSPHY
General considerations
The design philosophy for FRP-reinforced concrete is based on principles of
equilibrium, compatibility of strains, and the stress-strain characteristics of the materials
involved. The brittle behavior of both FRP reinforcement and concrete must be
considered. Crushing of the concrete or FRP rupture are the mechanisms that control the
failure of the section. For concrete crushing, the Whitney rectangular stress block is used
to approximate the concrete stress distribution at ultimate strength conditions. For FRP
reinforcement, the linear-to-failure stress-strain relationship must be used. If the FRP
reinforcement ruptures, sudden and catastrophic failure can occur. Therefore, concrete
crushing has typically been considered to be the more desirable failure mode, although
there are opposing viewpoints on this issue. Using limit states principles, FRP reinforced
sections are designed based on required strength considerations and then checked for
fatigue endurance, creep rupture stress limits, and serviceability criteria. In many cases,
serviceability limit states are expected to control the design.
Flexural failure of FRP-reinforced concrete sections can only be brittle. However,
when FRP reinforcement ruptures in tension (i.e. tension-controlled failures), there is
significant elongation. Warning of impending failure is given by extensive cracking and
large deflections. The compression-controlled failure mode of concrete crushing also has
good deformability, with sections exhibiting pseudo-plastic behavior before failure. Both
failure modes are acceptable in the design of FRP-reinforced flexural members provided
that strength and serviceability criteria are satisfied.
Differences between FRP and steel reinforcement
A direct substitution between FRP and steel reinforcement is not possible due to
differences in the mechanical properties of the two materials. The modulus of elasticity of
FRP is much lower than that of steel; thus, larger strains are needed to develop
comparable tensile stresses in the reinforcement. If a direct substitution of FRP for steel
reinforcement was used, FRP reinforced sections would have larger deflections and crack
widths than comparable steel reinforced sections.
In traditional steel reinforced sections, the section is under-reinforced. Specifying a
maximum amount of steel reinforcement ensures that the steel yields first, giving a
ductile failure mode with good deformability. Through plastic straining in the steel
reinforcement, there is adequate warning of impending failure and the failed section is
able to absorb large amounts of energy. FRP reinforced concrete sections do not exhibit
the ductility that is commonly observed for under-reinforced concrete sections reinforced
with steel. Therefore, the suggested margin of safety against failure for FRP reinforced
concrete is higher than that used for traditional steel-reinforced sections.

938 Feeser and BrownIn FRP reinforced sections, the concrete may be over-reinforced by specifying a
minimum amount of FRP reinforcement. If the section fails, the concrete will crush in
compression (compression-controlled failure). The crushing of the concrete serves as
warning of failure and reserves tensile capacity in the FRP reinforcement. Under-
reinforced (tension-controlled) failures are also permitted, but the failure mode is much
different than that of steel-reinforced concrete. Tension-controlled failures result in FRP
rupture, and the failure may be catastrophic due to the linear to elastic failure of the FRP
material; however, deformability comparable to steel-reinforced sections (and to
compression-controlled FRP sections) is achievable. In steel reinforced concrete
members, the ultimate limit states usually control design of the section, with the required
strength dictating the geometry. In FRP reinforced concrete, serviceability limit states
(deflections, crack widths, or creep rupture stress limits) will in all likelihood control the
design of the member.
The general design approach to using internal FRP reinforcement has been to set a
lower limit on FRP reinforcement to achieve a compression-controlled failure in the
concrete. This is a change in design methodology when compared to steel. Due to the
increased tensile strength of the FRP and the compression-controlled failure mode,
researchers have suggested using higher concrete compressive strengths to make more
efficient use of the FRP tensile strength (Yost and Gross 2002). However, serviceability
limits present challenges to this approach in practical design.
SPREADSHEET ANALYSIS PROGRAM
A spreadsheet program (Feeser 2005) was written for flexural and serviceability
analysis of concrete sections reinforced with a single layer of glass or carbon FRP bars.
The spreadsheet provides a convenient means to analyze or design a concrete section in
accordance with ACI 440.1R-03. The spreadsheet analyzes a reinforced concrete section
for flexural strength, serviceability, creep rupture and fatigue based on values for ultimate
moment, service moments, section geometry, concrete compressive strength, FRP type
and material properties, and environmental conditions. The program compares the
analysis results to the design criteria requirements, and indicates whether the section
meets applicable criteria.
The major objective in developing the spreadsheet was to investigate design
parameters. The spreadsheet was adapted to study how various design parameters
interact with each other, thus identifying the challenges in designing a reinforced
concrete section to satisfy ultimate strength and crack width requirements for a desired
failure mode. Results from that study were plotted as figures and design aids.
GLASS FIBER-REINFORCED POLYMER ANALYSIS
Section efficiency
In practical design of concrete reinforced with glass FRP bars, there are several issues
that challenge what has emerged as preferred design concept. An interesting trend

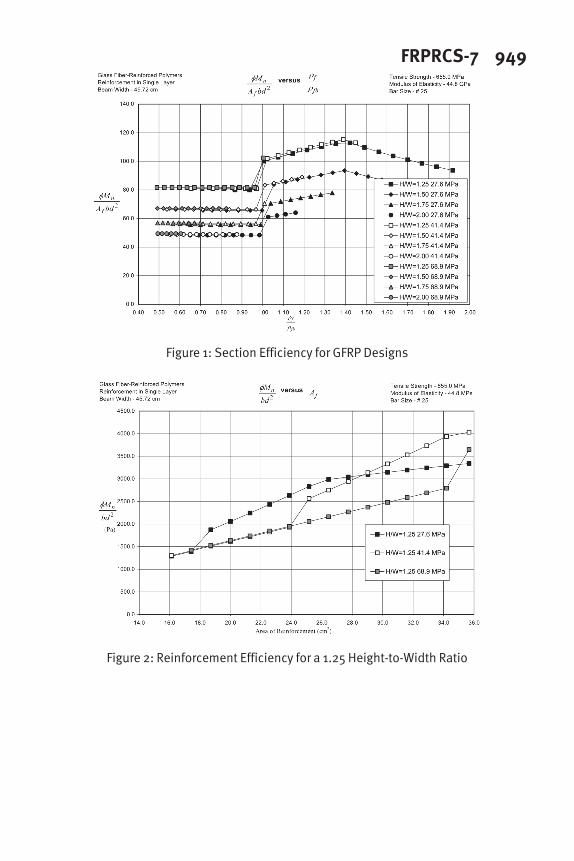
FRPRCS-7 939becomes apparent from examination of Figure 1, which is referred to as “Section
Efficiency” because it displays the ability of a section to achieve larger nominal moment
capacity based on reinforcement ratio. The figure shows the variation in design moment
capacity (normalized with size of cross section and amount of reinforcement as
φMn/A
fbd
2
) as a function of reinforcement ratio (normalized to the balanced
reinforcement ratio as ρf/ρ
fb).
Figure 1 displays a direct relationship between the reinforcement ratios to nominal
moment capacity for different concrete strengths. This figure shows a variety of height-
to-width ratios for rectangular shaped sections with minimum concrete cover, beam width
of 457 mm (18”) and concrete strengths of 27.5 MPa, 41.5 MPa, and 69 MPa (4 ksi, 6
ksi, and 10 ksi). The analysis was based on a single layer of reinforcement using #25M
(#8) bars. Different bar sizes were not considered because bar size has an effect on the
tensile strength of the bar, due to the shear lag that develops between fibers in the larger
size bars. To simplify the analysis, only #25M bars with a tensile strength of 650 MPa
(95 ksi) and modulus of elasticity of 44.8 GPa (6,500 ksi) were considered.
The figure was developed using ρf/ρ
fb as independent variable to analyze trends as the
sections progress through different controlling failure modes. A section with a
reinforcement ratio ρf/ρ
fb < 1.0 is tension-controlled with a strength reduction factor φ
equal to 0.50. A section with a reinforcement ratio ρf/ρ
fb > 1.4 is compression-controlled
with a strength reduction factor φ equal to 0.70. A section with a reinforcement ratio
ρf/ρ
fb between 1.0 and 1.4 is still compression–controlled, but is considered to be a
transition section with a strength reduction factor φ linearly varying between 0.5 and 0.7.
Figure 1 shows that the tensile strength of GFRP is not large enough to force the
section into the compression-controlled region for larger depth sections or for higher
strength concrete. The compression-controlled sections had smaller height-to-width
ratios and concrete compressive strengths. There are a limited number of concrete
sections capable of achieving a compression-controlled failure, even when the section is
reinforced with the maximum amount of GFRP that can be contained in a single layer. It
is apparent that multiple layers of reinforcement are necessary to achieve compression-
controlled failures, but the current design guide does not address such sections.
The effect of varying the amount of reinforcement can best be understood in terms of
the type of failure mode encountered. In the compression-controlled region, an additional
amount of reinforcement does not result in an equivalent increase in moment capacity.
For example, increasing Af by 10% would result in an increase of less than 10% in φM
n.
In the linear transition region, the φMn/A
fbd
2
ratio increases, resulting in a more efficient
use of FRP materials because of the increasing strength reduction factor. In the tension-
controlled region, an increase in the amount of reinforcement provides an equal increase
in moment capacity for a given section. The dramatic decrease in moment capacity as the
section failure mode regresses from transition to tension-controlled, as seen in Figure 1,
is the direct result of a 0.80 reduction coefficient used in calculating the nominal moment
capacity for tension-controlled sections in the ACI 440.1R-03 Guide. The Guide
rationale for the 0.80 coefficient is that it provides a conservative and yet meaningful

940 Feeser and Brownapproximation of the nominal moment capacity. The validity of using the recommended
0.80 coefficient for tension-controlled sections will be discussed later in the paper.
Reinforcement efficiency
Other trends become apparent from examination of Figures 2 and 3. These figures
display a direct relationship between the area of reinforcement and nominal moment
capacity for different concrete compressive strengths. However, these figures do not
directly display the different modes of failure; rather the failure mode can be identified by
the change in the slope of each curve. The initial portion of each curve corresponds to a
tensioned-controlled section. The first change in the slope represents the point at which
the section moves into the linear-transition range. The second change in the slope is the
point at which the section becomes completely compression-controlled.
Generally accepted opinion is that using a higher concrete strength results in a more
efficient use of FRP (Yost and Gross, 2002). However, for GFRP, Figures 2 and 3
indicate it may actually be more efficient to use lower concrete strengths, especially if a
compression-controlled failure mode is preferred. The GFRP’s tensile strength is not
large enough to take advantage of the higher concrete compressive strength. For
example, in Figure 2, the 27.5 MPa (4 ksi) concrete actually achieves a larger moment
capacity than do the higher strength concretes for area of reinforcement less than
approximately 2870 mm2
(4.45 in2
), due to the type of failure mode encountered. When
the area of reinforcement is increased beyond 2870mm2
, the 41.5 MPa (6 ksi) concrete
achieves the largest moment capacity. The 69 MPa (10 ksi) concrete never exceeds the
other concrete compressive strengths’ moment capacities; it is not possible to provide a
sufficient amount of FRP reinforcement in a single layer to take advantage of the full
strength of the 69 MPa concrete. Note, however, that sections with the smaller height-
to-width ratios will in all likelihood be controlled by deflections. As the height-to-width
ratio is increased in Figure 3, the 27.5 MPa reinforced concrete sections achieve moment
capacities comparable to the higher strength concrete in the tension-controlled region.
The 27.5 MPa reinforced sections become compression-controlled at smaller areas of
reinforcement than when higher strength concrete is used; therefore, it is more efficient to
use lower concrete compressive strengths with GFRP. Equally reinforced sections with
higher concrete compressive strengths can force the failure mode of the section from
compression-controlled through transition into tension-controlled sections because of the
limiting tensile strength of the glass FRP. Tension-controlled sections do not appear to
result in efficient designs, due to the penalties from the much lower φ factor (0.5 versus
0.7 for compression-controlled sections) and the 0.8 reduction coefficient in the equation
for nominal moment capacity of tension-controlled sections in the ACI 440.1R Guide.
Design efficiency
The spreadsheet analysis program was used to determine the maximum allowable
service moment that would satisfy crack width criteria. The service moment from crack
width limits was compared with the maximum allowable service moment to satisfy
ultimate strength limits, calculated by dividing the design strength φMn by an average
overall load factor of 1.512 (from a 2:1 dead load to live load ratio). Figure 4 displays the
trends of the maximum allowable service moment to satisfy crack width criteria and

FRPRCS-7 941maximum allowable service moment to satisfy ultimate strength limits. When the
maximum service moment to satisfy ultimate strength limits is larger than the maximum
service moment to satisfy crack widths, crack width criteria control resulting in an
inefficient design that cannot develop full moment capacity. Conversely, for members in
which the maximum service moment to satisfy crack width criteria is greater than the
maximum service moment to satisfy ultimate strength limits, strength criteria control and
the full moment capacity can be developed, resulting in a much more efficient use of FRP
reinforcement.
Smaller bar size and greater H/W ratios result in sections in which efficient designs
are more easily achievable. As Figure 4 illustrates, tension-controlled designs will
typically be controlled by strength rather than crack width limitations. As these sections
approach the transition limit, however, the situation changes and crack width limitations
become the more critical factor. This trend continues through much of the compression-
controlled region as well. However, if the GFRP reinforced sections could actually be
reinforced with larger reinforcement ratios in the compression-controlled region, efficient
designs in which ultimate strength was the limiting factor would again be achievable.
Such reinforcement ratios are usually not possible when reinforcement is placed in a
single layer. Therefore, sections reinforced with GFRP will usually be designed for
tension-controlled failures. In these situations, ultimate strength limits rather than crack
width criteria (or creep rupture stress limits) will in all likelihood control the design and
section geometry. In addition, sections designed using minimum amounts of
reinforcement should be more cost effective than designing for a compression-controlled
failure. In the tension-controlled region, using higher concrete compressive strengths is
not necessarily cost effective because the section will achieve the same moment capacity
for an equally sized and reinforced section using lower concrete compressive strength.
CARBON FIBER-REINFORCED POLYMER ANALYSIS
Although the design of CFRP reinforced concrete sections experiences some of the
same tradeoffs as with GFRP reinforced sections, there are differences. For example, as
Figure 5 shows, the CFRP tensile strength is large enough to force the section into the
compression-controlled region (ρf/ρ
fb > 1.4), even with deeper sections and higher
concrete strengths. Such is not the case with lower-strength GFRP reinforcement. The
negative slope of the CFRP curves in the compression-controlled region indicates that an
additional amount of reinforcement does not result in an equivalent increase in moment
capacity. This development is more prevalent for CFRP sections because a majority of
the sections are compression controlled as compared to GFRP sections. In the tension-
controlled region (ρf/ρ
fb < 1), an increase in the amount of reinforcement provides an
equal increase in moment capacity for both GFRP and CFRP sections.
The effect of varying the amount of reinforcement for CFRP and GFRP reinforced
sections is very similar as Figure 6 indicates. For GFRP, it is more efficient to use lower
concrete compressive strengths, but for CFRP higher concrete compressive strength can
be used to take advantage of the higher tensile strength of the CFRP. In Figure 6, as the
area of reinforcement increases for the CFRP sections, the 27.5 MPa (4 ksi) concrete

942 Feeser and Brownachieves the greatest moment capacity up until approximately 1550 mm
2
(2.40 in2
) of
reinforcement. The 41.5 MPa (6 ksi) concrete then provides larger design moments up
until approximately 2160 mm2
(3.35 in2
) of CFRP; thereafter, the 69 MPa (10 ksi)
designs achieve the greatest moment capacity. However, for GFRP, the 69 MPa concrete
never exceeds the other concrete compressive strengths’ moment capacities. As the
height-to-width ratio increases, the relationship is similar, but the change-over points
occur at larger areas of reinforcement. All of the sections have equal moment capacities
in the tension-controlled region, regardless of reinforcement type or concrete strength.
Also note that CFRP sections can be reinforced with a smaller minimum area of
reinforcement because of the higher CFRP tensile strength. Thus, unlike GFRP sections,
use of higher concrete compressive strengths is more efficient for CFRP sections.
Figure 7 displays the ratio of maximum service moment to satisfy crack width criteria
to maximum service moment to satisfy ultimate strength limits, and thus provides a
means to evaluate the efficiency of the design. To take full advantage of the FRP
reinforcement, sections should preferably be limited by either ultimate strength or creep
rupture stress considerations, which mean the ratio of crack width service moment to
service moment limited by ultimate strength should be greater than 1. The shape of the
design efficiency curves for CFRP is similar to what is seen with GFRP sections, except
that the CFRP curves extend more fully into the compression-controlled range. Figure 7
indicates that sections with larger concrete compressive strengths achieve their largest
design efficiency ratios when approaching the transition limit in the tension-controlled
region. Sections with smaller concrete compressive strengths achieve the greatest design
efficiency ratios in the compression-controlled region as the section approaches the
maximum possible area of reinforcement that can be fitted into a single layer.
Extrapolating the curves for the higher strength concrete, a reasonable assumption is that
design efficiencies would also increase in compression-controlled regions, if it were
possible to fit the required area of reinforcement into the section. Such an approach,
although efficient, would not be particularly economical. Such designs are not likely to
satisfy deflection limitations.
In summary, the analysis of CFRP and GFRP reinforced sections show significant
similarities and differences. For both CFRP and GFRP sections, tension-controlled
sections have equal moment capacities per unit area of FRP for varying amounts of
reinforcement and designs are rarely controlled by crack width limitations. In the linear
transition region, increasing the amount of reinforcement results in proportionally greater
increase in moment capacity from ultimate strength limitations, but these sections will
usually have service moment controlled by crack widths. In the compression-controlled
region, the φMn/A
fbd
2
ratio decreases with increasing reinforcement ratio. For CFRP
compression-controlled sections, the greatest reinforcement efficiencies are achieved
using higher concrete compressive strength with practical areas of reinforcement.
However, for GFRP sections, the greatest reinforcement efficiencies are achieved using
lower concrete compressive strength for tension-controlled sections with practical areas
of reinforcement. The difference in section and reinforcement efficiencies between
CFRP and GFRP is a direct result of the higher tensile strength of the CFRP.
FRPRCS-7 943Sections reinforced with CFRP may be designed for compression-controlled failures.
Crack width criteria rather than ultimate strength or creep rupture stress limits will likely
control section geometry, the reverse of what occurs in GFRP sections where designs are
most likely to be tension-controlled. Higher concrete compressive strengths should be
used with CFRP reinforcement to take advantage of CFRP’s higher tensile strength.
TENSION-CONTROLLED MOMENT EQUATION
ACI 440.1R (ACI 2003) recommends that moment capacity of tension-controlled
sections be calculated as
−=
2
8.0
1 b
fufn
c
dfAM
β
(1)
The Aff
fu term represents the tensile force in the FRP at rupture, while d –
1
/2 β
1c
b
provides a conservative lower-bound approximation to the actual moment arm. The
rationale for the 0.8 factor is less clear, as the Guide only indicates that it provides a
“conservative and yet meaningful approximation of the nominal moment.” The
implication is that the reduction coefficient adjusts computed values to reflect test data.
If the 0.80 reduction coefficient is removed from the calculation for tension-
controlled moment capacities in Equation (1), continuity is achieved in the design
strength φMn values as a section’s reinforcement ratio moves from the tension-controlled
region into the transition range, for both the GFRP and the CFRP reinforcement. In
Figure 8, the normalized design moment makes a smooth transition as the section moves
into the linear-transition range, in contrast to the same curves in Figure 5. However, it
will not be possible to take complete advantage of the increase in moment capacity that
might be expected from the removal of the 0.8 reduction coefficient. Figure 9 indicates
that serviceability criteria will now control the design in the tension-controlled region,
instead of ultimate strength, as was the case in the tension-controlled range in Figure 7.
DESIGN EXAMPLES AND DESIGN AIDS
Guided design examples can be used to illustrate how theoretical approaches to
design can be applied to FRP reinforced concrete sections and to identify unresolved
design issues. Two separate design scenarios were considered. The scenarios were
created to simulate real and practical design applications using FRP reinforcement. Both
design scenarios contained several design element examples: one-way slab, simply
supported T-shaped beam, and continuous rectangular shaped girder.
The first design scenario was a hospital floor that supports electromagnetic equipment
where magnetic fields are present. The hospital floor plan has a typical bay spacing of
7325 mm by 4875 mm (24’ x 16’) and floor live loading of 2.875 kN/m2
(60 psf). Glass
FRP reinforcement was used for all of the hospital floor’s supporting elements because
the GFRP reinforcement can be used more effectively for lighter loads and shorter spans.
The second design scenario was a typical manufacturing plant floor exposed to a
highly corrosive environment where the corrosion-resistance of the FRP reinforcement is
944 Feeser and Brownmost beneficial. The manufacturing floor plan has a typical bay spacing of 9750 mm by
7325 mm (32’ x 24’) and floor live loading of 6 kN/m2
(125 psf). Carbon FRP
reinforcement was used for all of the manufacturing plant floor’s supporting elements
because the CFRP reinforcement can be used more effectively for heavier loads and
longer spans.
Both design scenarios contain similar elements – a floor slab that forms the flanges of
simply supported T beams, which are themselves supported on continuous rectangular
girders - illustrating the similarities and differences in applications using GFRP and
CFRP reinforcement. Design aids were developed as an efficient means to proportion
member sizes on the basis of ultimate strength, desired failure mode, and serviceability
criteria. The design aids should be used with caution to proportion reinforced sections
because dead load to live load ratio, shear reinforcement size and clear cover can greatly
affect serviceability criteria. Also note that deflection and creep rupture stress criteria are
not included in the design aids but may control section design. This means that member
sizes may require adjustment from what is initially chosen based on the design aids,
which should only be used to provide a reasonable starting point for sizing members.
The spreadsheet program was used to develop two sets of design aids, one set for
glass and carbon FRP reinforced concrete slabs, and the other for GFRP and CFRP
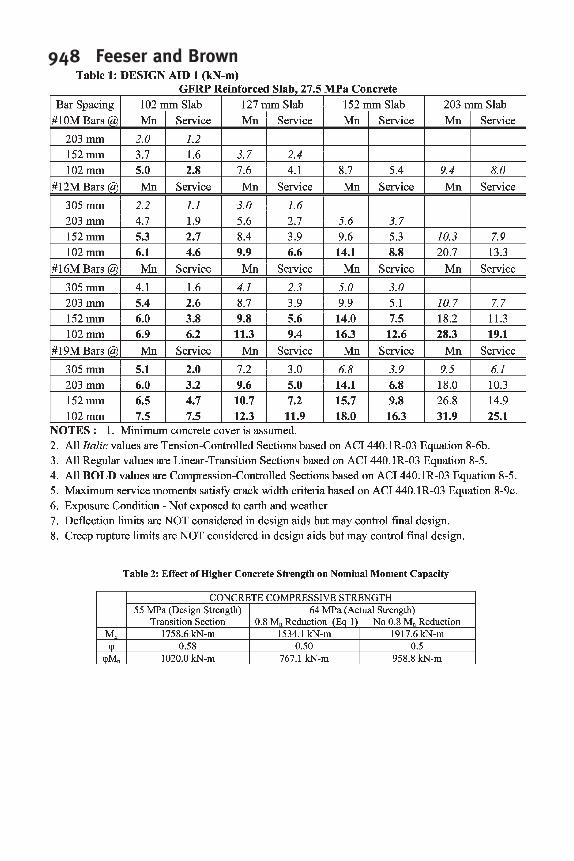
reinforced concrete beams. A typical design aid is shown in Table 1. The design aids
provide the ultimate strength φMn and maximum service moments to satisfy crack width
criteria for a variety of section dimensions, reinforcement bar sizes, and number of bars
in a single layer of reinforcement, assuming minimum concrete cover. The design aid
maximum service moment was based only on crack widths for interior exposure
conditions because crack width criteria usually limit the service moment. A member
geometry that meets crack width criteria will typically be adequate for creep rupture
limits as well. Deflection limits depend on performance criteria such as time-dependent
factor for sustained loads and tolerance provisions for support or attachment of
nonstructural elements, and were not included in the development of the design aids.
Hospital design examples with GFRP reinforcement
The hospital floor supports electromagnet equipment where magnetic fields are
present. The hospital floor plan has a typical bay spacing of 7325 mm by 4875 mm (24’
x 16’). The floor is designed to support a service live load of 2.875 kN/m2
(60 psf), 20%
sustained load, and superimposed service dead load of 1.44 kN/m2
(30 psf). Normal
weight concrete with a 28 day strength of 27.5 MPa (4 ksi) will be reinforced with GFRP.
Deflections shall not exceed L/360 immediate live load deflection and L/480 long-term
deflection with a time-dependent factor of 5 years or more, because the floor supports
nonstructural elements likely to be damaged by large deflections. Members are designed
using minimum clear cover and #12M (#4) stirrups for shear reinforcement. The crack
widths are computed using a recommended bond coefficient, kb, of 1.2. All elements
(floor slab, simply supported T beam, and continuous rectangular girder) were designed
for flexure and serviceability; the simply supported T beam was also designed for shear
and bond and anchorage requirements. The results of the design are shown in Figure 10.

FRPRCS-7 945Manufacturing plant design examples with CFRP reinforcement
The manufacturing plant floor is exposed to an environment where the corrosion-
resistance of FRP reinforcement is beneficial. The floor plan has a bay spacing of 9750
mm by 7325 mm (32’ x 24’). The floor is designed to support a service live load of 6
kN/m2
(125 psf) with 20% sustained load and a superimposed service dead load of 1.44
kN/m2
(30 psf). Normal weight concrete with 55 MPa (8 ksi) compressive strength will
be reinforced with CFRP reinforcement. Beam deflections must not exceed immediate
live load deflection of L/360 and long-term deflection of L/240 because the floor does not
support nonstructural elements likely to be damaged by large deflections. Members are
designed using minimum clear cover and #12M (#4) stirrups. The crack widths are
computed using a recommended bond coefficient, kb, of 1.2. All elements (floor slab,
simply supported T beam, and continuous rectangular girder) were designed for flexure
and serviceability; the continuous girder was also designed for shear and bond and
anchorage requirements. The results of the design are shown in Figure 11.
DESIGN ISSUES AND CONSTRUCTION CONCERNS
The design examples for GFRP and CFRP reinforced sections identified several
design issues for FRP reinforcement material properties and concrete compressive
strength.
FRP reinforcement material properties
Designers must recognize that FRP material properties vary more from manufacturer
to manufacturer than do steel material properties. FRP reinforcement bars are not
currently standardized across the FRP manufacturing industry. Unless the designer
mandates a specific commercial FRP manufacturer and bar type in the design
specifications, FRP bars used in construction will in all likelihood have different
properties than those used in design. If the contractor is free to choose the FRP
manufacturer, the initial design should be checked in the shop drawing phase for changes
in FRP material properties to assure all design requirements are met. As a result,
designers should take extra caution to properly specify required properties for their
design in the drawings and specifications.
Concrete compressive strength
In typical reinforced concrete design situations, the designer specifies a minimum 28-
day concrete compressive strength. In most cases, the concrete supplied exceeds the
specified strength. For FRP reinforced sections, actual concrete strength greater than
specified strength could (under certain circumstances) result in a change of failure mode
where larger safety factors for tension-controlled failures in the current version of the
ACI Guide could potentially result in smaller than intended design strength φMn
, despite
an increase in failure moment Mn. Table 2 illustrates the effect that increasing concrete
compressive strength can have on an FRP reinforced design. The continuously spanning
rectangular shaped girder was originally designed with a concrete compressive strength
of 55 MPa (8 ksi), as part of the manufacturing plant design example. The same design is
analyzed to investigate the impact that an actual concrete compressive strength of 64
MPa (9300 psi), 16% higher than specified, would have. The rectangular shaped girder

946 Feeser and Brown(see Figure 11) positive moment design capacity is φM
n = 1020 kN-m (752.20 kip-ft),
which is sufficient for the Mu
= 890 kN-m (656.35 kip-ft) moment demand from the
factored loads on a 9.75 m (32 ft) span. The resulting design was a 380 mm by 915 mm
(15” by 36”) section with five #19M (#6) CFRP bars. However, the section’s moment
capacity φMn decreases to 767 kN-m (565.68 kip-ft) when the concrete compressive
strength increases from 55 MPa to 64 MPa and if the nominal moment capacity Mn is
calculated by Eq. 1 as recommended in ACI 440.1R. This is because the increase in
concrete compressive strength causes an increase in the section’s balanced reinforcement
ratio, switching the mode of failure from a compression-controlled failure in the
transition zone with 55 MPa concrete to a tension-controlled failure with 64 MPa
concrete. Removal of the 0.8 reduction coefficient from Eq. 1, as recently proposed by
ACI Committee 440, will mitigate this situation although design strengths φMn may still
be smaller than intended - as is the case for the example illustrated in Table 2.
CONCLUSIONS AND RECOMMENDATIONS
The corrosion resistance, nonconductive, and nonmagnetic properties of FRP
reinforcement provide advantages to steel reinforcement in specialized environments.
However, where there is an opportunity that FRP could be substituted for steel, FRP
reinforcement needs to provide a bottom line cost benefit to the owner. A lifetime project
cost-benefit analysis should be employed, where costs over the anticipated service life of
the structure can be equally compared for FRP and steel reinforced concrete elements.
The design approach to using internal FRP reinforcement in concrete members has
been to set a lower limit on FRP reinforcement to achieve a compression-controlled
failure in the concrete. This is a change in design methodology when compared to steel.
Due to the increased tensile strength of the FRP, researchers have suggested using higher
concrete compressive strengths for efficient use of the FRP tensile strength. Concrete
sections reinforced with a single layer of GFRP bars contradict such an approach because
the tensile strength of the GFRP is not large enough to achieve the larger reinforcement
ratios required to take advantage of the benefits of a compression-controlled section.
Rather, GFRP reinforced sections should be designed for tension-controlled failures.
With the moment capacity equation currently recommended by the ACI Guide, ultimate
strength limits rather than crack width criteria will in all likelihood control the design and
determine the section’s geometry. Under these conditions, sections designed using
minimum amounts of reinforcement should be more cost effective than designing for a
compression-controlled failure. For tension-controlled sections where the reinforcement
is placed in a single layer, using higher concrete compressive strengths is less cost
effective because the section will achieve the same moment capacity for an equally sized
and reinforced section using lesser concrete compressive strengths. Sections reinforced
with multiple layers of GFRP reinforcement may be more attractive and should be
explored. Multiple layers of reinforcement will enable a GFRP reinforced section to
achieve larger reinforcement ratios for a compression-controlled failure. Using larger
concrete compressive strengths to make more efficient use of the GFRP tensile strength is
more applicable to designs with multiple layers of reinforcement.
FRPRCS-7 947The 0.80 reduction factor in the moment equation for tension-controlled sections
should be revisited. Indeed, ACI Committee 440 has recently chosen to recommend such
changes. For GFRP sections, such a change may cause serviceability rather than ultimate
strength criteria to control section geometry.
Concrete sections reinforced with a single layer of CFRP bars can reasonably use
larger concrete compressive strengths to make better use of FRP tensile strength. The
tensile strength of CFRP is large enough to achieve the larger reinforcement ratios that
can take advantage of the compression-controlled failure mode; thus, CFRP reinforced
sections should be designed for compression-controlled failures. Crack width criteria and
deflection limits will probably determine section geometry, unlike what occurs in GFRP
sections. CFRP sections should be designed using the minimum reinforcement necessary
to achieve compression-controlled failure. Larger concrete compressive strengths may be
used with CFRP reinforcement to take advantage of the higher tensile strength of the
CFRP. A cost-benefit analysis studying the impact of using larger concrete compressive
strengths should be done to identify optimum concrete compressive strength for CFRP
reinforcement. Typically, additional costs are involved in the production of higher
concrete compressive strengths, which may offset any potential benefits.
REFERENCES
ACI Committee 440.1R, 2003. “Guide for the Design and Construction of Concrete
Reinforced with FRP Bars.” American Concrete Institute, Farmington Hills, Mich.
Bakis, C.E. (Editor), Bank, L.C., Brown, V.L., Cosenza, C., Davalos, J.F., Lesko, J.J,
Machida, A. Rizkalla, S. H., and T. Triantafillou. May 2002. “FRP Composites for
Construction - State-of-the-Art Review.” Journal of Composites in Construction, Vol. 6,
No. 2, pp 73-87.
Canadian Standards Association. 1996. “Canadian Highways Bridge Design Code
Section 16 – Fibre Reinforced Structures.” CSA S6.
Canadian Standards Association. 2002. “S806 Design and Construction of Building
Components with Reinforced Polymers.” CSA S806.
Feeser, William. 2005. “Guide Examples for the Design of Concrete Reinforced with
Fiber Reinforced Polymer Bars.” Master’s thesis, Widener University, Chester, Pa.
fib Bulletin 14 (October 2001), "Externally Bonded FRP Reinforcement for RC
Structures - Technical Report on the Design and Use of Externally Bonded Fibre
Reinforced Polymer Reinforcement for Reinforced Concrete Structures".
Japan Society of Civil Engineers. 1997. “Recommendation for Design and Construction
of Concrete Structures Using Continuous Fiber Reinforcing Materials.” Concrete
Engineering Series 23, Tokyo, Japan.
Yost, J. R. & Gross, S. P. May-June 2002. “Flexural Design Methodology for Concrete
Beams Reinforced with Fiber-Reinforced Polymers,” ACI Structural Journal, V. 99, No.
3, p. 308.
948 Feeser and Brown
FRPRCS-7 949
Figure 1: Section Efficiency for GFRP Designs
Figure 2: Reinforcement Efficiency for a 1.25 Height-to-Width Ratio

950 Feeser and Brown
Figure 3: Reinforcement Efficiency for a 1.75 Height-to-Width Ratio
Figure 4: Allowable Service Moment as Controlled by Serviceability & Strength

FRPRCS-7 951
Figure 5: Section Efficiency of CFRP Relative to GFRP
Figure 6: Reinforcement Efficiency of CFRP Relative to GFRP

952 Feeser and Brown
Figure 7: Crack Width Limitation on Allowable Service Moment
Figure 8: Impact of Tension-Controlled Reduction Coefficient on Section Efficiency

FRPRCS-7 953
Figure 9: Impact of Tension-Controlled Reduction Coefficient on Design Efficiency
Figure 10: Hospital Floor System Design with GFRP ReinforcementNote: 1" = 25.4 mm; #4 = #12M bars; #6 = #19M bars; #8 = #25M bars

954 Feeser and Brown
Figure 11: Manufacturing Plant Floor System Design with CFRP ReinforcementNote: 1" = 25.4 mm; #4 = #12M bars; #6 = #19M bars; #8 = #25M bars