guidance on the assessment of occupational exposure to ......2016/09/30 · measurements of (more...
TRANSCRIPT

Guidance on the
Assessment of Occupational Exposure to Metals
Based on Monitoring Data
Final Report
September 2016
Developed by: On behalf of:
D. Vetter, J. Schade, K. Lippert Violaine Verougstraete
EBRC Consulting GmbH EUROMETAUX
Raffaelstr. 4 Avenue de Broqueville 12
30177 Hannover B-1150 Brussels
Germany Belgium

Assessment of occupational exposure to metals Final Report
© 2016, EBRC Consulting GmbH, Germany 2
Table of content
1 Introduction and objectives of this guidance 3
2 Monitoring methodology 4
2.1 Defining the scope of a monitoring campaign 4
2.1.1 Specificity of monitoring data 5
2.1.2 Representative nature of monitoring data 5
2.1.3 Identifying data needs 6
2.2 Sampling strategy 6
2.2.1 Dermal exposure monitoring 7
2.2.2 Oral exposure monitoring 7
2.2.3 Bio-monitoring 7
2.2.4 Inhalation exposure monitoring 8
2.3 Sampling equipment (for monitoring of inhalation exposure) 9
2.4 Quantification of exposure levels from obtained samples 12
3 Reporting and analysis of sampling results 12
3.1 Reporting 12
3.1.1 Basic information requirements 12
3.1.2 Required contextual information 13
3.1.3 Further information 13
3.2 Data management and data analysis 13
3.2.1 Treatment of historical inhalation monitoring data 14
3.2.2 Treatment of inhalation monitoring data for the total fraction of dust 14
3.2.3 Treatment of values below the limit of detection 17
3.2.4 Calculation and use of time weighted averages 18
3.2.5 Derivation of exposure estimate 18
4 Summary of substance-specific sources of information 24
5 References 32
Appendix 1: Further use of monitoring data for calibration of exposure estimation tools 35
Appendix 2: Information requirements for data used for the calibration of exposure
assessment tools 36

Assessment of occupational exposure to metals Final Report
© 2016, EBRC Consulting GmbH, Germany 3
1 Introduction and objectives of this guidance
This guidance for the assessment of occupational exposure based on monitoring data aims
at providing information to facilitate harmonised generation and analysis of exposure data in
the metals’ industry.
Harmonisation is important to ascertain easily accessible and comparable exposure
databases amongst metal associations, maximising their value for re-use for several
purposes. These purposes include: (i) exposure assessments as required under the REACH
Regulation (Regulation (EC) No 1907/2006) including those required for the application for
authorisation of uses, (ii) OEL setting at the European or national level, (iii) compliance
checking, (iv) checking/improving the efficiency of localised exposure controls and (v) use in
the calibration of exposure modelling tools.
In addition, harmonisation is important when historical (already existing and still relevant)
data are to be merged with recently generated exposure data. Only appropriately recorded
contextual information1 can ensure a consistent exposure database containing historical and
recent exposure data.
Consequently, this guidance addresses aspects of monitoring methodology and data
reporting relevant for occupational exposure assessments within the entire supply chain of
metals (and their compounds) rather than providing detailed guidance to address specific
questions of individual metal commodities/sites.
While it is acknowledged that exposure in the workplace may occur via inhalation, dermal
contact and via (inadvertent) ingestion, this document focusses on monitoring of inhalation
exposure as the main route of exposure2. For the remaining types of monitoring data, some
relevant issues are discussed in Section 2.2 and reference is given to other guidance
documents. It should also be noted that in addition to external exposure, internal exposure
may be measured through bio-monitoring if required pre-requisites are fulfilled.
An exposure assessment based on monitoring data entails the mathematical analysis of the
recorded data. More specifically, it entails the derivation of an exposure level from a
distribution of individual exposure values. Since the purpose of the exposure assessment
pre-defines the sampling methodology to a considerable extent, this guidance addresses the
specific requirements for a sound data analysis. Particular focus is thereby given to exposure
assessments as required under REACH (and indicated in ECHA guidance3).
In this guidance, considerations of particle size investigations are limited to the fractions of
dusts as mentioned in BS EN 481 whereas these considerations do not cover direct
measurements of (more complete) particle size distributions in the workplace.
1 Contextual information = auxiliary information required to qualify a dataset as reliable (see also Section 3.1)
2 Dermal and inadvertent ingestion exposure may also play an important role in workers’ exposure. However, the need to
assess these routes considerably varies between metals and sampling methodology is currently less developed and standardised. 3 It is noted that the relevant REACH guidance on occupational exposure (R.14) has been updated in August 2016. Whereas the principles mentioned remain the same in the recent version, some details have been modified. In particular, Table R.14-2 has been removed. A reference to this table (and the considerations behind it) has been nevertheless retained in this document providing indicative information on the required number of measurements for a representative exposure assessment. Further work is ongoing on this aspect.

Assessment of occupational exposure to metals Final Report
© 2016, EBRC Consulting GmbH, Germany 4
The provided guidance applies to measurements of most aerosols in the workplace,
however, in some instances, alternative methods that are potentially more suitable exist (e.g.
for welding fumes). They are however not part of this guidance. Finally it should be noted
that exposure monitoring of nano particles is not in the scope of this guidance.
The information included in this document does on purpose address generic issues related to
monitoring of occupational exposure to metals. However, references to information sources
for aspects outside the scope of this guidance and for metal-specific guidance, where
available, have been included in Section 4.
2 Monitoring methodology
As explained below, the actual purpose of the occupational exposure assessment predefines
the monitoring methodology to a considerable extent. Only, a well thought-through sampling
strategy, carried out with the appropriate sampling equipment, will facilitate a sound data
analysis and exposure assessment.
For the selection of the monitoring methodology one needs to consider:
(i) the scope of the monitoring campaign (2.1),
(ii) the sampling strategy (and actual sampling procedure) (2.2),
(iii) the sampling equipment (2.3), and
(iv) the quantification of exposure levels from the generated samples (2.4).
These 4 aspects should be defined in the context of the objectives of the exposure
assessment. Often, at the level of metal associations, such objectives are related to setting
up or amending a representative exposure database. The purpose of such a database may
vary: to serve as data source for, e.g. occupational risk assessments for registration and/or
authorisation under REACH, precautionary exposure assessments as part of product
stewardship or hazard identification, demonstration of appropriateness of specific risk
management measures or other purposes including the use for the calibration of exposure
models. However, the requirements for the generation of exposure data to meet these
objectives can be described on a generic level, related to the aforementioned 4 aspects and
are described below. While information in Sections 2.1 and 2.2 also refers to dermal
monitoring and bio-monitoring, subsequent sections (equipment and exposure quantification)
are exclusively focussing on inhalation monitoring data.
2.1 Defining the scope of a monitoring campaign
Before developing a sampling strategy (ii), the actual scope of the potential monitoring
campaign needs to be defined. A challenge when defining the scope is the balance to be
found between two competing concepts, namely the specificity and the representative nature
of data (sets). The definition of the scope will allow identifying the data needs.
For example, if an assessment is to cover an entire sector, data would be required from
several sites to ensure representativeness of the data set. The specificity of such an
exposure assessment would be less because of likely site-specific differences.

Assessment of occupational exposure to metals Final Report
© 2016, EBRC Consulting GmbH, Germany 5
2.1.1 Specificity of monitoring data
In order to assess exposure in a meaningful context, any exposure data used need to be
specific to the exposure situation4 to be assessed. An exposure situation is defined by the
operational conditions (OC) prevailing and risk management measures (RMM) effective
during the exposure period to be assessed. It is up to the exposure assessor to define the
boundaries for individual exposure situations since variations in the conditions of use5 (OC
and RMM) are common when, for example, multiple sites are concerned. Plausibility
considerations on the substance- and process-intrinsic emission potential (and other OC)
and their modification by the prevailing RMM could be used.
For example, occupational exposure during raw material handling (emptying of
received containers into storage silo) shall be assessed. The substance may be
handled either as metal chips or in powder form, whereas other operational conditions
are similar and implemented risk management measures vary in a way that powder
handling is completely enclosed and the handling of the metal chips may be conducted
with or without local exhaust ventilation (LEV) present. In this example, 3 exposure
situations may be defined: (i) enclosed handling of metal powder, (ii) handling of metal
chips (LEV present) and (iii) handling of metal chips (LEV not present). These
correspond to three sets of exposure data.
Further information on how to define exposure situations could be found in, for example,
EN 689. The following discriminators are to be considered: job functions, tasks, work
patterns and techniques, production processes, workplace configuration, safety precautions
and procedures, ventilation installations and other forms of engineering control, emission
sources, exposure times, workload, etc. when defining the boundaries of an exposure
situation. A similar and often used term for exposure situation in this context may be “Similar
Exposure Group” (SEG). Reference is given to the current draft version (June 2016) of
EN 689 (prEN 689) providing further information on SEGs.
2.1.2 Representative nature of monitoring data
As already mentioned above, differences in the implementation of OC and RMM at the level
of individual sites and inter- and intra-worker differences could lead to considerable variation
in exposure levels even within the same exposure situation. In order to address such
variation, repeated measurements of the exposure situation are required at different sites
and for different workers. The required number of measurements per exposure situation
varies with the level of variation and the required safety margin. An indication of the required
minimum number of observations can be found in the previous REACH guidance R.146,
Table R.14-2 (see also Section 3.2.5.1.1).
4 Under REACH, an exposure situation may be translated into a contributing exposure scenario. A contributing exposure scenario is defined by a single set of operational conditions and risk management measures. Consequently, observed variation in exposure levels may be mostly attributable to personal behaviour. 5 Under REACH, operational conditions and risk managements measures are commonly referred to as „conditions of use“. 6 ECHA guidance R.14 has been updated in August 2016. Although Table R.14-2 has been removed from the guidance,
reference to this table is still maintained in this guidance.

Assessment of occupational exposure to metals Final Report
© 2016, EBRC Consulting GmbH, Germany 6
For example, the 3 example exposure situations introduced above may be extended by
a situation in which powder and metal chips are handled together, so that a
differentiation according to the physical form would not reflect actual work practice. For
such a combined situation, however, higher variation of exposure levels can be
expected, so that more data points are required to still conduct a robust exposure
assessment.
2.1.3 Identifying data needs
For most metals and metal compounds, (inhalation) monitoring data already exist. If such
data are (still) reflective of current work practice and if the qualifying contextual information
(see Section 3.1) is available, they should be (re-)used as much as possible. An inventory of
exposure situations to be assessed together with the number of available measurements is
therefore a prerequisite for the planning of any monitoring campaign. Such inventory should
also include the variation and exposure estimate based on the historical data if such
calculations are already possible. When compared with the minimum number of required
measurements (please see Section 3.2.5.1.1), data gaps can be identified and taken into
account for defining the scope of the monitoring campaign. In addition, sector-coverage in
terms of monitored sites and workforce should be taken into account.
For example, where a given exposure situation to be monitored is relevant for several
sites, the number of measurements should be balanced between these sites as much
as possible taking into account the number of exposed workers at the individual sites if
the purpose is a sector-wide exposure assessment.
2.2 Sampling strategy
To enable robust (sector-wide) exposure assessments, monitoring should be conducted on a
representative basis, i.e. representative of regular working practices and workplace
conditions. Representative sampling therefore excludes any sampling during non-standard
settings (e.g. incidents) within the exposure situation to be assessed. The term “worst-case
sampling” is therefore misleading and should instead refer to sampling in a worst-case
exposure situation (which should not be grouped with a standard situation). Whether or not
such “worst case” situations are relevant for the purpose of the specific risk assessment7 can
only be assessed on a case-by-case basis whereas the same basic principles for monitoring
would still apply for the worst-case situation.
If data are obtained under the principles outlined in this document, it is assumed that they
could be re-used, e.g. for checking of compliance with an OEL at the company level where
such data have been obtained. Whether or not these data indeed fulfil specific requirements
as set in national legislation can only be decided by the responsible occupational hygienist
on-site by considering the specific metal substance concerned.
Thus, Section 4 provides an overview of available substance-specific guidance from
European sector organisations and a (non-exhaustive) selection of existing European and
American sampling standards.
7 For example, incidents and irregular, unscheduled repair work may be considered being outside the scope of standard REACH exposure scenarios and related risk assessment, whereas the protection of workers’ health in such situations would be ensured by separate measures.

Assessment of occupational exposure to metals Final Report
© 2016, EBRC Consulting GmbH, Germany 7
Types of monitoring for different exposure routes are briefly described in the following
sections.
2.2.1 Dermal exposure monitoring
Dermal exposure monitoring is conducted less frequently compared to inhalation exposure
monitoring. As explained in detail in the HERAG guidance8 (HERAG, 2007), different
sampling techniques exist for the measurement of potential or actual dermal exposure. It is
already stated in the aforementioned guidance that measurements of dermal exposure are
more difficult to interpret when compared to inhalation exposure data. Two conclusions of the
aforementioned guidance are of particular relevance for an appropriate sampling method in
the metals’ industry:
“[…] neither the use of cotton gloves nor the bag-wash method with their inherent
limitations are preferable methods […]“.
“[…] Particularly in the case of dermal exposure monitoring of inorganic compounds, it
is proposed for future measurements to make use of the wipe-sampling methodology.
The degree of standardisation and validation obtained with this method to date should
facilitate the collection of a comparable dataset for the future.”
2.2.2 Oral exposure monitoring
For workers, oral exposure is often assumed to be sufficiently controlled by strict
occupational hygiene practices (e.g. no eating and smoking in the workplace, washing hands
before eating, etc.) in most situations. However, inhalation of particles and subsequent
swallowing may still lead to inadvertent oral exposure.
Monitoring of oral exposure is however not further addressed in this guidance. In many cases
bio-monitoring (see Section 2.2.3) may be an alternative way to assess exposure resulting
from all routes, including the oral route.
2.2.3 Bio-monitoring
Bio-monitoring represents an additional tool to assess human exposure to a subset of
chemicals. In bio-monitoring, either body fluids such as blood or urine, or tissues are
examined in order to analyse levels of specific chemicals (either the agent of interest or its
metabolite). In addition, measurements of any indicator of effect (e.g., pulmonary function
testing) can be considered as bio-monitoring. While for some chemicals, the use of bio-
monitoring is less suitable9, the determination, for example, of blood lead levels is a common
procedure in Europe. Bio-monitoring data reflect uptake through all routes of exposure and
exposure in and outside the workplace. The uncertainty of the assessment of internal
exposure (that is after uptake) is less compared to substances for which exclusively external
8 http://www.ebrc.de/downloads/HERAG_FS_01_August_07.pdf 9 Substances for which (i) toxicokinetics (uptake into, distribution in and/or excretion from the human body) are not sufficiently investigated, (ii) an internal toxicological reference value is not available and/or (iii) the required sample of body fluid or tissue is difficult to obtain hindering an effective exposure/health monitoring of workers. In addition, if local effects in the lung are of concern, any measure of internal exposure may not adequately quantify the actual lung burden relevant for such type of effect so that external exposure monitoring may be more suitable or should be used in addition to bio-monitoring in this situation.

Assessment of occupational exposure to metals Final Report
© 2016, EBRC Consulting GmbH, Germany 8
exposure levels (dermal and/or inhalation exposure levels) are available. Also exposure via
the oral route (e.g. after inadvertent ingestion or hand-to-mouth transfer) is reflected in
bio-monitoring data. Several prerequisites are however to be fulfilled for an effective use of
bio-monitoring data. The most important is potentially the availability of an internal
toxicological threshold value or, if such a value is not available, the possibility to recalculate
from internal exposure levels obtained in bio-monitoring to an external threshold value.
Because of its highly substance-specific requirements, bio-monitoring is not further
addressed in this guidance.
2.2.4 Inhalation exposure monitoring
2.2.4.1 Type of inhalation monitoring
In principle, 2 types of inhalation monitoring approaches may be distinguished at first
instance: personal or static monitoring. For risk assessment purposes, a clear preference
should be given to personal sampling as naturally being more relevant for personal
exposure. For assessments under REACH, it is stated in the R.14 guidance (Version 2) that
“[…] Data collected using static samplers should only be used in the exposure
estimation if there is sufficient information provided to demonstrate how they reflect
personal exposures or that they provide a conservative estimate of personal exposures
[…]”.
However, static sampling has an important application in characterising/comparing particular
work areas or when exposure levels are very low and personal sampling will not collect
sufficient mass to be above the detection limit. Furthermore, it may be required to obtain
higher amounts of airborne dust from specific workplaces, for example, if chemical speciation
of the analysed elements is required for specific aspects in a risk assessment. This may be
the case if a metal has significantly less hazard potential when compared to its oxide form.
Due to possible higher air flow (larger pumps could be used) and longer sampling durations
than full-shift (see also Section 2.3), sampled mass can be increased in static sampling.
2.2.4.2 Sampling duration
In particular for inhalation monitoring, it is important to define the sampling duration by
considering (i) the type of effect (acute or chronic) to which the exposure assessment should
refer to and (ii) technical requirements imposed by the exposure situation (e.g. high dust
emissions may lead to overload of filters). Often, an exposure situation under REACH
applies to an entire work-shift, for which a sampling duration of at least 120 minutes
(considered as full-shift representative) should be foreseen if long-term effects are relevant.
When exposure levels are very low, longer sampling periods are required in order to collect
enough mass above the detection limit10. When an exposure situation is defined for less than
120 minutes, sampling should at least hold for the exposure duration defined.
10 The detection limit may be considered a constant (mass) for a given filter (e.g. expressed as mg/filter) when using the same analytical method. When expressing the detection limit as air concentration, the latter is directly correlated with the sampled air volume and therefore decreases with longer sampling durations.

Assessment of occupational exposure to metals Final Report
© 2016, EBRC Consulting GmbH, Germany 9
If exposure needs to be compared with reference values for acute effects, sampling may
either be conducted for 15 minutes only (as generally considered representative for short-
term exposure) in a peak exposure situation or a short-term exposure estimate may be
extrapolated from long-term measurements.
Section 3.2.5.3 provides further information on such extrapolation. In addition, MDHS 14/4
(10) provides the following information:
“[…] sampling duration should not be longer as reasonably practicable and should
reflect actual workplace conditions. Thus, the maximum sampling duration should be
an entire shift for comparison with reference values referring to full-shift exposure and
short-term samples (i.e. 15 minutes duration) should be taken for comparison with
short-term reference values. Task-specific sampling should be performed for the whole
duration of the tasks and for 8-hour time-weighted average (TWA) estimation of
exposure, the minimum sampling period should be 25 % of the shift.”
There is a possibility that large amounts of dust in the workplace air can cause the sample to
become overloaded in a period of time less than the period of interest for the sampling. In
such a case, it may be necessary to divide the period of interest of worker sampling into sub-
periods. This would result in multiple samples that would be analysed separately and
subsequently averaged.
When monitoring exposure to a specific substance, accompanying real-time measurements
(i.e. obtained with direct-reading instruments) can help assessing the existence of exposure
peaks. However, chemical speciation is not commonly feasible for real-time measurements.
Thus, careful interpretation of real-time measurements is required considering potential
contribution of additional exposure sources potentially not related to the contaminant of
interest.
2.3 Sampling equipment (for monitoring of inhalation exposure)
Substances that are present in workplace atmosphere can potentially be inhaled by workers.
Contaminants may be present as gases/vapours (i.e. substances being present as individual
molecules) or aerosols of fine liquid droplets and/or airborne dust (including fumes). Whereas
gases/vapours are small by nature and thus have the ability to access the entire human
respiratory tract (HRT), for aerosols, this ability heavily depends on the size of the droplets or
particles actually being present.
Inhalation exposure to metals or metal compounds commonly occurs via dust suspended in
workplace atmosphere. For local effects, depending on the specific location in the respiratory
tract where the effect occurs, specific fractions of dust may be relevant for exposure
assessment. These fractions are defined by the ability of particles to penetrate in certain
areas of the human respiratory tract.
Airborne dust cannot be characterised by a single particle size figure since it greatly varies
even in a single workplace. Consequently, in terms of particle size, airborne dust is better
characterised by a particle size distribution (PSD). According to BS EN 481, such a PSD can
be fractionated according to the ability of the particles to penetrate to specific regions of the
HRT.

Assessment of occupational exposure to metals Final Report
© 2016, EBRC Consulting GmbH, Germany 10
In BS EN 481, the most common fractions are defined as the:
- inhalable fraction (particles that could potentially be inhaled),
- thoracic fraction (particles that could penetrate beyond the larynx) and
- respirable fraction (particles that could penetrate to the unciliated airways).
It is noted that the respirable fraction is a sub-fraction of the thoracic fraction, which is a sub-
fraction of the inhalable fraction (e.g. a particle that penetrates to the unciliated airways
needs to be inhaled). For each of these fractions, target specifications for sampling
instruments are given in BS EN 481 as the percentage (E) of airborne particles of
aerodynamic diameter (D) in µm which are to be collected:
- for the inhalable convention as defined by EI = 50 ∙ (1 + 𝑒−0.06∙𝐷),
- for the thoracic convention (ET) as defined by the percentage of EI given by a
cumulated lognormal distribution having a median of 11.64 and a geometric standard
deviation (GSD) of 1.5 and
- for the respirable convention (ER) as defined by the percentage of ET given by a
cumulated lognormal distribution having a median of 4.25 and a GSD of 1.5.
It can be seen in the figure below that ER is a sub-fraction of ET being a sub-fraction of EI:
Figure 1: Target specifications of sampling conventions
It is important to note that BS EN 481 also mentions a term “total airborne particles” defined
as “All particles surrounded by air in a given volume of air”. This term is however different
from the so-called “total fraction”. The latter term is associated with samplers only sampling a
sub-fraction of EI and would therefore underestimate exposure if the inhalable fraction is of
concern. It was tried in the past to establish conversion factors converting measurement
results for the total fraction into values for the inhalable fraction with varying success and
regulatory acceptance. It needs to be noted that such factors can only be established by
paired sampling (i.e. simultaneous sampling of the total and the inhalable fraction) with a
sufficient number of replicates and that such factors are highly variable between metals and
their compounds and workplaces. Further information on the derivation of such factors is
given in Section 3.2.2.
0%
25%
50%
75%
100%
0.1 1 10 100
Cu
mu
late
d m
as
s p
erc
en
tag
e o
f a
irb
orn
e p
art
icle
s
Aerodynamic diameter [µm]
Inhalable convention
Thoracic convention
Respirable convention

Assessment of occupational exposure to metals Final Report
© 2016, EBRC Consulting GmbH, Germany 11
Since all commercially available samplers are size-selective, the fraction of dust that could
be sampled needs to be considered when selecting samplers. The table below provides an
overview of commonly used samplers. Further information can be found, for example, in
Vincent (2007) and MDHS 14/3 (including pictures) and MDHS 14/4.
During sampling, special attention should be given to the avoidance of sampling losses due
to material adsorbed on sampler walls.
Table 1: Commonly used samplers for monitoring of specific fractions of dust
Name Manufacturer Type of
sampling*
Required air flow [L/min]
Filter diameter
[mm]
Fraction of dust**
Comments
IOM sampler
SKC Ltd. personal 2 25 I well validated, commonly used
in the UK and other EU countries
GSP 3.5/10
GSA personal 3.5 / 10 37 I well validated, commonly used in German speaking countries
FSP 2/10 GSA personal 2 / 10 37 R commonly used in German
speaking countries
Cyclone SKC Ltd. personal 2.2 25 / 37 R commonly used in the UK and
other EU countries
PGP-EA GSA personal 3.5 37 I & R less validated, often used for
comparative purposes
Respicon TSI personal 3.11 37 I, T, R less validated, often used for
comparative purposes
VC 25 GSA static 375 150 I or R very high air flow enabling
higher detection limits
*It is noted that all personal samplers can principally also be used for static (area) sampling. **Inhalable (I), Thoracic (T), Respirable (R)
In addition to the sampler (or the sampling head), the filter material and the sampling pump
need to be selected. The filter material should be suitable for the detection of the metal of
interest. Sampling pumps should reliably provide a constant air-flow for the measurement
duration. It should be acknowledged that each sampler type requires a defined air flow
(commonly 2 L/min – 10 L/min for personal sampling and higher flow rates for static
sampling, see Table 1). A typical sampling system is schematically represented in the figure
below:
Figure 2: Schematic representation of a sampling system for inhalation exposure
Workplace Aerosol Sampler Filter Flow
Calibration Air Pump

Assessment of occupational exposure to metals Final Report
© 2016, EBRC Consulting GmbH, Germany 12
2.4 Quantification of exposure levels from obtained samples
In view of the existence of nuisance dust or general process dust not related to the
substance of interest and its potential to bias the substance exposure assessment, the
results of the gravimetric analysis of dust deposited on the filters should not be used in
isolation when carrying out metal risk assessments. Instead, the metal content should always
be quantified by chemical means. In most cases an elemental analysis and recalculation to
the substance of interest is sufficient if the reference value to which exposure is to be
compared (e.g. DNEL or OEL) is not already given as metal concentration, so that further
chemical speciation is often not required.
A number of documents are available providing guidance on the determination of individual
substances in monitoring samples. For example, the UK Health and Safety Executive has a
website where so-called “Methods for the Determination of Hazardous Substances (MDHS)
guidance” are available free of charge: http://www.hse.gov.uk/pubns/mdhs/. On this website,
information on the analysis of e.g. lead, cobalt or nickel in air can be found. In addition,
several European Standards exist, providing information on measurements of chemical
agents in workplace atmospheres (e.g. EN 689). More detailed information may also be
available in metal-specific guidance as referenced in Section 4 of this document.
3 Reporting and analysis of sampling results
3.1 Reporting
Regardless of whether monitoring data are to be generated de novo and/or data of historical
nature are to be used, the exposure assessor always has to ascertain that a specific level of
data quality is achieved and maintained. The assessment of data quality strongly relies on
the documentation of the monitoring data. The required information can be divided into:
(i) basic information requirements,
(ii) required contextual information and
(iii) further information not essentially required.
3.1.1 Basic information requirements
Basic information as listed below may most easily be reported together with the monitoring
values in spreadsheet format as the information is likely to vary for individual measurements
within a data set:
1. Measurement result together with unit – it is noted that individual raw data should be
reported, i.e. no aggregated figures (e.g. averages) and no (calculated) time weighted
averages (TWA)
2. Handled substance(s) (preferably including information on the handled physical form)
3. Analysed substance
4. Type of monitoring, i.e. personal or static sampling
5. Sampling duration
6. Measured fraction of dust according to BS EN 481, e.g. inhalable, thoracic or
respirable (see Section 2.2.3 for further explanation)
7. Sampling date
8. Unique worker ID (can be anonymised) for personal sampling

Assessment of occupational exposure to metals Final Report
© 2016, EBRC Consulting GmbH, Germany 13
9. Sampling equipment (sampling head, sampling pump)
10. Method of chemical quantification/analysis
11. Limit of detection (LOD) and limit of quantification (LOQ)
12. Monitored exposure situation (link to contextual information, please see below)
3.1.2 Required contextual information
Contextual information may be given per exposure situation in a questionnaire-like format
enabling linking to measurement data (via exposure situation/workplace):
1. Exposure situation including reference to sector/role in the supply chain (e.g. surface
coating with metal X)
2. Workplace identification (e.g. plating shop)
3. Conducted process (e.g. surface treatment)
4. Operations/tasks conducted by worker (e.g. sampling and replenishment)
5. Operational conditions (OC):
a. Frequency and duration of exposure of worker conducting the monitored
task(s) (e.g. 120 min twice a shift)
b. Amount of substance handled (e.g. 5 kg per shift)
c. Process conditions as relevant (e.g. heated bath 80°C, high current applied)
d. Level of automation, etc. (e.g. manual)
6. Localised controls
a. e.g. enclosure during plating
b. e.g. rim ventilation
c. etc.
7. Personal protective equipment (PPE) worn by monitored worker11
3.1.3 Further information
Further information may help understanding the exposure settings or may enable the use of
the monitoring data for the calibration of exposure assessment tools. A selection of such
information is provided in Appendix 1 and Appendix 2.
3.2 Data management and data analysis
Data may be most easily arranged in a spreadsheet format enabling quick and correct data
manipulation and analysis. The spreadsheet should contain separate columns for the
information listed in Section 3.1.1 and list the monitoring results in separate rows. Such data
format (flat-file format) facilitates further use of the data set in statistical software packages
for advanced data analysis and also makes best use of built-in functionalities of spreadsheet
software such as sorting and filtering.
11 It is noted that air sampling for occupational exposure assessments is normally conducted outside any respiratory protective equipment (RPE), so that records of RPE used during sampling can be compared with the results of the risk characterisation. Dermal exposure is often measured by skin wiping, i.e. below any potentially worn skin protection. Records of such PPE are therefore required for the exposure assessment and risk characterisation.

Assessment of occupational exposure to metals Final Report
© 2016, EBRC Consulting GmbH, Germany 14
3.2.1 Treatment of historical inhalation monitoring data
The use of historical inhalation monitoring data for conducting exposure assessments may
be possible in case these data are still relevant for the respective assessment. This decision
has to be made based on the available information. In general, basic information
requirements (including contextual information) as described in Section 3.1 above have to be
considered.
Reasons for excluding historical monitoring data are, e.g.:
Closing down of a company/site
Change in the conditions of use
o Change in product characteristics
o Change in operational conditions such as availability of localised controls (e.g.
LEV)
o Change in risk managements measures such as personal protective
equipment (not relevant for inhalation exposure monitoring but for dermal
exposure monitoring and bio-monitoring data)
However, for a sector-wide assessment, it may be beneficial to still include data, for example,
from a site that has been closed down if the conditions of use are still relevant for other sites
to be assessed. Highlighting again that careful documentation of monitoring data as
described above (see Section 3.1) is required so that the similarity of the conditions of use
(i.e. of the closed-down site and other sites) can be assessed appropriately.
3.2.2 Treatment of inhalation monitoring data for the total fraction of dust
In 1993, a European standard on the sampling efficiency of air samplers was issued
(BS EN 481). According to this standard, samplers may be categorised on the basis of their
sampling efficiency of particles of certain size ranges (or fractions - please refer to
Section 2.2.3 for further information). In the EU today, the most important fractions are the
respirable (RF) and the inhalable fraction (IF). However, older monitoring data, data from the
US or some European countries, or data for specific substances may have been obtained for
the so-called total fraction (TF). In contrast to the intuitive interpretation of the term, it is
important to note that the TF represents a sub-fraction of the IF (please refer to Section 2.3
for further information fractions of dust according to BS EN 481). Thus, if sampling results for
the TF were to be compared with a threshold value (e.g. DNEL or OEL) given for the IF, the
comparison would lead to an underestimation of risk due to the lower sampling efficiency of
the samplers used.
There are 2 cases in which measurements of the TF need to be converted to the IF: firstly,
since air monitoring is expensive and time consuming, discarding of existing data should be
avoided in an exposure assessment. Secondly, an OEL (or DNEL) may need to be derived
for the IF but occupational health studies reporting inhalation exposure according to the TF
are to be considered. Obviously, both cases have different requirements in terms of a
conversion methodology.
For an exposure assessment, different conversion factors (S) may be relevant depending on
the particle size distribution of airborne dust. As a rule of thumb, it can be said that S
increase with increasing particle size. Preferentially, S are derived for distinct exposure
settings and are applied as such to TF data obtained in these settings individually.

Assessment of occupational exposure to metals Final Report
© 2016, EBRC Consulting GmbH, Germany 15
If S are not differentiated for specific workplaces, substantial uncertainty could be introduced
in the exposure assessment.
For example, in an exposure assessment, TF data may exist for 3 workplaces, namely
smelting, grinding and powder handling (packaging). S of 1.2 and 2.7 have been
derived for smelting and packaging, respectively. An overall conversion factor of 2 was
calculated as an average of the available S. When converting, it is important that the
differences in S are acknowledged at the level of the individual workplaces.
Consequently, TF data for smelting will be converted to IF by using a factor of 1.2, TF
data for packaging by using a factor of 2.7. Obviously, if only the average conversion
factor would have been used for all workplaces, exposure in the smelting workplace
was over-estimated, whereas exposure in the packaging workplace was under-
estimated. How data for which an explicit S was not obtained could be converted (i.e.
for the grinding workplace in this example), is explained in the next section.
If a workplace-specific conversion is rigorously followed, it appears justified to merge such
converted data with existing IF databases for the purpose of exposure estimation if all other
requirements as described above (i.e. similar conditions of use).
When converting exposure information given as TF (from a health-effect study in workers like
a cohort study) to IF exposure information needed for the purpose of threshold-setting (e.g.
DNEL), the same principle of workplace-specific conversion applies. However, the
consequences of using wrong (or too highly aggregated) S are obviously inverted: using too
high S would lead to an under-protection of workers, as the IF exposure levels at which
effects were (not) observed would be over-estimated and vice versa.
3.2.2.1 Derivation of conversion factors
Kenny et al (1997) compared sampling efficiencies of the GSP and IOM sampler (both IF)
with the efficiency of a 37 mm closed face cassette sampler (CFC; TF). It was found that the
samplers for the IF and the CFC were in good agreement for particle sizes up to 10 µm (as
would be applicable to fumes). For larger particle sizes (10 µm – 100 µm), it was however
found that the CFC considerably under-samples the IF confirming the results of studies by
Tsai et al. (1995) and Werner et al. (1996). Vincent (2007) provides a summary of related
studies published until 2003 in Table 22.2. In this table, a total of 974 measurements for 27
different workplaces and industries originating from 10 comparative studies are summarised.
The 31 values for S (summary ratio of IF and TF) are reported between 0.92 and 3.64.
It is noted that S were calculated by the authors using 1 out of 3 different methods, as listed
below:
1. Slope of the regression line (least squares or weighted least squares)
2. Arithmetic mean of the ratio of the individual sampling pairs
3. Ratio of the median of the exposure distribution for IF and TF
It can be seen that all estimates of S are based on the central tendency (or similar measures)
of the distribution of the ratios of paired data points but do neither include a measure for the
variability nor for the statistical confidence (e.g. related to the number of observations) in S.
Such measures would help in assessing the uncertainty associated with using S. Given the
differences of S between exposure settings even for the same substance, a measure of
variability would also help in identifying whether the assessed situation needs to be further
differentiated.

Assessment of occupational exposure to metals Final Report
© 2016, EBRC Consulting GmbH, Germany 16
For the derivation of threshold values, EBRC (2015a) suggested an amended scheme
originally developed by Werner et al. (1996). This scheme considers the level of knowledge
about the workplaces examined in the health effect study (e.g. cohort study) in a tiered
approach.
Table 2: Tiered approach for the derivation of conversion factors from total to inhalable
fraction for threshold derivation (translated from EBRC, 2015a)
Available
information Tier
Health effect
study (HES) Comparative study Conversion factor
Information on
workplace, task and
type of exposure
0 unknown not relevant 1 (no conversion)
1 at least type of
exposure is known
not available
factors according to Werner et al. (1996), grouped for type of exposure as reported in HES:
Dust: 2.5 Mist: 2.0 Hot processes: 1.5 Fumes: 1.0
2 known
measurements of the total and inhalable fraction at the same workplace paired via the rank of the exposure values (i.e. not
necessarily simultaneous measurements)
prerequisite: exposure control measures have to be equal or better when monitoring
the inhalable fraction
Lower 95 % confidence limit of the arithmetic mean
3 known simultaneous measurements of total and inhalable fraction at the same workplace
and task
Lower 90 % confidence limit of the arithmetic mean
3.2.2.2 Conversion factors derived and used in the metals’ industry
Various conversion factors (S) converting measurement results for the total fraction (TF) into
values for the inhalable fraction (IF) were established in the past with varying regulatory
acceptance. A summary of established S, how they were derived and how they were used is
given in the table below.

Assessment of occupational exposure to metals Final Report
© 2016, EBRC Consulting GmbH, Germany 17
Table 3: Conversion factors (S) derived for various metal workplaces (adapted and
amended from Vincent (2007))
Metal Workplaces S (n) Method* Used for Region of regulatory
acceptance References
EA TD
Al Welding 1.36 (15) WLS Not evaluated Wilsey et al. (1996)
Aluminium smelter potroom
2.8 (30) A X NOR Nordheim (2015)
Be CuBe processing 2.88 (39) GM X Pending in DE Kock et al. (2015)
Fe n.r. 1.39 (54) A Not evaluated Demange et al. (2002)
Mn n.r. 2 (n.r.) n.r. X EU, DE DFG (1994)
Ni
Matte grinding Chlorine leaching Roasting/smelting
Electrolysis Alloy production
Mining Milling
Smelting A Smelting B
Refining Electroplating 1 Electroplating 2
1.8 (11) 1.7 (14) 2.3 (12) 1.5 (13) 2.3 (46) 3.2 (32) 2.7 (21) 2.8 (23) 1.7 (35) 2.1 (36) 2.0 (21) 3.0 (21)
WLS WLS WLS WLS WLS WLS WLS WLS WLS WLS WLS WLS
X X US
Werner et al. (1999) “ “ “
Tsai et al. (1996b) Tsai et al. (1995)
“ “ “ “
Tsai et al. (1996a) “
Pb Smelter Battery
1.77 (151) 1.29 (11)
WLS RM
Not evaluated Spear et al. (1997)
Vinzents et al. (1995)
V
Abrasive Process Hot Process
Material Handling Other
Wet Process
n.d. (1) X (9)
X (16) X (9) X (3)
LCL X Pending in DE
EBRC (2015b) “ “ “ “
S=Conversion Factor; EA=Exposure Assessment; TD=Threshold Derivation, n.r.=not reported, X=confidential information *A=Average of the individual paired sample ratios; GM=Geometric Mean of the individual paired sample ratios; LCL=Lower Confidence Limit (90 %) of the arithmetic mean of the individual paired samples ratios; RM=Ratio of Medians of cumulative exposure distributions for TF and IF; WLS=Weighted Least Squares
As can be seen from the table above, reported S-values range from 1.3 to 3.2 for various
workplaces and metal industries.
3.2.3 Treatment of values below the limit of detection
At first instance, values below the limit of detection (LOD) should be reported and analysed
as LOD. However, if a data set includes many results below the LOD12, exposure estimates
derived from that data set may be biased. This is of particular importance if the LOD is close
to the threshold value. In such cases, standard procedures are commonly followed for
modifying the LOD to a more relevant value. Dividing the LOD by 2 or √2 is thereby common
practice. It is noted that this method should not be applied to datasets containing a high
percentage12 of values below LOD and only with caution for a medium percentage of values
below LOD.
12 Percentage of LODs in dataset can be categorised as low: ≤ 20 %, medium: 20 % to 50 %, high: 50 % to 80 %, and severe: 80 % to 100 % (Hewett, 2006).
Assessment of occupational exposure to metals Final Report
© 2016, EBRC Consulting GmbH, Germany 18
Hewett (2006) describes several methods for treating values below the LOD in occupational
exposure assessments:
1. Removal (not recommended)
2. Substitution (by LOD, by LOD/2 or by LOD/√2)
3. Log-probit regression (LPR)
4. Maximum Likelihood Estimation (MLE)
Hewett suggests using substitution only for datasets containing at maximum a medium
percentage of values below LOD. In other cases, LPR may be used provided that the sample
size is larger than n=15. MLE could be used with even smaller sample sizes.
In cases in which the result is below the limit of quantification (LOQ) but still above LOD,
Hewett suggests either using the (unreliable) measured exposure level or to basically apply
one of the methods for treatment of values below the LOD as listed above.
However, any modification of a dataset as indicated above should be reported together with
the exposure assessment results.
3.2.4 Calculation and use of time weighted averages
If the exposure duration is significantly shorter than full-shift, the calculation of time weighted
averages (TWA) may be a useful refinement option for monitoring data. Further information
on how such calculations are to be conducted can be found, for example, in EH40/2005. It
needs to be noted that the use of TWA in the risk assessment of workers does narrow the
applicability of the risk assessment in the following ways:
1. if workers switch between exposure situations (workplaces and/or tasks), TWA are
difficult to calculate and introduce further uncertainties in the assessment,
2. exposure duration needs to be restricted in REACH exposure scenarios according to
the assumptions made in the calculation of the TWA.
However, any modification of a dataset as indicated above should be reported together with
the raw data.
3.2.5 Derivation of exposure estimate
Exposure concentrations vary with time and between workers even if other key exposure
factors are kept constant. Reasons for variability may be inter-worker differences in working
practices, varying process parameters, differences in the nature of the handled materials
(e.g. varying moisture content), etc. In an exposure assessment, it is therefore important to
derive an exposure estimate on the basis of repeated measurements for the same exposure
situation to account for such variability.
Within the scope of this guidance, any exposure assessment is assumed to relate to an
industry sector rather than to individual companies. Consequently, individual measurements
are no longer attributable to individuals (although preferably generated by personal
monitoring) but instead have to be seen as records of exposure levels which were observed
for a specific exposure situation. Consequently, the exposure estimate derived represents a
point estimate of potential exposure but is not related to individual workers.

Assessment of occupational exposure to metals Final Report
© 2016, EBRC Consulting GmbH, Germany 19
For example, in an exposure assessment for an exposure scenario required under
REACH, monitoring data from 2 companies may be used. Similarities in conditions of
use allow merging of both datasets for a given exposure situation. Both companies
have provided 20 data points. Company A has provided monitoring data from 20
workers (all workers monitored once) and company B has provided repeated
measurements from 10 workers (all workers monitored twice). Although inferential
statistics could help in identifying the contribution of personal behaviour, any derived
exposure estimate from the data set of 40 values does no longer relate to an individual
worker but instead indicates the likelihood that any worker may experience a certain
exposure level in the given exposure situation13.
The concept of potential exposure has consequences on the accepted probability that the
estimated exposure level exceeds a given (toxicological) threshold. Whereas individual
workers should never (or, more precisely, with very low probability) exceed the given
threshold, the probability for potential exposure being above the threshold is commonly
accepted at higher percentages. International and European standards, technical notes for
guidance or technical guidance to legislation indicate probabilities ranging from 5 % to 25 %.
In addition, when it comes to long-term effects (of a population of workers), the
corresponding toxicological reference values (e.g. DNEL), commonly consider life-time
exposure of workers (often by assuming 40 working years). In other words, the exposure
estimate when compared to a chronic DNEL, should be reflective of life-time exposure.
Although individual worker’s behaviour is an important exposure factor, it appears unlikely
that any single (real) worker would be constantly exposed to upper percentile exposure
levels during his or her entire working career.
In contrast to the most likely exposure level (often referred to as “typical” exposure level),
estimates at the higher end of the exposure distribution are often called reasonable worst
case (RWC) exposure levels. There are various ways how these percentiles can be
calculated. Depending on the legal framework for which the assessment is conducted,
empirical percentiles, percentiles from parameterised log-normal distributions, confidence
intervals of means or similar statistics may be used.
3.2.5.1.1 Descriptive statistics
The exposure estimate as such, is a summary statistic derived from the results of the
repeated measurements. The type of the summary statistic used depends on the context in
which the exposure assessment is conducted. In risk assessments, the 90th percentile of the
data set is commonly accepted representing an estimate for the reasonable worst case
exposure level, whereas the median (or 50th percentile) is often used as an estimate for the
typical exposure level. Percentiles can be calculated with standard spreadsheet or statistical
software, whereas it is noted that different algorithms may be implemented in the various
programs.
13 From a statistical point of view all data points should be stochastically independent in addition, which is ignored here for the sake of brevity of this example.

Assessment of occupational exposure to metals Final Report
© 2016, EBRC Consulting GmbH, Germany 20
According to Hyndman & Fan (1996), 9 different algorithms exist, whereas the general form
of:
Q(p)=(1-f)X[i]+fX[i+1]
applies to all types and Q(p) is the pth quantile (percentile) of the data set, i is the integer part
and f is the fractional part of the calculated rank statistic. This rank statistic can be calculated
as given below:
Type 1: i.f=np; but f is always set to 0,
Type 2: i.f=np; but if f=0 then f=0.5 else f=0,
Type 3: i.f=np; but if f<0.5 then f=0 else f=1,
Type 4: i.f=np,
Type 5: i.f=np+0.5,
Type 6: i.f=(n+1)p,
Type 7: i.f=(n-1)p+1,
Type 8: i.f=(n+1/3)p+1/3 and
Type 9: i.f=(n+1/4)p+3/8
with n representing the number of values.
The selection of the percentile should also consider if sufficient monitoring data are available.
The figure below contains a table on data requirements as provided in the R.14 guidance
(Version 2). If these data requirements are not met, it is suggested to select higher
percentiles (e.g. 95th) to account for higher uncertainties. On the other hand, in cases in
which sufficient data are available and the geometric standard deviation (GSD) suggests a
high specificity of the data set to the exposure situation to be assessed (for example,
GSD < 2 and n > 11), the use of the 75th percentile may be justified.
Source: European Chemicals Agency, http://echa.europa.eu/
Figure 3: Required number of measurements, excerpt from R.14 guidance, Version 2

Assessment of occupational exposure to metals Final Report
© 2016, EBRC Consulting GmbH, Germany 21
In addition to the exposure estimate, the following statistics should always be reported:
minimum and maximum value, median value, geometric mean and GSD and the number of
values. Whereas dedicated functions are included in spreadsheet software for most of the
statistical figures, the GSD requires additional calculation steps. The table below includes the
statistical figures suggested to be reported and how they can be derived in commonly used
spreadsheet software.
Table 4: How to calculate required summary statistics in spreadsheet software
Summary statistic How to calculate in spreadsheet software
Number of values =COUNT(values)
Minimum value =MIN(values)
Maximum value =MAX(values)
Median value =MEDIAN(values) or =PERCENTILE(values,0.5)
Geometric mean =GEOMEAN(values)
Geometric standard deviation 1st step: Calculate natural logarithm for each value by =LN(value)
2nd step: Calculate standard deviation of the calculated natural logarithms
of the values =STDEV(ln-values)
3rd step: Calculate e raised to the power of the calculated standard
deviation =EXP(STDEV(ln-values))
pth percentile (with 0 ≤ p ≤ 100)*
- empirical
- parametric (log-normality
assumption**)
=PERCENTILE(values,p/100)
=LOGNORM.INV(p/100,LN(GEOMEAN(values)),LN(GSD))
*Two main methods may be used to derive percentiles from a data set: (i) calculation of empirical percentiles or (ii) calculation of percentiles from a fitted (parameterised) distribution. While (i) may be calculated by one out of 9 algorithms (all potentially giving different results, see Hyndman and Fan, 1996), (ii) requires knowledge about the underlying distribution and an efficient handling of values below the limit of detection as these may have a significant impact on the moment estimates (e.g. GM and GSD). For standard applications when the underlying distribution is log-normally distributed and monitoring data are obtained on a representative basis, the use of empirical percentiles may lead to sufficiently accurate results. In these cases, commonly available spreadsheet software can be used because the most appropriate algorithm for the calculation of percentiles for log-normally distributed data is implemented in such programs (see Hyndman, R.J. & Fan, Y. (1996): Sample quantiles in statistical packages, American Statistician, 50, 361-365).
**Such assumption should be examined by a goodness of fit test (e.g. Anderson-Darling or Kolmogorow-Smirnov).
Exposure data are often following a lognormal distribution. As an intrinsic property of such
distributions, the probability of sampling values significantly different from typical exposure
levels is higher when compared to normal distributions. In practice, exposure assessors have
to decide whether such values indeed belong to the same exposure distribution or whether
they represent artefacts resulting from mistakes done when sampling and/or chemical
analysis was conducted or results were reported and/or interpreted. Although statistical
methods exist for identifying such outliers, it is recommended to check the given contextual
information and to correct mistakes if possible instead of excluding precious data points from
data analysis. Mistakes are often related to wrong units, typos or wrong assignments to
exposure situations.

Assessment of occupational exposure to metals Final Report
© 2016, EBRC Consulting GmbH, Germany 22
3.2.5.1.2 Inferential statistics
So far, focus was given in this section to the use of descriptive statistics, i.e. statistics that
describe the data set as such. However, since exposure data sets are only a sample out of
all exposure levels possibly occurring in a given exposure situation, any statistics exclusively
based on the data set will be a reflection of the measured exposure levels rather than of all
exposure levels possible. In particular, values at the tails of the (real) exposure distribution
are difficult to estimate from a sample since the possibility to measure such levels is low (that
is the reason why they appear at the tails of the distribution). A small data set will therefore
most likely contain only values from the centre of the distribution. Thus, the fewer
measurements are available, the more uncertainties are associated with the exposure
estimate. This is in particular true when the estimate refers to an upper percentile (of the real
exposure distribution).
Inferential statistics can add information to point estimates of exposure by considering the
extent and variability of the data set. Such information is normally given as confidence
interval indicating a range in which the true (real) value can be found with a given probability
(often 95 %). A good overview on statistical methods is, for example, provided in Ignacio et
al. (2006). In addition to the methods mentioned there, bootstrapping may be used to derive
confidence limits for any given statistic.
3.2.5.2 Exposure assessment under REACH
According to current ECHA guidance on occupational exposure assessment (R.14), the
spread of the exposure distribution as expressed by the GSD has to be taken into account
when assessing the specificity of the data set to the exposure scenario under investigation:
whereas highly specific and robust data sets (i.e. low GSD < 2 and n > 11) could justify the
selection of the 75th percentile as an exposure estimate14, higher GSDs would normally
require the selection of higher percentiles, such as the 90th (default) or even the 95th
percentile. Additionally, the GSD level is to be taken into account when estimating the
required minimum number of data points for an individual exposure assessment: more data
points are required with increasing GSD. Further information is provided in Section 3.2.5.1.1.
3.2.5.3 Extrapolation from full-shift exposure levels to short-term exposure
levels
Inhalation monitoring data are often made available as full-shift representative sampling
results. Thus, when comparing to acute effect levels, additional exposure estimates have to
be derived for peak exposure levels. Kumagai & Matsunaga (1994) have investigated into
possible factors for such extrapolations. The following table has been generated by
considering their findings in a way that only exposure duration of 15 minutes and 95th
percentiles for peak exposure estimates are considered relevant:
14
In R.14 (Version 3), ECHA suggests using the 75th percentile if monitoring data were obtained under worst-case conditions.

Assessment of occupational exposure to metals Final Report
© 2016, EBRC Consulting GmbH, Germany 23
Table 5: Extrapolation factors from full-shift to peak exposure levels
GSD Full-shift estimate based on
75th percentile 90th percentile
1 - 2 3 2.2
2 – 4 3 2.0
4 – 6 4 1.5
6 – 8 5 1.4
> 8 6 1.4
It is noted that extrapolation factors for full-shift exposure estimates based on higher
percentiles than the 90th would be extrapolated by using the factors as given for the 90th
percentile on a conservative basis.
For example, extrapolation from a full-shift level (P90) of 100 µg/m³ based on data with
a GSD of 2.5 to a peak exposure estimate would be done by using a factor of 2
resulting in a peak exposure estimate of 200 µg/m³.

Assessment of occupational exposure to metals Final Report
© 2016, EBRC Consulting GmbH, Germany 24
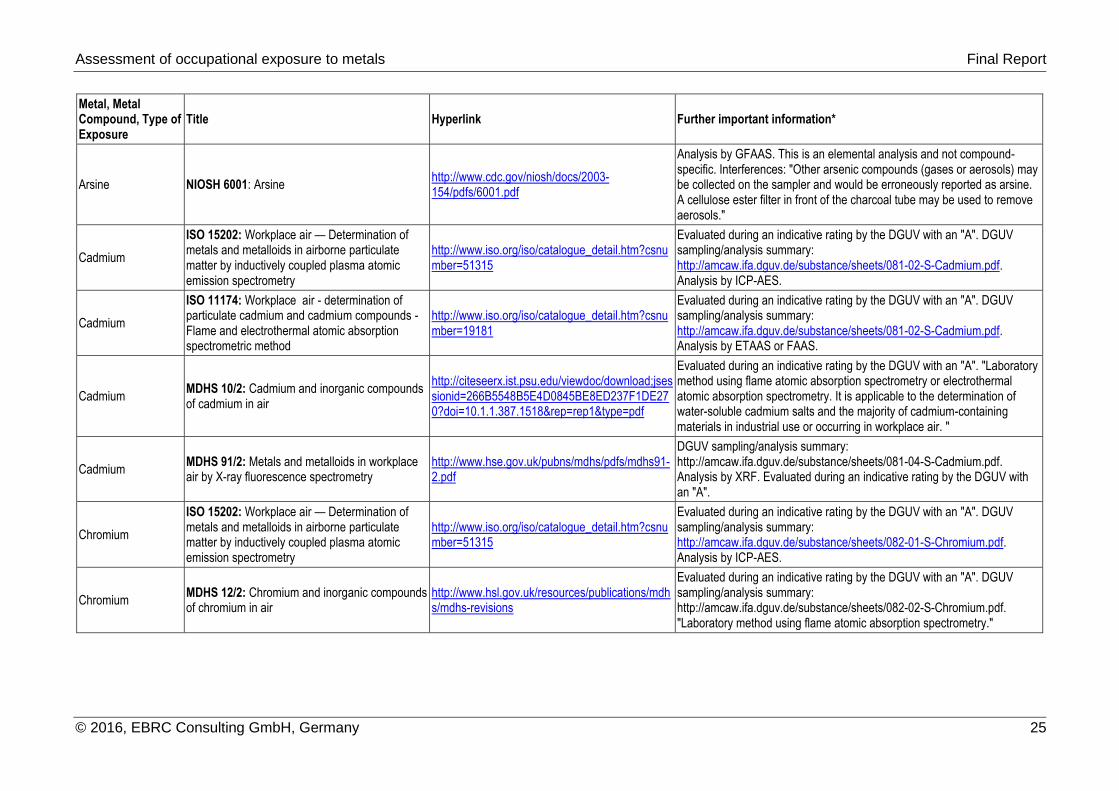
4 Summary of substance-specific sources of information
Metal, Metal Compound, Type of Exposure
Title Hyperlink Further important information*
Aluminium NIOSH 7013: Aluminium and compounds, as Al http://www.cdc.gov/niosh/docs/2003-154/pdfs/7013.pdf
Analysis by flame AAS. Citation: "Alumina (Al2O3) will not be dissolved by this procedure. Lithium borate fusion is necessary to dissolve alumina. The following sample preparation gave quantitative recovery for soluble aluminium compounds."
Aluminium OSHA ID-121: Metal & metalloid particulates in workplace atmospheres (atomic absorption)
https://www.osha.gov/dts/sltc/methods/inorganic/id121/id121.pdf
Analysis by FAAS or AES for 32 elements (Al, Au, K, Sb, Hf, Se, Ba, In, Ag, Bi, Fe, Na, Cd, Pb, Te, Ca, Li, Tl, Cs, Mg, Sn, Cr, Mn, Ti, Co, Mo, Y, Cu, Ni, Zn, Pt, Zr.), but for some elements and/or their substances there are alternate methods or stopgap procedures available.
Aluminium OSHA ID-109_SG: Aluminium oxide in workplace atmospheres
https://www.osha.gov/dts/sltc/methods/inorganic/t-id109sg-pv-02-0110-m/t-id109sg-pv-02-0110-m.pdf
Analysis by AAS.
Aluminium IFA 6060: Aluminium (A-Staub) http://www.ifa-arbeitsmappedigital.de/6060
Arsenic and compounds
MDHS 41/2: Arsenic and inorganic compounds of arsenic (except arsine) in air.
http://www.hsl.gov.uk/resources/publications/mdhs/mdhs-revisions
"Laboratory method using continuous flow or flow injection analysis hydride generation atomic absorption spectrometry." Evaluated during an indicative rating by the DGUV with an "A".
Arsenic and compounds
MDHS 91/2: Metals and metalloids in workplace air by X-ray fluorescence spectrometry
http://www.hse.gov.uk/pubns/mdhs/pdfs/mdhs91-2.pdf
Not applicable for As2O3. DGUV sampling/analysis summary: http://amcaw.ifa.dguv.de/substance/sheets/079-04-S-Arsenic.pdf. Analysis by XRF. Evaluated during an indicative rating by the DGUV with an "A".
Arsenic and compounds
ISO 11041: Workplace air -- Determination of particulate arsenic and arsenic compounds and arsenic trioxide vapour -- Method by hydride generation and atomic absorption spectrometry
http://www.iso.org/iso/iso_catalogue/catalogue_tc/catalogue_detail.htm?csnumber=19021
Not applicable for arsenic in the form of metal arsenides. DGUV sampling/analysis summary: http://amcaw.ifa.dguv.de/substance/sheets/079-01-S-Arsenic.pdf. Analysis by AAS. Evaluated during an indicative rating by the DGUV with an "A".
Arsenic and compounds
ISO 15202: Workplace air — Determination of metals and metalloids in airborne particulate matter by inductively coupled plasma atomic emission spectrometry
http://www.iso.org/iso/catalogue_detail.htm?csnumber=51315
Evaluated during an indicative rating by the DGUV with an "A". DGUV sampling/analysis summary: http://amcaw.ifa.dguv.de/substance/sheets/079-02-S-Arsenic.pdf. Analysis by ICP-AES. Not applicable for As2O3.
Assessment of occupational exposure to metals Final Report
© 2016, EBRC Consulting GmbH, Germany 25
Metal, Metal Compound, Type of Exposure
Title Hyperlink Further important information*
Arsine NIOSH 6001: Arsine http://www.cdc.gov/niosh/docs/2003-154/pdfs/6001.pdf
Analysis by GFAAS. This is an elemental analysis and not compound-specific. Interferences: "Other arsenic compounds (gases or aerosols) may be collected on the sampler and would be erroneously reported as arsine. A cellulose ester filter in front of the charcoal tube may be used to remove aerosols."
Cadmium
ISO 15202: Workplace air — Determination of metals and metalloids in airborne particulate matter by inductively coupled plasma atomic emission spectrometry
http://www.iso.org/iso/catalogue_detail.htm?csnumber=51315
Evaluated during an indicative rating by the DGUV with an "A". DGUV sampling/analysis summary: http://amcaw.ifa.dguv.de/substance/sheets/081-02-S-Cadmium.pdf. Analysis by ICP-AES.
Cadmium
ISO 11174: Workplace air - determination of particulate cadmium and cadmium compounds - Flame and electrothermal atomic absorption spectrometric method
http://www.iso.org/iso/catalogue_detail.htm?csnumber=19181
Evaluated during an indicative rating by the DGUV with an "A". DGUV sampling/analysis summary: http://amcaw.ifa.dguv.de/substance/sheets/081-02-S-Cadmium.pdf. Analysis by ETAAS or FAAS.
Cadmium MDHS 10/2: Cadmium and inorganic compounds of cadmium in air
http://citeseerx.ist.psu.edu/viewdoc/download;jsessionid=266B5548B5E4D0845BE8ED237F1DE270?doi=10.1.1.387.1518&rep=rep1&type=pdf
Evaluated during an indicative rating by the DGUV with an "A". "Laboratory method using flame atomic absorption spectrometry or electrothermal atomic absorption spectrometry. It is applicable to the determination of water-soluble cadmium salts and the majority of cadmium-containing materials in industrial use or occurring in workplace air. "
Cadmium MDHS 91/2: Metals and metalloids in workplace air by X-ray fluorescence spectrometry
http://www.hse.gov.uk/pubns/mdhs/pdfs/mdhs91-2.pdf
DGUV sampling/analysis summary: http://amcaw.ifa.dguv.de/substance/sheets/081-04-S-Cadmium.pdf. Analysis by XRF. Evaluated during an indicative rating by the DGUV with an "A".
Chromium
ISO 15202: Workplace air — Determination of metals and metalloids in airborne particulate matter by inductively coupled plasma atomic emission spectrometry
http://www.iso.org/iso/catalogue_detail.htm?csnumber=51315
Evaluated during an indicative rating by the DGUV with an "A". DGUV sampling/analysis summary: http://amcaw.ifa.dguv.de/substance/sheets/082-01-S-Chromium.pdf. Analysis by ICP-AES.
Chromium MDHS 12/2: Chromium and inorganic compounds of chromium in air
http://www.hsl.gov.uk/resources/publications/mdhs/mdhs-revisions
Evaluated during an indicative rating by the DGUV with an "A". DGUV sampling/analysis summary: http://amcaw.ifa.dguv.de/substance/sheets/082-02-S-Chromium.pdf. "Laboratory method using flame atomic absorption spectrometry."

Assessment of occupational exposure to metals Final Report
© 2016, EBRC Consulting GmbH, Germany 26
Metal, Metal Compound, Type of Exposure
Title Hyperlink Further important information*
Chromium MDHS 91/2: Metals and metalloids in workplace air by X-ray fluorescence spectrometry
http://www.hse.gov.uk/pubns/mdhs/pdfs/mdhs91-2.pdf
DGUV sampling/analysis summary: http://amcaw.ifa.dguv.de/substance/sheets/082-03-S-Chromium.pdf. Analysis by XRF. Evaluated during an indicative rating by the DGUV with an "A".
Chromium MDHS 52/4: Hexavalent chromium in chromium plating mists
http://www.hse.gov.uk/pubns/mdhs/pdfs/mdhs52-4.pdf
The method is suitable for static measurements adjacent to chromium plating baths to aid in assessing efficacy of measures to control emissions of chromium plating mist.
Cobalt
ISO 15202: Workplace air — Determination of metals and metalloids in airborne particulate matter by inductively coupled plasma atomic emission spectrometry
http://www.iso.org/iso/catalogue_detail.htm?csnumber=51315
Analysis by ICP-AES. DGUV sampling/analysis summary: http://amcaw.ifa.dguv.de/substance/sheets/083-01-S-Cobalt.pdf. Evaluated during an indicative rating by the DGUV with an "A".
Cobalt HSE 30/2: Cobalt and cobalt compounds in air. Laboratory method using flame atomic absorption spectrometry.
http://www.hsl.gov.uk/resources/publications/mdhs/mdhs-revisions
Analysis by flame AAS. DGUV sampling/analysis summary: http://amcaw.ifa.dguv.de/substance/sheets/083-02-S-Cobalt.pdf. Evaluated during an indicative rating by the DGUV with an "A".
Cobalt MDHS 91/2: Metals and metalloids in workplace air by X-ray fluorescence spectrometry
http://www.hse.gov.uk/pubns/mdhs/pdfs/mdhs91-2.pdf
Analysis by XRF. DGUV sampling/analysis summary: http://amcaw.ifa.dguv.de/substance/sheets/083-03-S-Cobalt.pdf. Evaluated during an indicative rating by the DGUV with an "A".
Copper MDHS 91/2: Metals and metalloids in workplace air by X-ray fluorescence spectrometry
http://www.hse.gov.uk/pubns/mdhs/pdfs/mdhs91-2.pdf
Analysis by XRF. DGUV sampling/analysis summary: http://amcaw.ifa.dguv.de/substance/sheets/084-02-S-Copper.pdf. Evaluated during an indicative rating by the DGUV with an "A".
Copper
ISO 15202: Workplace air — Determination of metals and metalloids in airborne particulate matter by inductively coupled plasma atomic emission spectrometry
http://www.iso.org/iso/catalogue_detail.htm?csnumber=51315
Analysis by ICP-AES. DGUV sampling/analysis summary: http://amcaw.ifa.dguv.de/substance/sheets/084-01-S-Copper.pdf. Evaluated during an indicative rating by the DGUV with an "A".
Copper OSHA ID-121: Metal & metalloid particulates in workplace atmospheres (atomic absorption)
https://www.osha.gov/dts/sltc/methods/inorganic/id121/id121.pdf
DGUV sampling/analysis summary: http://amcaw.ifa.dguv.de/substance/sheets/084-10-S-Copper.pdf. Analysis by FAAS. Evaluated during an indicative rating by the DGUV with an "A".
Generic dust IFA 6068: Alveolengängige Fraktion http://www.ifa-arbeitsmappedigital.de/6068
DGUV sampling/analysis summary: http://amcaw.ifa.dguv.de/substance/sheets/125-04-S-Respirable%20aerosol%20fraction.pdf. Evaluated during an indicative rating by the DGUV with an "A". Analysis by gravimetry.

Assessment of occupational exposure to metals Final Report
© 2016, EBRC Consulting GmbH, Germany 27
Metal, Metal Compound, Type of Exposure
Title Hyperlink Further important information*
Generic dust IFA 7284: Einatembare Fraktion http://www.ifa-arbeitsmappedigital.de/7284
DGUV sampling/analysis summary: http://amcaw.ifa.dguv.de/substance/sheets/124-04-S-Inhalable%20aerosol%20fraction.pdf. Evaluated during an indicative rating by the DGUV with an "A". Analysis by gravimetry.
Generic dust MDHS 95/3: Measurement of personal exposure of metalworking machine operators to airborne water-mix metalworking fluid
http://www.hse.gov.uk/pubns/mdhs/pdfs/mdhs95-3.pdf
"This method describes a procedure for the measurement of time-weighted average concentrations of water-mix metalworking fluid originating from metalworking machine operations. The method is only suitable when the machine sump fluid (liquid circulating in the machine) contains an element which is unlikely to emanate from a source other than the water or metalworking fluid concentrate used to prepare the fluid and this element is present at a high enough concentration to facilitate its use as a marker." Analysis by FAAS, ICP-AES.
Generic dust MDHS 14/4: General methods for sampling and gravimetric analysis of respirable, thoracic and inhalable aerosol
http://www.hse.gov.uk/pubns/mdhs/pdfs/mdhs14-4.pdf
Guidance for sampling. DGUV sampling/analysis summary: http://amcaw.ifa.dguv.de/substance/sheets/124-01-S-Inhalable%20aerosol%20fraction.pdf. Evaluated during an indicative rating by the DGUV with an "A". Analysis by gravimetry.
H2S OSHA 1008: Hydrogen sulfide http://www.cdc.gov/niosh/docs/2003-154/pdfs/6013.pdf
Analysis by conductivity detection in Ion chromatography
H2S OSHA ID-141: Hydrogen Sulfide in Workplace Atmospheres
https://www.osha.gov/dts/sltc/methods/inorganic/id141/id141.html
Analysis by differential pulse chromatography
H2S NIOSH 6013: Hydrogen sulfide https://www.cdc.gov/niosh/docs/2003-154/pdfs/6013.pdf
Analysis by conductivity detection in Ion chromatography
Lead MDHS 91/2: Metals and metalloids in workplace air by X-ray fluorescence spectrometry
http://www.hse.gov.uk/pubns/mdhs/pdfs/mdhs91-2.pdf
DGUV sampling/analysis summary: http://amcaw.ifa.dguv.de/substance/sheets/073-04-S-Lead.pdf. Analysis by XRF (Pb L β line). Evaluated during an indicative rating by the DGUV with an "A". Analysis by XRF.
Lead
ISO 8518:2001: Workplace air -- Determination of particulate lead and lead compounds -- Flame or electrothermal atomic absorption spectrometric method
http://www.iso.org/iso/catalogue_detail.htm?csnumber=26501
DGUV sampling/analysis summary: http://amcaw.ifa.dguv.de/substance/sheets/073-01-S-Lead.pdf. Analysis by FAAS and ETAAS. Evaluated during an indicative rating by the DGUV with an "A".

Assessment of occupational exposure to metals Final Report
© 2016, EBRC Consulting GmbH, Germany 28
Metal, Metal Compound, Type of Exposure
Title Hyperlink Further important information*
Lead
ISO 15202: Workplace air — Determination of metals and metalloids in airborne particulate matter by inductively coupled plasma atomic emission spectrometry
http://www.iso.org/iso/catalogue_detail.htm?csnumber=51315
Analysis by ICP-AES. DGUV sampling/analysis summary: http://amcaw.ifa.dguv.de/substance/sheets/073-02-S-Lead.pdf. Evaluated during an indicative rating by the DGUV with an "A".
Manganese
ISO 15202: Workplace air — Determination of metals and metalloids in airborne particulate matter by inductively coupled plasma atomic emission spectrometry
http://www.iso.org/iso/catalogue_detail.htm?csnumber=51315
Analysis by ICP-AES. DGUV sampling/analysis summary: http://amcaw.ifa.dguv.de/substance/sheets/074-01-S-Manganese.pdf. Evaluated during an indicative rating by the DGUV with an "A"
Manganese MDHS 91/2: Metals and metalloids in workplace air by X-ray fluorescence spectrometry
http://www.hse.gov.uk/pubns/mdhs/pdfs/mdhs91-2.pdf
Analysis by XRF. DGUV sampling/analysis summary: http://amcaw.ifa.dguv.de/substance/sheets/074-02-S-Manganese.pdf. Evaluated during an indicative rating by the DGUV with an "A".
Manganese OSHA ID-121: Metal & metalloid particulates in workplace atmospheres (atomic absorption)
https://www.osha.gov/dts/sltc/methods/inorganic/id121/id121.pdf
Analysis by FAAS or AES for 32 elements, but for some elements and/or their substances there are alternate methods or stopgap procedures available. Evaluated during an indicative rating by the DGUV with an "A".
Manganese Guidance for the collection of inhalable and respirable airborne manganese dust
http://cn.manganese.org/images/uploads/pdf/Measuring_Exposure_in_the_workplace.pdf
Analysis by gravimetry and ICP-AES or AAS.
Mercury ISO 17733: Determination of mercury and inorganic mercury compounds
http://www.iso.org/iso/catalogue_detail.htm?csnumber=31514
"Samples are analysed using either cold vapour atomic absorption spectrometry (CVAAS) or cold vapour atomic fluorescence spectrometry (CVAFS) after acid dissolution of the mercury collected.". DGUV sampling/analysis summary: http://amcaw.ifa.dguv.de/substance/sheets/075-01-S-Mercury.pdf. Evaluated during an indicative rating by the DGUV with an "A".
Mercury MDHS 16/2: Mercury and its inorganic divalent compounds in air.
http://www.hsl.gov.uk/resources/publications/mdhs/mdhs-revisions
"Laboratory method using Hydrar® diffusive badges or pumped sorbent tubes, acid dissolution and analysis by cold vapour atomic absorption spectrometry or cold vapour atomic fluorescence spectrometry." Evaluated during an indicative rating by the DGUV with an "A".
Nickel
ISO 15202: Workplace air — Determination of metals and metalloids in airborne particulate matter by inductively coupled plasma atomic emission spectrometry
http://www.iso.org/iso/catalogue_detail.htm?csnumber=51315
Analysis by ICP-AES. DGUV sampling/analysis summary: http://amcaw.ifa.dguv.de/substance/sheets/076-01-S-Nickel.pdf. Evaluated during an indicative rating by the DGUV with an "A"

Assessment of occupational exposure to metals Final Report
© 2016, EBRC Consulting GmbH, Germany 29
Metal, Metal Compound, Type of Exposure
Title Hyperlink Further important information*
Nickel MDHS 42/2: Nickel and inorganic compounds of nickel in air (except nickel carbonyl).
http://www.hsl.gov.uk/resources/publications/mdhs/mdhs-revisions
"Laboratory method using flame atomic absorption spectrometry or electrothermal atomic absorption spectrometry." Evaluated during an indicative rating by the DGUV with an "A". DGUV sampling/analysis summary: http://amcaw.ifa.dguv.de/substance/sheets/076-02-S-Nickel.pdf
Nickel MDHS 91/2: Metals and metalloids in workplace air by X-ray fluorescence spectrometry
http://www.hse.gov.uk/pubns/mdhs/pdfs/mdhs91-2.pdf
"This method describes the determination of concentrations of metallic and submetallic elements of atomic number equal to or greater than titanium (Z ≥22) using X-ray fluorescence spectrometry (XRFS)." Evaluated during an indicative rating by the DGUV with an "A". DGUV sampling/analysis summary: http://amcaw.ifa.dguv.de/substance/sheets/076-03-S-Nickel.pdf
Nickel Guidance for collection of inhalable and respirable Ni dust
http://www.nickelconsortia.eu/guidance-documents.html
Guidance covers the collection of inhalable and respirable dust.
Platinum International Platinum Group Metal Association (IPA) - Harmonised Methodology for the Sampling of Platinum in Workplace Atmospheres
http://ipa-news.com/assets/about/IPA-Harmonised-Sampling-Procedure-of-Platinum-at-Workplace.pdf
Guidance focusses on the determination of soluble platinum
Platinum OSHA ID-121: Metal & metalloid particulates in workplace atmospheres (atomic absorption)
https://www.osha.gov/dts/sltc/methods/inorganic/id121/id121.pdf
Analysis by FAAS or AES for 32 elements, but for some elements and/or their substances there are alternate methods or stopgap procedures available.
Platinum OSHA ID-130_SG: Platinum in workplace atmospheres
https://www.osha.gov/dts/sltc/methods/partial/t-id130sg-pv-01-8503-m/t-id130sg-pv-01-8503-m.html
Analysis by GFAAS.
Platinum MDHS 46/2: Platinum metal and soluble platinum compounds in air.
http://www.hsl.gov.uk/resources/publications/mdhs/mdhs-revisions
"Laboratory method using electrothermal atomic absorption spectrometry or inductively coupled plasma-mass spectrometry."
Silver OSHA ID-121: Metal & metalloid particulates in workplace atmospheres (atomic absorption)
https://www.osha.gov/dts/sltc/methods/inorganic/id121/id121.pdf
Analysis by FAAS or AES for 32 elements, but for some elements and/or their substances there are alternate methods or stopgap procedures available. Evaluated during an indicative rating by the DGUV with a "C".
Silver
ISO 15202: Workplace air — Determination of metals and metalloids in airborne particulate matter by inductively coupled plasma atomic emission spectrometry
http://www.iso.org/iso/catalogue_detail.htm?csnumber=51315
Analysis by ICP-AES. Rating by the DGUV with a "C".
SO2 DFG: Sulfur dioxide http://onlinelibrary.wiley.com/doi/10.1002/3527600418.am744609e0008/pdf
Evaluated during an indicative rating by the DGUV with an "A". Analysis by ion chromatography.

Assessment of occupational exposure to metals Final Report
© 2016, EBRC Consulting GmbH, Germany 30
Metal, Metal Compound, Type of Exposure
Title Hyperlink Further important information*
SO2 OSHA ID-200: Sulfur dioxide in workplace atmospheres (impregnated activated beaded carbon)
https://www.osha.gov/dts/sltc/methods/inorganic/id200/id200.html
Analysis by ion chromatography. Evaluated during an indicative rating by the DGUV with an "A".
Tin MDHS 91/2: Metals and metalloids in workplace air by X-ray fluorescence spectrometry
http://www.hse.gov.uk/pubns/mdhs/pdfs/mdhs91-2.pdf
Analysis by XRF. DGUV sampling/analysis summary: http://amcaw.ifa.dguv.de/substance/sheets/077-02-S-Tin.pdf. Evaluated during an indicative rating by the DGUV with an "A".
Tin
ISO 15202: Workplace air — Determination of metals and metalloids in airborne particulate matter by inductively coupled plasma atomic emission spectrometry
http://www.iso.org/iso/catalogue_detail.htm?csnumber=51315
Analysis by ICP-AES. DGUV sampling/analysis summary: http://amcaw.ifa.dguv.de/substance/sheets/077-01-S-Tin.pdf. Evaluated during an indicative rating by the DGUV with an "A".
Tin OSHA ID-121: Metal & metalloid particulates in workplace atmospheres (atomic absorption)
https://www.osha.gov/dts/sltc/methods/inorganic/id121/id121.pdf
DGUV sampling/analysis summary: http://amcaw.ifa.dguv.de/substance/sheets/077-08-S-Tin.pdf. Evaluated during an indicative rating by the DGUV with an "A". Analysis by FAAS.
Tungsten OSHA ID-213: Tungsten and Cobalt in Workplace Atmospheres (ICP Analysis)
https://www.osha.gov/dts/sltc/methods/inorganic/id213/id213.html
Analysis by ICP-AES.
Tungsten NIOSH 7074: Tungsten (soluble and insoluble) http://www.cdc.gov/niosh/docs/2003-154/pdfs/7074.pdf
Analysis by FAAS.
Vanadium NIOSH 7504: Vanadium oxides http://www.cdc.gov/niosh/docs/2003-154/pdfs/7504.pdf
Analysis by X-Ray powder diffraction. The method will determine V2O5, V2O3, and NH4VO3 separately on the same sample.
Vanadium OSHA ID-185: Confirmation of Vanadium Pentoxide in Workplace Atmospheres - (Inorganic Method #185)
https://www.osha.gov/dts/sltc/methods/inorganic/id185/id185.html
Analysis by XRF and verification by XRD
Welding fume OSHA ID-204: Quantitative X-Ray Fluorescence Analysis of Workplace Substances
https://www.osha.gov/dts/sltc/methods/inorganic/id204/id204.html
Analysis by XRF
Welding fume OSHA ID-213: Tungsten and Cobalt in Workplace Atmospheres (ICP Analysis)
https://www.osha.gov/dts/sltc/methods/inorganic/id213/id213.html
Analysis by ICP-AES.
Welding fume OSHA ID-125G: Metal and metalloid particulates in workplace atmospheres (ICP analysis)
https://www.osha.gov/dts/sltc/methods/inorganic/id125g/id125g.pdf
Analysis by ICP-AES. Validated for thirteen elements (Be, Cd, Co, Cr, Cu, Fe, Mn, Mo, Ni, Pb, Sb, V, and Zn). Expanding the analysis method is dependent on laboratory instrumentation, and element solubility and stability in the matrix used for digestion.

Assessment of occupational exposure to metals Final Report
© 2016, EBRC Consulting GmbH, Germany 31
Metal, Metal Compound, Type of Exposure
Title Hyperlink Further important information*
Zinc NIOSH 7302: Elements by ICP (Microwave Digestion)
https://www.cdc.gov/niosh/docs/2014-151/pdfs/methods/7302.pdf
Analysis by ICP-AES. Applicability: "This method is for the analysis of metal and nonmetal dust collected on MCE filters in the workplace. The working range varies from element to element." Analyte: Al, Sb, As, Ba, Be, B, Cd, Ca, Cr, Co, Cu, Fe, Pb, Li, Mg, Mn, Mo, Ni, P, Pt, K, Se, Ag, Na, Sr, Te, Tl, Sn, Ti, V, Y, Zn, Zr.
Zinc NIOSH 7304: Elements by ICP Microwave Digestion
https://www.cdc.gov/niosh/docs/2014-151/pdfs/methods/7304.pdf
Analysis by ICP-AES. Applicability: "The working range of this method varies from element to element. This method is for the analysis of metal and nonmetal dust collected on PVC filters that are also used for gravimetric analysis. This is a simultaneous elemental analysis using a microwave digestion approach to simplify and expedite the analysis. Some elements such as antimony, silver, and tin do not form stable solutions in nitric acid when chloride from the PVC filters is present. In such cases a mixed cellulose ester (MCE) filter is necessary (See NMAM 7302)." Analyte: Al, As, Ba, Be, B, Cd, Ca, Cr, Co, Cu, Fe, Pb, Li, Mg, Mn, Mo, Ni, P, Pt, K, Se, Na, Sr, Te, Tl, Ti, V, Y, Zn, Zr.
Zinc NIOSH 7306: Elements by cellulosic internal capsule sampler
https://www.cdc.gov/niosh/docs/2014-151/pdfs/methods/7306.pdf
Analysis by ICP-AES. Applicability: "This is simultaneous elemental analysis, not compound specific. Verify that the types of compounds in the samples are soluble with the dissolution procedure selected. Some compounds of these elements require special sample treatment." Analyte: Al, Sb, As, Ba, Be, Cd, Ca, Cr, Co, Cu, In, Fe, La, Pb, Li, Mg, Mn, Mo, Ni, P, K, Se, Ag, Sr, Sn, Te, Tl, Ti, W, V, Y, Zn, Zr.
Zinc NIOSH 7502: Zinc oxide https://www.cdc.gov/niosh/docs/2014-151/pdfs/methods/7502.pdf
Analysis by X-Ray powder diffraction. Analyte for this method: crystalline zinc oxide; direct analysis on filter.
Zinc IFA 8985: Zinkoxide http://www.ifa-arbeitsmappedigital.de/8985
*: Please note that, amongst other kind of information, information on an indicative rating by the DGUV is provided in this column, where available (the complete database is available on: http://amcaw.ifa.dguv.de/WForm09.aspx). However, exclusively sources and methods that have been evaluated with an “A” are included here (except for the substance silver, for which a higher rating than “C” was not available). An “A” has been assigned for methods meeting all of or the most of the major requirements of BS EN 482 (1999). Further information on the rating of analytical methods is available on: http://www.dguv.de/medien/ifa/de/gestis/analytical_methods/3indicative_rating.pdf.
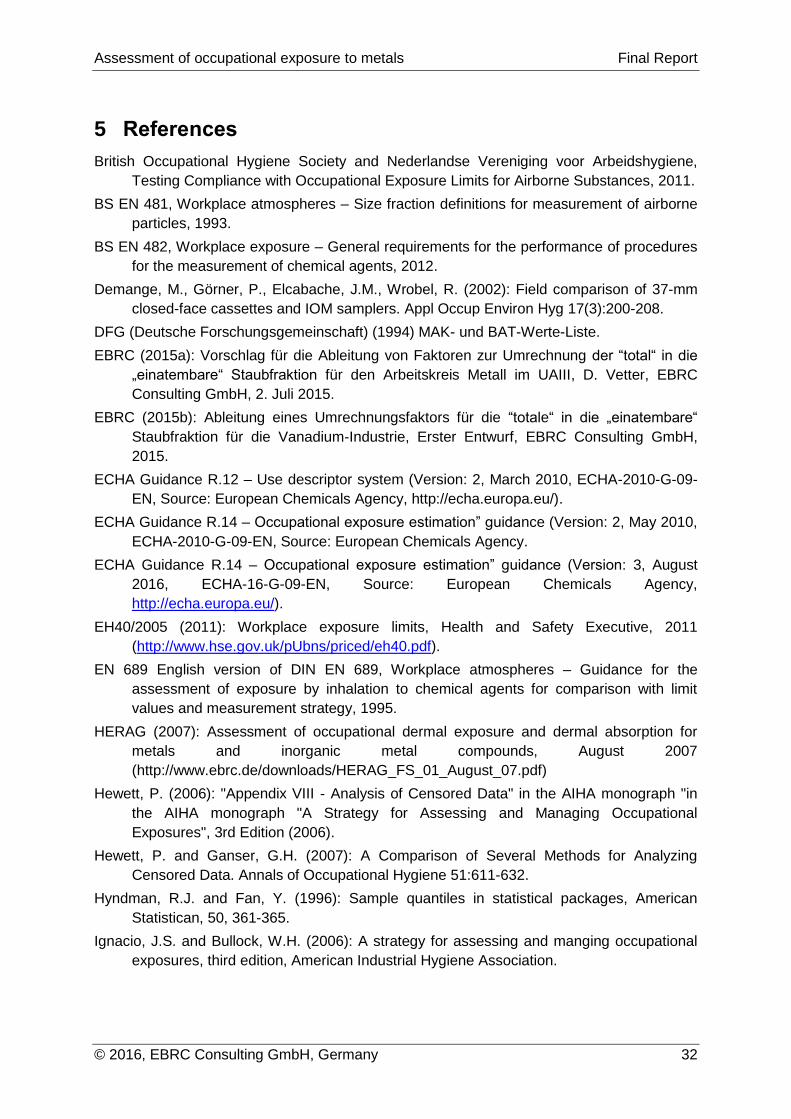
Assessment of occupational exposure to metals Final Report
© 2016, EBRC Consulting GmbH, Germany 32
5 References
British Occupational Hygiene Society and Nederlandse Vereniging voor Arbeidshygiene,
Testing Compliance with Occupational Exposure Limits for Airborne Substances, 2011.
BS EN 481, Workplace atmospheres – Size fraction definitions for measurement of airborne
particles, 1993.
BS EN 482, Workplace exposure – General requirements for the performance of procedures
for the measurement of chemical agents, 2012.
Demange, M., Görner, P., Elcabache, J.M., Wrobel, R. (2002): Field comparison of 37-mm
closed-face cassettes and IOM samplers. Appl Occup Environ Hyg 17(3):200-208.
DFG (Deutsche Forschungsgemeinschaft) (1994) MAK- und BAT-Werte-Liste.
EBRC (2015a): Vorschlag für die Ableitung von Faktoren zur Umrechnung der “total“ in die
„einatembare“ Staubfraktion für den Arbeitskreis Metall im UAIII, D. Vetter, EBRC
Consulting GmbH, 2. Juli 2015.
EBRC (2015b): Ableitung eines Umrechnungsfaktors für die “totale“ in die „einatembare“
Staubfraktion für die Vanadium-Industrie, Erster Entwurf, EBRC Consulting GmbH,
2015.
ECHA Guidance R.12 – Use descriptor system (Version: 2, March 2010, ECHA-2010-G-09-
EN, Source: European Chemicals Agency, http://echa.europa.eu/).
ECHA Guidance R.14 – Occupational exposure estimation” guidance (Version: 2, May 2010,
ECHA-2010-G-09-EN, Source: European Chemicals Agency.
ECHA Guidance R.14 – Occupational exposure estimation” guidance (Version: 3, August
2016, ECHA-16-G-09-EN, Source: European Chemicals Agency,
http://echa.europa.eu/).
EH40/2005 (2011): Workplace exposure limits, Health and Safety Executive, 2011
(http://www.hse.gov.uk/pUbns/priced/eh40.pdf).
EN 689 English version of DIN EN 689, Workplace atmospheres – Guidance for the
assessment of exposure by inhalation to chemical agents for comparison with limit
values and measurement strategy, 1995.
HERAG (2007): Assessment of occupational dermal exposure and dermal absorption for
metals and inorganic metal compounds, August 2007
(http://www.ebrc.de/downloads/HERAG_FS_01_August_07.pdf)
Hewett, P. (2006): "Appendix VIII - Analysis of Censored Data" in the AIHA monograph "in
the AIHA monograph "A Strategy for Assessing and Managing Occupational
Exposures", 3rd Edition (2006).
Hewett, P. and Ganser, G.H. (2007): A Comparison of Several Methods for Analyzing
Censored Data. Annals of Occupational Hygiene 51:611-632.
Hyndman, R.J. and Fan, Y. (1996): Sample quantiles in statistical packages, American
Statistican, 50, 361-365.
Ignacio, J.S. and Bullock, W.H. (2006): A strategy for assessing and manging occupational
exposures, third edition, American Industrial Hygiene Association.

Assessment of occupational exposure to metals Final Report
© 2016, EBRC Consulting GmbH, Germany 33
Kenny, L.C., Aitken, R., Chalmers, J.C., Fabriès, J.F., González-Fernández, E., Kromhout,
H., Lidén, G., Mark, D., Riediger, G., Prodi, V. (1997): A collaborative European study
of personal inhalable aerosol sampler performance. Ann. Occup. Hyg. 41(2):135-153.
Kock, H., Civic, T., Koch, W. (2015): Beryllium concentration at European workplaces:
comparison of “total” and inhalable particulate measurements.
Kumagai, S., Matsunaga, I. (1994): Approaches for estimating the distribution of short-term
exposure concentrations for different averaging times. Annals of Occupational Hygiene
38: 815-825.
Lauwerys, R.R. and Hoet, P. (2001): Industrial Chemical Exposure, Guidelines for Biological
Monitoring, Third Edition, Lewis Publishers, 2001.
MDHS 14/3 General methods for sampling and gravimetric analysis of respirable and
inhalable aerosols, Health and Safety Executive, February 2000.
MDHS 14/4 General methods for sampling and gravimetric analysis of respirable, thoracic
and inhalable aerosols, Health and Safety Executive, June 2014.
MDHS 6/3 Lead and inorganic compounds of lead in air, Health and Safety Executive,
February 1998.
Nordheim, E. (2015): Personal communication on parallel sampling of the total and inhalable
fraction conducted by Norwegian Institute of Occupational Health (STAMI) in 1995.
prEN 689 English version of DIN EN 689, Workplace atmospheres – Measurement of
exposure by inhalation to chemical agents - Strategy for testing compliance with
occupational exposure limit values, Draft, June 2016.
REACH Regulation (Regulation (EC) No 1907/2006).
Sánchez Jiménez, A., Galea, K.S., Searl, A., Spankie, S., MacCalman, L., Cherrie, J.W., van
Tongeren, M. (2011):, Development of a Standardised Method for Measuring
Manganese Exposure, Research Report TM/10/04, June 2011.
Sánchez Jiménez, A., Galea, K.S., van Tongeren, M. (2010): Guidance for the collection of
inhalable and respirable airborne manganese dust, Research Report TM/10/04-1,
October 2010.
Sánchez Jiménez, A., van Tongeren, M., Aitken, R.J. (2012): Guidance for collection of
inhalable and respirable Ni dust, Strategic Consulting: 538-0000, March, 2012.
Spear, T.M., Werner, M.A., Bootland, J., Harbour, A., Murray, E.P., Vincent, J.H. (1997):
Comparison of methods for personal sampling of methods of inhalable and total lead
and cadmium-containing aerosols in a primary lead smelter. Am. Ind. Hyg. Assoc. J.
58(12):893-899.
TRGS 402 Technical Rules for Hazardous Substances, Identification and Assessment of the
Risks from Activities involving Hazardous Substances: Inhalation Exposure, January
2010.
Tsai, P.J., Vincent, J.H., Wahl, G., Maldonado, G. (1995): Occupational exposure to
inhalable and total aerosol in the primary nickel production industry. Occup. Environ.
Med. 52:793-799.
Tsai, P.J., Vincent, J.H., Wahl, G.A., Maldonado, G. (1996b): Worker exposures to inhalable
and total aerosol during nickel alloy production. Ann. Occup. Hyg. 40(6):651-659.

Assessment of occupational exposure to metals Final Report
© 2016, EBRC Consulting GmbH, Germany 34
Tsai, P.J., Werner, M.A., Vincent, J.H., Maldonado, G. (1996 a): Worker Exposure to nickel-
containing aerosol in two electroplating shops: comparison between inhalable and total
aerosol. Appl. Occup. Environ. Hyg. 11(5):484-492.
Vincent, J.H. (2007): Aerosol Sampling, Science, Standards, Instrumentation and
Applications, John Wiley & Sons Ltd.
Vinzents, P.S., Thomassen, Y., Hetland, S. (1995): A method for establishing tentative
occupational exposure limits for inhalable dust. Ann Occup Hyg. 1995 Dec; 39(6):795-
800.
Werner, M.A., Spear, T.M., Vincent, J.H. (1996): Investigation into the impact of introducing
workplace aerosol standards based on the inhalable fraction. Analyst 121:1207-1214.
Werner, M.A., Vincent, J.H., Thomassen, Y.H., Hetland, S., Berge, S. (1999): Inhalable and
‘total’ metal and metal compound aerosol exposures for nickel refinery workers. Occup.
Hyg. 5, 93–109.
Wilsey, P.W., Vincent, J.H., Bishop, M.J., Brosseau, L.M., Greaves, I.A. (1996): Workers’
exposures to inhalable and total oil mist aerosol in a metal machining shop, American
Industrial Hygiene Association Journal, 57, 1149-1153.

Assessment of occupational exposure to metals Final Report
© 2016, EBRC Consulting GmbH, Germany 35
Appendix 1: Further use of monitoring data for calibration
of exposure estimation tools
The development of exposure assessment tools is data hungry by nature. Even for tools
dedicated to specific industry sectors, such as the MEASE tool being dedicated to the
metals’ sector, a considerable amount of monitoring data is required. This appendix aims at
explaining the need for a comprehensive set of contextual information for each measurement
when to be used in the calibration of exposure assessment tools.
In exposure estimation tools such as MEASE or ART, occupational exposure is estimated on
a conservative basis in consideration of specific tasks that are conducted in combination with
present product characteristics, operational conditions (OCs) and risk management
measures (RMMs). Examples for tasks are spraying of a substance, transfer of a substance
or furnace operations. For these tasks, not only the use of different substances but also the
product characteristics of a specific handled substance can lead to varying exposure levels,
for example if transfer of massive objects is compared to transfer operations of high dusty
powders or if substances with different melting points handled at elevated temperatures are
compared. With regard to RMMs, emphasis is placed on present measures at the site and
not on personal protective equipment (PPE). That is due to the fact that inhalation exposure
measurements usually represent exposure levels outside any respiratory protective
equipment (RPE). If applicable, such equipment can be documented and later be taken into
account by dividing the exposure level by the so-called assigned protection factor (APF,
according to BS EN 529:2005).
In principle, all information that has to be entered in an exposure estimation tool such as
MEASE or ART (Advanced Reach Tool) has to be documented during actual inhalation
exposure measurements. MEASE is a first tier exposure estimation tool, while ART is a
higher tier tool. Correspondingly, some additional information such as information on near-
field or far-field exposure (distance of the worker from the emission source) has to be
documented.
The use of measured inhalation exposure data to calibrate data for exposure estimation tools
would not only help the tool developers but also users of the tool since it is assumed that not
every company involved in REACH has measured exposure data for each and every process
step. Therefore, a calibrated and validated tool is very helpful for a number of companies.
Please refer to Appendix 2 for further details on information requirements for different
occupational exposure models.

Assessment of occupational exposure to metals Final Report
© 2016, EBRC Consulting GmbH, Germany 36
Appendix 2: Information requirements for data used for the
calibration of exposure assessment tools
Information requirements for first tier assessment tools, e.g. MEASE:
Molecular weight of the handled substance
Melting point of the handled substance
Vapour pressure of the handled substance
Physical form of the handled substance (guidance on physical form is provided in the
glossary of MEASE, available on: www.ebrc.de/mease.html)
Content of the measured substance in the handled product (percentage)
Information on conducted tasks during measurements (either free text description or
assignment of process category according to ECHA Guidance R.12 (available on
http://echa.europa.eu/documents/10162/13632/information_requirements_r12_en.pdf))
Process temperature (for processes at elevated temperature)
Scale of operation (industrial or professional use within the meaning of REACH)
Presence, type and efficiency of implemented risk management measures such as
enclosures, local exhaust ventilation, suppression techniques, separation of workers
Information requirements for higher tier assessment tools (selection),
e.g. ART:
Involved workplace / process, task description, task duration
Country
Near field / far field exposure, distance source to worker > 4 meters
Process temperature (°C)
Measurement method
Amount used
Containment, localised controls
Room volume (m³), ventilation type, ventilation rate (ACH)
Surface contamination
Measured substance
CAS number
Concentration of substance in product (%)
Vapour pressure (Pa), boiling temperature (°C), melting point (°C)
Dustiness, viscosity (Pa . s), moisture content
Etc.