guidance in uncertain times · itr economics provides the best economic intelligence to reduce ......
TRANSCRIPT

Alex ChausovskySenior Analyst
1
Guidance in Uncertain Times

First in Forecasts Since 1948
ITR Economics provides the best economic intelligence to reducerisk and drive practical and profitable business decisions.
Duration Accuracy
USGDP 15 99.1%USInd. Prod. 10 99.9%Eur Ind.Prod. 15 99.2%Canada Ind Prod 15 99.6%ChinaInd Prod 18 99.3%RetailSales 18 99.8%Housing 15 95.6%Employment 14 99.7%
2016 Forecast Results2
2

First in Forecasts Since 1948
3-Month Moving Average 3/12 Rate-of-ChangeQuarter-over-Quarter Growth Rate
• Annual Trend: • Phase: • Year-over-Year:
IndustryOutlook
2017:2018:2019:
US Gross Domestic ProductUS Gross Domestic Product
$16.7 trillionB
1.6%
3.7%1.7%
-1.9%
Source: BEA 3
0
5
10
15
20
25
0
5
10
15
20
25
'06 '07 '08 '09 '10 '11 '12 '13 '14 '15 '16 '17 '18 '19-9
-6
-3
0
3
6
9
-9
-6
-3
0
3
6
9
'06 '07 '08 '09 '10 '11 '12 '13 '14 '15 '16 '17 '18 '19

First in Forecasts Since 1948
Real Gross Domestic Product
Source: BEA3/12 Rate-of-Change
-8
-4
0
4
8
12
16
1950 1960 1970 1980 1990 2000 2010 2020Republican Democrat GDP 3/12
4

First in Forecasts Since 1948
Personal Consumption
66%
Business Investment
16%
Government Spending
18%
US GDP by Consumption
Data Source: Bureau of Economic AnalysisPercent
5

First in Forecasts Since 1948
12-Month Moving Average 12/12 Rate-of-ChangeYear-over-Year Growth Rate
• Annual Trend: • Phase: • Year-over-Year:
IndustryOutlook
2017:2018:2019:
US Industrial Production IndexUS Industrial Production Index
103.3A
-0.4%
2.5%0.5%-0.7%
Source: FRB
84
89
94
99
104
109
114
84
89
94
99
104
109
114
'07 '08 '09 '10 '11 '12 '13 '14 '15 '16 '17 '18 '19 -15
-10
-5
0
5
10
-15
-10
-5
0
5
10
'07 '08 '09 '10 '11 '12 '13 '14 '15 '16 '17 '18 '19

First in Forecasts Since 1948
US Industrial Production to Gross Domestic Product
Sources: FRB, BEAYear-over-Year, Quarter-to-Quarter (3/12)
-6.8%
-2.9%-5.3%
-15.5%
0.7
-16
-12
-8
-4
0
4
8
12
-16
-12
-8
-4
0
4
8
12
'82 '84 '86 '88 '90 '92 '94 '96 '98 '00 '02 '04 '06 '08 '10 '12 '14 '16 '18 '20
GDPUS IP
GDPUS IP
Manufacturing ~ 73% of Industrial ProductionMining ~ 16% of Industrial ProductionUtilities ~ 10% of Industrial production

First in Forecasts Since 1948
RawMay-15 1.5Jun-15 1.5Jul-15 1.4
Aug-15 1.5Sep-15 1.3Oct-15 1.3Nov-15 1.6Dec-15 1.6Jan-16 1.5Feb-16 1.7Mar-16 1.6Apr-16 1.7
May-16 1.7Jun-16 1.7Jul-16 1.6
Aug-16 1.7Sep-16 1.5Oct-16 1.5Nov-16 1.9Dec-16 1.7Jan-17 1.7Feb-17 1.9Mar-17 1.7Apr-17 1.7
3/12 Rate-of-Change
= !"#$%'()*+,,-!"#$%'().+,,-
×100 − 100
=3.+5.6×100 − 100 = 10.4%
3MMT
4.44.44.44.24.14.24.54.74.84.85.05.05.15.05.04.84.74.95.15.35.35.3
12MMT
18.018.218.418.618.819.019.219.419.719.820.020.220.3
12/12
26.7%25.5%25.2%22.4%20.0%18.3%15.4%12.7%
12/12 Rate-of-Change
= !"#$%'()*)',,-!"#$%'().)',,-
×100 − 100
='(.+)6.(
×100 − 100 = 12.7%
3/12
15.9%13.6%13.6%14.3%14.6%16.7%13.3%12.8%10.4%10.4%
Data Preparation
DATACAST !
First in Forecasts Since 1948
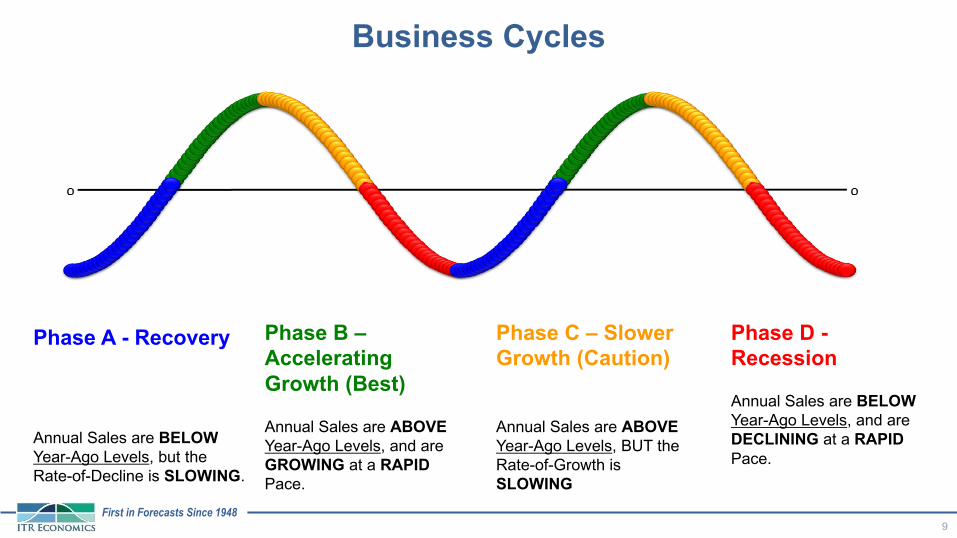
Phase A - Recovery
Annual Sales are BELOWYear-Ago Levels, but the Rate-of-Decline is SLOWING.
Phase B –Accelerating Growth (Best)
Annual Sales are ABOVEYear-Ago Levels, and are GROWING at a RAPIDPace.
Phase C – Slower Growth (Caution)
Annual Sales are ABOVEYear-Ago Levels, BUT the Rate-of-Growth is SLOWING
Phase D -Recession
Annual Sales are BELOWYear-Ago Levels, and are DECLINING at a RAPIDPace.
Business Cycles
9

First in Forecasts Since 1948
Step 2 - Leading Indicators
Rates-of-Change
-21
-14
-7
0
7
14
21
-45
-30
-15
0
15
30
45
'06 '07 '08 '09 '10 '11 '12 '13 '14 '15 '16 '17 '18
IndicatorCompany A
Company AIndicator - 1/12
March 2010March 2011
The Indicator has a 12-month lead time to the Company
June 2014 June 2015
First in Forecasts Since 1948
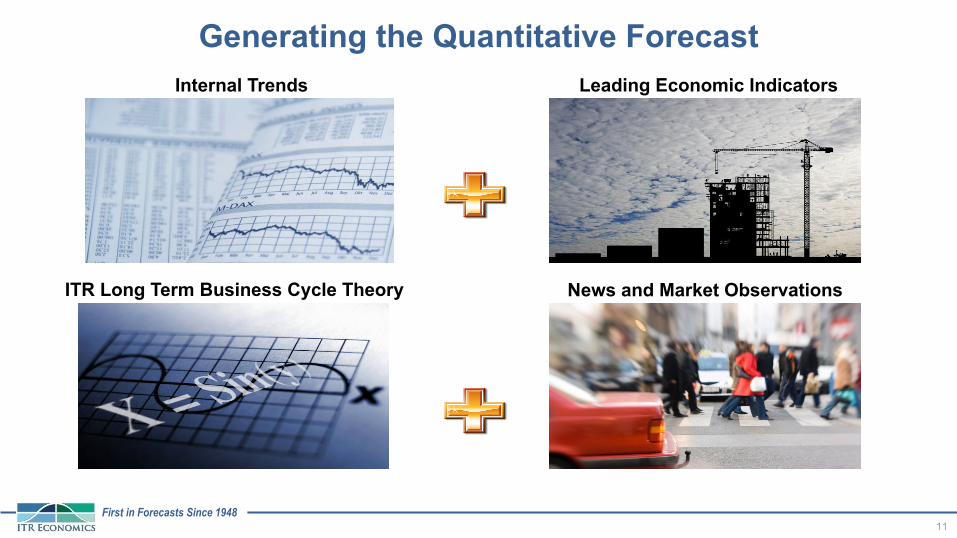
Generating the Quantitative Forecast
11
ITR Long Term Business Cycle Theory News and Market Observations
Leading Economic IndicatorsInternal Trends

First in Forecasts Since 1948
US Industrial Production to ITR Leading Indicator™
Sources: FRB, ITR EconomicsUSIP – 12/12 Indicator - Monthly
-15
-10
-5
0
5
10
15
-15
-10
-5
0
5
10
15
'90 '92 '94 '96 '98 '00 '02 '04 '06 '08 '10 '12 '14 '16 '18 '20
IndicatorUS IP
Indicator - MonthlyUS IP - 12/12
Reported in ITR Trends Report – ITR Advisor
As seen in
First in Forecasts Since 1948
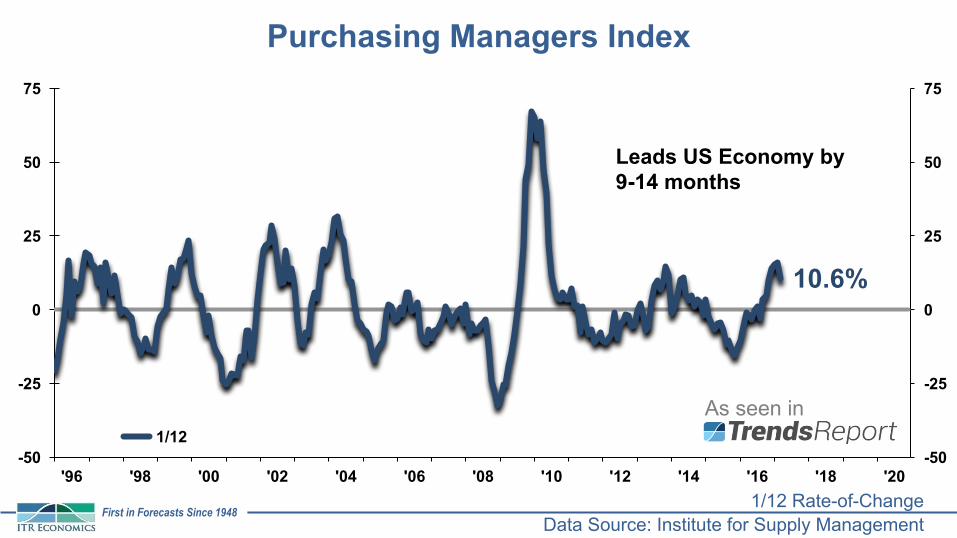
Purchasing Managers Index
Data Source: Institute for Supply Management1/12 Rate-of-Change
10.6%
-50
-25
0
25
50
75
-50
-25
0
25
50
75
'96 '98 '00 '02 '04 '06 '08 '10 '12 '14 '16 '18 '20
1/12
Leads US Economy by 9-14 monthsLeads US Economy by 9-14 months
As seen in
First in Forecasts Since 1948
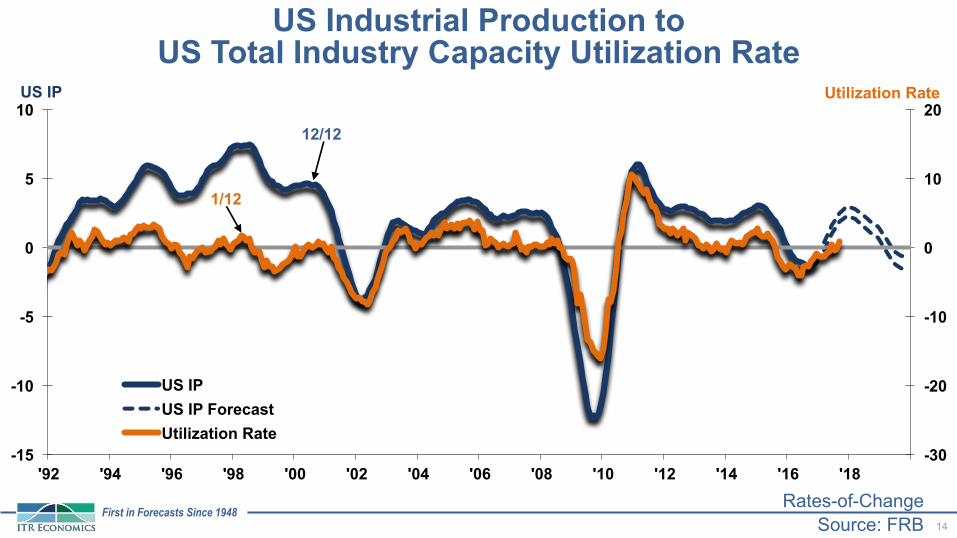
US Industrial Production to US Total Industry Capacity Utilization Rate
Source: FRBRates-of-Change
-30
-20
-10
0
10
20
-15
-10
-5
0
5
10
'92 '94 '96 '98 '00 '02 '04 '06 '08 '10 '12 '14 '16 '18
US IPUS IP ForecastUtilization Rate
Utilization RateUS IP
1/12
12/12
14

First in Forecasts Since 1948
Canada Industrial Production Index
2000 = 10015
2.5%0.3%
100.4
75
100
125
150
-40
-20
0
20
'96 '98 '00 '02 '04 '06 '08 '10 '12 '14 '16 '18 '20
MMAROC
12/123/12
12MMA3MMA
Source: Statistics Canada
2017 3.1%2018 1.8%

First in Forecasts Since 1948
Mexico Industrial Production Index
Source: CEIC2008 = 100
-0.8%-0.3%
107.5
60
110
160
210
-30
-15
0
15
'96 '98 '00 '02 '04 '06 '08 '10 '12 '14 '16 '18 '20
MMAR-O-C
3/12
12/12
3MMA 12MMA
16
2017 1.9%2018 2.0%
First in Forecasts Since 1948
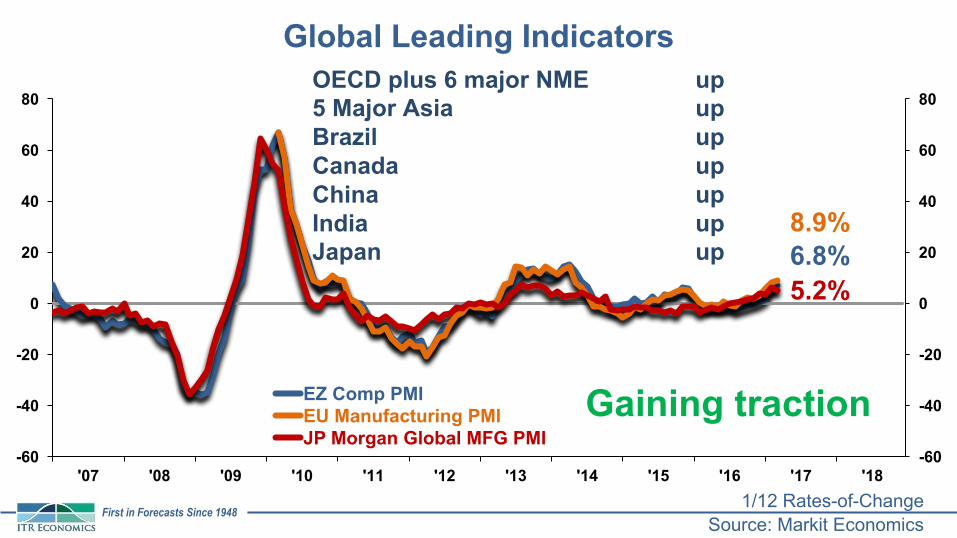
Global Leading Indicators
Source: Markit Economics1/12 Rates-of-Change
5.2%
8.9%6.8%
-60
-40
-20
0
20
40
60
80
-60
-40
-20
0
20
40
60
80
'07 '08 '09 '10 '11 '12 '13 '14 '15 '16 '17 '18
EZ Comp PMIEU Manufacturing PMIJP Morgan Global MFG PMI
Gaining traction
OECD plus 6 major NME up5 Major Asia upBrazil upCanada upChina upIndia upJapan up
First in Forecasts Since 1948
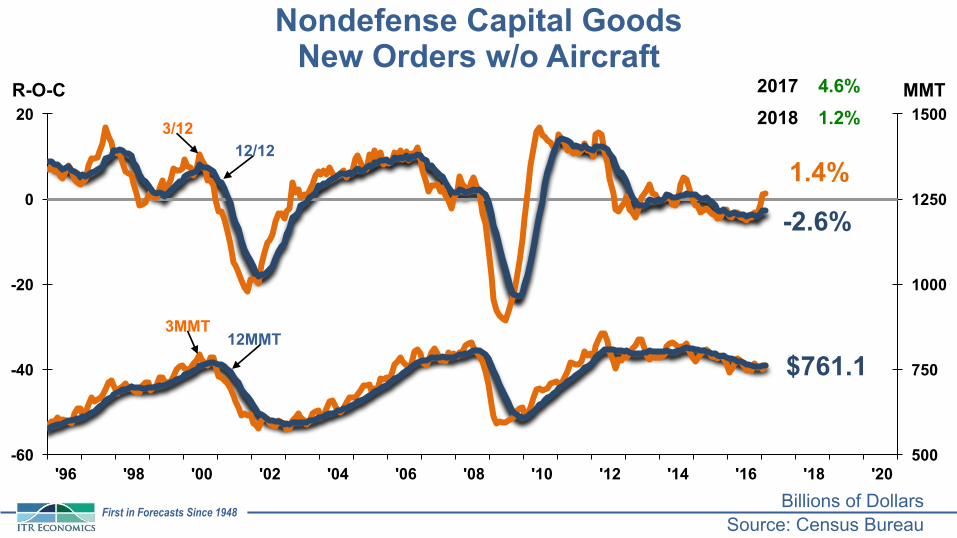
Nondefense Capital Goods New Orders w/o Aircraft
Source: Census BureauBillions of Dollars
1.4%
-2.6%
$761.1
500
750
1000
1250
1500
-60
-40
-20
0
20
'96 '98 '00 '02 '04 '06 '08 '10 '12 '14 '16 '18 '20
MMTR-O-C
3/1212/12
3MMT12MMT
2017 4.6%2018 1.2%

First in Forecasts Since 1948
Aluminum Base Scrap Commodity Price Index to Steel Scrap Producer Price Index to
Nickel Commodity Prices to Copper Futures Prices
Data Sources: WSJ, LME, BLS12/12 Rates-of-Change
-100
-50
0
50
100
150
-100
-50
0
50
100
150
'96 '98 '00 '02 '04 '06 '08 '10 '12 '14 '16 '18 '20
-0.4% Aluminum-1.4% Nickel
1.0% Copper21.2% Steel

First in Forecasts Since 1948
Commodity Prices
Source: WSJ, London Metal Exchange, Metalprices.com, Steel Market Update3/12 Rates-of-Change
63.0% Zinc
29.4% Tin30.8% Lead
22.0% Alum
45.6% Steel
26.6% Copper
-100
-50
0
50
100
150
200
-100
-50
0
50
100
150
200
'98 '00 '02 '04 '06 '08 '10 '12 '14 '16 '18 '20
All OthersZincTinLeadAluminumSteelCopper
Copper & Steel
20

First in Forecasts Since 1948
US Overall Wage Growth
Source: FRB AtlantaPercent
0
1
2
3
4
5
'06 '08 '10 '12 '14 '16 '18 '20
Raw Data
Three-month moving average of median wage growth in the overall economy of the United States. Wages are pre-tax and exclude overtime, tips and commissions. The following are also excluded: top-coded individuals, individuals whose hourly pay is below the current federal minimum for tip-based workers, and individuals employed in agricultural occupations.
21
First in Forecasts Since 1948
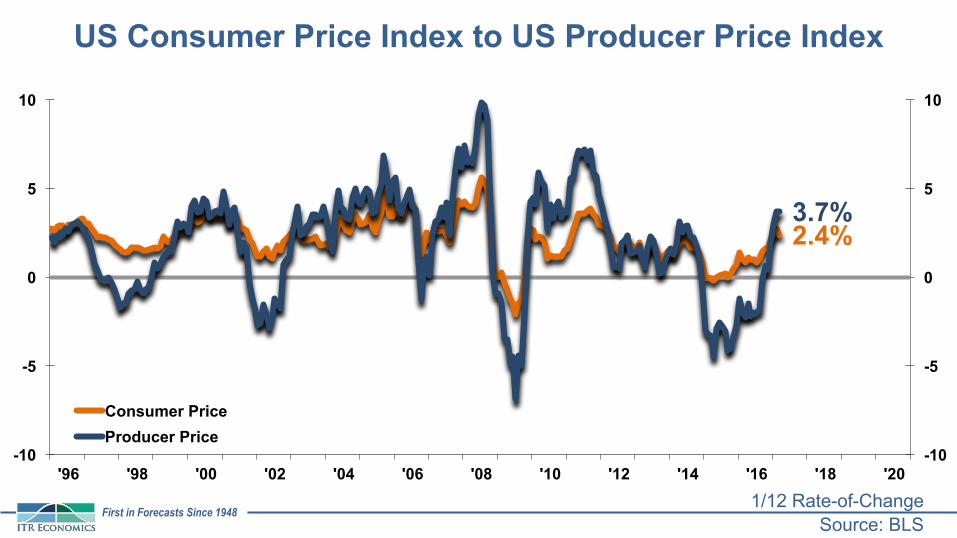
US Consumer Price Index to US Producer Price Index
Source: BLS1/12 Rate-of-Change
2.4%3.7%
-10
-5
0
5
10
-10
-5
0
5
10
'96 '98 '00 '02 '04 '06 '08 '10 '12 '14 '16 '18 '20
Consumer PriceProducer Price

First in Forecasts Since 1948
US Trade in Goods with World: Exports to Trade Weighted Exchange Rate Index
Sources: Census Bureau, FRED12/12 Rates-of-Change
-1.2%
0.1%
-15
-10
-5
0
5
10
15
20-30
-20
-10
0
10
20
30
40
'96 '98 '00 '02 '04 '06 '08 '10 '12 '14 '16 '18 '20
Exchange RateExports
Exports
Exchange Rate
3/12: 6.4% B

First in Forecasts Since 1948
Euros per US Dollars
Source: Wall Street Journal
7.3%1.4%
0.919
0.6
0.7
0.8
0.9
1.0
1.1
1.2
-60
-45
-30
-15
0
15
30
'05 '06 '07 '08 '09 '10 '11 '12 '13 '14 '15 '16 '17 '18 '19
MMAR-O-C
1/12
12/12
Actual
12MMA
24

First in Forecasts Since 1948
Global Oil Market Balance Summary (IEA)
Source: IEA
First in Forecasts Since 1948
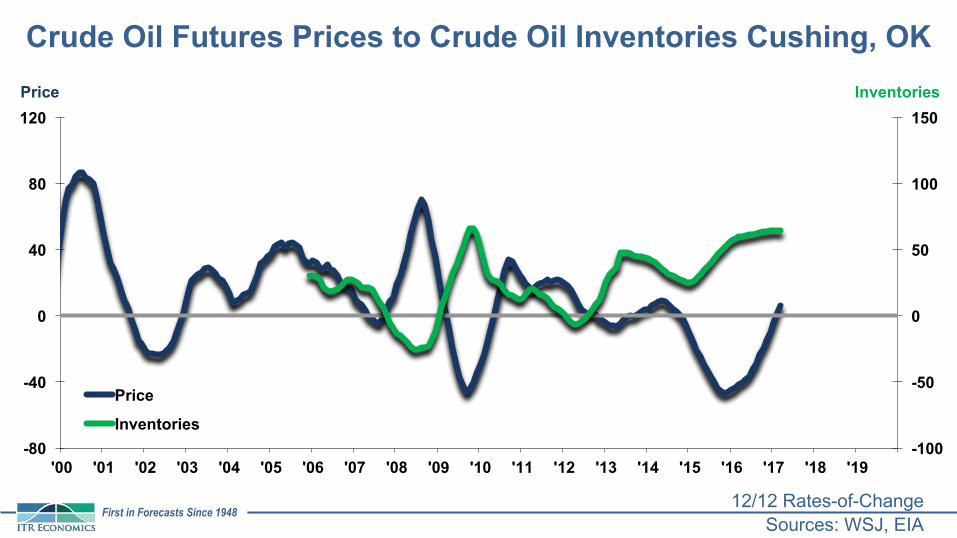
Crude Oil Futures Prices to Crude Oil Inventories Cushing, OK
Sources: WSJ, EIA12/12 Rates-of-Change
-100
-50
0
50
100
150
-80
-40
0
40
80
120
'00 '01 '02 '03 '04 '05 '06 '07 '08 '09 '10 '11 '12 '13 '14 '15 '16 '17 '18 '19
Price
Inventories
InventoriesPrice

First in Forecasts Since 1948
US Crude Oil Futures Commodity Prices
Source: Wall Street JournalDollars per Barrel
0
20
40
60
80
100
120
140
0
20
40
60
80
100
120
140
'00 '02 '04 '06 '08 '10 '12 '14 '16 '18
3MMA3MMA Forecast
27

First in Forecasts Since 1948
3.4%3.5%
103.1
70
85
100
115
130
145
160
-28
-21
-14
-7
0
7
14
'96 '98 '00 '02 '04 '06 '08 '10 '12 '14 '16 '18 '20
MMAR-O-C3/12
12/12
3MMA12MMA
US Petroleum Refineries Production
Source: FRBN32411, 2002 = 100
28
2017 1.3%2018 0.1%
First in Forecasts Since 194829
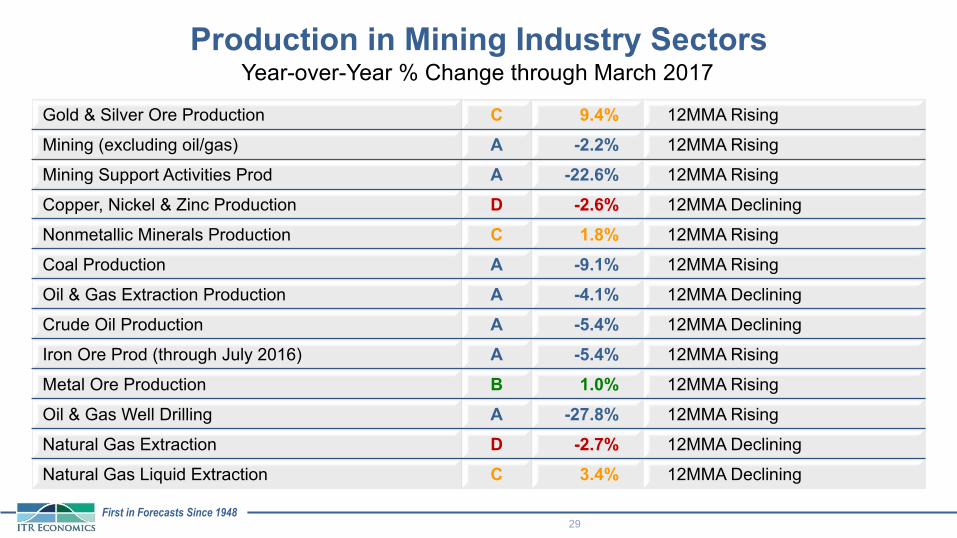
Production in Mining Industry SectorsYear-over-Year % Change through March 2017
Gold & Silver Ore Production C 9.4% 12MMA Rising
Mining (excluding oil/gas) A -2.2% 12MMA Rising
Mining Support Activities Prod A -22.6% 12MMA Rising
Copper, Nickel & Zinc Production D -2.6% 12MMA Declining
Nonmetallic Minerals Production C 1.8% 12MMA Rising
Coal Production A -9.1% 12MMA Rising
Oil & Gas Extraction Production A -4.1% 12MMA Declining
Crude Oil Production A -5.4% 12MMA Declining
Iron Ore Prod (through July 2016) A -5.4% 12MMA Rising
Metal Ore Production B 1.0% 12MMA Rising
Oil & Gas Well Drilling A -27.8% 12MMA Rising
Natural Gas Extraction D -2.7% 12MMA Declining
Natural Gas Liquid Extraction C 3.4% 12MMA Declining
First in Forecasts Since 1948
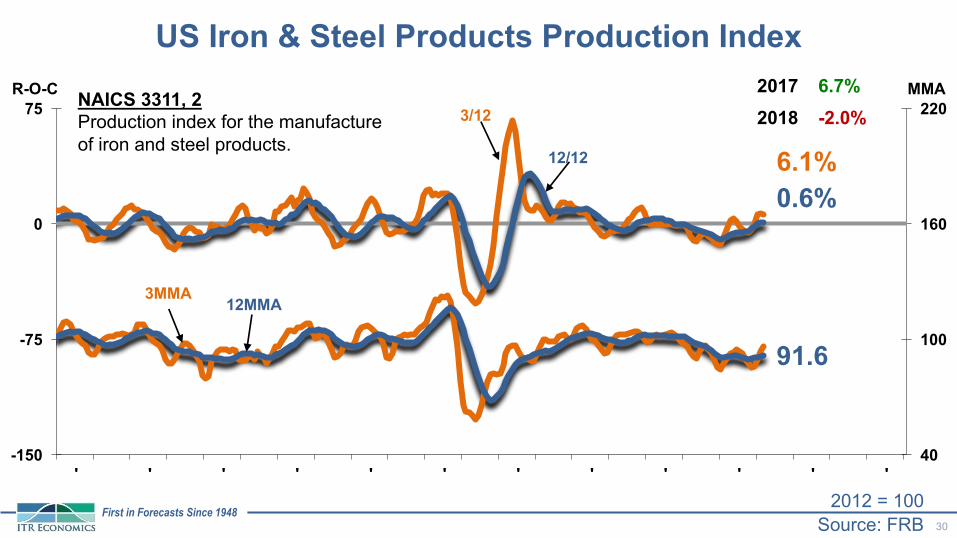
US Iron & Steel Products Production Index
Source: FRB2012 = 100
6.1%0.6%
91.6
40
100
160
220
-150
-75
0
75
'98
'00
'02
'04
'06
'08
'10
'12
'14
'16
'18
'20
MMAR-O-C
12MMA3MMA
12/12
3/12
30
NAICS 3311, 2Production index for the manufacture of iron and steel products.
2017 6.7%2018 -2.0%

First in Forecasts Since 1948
US Industrial Machinery Production Index
2012 = 100
16.2%9.6%
106.7
65
155
245
335
-80
-40
0
40
'96 '98 '00 '02 '04 '06 '08 '10 '12 '14 '16 '18 '20
MMAR-O-C
3/1212/12
3MMA12MMA
31Source: FRB
2017 6.3%2018 4.2%

First in Forecasts Since 1948
US Industrial Machinery New Orders
Source: US Census BureauBillions of $
4.3%
-1.2%
28.1
0
25
50
75
100
125
-210
-140
-70
0
70
140
'96 '98 '00 '02 '04 '06 '08 '10 '12 '14 '16 '18 '20
MMTR-O-C
3MMT 12MMT
3/12 12/12
32
2017 13.3%2018 5.7%
First in Forecasts Since 1948
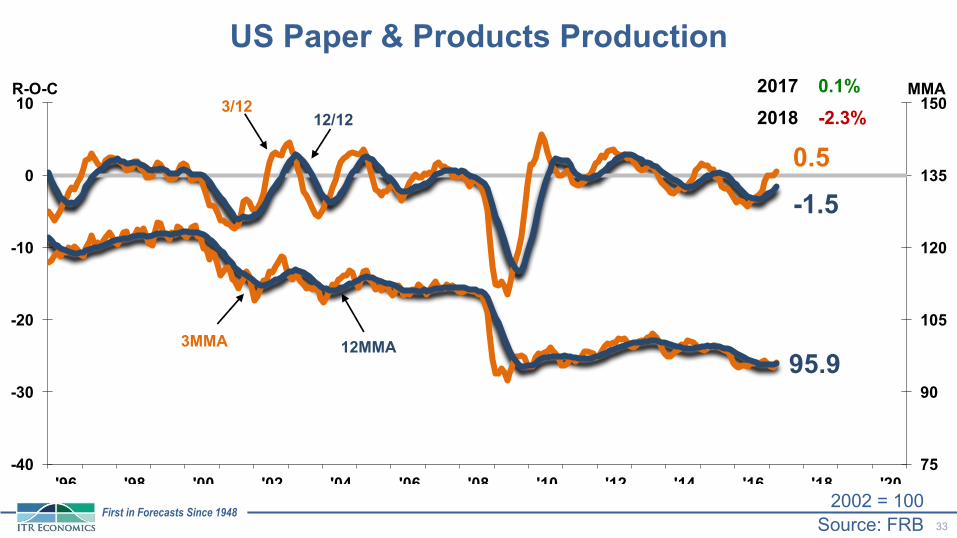
US Paper & Products Production
Source: FRB2002 = 100
0.5-1.5
95.9
75
90
105
120
135
150
-40
-30
-20
-10
0
10
'96 '98 '00 '02 '04 '06 '08 '10 '12 '14 '16 '18 '20
MMAR-O-C3/12
12/12
3MMA 12MMA
33
2017 0.1%2018 -2.3%
First in Forecasts Since 194834
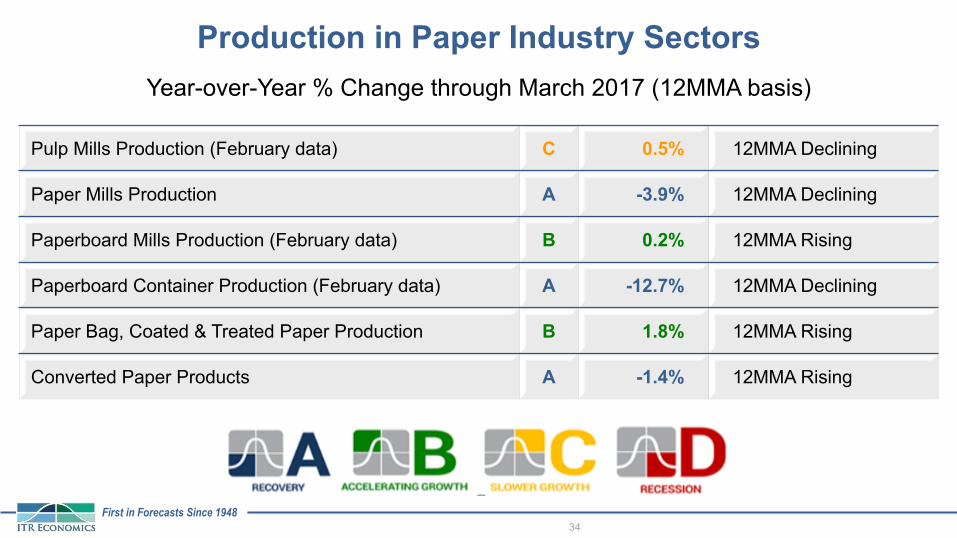
Production in Paper Industry SectorsYear-over-Year % Change through March 2017 (12MMA basis)
Pulp Mills Production (February data) C 0.5% 12MMA Declining
Paper Mills Production A -3.9% 12MMA Declining
Paperboard Mills Production (February data) B 0.2% 12MMA Rising
Paperboard Container Production (February data) A -12.7% 12MMA Declining
Paper Bag, Coated & Treated Paper Production B 1.8% 12MMA Rising
Converted Paper Products A -1.4% 12MMA Rising

First in Forecasts Since 1948
US Public Water and Sewer Facilities Construction
Source: US Census BureauPublic, Billions of Dollars
-18.3%-11.9%
32.4
10
25
40
55
70
85
100
-60
-45
-30
-15
0
15
30
'96 '98 '00 '02 '04 '06 '08 '10 '12 '14 '16 '18 '20
MMTR-O-C
3/1212/12
3MMT 12MMT
35
2017 -2.8%2018 7.3%

First in Forecasts Since 1948
US Total Power Facilities Construction
Source: US Census BureauBillions of Dollars
3.1%2.6%
96.3
10
35
60
85
110
135
160
185
-250
-200
-150
-100
-50
0
50
100
'96 '98 '00 '02 '04 '06 '08 '10 '12 '14 '16 '18 '20
MMTR-O-C3/12
12/12
3MMT 12MMT
36
2017 1.6%2018 11.8%

First in Forecasts Since 1948
US Electric Power Generation, Transmission and Distribution Production Index
Source: FRB2012 = 100
-1.7%0.8%
101.8
70
100
130
160
190
220
-12
-8
-4
0
4
8
'96 '98 '00 '02 '04 '06 '08 '10 '12 '14 '16 '18 '20
MMAR-O-C
3/12
12/12
3MMA 12MMA
37
2017 -1.6%2018 2.4%
First in Forecasts Since 1948
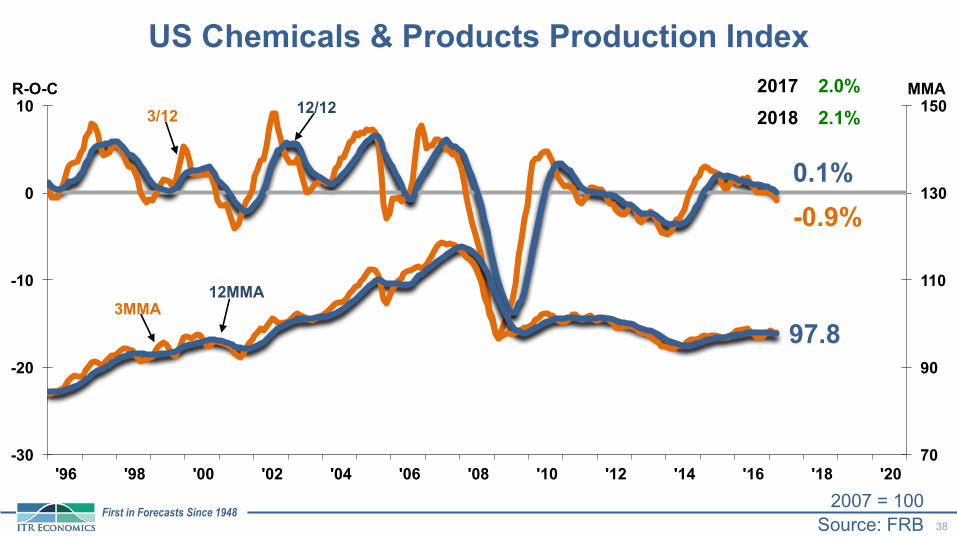
US Chemicals & Products Production Index
Source: FRB2007 = 100
-0.9%0.1%
97.8
70
90
110
130
150
-30
-20
-10
0
10
'96 '98 '00 '02 '04 '06 '08 '10 '12 '14 '16 '18 '20
MMAR-O-C
38
3/12 12/12
3MMA12MMA
2017 2.0%2018 2.1%
First in Forecasts Since 1948
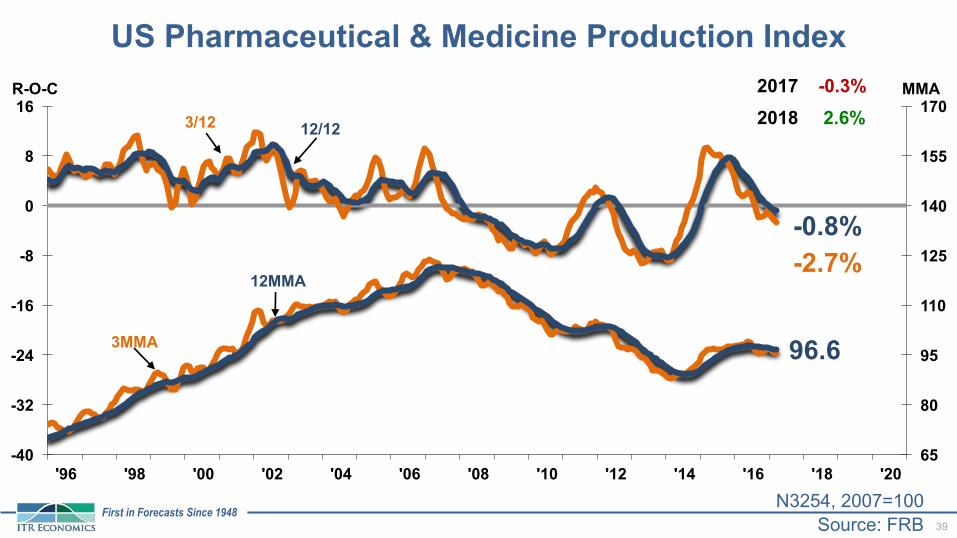
US Pharmaceutical & Medicine Production Index
Source: FRB 39
N3254, 2007=100
-2.7%-0.8%
96.6
65
80
95
110
125
140
155
170
-40
-32
-24
-16
-8
0
8
16
'96 '98 '00 '02 '04 '06 '08 '10 '12 '14 '16 '18 '20
MMAR-O-C
12/123/12
3MMA
12MMA
2017 -0.3%2018 2.6%
First in Forecasts Since 1948
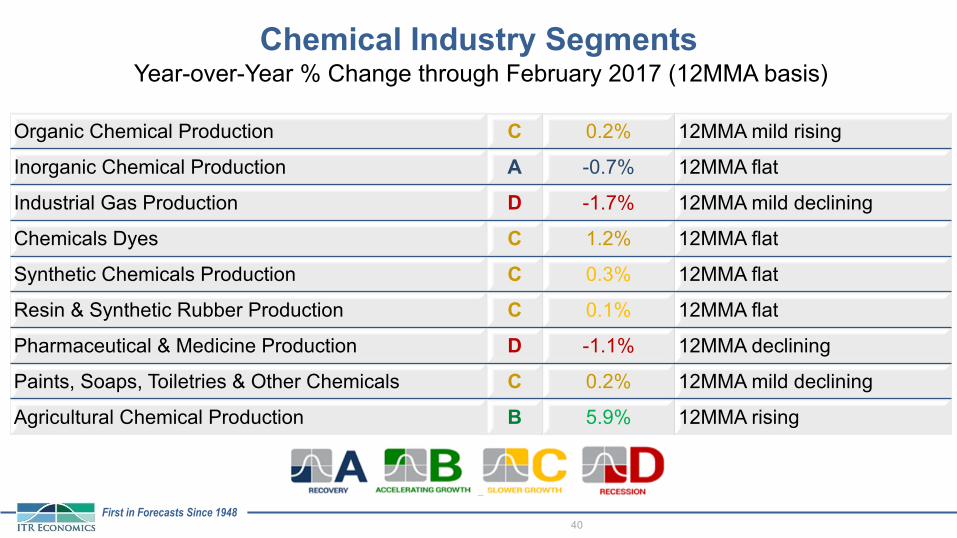
Chemical Industry Segments
Organic Chemical Production C 0.2% 12MMA mild rising
Inorganic Chemical Production A -0.7% 12MMA flat
Industrial Gas Production D -1.7% 12MMA mild declining
Chemicals Dyes C 1.2% 12MMA flat
Synthetic Chemicals Production C 0.3% 12MMA flat
Resin & Synthetic Rubber Production C 0.1% 12MMA flat
Pharmaceutical & Medicine Production D -1.1% 12MMA declining
Paints, Soaps, Toiletries & Other Chemicals C 0.2% 12MMA mild declining
Agricultural Chemical Production B 5.9% 12MMA rising
Year-over-Year % Change through February 2017 (12MMA basis)
40

First in Forecasts Since 1948
US Food Production Index
Source: FRBN311, 2007 = 100
2.9%2.8%
108.4
75
90
105
120
135
150
-12
-8
-4
0
4
8
'96 '98 '00 '02 '04 '06 '08 '10 '12 '14 '16 '18 '20
MMAR-O-C
12/123/12
12MMA3MMA
41
2017 2.1%2018 1.2%
First in Forecasts Since 194842
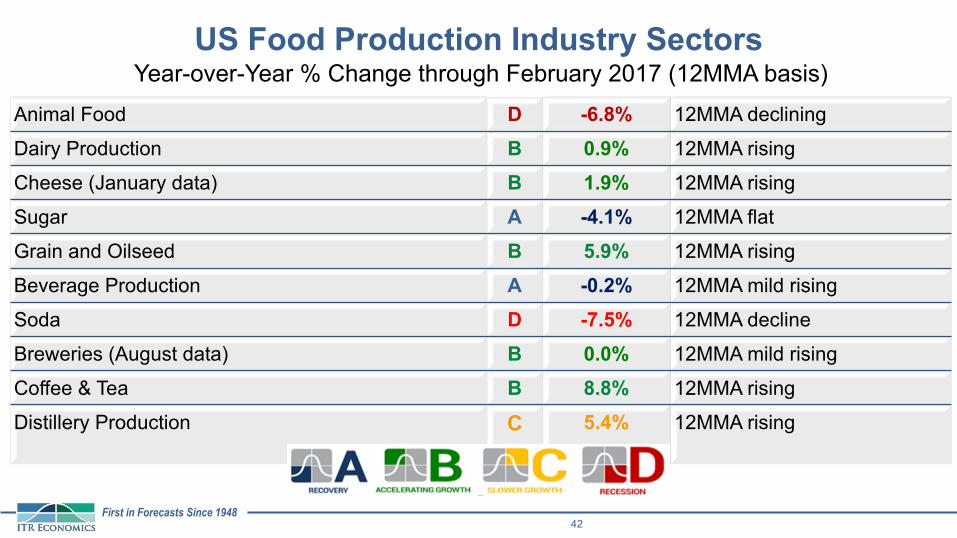
US Food Production Industry Sectors
Animal Food D -6.8% 12MMA declining
Dairy Production B 0.9% 12MMA rising
Cheese (January data) B 1.9% 12MMA rising
Sugar A -4.1% 12MMA flat
Grain and Oilseed B 5.9% 12MMA rising
Beverage Production A -0.2% 12MMA mild rising
Soda D -7.5% 12MMA decline
Breweries (August data) B 0.0% 12MMA mild rising
Coffee & Tea B 8.8% 12MMA rising
Distillery Production C 5.4% 12MMA rising
Year-over-Year % Change through February 2017 (12MMA basis)

First in Forecasts Since 1948
Industry Phase 12/12 F2017 F2018
US Industrial Production Index A -0.4% 2.2% 1.1%Mining Production Index (excl. Oil & Gas) A -2.2% 1.7% 0.2%Iron & Steel Products Production Index B 0.6% 6.7% -2.0%Industrial Machinery Production Index B 9.6% 6.3% 4.2%Oil & Gas Extraction Production Index A -4.1% 1.0% 3.1%Electric Power Generation Production B 0.8% -1.6% 2.4%Water & Sewer Facility Construction D -11.9% -2.8% 7.3%Energy & Power Facility Construction C 2.6% 1.6% 11.8%Chemicals Production Index C 0.1% 2.0% 2.1%Paper Production Index A -1.5% 0.1% -2.3%Canada Industrial Production Index B 0.1% 3.1% 1.8%Mexico Industrial Production Index D -0.3% 1.9% 2.0%
North American Market Sectors – 2017/18 Outlook
Sources: FRB, Census Bureau, Statistics Canada, Mexico National Institute of Statistics and Geography12/12 Rates-of-Change
43
First in Forecasts Since 1948
0
1
2
3
4
5
6
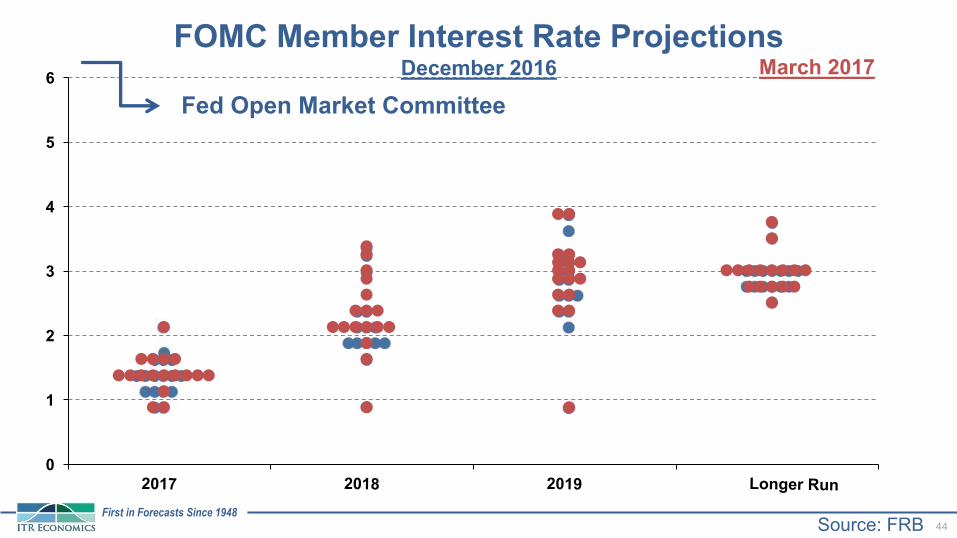
FOMC Member Interest Rate Projections
Source: FRB 44
Fed Open Market CommitteeMarch 2017December 2016

First in Forecasts Since 1948
ITR Management Objectives™Actionable Takeaways
45
1. Budget for continued economic growth through 2018
2. Be willing to take risks – have to be in it to win it
3. Consider opportunistic business and capital acquisitions
4. Add new products – new ventures buck the business cycle
5. Make sure your training and retention programs are top notch
6. Budget for higher wages and input costs – Raise your prices!

First in Forecasts Since 1948
Email [email protected] with the subject line
Receive monthly updates on the economy
STAY INFORMED!
MCAA
ITR Economics provides the best economic intelligence to reduce risk and drive practical and profitable business decisions.