guidance for the economic reform programmes 2020-2022 of ... · a) the economic reform programmes...
TRANSCRIPT

June 2019
Guidance for the Economic Reform Programmes 2020-2022 of the Western
Balkans and Turkey
EUROPEAN COMMISSION

2
I. INTRODUCTION
a) The Economic Reform Programmes 2020-2022 should be submitted to the Commission no
later than 31 January 2020. The programme should closely follow the instructions of this
guidance note, which takes into account lessons learned from the previous year.
b) A strong link between the macroeconomic and fiscal scenario and the structural reform agenda
is essential for the comprehensiveness, coherence, effectiveness and credibility of the
programme. All reform measures included in the ERP must include details on their estimated
cost and financing and be fully reflected in the fiscal framework. Details of the cost and
financing of each reform measure shall be included in tables 10a and 10b of the annex.
Technical assistance (TA) is available to support partner countries in the costing exercise.
Detailed guidance can also be found here:
https://www.cef-see.org/files/Costing_Guidance.pdf
c) Preparation of the ERP should be centrally coordinated and endorsed at the highest level. An
official coordinator should be appointed within the government who steers the process and
ensures a widespread consensus. In addition, ERP coordinators should be appointed within
each relevant line-Ministry. Together they would form an ERP working group that would
ensure broad ownership of the exercise.
d) To create ownership and the broadest possible political support, it is crucial to involve and
consult other stakeholders such as the business community, social partners and civil society,
as well as the national parliament and regional and local authorities. These actors should
ideally be involved throughout the process and be consulted on i) the analysis of obstacles to
competitiveness and inclusive growth identified by the government, ii) the reporting on the
implementation of the targeted policy guidance and previous reform programmes, and iii) the
identification and formulation of key reforms. However, at a minimum, a first complete draft
of the ERP should be subject to a public consultation whereby the draft is made public for a
minimum of two weeks. Input should be shared with the European Commission in an annex to
the ERP. This public consultation should be launched no later than 22 November 2019 to
allow sufficient time to incorporate comments into the draft. Adequate consultations with the
social partners' organisations in line with the national tripartite consultation mechanisms
should take place as well.
II. MACRO-FISCAL FRAMEWORK
a) With respect to the common external assumptions we suggest to use as far as possible the
Commission's autumn forecast, which will be published in early November. The required
information is also available in the forecast document.1 The latest Commission forecasts can
be found on the DG ECFIN's website:
http://ec.europa.eu/economy_finance/eu/forecasts/index_en.htm
b) Countries are invited to supply quantitative information by submitting the standardised set of
tables 1-8 in the Annex also as a spreadsheet file, readable by common office programmes.
c) To improve the comparability of different submissions, support the analysis of the
macroeconomic framework and help candidate and potential candidate countries getting
acquainted with the data requirement for stability and convergence programmes, the ERP
1 The Commission's technical assumptions on interest rates, exchange rates and oil prices can usually be found in chapter 1 of
the forecast text, in a special box on technical elements behind the forecast. Estimates on global GDP growth and world
trade are presented in the publication's statistical annex, in the tables 55-60. Projections on commodity prices can be found
in table 62 of the data annex.
3
should include, as complete as possible, the standardised Annex tables. The tables should
provide aggregate data on a country-wide level including local government finances. If the
programme could benefit from additional, non-standardised, tables, these should, of course, be
added.
In all cases, the status of the quantitative information should be clearly established. To the
extent currently possible, the concepts used should be in line with the standards established at
the EU level, notably in the context of the European System of Accounts (ESA). It should be
noted if data is based on concepts which deviate from these standards.
III. STRUCTURAL REFORMS
a) The ERP 2020-2022 will cover the following eight areas:
1. Energy and transport market reform;
2. Agriculture, industry and services;
3. Business environment and reduction of the informal economy;
4. Research, development and innovation and the digital economy;
5. Trade-related reforms;
6. Education and skills;
7. Employment and labour market;
8. Social protection and inclusion.
c) The ERP is a rolling programme. Therefore, activities included in the ERP 2020-2022 should
be the same as those included in the ERP 2019-2021 for the years 2020 and 2021 if the
priorities remain the same, while also taking into account the Commission assessment of the
measures in the ERP assessments of April 2019.
d) The structural reform priorities should be consistent with key documents developed in the
bilateral relations with the European Commission and with national and regional strategies
and targets, keeping in mind that ensuring competitiveness and inclusive growth is the overall
objective of the structural reforms included in the ERP.
e) The European Commission will provide assistance to the Western Balkans and Turkey in the
preparation of the Economic Reform Programmes 2020-2022 including with the support of
the Center of Excellence in Finance (CEF) and possible TAIEX expert missions.
IV. FORMATTING
a) The ERP shall be written in font size 12 and shall not exceed 85 pages in length, with 40
pages for the macroeconomic framework and the fiscal framework together. The section on
structural reforms shall not contain more than 20 reforms and shall not exceed 40 pages in
length. A separate annex shall be added that provides information on the results and the
organisation of the consultation process with external stakeholders including any written
contributions and a list of the directly consulted institutions. Further information and analysis
should be added as additional annexes to the main document.
V. CONTACT POINTS AT THE EUROPEAN COMMISSION
a) In case of questions or comments related to the macroeconomic and fiscal framework, please
contact Mr Uwe Stamm in DG ECFIN at [email protected]. For questions or
comments related to structural reform areas 1-5, please contact Ms Barbara Banki in DG
NEAR at [email protected]. For questions or comments related to structural
reform areas 6-8, please contact Mr Lluís Prats in DG EMPL at [email protected].

4
EUROPEAN COMMISSION
ECONOMIC REFORM PROGRAMME (ERP) 2019-2021
OUTLINE
_________________________________
The expected structure and content of the ERP is described in more detail below. The outline is
meant to guide partner countries in drafting the ERP to guarantee that the provided information is
suitable and comparable across countries.

5
Table of Contents
I. INTRODUCTION ......................................................................................................... 2
II. MACRO-FISCAL FRAMEWORK ................................................................................ 2
III. STRUCTURAL REFORMS ........................................................................................ 3
VII. CONTACT POINTS AT THE EUROPEAN COMMISSION .......................................... 3
1. OVERALL POLICY FRAMEWORK AND OBJECTIVES (MAX 1 PAGE) ...................... 6
2. IMPLEMENTATION OF THE POLICY GUIDANCE (MAX 2 PAGES) ............................. 6
3. MACROECONOMIC FRAMEWORK (MAX 15 PAGES) ............................................... 6
3.1. Recent economic developments .................................................................... 6
3.2. Medium-term macroeconomic scenario ....................................................... 6
3.3. Alternative scenarios and risks ..................................................................... 8
4. FISCAL FRAMEWORK (MAX 25 PAGES) .................................................................. 8
4.1. Policy strategy and medium-term objectives ................................................ 8
4.2. Budget implementation in 2019 .................................................................... 9
4.3. Medium-term budgetary outlook .................................................................. 9
4.4. Structural balance (cyclical component of the deficit, one-off and temporary
measures, fiscal stance) ............................................................................... 9
4.5. Debt levels and developments, analysis of below-the-line operations and stock-
flow adjustments ....................................................................................... 10
4.6. Sensitivity analysis and comparison with the previous programme ........... 10
4.7. Fiscal governance and budgetary frameworks ............................................ 10
4.8. Sustainability of public finances ................................................................. 10
5. STRUCTURAL REFORMS IN 2020-2022 (MAX 40 PAGES) ..................................... 12
5.1. Identification of key obstacles to competitiveness and inclusive growth (max 3
pages) ........................................................................................................ 12
5.2. Summary of reform measures (max 1 page) ............................................... 12
5.3. Analysis by area and structural reform measures (max 35 pages) .............. 12
4.3.1 Energy and transport market reform ........................................................... 14
4.3.2 Agriculture, industry and services .............................................................. 14
4.3.3 Business environment and reduction of the informal economy .................. 14
4.3.4 Research, development and innovation and the digital economy ............... 15
4.3.5 Trade-related reforms.................................................................................. 15
4.3.6 Education and skills .................................................................................... 15
4.3.7 Employment and labour markets ................................................................ 15
4.3.8 Social protection and inclusion ................................................................... 15
6. THE COST AND FINANCING OF STRUCTURAL REFORMS ...................................... 15
7. INSTITUTIONAL ISSUES AND STAKEHOLDER INVOLVEMENT (MAX 1 PAGE) ....... 16
6
1. OVERALL POLICY FRAMEWORK AND OBJECTIVES (MAX 1 PAGE)
This section will briefly explain the status of the ERP in the context of national procedures, e.g.
specifying whether it has been adopted by parliament and whether it has been subject to a wide-
reaching national consultation process with external stakeholders. Furthermore, it should briefly
describe the country’s key economic challenges, the current policy framework for the medium
term and spell out the main policy objectives embedded in that framework. Countries are
encouraged to include cross-references to the Commission's assessment in the respective annual
report of the enlargement package.
2. IMPLEMENTATION OF THE POLICY GUIDANCE (MAX 2 PAGES)
Provide a concise overview of the measures taken or planned to be taken over the duration of the
programme to implement the policy guidance that was adopted in the Economic and Financial
Dialogue in May 2019. The following sections on the medium-term macroeconomic and fiscal
framework and structural reforms should be consistent with these measures and should refer back
to them and their expected impact where appropriate.
3. MACROECONOMIC FRAMEWORK (MAX 15 PAGES)
The economic framework should start with a short overview of the programme's expectations on
the development of the world economy and a brief description of the programme's underlying
technical assumptions.2
3.1. Recent economic developments
This sub-section will present a very brief overview of developments during 2019, focusing upon
key economic aggregates such as output, consumption, investment, employment, productivity,
wages, the external sector, inflation, monetary and credit variables, as well as the exchange rate.3 A
more in-depth analysis of particular macroeconomic issues should be developed in the following
sub-section.
Furthermore, the text will compare the economic trends occurred since the last submission to those
envisaged in the previous document. The comparison should highlight the reasons for any
significant deviation from expected trends.
3.2. Medium-term macroeconomic scenario
The programme is expected to provide a realistic and consistent medium-term macroeconomic
scenario. Significant divergences between the national and the Commission services' autumn 2018
forecasts (if available) will be explained in some detail. In such cases, it would be useful to give
some indications on the effect that adopting the European Commission external assumption would
have on the main variables in the programme framework (growth, inflation, budget balance and
current account balance). Due attention should be paid to the issue of the economic policy mix
supporting the envisaged macroeconomic developments.
2 Table 8 in the Annex should summarise the key data for this sub-section. In case of major revisions compared to the
previous programme or of significant deviations between the programme's assumptions and those of the European
Commission, comments in Table 8 should be used for clarification. 3 The discussion in this sub-section should be based on the data provided in Tables 1 and 2 in Annex and any other
table the authorities may wish to add.

7
The macroeconomic framework should discuss the outlook of each of the following core
macroeconomic areas separately and explain any significant revision in projected trends relative to
the previous submission.
Real sector
The programme will provide sufficient information about the outlook of the real sector to allow an
analysis of the cyclical position of the economy. The assumptions on real GDP growth should be
underpinned by an indication of the expected sources of growth, both in terms of changes in
factors of production and aggregate demand, as well as structural reforms with large expected
impacts on growth. Indicate here which five structural reform measures from the list of 15-20
measures included in section 5 you believe will have the largest impact on growth in the medium-
term.
Monetary and exchange rate policy and inflation
The programme will present briefly the current policy stance and the intended monetary policy and
their relationship to price stability, the exchange rate regime and, more generally, the policy mix.
The authorities are invited to provide a description of current exchange rate arrangements and any
proposed changes in light of the medium-term sustainability of current arrangements. In addition,
the authorities should present the expected path for inflation, and explain the policy instruments
which will be used to achieve any inflation target.
Significant changes in policy targets or instruments relative to the previous submission should be
noted and explained, for both the monetary and exchange rate policy and inflation parts.4
External sector and its medium-term sustainability
This sub-section will assess the past and expected future evolution of the current account balance,
including its main contributing elements (e.g. goods/services balance, net primary income balance,
current transfers). It will also assess to what extent the evolution of the current account is cyclical
or structural. As to assess balance of payment vulnerabilities, the programme will also provide an
analysis of capital flows and their composition (FDI inflows, portfolio investments, bank lending
etc.), clearly identifying expected debt-creating flows over the programme's horizon.
In order to complement the flow analysis with stock assessments, the discussion should also refer
to the evolution of the country's net international investment position (NIIP) and/or gross external
debt. As to better assess vulnerabilities, it is recommended to focus separately on liabilities that
require repayment of principal or interest as opposed to non-debt generating liabilities. In this
respect, the major risks that could affect the sustainability of external debt will be identified by
assessing vulnerabilities arising from potential interest rate and exchange rate shocks and the
maturity composition of the debt. Projected developments in external reserves relative to imports
and short-term debt will also be covered.
The discussion will be complemented by an analysis of the prospects for the country's export
performance, including the expected evolution of its geographical and sector composition.
Developments in the country's price and cost competitiveness position will also be assessed by
making use of conventional indicators, such as the Real Effective Exchange Rate5, the Nominal
Unit Labour Costs, etc. In addition, changes in overall export market shares of goods and services
will also be assessed so as to evaluate both price and non-price competitiveness. This part will end
with a short overall assessment of the medium-term sustainability of the country's external
position.
4 Table 1a and 1b in Annex could be referred to. 5 Please provide a brief explanation, how the REER is calculated, including information on the weighting of the
currency basket and the deflator used.

8
In addition, and in order to complement the macro analysis above, this sub-section should provide
a qualitative assessment of national markets for goods and services regarding their openness to
international competition and their level of integration with the EU economy. It will be based upon
recent developments in: (i) trade openness, (ii) FDI performance and (iii) obstacles to trade in
goods and services, and to cross-border investments.
In the event that any potential problems are identified, the authorities are expected to provide a
description of their policy proposals. Significant changes in policy targets or instruments relative to
the previous submission should be noted and explained.6
Financial sector
The authorities should provide quantitative and qualitative information on the development of the
financial sector, including on its intermediary role between investors and savers. A discussion of
projected developments in domestic credit should be included, in particular referring to the
development of private sector credits and private sector debt. Projected trends in the composition
and currency denomination of domestic credit flows will be discussed on the basis of data on the
foreign currency liabilities of different sectors of the economy to the banking system, to non-
banking financial institutions and to external creditors. The stability of the domestic financial and
banking system should be assessed and any weaknesses, which could potentially threaten its
stability, will be highlighted. Risks related to the possible feed-back loops between the real
economy and the financial sector should be assessed.
The programme will also provide information on any planned financial sector reform; in particular,
prudential, supervisory and regulatory changes foreseen over the programme period to foster
financial stability should be highlighted, along with measures to address NPL resolution.
3.3. Alternative scenarios and risks
This sub-section should provide an assessment of the main upside and downside risks, related to
both the external and the domestic environment, underlying the macroeconomic scenario. It should
take into account potential downside risks to domestic demand, such as delays in the
implementation of critical structural reforms, under-implementation of public investment, political
uncertainties curbing confidence, or adverse developments in households' disposable income. In
the case that risks to the baseline scenario are identified, an alternative macroeconomic scenario is
strongly encouraged, clearly specifying all the differences in assumptions and trends between
scenarios.
4. FISCAL FRAMEWORK (MAX 25 PAGES)
4.1. Policy strategy and medium-term objectives
This sub-section will serve as an introduction and should explain the programme's overall fiscal
policy strategy. Particular attention will be devoted to putting the fiscal policy objectives into the
broader context of the overall economic policy framework. The programme will also include an
assessment of the structure and efficiency of revenue systems as well as of the composition and
effectiveness of expenditure and highlight changes to be introduced by the fiscal strategy.
References shall be made to the Commission's assessment of the previous ERP and the Joint
Conclusions of the Economic and Financial Dialogue between the EU and the Western Balkans
and Turkey from May 2018.
6 Tables 1a, 1d, 1f, 1g and 8 in Annex could be referred to.

9
4.2. Budget implementation in 2019
In this part, the programme will describe the budgetary implementation for 2019. The development
of the main expenditure and revenue categories should be briefly described and compared with the
budget for 20197 and reasons for deviations should be fully assessed.
4.3. Budget plans for the ERP submission year
In this part, the programme will describe the budgetary plans for the ERP submission year. The
development of the main expenditure and revenue categories should be briefly described and
compared with the budget plan and outcome of the previous year. Reasons for deviations from the
previous year should be explained and assessed.
4.4. Medium-term budgetary outlook
This sub-section will describe for the whole programme period the budgetary and other economic
measures being taken, or proposed, to achieve the fiscal objectives of the programme. It will
include the fiscal plan for 2021-2022, and a description and quantification of the underlying
policies and measures. The programme should illustrate the feasibility of the government's fiscal
objectives by means of a projection of the main fiscal aggregates. It should be assessed to what
extent the expected budgetary balance might depend on the accomplishment of structural reforms.
To allow for a comprehensive understanding of the path of the government balance and of the
budgetary strategy in general, the programme will spell out expenditure and revenue ratios and
their components. This is expected to be underpinned by quantitative and qualitative information
on the most significant policy measures on the revenue and expenditure sides that will support the
outlined fiscal strategy or could impact the achievement of the fiscal targets, such as in the area of
taxation (including estimates for tax expenditures), public sector wages and employment, social
benefit system, subsidy reforms etc. One-off and other temporary measures should be clearly
distinguished from permanent ones.
With cross-reference to the list of the five structural reform measures with the largest expected
impact on growth outlined in section 3.2 “real sector”, make an estimate of the expected budgetary
impact of these five measures.
The programme will also provide information on the plans to finance current and future
government deficits and on the sources and expected costs of such financing (including, where
possible, EU resources), and any plans to access debt markets.8
4.5. Structural balance (cyclical component of the deficit, one-off and temporary
measures, fiscal stance)
Countries are invited to present their views on the cyclical position of the economy and its impact
on the budgetary position. The text should discuss the factors affecting potential growth and
cyclical developments as well as the parameters, data and methodology used for the projections.
One-off and temporary measures should be clearly identified and estimates of their budgetary
impact (including as a share of GDP) should be presented for the previous year and the whole
programme period.
7 Where relevant, the comparison should also be made with the revised 2019 budget. 8 Data should be provided on the basis of Tables 2, 3, 6 and 7 in Annex and be comparable with those of the fiscal
notification. Only if this should still be impossible due to the limited availability and/or preliminary nature of ESA
2010 fiscal data, GFS data should be used as an alternative. The exact reasons for doing so should be clearly stated
along with a detailed calendar setting out the actions needed to correct these outstanding methodological
weaknesses.
10
4.6. Debt levels and developments, analysis of below-the-line operations and stock-flow
adjustments
The programme will describe the institutional arrangements governing the management of public
and publicly guaranteed domestic and external debt. Any proposed changes to these arrangements
should be specified. In those cases where borrowing limits have been introduced, the programme
should explain the key elements of the ceilings.
This sub-section will also provide a description of the key features of the existing debt stock and a
projection of its evolution and its determinants on all government levels. Key assumptions, such as
those concerning interest rate and exchange rate movements, should be made explicit. To allow a
comprehensive understanding of the path of the debt ratio, information should be provided, to the
extent possible, on components of the stock-flow adjustment, planned privatisation receipts, and
other financial operations. Where relevant, sensitivity analyses are encouraged.
Contingent liabilities
This sub-section will provide an estimate of contingent liabilities of central and local governments
such as state guarantees on non-sovereign borrowing, legal obligations, financial obligations
arising from PPPs and concessions, the obligations of state owned financial institutions and state-
owned/public enterprises, the obligations of quasi-governmental organisations, bank bail-outs, and
the accumulation and/or clearing of governmental as well as public enterprise arrears and
liabilities. In this context, it could prove useful to describe envisaged "fall-back positions", i.e.
compensatory measures to be taken if necessary, and contingency reserves.
4.7. Sensitivity analysis and comparison with the previous programme
- Sensitivity of the budgetary projections to alternative scenarios and risks
This sub-section will provide an assessment of the main upside and downside risks to the fiscal
scenario over the programme period.
It will be accompanied by a sensitivity analysis of the impact of changes to main economic
assumptions (in particular, GDP growth, interest rates and exchange rates) and/or the alternative
macroeconomic scenario presented in section 2 on the fiscal position.
- Comparison with the previous programme
Budgetary outcomes and current policy plans should be briefly compared with the targets
presented in the previous programme, assessing the reasons for any significant difference in
outcomes and future targets.
4.8. Fiscal governance and budgetary frameworks
The programme will describe envisaged changes to the country's fiscal governance, i.e. to the set
of arrangements, rules, and institutions that underlie the conduct of fiscal policy, such as: (1)
numerical fiscal rules; (2) independent fiscal institutions to monitor fiscal performance and/or
advise the government on fiscal policy matters; (3) medium-term budget frameworks; (4) use
of realistic, unbiased forecasts for budget planning and their regular evaluation; (5) availability
and quality of fiscal data and alignment with ESA standards. The programme should present the
compliance with the country’s fiscal rules over the programme period.
4.9. Sustainability of public finances
The authorities are expected to spell out their policy strategy with respect to the sustainability of
public finances. In support of this strategy, the programmes will present an analysis of the long-
11
term sustainability of public finance, especially in light of the envisaged trends in pension and
health care expenditures9.
The underlying policies should be appropriately described and projections should be based on a
"current policy scenario". In case of planned but not yet implemented reforms, an alternative
“reform scenario” table should also be provided and reforms, such as in the area of pension and
health care, should be outlined.
9 Table 7 in Annex could be referred to.

12
5. STRUCTURAL REFORMS IN 2020-2022 (MAX 40 PAGES)
This section will first provide a concise overview of the main structural obstacles to
competitiveness and inclusive growth at national level. Following this overview, the analysis of
structural obstacles for the country as a whole shall be broken down by area (outlined below) to
explain in more details the current state of the economy. Based on this analysis, the section should
then identify 15-20 reform measures, spread across the areas, which will be implemented over the
period 2020-2022 to tackle the most important obstacles. The expected outcome or impact of
reforms should be elaborated in detail. It is important to include specific activities with a detailed
timeline for each reform measure.
For further clarifications on the definition of a structural reform and a measure, please see the
Guidance note from 2018 found here:
https://ec.europa.eu/neighbourhood-enlargement/policy/policy-highlights/economic-
governance_en
5.1. Identification of key obstacles to competitiveness and inclusive growth (max 3 pages)
This section should give a concise overview of the main underlying structural obstacles to
competitiveness and inclusive growth at national level. The (country-wide) overview should be
limited to an analysis of key obstacles and challenges across sectors and should not report on
implemented reforms or reform plans. The OECD ERP Diagnostic Tool (link:
https://www.oecd.org/south-east-europe/programme/ERP_Diagnostic_Tool.pdf) can provide
practical guidelines for the development of this section and it is strongly recommended to make
full use of this tool.
5.2. Summary of reform measures (max 1 page)
This section should include a table with the 15-20 reform measures identified below in order to
give an overview. Where a reform is linked to previous years' policy guidance, this should be
identified and indicated in the table.
Measures which still constitute a main priority of the government and respond to a key constraint
should be rolled over from the previous year's ERP. As a rule, measures should only be
discontinued if they i) have been fully implemented, ii) do not effectively address a key constraint
or iii) are no longer considered a priority for the government. When discontinuing a measure,
provide an explanation in the ERP in Annex table 11. Delays in implementation are not a valid
reason to drop a measure.
Measures should be selected based on the identified key obstacles to competitiveness and inclusive
growth in section 5.3 below. The policy guidance from May 2019 should also inform the
prioritisation of structural reform measures in the ERP 2020-2022 as it features the main
structural reform needs of each economy as jointly agreed. A transparent, criteria-based
prioritisation methodology is illustrated in the OECD ERP Prioritisation Tool (link:
https://www.oecd.org/south-east-europe/programme/ERP_Prioritisation_Tool.pdf).
5.3. Analysis by area and structural reform measures (max 35 pages)
Each area should be structured in the following way (please include subtitles in the ERP to provide
structure):
a. Analysis of main obstacles
This should include a clear identification of key obstacles and their effects on competitiveness,
growth and social outcomes on employment and gender. Obstacles to regional economic

13
integration, including the implementation of the Regional Economic Area Multiannual Action Plan
(REA MAP), should also be considered in the relevant areas. A comprehensive set of indicators to
describe the state of play, as well as examples of structural obstacles and their impact on
competitiveness and growth for each ERP policy area can be found in the OECD ERP Diagnostic
Tool, which could be used as a reference document for the development of this section.
b. Reform measures
This section should include a maximum of 20 reform measures clearly enumerated. The 15-20
reform measures do not have to cover all the eight areas above. However, even when there is no
priority reform measure in one of the areas, an analysis of main obstacles must still be included.
Each reform measure should include only the following information:
1. Description of measure
Give a concise description of the measure and provide information on its relations with
national strategic documents or sector strategies and wider reform efforts. If the measure is
rolled over from the previous year, indicate whether the activities planned in previous years
have been implemented. If they have not, include an explanation for the delays.
a. Activities planned in 2020
Describe the activities planned in 2020 and indicate which Government
body/ministry or other stakeholder is responsible for the implementation of each
activity.
b. Activities planned in 2021
Describe the activities planned in 2021 and indicate which Government
body/ministry or other stakeholder is responsible for the implementation of each
activity.
c. Activities planned in 2022
Describe the activities planned in 2022 and indicate which Government
body/ministry or other stakeholder is responsible for the implementation of each
activity.
2. Results Indicators
In a simple table, include 2-3 country-wide results indicators for monitoring and evaluating
the results of each reform measure on specific segments or sectors in the economy. These
indicators should be specific for each reform measure. Further information on the selection
of indicators can be taken from the OECD ERP Monitoring Tool (link:
https://www.oecd.org/south-east-europe/programme/ERP_Monitoring_Tool.pdf).
Example:
Indicator Baseline (year) Intermediate
target (year)
Target (year)
3. Expected impact on competitiveness (not relevant for the area "social protection and
inclusion")
The purpose of this section is to estimate the expected quantified impact on
competitiveness and/or growth. The ERP should identify 1-3 country-wide high-
level outcome indicators that can be applied to each reform measure to estimate
and then report on the impact. Further information on the selection of indicators
can be taken from the OECD ERP Monitoring Tool. Such outcome indicators
should help answer the following questions: How do the sectors or businesses etc.

14
targeted by the reform measure contribute to GDP, GDP growth, exports or export
growth now and to what extent is this expected to change after the implementation
of the reform? When looking at the potential effect, a longer time horizon should
be used; some reforms (e.g. education) will only fully unfold their impact 10 or 20
years from now.
4. Estimated cost of the activities and the source of financing
Estimate the annual additional cost of the implementation of all the activities of the
measure. State the source of financing used to cover the full costs. However, do not
mention the specific donor or lender by name. Further guidance on costing and financing of
structural reform can be found in the CEF Guidance on Costing (link:
https://www.cef-see.org/files/Costing_Guidance.pdf).
5. Expected impact on social outcomes, such as employment, poverty reduction, equality
and gender
Estimate the expected qualitative and/or quantitative impact of the measure on social
outcomes, such as employment, poverty reduction, equality and gender in the short-,
medium- and/or long-term. If the measure is considered neutral in terms of gender impact,
please make this clear.
6. Expected impact on the environment
Estimate the expected impact of the measure on the environment (quantitative) in the short,
medium and/or long term. If the measure is neutral in terms of environmental impact,
please make this clear.
7. Potential risks
Fill in and include the below table for each measure.
Risk Probability (low
or high)
Planned mitigating action
4.3.1 Energy and transport market reform
Public policies directly affecting the competitiveness of the transport and energy markets (e.g.
liberalisation of energy markets, strengthening of regulation and oversight etc.) will be covered
under this sub-section.
4.3.2 Agriculture, industry and services
Public policies directly affecting the competitiveness of a sector will be covered under this sub-
section. This includes sector specific and cross-sector development strategies across any of the
three sectors of the economy (agriculture, industry/manufacturing and services).
4.3.3 Business environment and reduction of the informal economy
Public policies directly affecting the business environment (e.g. regulatory and administrative
reforms including on public procurement, reduction of costs of doing business including para-
fiscal charges, improvement in property rights, contract enforcement, access to finance, support
to SMEs etc.), subsidy and state aid policies, privatisation, SOE restructuring and corruption will
be covered under this sub-section. Public policies aiming to reduce the informal economy should
also be covered here.

15
4.3.4 Research, development and innovation and the digital economy
Public policies directly affecting the capacity of the economy/businesses to absorb technology
and to innovate (e.g. public investments and incentives for private investments in research &
development, SMART specialisation and inter-linkages between research institutions and
businesses, innovation-specific support to SMEs etc.) will be covered under this sub-section.
Measures related to the digitisation of the economy will also be covered under this sub-section.
4.3.5 Trade-related reforms
Public policies fostering trade integration of the countries at regional, EU and global level (e.g.
quality and safety standards, conclusion of trade agreements, customs reform etc.) will be
covered under this sub-section.
4.3.6 Education and skills
Public policies to strengthen access to and quality of education, training and life-long learning at
all levels will be covered in this sub-section. This includes improving the provision of basic skills
in pre-school and general education, increasing educational attainment levels and promoting an
appropriate supply of relevant knowledge, skills and competences to manage successfully
transition in the labour market (e.g. developing Vocational Education and Training (VET) and
promoting work-based learning systems). The latest available PISA (Programme for International
Students Assessment) and where applicable PIAAC (Programme for International Assessment of
Adult Competencies) rating should be included for reference as well.
4.3.7 Employment and labour markets
Public policies to promote quality employment, equal opportunities and access to the labour
market and fair working conditions will be covered in this sub-section. This includes boosting
demand for labour, promoting productivity and employability through enhancing the functioning
of the labour markets, active support for employment, effective public employment services,
social dialogue, and labour inspection with effective enforcement of labour rules across the entire
territory as well as tackling high unemployment and inactivity, in particular of young people,
women and long-term unemployed.
4.3.8 Social protection and inclusion
This section will cover public policies modernising social protection systems to provide effective,
efficient, and adequate protection throughout all stages of a person’s life, fostering social
inclusion, promoting equal opportunities and addressing inequalities and poverty. This includes
adequate activation support and income for (re)integration in the labour market and society, and
sustainability and adequacy of pension systems and access to quality services such as early
childhood education and care, housing, healthcare and essential services and long-term care.
6. THE COST AND FINANCING OF STRUCTURAL REFORMS
This section should summarise the costs and financing sources of the structural reforms, i.e.
whether they are financed by the budget, by external lenders or by external donors. Please indicate
rough percentages of each. It should also provide an overview as to what type of measure is most
common in the programme (infrastructure/administrative/legislative/direct grants/credit guarantee
scheme).

16
7. INSTITUTIONAL ISSUES AND STAKEHOLDER INVOLVEMENT (MAX 1 PAGE)
Involvement and participation of all actors is essential to ensure ownership and facilitate progress
on the implementation of the policy guidance and reforms. This section should thus explain the
institutional process for the preparation and approval of the Economic Reform Programme as well
as the public consultation.
The section should include information on:
■ The government ministries and agencies involved in the process and how the coordinator
arbitrated different interests.
■ The process by which regional and local authorities were involved in the preparation of
the programme and in the implementation of the past policy guidance and commitments.
■ When the programme was presented to the national Parliament and the outcome of the
discussions.
■ The process by which social partners (employers’ associations and trade unions) and civil
society were consulted in the preparation of the programme and their main comments and
the extent to which their comments have been taken on board.
In addition to explanations given in this section, partner countries are asked to include the main
comments of civil society and any written contributions from external stakeholders in Annex 2.
This section should not be longer than 1 page.
N.B. It is not enough to include information on previously conducted external consultations on
other national strategies, agendas and programmes. The ERP should be subject to a specific and
separate external consultation, giving stakeholders the opportunity and sufficient time to
comment on a draft version of the ERP.

17
ANNEX 1: TABLES TO BE CONTAINED IN THE ECONOMIC REFORM PROGRAMMES
AND THEIR UPDATES10
Table 1a: Macroeconomic prospects
ESA
Code
Year
X – 2
Year
X –
2
Year
X-1
Year
X
Year
X +
1
Year
X +
2
Level (€) Rate of change
1. Real GDP at market prices B1*g
2. GDP at market prices B1*g
Components of real GDP
3. Private consumption
expenditure P3
4. Government consumption
expenditure P3
5. Gross fixed capital formation P51
6. Changes in inventories and net
acquisition of valuables (% of
GDP)
P52+
P53
7. Exports of goods and services P6
8. Imports of goods and services P7
Contribution to real GDP growth
9. Final domestic demand
10. Change in inventories and net
acquisition of valuables
P52+
P53
11. External balance of
goods/services B11
10 Please replace in the tables the placeholders (Year X+/-n) indicating the programme period with the concrete years,
with the year X being the year of the submission deadline.
18
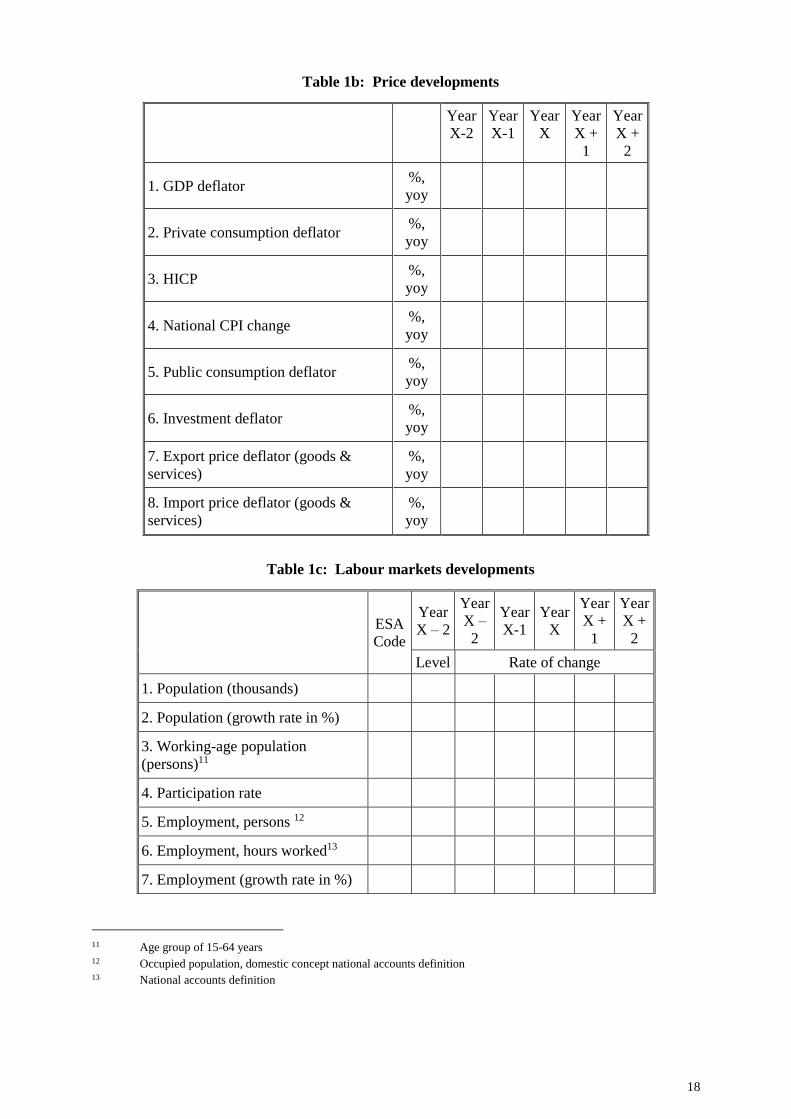
Table 1b: Price developments
Year
X-2
Year
X-1
Year
X
Year
X +
1
Year
X +
2
1. GDP deflator %,
yoy
2. Private consumption deflator %,
yoy
3. HICP %,
yoy
4. National CPI change %,
yoy
5. Public consumption deflator %,
yoy
6. Investment deflator %,
yoy
7. Export price deflator (goods &
services)
%,
yoy
8. Import price deflator (goods &
services)
%,
yoy
Table 1c: Labour markets developments
ESA
Code
Year
X – 2
Year
X –
2
Year
X-1
Year
X
Year
X +
1
Year
X +
2
Level Rate of change
1. Population (thousands)
2. Population (growth rate in %)
3. Working-age population
(persons)11
4. Participation rate
5. Employment, persons 12
6. Employment, hours worked13
7. Employment (growth rate in %)
11 Age group of 15-64 years 12 Occupied population, domestic concept national accounts definition 13 National accounts definition
19
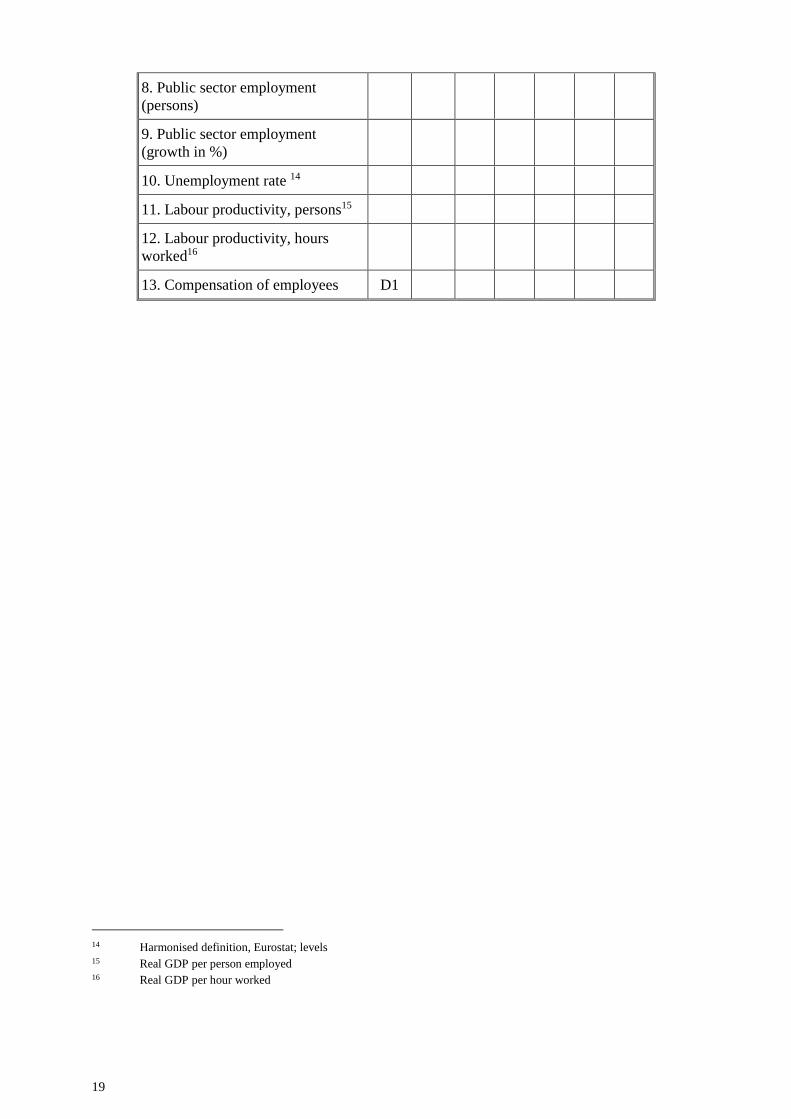
8. Public sector employment
(persons)
9. Public sector employment
(growth in %)
10. Unemployment rate 14
11. Labour productivity, persons15
12. Labour productivity, hours
worked16
13. Compensation of employees D1
14 Harmonised definition, Eurostat; levels 15 Real GDP per person employed 16 Real GDP per hour worked

20
Table 1d: Sectoral balances
% of GDP ESA
code
Year
X – 2
Year
X – 1
Year
X
Year
X + 1
Year
X + 2
1. Net lending/borrowing vis-à-vis the
rest of the world B.9 optio
nal
optio
nal
of which:
- Balance of goods and services
- Balance of primary incomes &
transfers
- Capital account
2. Net lending/borrowing of the private
sector
B.9/
EDP B.9
3. Net lending/borrowing of general
government
4. Statistical discrepancy optio
nal
optio
nal
optio
nal
optio
nal
21
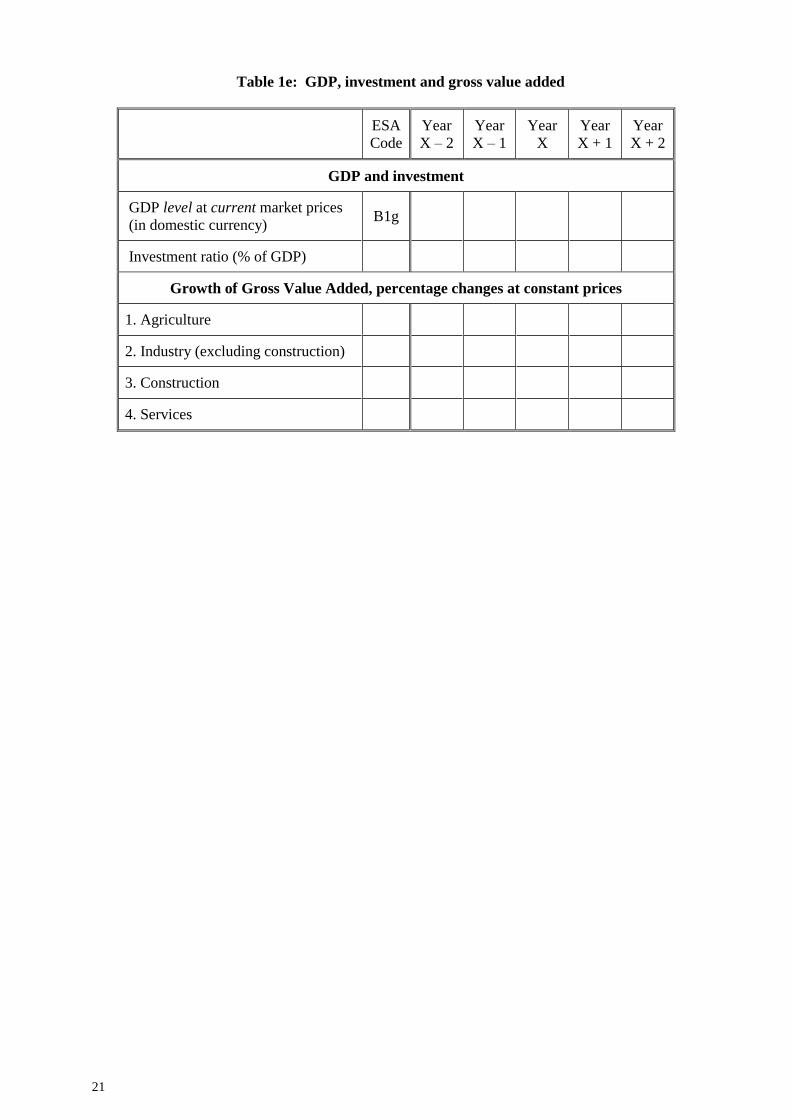
Table 1e: GDP, investment and gross value added
ESA
Code
Year
X – 2
Year
X – 1
Year
X
Year
X + 1
Year
X + 2
GDP and investment
GDP level at current market prices
(in domestic currency) B1g
Investment ratio (% of GDP)
Growth of Gross Value Added, percentage changes at constant prices
1. Agriculture
2. Industry (excluding construction)
3. Construction
4. Services
22
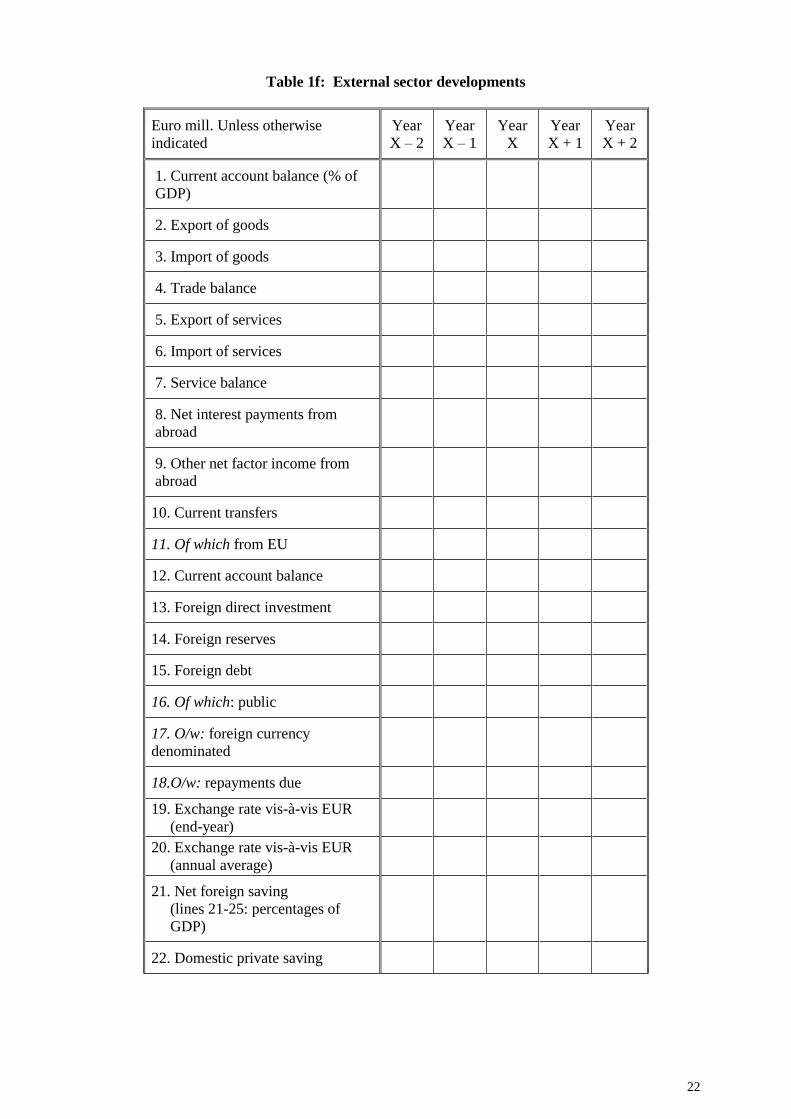
Table 1f: External sector developments
Euro mill. Unless otherwise
indicated
Year
X – 2
Year
X – 1
Year
X
Year
X + 1
Year
X + 2
1. Current account balance (% of
GDP)
2. Export of goods
3. Import of goods
4. Trade balance
5. Export of services
6. Import of services
7. Service balance
8. Net interest payments from
abroad
9. Other net factor income from
abroad
10. Current transfers
11. Of which from EU
12. Current account balance
13. Foreign direct investment
14. Foreign reserves
15. Foreign debt
16. Of which: public
17. O/w: foreign currency
denominated
18.O/w: repayments due
19. Exchange rate vis-à-vis EUR
(end-year)
20. Exchange rate vis-à-vis EUR
(annual average)
21. Net foreign saving
(lines 21-25: percentages of
GDP)
22. Domestic private saving
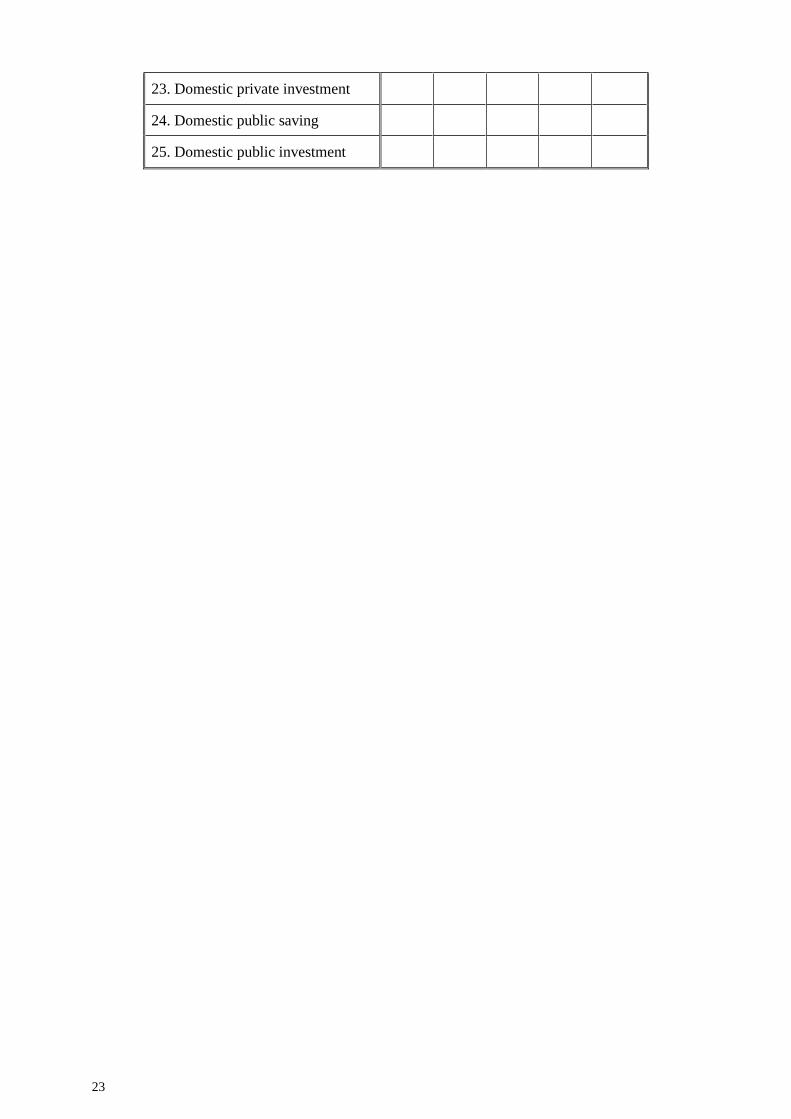
23
23. Domestic private investment
24. Domestic public saving
25. Domestic public investment

24
Table 1g: Sustainability indicators
Dimension Year
X – 5
Year
X – 4
Year
X – 3
Year
X – 2
Year
X – 1
1. Current Account Balance % of GDP
2. Net International Investment
Position
% of GDP
3. Export market shares %, yoy
4. Real Effective Exchange
Rate 17 %, yoy
5. Nominal Unit Labour Costs %, yoy
6. Private sector credit flow % of GDP
7. Private sector debt % of GDP
8. General Government Debt % of GDP
17 Please explain the methodology used (deflators, trade weighing, etc)

25
Table 2a: General government budgetary prospects
ESA
code
Year
X – 2
Year
X –
2
Year
X –
1
Year
X
Year
X +
1
Year
X +
2
Level % of GDP
Net lending (B9) by sub-sectors
1. General government S13
2. Central government S1311
3. State government S1312
4. Local government S1313
5. Social security funds S1314
General government (S13)
6. Total revenue TR
7. Total expenditure18 TE
8. Net borrowing/lending EDP.B9
9. Interest expenditure EDP.D4
1
10. Primary balance19
11. One-off and other temporary
measures20
Components of revenues
12. Total taxes (12 =
12a+12b+12c)
12a. Taxes on production and
imports
D2
12b. Current taxes on income and
wealth
D5
12c. Capital taxes D91
13. Social contributions D61
14. Property income D4
15. Other (15 = 16-(12+13+14))21
18 Adjusted for the next flow of swap-related flows, so the TR-TE = EDP.B9. 19 The primary balance is calculated as (EDP.B9, item 8) plus (EDP D41 + FISIM recorded as intermediate
consumption, item 9). 20 A plus sign means deficit-reducing one-off measures 21 P.11+P.12+P.131+D.39+D.7+D.9 (other than D.91).

26
16 = 6. Total revenue TR
p.m.: Tax burden
(D2+D5+D61+D91-D995)22
22 Including those collected by the EU and including an adjustment for uncollected taxes and social contributions
(D995), if appropriate.

27
Table 2a (continued)
ESA
code
Year
X – 2
Year
X –
2
Year
X –
1
Year
X
Year
X +
1
Year
X +
2
Level % of GDP
Selected components of expenditures
17. Collective consumption P32
18. Total social transfers D62 +
D63
18a. Social transfers in kind P31 =
D63
18b. Social transfers other than in
kind D62
19 = 9. Interest expenditure EDP.D4
1
20. Subsidies D3
21. Gross fixed capital formation P51
22. Other (22 = 23-
(17+18+19+20+21)23
23 = 7. Total expenditures TE24
p.m. Compensation of public sector
employees D1
23 D.29+D4 (other than D.41)+ D.5+D.7+D.9+P.52+P.53+K.2+D.8 24 Adjusted for the next flow of swap-related flows, so the TR-TE = EDP.B9.

28
Table 2b: General government budgetary prospects
ESA
code
Year
X – 2
Year
X –
2
Year
X –
1
Year
X
Year
X +
1
Year
X +
2
Level Bn NCU
Net lending (B9) by sub-sectors
1. General government S13
2. Central government S1311
3. State government S1312
4. Local government S1313
5. Social security funds S1314
General government (S13)
6. Total revenue TR
7. Total expenditure25 TE
8. Net borrowing/lending EDP.B9
9. Interest expenditure EDP.D4
1
10. Primary balance26
11. One-off and other temporary
measures27
Components of revenues
12. Total taxes (12 =
12a+12b+12c)
12a. Taxes on production and
imports
D2
12b. Current taxes on income and
wealth
D5
12c. Capital taxes D91
13. Social contributions D61
14. Property income D4
15. Other (15 = 16-(12+13+14))28
25 Adjusted for the next flow of swap-related flows, so the TR-TE = EDP.B9. 26 The primary balance is calculated as (EDP.B9, item 8) plus (EDP D41 + FISIM recorded as intermediate
consumption, item 9). 27 A plus sign means deficit-reducing one-off measures

29
16 = 6. Total revenue TR
p.m.: Tax burden
(D2+D5+D61+D91-D995)29
28 P.11+P.12+P.131+D.39+D.7+D.9 (other than D.91). 29 Including those collected by the EU and including an adjustment for uncollected taxes and social contributions
(D995), if appropriate.

30
Table 2b (continued)
ESA
code
Year
X – 2
Year
X –
2
Year
X –
1
Year
X
Year
X +
1
Year
X +
2
Level Bn NCU
Selected components of expenditures
17. Collective consumption P32
18. Total social transfers D62 +
D63
18a. Social transfers in kind P31 =
D63
18b. Social transfers other than in
kind D62
19 = 9. Interest expenditure EDP.D4
1
20. Subsidies D3
21. Gross fixed capital formation P51
22. Other (22 = 23-
(17+18+19+20+21)30
23 = 7. Total expenditures TE31
p.m. Compensation of public sector
employees D1
Table 3: General government expenditure by function
Percentage of GDP COFOG
Code
Year
X – 2
Year
X – 1
Year
X
Year
X +
1
Year
X + 2
1. General public services 1
2. Defence 2
3. Public order and safety 3
4. Economic affairs 4
5. Environmental protection 5
6. Housing and community
amenities
6
7. Health 7
8. Recreation, culture and
religion
8
9. Education 9
30 D.29+D4 (other than D.41)+ D.5+D.7+D.9+P.52+P.53+K.2+D.8 31 Adjusted for the next flow of swap-related flows, so the TR-TE = EDP.B9.

31
10. Social protection 10
11. Total expenditure (item 7 =
23 in
Table 2)
TE

32
Table 4: General government debt developments
Percentages of GDP
ESA
code
Year
X –
2
Year
X –
1
Year
X
Year
X +
1
Year
X +
2
1. Gross debt 32
2. Change in gross debt ratio
Contributions to change in gross debt
3. Primary balance33
4. Interest expenditure 34
5. Stock-flow adjustment
of which:
- Differences between cash and
accruals35
- Net accumulation of financial
assets36
of which:
- Privatisation proceeds
- Valuation effects and other37
p.m. implicit interest rate on debt38
Other relevant variables
6. Liquid financial assets39
7. Net financial debt (7 = 1 – 6)
32 As defined in Regulation 3605/93 (not an ESA concept). 33 Cf. item 10 in Table 2. 34 Cf. item 9 in Table 2. 35 The differences concerning interest expenditure, other expenditure and revenue could be distinguished when
relevant. 36 Liquid assets, assets on third countries, government controlled enterprises and the difference between quoted and
non-quoted assets could be distinguished when relevant. 37 Changes due to exchange rage movement, and operation in secondary market could be distinguished when relevant. 38 Proxied by interest expenditure divided by the debt level of the previous year. 39 AF1, AF2, AF3 (consolidated at market value, AF5 (if quoted in stock exchange; including mutual fund shares).

33
Table 5: Cyclical developments
% of GDP ESA
Code
Year
X –
2
Year
X –
1
Year
X
Year
X +
1
Year
X +
2
1. Real GDP growth (%) B1g
2. Net lending of general
government
EDP.B
.9
3. Interest expenditure EDP.D
.41
4. One-off and other temporary
measures40
5. Potential GDP growth (%)41
Contributions:
- labour
- capital
- total factor productivity
6. Output gap
7. Cyclical budgetary component
8. Cyclically-adjusted balance (2-7)
9. Cyclically-adjusted primary balance
(8-3)
10. Structural balance (8-4)
Table 6: Divergence from previous programme
Year
X – 2
Year
X – 1
Year
X
Year
X + 1
Year
X + 2
1. GDP growth (% points)
Previous
programme
Current
programme
Difference
2. General government net lending (% of GDP)
Previous
programme
Current
programme
Difference
3. General government gross debt (% of GDP)
40 A plus sign means deficit-reducing one-off measures 41 Until an agreement on the Production Function Method is reached, countries can use their own figures (SP).

34
Previous
programme
Current
programme
Difference

35
Table 7: Long-term sustainability of public finances
Percentages of GDP 2007 2010 2020 2030 2040 2050 2060
Total expenditure
of which: age-related expenditures
- Pension expenditure
- Social security pension
- Old-age and early pensions
- Other pensions (disability, survivors)
- Occupational pensions (if in general
government)
- Health care
- Long-term care (this was earlier
included in the health care)
Education expenditure
Other age-related expenditures
Interest expenditure
Total revenues
of which:
property income
trade-related revenue,
royalties, concessions etc.
from pensions contributions (or
social contributions, if
appropriate)
Pension reserve fund assets
of which: consolidated public
pension fund assets (assets other
than government liabilities)
Assumptions
Labour productivity growth
Real GDP growth
Participation rate males (aged 20-64)
Participation rates females (aged 20-
64)
Total participation rates (20-64)

36
Unemployment rate
Population aged 65+ over total
population
Table 7a: Contingent liabilities
% of GDP Year
X – 1
Year
X
Public guarantees
Of which: linked to the financial sector Optional
Other contingent liabilities

37
Table 8: Basic assumptions on the external economic environment
underlying the programme framework
This table should preferably be included in the programme itself; if not, these assumptions should
be transmitted to the Commission together with the programme.
Dimension
Year
X –
2
Year
X –
1
Year
X
Year
X +
1
Year
X +
2
Short-term interest rate42 Annual
average
Long-term interest rate Annual
average
USD/EUR exchange Annual
average
Nominal effective exchange rate Annual
average
Exchange rate vis-à-vis the EUR Annual
average
Global GDP growth, excluding EU Annual
average
EU GDP growth Annual
average
Growth of relevant foreign markets Annual
average
World import volumes, excluding
EU
Annual
average
Oil prices (Brent, USD/barrel) Annual
average
42 If necessary, purely technical assumption.

38
Table 9: Selected employment and social indicators43
Data
source
Year
X –
2
Year
X-1
Year
X
Year
X +
1
Year
X +
2
Labour market participation rate (%) total
(20-64 years old)
- male
- female
2Employment rate (%) total
(20-64 years old)
- male
- female
3. Unemployment rate (%) total
- male
- female
4. Long-term unemployment rate (%) total
- male
- female
5. Youth unemployment (15-24 years old)
rate (%) total
- male
- female
6. Young people (15-24 years old) not in
employment, education or training (NEET),
in %
7. Early school leavers, in % (Eurostat
definition)
8. PISA Rating
9. PIAAC rating
10. Participation rate in early childhood
education and care
43 Given the disparate availability of data and variety of definitions used for indicators, countries should use EUROSTAT data when available.
In case of data from national or international sources, a footnote should be added for each indicator indicating how it is defined. In case no data are available for an indicator, please see whether any data would be available for a similar indicator and explain so. It is recommended
that year X = 2017. In case that no data are available for the year 2017, the data available for previous years (2016, 2015) shall be
introduced in the respective columns. For all indicators the values shall be inserted in the table, not the year-on-year change of the values as in some other tables.

39
11. GINI coefficient
12. Inequality of income distribution
S80/S20 (Income quintile ratio)
e
13. Social protection expenditure in % of
GDP
e
14. Health expenditure in % of GDP e
15. At-risk-of-poverty before social
transfers, % of the population
e
16. Poverty rate
(Please indicate which data are available
for your country)
17. Poverty gap
(Please indicate which data are available
for your country)
Other indicators used in the EU Social Scoreboard
18. Real adjusted GDHI - per capita in PPS
(Index 2008=100)
19. Impact of social transfers (other than
pensions) on poverty reduction
20. Self-reported unmet need for medical
care
21. Individuals' level of digital skills (% of
individuals with basic or above basic
overall digital skills)

Table 10a: Costing of structural reform measure: (NAME OF THE MEASURE) (in EUR) (Fill in one per reform)
Year Salaries Goods and services Subsidies and transfers Capital expenditure Total
Year X
Year X+1
Year X+2
Methodological explanation of the table:
Only “additional costs” are to be calculated in the table. This means that only those costs are to be calculated that would not be there if the measure would not be
implemented. For example, if existing staff is working on implementing a measure, their salaries should not be calculated.
The table addresses only direct first-level costs of the reform measure. In case the reform measure can be implemented without additional costs, all spaces in the table
should be filled with “0” (zero). In case the measure generates first-level implications on the revenue side of public finances (for example, an increase in budget
revenues or an increase in pension fund contributions); this should be explained and quantified in a footnote to the table.
Costing is to be done for a three-year period with the year X being the first year under the ERP, i.e. 2019.
If a measure is composed of several activities, a sub-table for each of them has to be prepared as an input for the summary table that shows costing for the structural
reform measure as a whole – these sub-tables do not have to be included in the ERP.
Category “Salaries” and its costing: The category is composed of costs for salaries to be paid for hiring additional staff that is needed to implement the structural
reform measure. Costing of the additional staff has to take into account not only the number of new staff members but also their qualifications as well as salary
increases for the existing staff members. Standardised salaries for different categories of new staff members should be applied. Such a table of standardised costs does
not need to be included in the ERP. If standardised costs are either not available or not appropriate, expert opinion can be applied.
Category “Goods and services” and its costing: The category is composed of the following categories of costs: (i) training, (ii) expertise, (iii) office equipment, (iv)
utilities (rent, electricity, travel). Standardised costs for each category should be applied whenever possible. Such a table of standardised costs does not need to be
included in the ERP. If standardised costs are either not available or not appropriate, expert opinion can be applied.
Category “Subsidies and transfers” and its costing: The category includes different types of subsidies and transfers that the beneficiary may get in order to implement
the structural reform measure. Expert opinion can be used for calculating this category of costs.
Category “Capital expenditures”: The category includes capital expenditures associated with implementation of the structural reform measure. Expert opinion can be
used for calculating forecasted expenditures under this category of costs.
Category “Total”: This is a sum of the categories in the three columns.
41
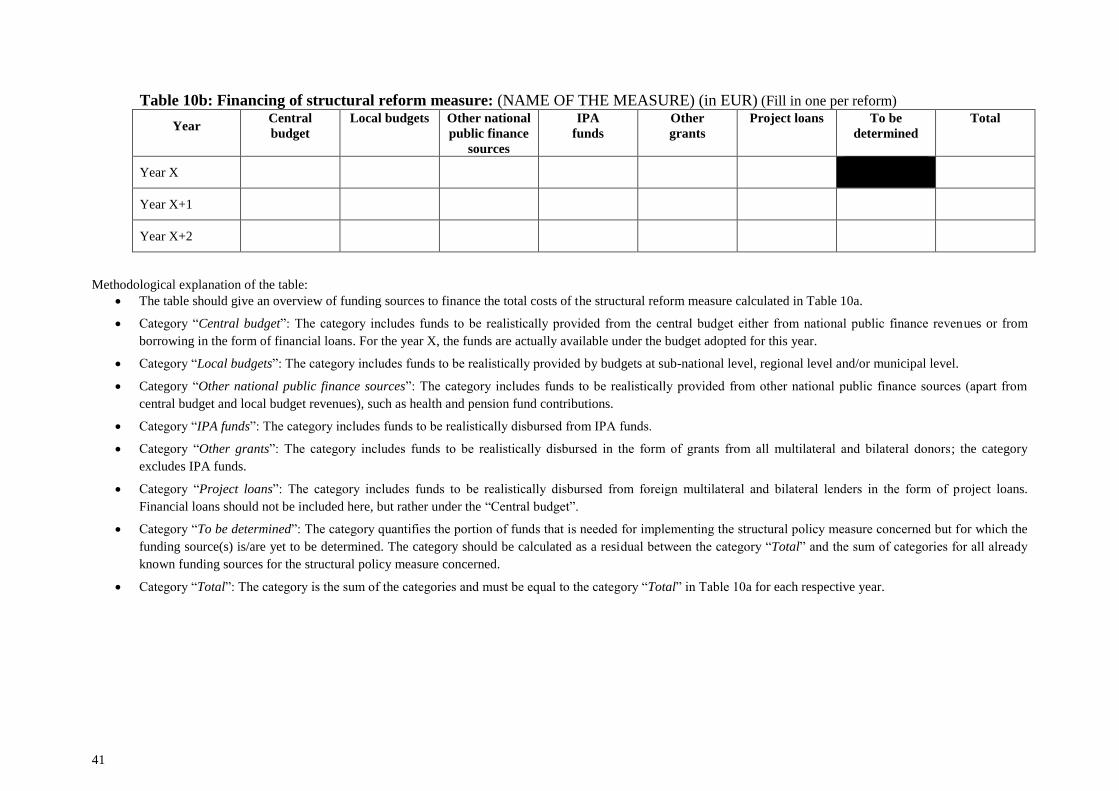
Table 10b: Financing of structural reform measure: (NAME OF THE MEASURE) (in EUR) (Fill in one per reform)
Year Central
budget
Local budgets Other national
public finance
sources
IPA
funds
Other
grants
Project loans To be
determined
Total
Year X
Year X+1
Year X+2
Methodological explanation of the table:
The table should give an overview of funding sources to finance the total costs of the structural reform measure calculated in Table 10a.
Category “Central budget”: The category includes funds to be realistically provided from the central budget either from national public finance revenues or from
borrowing in the form of financial loans. For the year X, the funds are actually available under the budget adopted for this year.
Category “Local budgets”: The category includes funds to be realistically provided by budgets at sub-national level, regional level and/or municipal level.
Category “Other national public finance sources”: The category includes funds to be realistically provided from other national public finance sources (apart from
central budget and local budget revenues), such as health and pension fund contributions.
Category “IPA funds”: The category includes funds to be realistically disbursed from IPA funds.
Category “Other grants”: The category includes funds to be realistically disbursed in the form of grants from all multilateral and bilateral donors; the category
excludes IPA funds.
Category “Project loans”: The category includes funds to be realistically disbursed from foreign multilateral and bilateral lenders in the form of project loans.
Financial loans should not be included here, but rather under the “Central budget”.
Category “To be determined”: The category quantifies the portion of funds that is needed for implementing the structural policy measure concerned but for which the
funding source(s) is/are yet to be determined. The category should be calculated as a residual between the category “Total” and the sum of categories for all already
known funding sources for the structural policy measure concerned.
Category “Total”: The category is the sum of the categories and must be equal to the category “Total” in Table 10a for each respective year.

Table 11: Reporting on the implementation of the structural reform measures of the ERP 2019-2021 (Fill in one per reform)
Name and number of reform measure Stage of reform
implementation (1-5)44
Activities planned for 2019 1
2.
3.
Description of implementation and explanation if partial or no implementation
1.
2.
3.
Comment: each country can on a voluntary basis provide additional tables and heat maps reporting on the implementation of country-wide45
reform measures, although these should not be part of the ERP itself. These could be based on those included in the OECD ERP Monitoring
Tool.
44 0=no implementation; 1=implementation is being prepared; 2=initial steps have been taken; 3=implementation ongoing with some initial results; 4=implementation is advanced; 5=full implementation 45 The Commission will not accept any tables reporting on the implementation of entity-level measures.
43
ANNEX 2: External contributions to the ERP 2020-2022
This Annex should include information on the consultation process of external stakeholders, including the national parliament, local and regional
government, social partners and civil society. All contributions should be included in this annex of the ERP.