guidance for optimizing remedial action operation (rao) centers/engineering and... ·...
TRANSCRIPT

NAVAL FACILITIES ENGINEERING COMMANDWashington, DC 20374-5065
Special ReportSR-2101-ENV
Guidance for OptimizingRemedial Action Operation (RAO)
Interim-Final
April 2001
Prepared forDepartment of the Navy RAO/LTM Optimization Working Group
Approved for public release; distribution is unlimited.
Printed on recycled paper

INTERIM FINAL
Guidance for OptimizingRemedial Action Operation (RAO)
Prepared for:Naval Facilities Engineering Service Center
Port Hueneme, California
Prepared by:Radian International
P.O. Box 13000Research Triangle Park, North Carolina 27709
April 2001

Interim Final
Guidance to Optimizing Remedial Action Operation iii April 2001
Preface
The goal of “optimization” is to achieve site closeout in the shortest amount of time and to minimize thecost of environmental restoration (ER) projects without sacrificing data quality and the ability to makeenvironmentally protective decisions. As the Department of the Navy (DON) ER Program matures, moreprojects are entering the post-remedy selection phase where millions of dollars can be spent operating,monitoring, and maintaining remediation systems. The DON is committed to optimizing the programthrough careful evaluation of project goals, remediation system effectiveness, life cycle design and costanalyses, and data management and reporting. This Guidance for Optimizing Remedial Action Operation(RAO) presents a step-wise process for optimizing RAO projects as developed by the Navy RAO/LongTerm Monitoring (LTM) Optimization Working Group. The objective of this guidance document is toprovide information to remedial project managers (RPMs) and their contractors so they can readilyimplement to reduce operating costs while maintaining program effectiveness. As we understand moreabout remediation projects and how they can be optimized, we can also apply that knowledge to theremedial design. This guidance presents the concept of life cycle design for optimizing existing RAOprojects. This concept should also be applied to the remedial design phase.
The Guidance and the optimization process were based largely on the findings from RAO optimizationcase studies conducted by the Working Group at several Navy and Marine Corps installations. Theremediation technologies included in the case studies were pump and treat, air sparging/soil vaporextraction, bioslurping, and in-situ chemical oxidation. For two DON in-house case studies, theEngineering Field Division/Activities (EFD/A) optimized the RAO programs and provided information toprepare brief case study reports. For seven other case studies, contractors provided recommendations foroptimizing RAO programs and/or developed strategies for site closeout. Examples from the case studiesare provided throughout this document to highlight technical points and concepts. Summaries of the casestudy reports are provided in Appendix B of this document. In house Navy case studies where EFD/Asundertook actions to optimize their own RAO optimization programs are provided in Appendix C.Relevant information from other Government and private sources, such as guidance documents,engineering manuals, and performance evaluation checklists, was also used in developing this document.
This document is written in general language to apply to a variety of site conditions, but at the same timeprovides guidance for RAO optimization of specific technologies. Technology-specific optimizationstrategies for common remedial system operational problems are provided in Appendix A. The Guidanceis intended to provide RPMs with the information they need to understand the main points of RAOoptimization so that they can apply the process to their programs. The optimization steps described in thedocument generally follow the approach implemented in completing the case studies.
The Guidance focuses on a step-wise process to maximize cost-effectiveness without compromisingprogram and data quality. These steps are:
1. Review and Evaluate Remedial Action (RA) Objectives2. Evaluate Remediation Effectiveness3. Evaluate the Cost Effectiveness4. Consider Remediation Alternatives5. Develop and Prioritize Optimization Strategies6. Prepare an Optimization Report and Implement the Optimization Strategy
Optimization should be an iterative and systematic process. Ideally, RAO projects should be evaluatedand optimization recommendations should be generated annually. Optimization reports should beprepared in time to allow RPMs to include any changes in their annual budget requests. Regularevaluations and organization of monitoring data will also streamline the 5-year review process.

Interim Final
Guidance to Optimizing Remedial Action Operation iv April 2001
The Navy Guide to Optimal Groundwater Monitoring is a companion document to this guidance thatdiscusses monitoring optimization; therefore this RAO optimization guidance defers monitoring issues tothat document. Other Department of Defense (DOD) documents were also referenced for additional ideason optimizing RAO programs at military installations.

Interim Final
Guidance to Optimizing Remedial Action Operation v April 2001
TABLE OF CONTENTS
1.0 INTRODUCTION...................................................................................................................... 11.1 What is Optimization and Why is it Important?................................................................. 11.2 How Can This Manual Help? ............................................................................................. 2
2.0 WHAT IS THE REMEDIAL ACTION OPERATION OPTIMIZATION PROCESS? ............ 43.0 REVIEW AND EVALUATE REMEDIAL ACTION OBJECTIVES....................................... 6
3.1 Verifying the Conceptual Site Model................................................................................. 63.2 Verifying Remedial Action Objectives .............................................................................. 8
3.2.1 Exposure Routes and Receptors......................................................................... 83.2.2 Cleanup Goals .................................................................................................... 93.2.3 Life Cycle Design .............................................................................................. 9
4.0 EVALUATE REMEDIATION EFFECTIVENESS ................................................................ 114.1. Remedial Performance ..................................................................................................... 114.2 System Performance......................................................................................................... 164.3 System Suitability............................................................................................................. 16
5.0 EVALUATE COST EFFICIENCY.......................................................................................... 185.1 Cost and Performance Data.............................................................................................. 185.2 Cost Efficiency Plots ........................................................................................................ 18
6.0 IDENTIFY SYSTEM MODIFICATIONS AND REMEDIATION ALTERNATIVES ......... 216.1 Modifications to the Existing Remedial System .............................................................. 21
6.1.1 Enhancing Remedial Performance................................................................... 216.1.2 Reducing O&M Costs...................................................................................... 22
6.2 Identify Alternative Remedial Technologies.................................................................... 236.3 Alternative Regulatory Mechanisms ................................................................................ 23
6.3.1 Revising Cleanup Goals and Remediation Objectives..................................... 246.3.2 Land Use Controls ........................................................................................... 246.3.3 Technical Impracticability ............................................................................... 25
7.0 DEVELOP AND PRIORITIZE OPTIMIZATION STRATEGIES ......................................... 267.1 Developing Optimization Strategies ................................................................................ 267.2 Prioritizing Optimization Strategies ................................................................................. 26
8.0 PREPARE OPTIMIZATION REPORT AND IMPLEMENTOPTIMIZATION STRATEGY................................................................................................ 298.1 Report Format and Content .............................................................................................. 298.2 Reporting Frequency ........................................................................................................ 30
8.2.1 Annual Program Reviews ................................................................................ 308.2.2 CERCLA Five-Year Reviews .......................................................................... 308.2.3 RCRA Permit Modifications............................................................................ 30
8.3 Implementing the Optimization Strategy ......................................................................... 309.0 WHAT TOOLS CAN I USE TO OPTIMIZE MY REMEDIAL ACTION
OPERATION PROGRAM?..................................................................................................... 329.1 Remedial System Optimization Checklists (Corps of Engineers).................................... 329.2 Geographical Information System.................................................................................... 329.3 MNA Tools ...................................................................................................................... 329.4 Example Statement of Work for Optimizing Remedial Action Operation ...................... 33

Interim Final
Guidance to Optimizing Remedial Action Operation vi April 2001
TABLE OF CONTENTS (continued)
9.5 Acquisition Strategies for Remedial Action Operations .................................................. 369.5.1 Defining Program Cost Approaches.................................................................... 369.5.2 Cost Reimbursable versus Fixed Price ................................................................ 369.5.3 Contractor Performance Incentives ..................................................................... 38
10.0 WHERE ELSE CAN I GO FOR HELP? ................................................................................. 3910.1 Useful Web Sites .............................................................................................................. 3910.2 Useful Documents ............................................................................................................ 40
10.2.1 General Optimization ........................................................................................... 4010.2.2 Pertinent Guidance and Policy ............................................................................. 4110.2.3 Cost Information .................................................................................................. 4110.2.4 Life Cycle Design................................................................................................. 42
10.3 Remedial Technologies .................................................................................................... 42Pump and Treat ................................................................................................................ 42Air Sparging/Soil Vapor Extraction ................................................................................. 43Soil Vapor Extraction....................................................................................................... 43Bioventing ........................................................................................................................ 43Multi-Phase Extraction..................................................................................................... 44Enhancement of In-situ Bioremediation for Fuel and Chlorinated Contaminated Sites .. 45In -Situ Chemical Oxidation............................................................................................. 45In-Situ Thermal Treatment ............................................................................................... 45Reactive Barriers/Treatment Walls .................................................................................. 45Air Stripping..................................................................................................................... 46Aboveground Treatment................................................................................................... 46Monitored Natural Attenuation ........................................................................................ 46
11.0 REFERENCES......................................................................................................................... 48
APPENDIX A TECHNOLOGY SPECIFIC OPTIMIZATION RECOMMENDATIONS ........ A-1
APPENDIX B SUMMARY OF OPTIMIZATION CASE STUDIES ............................................B-1
APPENDIX C NAVY INTERNAL CASE STUDIES ..................................................................... C-1
Interim Final
Guidance to Optimizing Remedial Action Operation vii April 2001
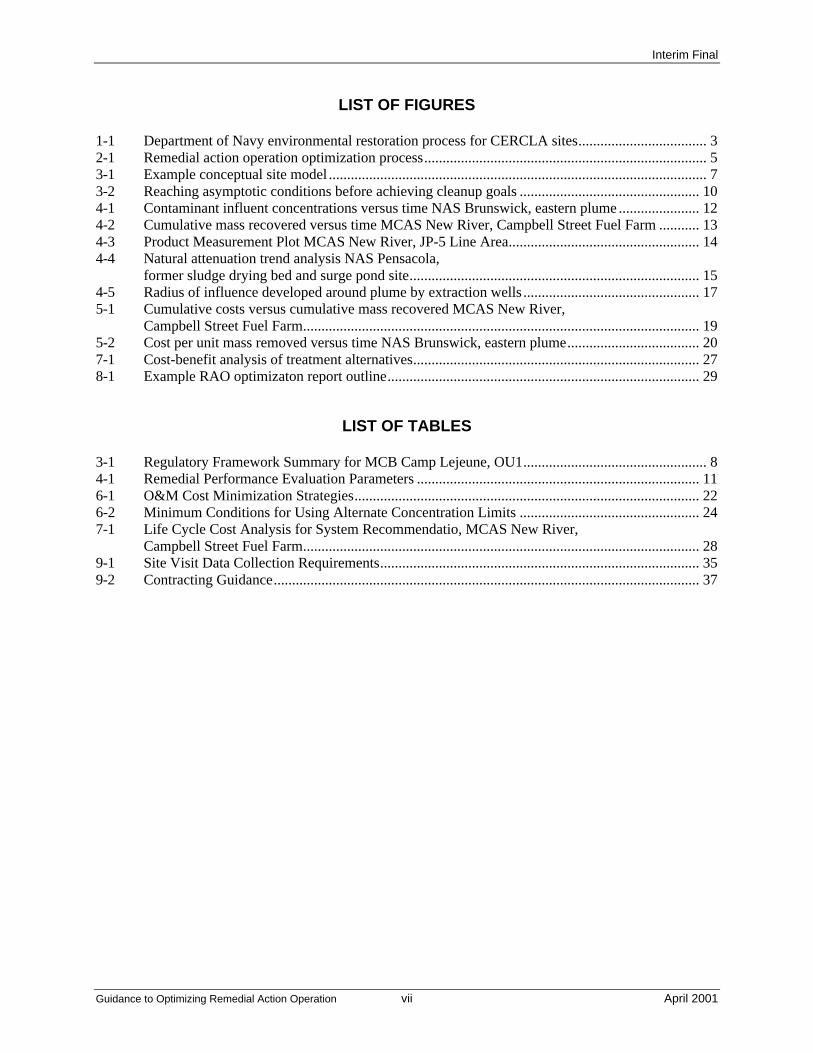
LIST OF FIGURES
1-1 Department of Navy environmental restoration process for CERCLA sites................................... 32-1 Remedial action operation optimization process............................................................................. 53-1 Example conceptual site model ....................................................................................................... 73-2 Reaching asymptotic conditions before achieving cleanup goals ................................................. 104-1 Contaminant influent concentrations versus time NAS Brunswick, eastern plume ...................... 124-2 Cumulative mass recovered versus time MCAS New River, Campbell Street Fuel Farm ........... 134-3 Product Measurement Plot MCAS New River, JP-5 Line Area.................................................... 144-4 Natural attenuation trend analysis NAS Pensacola,
former sludge drying bed and surge pond site............................................................................... 154-5 Radius of influence developed around plume by extraction wells ................................................ 175-1 Cumulative costs versus cumulative mass recovered MCAS New River,
Campbell Street Fuel Farm............................................................................................................ 195-2 Cost per unit mass removed versus time NAS Brunswick, eastern plume.................................... 207-1 Cost-benefit analysis of treatment alternatives.............................................................................. 278-1 Example RAO optimizaton report outline..................................................................................... 29
LIST OF TABLES
3-1 Regulatory Framework Summary for MCB Camp Lejeune, OU1.................................................. 84-1 Remedial Performance Evaluation Parameters ............................................................................. 116-1 O&M Cost Minimization Strategies.............................................................................................. 226-2 Minimum Conditions for Using Alternate Concentration Limits ................................................. 247-1 Life Cycle Cost Analysis for System Recommendatio, MCAS New River,
Campbell Street Fuel Farm............................................................................................................ 289-1 Site Visit Data Collection Requirements....................................................................................... 359-2 Contracting Guidance.................................................................................................................... 37

Interim Final
Guidance to Optimizing Remedial Action Operation viii April 2001
LIST OF ACRONYMS
ACL(s) Alternate Concentration Limit(s)AFCEE Air Force Center for Environmental ExcellenceAFVR Aggressive Fluid Vapor RecoveryAS Air SpargingASTM American Society for Testing and Materialsbgs below ground surfaceBRAC Base Realignment and ClosuresBTEX Benzene, toluene, ethylbenzene and xyleneCERCLA Comprehensive Environmental Response, Compensation, and Liability ActCNO Chief of Naval OperationsCOC(s) Contaminant(s) of ConcernCSM Conceptual Site ModelCSMoS Center for Subsurface Modeling SupportDCE cis-DichloroetheneDNAPL(s) Dense Non-Aqueous Phase Liquid(s)DOD Department of DefenseDON Department of the NavyDPE Dual-Phase ExtractionDRMO Defense Reutilization and Marketing OfficeEC(s) Engineering Control(s)EFD/As Engineering Field Division/ActivitiesEISB Enhanced Insitu BioremediationEPA Environmental Protection AgencyER Environmental RestorationESD Explanation of Significant DifferenceGAC Granular Activated CarbonGIS Geographical Information SystemHRC Hydrogen Release CompoundHTRW CX Hazardous, Toxic, and Radioactive Waste Center of ExpertiseIC(s) Institutional Control(s)LNAPL Light Non-Aqueous Phase LiquidLTM Long Term MonitoringLTMgt Long Term ManagementLUC(s) Land Use Control(s)MCAS Marine Corps Air StationMCB Marine Corps BaseMCL(s) Maximum Contaminant Level(s)MNA Monitored Natural AttenuationMPE Multi-Phase ExtractionNAS Naval Air StationNAVFAC Naval Facilities Engineering CommandNPL National Priorities ListNPV Net Present ValueNSB Naval Submarine BaseNEX Naval ExchangeNFESC Naval Facilities Engineering Service CenterO&M Operations and MaintenanceORC Oxygen Release Compound
Interim Final
Guidance to Optimizing Remedial Action Operation ix April 2001
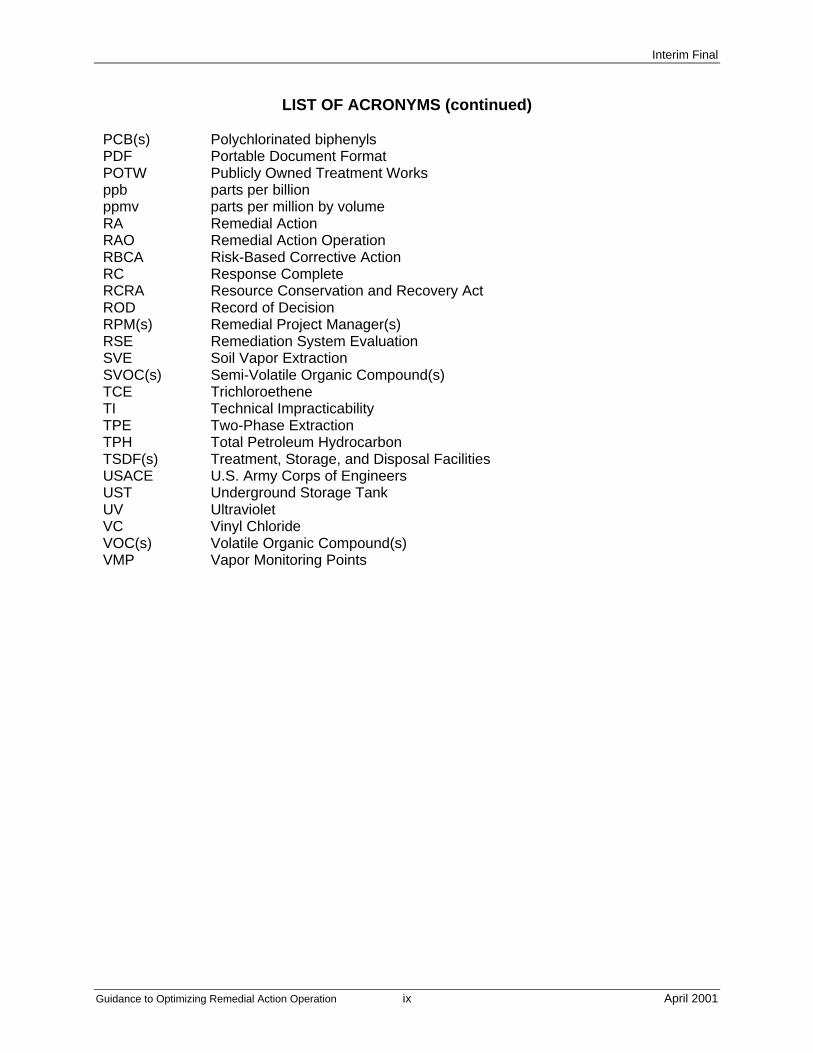
LIST OF ACRONYMS (continued)
PCB(s) Polychlorinated biphenylsPDF Portable Document FormatPOTW Publicly Owned Treatment Worksppb parts per billionppmv parts per million by volumeRA Remedial ActionRAO Remedial Action OperationRBCA Risk-Based Corrective ActionRC Response CompleteRCRA Resource Conservation and Recovery ActROD Record of DecisionRPM(s) Remedial Project Manager(s)RSE Remediation System EvaluationSVE Soil Vapor ExtractionSVOC(s) Semi-Volatile Organic Compound(s)TCE TrichloroetheneTI Technical ImpracticabilityTPE Two-Phase ExtractionTPH Total Petroleum HydrocarbonTSDF(s) Treatment, Storage, and Disposal FacilitiesUSACE U.S. Army Corps of EngineersUST Underground Storage TankUV UltravioletVC Vinyl ChlorideVOC(s) Volatile Organic Compound(s)VMP Vapor Monitoring Points

Introduction Interim Final
Guidance to Optimizing Remedial Action Operation 1 April 2001
11..00 IInnttrroodduuccttiioonn
The goal of the Department of Navy (DON) Environmental Restoration (ER) Program is to “achieveenvironmentally protective site closeout at least cost.” Figure 1-1 illustrates the phases of the ER Process.In the past, ER programs have focused primarily on site identification and investigation. As the attentionhas recently shifted toward remedy selection, remedial design, and remedial action construction, thenumber of Navy/Marine Corps sites in the remedial action operation (RAO) and long term management(LTMgt) phases is expected to increase. The growing number of Navy/Marine Corps sites advancing tothe RAO and LTMgt phases will soon represent the majority of the ER Program budget requirements.Optimization is becoming a necessary process to allow the remedial project manager (RPM) to manageRAO programs within budgetary constraints.
The DON formed a Working Group to provide guidance to the DON activities for optimizing RAO andgroundwater monitoring at Navy installations. This Working Group, led by the Naval FacilitiesEngineering Service Center (NFESC), is made up of engineers and scientists from NFESC, NavalFacilities Engineering Command (NAVFAC), Engineering Field Divisions/Activities (EFD/A), and Chiefof Naval Operations (CNO).
This document provides guidance on the optimization of RAO programs and serves as a companiondocument to the Guide to Optimal Groundwater Monitoring (NFESC 2000).
1.1 What is Optimization and Why is it Important?
Optimization is a process to streamline RAO programs by maximizing remedial effectiveness and costefficiency. Optimization is an ongoing responsibility of Navy/Marine Corps RPMs and their contractorswho operate, maintain, and monitor remediation systems. The goal of optimization is to achieve responsecomplete (RC) and ultimately site closeout in the shortest amount of time and with the least possibleexpenditure.
Life cycle design is an important element in the optimization process. The concept of life cycle designhelps the RPM focus on the main strategies necessary to optimize a remediation system. The basis of thisconcept is that the requirements for groundwater and/or soil remediation will change over time due tochanges in contaminant concentrations. This concept will allow the RPM to understand the limitations ofa remediation system and to design a remedial strategy that will address all the conditions encounteredduring remediation. Life cycle design is discussed in more detail in Section 3.2.3.
The benefits of RAO optimization include:
§ Ensuring that the remedial action (RA) remains protective of human health and the environment§ Enhancing the effectiveness of RAs toward achieving remedial objective§ Reducing operation and maintenance (O&M) costs§ Accelerating the site closeout schedule
Introduction Interim Final
Guidance to Optimizing Remedial Action Operation 2 April 2001
1.2 How Can This Manual Help?
The Guidance for Optimizing Remedial Action Operation focuses on the most significant ways to designand optimize RAO programs in order to maximize cost efficiency while maintaining remedialeffectiveness. This guidance manual contains:
§ Detailed explanations of the RAO optimization process§ References to tools that the RPMs may use in the RAO optimization process§ Technology-specific optimization strategies for common remedial system operational problems§ Summaries of RAO optimization case studies conducted at Navy/Marine Corps installations§ Examples of RAO optimization technical points and concepts based on “lessons learned” from the
case studies
Although this guidance manual is primarily intended for the optimization of existing remediation systems,these optimization principles can also complement the remedial design process to promote the design andinstallation of more effective and efficient remediation systems.

Introduction Interim Final
Guidance to Optimizing Remedial Action Operation April 20013
PreliminaryAssessment/
Site Inspection
RemedialInvestigation/
Feasibility StudyRemedyDesign
Removal and/orInterim Remedial
Action
Remedial ActionConstruction Remedy in Place Remedial Action
Operation (RAO)
ResponseComplete (RC)
Long-TermManagement
(LTMgt)**
SiteCloseout***
Optimization
******
Removal and/or Interim Remedial Actions may occur throughout process. Some sites may require indefinite LTMgt. Sites may be reevaluated, if necessary.
000111C-EK-RTP
Figure 1-1. Department of Navy environmental restoration process for CERCLA sites.

What is the Remedial Action Operation Optimization Process? Interim Final
Guidance to Optimizing Remedial Action Operation April 20014
22..00 WWhhaatt iiss tthhee RReemmeeddiiaall AAccttiioonn OOppeerraattiioonn OOppttiimmiizzaattiioonn PPrroocceessss??
The RAO optimization process is designed to evaluate the site remedial strategy, remedial system design,remedial effectiveness, and cost efficiency. Based on this evaluation, strategies are developed to improveexisting remediation systems, utilize scientific advances in remediation technologies, and/or incorporatechanges in regulatory requirements. Optimization is an ongoing process. Therefore, RAO programs maybe evaluated and optimized as often as annually, or less frequently depending on the progress of the RAOin achieving its objectives.
In general, “lessons learned” from RAO optimization case studies performed at several Navy/MarineCorps installations were used to develop the RAO optimization process. These case studies cover a widerange of remediation technologies, including pump and treat, air sparging/soil vapor extraction,bioslurping, and in-situ chemical oxidation. Examples from these case studies are provided throughoutthis guidance document to highlight technical points and concepts.
Other Department of Defense (DOD) documents were referred for additional ideas on optimizingRAO programs. Specifically, the Air Force, Air Combat Command Environmental Restoration ProgramSite Closure Guidance Manual (1997) and the Air Force Center for Environmental Excellence (AFCEE)Remedial Process Optimization Handbook (AFCEE 1999) were used as models for this guidancedocument.
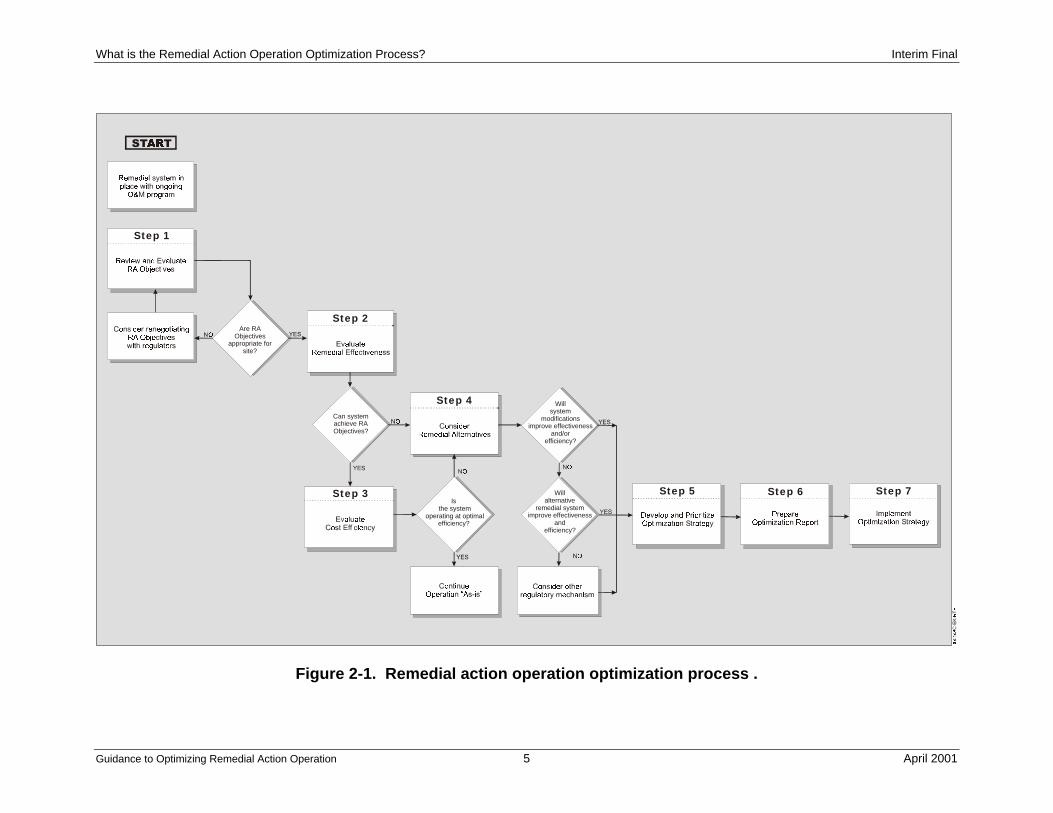
The RAO optimization process, as illustrated in Figure 2-1, consists of seven steps:
Step 1. Review and Evaluate Remedial Action Objectives – Prior to any optimization activities, theRPM should review the decision-making framework for a remedial site to ensure that the RA objectivesremain appropriate.
Step 2. Evaluate Remediation Effectiveness – Based on an assessment of remedial and systemperformance, the RPM should determine whether the existing remediation system is capable of achievingthe RA objectives within a reasonable timeframe.
Step 3. Evaluate Cost Efficiency – After verifying that the remediation system can achieve RAobjectives, the RPM should determine the cost efficiency of the system. By relating cost and performancedata, the evaluation of cost efficiency verifies efficient operations of the remediation system.
Step 4. Identify Remediation Alternatives – Based on the evaluations of remediation effectiveness andcost efficiency, the RPM should identify alternatives for optimizing the remediation system. Remediationalternatives that may be considered include modifications to the existing remediation system, selection ofalternative remediation systems, and the use of alternative regulatory mechanisms.
Step 5. Develop and Prioritize Optimization Strategies – The RPM should formulate optimizationstrategies from the potential remediation alternatives and prioritize these strategies based on a relativecost-benefit analysis of life cycle costs.
Step 6. Prepare Optimization Report – The RPM should document the findings of the remediationsystem evaluation and the preferred optimization strategy in an optimization report.
Step 7. Implement Optimization Strategy – The preferred optimization strategy should be implementedfollowing the implementation plan developed by the RPM.
What is the Remedial Action Operation Optimization Process? Interim Final
Guidance to Optimizing Remedial Action Operation 5 April 2001
Step 4
Step 5 Step 6 Step 7Step 3
Step 1
Step 2Are RA
Objectivesappropriate for
site?
Can systemachieve RAObjectives?
Is the system
operating at optimal efficiency?
Willsystem
modificationsimprove effectiveness
and/or efficiency?
Willalternative
remedial systemimprove effectiveness
and efficiency?
Figure 2-1. Remedial action operation optimization process .

Review and Evaluate Remedial Action Objectives Interim Final
Guidance to Optimizing Remedial Action Operation 6 April 2001
33..00 RReevviieeww aanndd EEvvaalluuaattee RReemmeeddiiaall AAccttiioonn OObbjjeeccttiivveess
Content: The first step of the RAO optimization process is to review and evaluate RA objectives. Thissection describes the process for reviewing the decision-making framework for the remedial site,including verifying the CSM and the RA objectives. This evaluation, which includes a review of exposureroutes and receptors, the cleanup goals and the life cycle design, allows the RPM to determine whetherRA objectives remain appropriate for the remedial site.
3.1 Verifying the Conceptual Site Model
The CSM is the basis for defining the RA objectives, determining the restoration potential of the site, andevaluating the effectiveness of the existing remediation system. The verification and revision, ifnecessary, of the CSM ensures that changes in the site and the surrounding area, such as development orother land use changes, are incorporated into the decision making framework. Particular attention shouldbe given to those assumptions that influenced the initial remedial design to ensure that the RA objectivesremain appropriate for the site.
Verifying the CSM also provides an opportunity to update the CSM by incorporating the most recentO&M and monitoring data. The operating and monitoring data provides current information concerning:
§ Hydrogeology§ Types of contaminants removed§ Lateral and vertical distribution of contamination§ Estimated volume of contamination§ Other factors that could affect decisions at the remediation site/monitoring locations, such as mission-
related needs, site development and other land use changes
In some cases, additional field investigations may also be necessary to obtain information to update theCSM.
A detailed description of CSMs can be found in Section 2.2.1 of the Navy’s Guide to OptimalGroundwater Monitoring. Additional information on CSMs can be found in the American Society forTesting and Materials (ASTM) E1689-95 Standard Guide for Developing Conceptual Site Models forContaminated Sites (ASTM, 1995). An example of a CSM diagram is presented in Figure 3-1.
Example: The review of current conditions at Marine Corps Base (MCB) Camp Lejeune OU1 South siteidentified significant changes in the spatial distribution of the contaminant plume. Recent groundwatermonitoring data were used to evaluate the size of the contaminant plume. The data revealed that thecontaminant plume had stabilized and possibly decreased in size. The current conditions wereincorporated into the CSM and used to support the recommendation to shut down the pump and treatsystem and to evaluate natural attenuation as the final remedy.

Review and Evaluate Remedial Action Objectives Interim Final
Guidance to Optimizing Remedial Action Operation 7 April 2001
Figure 3-1. Example conceptual site model.

Review and Evaluate Remedial Action Objectives Interim Final
Guidance to Optimizing Remedial Action Operation 8 April 2001
3.2 Verifying Remedial Action Objectives
The RA objectives are criteria that determine when site conditions are no longer considered a risk tohuman health or the environment, and site closeout may be pursued. The RA objectives must be asspecific as possible in order to focus the remedy decision process and should specify:
§ Contaminants of concern (COC)§ Exposure routes and receptors§ Cleanup goals (concentrations) for each exposure route
To verify RA objectives, these cleanup criteria should be reviewed and compared with the existing CSMand the life cycle design to determine whether they remain appropriate for the site. An example of RAobjectives, presented as part of the regulatory framework for the remedial site, is provided in Table 3-1.
Table 3-1. Regulatory Framework Summary for MCB Camp Lejeune, OU1
Site DescriptionContaminated
MediaContaminants of
Concern Cleanup GoalsRemedial Action
Objectives21 Transformer
Storage Lot 140Soil Pesticides and PCBs
24 Industrial FlyAsh Dump
Groundwaterand soil
Groundwater:metals andheptachlor epoxideSoils: pesticides andmetals
78 Hadnot PointIndustrial Area
Groundwaterand soil
Groundwater:VOCs (BTEX andchlorinatedsolvents) and metalsSoils: pesticides andSVOCs
Groundwater:Federal MCLs, stategroundwaterstandards, risk-basedlevelsSoil:EPA Region IIIRBCs
Three consecutiverounds in whichsamples have non-detect concentrationsor concentrationsprotective of humanhealth have beendemonstrated to thesatisfaction of theregulatory agencies.
3.2.1 Exposure Routes and Receptors
As site conditions change over time, the contaminant exposure routes and receptors specified in the RAobjectives should be reviewed to confirm that they remain appropriate for the site. The CSM representsthe current conditions at the site and serves as the basis for this review. This review of the exposureroutes and receptors should consider:
§ Modifying the list of COCs based on the past year of monitoring§ Revising the exposure routes (i.e., groundwater, soil or surface water) based on current contaminant
distribution§ Identifying any new receptors that may be affected by the contamination
It is also important that the monitoring well network reflects any changes in exposure routes andreceptors. The purpose of each monitoring well should be clearly defined as an in-plume, background,point-of-compliance, or sentinel well. Also, the timeframe required for each to these monitoring wells todemonstrate risk reduction, such as meeting cleanup goals for four consecutive quarters of monitoring,should be updated to reflect any changes in monitoring frequency and duration. Detailed descriptions ofoptimizing a monitoring network and monitoring frequency can be found in the Navy’s Guide to OptimalGroundwater Monitoring.

Review and Evaluate Remedial Action Objectives Interim Final
Guidance to Optimizing Remedial Action Operation 9 April 2001
3.2.2 Cleanup Goals
Regulatory standards are commonly used to establish cleanup goals. More recently, risk-based goals havegained greater acceptance from the regulatory community. Cleanup goals should be reviewed to confirmthat they remain appropriate for the remedial site.
Regulatory Goals – Regulatory programs, such as Resource Conservation and Recovery Act (RCRA),Comprehensive Environmental Response, Compensation, and Liability Act (CERCLA), and stateunderground storage tank (UST) programs, commonly establish maximum contaminant levels (MCL) asthe cleanup goals. These MCLs, however, are not always appropriate for a remedial site. For example, ifthe groundwater is not a potential drinking water source, cleanup to MCLs may be overly conservative.Also, MCLs do not consider the source of contamination or site conditions. Thus, cleanup goals may beestablished for compounds that are naturally occurring in the aquifer and not related to the release ofcontamination.
Example: At MCB Camp Lejeune OU1 South, the COC include petroleum contaminants (i.e., benzene,toluene, ethylbenzene, and xylene [BTEX]), chlorinated solvents, and metals in groundwater. Results ofremedial investigation indicated that concentrations of metals in groundwater were uniformly distributedacross the site. Subsequent development of a database for metals detected in groundwater indicated thatthe concentrations of metals detected at the site are similar to background concentrations. As a result ofthe evaluation, metals were removed from cleanup goals for the remedial site.
Risk-Based Goals – Under the Superfund program, the results of qualitative and quantitative riskassessments are used to establish the need for remedial action and determining remediation alternatives.Also, to simplify baseline risk assessments for Superfund sites, the EPA has developed generic soilscreening guidance that differentiates between contamination levels that present no health risk and thosethat potentially require additional investigation. The EPA can also require the assessment of humanhealth risk as well as ecological risk at a facility under the RCRA Corrective Action Program. Ifnecessary, a baseline risk assessment is completed during the RCRA Facility Investigation and furtheranalysis conducted during the CMS. The results of the assessment are used to establish cleanup goals andto prioritize cleanup of high-risk sites.
Nearly every state UST program has adopted risk-based cleanup criteria to streamline the site closureprocess for petroleum contaminated sites. Where risk-based corrective action (RBCA) programs havebeen adopted, the use of risk-based goals should be considered for a site. These risk-based goals aretypically more appropriate cleanup goals as they are based on site-specific risk to human health, safety,and the environment. RBCA programs are currently in place in a majority of states and are underdevelopment in many more.
Example: The evaluation of cleanup goals at the MCB Camp Lejeune, RR-72 site resulted in riskreclassification using risk-based standards for petroleum USTs. Under the previously applicableregulation, continued action was required to remediate the groundwater to the applicable drinking waterstandards. Recently adopted new regulations for petroleum USTs allowed sites to be re-evaluated usingrisk-based standards. Under these risk-based standards, it was recommended that the RR-72 site bereclassified as a low-risk site requiring no further action.
3.2.3 Life Cycle Design
Because the behavior of contaminants changes over the life of a remediation project, the life cycle designof the remedy should be considered when verifying the RA objectives. As the remediation system

Review and Evaluate Remedial Action Objectives Interim Final
Guidance to Optimizing Remedial Action Operation 10 April 2001
continues to operate, contaminant concentrations decrease over time until asymptotic conditions arereached (Figure 3-2). This asymptotic condition becomes a problem when:
§ Concentrations are not low enough to declare the site clean and/or to shut off the remediation system§ O&M costs are not decreasing, despite the decrease in mass removal rate
The remediation strategy must account for the entire life of the project, not just the conditions found at thebeginning of the project. When the remedial system removes and/or destroys high concentrations ofcontamination, the mass removal is limited by the remedial system’s ability to “reach” the contamination.During this period, referred to as the mass removal portion of the life cycle, the number of pore volumesextracted by remediation system determine the amount of mass removal.
As contaminant concentrations decrease, diffusion processes limit the ability of the remedial system toremove contaminant mass. Different remediation technologies may have to be applied to a site atdifferent periods of the life cycle curve. For example, a remedial site may use excavation, soil vaporextraction, pump and treat, and Monitored Natural Attenuation (MNA) as remediation technologies toaddress various periods of the life cycle curve.
The RA objectives should provide clear technical and/or cost-based criteria that can be used to determinewhen remediation technologies have reached their technical limits and alternative technologies should beimplemented. These criteria may also be used to determine when cleanup goals cannot be achieved at asite and the RA objectives must be modified or alternative regulatory mechanisms must be employed.
Example: An overall plume management strategy has been implemented at Naval Submarine Base (NSB)Kings Bay and Naval Air Station (NAS) Pensacola. For each installation, a long-term pump and treatprogram was terminated after asymptotic conditions were achieved. In-situ chemical oxidation usingFenton’s Reagent method was successfully implemented to substantially reduce source areaconcentrations and to ensure the protectiveness and timeliness of MNA as the final remedy.
Figure 3-2. Reaching asymptotic conditions before achieving cleanup goals.
Co
nce
ntr
atio
n
Time
Cleanup
Goals
Mass Removal
Diffusion Controlled

Evaluate Remediation Effectiveness Interim Final
Guidance to Optimizing Remedial Action Operation 11 April 2001
44..00 EEvvaalluuaattee RReemmeeddiiaattiioonn EEffffeeccttiivveenneessss
Content: The second step of the RAO optimization process is to evaluate the effectiveness of theremediation system. This section describes the process to evaluate the effectiveness of the existingremediation system using O&M and monitoring data. This evaluation, which considers the remedialprogress toward cleanup goals, and the operating efficiency and suitability of the system, allows the RPMto determine whether the remediation system is capable of achieving RA objectives within a reasonabletimeframe.
4.1. Remedial Performance
The effectiveness of a remediation system is measured by its remedial performance. Remedialperformance refers to the system’s progress toward meeting cleanup goals. The remedial performanceshould be evaluated to determine whether the remediation system is capable of achieving cleanup goals.
To evaluate remedial performance, performance data is compared with the cleanup criteria established inthe RA objectives. O&M and monitoring data typically found in remediation system O&M reports areused to evaluate remedial performance. Common O&M and monitoring data used for this evaluationinclude:
§ Groundwater/soil contaminant concentrations§ Groundwater level monitoring, including free product levels§ System influent contaminant concentrations§ Geochemical parameters, such as dissolved oxygen levels, alkalinity and oxidation-reduction
potential
Table 4-1 lists parameters that are common to various remediation systems and which should beevaluated to determine the progress towards achieving cleanup goals.
Table 4-1. Remedial Performance Evaluation Parameters
Remedial Performance IndicatorsEvaluation Parameter Positive Indicators Negative IndicatorsChange in ContaminantConcentrations
Continual decline in contaminantconcentrations in groundwater, soil, and/orsystem influent.
No decline in contaminant concentrationsand/or steady low contaminantconcentrations (asymptotic conditions)
Rate of Mass Removal High rates of mass removal from extractionwells, in-situ treatment, and/oraboveground treatment.
Declining rates of mass removal and/orsteady low mass removal rate (asymptoticconditions)
Development ofCapture Zones
Inward hydraulic gradients are establishedand maintained.
Inability to establish and/or maintaininward hydraulic gradients.
Changes in Plume Sizeand Shape
Shrinking or stable contaminant plume. Expanding and/or migrating contaminantplume.
Evidence of NaturalAttenuation Processes
Trends in contaminant concentrations andgeochemical parameters consistent withnatural attenuation.
No presence of contaminant degradationproducts and/or geochemical conditionsthat do not support natural attenuation.
These parameters can be evaluated by applying GIS tools to prepare plots of remedial performance datafor each monitoring point and extraction well. Maps and cross-sections illustrating groundwater potentialand contaminant distribution should also be prepared to analyze capture zones and dynamics of thecontaminant plume, respectively. From these performance plots, maps and cross-sections, trends can be

Evaluate Remediation Effectiveness Interim Final
Guidance to Optimizing Remedial Action Operation 12 April 2001
identified over time and distance to determine if the remediation system is capable of achieving cleanupgoals.
Performance plots of contaminant concentrations versus time should also be used to estimate thetimeframe to achieve cleanup goals. This timeframe should be compared to the timeframe initiallypredicted during system design and any significant differences noted. Whether the estimated timeframeto achieve cleanup goals is reasonable is dependent on a site-specific evaluation and considers multiplefactors, including the location of receptors, current and future property use, and remedial costs. GIS toolsmay be used for time-series analysis to visualize contaminant trends for performance evaluation.
Figures 4-1 through 4-4 provide examples and evaluations of remedial performance plots for time-seriesdata and spatial data.
Contaminant influent concentrations versus time – Time-series performance plots of contaminantinfluent concentrations are useful in evaluating the effectiveness of a remediation system in removingcontaminants. The plot is applicable to all systems that extract contaminants in water or vapor. A time-series plot of contaminant concentrations should be prepared for each individual extraction well, as wellas the total system influent, to evaluate the remedial effectiveness of each extraction well and the overallremedial system.
Example: A pump and treat system was installed to contain and remediate the Eastern Plume at NASBrunswick. Figure 4-1 is a time-series plot of contaminant concentration in the influent to the treatmentplant. In this example, total volatile organic compound (VOC) influent concentrations have generallyincreased since system start-up. The sharp increase in 1998 represents the addition of an extraction wellwithin a contaminant hot spot in the plume. System performance was enhanced not only by properlylocating the well within the plume, but by also isolating the well screen to the most contaminated intervalin the aquifer.
Figure 4-1. Contaminant influent concentrations versus timeNAS Brunswick, eastern plume.
0
200
400
600
800
1,000
1,200
1,400
1,600
May
-96
Dec
-96
Jun-
97
Jan-
98
Jul-9
8
Feb
-99
Aug
-99
Time
VO
C C
on
cen
trat
ion
(u
g/L
)

Evaluate Remediation Effectiveness Interim Final
Guidance to Optimizing Remedial Action Operation 13 April 2001
Cumulative mass removed versus time – A plot of cumulative mass removed versus time relates thecontaminant influent concentration with the extraction rate to illustrate the effectiveness of a remediationsystem in removing contaminant mass. For in-situ remediation processes, mass removal may bedetermined by applying geostat or other GIS tools and using the contaminant distribution obtained frommonitoring wells or soil borings. For in-situ aerobic biodegradation processes, mass removal estimatesmay also be obtained by in-situ respirometry tests. The plot of a system that is operating effectivelyexhibits an upward slope. A plot that exhibits asymptotic conditions for mass removed suggests thatperformance has reached the system limits and that a new strategy should be implemented for closeout.
Example: A pump and treat system was installed to contain and remediate a plume at the CampbellStreet Fuel Farm at Marine Corps Air Station (MCAS) New River. Figure 4-2 is a time-series plot ofcontaminant mass removed by the pump and treat system. In this example, the system has removed lessthan 3.5 pounds of contaminants during an operational period from July 1996 through March 1999. Lessthan 0.5 pounds of VOC have been removed since December 1997, which is manifested by the asymptoticcondition depicted in the graph. Asymptotic conditions are a clear indication that the system is no longerproductive and alternative remedies should be explored if site closeout cannot be justified.
Figure 4-2. Cumulative mass recovered versus timeMCAS New River, Campbell Street Fuel Farm.
0.00
0.50
1.00
1.50
2.00
2.50
3.00
3.50
4.00
Jul-9
6
Jan-
97
Aug
-97
Feb
-98
Sep
-98
Mar
-99
Oct
-99
Time
Cu
mu
lati
ve V
OC
Rec
ove
red
(lb
s)
Asymptotic performanceEffective Mass Removal

Evaluate Remediation Effectiveness Interim Final
Guidance to Optimizing Remedial Action Operation 14 April 2001
Change in free product thickness versus time – Product measurement plots are used primarily toevaluate the performance of a product recovery system. A plot of product and water level measurementsprovides a visual description of the product thickness over time. In addition to product thickness, othertrends may be identified, such as water level and seasonal effects on product thickness. A continualreduction in product thickness over time indicates that the remedial system is recovering free product.Conversely, no change or an increase in product thickness indicates that the remedial system is either notrecovering free product or there is a new or previously undiscovered source.
Example: A free product recovery system was constructed at MCAS New River, JP-5 Line Area torecover JP-5 fuel. Figure 4-5 illustrates the product measurements from a recovery well at the remedialsite. The product measurement plot shows that no recoverable free product has been measured in therecovery well since September 1998. The recovery well has been in continuous operation for over a yearwithout the presence of free product. This evaluation of free product thickness over time led to theconclusion that operation of the recovery well could be discontinued, as it is not contributing to restoringgroundwater quality.
Figure 4-3. Product measurement plotMCAS New River, JP-5 line area.
0
2
4
6
8
10
12
14
16
1/5/1998 4/15/1998 7/24/1998 11/1/1998 2/9/1999 5/20/1999 8/28/1999 12/6/1999 3/15/2000
Date
Dep
th (
ft b
elo
w t
oc)
Product
Water
ProductThickness
No Free Product Recovery

Evaluate Remediation Effectiveness Interim Final
Guidance to Optimizing Remedial Action Operation 15 April 2001
Change in geochemistry and contaminant concentrations over distance – Spatial data analysis ofgeochemical parameters and contaminant concentrations are useful for evaluating the occurrence ofnatural attenuation processes.
Example: The effectiveness of natural attenuation of chlorinated ethenes and benzenes in thegroundwater system was assessed at NAS Pensacola, Florida, Former Sludge Drying Bed and SurgePond site. Based on trend analyses of monitoring data along a flowpath (Figure 4-4), it was determinedthat redox conditions were favorable for natural attenuation of chlorinated ethenes. Also, TCE and itsbiodegradation products were completely destroyed within 250 feet downgradient of the source area. Asa result of this assessment, MNA was implemented as the final remedy for the site.
Figure 4-4. Natural attenuation trend analysisNAS Pensacola, former sludge drying bed and surge pond site.
-100
0
100
200
300
400
500
-50 0 50 100 150 200 250 300 350
Distance along flowpath (feet)
Co
nce
ntr
atio
n o
f D
O a
nd
Fe(
II) (
mg
/L)
DO vs Distance
Fe(II) vs Distance
-50
0
50
100
150
200
250
300
350
-50 0 50 100 150 200 250 300 350
Distance along flowpath (feet)
Co
nce
ntr
atio
n (
ug
/L)
cis-DCE vs Distance
VC vs Distance
1,1-DCA vs Distance

Evaluate Remediation Effectiveness Interim Final
Guidance to Optimizing Remedial Action Operation 16 April 2001
4.2 System Performance
System performance is a measure of how well a remedial system meets its design objectives. The systemperformance should be evaluated to determine if the remediation system is operating as designed.
To evaluate system performance, O&M and monitoring data are compared with the specifications fromthe original design and installation of the remedial system. Common O&M and monitoring data used toevaluate systems that utilize extraction and treatment processes for remediation include:
§ Extraction rates§ Treatment system operational parameters, such as influent flow rates, operating temperatures, and
feed valve settings§ Influent/effluent contaminant concentrations for each component of the treatment system
System performance data for in-situ treatment varies depending on the remediation technology. Injectionrates and volumes are used to evaluate the system performance for many in-situ remediation technologies,including for bioremediation (rate of nutrients/amendments injection), chemical oxidation (volume ofchemical injection), and thermal treatment (rate of steam/hot water injection).
System performance data must meet design specifications for an effective remediation system. Forexample, a soil vapor extraction system that does not meet the design specification for vapor extractionrate will not achieve the area of influence necessary to remediate the extent of contamination.
Example: At MCB Camp Lejeune, the OU1 South pump and treat system removed approximately0.03 pore volumes of groundwater in 1998. This system performance is poor when compared to typicalextraction well-field design criteria of 0.3 to 2 pore volumes per year. The inability of the extraction wellnetwork to meet the minimum design criterion is attributed primarily to the low permeability of thesurficial aquifer, which precludes pumping at higher rates. Due to the limited potential of the surficialaquifer to yield water, approximately 10 additional extraction wells would be required to remove 0.3 porevolumes of contaminated water per year. As a result of poor remedial and system performance, andevidence of a stable contaminant plume, the remediation system at OU1 South was discontinued in favorof evaluating alternative remedial technologies.
4.3 System Suitability
If the effectiveness evaluation indicates that the remediation system is operating as designed, but is notcapable of achieving cleanup goals, the system suitability should be evaluated. This evaluation of systemsuitability may explain why the remediation system is not capable of achieving RA objectives.
This evaluation compares the design and operation of the remediation system with the existing siteconditions defined by the CSM. The following conditions should be evaluated to determine the systemsuitability:
§ Adequacy of injection and/or extraction well network – The injection and/or extraction wellnetwork must have adequate radius of influence to cover or capture the extent of contamination toachieve cleanup goals. (See Figure 4-5)
§ Evidence of technical limitations – Low permeability, heterogeneous soils and the presence of densenon-aqueous phase liquids (DNAPL) are examples of technical limitations for remediation systems.

Evaluate Remediation Effectiveness Interim Final
Guidance to Optimizing Remedial Action Operation 17 April 2001
Figure 4-5. Radius of influence developed around plume by extraction wells.
§ Life cycle design limitations – Remedial progress for systems designed for mass removal will belimited by sites in the diffusion-limited phase of the life cycle design.
Example: An evaluation of the pump and treat system at the MCB Camp Lejeune OU1 South sitedetermined that the system was not suitable for achieving cleanup goals. A review of the remediationsystem and the CSM revealed that the extraction well network was not located within the contaminantplume or the source area. Also, the design of the pump and treat system was not suitable for the lowpermeability of the aquifer, which prevented adequate groundwater extraction.

Evaluate Cost Efficiency Interim Final
Guidance to Optimizing Remedial Action Operation 18 April 2001
55..00 EEvvaalluuaattee CCoosstt EEffffiicciieennccyy
Content: The third step of the RAO optimization process is to evaluate the cost efficiency of theremediation system. This section describes the process to evaluate the cost efficiency of the existingremediation system using a combination of cost and performance data. This evaluation allows the RPMto determine if the remediation system is operating efficiently.
5.1 Cost and Performance Data
After verifying the effectiveness of a remediation system, the cost efficiency of the system must beevaluated. Cost efficiency compares the costs associated with operating and maintaining a remediationsystem against its performance. The cost efficiency evaluation determines whether the existingremediation system is operating efficiently or whether opportunities to improve the cost efficiency shouldbe investigated and implemented.
Cost and performance data typically found in remediation system O&M reports are used to evaluate costefficiency. Common cost and performance data used in this evaluation include:
§ O&M costs§ Capital costs of system modifications and upgrades§ Mass of contaminant removed
All O&M costs are included for the cost efficiency evaluation. However, only capital costs associatedwith system upgrades and modifications are included in this evaluation. If incurred, these capital costsshould not be amortized. The O&M costs should be reported on a monthly basis, while capital costs ofmodifications and upgrades should be reported when incurred.
The O&M costs should be tracked by the RPM/contractors and grouped into the following categories:
§ Labor, including not only O&M labor, but also labor supervision and payroll expenses§ Materials, such as consumable supplies, bulk chemicals, and raw materials§ Utilities and fuel, such as fuel, electricity, and natural gas§ Equipment, such as equipment rental§ Performance testing and analysis, such as monitoring, sampling and analysis
Capital costs associated with system upgrades and modifications are needed to quantify increases inremedial performance. Examples of these costs include construction of additional extraction wells,modifications to the aboveground treatment system, and upgrades of pumps.
5.2 Cost Efficiency Plots
Plots of cost and performance data are tools used to assess cost efficiency. These plots should be used totrack remediation system operation costs, mass of contaminant removed/destroyed, and cost per pound ofcontaminants removed/destroyed. The cost efficiency plots should be evaluated to identify trends in costand performance data. General conclusions that can be drawn from these plots include:
§ Efficient system operation demonstrated by cost effective mass removal§ Decreasing system efficiency demonstrated by decreasing cost effectiveness over time, resulting from
increasing O&M costs or decreasing mass removal§ Poor system efficiency demonstrated by asymptotic conditions in the cost efficiency plots

Evaluate Cost Efficiency Interim Final
Guidance to Optimizing Remedial Action Operation 19 April 2001
Figures 5-1 and 5-2 show two examples of cost efficiency performance plots. Evaluations of these plotsare also provided.
Cumulative costs incurred versus cumulative mass removed – A plot of cumulative costs versuscumulative mass removed illustrates the operating efficiency of a remedial system. The slope of the plotillustrates the degree of cost-effectiveness. Near vertical segments represent periods of poor systemefficiency due to high cost and/or low mass removal.
Example: Figure 5-1 is a plot of cumulative costs versus cumulative mass recovered for the pump andtreat system at MCB Camp Lejeune, Campbell Street Fuel Farm. The plot clearly illustrates, by itsnearly vertical slope, the cost ineffectiveness of operating a remediation system that has reachedasymptotic levels of mass removal. In this example, approximately $175,000 was spent to remove3 pounds of contaminant mass. However, after asymptotic levels of mass removal were reached, only anadditional 0.5 pounds of mass was removed at a cost of $325,000.
Figure 5-1. Cumulative costs versus cumulative mass recoveredMCAS New River, Campbell Street Fuel Farm.
0
100,000
200,000
300,000
400,000
500,000
600,000
0.00 0.50 1.00 1.50 2.00 2.50 3.00 3.50 4.00
Cumulative Mass VOCs Recovered (lb)
Cu
mu
lati
ve C
ost
s ($
) High cost, lowmass removal

Evaluate Cost Efficiency Interim Final
Guidance to Optimizing Remedial Action Operation 20 April 2001
Cost per unit mass removed versus time – A plot of cost per unit mass versus time is another measureof system efficiency. The overall trend of the plot is generally downward for a system that is operatingefficiently.
Example: Figure 5-2 is a plot of the average cost per pound of contaminant removed by the pump andtreat system at Eastern Plume, NAS Brunswick, Maine. As seen in the figure, the average cost of massremoval decreased from approximately $5,000 in September 1996 to approximately $3,200 in October1997 when an upward trend began. This upward trend in cost was reversed with the installation of a newwell in June 1998 at an estimated cost of $115,000. The improvement of the performance of theremediation system increased the amount of mass recovered, which lowered the cost of mass removal.
Figure 5-2. Cost per unit mass removed versus timeNAS Brunswick, eastern plume.
$0
$1,000
$2,000
$3,000
$4,000
$5,000
$6,000
Oct
-95
May
-96
Dec
-96
Jun-
97
Jan-
98
Jul-9
8
Feb
-99
Aug
-99
Time
Ave
rag
e C
ost
of
VO
C R
eco
vere
d (
$/lb
)
June 1998Capital cost$115,000
Improved costefficiency

Identify System Modifications and Remediation Alternatives Interim Final
Guidance to Optimizing Remedial Action Operation 21 April 2001
66..00 IIddeennttiiffyy SSyysstteemm MMooddiiffiiccaattiioonnss aanndd RReemmeeddiiaattiioonn AAlltteerrnnaattiivveess
Content: The fourth step of the RAO optimization process is to identify potential modifications andalternatives to the existing remediation system to improve its effectiveness and/or cost efficiency. Thissection describes the process to identify potential modifications and select alternatives based on theevaluation of RA objectives, remediation effectiveness and cost efficiency. The remediation alternativesdiscussed in this section include modifying the existing remediation system, selecting an alternativeremediation technology, and considering alternative regulatory mechanisms.
6.1 Modifications to the Existing Remedial System
If the remedial effectiveness and cost efficiency evaluations determine that remedial progress is limitedand that the remediation system is not operating at optimal efficiency, the RPM should first considermodifying the existing remedition system. Two methods to improve the remedial effectiveness and/orcost efficiency of a remediaion system are enhancing performance and/or reducing O&M costs.Modifications, however, are only appropriate for remediation systems that are suitable for the existing siteconditions (e.g., no evidence of technical limitations or life cycle design limitations) and capable ofachieving RA objectives.
6.1.1 Enhancing Remedial Performance
Existing remediation systems may be modified to improve remedial effectiveness and cost efficiency.Where possible, improvements to system performance and system suitability should enhance the remedialperformance of the existing system. Evidence from the remedial effectiveness evaluation thatdemonstrate a need to improve remedial performance include asymptotic conditions in performance plots,expanding or migrating contaminant plumes, and rebounding of contaminant concentrations.
Opportunities should be identified to address the operational problems that limit remedial performance.In general, these opportunities to optimize RAO include:
§ Modifying system operations to meet design specifications, such as adjusting flow rates and injectionvolumes
§ Modifying and/or replacing existing components of the remedation system, such as recovery pumpsor treatment system components
§ Adding components to the existing remediation system to improve remedial performance, such asnew extraction or injection wells
Technology-specific optimization strategies for common operational problems are presented inAppendix A.
The optimization strategies should not only improve remedial effectiveness, but also cost efficiency.Optimization strategies to improve remedial performance may require additional capital expenditureand/or increase monthly O&M costs. However, any additional costs must be offset by an overall decreasein life cycle costs or a proportional increase in the amount of mass removed/destroyed, such that theaverage cost per pound of contaminant removed/destroyed decreases.

Identify System Modifications and Remediation Alternatives Interim Final
Guidance to Optimizing Remedial Action Operation 22 April 2001
Example: Recommendations were provided to modify the operation of pump and treat system to improveremedial performance at MCB Camp Lejeune OU2. On the basis of the data evaluation, the installationof additional shallow extraction wells within the plume was recommended. These additional extractionwells would supplement mass removal from “hot spots” and would improve the performance of theexisting remedial system.
6.1.2 Reducing O&M Costs
Reducing total O&M costs without compromising remedial progress or data quality should be a routinepractice for all remediation systems. Tracking overall O&M costs as well as individual cost items, suchas labor, materials, utilities and chemical analysis, provide valuable information regarding areas wherecost reductions should be pursued. The elimination of remediation system components that do notcontribute to remedial progress can also reduce O&M costs.
Optimization strategies to reduce the costs associated with O&M functions can result in improvements inthe cost efficiency of the remediation system. Minimizing the costs associated with these functions canresult in substantial savings, regardless of the remedial technology used. Table 6-1 presents strategiesRPMs can use to minimize remedial system O&M costs.
Table 6-1. O&M Cost Minimization Strategies
CostCategory Cost Minimization Strategy Remarks
Labor • Use base personnel for the O&M of the remedial system• Implement remote data acquisition/analysis• Use autodialing systems to notify operator of unplanned system
shutdowns• Minimize sampling frequencies• Use a streamlined data reporting system• Develop detailed standard operating procedures for O&M tasks• Contract O&M of similar systems in large packages to obtain
economy of scale and minimize administrative burden
• When using contractors, on-site labor rates can resultin significant cost reduction. This usually requiresissuing adequate work to a particular contractor toallow dedication of one or more full-time staff tooperate and maintain one or more remedial systems.
• Administrative burden for RPMs can be reduced byminimizing the number of contracts that must bemanaged to implement a RAO program.
Analytical • Reduce analytical methods and collection frequencies to onlythose data needed to measure system/remedial performance andjustify site closure
• Use of on-site analyses can significantly reduce analytical costs ifanalyses are performed frequently
• Frequently obtain competitive laboratory cost quotes• Coordinate sampling events to obtain bulk analysis discounts• Negotiate permit flexibility to minimize sample collection
frequencies if compliance is consistently demonstrated
• If the remedial system is subject to dischargerequirements, analytical flexibility should benegotiated.
Power/Utilities
• Use appropriately sized equipment• Use treatment equipment appropriate for system influent
concentrations and contaminant profile• Minimize system downtime to avoid multiple startup costs• Operate using system pulsing to minimize unit cost of
contaminants removed• Use utility suppliers that have the lowest rates• Consider using treated water for alternative uses at the installation
• Operating in-situ remedial systems in a “pulse”mode can reduce unit mass extraction costs.
• Alternative uses for treated water include irrigation,heating water, cooling water, and fire fighting supplywater. Significant cost savings can be realized byusing treated water for purposes where supply waterwould normally be purchased.
Repairs • Prepare standardized system designs• Purchase and stock replacement parts in bulk that are common to
numerous systems• Practice preventative maintenance in accordance with component
manufacturer recommendations• Periodically update O&M manual to address recurring problems
• Maintaining accurate documentation regardingcomponent failure may allow RPMs/contractors topursue vendor warranties, which would reduce repaircosts.

Identify System Modifications and Remediation Alternatives Interim Final
Guidance to Optimizing Remedial Action Operation 23 April 2001
In addition to cost minimization strategies, eliminating existing components of the remediation systemthat do not contribute to remedial progress can also reduce O&M costs. The evaluation of remedialperformance, system performance and system suitability should identify if any existing components canbe removed or bypassed without affecting remedial progress. Examples of this strategy include:
§ Discontinuing operation of extraction/injection wells in areas where cleanup goals have beenachieved
§ Removal of components of the aboveground treatment system where the vapor/liquid streams haveachieved discharge concentrations
Example: Recommendations were provided to modify the operation of the aboveground treatment trainat MCB Camp Lejeune OU1 South. These recommendations included bypassing the oil/water separatorand flocculation tank, replacing the polymer pump, and bypassing the granular activated carbon (GAC)units. These recommendations would not only maintain the quality of the treatment system effluent, butwould also reduce labor and analytical costs.
6.2 Identify Alternative Remedial Technologies
If the evaluation of remedial effectiveness and cost efficiency indicates that the system cannot bemodified to achieve RA objectives, the RPM should then identify alternative remedial technologies. Thealternative remedial technologies must be capable of attaining RA objectives in a shorter timeframeand/or at lower costs. Also, the alternative remedial technologies must address those conditions, such asevidence of technical limitations and life cycle design limitations, which limited the remedial progress ofthe existing remediation system.
Considerations for life cycle design may require the sequencing of several remediation technologies toachieve cleanup goals. For example, a soil vapor extraction system that has achieved asymptoticconditions may be followed by a bioventing system. Finally, a passive system may also be selected as apolishing remedy to achieve cleanup goals. Alternative remedial technologies can also be used tocomplement existing remediation systems. For example, in-situ chemical oxidation may be used for “hotspot” removal, while an existing pump and treat system operates to maintain containment of thedowngradient contaminant plume.
Potential remediation technologies that may be used as an alternative remedial strategy are discussed inAppendix A. The RPM should conduct a detailed screening and selection process to identify anappropriate alternative remedial strategy. The Remediation Technologies Screening Matrix andReference Guide developed by the Federal Remediation Technologies Roundtable provides informationon technology screening.
6.3 Alternative Regulatory Mechanisms
If an alternative remedial strategy cannot improve the remedial effectiveness and cost efficiency, theRPM should consider using alternative regulatory mechanisms to manage the site. These alternativeregulatory mechanisms are used for sites where the specified cleanup goals cannot be achieved. Suchmechanisms include:
§ Revising cleanup goals and remediaton objectives§ Land use controls (LUC)§ Technical Impracticability (TI) waivers

Identify System Modifications and Remediation Alternatives Interim Final
Guidance to Optimizing Remedial Action Operation 24 April 2001
Most of these alternatives do not require remediation to cleanup goals, but provide measures for ensuringthe protectiveness of human health and the environment. Although these alternatives are a viable optionas part of a remedy, it is important to consider the long-term, life cycle costs of these alternatives. Theimplementation of these alternatives results in continuing liability of an indefinite duration for DON.Therefore, the long term costs of maintaining these alternatives must be weighed against the time andcosts of continued remediation.
6.3.1 Revising Cleanup Goals and Remediation Objectives
The decision making framework for a remedial site may be modified to revise cleanup goals andremediation objectives. Whether revising cleanup goals or RA objectives, the remediation strategy mustdemonstrate the protection of human health and the environment. The remediation strategy must alsosatisfy the statutory and regulatory requirements of the appropriate regulatory program.
Alternate concentration limits (ACL) may be proposed in situations where it is not economically ortechnically feasible to achieve existing cleanup goals provided the ACLs are shown to be protective ofhuman health and environment. ACLs provide alternative cleanup goals that may be established based onsite characterization, risk assessment, and the regulation framework. Table 6-2 specifies the minimumconditions under which ACLs may be considered for use. For remedial sites where achieving cleanupgoals is not possible, and the use of ACLs are not appropriate, the RA objectives may be revised fromrestoration to containment.
Table 6-2. Minimum Conditions for Using Alternate Concentration Limits
RegulatoryFramework RCRAa CERCLAb
Groundwater contamination plumes shouldnot increase in size or concentration aboveallowable health or environmentalexposure levels
Points of entry of contaminatedgroundwater into surface water are knownand projected
Increased facility property holdings shouldnot be used to allow a greater ACL
There will be no statistically significantincrease of hazardous constituents fromcontaminated groundwater into surfacewaterMMiinniimmuumm
CCoonnddiittiioonnssACLs should not be established so as tocontaminate off-site groundwater aboveallowable health or environmentalexposure levels
Remedial action includes enforceablemeasures that will preclude humanexposure to contaminated groundwater atany point between the facility boundaryand all known and projected points ofentry of contaminated groundwater intosurface water
a Specific factors for groundwater contamination and surface water pathways are listed in 40 CFR 264.94(b).b CERCLA Section 121 (d)(2)(B)(ii)
6.3.2 Land Use Controls
LUCs refer to the use of engineering controls (EC) and institutional controls (IC) together. ECs areengineered remedies that contain and/or reduce contamination and limit access to property. Examples ofECs include fences, signs, landfill caps, and reactive walls. In contrast, ICs are a variety of legal devicesimposed to ensure that the ECs stay in place or, where there are no ECs, to ensure the restrictions on land
Identify System Modifications and Remediation Alternatives Interim Final
Guidance to Optimizing Remedial Action Operation 25 April 2001
use stay in place. Examples of ICs include deed restrictions, easements, notices/warnings, covenants,zoning, well drilling prohibitions, or well use advisories. The DON Environmental Policy Memorandum99-02; Land Use Controls (Interim Final – 25 May 1999) documents the requirements for the use ofLUCs at Navy installations.
LUCs should be considered when:
§ Cleanup costs are prohibitive§ Risks associated with cleanup are greater than the contamination itself§ Remedial technology is limited in its effectiveness
LUCs act as an integral part of the remedial alternative, and are used to ensure protection of human healthand the environment, to protect ongoing remedial activities and to ensure viability of the remedy. LUCsare more often applied to closing installations, but can be used at active installations. Whereas DON hasthe authority to impose restrictions on transferred property, DON does not have the authority to imposeeasements or covenants on property at active installations. ICs such as base master planning proceduresand agreements with regulators are acceptable means of ensuring the viability of LUCs at activeinstallations.
6.3.3 Technical Impracticability
The RPM may apply for a TI waiver for a remedial site that cannot achieve the cleanup goals. The TIwaiver requires implementing an alternative remedial strategy that is technically practicable, protective ofhuman health and the environment, and satisfies the statutory and regulatory requirements of theappropriate regulatory program.
Site-specific characterization and remedial performance data will be used in the TI evaluation. The TIevaluation should include the following components:
§ Specific cleanup standards for which TI determinations are sought§ Spatial area over which the TI decision will apply§ Conceptual site model that describes site geology, hydrology, contamination sources, transport, and
fate§ Evaluation of restoration potential of the site, including data and analysis that identify the factors
limiting restoration§ Modeling to estimate the timeframe to achieve cleanup criteria§ Estimates of the cost of existing remedy solutions
Guidance on TI waivers is published in the Guidance for Evaluating the Technical Impracticability ofGround-Water Restoration (EPA, 1993).

Develop and Prioritize Optimization Strategies Interim Final
Guidance to Optimizing Remedial Action Operation 26 April 2001
77..00 DDeevveelloopp aanndd PPrriioorriittiizzee OOppttiimmiizzaattiioonn SSttrraatteeggiieess
Content: The fifth step of the RAO optimization process is to develop and prioritize optimizationstrategies. This section describes the process to develop optimization strategies based on applicableremediation alternatives and to prioritize the strategies based on cost benefit analyses. This step allowsthe RPM to develop and select the appropriate optimization strategy to implement at a remedial site.
7.1 Developing Optimization Strategies
The optimization strategy is developed to address the findings from the RAO program evaluation,including any limitations that may prevent the existing remedial system from achieving cleanup goals.Optimization strategies must demonstrate benefits to the RAO program, including:
§ Improving remedial performance and operational costs for the existing remedial system§ Improving or at least maintaining progress towards achieving cleanup goals§ Improving or maintaining protectiveness of human health and the environment
The optimization strategy may consist of one or more remediation alternatives implementedsimultaneously or in succession. For example, the use of an alternative remedy for the control ofcontaminant migration coupled with LUCs is a simultaneous implementation of remediation alternatives.For remediation alternatives implemented in succession, it is important to clearly define the criteria totransition from one alternative to the next.
Example: Source areas of chlorinated solvents in groundwater have been effectively remediated usingin-situ chemical oxidation at the NSB Kings Bay Landfill site and the NAS Pensacola Sludge DryingBed/Surge Pond site. The efficiency of natural attenuation was assessed at each site with quarterlysampling for approximately 2 years. Results indicated that effective source reduction would ensurenatural attenuation processes would be protective of downgradient receptors. In-situ chemical oxidationusing the Fenton’s Reagent method was selected as the technology for source reduction. Theoptimization strategy combined in-situ chemical oxidation for source control and MNA as the finalremedy, and has been successful in demonstrating remedial progress toward the cleanup goals.
7.2 Prioritizing Optimization Strategies
Since more than one optimization strategy may be available for a remedial site, the various optimizationstrategies should be prioritized to determine the most appropriate strategy to implement. Prioritization ofoptimization strategies is based on a relative cost-benefit analysis over the life cycle of a remediationalternative. This cost-benefit analysis will allow the most effective and efficient optimization strategy tobe implemented at the remedial site.
Cost-benefit analysis compares the current costs of system operations with the costs of the proposedalternatives after optimization. This cost-benefit analysis should compare the O&M costs of the existingsystem with both capital costs and O&M costs of the remediation alternative. The cost comparisonshould also consider life cycle costs based on the expected timeframe of the remediation strategy.
Net present value (NPV) calculations are used to determine the investment value of remedial costs. TheNPV allows a more direct comparison of optimization strategies with different capital and O&M costsand over different timeframes of operation. The equation for calculating the NPV of O&M costs isprovided below:

Develop and Prioritize Optimization Strategies Interim Final
Guidance to Optimizing Remedial Action Operation 27 April 2001
NPV = RFRP,i,n
Where: R = Annual O&M costsFRP,i,n = capital recovery factor, given i% interest rate and n year plant lifeFRP = ((1+ i)n-1)/(i*(1+ i)n)
From Jelen's Cost and Optimization Engineering, Third Edition
Capital costs of remediation alternatives should be added to the NPV of its O&M costs to calculateoverall NPV costs. An example cost-benefit analysis of life cycle costs is presented in Table 7-1.
Since budgets are based on expenditures not investment, a cost-benefit analysis based on actual cost overtime may be more appropriate for budgeting remedial costs. Rather than calculating the investment valueof remedial costs, this approach evaluates costs as they are incurred over the life of the remediationstrategy. The approach also allows the RPM to recognize high capital and/or annual costs that may bedifficult to budget. The cost benefit analysis can then be used to determine the payback ratio or projectedsavings associated with each optimization strategy.
Example: Two alternatives for the treatment of extracted groundwater are carbon units and airstripping. Both alternatives meet the flow rate and treatment requirements. The costs for the carbonunits are $4,200 for capital and $17.30/day for O&M; the costs of the air stripping are $18,500 forcapital and $9.90/day for O&M. The period of equal costs for these alternatives is 4.8 years. The lifecycle costs for the carbon units are lower than those of the air stripping for a duration of less than 4.8years; however, for a duration greater than 4.8 years, the life cycle costs are lower for air stripping. Thecost-benefit analysis for these treatment alternatives is illustrated in Figure 7-1.
Figure 7-1. Cost-benefit analysis of treatment alternatives.
$-
$10,000
$20,000
$30,000
$40,000
$50,000
$60,000
$70,000
$80,000
0 2 4 6 8 10 12 14
Time (years)
To
tal C
ost
s ($
) Air Stripping withVapor Phase Carbon
Small QuantityCarbon Units
4.8 Years
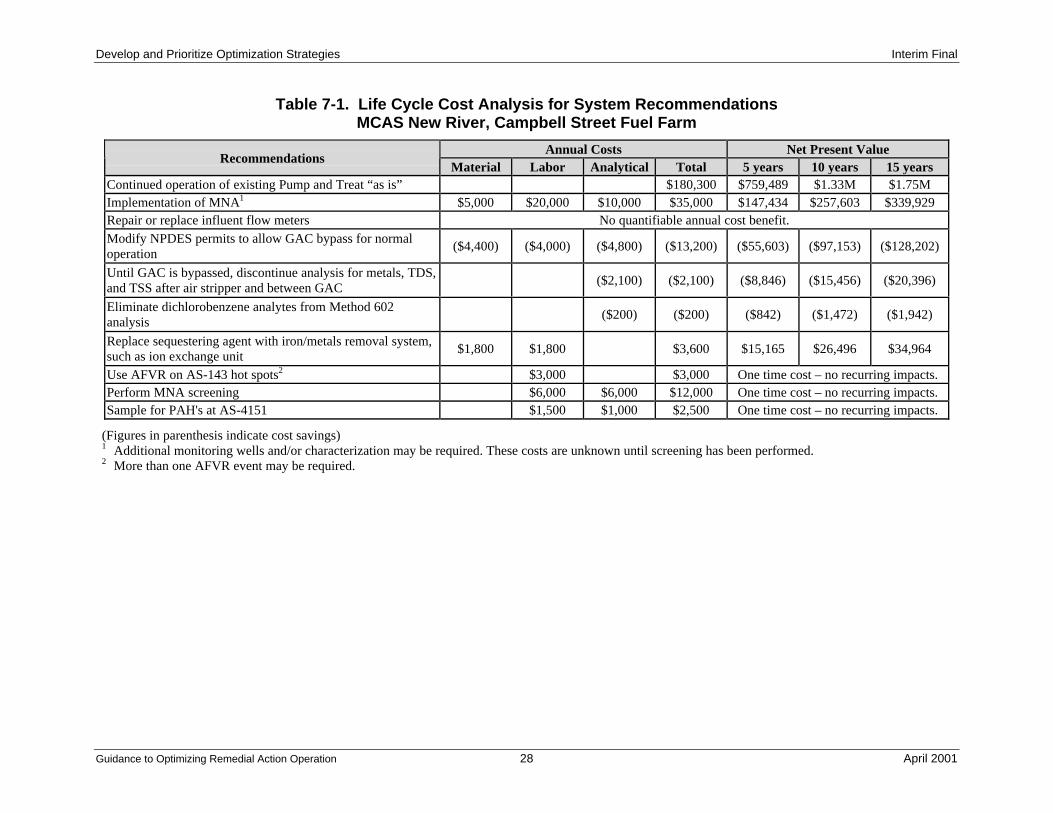
Develop and Prioritize Optimization Strategies Interim Final
Guidance to Optimizing Remedial Action Operation 28 April 2001
Table 7-1. Life Cycle Cost Analysis for System RecommendationsMCAS New River, Campbell Street Fuel Farm
Annual Costs Net Present ValueRecommendations
Material Labor Analytical Total 5 years 10 years 15 yearsContinued operation of existing Pump and Treat “as is” $180,300 $759,489 $1.33M $1.75MImplementation of MNA1 $5,000 $20,000 $10,000 $35,000 $147,434 $257,603 $339,929Repair or replace influent flow meters No quantifiable annual cost benefit.Modify NPDES permits to allow GAC bypass for normaloperation
($4,400) ($4,000) ($4,800) ($13,200) ($55,603) ($97,153) ($128,202)
Until GAC is bypassed, discontinue analysis for metals, TDS,and TSS after air stripper and between GAC
($2,100) ($2,100) ($8,846) ($15,456) ($20,396)
Eliminate dichlorobenzene analytes from Method 602analysis
($200) ($200) ($842) ($1,472) ($1,942)
Replace sequestering agent with iron/metals removal system,such as ion exchange unit
$1,800 $1,800 $3,600 $15,165 $26,496 $34,964
Use AFVR on AS-143 hot spots2 $3,000 $3,000 One time cost – no recurring impacts.Perform MNA screening $6,000 $6,000 $12,000 One time cost – no recurring impacts.Sample for PAH's at AS-4151 $1,500 $1,000 $2,500 One time cost – no recurring impacts.
(Figures in parenthesis indicate cost savings)1 Additional monitoring wells and/or characterization may be required. These costs are unknown until screening has been performed.2 More than one AFVR event may be required.

Prepare Optimization Report and Implement Optimization Strategy Interim Final
Guidance to Optimizing Remedial Action Operation 29 April 2001
88..00 PPrreeppaarree OOppttiimmiizzaattiioonn RReeppoorrtt aanndd IImmpplleemmeenntt OOppttiimmiizzaattiioonnSSttrraatteeggyy
Content: The final steps in the RAO optimization process are to prepare the optimization report andimplement the optimization strategy. The optimization report details the evaluation of the RAO program,presents conclusions on the remedial effectiveness and cost efficiency of the remedial system and providesrecommendations to optimize the program. The conclusions and recommendations from the optimizationreport should be incorporated into regulatory reviews prior to implementing the optimization strategy.
8.1 Report Format and Content
The evaluation of the RAO program should be properly documented in an optimization report. The RAOoptimization report contains site-specific information concerning the remedial site, remedial system,remedial performance and cost, and recommendations to improve the RAO program. The content of theoptimization report should follow the steps of the RAO optimization process. A sample outline for aRAO optimization report is shown in Figure 8-1.
Figure 8-1. Example RAO optimizaton report outline.
RRAAOO OOppttiimmiizzaattiioonn RReeppoorrtt
1. Background1.1. Purpose and Scope1.2. Site Description and History1.3. Remedial System and Monitoring Activity Status
2. Remedial Action Objectives Review2.1. Current Conceptual Site Model2.2. Regulatory Framework Evaluation
3. Remediation Effectiveness Evaluation3.1. Remedial Performance Baseline3.2. System Performance3.3. System Suitability
4. Cost Efficiency Evaluation5. Remediation Modifications and Alternatives
5.1. Modifications to the Existing System5.2. Alternative Remediation Systems5.3. Alternative Regulatory Mechanisms
6. Optimization Recommendations6.1. Optimization Strategy6.2. Cost-benefit Analysis
7. Implementation Plan7.1. Annual regulatory review7.2. Regulatory documentation7.3. Schedule for Implementation
Prepare Optimization Report and Implement Optimization Strategy Interim Final
Guidance to Optimizing Remedial Action Operation 30 April 2001
8.2 Reporting Frequency
The Working Group recommends that RPMs perform annual reviews of RAO programs. Theoptimization reports produced from these annual reviews should be incorporated into regulatory reviews.The opportunities to present the recommendations to optimize the RAO program include annual programreviews, CERCLA Five-Year reviews, and RCRA permit modifications.
8.2.1 Annual Program Reviews
Regular program reviews of remedial sites should be conducted with regulatory agencies annually. Theprogram reviews meet regulatory requirements to present cost and performance data. These reviews alsoprovide an opportunity to discuss remedial progress with the regulators. The RAO evaluation should alsobe incorporated into the program reviews, to identify opportunities to optimize the remedial system. Theroutine involvement of the regulators in site evaluation will result in consensus conclusions andrecommendations for changes and improvements in the RAO program.
8.2.2 CERCLA Five-Year Reviews
Remedial sites subject to CERCLA requirements must be evaluated every 5 years. This process,generally known as the Five-Year Review, requires evaluating RA objectives as detailed in the Record ofDecision (ROD), evaluating whether the response action remains protective, and proposing changes toimprove remedial progress. The Navy RPMs are responsible for completing the Five-Year Reviewreports for their sites. The EPA is preparing a new guidance on five-year reviews. This final guidance isexpected in April 2001. The draft EPA guidance on the five-year reviews is provided in Five-YearReviews - Version 3 (EPA, 1999). For National Priorities List (NPL) sites, EPA’s role is to review thereport and issue a finding of concurrence or non-concurrence. For non-NPL sites, EPA does not have anyexplicit role to review the Five-Year Review report. There are two types of reviews: Statutory andPolicy. Statutory reviews are for sites where contaminants will be left on site after completion of theremedial action(s). Policy reviews are for sites where the remedial action(s) will remove contaminants torequired levels, resulting in unlimited use and unrestricted exposure. As of March 2001, the DON isevaluating whether the policy reviews should be conducted at DON sites. For Statutory reviews, thetrigger date for start of the 5-year review period is the beginning of RA construction, which is equivalentto the onsite mobilization date; whereas, for Policy reviews, the trigger date is the constructioncompletion date. The RAO optimization evaluation should provide data and conclusions to directlysupport these Five-Year Reviews.
8.2.3 RCRA Permit Modifications
Remedial sites subject to RCRA requirements must operate within the framework of the RCRA permit.The implementation of optimization recommendations may require a modification of the RCRA permit.The requirements to modify the permit are dependent on the extent of change. Minor changes to systemoperation may only require a letter to the regulatory agency (Class I modification). More significantchanges to system operation may require additional background and supporting documentation(Class II modification), or a complete permit reapplication (Class III modification). The three classes ofRCRA permit modifications are described in further detail in 40 CFR 270.42.
8.3 Implementing the Optimization Strategy
The RPM should prepare a plan to implement the optimization strategy. The implementation of theoptimization strategy may require additional regulatory documentation. For CERCLA sites, anexplanation of significant difference (ESD) or ROD amendment may be required. An ESD documents a

Prepare Optimization Report and Implement Optimization Strategy Interim Final
Guidance to Optimizing Remedial Action Operation 31 April 2001
significant modification in cleanup goals or approach to those detailed in the original ROD, without achange in the overall remedy. A ROD amendment documents a complete change in cleanup goals and/orapproach to those detailed in the original ROD, including a change in the selected remedy. RCRA sitesmay require a permit amendment or modification, as discussed in Section 8.2.3.
The optimization strategy must gain acceptance from the regulatory agency prior to implementation. Theoptimization strategy may also require public review, and thus, would need to gain community acceptanceas well. Finally, the RPM must ensure that the optimization strategies are implemented once acceptanceis received from all stakeholders.

What Tools Can I Use to Optimize My Remedial Action Operation Program? Interim Final
Guidance to Optimizing Remedial Action Operation 32 April 2001
99..00 WWhhaatt TToooollss CCaann II UUssee ttoo OOppttiimmiizzee MMyy RReemmeeddiiaall AAccttiioonn OOppeerraattiioonnPPrrooggrraamm??
Content: RAO optimization involves a broad range of activities. This section describes a number of toolsthat can be used to assist the RPM in evaluating RAO and developing optimization recommendations.
9.1 Remedial System Optimization Checklists (Corps of Engineers)
The U.S. Army Corps of Engineers (USACE) Hazardous, Toxic, and Radioactive Waste Center ofExpertise (HTRW CX) has prepared a series of 22 remediation system evaluation (RSE) checklists. Thechecklists are designed to evaluate the effectiveness of long-term remediation systems and include ageneral checklist that is applicable to every site, an environmental monitoring checklist, and individualchecklists for various remediation technologies. The checklists are available in portable document format(PDF) at the following website address:
www.environmental.usace.army.mil/library/guide/rsechk/rsechk.html
9.2 Geographical Information System
Geographical Information System (GIS) software is a useful tool for organizing and managing manytypes of data associated with RAO at a site. It facilitates data evaluation and interpretation through itsvisualization, analysis, and querying capabilities. It also allows the user to illustrate the data in real timepresentation. An overview of GIS can be found in Section 9.3 of the Navy Guide to OptimalGroundwater Monitoring.
9.3 MNA Tools
A number of tools are available to assist in evaluating the potential of a site to support natural attenuation.
DON Technical Guidelines for Evaluating Monitored Natural Attenuation at Naval and Marine CorpsFacilities (DON March 1998). This document provides an overview of natural attenuation, how theefficiency of natural attenuation can be assessed for petroleum hydrocarbons and chlorinated solvents,identifies the hydrogeologic and geochemical data needed to make these assessments, and summarizes themonitoring requirements needed to verify the effectiveness of natural attenuation.
EPA Technical Protocol for Evaluating Natural Attenuation of Chlorinated Solvents in Groundwater(EPA, September 1998).
EPA OSWER Directive 9200.4-17: Use of Monitored Natural Attenuation at Superfund, RCRA CorrectiveAction, and Underground Storage Tank Sites (Interim Final December 1997).
EPA’s Center for Subsurface Modeling Support (CSMoS). Two models available from CSMoS forevaluating MNA are BIOCHLOR and BIOSCREEN. BIOCHLOR is a screening model that simulates thenatural attenuation of chlorinated compounds. It includes a scoring system to help determine the potentialfor reductive dechlorination from site-specific data. BIOSCREEN is a similar screening model forevaluating the natural attenuation of dissolved petroleum constituents. The CSMoS can be accessedthrough EPA's web page at www.epa.gov.
AFCEE Technical Protocol for Implementing Intrinsic Remediation (Natural Attenuation) with Long-Term Monitoring Option for Dissolved-Phase Fuel Contamination in Groundwater (AFCEE, 1995).

What Tools Can I Use to Optimize My Remedial Action Operation Program? Interim Final
Guidance to Optimizing Remedial Action Operation 33 April 2001
9.4 Example Statement of Work for Optimizing Remedial Action Operation
The RPM may desire an independent third party to assess a RAO and to provide optimizationrecommendations. The following is an example Statement of Work that may be used to retain anindependent contractor. The Statement of Work specifies general requirements and four specific tasksthat should be included in any optimization evaluation.
General Requirements:
The contractor will employ a multi-disciplinary team and approach to assess and evaluate the adequacy ofthe remedial action operation strategy and progress at (***insert appropriate installation, OUs and/orsites***). This evaluation will be done in accordance with the DON Guidance for Optimizing RemedialAction Operation (RAO), and other applicable site-specific guidance documents and regulations. Theprimary purposes of the optimization assessment are to: 1) evaluate whether the current remedial actionoperation is making progress toward attaining site remedial action objectives; and 2) provide programoptimization recommendations to increase the effectiveness of remedial action operation while reducingthe overall cost. Both of these purposes must be accomplished without loss of data and informationquality.
In accomplishing this evaluation, it is anticipated that the contractor will require the following experienceand expertise (edit list as appropriate). Individual project tasks are detailed in subsequent paragraphs.
§ Project Manager with demonstrated optimization experience§ Mid-level to senior-level geologist or hydrogeologist with specific experience in the geologic
formations at (***insert installation/region***)§ Project chemist§ Statistician with specific experience evaluating monitoring data§ Toxicologist or risk assessment specialist§ CADD/GIS specialist§ Groundwater modeler§ Mid-level to senior-level engineer(s) with passive (e.g., MNA) and active (e.g., pump and treat)
groundwater remediation experience§ Regulatory analysis specialist with experience specific to (***insert State and EPA Region***) and
(***insert governing program [e.g., RCRA or CERCLA]***)§ Life cycle cost engineer/specialist to evaluate cost savings, avoidance, and payback periods for
appropriate recommendations and alternatives
Task 1: Project Work Plan
Contractor will provide a work plan in draft and final versions. At a minimum, the work plan willinclude:
§ Project description and objectives§ Project organization including roles, responsibilities, and contact information for team members§ Description and procedures for primary technical tasks§ List of project deliverables§ Schedule of primary project milestones

What Tools Can I Use to Optimize My Remedial Action Operation Program? Interim Final
Guidance to Optimizing Remedial Action Operation 34 April 2001
Task 2: Site Visit and Data Gathering
The contractor will perform a site visit to collect the necessary data (***specified in Table 9-1***) andinterview appropriate personnel to perform a comprehensive evaluation and assessment of the remedialaction operation program at (***insert installation***). In order to assist installation personnel inpreparing for the site visit, a letter request for site-specific data, along with a data needs checklist, will besubmitted 3 to 4 weeks prior to the visit.
In addition, a pre-visit conference call will be conducted to review project goals and objectives, andcoordinate on-site logistics and data gathering needs. The call will include the contractor project team,the responsible RPM from the supporting Engineering Field Divisions/Activities (EFD/A), andrepresentatives from (***insert installation***). During the site visit, a formal project in-brief and out-brief will be required.
Task 3: Remedial Action Operation Optimization Report
The contractor will produce a report detailing the overall approach, findings, conclusions, andoptimization recommendations for (***insert installation***). The report will be delivered in workingdraft, draft, and final versions, and at a minimum will include an assessment of the elements listed below.In addition, all recommendations will have a suggested priority for implementation; and as appropriate,lifecycle cost savings and/or avoidance will be calculated and presented.
§ Overview and goals of the Remedial Action Operation, including regulatory framework, remedialaction objectives, and site closeout strategy
§ Adequacy of the CSM§ System description including extraction/injection wells or trenches and aboveground treatment train§ Design basis including specifications and design parameters, system upgrades and modifications, and
total capital costs§ Baseline of system performance and cost including extraction/injection well network, monitoring well
network, and aboveground treatment train§ Best technical and management practices already in place at the installation§ Frequency and approach for data evaluation, trend analysis, presentation, and reporting
Task 4: Presentation of Optimization Report Conclusions and Recommendations
The contractor shall prepare for and attend a meeting to present the conclusions and recommendationscontained within the report to applicable installation and regulatory agency personnel. A draft version ofthe presentation will be reviewed and approved by Navy personnel prior to the formal presentation to theregulatory agencies.

What Tools Can I Use to Optimize My Remedial Action Operation Program? Interim Final
Guidance to Optimizing Remedial Action Operation 35 April 2001
Table 9-1. Site Visit Data Collection Requirements
Data RequirementCategories Specific Data Requirement
Understand Site Backgroundand Conceptual Model
• Types of contaminants being removed and plume maps illustrating thelateral and vertical distribution of contamination
• Estimated volume of contaminated medium or mass of contaminants inthe medium
• Any factors that could affect decisions at the remediation site/monitoringlocations (e.g., mission-related needs, land use changes, site development,or attitudes and concerns of the public)
Verify Remedial ActionObjectives and CleanupCriteria
• Risk Assessment of site/OU• The indicator(s) to be used to determine when monitoring can be stopped• State regulations or guidance used to set the sampling or measurement
frequencies, analytes, or total time of monitoring• Ecological considerations and factors
Extraction and TreatmentSystem Design Specifications
• As-built (if completed) drawings and descriptions of equipment and/orwells
• As-built descriptions of sampling or measuring points, (depth, length,devices used)
• Corrective measures study, feasibility study, and/or pilot test reportsrelated to the existing remedial systems
• Design analysis report• Groundwater modeling reports• Extraction well pumping test reports• Current or planned operations and maintenance manuals• Current or planned inspection/maintenance schedule
Baseline System Costs(Capital and O&M)
• Capital costs• Current sampling costs: labor cost per location and cost of measurement
or analysis• Annual power consumption and costs• Annual operating costs (labor, parts, chemicals, etc.) and/or budget; and• Handling, repackaging, transportation, or disposal costs

What Tools Can I Use to Optimize My Remedial Action Operation Program? Interim Final
Guidance to Optimizing Remedial Action Operation 36 April 2001
9.5 Acquisition Strategies for Remedial Action O&M
The approach to the management of program costs is defined by the contracting mechanism, approachand strategy. Contracting options are available which can be used to align O&M contractor’s financialincentives with the goals of the remediation program.
9.5.1 Defining Program Cost Approaches
The appropriate use of contract mechanisms and performance measures is a necessary element to ensureoptimal site closure. Contractor performance should be evaluated based on demonstrated cost-effectiveprogress toward site closure. The use of appropriate contract mechanisms provides incentives tocontractors while simultaneously protecting the interests of the Government.
For example, it is common for a contractor’s performance evaluation to be based, in part, on the up-timefor a remedial system. While percentage up-time can be an important performance measure, it is notalways correlated with optimal progress toward site closure. This example becomes further confoundedwhen the O&M contract vehicle is of the cost reimbursable type, where the majority of the performancerisk lies with the Government. Table 9-2 provides guidance in forming and implementing an appropriatecontract strategy.
9.5.2 Cost Reimbursable versus Fixed Price
Contract types fall into two major categories, fixed-price and cost-reimbursable, and are most notablydistinguished from one another on the basis of the amount of risk associated with the costs ofperformance assumed by or allocated to the parties. Contractors assume the greatest amount of risk underfixed-price contracts because they are responsible for the costs of performance. Under cost-reimbursement contracts, the Government assumes the risk for the cost of performance. Cost-reimbursable contracts may be appropriate during initial startup of remedial actions. After the initialstartup, fixed-price contracts are preferable during remedial actions.
The use of fixed-price, performance-based contract mechanisms is recommended where appropriate.Fixed price contracts are a preferred mechanism when the project scope is well define and unlikely to bemodified. This contract strategy provides an incentive to the contractor to conduct operations effectivelyand efficiently and manage costs. The disadvantages of this contract strategy includes:
§ The need to establish targets up front§ Potentially higher costs to offset the higher risk to the contractor§ Loss of cost savings if the actual costs are less than the fixed-price amount
If fixed-price mechanisms are not available, cost-reimbursable, performance-based (cost-plus incentivefee or cost-plus award fee) contracts can be considered. The more a remedial system is subject tomodifications, the more favorable a cost or cost plus award fee a contract becomes. This contract strategystill provides an incentive to the contractor to perform the work efficiently and control costs; however, therisks associated with the costs of performance are not assumed by the contractor.

What Tools Can I Use to Optimize My Remedial Action Operation Program? Interim Final
Guidance to Optimizing Remedial Action Operation 37 April 2001
Table 9-2. Contracting Guidance
Contract Strategy Benefits Remarks
Use fixed-price,performance-basedcontract mechanismswhere feasible
• Provides operating flexibilityand appropriate incentives forthe contractor to focus onachieving site closure in themost optimal manner possible
• Promotes financial risk sharingbetween the contractor and theGovernment
• Cost reimbursable contracts are appropriate during thefirst few months of operation (e.g., startup,shakedown, and optimization of new remedialsystems).
• If fixed-price mechanisms are not available, a cost-plus incentive fee or a cost-plus award fee contractcan be considered.
Establish a set ofperformance measuresdirectly tied to the siteclosure strategy
• Ensures the contractor isoperating and monitoring thesystem toward the ultimate goalof site closure
Example performance measures include the following:
• Achievement of cleanup or closure-criteria by aspecified time
• Mass of contaminants removed
• Percent reduction of contaminant mass orconcentration
• Reduction in total operating or monitoring costs
• Zero permit violations
• Maintaining a predetermined removal efficiency
• Maintaining plume capture
Note: Contractor's scope must provide authority toimplement changes to achieve goals.
Issue work in bulkpackages
• Reduced contractadministrative burden
• Reduced analytical and laborrates
• Increased data quality
• Labor is reduced for the Government throughminimizing the number of contracts requiringadministration.
• Labor and analytical rates are reduced by allowingon-site labor rates (no G&A surcharge) and bulkanalysis discounts.
• Data quality can be improved by coordinatingsampling events and instructing laboratories toanalyze all routine and quality control analyses in thesame analysis batch.
Specify reporting,administrative, andanalyticalrequirements instatements of work
• Provides program flexibility byallowing significant projectparameters to be adjusted whilenot revising existing manuals orsampling plans
• Significant parameters include monitoring, reporting,sampling frequencies, and analytical methods-theseparameters can be easily be modified to account forchanging site conditions during remediation.
• Often referred to as a “plug-in” Statement of Work.

What Tools Can I Use to Optimize My Remedial Action Operation Program? Interim Final
Guidance to Optimizing Remedial Action Operation 38 April 2001
9.5.3 Contractor Performance Incentives
Contractor performance incentives can be used to motivate the contractor to reduce costs, improveproduct/services, and reduce the delivery time. The performance metrics should be directly linked to thesite closeout endpoint. Example performance measures include:
§ Achievement of cleanup or closure criteria by a specified time§ Mass of contaminants removed§ Percent reduction of contaminated mass or concentration§ Reduction in total operating or monitoring costs§ Zero permit violations§ Maintaining a predetermined removal efficiency§ Maintaining plume capture
Establishing these performance measures and basing performance incentives on them ensures that thecontractor is operating and monitoring the system toward the ultimate goal of site closure. Thecontractor's scope must include the authority to implement changes to achieve site goals. Careful contractadministration may be required with cost-reimbursable projects to ensure that excessive reimbursablecosts are not incurred to achieve contract incentives.

Where Else Can I Go for Help? Interim Final
Guidance to Optimizing Remedial Action Operation 39 April 2001
1100..00 WWhheerree EEllssee CCaann II GGoo ffoorr HHeellpp??
Content: This section provides a listing of resources related to RAO optimization. State and localregulators should be contacted for state-specific and local regulatory requirements. Section 10 of theGuide to Optimal Groundwater Monitoring provides links to all 50 state environmental agencies.
10.1 Useful Web Sites
Naval Facilities Engineering Services Center (NFESC). The NFESC web site provides innovativeenvironmental cleanup technologies and approaches for the Navy and Marine Corps. The site coversinformation on environmental cleanup of Navy property contaminated with hazardous substances andprovides details on the Navy’s cleanup program, technologies, regulations and policies, outreach efforts,support services, and output from technical work groups. http://erb.nfesc.navy.mil
Hazardous Waste Clean-Up Information (Clu-In). The site is managed by the U.S. EPA, TechnologyInnovation Office. Clu-In provides information about innovative treatment technologies to the hazardouswaste remediation community. The Technology Focus links provides information on sources for airsparging, bioremediation of chlorinated solvents, fracturing, ground-water circulating wells, in-situflushing, in-situ oxidation, multi-phase extraction, natural attenuation, permeable reactive barriers,phytoremediation, soil vapor extraction, and thermal desorption. http://clu-in.org
Federal Remediation Technologies Roundtable (FRTR). Includes links and chapters to RAOtechnologies, workgroups, publications, cost and performance information, case studies on full-anddemonstration-scale remedial technologies, optimization and evaluation technology, remediationscreening matrix, and sampling and analysis matrices. Of particular interest is the document,“Remediation Technologies Screening Matrix and Reference Guide.” http://www.frtr.gov
United States Army Corps of Engineers (USACE). Website provides multiple manuals andpublications on remediation technology and services for the public and military. Useful programs includethe Environmental Division and Base Realignment and Closure (BRAC). The Military ProgramsEnvironmental Division provides management, design, and execution of a full range of cleanup andprotection activities. There is also information on BRAC for multiple installations.http://www.usace.army.mil
The Air Force Center for Environmental Excellence (AFCEE). AFCEE provides a range ofenvironmental, architectural and landscape design, and planning and construction management servicesand products. AFCEE provides research findings, fact sheets, documents, and manuals on remediationtechnology easily accessed through their search engine. http://www.afcee.brooks.af.mil
Defense Environmental Network and Information eXchange (DENIX). DENIX provides DODpersonnel with access to environmental legislative, compliance, restoration, cleanup, and DOD guidanceinformation. It serves as a central electronic junction where information can be exchanged worldwideamong environmental professionals. DENIX was developed and is maintained and operated by theUnited States Army Corps of Engineers Construction Engineering Research Laboratories.http://www.denix.osd.mil
Department of Defense Environmental Cleanup Home Page. DOD’s Office of EnvironmentalCleanup is charged with developing policy and overseeing the Defense Environmental RestorationProgram (DERP). This program focuses on reducing the risks to human health and the environment at

Where Else Can I Go for Help? Interim Final
Guidance to Optimizing Remedial Action Operation 40 April 2001
active, formerly used, and closing bases, while ensuring that DOD environmental cleanup policyconforms to existing laws and regulations. http://www.dtic.mil/enviroDOD/index.html
Global Network of Environment and Technology (GNET). GNET provides information onenvironmental technology and news that promotes the use of innovative environmental technologies.http://www.gnet.org
Ground-Water Remediation Technologies Analysis Center (GWRTAC). GWRTAC compiles,analyzes, and disseminates information on innovative ground-water remediation technologies.http://www.gwrtac.org
United States Department of Energy, Office of Environmental Management (EM). Technicalguidance on remediation technologies, by state, is provided along with regulations and laws andpublication searches. http://www2.em.doe.gov
United States Environmental Protection Agency (EPA). The EPA website provides information onenvironmental laws and regulations, programs by media and topic, scientific and research-relatedprograms, hotlines, publications, and a search engine. Links of interest include: 1) Enviro$en$e, whichprovides pollution prevention, compliance assurance, enforcement information, and data bases, and2) EPA REACH IT (Remediation and Characterization Innovative Technologies), a new system designedto search, view, download, and print information about innovative remediation and characterizationtechnologies. The site provides links to technologies for treatment, characterization, or monitoring of aparticular contaminated medium, information about service providers, and sites at which a particular typeof technology has been implemented. http://www.epa.gov
United States Government Printing Office (GPO). Provides links to the Federal Register, Code ofFederal Regulations, and other Government agencies. http://www.access.gpo.gov
10.2 Useful Documents
10.2.1 General Optimization
Radian International. December 1997. “Air Combat Command Environmental Restoration Program SiteClosure Guidance Manual.” – This document contains information on regulatory requirements anddocumentation, LTM/LTO performance evaluation, contracting strategies, LTO optimization (soil vaporextraction [SVE], bioventing, capping, pump and treat, multi-phase extraction, free product recovery, andMNA).
U.S. Army Corps of Engineers. September 30, 1999. “Engineering and Design - Safety and HealthAspects of HTRW Remediation Technologies.” Washington, D.C. EM 1110-1-4007. 232 pp. (USACE)– This Engineering manual identifies and analyzes generic safety and health hazards for 25 remediationtechnologies used in clean-up operations at Hazardous, Toxic, and Radioactive Waste (HTRW) sites.
U.S. Air Force Environmental Restoration Program. December 1999. “Remedial Process OptimizationHandbook.”
Where Else Can I Go for Help? Interim Final
Guidance to Optimizing Remedial Action Operation 41 April 2001
10.2.2 Pertinent Guidance and Policy
Department of Navy. “Guide to Optimal Groundwater Monitoring” (January 2000).
Department of Navy. “Technical Guidelines for Evaluating Monitored Natural Attenuation at Naval andMarine Corps Facilities” (March 1998).
EPA Technical Protocol for Evaluating Natural Attenuation of Chlorinated Solvents in Groundwater(September 1998).
EPA OSWER Directive 9200.4-17: Use of Monitored Natural Attenuation at Superfund, RCRACorrective Action, and Underground Storage Tank Sites (Interim Final December 1997).
Department of Defense. “A Guide to Establishing Institutional Controls at Closing MilitaryInstallations.”
Kratina, Kevin. May 6, 1998. “Institutional Controls In Risk-Based Corrective Actions.” U.S. EPA; NJDEP. (EPA) – This article provides a summary on the topic and use of institutional mechanisms in risk-based corrective actions. The article touches on Federal, State, and local laws and codes and examples ofdifferent types of institutional controls.
U.S. Department of Energy. February 1997. “Uncertainty Management: Expediting Cleanup throughContingency Planning.” DOE/EH/(CERCLA)-002.
U.S. Department of Energy, December 1999. “Use of Alternate Concentration Limits (ACLs) toDetermine Cleanup or Regulatory Levels Under RCRA and CERCLA.” DOE/EM-413-9912.
U.S. EPA. 1988. “Guidance for Conducting Remedial Investigations and Feasibility Studies underCERCLA.” Washington, DC. OSWER- 9355.3-01. (EPA). EPA publication order number: PB89-184626.
U.S. EPA, Office of Underground Storage Tanks. May 1995. “How to Evaluate Alternative CleanupTechnologies for Underground Storage Tank Sites: A Guide for Corrective Action Plan Reviewers.”EPA 510-B-95-007. (EPA). EPA publication order number: EPA 510-B-95-007 – This document isdesigned to determine whether appropriate cleanup technologies have been proposed and providesinformation on alternative cleanup technologies. The document provides detailed descriptions of tenalternative technologies: soil vapor extraction, bioventing, biopiles, landfarming, low-temperature thermaldesorption, air sparging, biosparging, natural attenuation, in-situ groundwater bioremediation, dual-phaseextraction.
10.2.3 Cost Information
RACER is an electronic cost system that resides on an MS Access windows platform. The cost modelsare based on the parametric method of cost estimating and are validated using historical cost data. Thecost engineering system is used primarily to price and program for the environmental cleanuprequirements from current execution year through site close-out. The execution year projects use RACERas their baseline and are modified based on historical costs and RPM experience.
Battelle. Bioslurping Cost Estimating Program. Prepared for the Naval Facilities Engineering ServiceCenter. (NFESC) – The bioslurping cost estimator is an Excel-based tool that allows the user to estimateand view costs by inputing parameters, and print reports. A help file for using the tool is also available.

Where Else Can I Go for Help? Interim Final
Guidance to Optimizing Remedial Action Operation 42 April 2001
Battelle. Bioventing Cost Estimator. (NFESC) – The bioventing cost estimator is an Excel-based tool thatallows the user to print reports and estimate costs by inputing general assumptions and parameters.Additional modifications can also be incorporated into the anaylsis.
Battelle. Remediation by Natural Attenuation (RNA) Cost Estimating Program. Prepared for the NavalFacilities Engineering Service Center. (NFESC) – The natural attentuation cost estimator is an Excel-based tool that allows the user to generate detailed cost estimates, general cost estimates, cost summaries,and general RNA flowcharts. A help file for using the tool is also available.
Federal Remediation Technologies Roundtable. October 1998. “Guide to Documenting and ManagingCost and Performance Information for Remediation Projects.” EPA 542-B-98-007. 77 pp. (Clu-In)(EPA) – This document outlines the types of data that should be compiled to document the performanceand cost of future cleanups for 13 technologies. The document also presents a standard set of parametersto be used for documenting completed remediation projects.
Radian International. May 1997. “U.S. Air Force Presumptive Remedy Engineering Evaluation/CostAnalysis (PREECA).” – This document provides a remedy selection process for various remediationtechnologies, including remedy selection justification and methodology, SVE, bioventing, capping,groundwater containment, and Multi-Phase Extraction (MPE).
Yager, Kathleen and Robert Greenwald. December 1999. “Pump and Treat Optimization TechnologyBrings Significant Cost Savings.” Ground Water Currents. Issue No. 34. (EPA) – The U.S. EPATechnology Innovation Office and Office of Research and Development along with HSI GeoTrans,assessed the effectiveness of an optimization technology for pump and treat systems. Study resultsindicated that savings in O&M costs are possible. Primary objectives of the study included: 1) to evaluatea technology that could improve the efficiency of Pump and Treat (P&T) systems along with reducingO&M costs, 2) to emphasize the importance of evaluating system performance on a regular basis, and 3)to develop guidance on when detailed optimization analysis is beneficial. The report includes the use ofcase studies.
10.2.4 Life Cycle Design
Nyer, E.K. 1996. “In-Situ Treatment Technology.” CRC Press LLC.
10.3 Remedial Technologies
Pump and Treat
U.S. EPA. July 1996. “Pump-and-Treat Ground-Water Remediation: A Guide for Decision Makers andPractitioners.” Washington, DC. (EPA) – EPA publication order number: EPA/625/R-95/005. Thisguide introduces pump-and-treat ground-water remediation and outlines the foundation for evaluating theappropriateness of different technology approaches. The document also addresses when pump-and-treatis an appropriate remediation approach, and what is involved in the “smart” application of pump-and-treat, among other questions.
U.S. EPA. 1990. “A Guide to Pump and Treat Groundwater Remediation Technology.” EPA/540/2-90/018. EPA publication order number: EPA540290018.
U.S. EPA. “Methods for Monitoring Pump-and-Treat Performance.” EPA publication order number:EPA 600-R-94-123.

Where Else Can I Go for Help? Interim Final
Guidance to Optimizing Remedial Action Operation 43 April 2001
Air Sparging/Soil Vapor Extraction
Miller, Ralinda. October 1996. “Air Sparging.” Ground-Water Remediation Technologies AnalysisCenter.” Pittsburgh, PA. (GWRTAC) – This technology summary report provides an overview of airsparging, including an introduction to its general principles, reported applicability and utilization, andadvantages/disadvantages. A comparison to bioventing is also provided.
U.S. Army Corps of Engineers. September 15, 1997. “In-Situ Air Sparging.” Engineering and Design.Washington, DC. EM 1110-1-4005. 154 pp. (USACE) – This engineering and design manual providesguidance for the evaluation of the feasibility of in-situ air sparging for remediation of contaminatedgroundwater and soil sites and to describe design and operational measures for in-situ air spargingsystems.
U.S. Army Corps of Engineers. November 30, 1995. “Soil Vapor Extraction and Bioventing.”Washington, DC. EM 1110-1-4001. 247 pp. (USACE) – This engineering and design manual providesguidance for the design and operation of soil vapor extraction and bioventing systems and provides adescription of current best practices for soil vapor extraction and bioventing technologies and operations.
U.S. EPA. 1995. “Soil Vapor Extraction (SVE) Enhancement Technology Resource Guide: AirSparging, Bioventing, Fracturing, Thermal Enhancements.” (EPA) – This guide contains abstracts ofSVE technology guidance documents, overview/program documents, studies and demonstrations, andother resource guides. Each technology is also summarized. For each technology, a matrix is provided toscreen the abstracted references. Many of the documents listed within this guide are available from theEPA.
WASTECH. 1998. “Vacuum Extraction and Air Sparging.” Innovative Site Remediation Technology:Design & Application, Volume 7. American Academy of Environmental Engineers, Annapolis, MD. –This report is available from the American Academy of Environmental Engineering at (410) 266-3390.This report is a cooperative project managed by the American Academy of Environmental Engineers withgrant assistance from the U.S. EPA, DOD, and DOE. This is one report of many publications thatprovide precise engineering information on, in this case, vacuum extraction and air sparging.
Soil Vapor Extraction
U.S. EPA. July 20, 1999. HyperVentilate (free computer software). (EPA) - HyperVentilate is a user-friendly software that aids in the use of vapor extraction (soil venting) technology. The software helps theuser identify and characterize site-specific data, decide if soil venting is the appropriate technology,evaluate air permeability test results, calculate the number of extraction wells needed, and compares yoursite results to an ideal situation.
Bioventing
Air Force Center for Environmental Excellence. 1994. “Bioventing Performance and Cost Summary,Draft.” Brooks AFB, TX. (AFCEE)
Department of Energy. 1993. “Methanotrophic In-Situ Bioremediation Using Methane/Air and GaseousNutrient Injection Via Horizontal Wells, Technology Information Profile Rev. 2.” DOE ProTechDatabase. TTP Reference No.: SR-1211-06.

Where Else Can I Go for Help? Interim Final
Guidance to Optimizing Remedial Action Operation 44 April 2001
U.S. Air Force Environics, Air Force Center for Environmental Excellence, and U.S. EPA Office ofResearch and Development. September 1995. “Principles and Practices of Bioventing, Volume I:Bioventing Principles.” EPA 540-R-95-534a. USAF AL/EQ-TR-1995-0037. (EPA).
EPA Publication Order Number: EPA 540-R-95-534a. This manual was prepared by Battelle MemorialInstitute for the U.S. Air Force and U.S. EPA. The manual contains information on bioventing principles,site characterization, field treatability studies, system design, installation, and operation, processmonitoring, site closure, and other technologies.
U.S. Air Force Environics, Air Force Center for Environmental Excellence, and U.S. EPA Office ofResearch and Development. September 1995. “Principles and Practices of Bioventing, Volume II:Bioventing Design.” EPA 625-xxx-001. USAF AL/EQ-TR-1995-0037. (EPA)
EPA Publication Order Number: EPA 625-xxx-001. This manual was prepared by Battelle MemorialInstitute for U.S. Air Force and U.S. EPA. The second volume of “Principles and Practices ofBioventing” focuses on bioventing design and process monitoring.
Wisconsin Department of Natural Resources. July 1993. “Guidance for Design, Installation and Operationof Soil Venting Systems.” Madison, WI: Emergency and Remedial Response Section. PUBL-SW185-93.This document is intended to guide professionals in designing soil venting systems for soil contaminatedwith volatile organic compounds. This document discusses the basics of soil venting system design,technical considerations, site characterization, treatability or pilot testing, design and installation,operation, and references.
Multi-Phase Extraction
Miller, Ralinda. October 1996. “Bioslurping.” Ground-Water Remediation Technologies AnalysisCenter. Pittsburgh, PA. (GWRTAC). This is a technology overview report of bioslurping, providing anintroduction to its general principles, reported applicability and utilization, and cited advantages anddisadvantages.
U.S. Air Force. January 1995. “Draft: Test Plan and Technical Protocol for Bioslurping.” Air ForceCenter for Environmental Excellence, Brooks AFB, TX. A324068. (AFCEE)
U.S. EPA Office of Solid Waste and Emergency Response. September 1997. “Analysis of SelectedEnhancements for Soil Vapor Extraction.” EPA/542/R-97/007. 246 pp. (EPA). EPA publication ordernumber: EPA/542/R-97/007. This report evaluates five SVE enhancement technologies, including: airsparging, dual-phase extraction, directional drilling, pneumatic and hydraulic fracturing, and thermalenhancement. For each technology, the report provides background and applicability information, anengineering evaluation, an evaluation of performance and costs, a list of vendors, a discussion on itsstrengths and limitations, recommendations for future use and applicability, and references.
Wickramanayake, G.B., et al. 1996. “Best Practices Manual for Bioslurping.” Technical Memorandum.Naval Facilities Engineering Service Center, TM-2192-ENV. (NFESC). This document was prepared byBattelle. This document provides information on the use of bioslurping, bioslurper feasiblitly testing,installation, implementation, data reduction and results interpretation, system operation and performancemonitoring, cost-estimating guide, and references.

Where Else Can I Go for Help? Interim Final
Guidance to Optimizing Remedial Action Operation 45 April 2001
Enhancement of In-situ Bioremediation for Fuel and Chlorinated Contaminated Sites
Bioremediation of Chlorinated Solvents Consortium of the Remediation Technologies DevelopmentForum (RTDF). May 1997. “Natural Attenuation of Chlorinated Solvents in Groundwater: Principles andPractices.” Version 3.0. (EPA). This manual is formatted as a quick reference, question and answerdocument, discussing the science and practice of natural attenuation of chlorinated solvents. The manualincludes an introduction, background information on the technical challenges at chlorinated solvent-contaminated sites and types of chlorinated solvent attenuation processes, evaluation of naturalattenuation, and methodology used to evaluate and implement natural attenuation.
Grindstaff, Megan. 1998. “Bioremediation of Chlorinated Solvent Contaminated Groundwater.”U.S. EPA Technology Innovation Office. (Clu-In). The purpose of this document is to presentinformation regarding field applications of enhanced in-situ bioremediation for treating groundwatercontaminated with chlorinated solvent. It also includes a discussion on bioremediation technologies andcost and performance for nine applications.
U.S. EPA. “Methodologies for Evaluating In-Situ Bioremediation of Chlorinated Solvents.” EPABioremediation Publications. NTIS PB92-146943. (EPA)
In -Situ Chemical Oxidation
U.S. EPA. September 1998. “Field Applications of In-Situ Remediation Technologies: ChemicalOxidation.” EPA 542-R-98-008. 37 pp. (EPA). EPA document order number: EPA 542-R-98-008. Thisreport documents pilot demonstrations and full-scale applications of soil and ground water treated eitherin place or through an increase in the solubility and mobility of contaminants to improve their removal byother remediation technologies.
In-Situ Thermal Treatment
U.S. EPA Office of Solid Waste and Emergency Response. April 1995. “In-Situ Remediation TechnologyStatus Report: Thermal Enhancements.” EPA/542-K-94-009. (EPA). EPA publication order number:EPA/542-K-94-009. The purpose of this document is to describe field demonstrations, commercialapplications, and research on technologies. The report also includes a summary of research,demonstrations, and field applications of the technology.
Reactive Barriers/Treatment Walls
Radisav D. Vidic, Ph.D. and Frederick G. Pohland, Ph.D. October 1996. “Treatment Walls.” Ground-Water Remediation Technologies Analysis Center. Pittsburgh, PA. 38 pp. (GWRTAC) (EPA). Thisdocument provides general information on treatment walls, its use, and advantages and disadvantages ofthis technology over ex-situ and other in-situ groundwater remediation approaches. The documentdiscusses technology description, performance, technology applicability, cost, regulatory requirements,lessons learned, and references.
U.S. EPA. “NATO/CCMS Pilot Study: Evaluation of Demonstrated and Emerging Technologies for theTreatment of Contaminated Land and Groundwater (Phase III) Special Session: Treatment Walls andPermeable Reactive Barriers.”
EPA publication order number: EPA542R98003.

Where Else Can I Go for Help? Interim Final
Guidance to Optimizing Remedial Action Operation 46 April 2001
U.S. EPA Office of Solid Waste and Emergency Response. April 1995. “In-Situ RemediationTechnology Status Report: Treatment Walls.” Technology Innovation Office. Washington, DC.EPA542-K-94-004 Treatment Walls. (EPA)
EPA Publication Order Number: EPA/542-K-94-004. The purpose of this document is to describe fielddemonstrations, commercial applications, and research on technologies. The report also includes asummary of research, demonstrations, and field applications of the technology.
Air Stripping
Dietrich, C., D. Treichler, and J. Armstrong. 1987. “An Evaluation of Rotary Air Stripping for Removalof Volatile Organics from Groundwater.” USAF Environmental and Service Center Report. ESL-TR-86-46.
Elliott, M.G. and E.G. Marchand. 1990. “USAF Air Stripping and Emissions Control Research.”Proceedings of the 14th Annual Army Environmental Symposium, USATHAMA Report. CETHA-TE-TR-90055.
Aboveground Treatment
Trach, Robert J. November 1996. “Ultraviolet/Oxidation Treatment.” Ground-Water RemediationTechnologies Analysis Center. Pittsburgh, PA. (GWRTAC). This report contains information onultraviolet (UV)/oxidation treatment processes for the treatment of contaminated groundwater. The reportdiscusses general principles and techniques associated with UV-OX, the applicability to groundwaterremediation, data relating to results of its use, its advantages and limitations, and references.
U.S. EPA. 1990. “Innovative and Alternative Technology Assessment Manual.” Office of Water ProgramOperations. EPA/430/9-78/009. (EPA)
Naval Energy and Environmental Support Activity. 1993. “Precipitation of Metals from Ground Water.”NEESA Document Number 20.2-051.6. Port Hueneme, CA.
Air Force Center for Environmental Excellence. April 29, 1998. “Oil/Water Separation Technology.”(AFCEE) – This document includes information on the benefits of the technology, backgroundinformation, applicability, site visit information, resource support, points of contact, and programpartners.
Air Force Center for Environmental Excellence. December 1996. “Fact Sheet: Oil/Water Separators.”(AFCEE) – This document includes general technology information, a coalescing oil/water separatordiscussion, its applicability, the design of Air Force oil/water separators, operation and maintenance,regulatory aspects, an Air Force perspective, help information, and references.
Monitored Natural Attenuation
Department of the Navy. March 1998. “Technical Guidelines for Evaluating Monitored NaturalAttenuation at Naval and Marine Corps Facilities.”
Sandia National Laboratories. June 19, 2000. Monitored Natural Attenuation (MNA) Toolbox.(Sandia). This toolbox was developed to screen sites for the applicability of implementation of MNA.The Toolbox identifies primary attenuation pathways, and leads to processes that might mitigate
Where Else Can I Go for Help? Interim Final
Guidance to Optimizing Remedial Action Operation 47 April 2001
particular contaminants. Each contaminant module results in a scorecard that uses site-specific inputparameters to measure the effectiveness of the technology.
U.S. Department of Energy, Office of Environmental Management. October 8, 1999. “TechnicalGuidance for the Long-Term Monitoring of Natural Attenuation Remedies at Department of EnergySites.” (EM). This guide provides DOE Remedial Project Managers with direction on the use ofmonitoring for implementation of natural attenuation systems, considerations for designing a monitoringnetwork, and statistical approaches for interpreting monitoring data and improving conceptual models.U.S. EPA. November 1997. “Draft EPA Region 4 Suggested Practices for Evaluation of a Site ForNatural Attenuation (Biological Degradation) of Chlorinated Solvents.” Version 3.0. 41 pp. (EPA) Thisreport is a combination of information from the Draft AFCEE Protocol for Evaluation of NaturalAttenuation of Chlorinated Solvents in Ground Water and other resources. The report discusses technicalprotocol, a summary of chlorinated aliphatic hydrocarbon biodegradation, the mechanisms associatedwith biodegradation, behavior of the plumes, protocol for quantifying degradation during remedialinvestigation, biodegradation determination and its indicators, groundwater characterization, refinementof the conceptual model, and completing premodeling calculations.
U.S. EPA, Office of Solid Waste & Emergency Response. April 1999. “Use of Monitored NaturalAttenuation at Superfund, RCRA Corrective Action, and Underground Storage Tank Sites.” Directive9200.4-17P. (EPA). The purpose of this Directive is to clarify EPA’s policy regarding the use of MNAfor the cleanup of contaminated soil and groundwater in the Superfund, RCRA Corrective Action, andUnderground Storage Tank programs. This document includes background information, advantages anddisadvantages of MNA, implementation, a demonstration of the efficacy of natural attenuation throughsite characterization, case studies, performance monitoring and evaluation, contingency remedies,references, and other sources of information.
Wiedemeier T.H., J.T. Wilson, D.H. Kampbell, R.N. Miller, and J.E. Hansen. 1995. “Technical Protocolfor Implementing Intrinsic Remediation with Long-Term Monitoring for Natural Attenuation of FuelContaminant Dissolved in Groundwater, Volumes I & II.” Air Force Center for EnvironmentalExcellence. (AFCEE)
Wiedemeier T.H., M.A. Swancon, D.E. Moutoux, J.T. Wilson, D.H. Kampbell, J.E. Hansen, P. Haas, andF.H. Chapelle. September 1998. “Technical Protocol for Evaluating Natural Attenuation of ChlorinatedSolvents in Groundwater, Volumes I & II.” 248pp. (AFCEE). This manual was prepared for the AirForce Center for Environmental Excellence, Technology Transfer Division, Brooks Air Force Base. Thistechnical document identifies parameters in evaluating natural attenuation of ground water contaminatedwith mixtures of fuels and chlorinated aliphatic hydrocarbons and presents protocol for data collectionand analysis to evaluate monitored natural attenuation through biological processes.

References Interim Final
Guidance to Optimizing Remedial Action Operation 48 April 2001
1111..00 RReeffeerreenncceess
Air Force Center for Environmental Excellence, Technical Protocol for Implementing IntrinsicRemediation with Long-Term Monitoring for Natural Attenuation of Fuel Contamination Dissolved inGroundwater, 1995.
ASTM, E1689-95 Standard Guide for Developing Conceptual Site Models for Contaminated Sites, 1995.
DON, Technical Guidelines for Evaluating Monitored Natural Attenuation at Naval and Marine CorpsFacilities, March 1998.
Federal Remediation Technologies Roundtable, Guide to Documenting and Managing Cost andPerformance Information for Remediation Projects, October 1998.
Naval Facilities Engineering Service Center, Guide to Optimal Groundwater Monitoring, Interim Final.January 2000.
USEPA, Guidance for Evaluating the Technical Impracticability of Ground-Water Restoration, InterimFinal, September 1993.
USEPA, Technical Protocol for Evaluating Natural Attenuation of Chlorinated Solvents in Groundwater,1998.
USEPA, Five-Year Reviews – Version 3, 1999.

Interim Final
Guidance to Optimizing Remedial Action Operation April 2001
Appendix A
Technology Specific Optimization Recommendations

Appendix A Interim Final
Guidance to Optimizing Remedial Action Operation A-2 April 2001
Appendix ATechnology Specific Optimization Recommendations
Content: The objective of every RAO program should be to achieve cleanup standards as cost-efficientlyas possible. To ensure that progress is made toward achieving cleanup standards through activeremediation, technology-specific guidance for optimizing twelve selected remedial systems is presented inthis appendix. This appendix includes the following information for each selected remedial system:
§ A brief system description§ An example performance plot§ A table outlining common operational problems and typical optimization recommendations
Examples included in this appendix are taken from case histories of remediation systems that wereevaluated using the RAO optimization process. Summaries of these case studies are included inAppendices B and C of this guidance document.
Conventional remedial systems that have wide application such as pump and treat, soil vapor extraction,and air sparging are discussed first. Discussions of these remedial systems are followed by those of moreinnovative technologies and less commonly applied systems. This appendix also includes an overview onutilizing monitored natural attenuation as an alternative to active remediation systems. Finally, theappendix addresses various above ground components commonly used in treating vapor phase and liquidphase waste streams.
A.1 General Considerations
Before a remediation system is optimized, it should be evaluated against the criteria discussed inSections 2.0 through 5.0 of this guidance document to first determine if the underlying technology iscapable of achieving the site cleanup goals. The results of the evaluation must show that the operation ofthe existing remediation system is consistent with the overall remedial strategy and cleanup objectives forthe site. If the results of the evaluation do not verify the effectiveness of the existing technology, theRPM should consider changing to a different remedial technology and proceed to make this case to theregulatory agency. Optimization of a system to improve its efficiency is justifiable only when it can beverified that the current technology is capable of achieving the cleanup objectives in a reasonable amountof time. For instance, no degree of optimization will improve the operational efficiency of an SVEsystem at a fuel release site where the remaining contaminants are semivolatile organic compounds,which are not removed by SVE. In such a case, it would be more appropriate to adopt a differenttechnology that is known to be effective against these contaminants than to attempt to optimize the SVEsystem.
Technology-specific guidance for optimization is presented below to ensure that remediation systems thatare verified to be operating effectively are also operating efficiently. For each of the twelve selectedtechnologies, a brief description of the system and a discussion of performance evaluation are presented.These are followed by discussions of common operational problems and optimization strategiesapplicable to the technology.
Appendix A Interim Final
Guidance to Optimizing Remedial Action Operation A-3 April 2001
Guidance for optimizing the following technologies is included in this appendix:
§ Pump and Treat for Hydraulic Containment§ Pump and Treat for Contaminant Mass Removal§ Soil Vapor Extraction§ Air Sparging§ Bioventing§ Multi-Phase Extraction§ Free Product Recovery§ Permeable Reactive Barriers§ In-situ Bioremediation of Petroleum Constituents§ In-situ Bioremediation of Chlorinated Compounds§ In-situ Chemical Oxidation§ In-situ Thermal Treatment
A.2 Pump and Treat for Hydraulic Containment
A.2.1 System Description
Groundwater pump and treat systems are used to either (1) hydraulically contain the migration of a plumeof dissolved contaminants, or (2) to contain and also remove the dissolved contaminants from thesaturated zone. Pump and treat systems designed to only contain the migration of a plume are discussedin this section. Pump and treat systems designed for mass removal and aquifer restoration are discussedlater in Section A.3.
Pump and treat systems designed for hydraulic containment are used in situations where site conditionspreclude aquifer restoration, such as aquifers contaminated by dense nonaqueous phase liquid (DNAPL).Containment may also be used as an interim approach to protect receptors while a mass removaltechnology is active in a part of the plume. These systems incorporate wells equipped with pumps toextract groundwater and create a hydraulic capture zone that prevents horizontal and vertical migration ofa contaminant plume. The extraction wells establish a capture zone by depressing water levels to formareas of low hydraulic head toward which the contaminated groundwater flows. Pump and treat systemsfor hydraulic containment typically include the following components:
§ An extraction network, including wells and/or trenches§ A collection system, including groundwater pumps and conveyance piping§ An extracted groundwater treatment system and disposal option§ A monitoring system and program
Figure A-1 is a schematic diagram of a pump and treat system using a network of four vertical extractionwells to hydraulically contain a plume. The diagram also shows 12 monitoring wells for measuring waterlevels and collecting groundwater samples for chemical analysis. A pre-treatment unit, air stripper, andliquid-phase granulated activated carbon are used to treat extracted groundwater in this system prior todischarge. Treatment options for extracted water are discussed separately in Section A.15.2.

Appendix A Interim Final
Guidance to Optimizing Remedial Action Operation A-4 April 2001
Figure A-1. Typical pump and treat system for hydraulic control.
A.2.2 Performance Plots
The effectiveness of a pump and treat system for hydraulic containment is assessed by periodicallymeasuring and evaluating water levels (hydraulic head) and groundwater quality in the monitoring wellnetwork to verify that the contaminant plume is not migrating. Delineating the horizontal capture zonealone is adequate for hydraulic containment systems utilizing extraction wells that fully penetrate anaquifer. However, delineating the vertical capture zone using data collected from nested monitoring wellsis also necessary if the extraction wells are only partially penetrating.
Evaluating the effectiveness of hydraulic containment systems involves comparing water levels withinand beyond a plume to verify that inward gradients have been established. Inward gradients indicate thatgroundwater flow is toward the extraction wells and ensure that dissolved contaminants are captured bythe extraction well network. The performance evaluation also involves examining contaminantconcentrations and trends in monitoring wells, especially in those wells located near the edge of theplume, to verify that no contaminant migration is occurring. The water level and water quality data aremost easily evaluated using maps and cross-sections to plot the potentiometric surface and contaminantextent. The presence of inward gradients can be interpreted from the potentiometric contour maps andcross-sections. Similarly, contaminant extent can be plotted to determine if the size and position of aplume remain stable. Overlaying the potentiometric contours onto the contaminant distribution mapindicates if the entire plume is located within the hydraulic capture zone. Figure A-2 is a generalized plotshowing a contaminant plume that is under the hydraulic control of a pump and treat system. The figureindicates that the entire plume is located within an area where potentiometric surface contour lines depictthe presence of inward gradients.

Appendix A Interim Final
Guidance to Optimizing Remedial Action Operation A-5 April 2001
Figure A-2. Performance plot of a typical pump and treat system for hydraulic control.
A.2.3 Common Operational Problems
Operational problems common to pump and treat systems for hydraulic containment are typicallyassociated with the extraction wells. Decreasing well yield is a particularly common problem that canresult from screen incrustation and biological fouling. Corrosion is another cause of lowered wellperformance that can lead to screen failure, sand pumping, and pump damage. Regular measurement ofwell depth and specific capacity can provide warning of impending problems and indicate the need forwell maintenance. Table A-1 lists these and other problems common to pump and treat systems used forhydraulic containment.
A.2.4 Common Optimization Strategies
The most significant optimization strategy for hydraulic containment systems is ensuring that theminimum quantity of groundwater is extracted to maintain plume containment. Some systems areoperated at the maximum achievable extraction rates whether warranted or not. For other systems,excessive amounts of water may be extracted if the hydraulic containment design analysis was performedat a time when groundwater elevations were below normal. One remedy to these situations is to readjustthe pumping rate and monitor the hydraulic response. The rate can be adjusted over a series ofincremental steps until monitoring indicates that the lowest rate capable of maintaining capture has beenattained. Another remedy that may be appropriate to highly characterized sites is to perform optimizationmodeling using analytical or numerical techniques. Available models range from simple graphicalmethods to complex models that have been combined with linear and nonlinear programming methods.At some sites, high long-term operating costs may justify installing low permeability barriers that limitthe flow of clean water into contaminated portions of the aquifer and allow pumping rates to be decreasedsignificantly. Table A-1 lists factors that should be considered to optimize the performance of pump andtreat systems for hydraulic containment.

Appendix A Interim Final
Guidance to Optimizing Remedial Action Operation A-6 April 2001
Table A-1. Common Operational Problems and Optimization Strategies for Hydraulic Containment Pump and Treat Systems
Operational Problem Potential Causes Potential Negative Impacts on Performance Optimization StrategiesThe extraction ratedeclines over time.
• Mineral incrustation of the well screens isoccurring.
• Biological fouling of the well screens isoccurring.
• Pumping below the design rate can resultin a capture zone that shrinks in size andfails to maintain hydraulic containment.
• Perform well rehabilitation usingappropriate acids and/or biocides.
• Redevelop the affected wells.
The design extractionrates have never beenachieved in individualwells.
• The pumps are not properly sized.
• The extraction wells were improperlydesigned, installed, or developed.
• The aquifer yield is less than predicted.
• The inability to achieve the design ratemay result in a failure to establish acapture zone of sufficient size to containthe contaminants.
• Install properly sized pumps.
• Redevelop the poorly developed wells.
• Replace the wells that are improperlydesigned or constructed.
• Review and potentially revise the aquifer-testing results. Install additional wells, asnecessary.
The wells are pumpingsand or experiencingsiltation.
• The pumps are improperly placed withinthe well screens.
• The wells are poorly developed.
• The wells were installed with inadequatesand packs or screens.
• "Sand pumping" can lead to excessivewell or treatment system downtime andresult in the loss or diminished size of thecapture zone.
• Raise the pumps above the well screensand redevelop the affected wells.
• Redevelop the poorly developed wells.
• Replace the improperly installed wells.
The contaminant plume ismigrating.
• The pumping rate is not sufficient toestablish a capture zone.
• The system is experiencing prolongedshut down.
• The number of wells is not adequate orthey are improperly located.
• Failure to maintain containment willallow the plume to expand in size andpotentially reach receptors.
• Increase the well pumping rates.
• Increase the system uptime through apreventive maintenance program.
• Install additional wells.
Excessive volumes ofwater are being extracted.
• The system is arbitrarily being pumped atthe maximum rate or the margin of safetyin the pumping rate is overlyconservative.
• The design rate was based on an analysisof abnormal conditions.
• The high permeability of the aquiferrequires a high pumping rate to maintainthe capture zone.
• Pumping at rates greater than required tocontain the plume results in unnecessarycosts.
• Incrementally adjust pumping to lowerrates and monitor the hydraulic responseuntil results indicate that the minimumpumping rate necessary to maintain thecapture zone has been attained.
• Perform analytical or numericalgroundwater modeling to calculateoptimum pumping rates.
• Evaluate whether installing lowpermeability barriers will be costeffective in lowering the pumping rate inhigh yielding aquifers.

Appendix A Interim Final
Guidance to Optimizing Remedial Action Operation A-7 April 2001
A.3 Pump and Treat for Contaminant Mass Removal
A.3.1 System Description
The ultimate goal of pump and treat systems designed for mass removal is aquifer restoration. Therefore,in addition to preventing plume migration, pump and treat systems designed for contaminant massremoval extract contaminated groundwater from an aquifer and enhance the flushing of contaminants thatare sorbed to the aquifer matrix as quickly and efficiently as possible. The strategy for operating this typeof system is to install extraction wells within a contaminated groundwater plume and operate them untilthe contaminant levels decrease to some predetermined level, or until a site-specific shut-down criterion isachieved. Prior completion of source removal is critical to achieving groundwater restoration using pumpand treat. The major limitations associated with these systems are attributed to two phenomena known astailing and rebound, which are discussed in Sections A.3.2 and A.3.3.
Like pump and treat systems for hydraulic containment, pump and treat systems for contaminant massremoval typically include the following components:
§ An extraction network, including wells and/or trenches§ A collection system, including groundwater pumps and conveyance piping§ An extracted groundwater treatment system and disposal option§ A monitoring system and program
Figure A-3 is a schematic diagram of a pump and treat system with a network of vertical extraction wellsinstalled to extract contaminant mass and to contain plume migration. The extraction wells are installedin the areas of greatest contamination; along the plume axis; and, in areas of the least mobilecontaminants to, collectively, maximize mass removal, reduce the pumping of clean water, and minimizecontaminant travel time to the extraction wells. The diagram also shows 12 monitoring wells formeasuring water levels and collecting groundwater samples for chemical analysis. A pre-treatment unit,air stripper, and liquid-phase granulated activated carbon are used to treat extracted groundwater in thissystem prior to discharge. Treatment options for extracted water are discussed separately inSection A.15.2
A.3.2 Performance Plots
An objective inherent to groundwater pump and treat systems for contaminant mass removal is hydrauliccontainment of the contaminants. Therefore, the effectiveness of these systems in preventing plumemigration should first be evaluated using the procedures described in Section A.2.2.
The effectiveness of the systems in removing contaminant mass and restoring groundwater quality shouldthen be evaluated by plotting the contaminant concentrations measured in the system influent versus time.Groundwater pump and treat systems for contaminant mass removal typically exhibit a tailing effect inthat the rate at which contaminant concentrations in the influent are reduced gradually declines. A plot ofconcentrations versus time for these systems will have an area of high initial contaminant concentrations,followed by a period of rapidly declining concentrations, and finally a period in which influentcontaminant concentrations reach asymptotic levels. Figure A-4 shows a performance plot for a pumpand treat system that has achieved an asymptotic level in the concentration of influent to the system.Similar plots should be prepared for individual monitoring wells by graphing contaminant concentrationsin groundwater samples versus time. The concentrations in monitoring well plots will also eventuallyreach asymptotic levels as pumping continues.
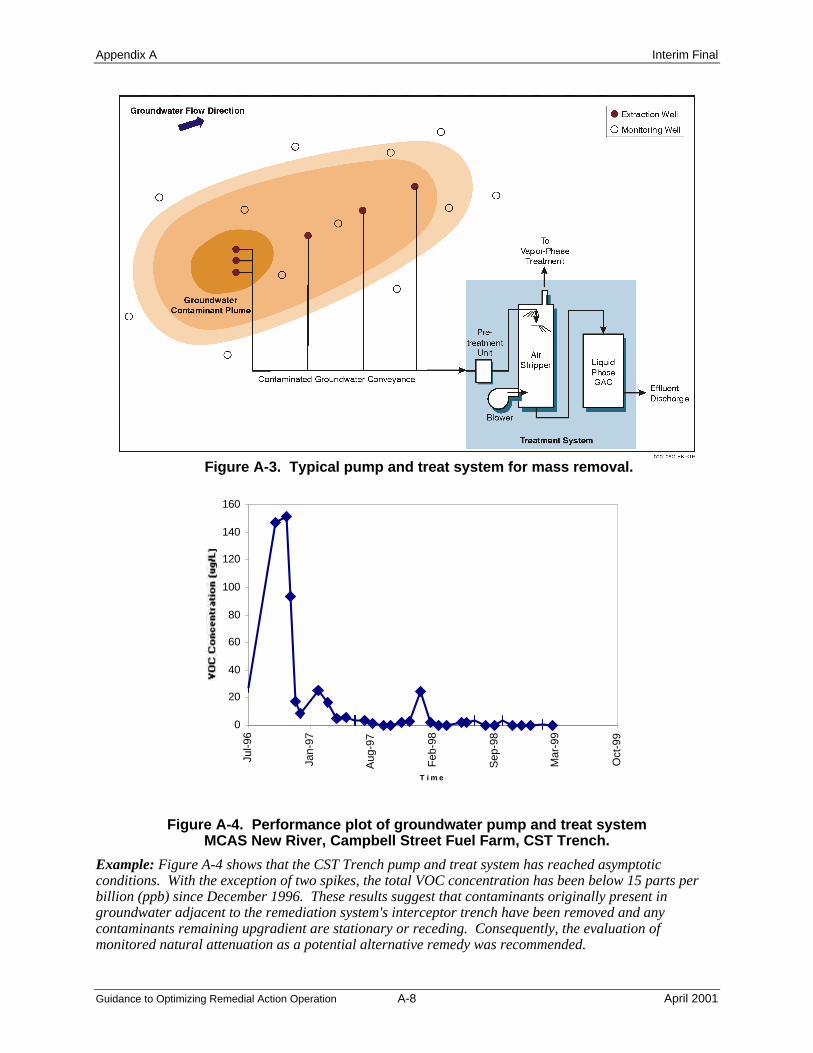
Appendix A Interim Final
Guidance to Optimizing Remedial Action Operation A-8 April 2001
Figure A-3. Typical pump and treat system for mass removal.
Figure A-4. Performance plot of groundwater pump and treat systemMCAS New River, Campbell Street Fuel Farm, CST Trench.
Example: Figure A-4 shows that the CST Trench pump and treat system has reached asymptoticconditions. With the exception of two spikes, the total VOC concentration has been below 15 parts perbillion (ppb) since December 1996. These results suggest that contaminants originally present ingroundwater adjacent to the remediation system's interceptor trench have been removed and anycontaminants remaining upgradient are stationary or receding. Consequently, the evaluation ofmonitored natural attenuation as a potential alternative remedy was recommended.
0
20
40
60
80
100
120
140
160
Jul-9
6
Jan-
97
Aug
-97
Feb
-98
Sep
-98
Mar
-99
Oct
-99
T i m e

Appendix A Interim Final
Guidance to Optimizing Remedial Action Operation A-9 April 2001
When pumping is terminated for at least several months, the contaminant concentrations in thegroundwater will typically rebound to levels that exceed those measured during system operation, butwhich are below initial concentrations. The rebound in concentrations will be evident in monitoring wellsamples and in the influent of a system that is restarted. Figure A-5 illustrates several periods of reboundin the influent concentration of a pump and treat system that is alternately turned on and off in anoperating procedure known as pulsing.
Figure A-5. Typical performance plot showing rebound in Influent concentrationas a result of pulsing a pump and treat system.
A.3.3 Common Operational Problems
An unrealistic expectation that a pump and treat system alone can attain cleanup goals based on drinkingwater standards is a fundamental problem common to many sites. Practical application of the technologyhas shown that the feasibility of achieving cleanup to drinking water standards using pump and treatsystems is difficult. Pump and treat systems are most likely to achieve this goal at sites involving mobilecontaminants dissolved in groundwater in a permeable, homogeneous aquifer from which the source areahas been completely removed. However, even under these ideal conditions several factors, including thepresence of residual contaminants, slow contaminant desorption, and low hydraulic conductivity, canimpose serious limitations on pump and treat performance. These factors contribute to the increasinglylower rate at which contaminant concentrations decline as pumping progresses, known as tailing; and, inthe rebound of contaminant concentrations to higher levels when pumping is terminated. Both tailing andrebound increase the volume of water that must be extracted to achieve cleanup goals and, therefore,prolong the time necessary to complete remediation.

Appendix A Interim Final
Guidance to Optimizing Remedial Action Operation A-10 April 2001
The contaminant source, including any nonaqueous phase liquid present at residual saturation, must beremoved before a pump and treat system can potentially restore an aquifer. Otherwise, contaminants inthe source area will continue to dissolve into groundwater and maintain concentrations above cleanupgoals. Similarly, as pumping progresses and reduces the concentration of contaminants dissolved ingroundwater, any contaminants sorbed to the aquifer matrix will partition into groundwater at rates thatdepend on the contaminant concentrations, their sorption properties, and the velocity of groundwaterflow. When pumping first commences, increased groundwater flow rates cause a decrease in contaminantconcentrations that ultimately tails off until the rate of desorption is again in equilibrium with theincreased groundwater flow velocity. This tailing phenomenon is responsible for the asymptoticcontaminant concentration levels typically seen in the performance plots of many pump and treat systems.Subsequently, if pumping is terminated, groundwater flow velocity decreases, contact time between thesorbed contaminants and groundwater increases, and dissolved contaminant concentrations rebound ashigher equilibrium conditions are re-established.
Low aquifer hydraulic conductivity can limit the yield of extraction wells causing efforts to contain plumemigration to fail. In addition, low extraction well yield may result in the insufficient flushing of theaquifer. Aquifer restoration requires that sufficient groundwater (typically 0.3 to 2 pore volumesannually) be flushed through the contaminated zone to extract both dissolved contaminants andcontaminants that will desorb from the aquifer matrix (Cohen et al., 1994. Methods for Monitoring Pumpand Treat Performance. EPA/600/R-94/123). Low hydraulic conductivity may restrict the ability topump at the rates necessary to achieve this degree of flushing.
Other operational problems common to pump and treat systems are those associated with the extractionwell network. Decreased well yield is a particularly common problem that can result from screenincrustation and biological fouling. Corrosion is another cause of lowered well performance that can leadto screen failure, sand pumping, and pump damage. Regular measurement of well depth and specificcapacity can provide warning of impending problems and indicate the need for well maintenance.Table A-2 lists other problems common to pump and treat systems for contaminant removal.
A.3.4 Common Optimization Strategies
Optimizing groundwater flow through a contaminated zone to flush dissolved and sorbed contaminantsfrom an aquifer can improve the effectiveness and efficiency of pump and treat systems in removingmass. This primarily involves optimizing pumping rates, well locations, and screen depths. These andother factors that should be considered in optimizing pump and treat performance for mass removal arelisted in Table A-2.
In particular, because asymptotic levels of mass removal have been reached by many pump and treatsystems, a commonly applicable optimization strategy is to alternate periods of pumping with periods ofno pumping in a procedure known as pulsing. During each non-pumping period, contaminants sorbed tothe aquifer matrix or residing in low permeability zones are allowed to reach chemical equilibrium in thegroundwater resulting in the removal of the highest contaminant concentration for the minimum volumeof water extracted. During pulsing, hydraulic containment must be maintained to prevent contaminantplume migration. In some cases, the plume may not migrate beyond the radius of the capture zone beforepumping is resumed and inward gradients are re-established. In other cases, however, the plume mayneed to be contained by continuously pumping wells near the boundary while wells in the more highlycontaminated portions of the plume are pulsed.

Appendix A Interim Final
Guidance to Optimizing Remedial Action Operation A-11 April 2001
Table A-2. Common Operational Problems and Optimization Strategiesfor Pump and Treat Systems for Mass Recovery
Operational Problem Potential Causes Potential Negative Impacts on Performance Optimization Strategies
The contaminantconcentrations have notdeclined in the systeminfluent and in themonitoring wells.
• The pumping rate is too low to allow anadequate number of pore volumes ofgroundwater to be pumped through thecontaminant plume.
• Source areas or hotspots have not beenadequately controlled.
• The inability to remove contaminants dueto ineffective flushing or lack of sourcecontrol precludes aquifer cleanup.
• Increase the pumping rates of existingwells and/or install additional wells toincrease the number of pore volumespumped through the contaminant plume.
• Install source control wells or evaluateother source control measures.
• Evaluate alternate technologies forpossible implementation.
The contaminantconcentrations in thesystem influent and in themonitoring wells havereached asymptotic levelsand/or rebound to higherlevels when pumping isterminated.
• The removal of contaminants sorbed tothe aquifer matrix is limited by site-specific desorption rates.
• The removal of contaminants within lowpermeability zones is diffusion limited.
• The extraction wells are improperlylocated or continue to operate in areaswhere contamination has been reduced.
• The extraction wells are inappropriatelyscreened through zones of lessercontamination.
• The contaminants remain at stagnationpoints that are not flushed bygroundwater pumping.
• The slower rate of contaminant removalwill extend cleanup time.
• "Pulse" the extraction wells or reduce thepumping rates to correspond tocontaminant desorption and/or diffusionrates.
• Identify unproductive extraction wellsthrough sampling and decrease thepumping rates while increasing rates atmore productive wells.
• Replace the improperly screened wellswith wells isolated to the contaminatedintervals within the aquifer.
• Rebalance the pumping rates betweenwells to eliminate stagnation points orinstall additional wells to enhanceflushing through stagnation points.
The system is noteffectively removingcontaminants but thecontaminantconcentrations aredecreasing or havereached asymptotic levelsand the plume is stable orreceding.
• The contaminants may be undergoingnatural attenuation.
• Continued active remediation may not becost effective.
• Evaluate the feasibility of MNA for siteremediation. Shut down the pump andtreat system if MNA is feasible.
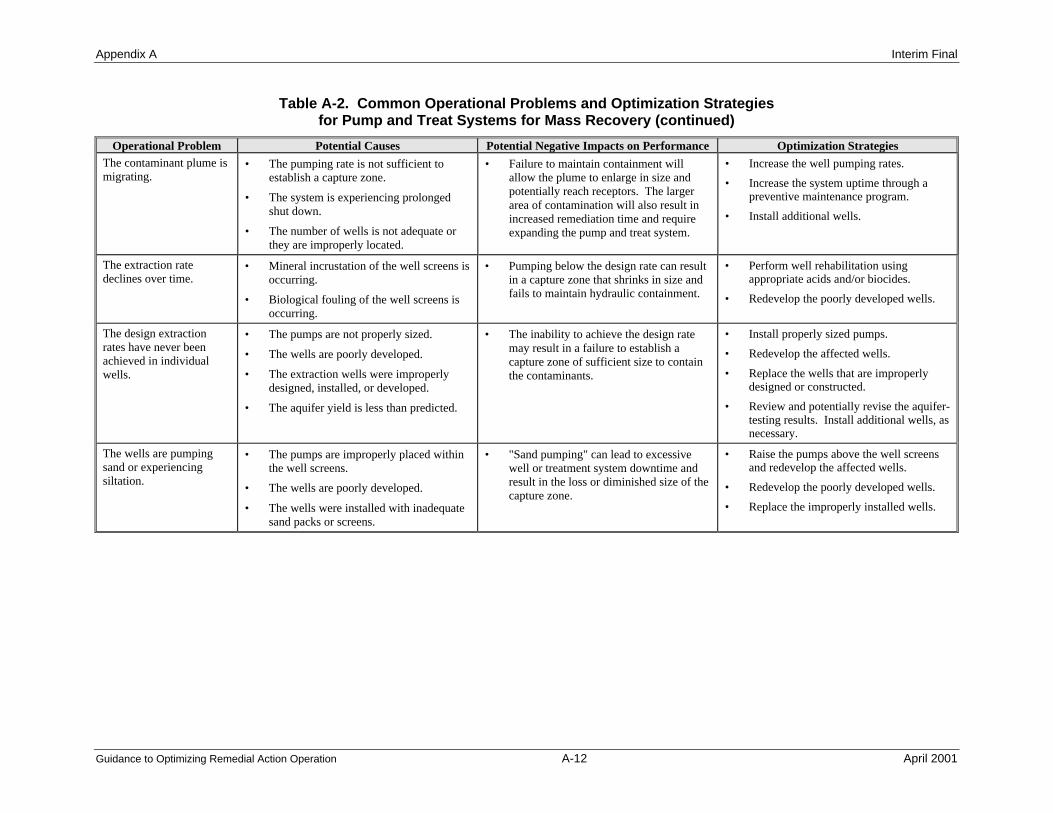
Appendix A Interim Final
Guidance to Optimizing Remedial Action Operation A-12 April 2001
Table A-2. Common Operational Problems and Optimization Strategiesfor Pump and Treat Systems for Mass Recovery (continued)
Operational Problem Potential Causes Potential Negative Impacts on Performance Optimization Strategies
The contaminant plume ismigrating.
• The pumping rate is not sufficient toestablish a capture zone.
• The system is experiencing prolongedshut down.
• The number of wells is not adequate orthey are improperly located.
• Failure to maintain containment willallow the plume to enlarge in size andpotentially reach receptors. The largerarea of contamination will also result inincreased remediation time and requireexpanding the pump and treat system.
• Increase the well pumping rates.
• Increase the system uptime through apreventive maintenance program.
• Install additional wells.
The extraction ratedeclines over time.
• Mineral incrustation of the well screens isoccurring.
• Biological fouling of the well screens isoccurring.
• Pumping below the design rate can resultin a capture zone that shrinks in size andfails to maintain hydraulic containment.
• Perform well rehabilitation usingappropriate acids and/or biocides.
• Redevelop the poorly developed wells.
The design extractionrates have never beenachieved in individualwells.
• The pumps are not properly sized.
• The wells are poorly developed.
• The extraction wells were improperlydesigned, installed, or developed.
• The aquifer yield is less than predicted.
• The inability to achieve the design ratemay result in a failure to establish acapture zone of sufficient size to containthe contaminants.
• Install properly sized pumps.
• Redevelop the affected wells.
• Replace the wells that are improperlydesigned or constructed.
• Review and potentially revise the aquifer-testing results. Install additional wells, asnecessary.
The wells are pumpingsand or experiencingsiltation.
• The pumps are improperly placed withinthe well screens.
• The wells are poorly developed.
• The wells were installed with inadequatesand packs or screens.
• "Sand pumping" can lead to excessivewell or treatment system downtime andresult in the loss or diminished size of thecapture zone.
• Raise the pumps above the well screensand redevelop the affected wells.
• Redevelop the poorly developed wells.
• Replace the improperly installed wells.

Appendix A Interim Final
Guidance to Optimizing Remedial Action Operation A-13 April 2001
Other optimization strategies are related to improving the operation of the extraction wells. Decreasingwell yield is a particularly common problem that can result from screen incrustation and biologicalfouling. Corrosion is another cause of lowered well performance that can lead to screen failure, sandpumping, and pump damage. Regular measurement of well depth and specific capacity can providewarning of impending problems and indicate the need for well maintenance.
Example: At NAS Brunswick, "uptime" for wells in the Eastern Plume pump and treat system waslimited by high turbidity and "sand pumping.” The operational history of the system indicated that thesewere recurring problems in wells whose design and construction required that the pumps be located in ornear the screened portion of the wells. Therefore, it was recommended that the pumps be positionedabove the well screen in all suitably constructed existing wells and in any new wells added to the system.

Appendix A Interim Final
Guidance to Optimizing Remedial Action Operation A-14 April 2001
A.4 Soil Vapor Extraction
A.4.1 System Description
SVE is applied to vadose zone soils, generally within source areas of contamination. This technique ismost effective in soils with relatively homogenous soil lithology and high permeability to air. It is noteffective where the water table is less than 3 feet below ground surface (bgs) and requires special controlssuch as groundwater pumping or horizontal wells at sites where the water table is less than 10 feet bgs.SVE wells are installed and screened above the water table, and should intersect the subsurface zone(s) ofcontamination as much as possible. The application of a vacuum to these wells induces air to flow fromthe atmosphere, through the contaminated vadose zone, and to the well screen. This flow of air causescontaminants with low vapor pressures to be volatilized from subsurface soils into the vapor phase andtransported to the surface where the VOCs can be treated and/or discharged.
The primary components of a typical SVE system are shown in Figure A-6, which include extractionwells, transfer piping, a water-vapor separator, a vacuum pump, and a vapor treatment system. The figurealso illustrates an air inlet well, which is sometimes included in the system design to enhance airflow inthe subsurface. Most of the differences between individual SVE systems is associated with the type andsize of the vacuum generating system and the vapor treatment system. The types of vacuum pumpstypically used include regenerative, positive displacement, and liquid ring. SVE wells can be readilyinstalled as vertical wells, angled wells, or horizontal wells depending on site-specific conditions.Treatment methods for extracted vapors include direct discharge (no treatment), carbon adsorption, andoxidation. Treatment options for extracted vapor are discussed separately in Section A.15.1
000062C-KL-RTP
Vapor VaporWater-Vapor
Separator
Blower
Water
Water Pump
To WaterTreatmentSystem
To Atmosphere
AmbientAir
ScreenedInterval
ContaminantPlume Vapors
Water Level
Off-GasTreatment
ExtractionWell
Air InletWell
Figure A-6. Typical soil vapor extraction system.
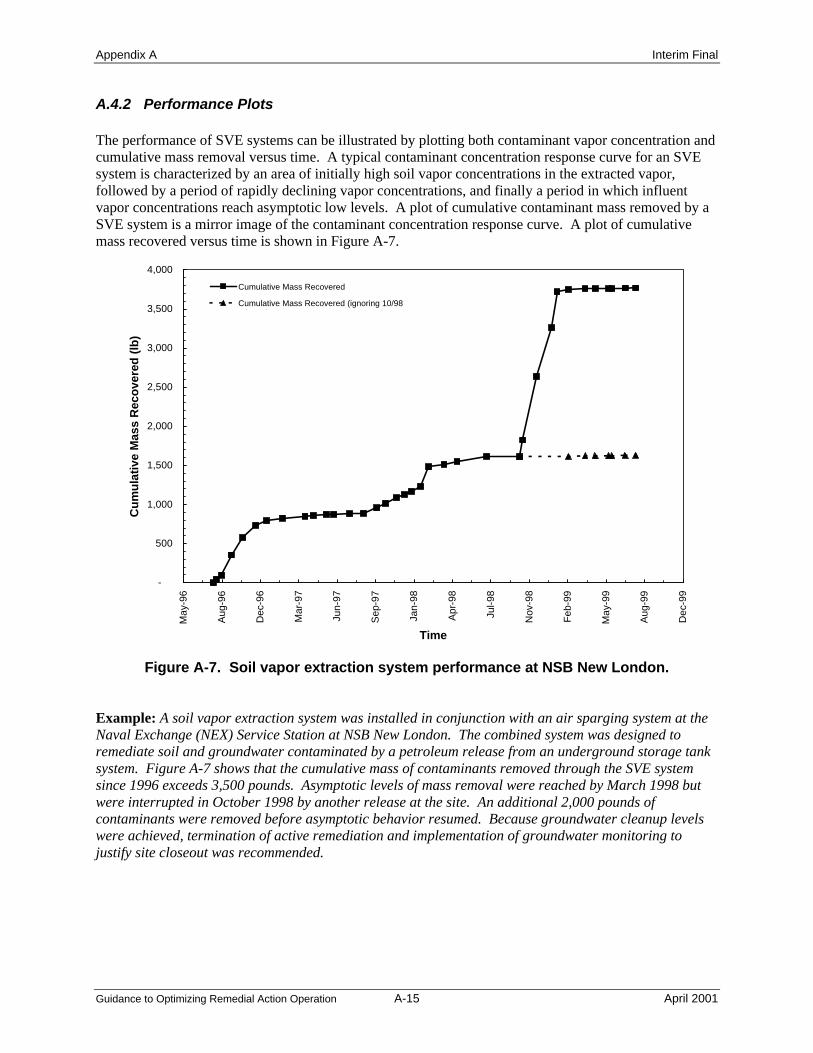
Appendix A Interim Final
Guidance to Optimizing Remedial Action Operation A-15 April 2001
A.4.2 Performance Plots
The performance of SVE systems can be illustrated by plotting both contaminant vapor concentration andcumulative mass removal versus time. A typical contaminant concentration response curve for an SVEsystem is characterized by an area of initially high soil vapor concentrations in the extracted vapor,followed by a period of rapidly declining vapor concentrations, and finally a period in which influentvapor concentrations reach asymptotic low levels. A plot of cumulative contaminant mass removed by aSVE system is a mirror image of the contaminant concentration response curve. A plot of cumulativemass recovered versus time is shown in Figure A-7.
Figure A-7. Soil vapor extraction system performance at NSB New London.
Example: A soil vapor extraction system was installed in conjunction with an air sparging system at theNaval Exchange (NEX) Service Station at NSB New London. The combined system was designed toremediate soil and groundwater contaminated by a petroleum release from an underground storage tanksystem. Figure A-7 shows that the cumulative mass of contaminants removed through the SVE systemsince 1996 exceeds 3,500 pounds. Asymptotic levels of mass removal were reached by March 1998 butwere interrupted in October 1998 by another release at the site. An additional 2,000 pounds ofcontaminants were removed before asymptotic behavior resumed. Because groundwater cleanup levelswere achieved, termination of active remediation and implementation of groundwater monitoring tojustify site closeout was recommended.
-
500
1,000
1,500
2,000
2,500
3,000
3,500
4,000
May
-96
Aug
-96
Dec
-96
Mar
-97
Jun-
97
Sep
-97
Jan-
98
Apr
-98
Jul-9
8
Nov
-98
Feb
-99
May
-99
Aug
-99
Dec
-99
Time
Cu
mu
lati
ve M
ass
Rec
ove
red
(lb
)
Cumulative Mass Recovered
Cumulative Mass Recovered (ignoring 10/98release)

Appendix A Interim Final
Guidance to Optimizing Remedial Action Operation A-16 April 2001
A.4.3 Common Operational Problems
Soil vapor extraction performance problems are commonly related to a system's inability to extract airfrom all areas of the remediation target zone. Generally, this problem is due to an under-designed system,short-circuiting or unanticipated site conditions. Conversely, an SVE system that is operating effectivelywill eventually reach a point at which the mass transfer of sorbed contaminants typically becomesdesorption and/or diffusion limited. Table A-3 lists these and other problems common to SVE systems.
A.4.4 Common Optimization Strategies
Optimizing the operation of SVE systems requires reliable data collection on a routine basis to track bothtotal extraction rate and the extraction rate of each individual well. The types of information needed tooptimize SVE performance may include the following:
§ Concentration of contaminants extracted prior to treatment§ Concentration of contaminants from each well§ Total system vacuum and individual well vacuums§ Condensate production rate§ Vapor flow rate at vacuum pump inlet and from individual wells§ Vacuum influence and contaminant concentrations at soil gas vapor monitoring points (VMP),§ Contaminant concentrations from groundwater samples
When the amount of mass recovered, or the constituent concentrations in the extracted vapor and ingroundwater samples reach asymptotic conditions, pulsing the system should be considered in an effort torestore a higher mass removal rate. More aggressive measures such as installing additional extractionwells may also be evaluated. If asymptotic conditions persist after operational or system changes havebeen implemented continued operation of the SVE system will generally not result in the significantremoval of additional mass. In this case, if further remediation is necessary, implementing anothertechnology or monitored natural attenuation should be considered. Table A-3 provides other guidance onoptimizing SVE system performance.

Appendix A Interim Final
Guidance to Optimizing Remedial Action Operation A-17 April 2001
Table A-3. Common Soil Vapor Extraction System Operational Problems and Optimization Strategies
Operational Problem Potential Causes Potential Negative Impacts on Performance Optimization Strategies
The design extractionrates and/or radius ofinfluence have never beenachieved in individualwells.
• The air permeability of the soil is lowerthan estimated.
• Short-circuiting is occurring due to thepresence of preferential flow paths.
• The extraction wells have beenincorrectly designed or installed.
• The contaminants located outside theeffective radius of the vacuum are notremoved and prevent reaching cleanupgoals.
• The number of pore volumes of soil gasexchanged in the contaminated area islimited and results in low mass removalthat increases cleanup time.
• Perform a subsurface investigation tofurther characterize the soil permeabilityand the preferential flow paths.
• Utilize Pneulog technology to profilevertical differences in the air permeabilityand contaminant mass and focus wellscreen placement to the appropriate depthintervals.
• Install additional wells in thecontaminated areas located outside thesystem's treatment zone.
• Replace incorrectly designed or installedwells.
The contaminantconcentrations have beenreduced in some but notall wells.
• Treatment may be complete in someareas of the site.
• The airflow to some areas of the site isinadequate.
• Continued operation of nonproductivewells will not be cost effective.
• The low airflow rates will limit massremoval and increase cleanup time.
• Shut off the low producing wells orreduce their pumping rates whileincreasing rates at the more productivewells.
• Install additional extraction wells in theareas where airflow is not adequate.
The contaminantconcentrations in extractedvapor have reachedasymptotic levels.
• The removal of contaminants sorbed tothe soil is limited by site-specificdesorption rates.
• The removal of contaminants within lowpermeability zones is diffusion limited.
• The extraction wells are not properlylocated or screened to treat allcontaminated areas.
• An uncontrolled source area continues torelease contaminants.
• The slower rate of contaminant removaldue to desorption/diffusion limitationswill extend cleanup time.
• The presence of a continuing source ofcontaminants will prevent cleanup.
• "Pulse" the wells or reduce airflow ratesto correspond to contaminant desorptionand/or diffusion rates.
• Install additional wells in thecontaminated areas located outside thesystem's treatment zone.
• Install wells with screens isolated to themost productive soil layers or pack offunproductive intervals in existing wells.
• Implement source control includingexcavation if feasible.
• Evaluate alternate technologies such asthermally enhanced SVE or bioventingfor petroleum-related contamination.

Appendix A Interim Final
Guidance to Optimizing Remedial Action Operation A-18 April 2001
Table A-3. Common Soil Vapor Extraction System Operational Problems and Optimization Strategies (continued)
Operational Problem Potential Causes Potential Negative Impacts on Performance Optimization Strategies
Low concentrations ofcontaminants are extractedduring operation, but highconcentrations reappearwhen the system is shutoff.
• The removal of contaminants sorbed tothe soil is limited by site-specificdesorption rates.
• The removal of contaminants within lowpermeability zones (tight soil layers) isdiffusion limited.
• The airflow rate is higher than necessarydue to desorption and diffusion limits.
• The airflow is short-circuiting due topreferential flow.
• The slower rate of contaminant removaldue to desorption/diffusion limitations orpreferential flow paths will extend thecleanup time.
• "Pulse" the wells or reduce the airflowrates to correspond to contaminantdesorption and/or diffusion rates.
• Temporarily shut off the system andperform equilibrium testing at vapormonitoring points to identify the morehighly contaminated areas where SVEshould be focused.
• Identify and excavate anydesorption/diffusion-limited hot spots, iffeasible.
• Evaluate alternate technologies such asthermally enhanced SVE or bioventingfor petroleum-related contamination.
The contaminantconcentrations in vapormonitoring points and inthe extracted vapor remainhigh despite high massremoval rates
• An uncontrolled source area or freeproduct may be present.
• The presence of a continuing source ofcontaminants will preclude cleanup.
• Perform further subsurface investigationto identify additional source areas andpotential free product.
• Identify and control any source areasincluding excavation if feasible.
The system extracts highvolumes of water.
• The well screens are installed too close tothe water table causing upwelling tooccur.
• Water table upwelling may occlude wellscreens causing lower mass removal thatextends cleanup time.
• The extraction of high volumes of watermay result in excessive system downtime.
• Replace the existing wells with shallowervertical wells or with horizontal wells.
• Consider temporarily shutting down thesystem during periods of seasonal highwater table.
• Evaluate the use of an alternatetechnology that is not influenced by ahigh water table.

Appendix A Interim Final
Guidance to Optimizing Remedial Action Operation A-19 April 2001
A.5 Air Sparging
A.5.1 System Description
Air sparging (AS) is an extraction technology that physically removes VOCs dissolved in groundwaterand sorbed to soil. Biodegradation of nonhalogenated contaminants is also usually enhanced as a result ofintroducing oxygen. Like SVE, air sparging is most effective in relatively homogeneous lithology withhigh permeability. It is also most effective with VOCs that exhibit a high Henry's law constant and willtransfer easily to the vapor phase. The technology involves injecting air into the contaminated portion ofthe saturated zone. The air is typically injected through vertical wells completed below the water table.In some cases, however, horizontal wells may be used to remediate larger areas. The injected air resultsin the transfer of dissolved and sorbed VOCs to the vapor phase. Although the vapor can be ventednaturally to the surface, it is usually extracted through a SVE system (Section 4.3) installed to controlvapor migration. The application of air sparging in conjunction with SVE is known as AS/SVE.Biosparging is a variation of air sparging in which air is injected at a lower rate than in air sparging. Theremediation objective in biosparging is not to strip the contaminants but rather to enhance theirbiodegradation by introducing oxygen. Biosparging is typically applied to petroleum products,dichloroethene, and vinyl chloride. Unlike air sparging, which is limited to remediating VOCs,biosparging is also effective in remediating semivolatile organic compounds.
When the amount of mass recovered, or the constituent concentrations in the extracted vapor and ingroundwater samples reach asymptotic conditions, pulsing the system should be considered in an effort torestore a higher mass removal rate. More aggressive measures such as installing additional air spargingwells may also be evaluated. If asymptotic conditions persist after operational or system changes havebeen implemented, continued operation of the AS system will generally not result in the significantremoval of additional mass. In this case, if further remediation is necessary, implementing anothertechnology or monitored natural attenuation should be considered.
The primary components of a typical AS system include air injection wells, manifold piping, and a bloweror air compressor. Figure A-8 is an illustration of an air sparging system.
ContaminantPlume
Water Level
Blower orCompressor
AirFlow
AirFlow
AirFlow
000053C-KL-RTP
Figure A-8. Typical air sparging system.

Appendix A Interim Final
Guidance to Optimizing Remedial Action Operation A-20 April 2001
A.5.2 Performance Plots
The performance of an AS system that is operated in conjunction with an SVE system should be assessedby plotting both the concentration of constituents in the extracted soil vapor and the amount ofcontaminant mass removed versus time. A performance plot of mass removed is similar to the illustrationshown in Figure A-7. In addition, or in cases where a complementary SVE system is not operated,progress toward achieving cleanup objectives should be monitored by plotting the contaminantconcentrations measured in groundwater samples collected from monitoring wells versus time. Anexample of this type of performance plot is shown in Figure A-9. All three types of plots will eventuallyexhibit asymptotic conditions as system performance declines as remediation progresses.
Figure A-9. Air sparging system performance at NSB New London.
Example: The remedial progress of the air sparging/soil vapor extraction system at the NEX site at NSBNew London is evaluated through periodic groundwater monitoring. Figure A-9 illustrates a decrease inVOC and total petroleum hydrocarbon (TPH) concentrations in groundwater during the system'soperation. Both curves show a general downward trend in concentration over a period during which atleast 3,500 pounds of contaminants were removed by the remediation system. Because groundwatercleanup levels were achieved, termination of active remediation and collection of equilibrium samples tojustify site closeout was recommended. Pulsing the air sparging system was recommended as acontingent remedy should contaminants in groundwater rebound to higher concentrations.
-
2,000
4,000
6,000
8,000
10,000
12,000
14,000
16,000
18,000
20,000
22,000
Oct
-95
May
-96
De
c-9
6
Jun
-97
Jan
-98
Jul-
98
Feb
-99
Aug
-99
Mar
-00
Time
Co
nce
ntr
atio
n (
ug
/l)
Average VOC concentration
Average TPH Concentration

Appendix A Interim Final
Guidance to Optimizing Remedial Action Operation A-21 April 2001
A.5.3 Common Operational Problems
A general problem common to AS systems is inadequate air distribution to all areas of the remediationtarget zone. Generally, this problem is due to an under-designed system, short-circuiting or unanticipatedsite conditions. Conversely, an AS system that is operating effectively will eventually reach a point atwhich the mass transfer of sorbed contaminants typically becomes desorption and/or diffusion limited.Table A-4 lists some of the underlying causes of inadequate air distribution as well as other problems thatmay affect the performance of air sparging systems.
A.5.4 Common Optimization Recommendations
When the various performance plots discussed in Section A.5.2 depict asymptotic conditions, pulsing thesystem should be considered in an effort to restore a higher mass removal rate. More aggressive measuressuch as installing additional air sparging wells may also be evaluated. If asymptotic conditions persistafter operational or system changes have been implemented, continued operation of the AS system willgenerally not result in the significant removal of additional mass. In this case, if further remediation isnecessary, implementing another technology or monitored natural attenuation should be considered.
If the AS system is combined with SVE, a determination should be made if the air sparge vapors mustcontinue to be collected. In cases where receptors are absent, there may be no risk in allowing the vaporsto migrate up through the unsaturated zone and to escape to the atmosphere. In certain other cases,biological processes that operate in the unsaturated zone may consume aerobically degradablecontaminants present in the vapor. Table A-4 provides additional guidance on optimizing AS systemperformance.
Example: At NSB New London, an AS/SVE system at the NEX site reached low and asymptoticcontaminant removal rates. The most recent groundwater monitoring results also indicated that theapplicable remediation standards had been reached. Therefore, it was recommended that the system beshut down and post-remediation monitoring be initiated. Also, pulsed operation of the AS/SVE system orbiosparging was recommended if rebound in contaminant concentrations occurred.

Appendix A Interim Final
Guidance to Optimizing Remedial Action Operation A-22 April 2001
Table A-4. Common Air Sparging System Operational Problems and Optimization Strategies
Operational Problem Potential Causes Potential Negative Impacts on Performance Optimization Strategies The zone of influence isinsufficient or not aspredicted.
• The permeability of the soil is lower thanestimated.
• Short-circuiting of air is occurring alongthe sparge well casings or subsurfaceutilities.
• Heterogeneous soil is causing channelingof the injected air.
• The airflow may not contact some areasof contamination resulting in insufficientcleanup.
• Cleanup will not be achieved or will takelonger than estimated.
• Increase the airflow to the injection wells.
• Install additional wells in thecontaminated areas located outside thesystem's treatment zone.
• Evaluate the system for evidence ofshort-circuiting; consider repairing,replacing, or relocating the affectedwells.
Increasingly high injectionpressure is needed tomaintain flow.
• The injection wells have been becomeplugged through mineral encrustation,biological fouling, or siltation.
• The airflow through the contaminatedarea will not be sufficient.
• Cleanup will not be achieved or will takelonger than estimated.
• Rehabilitate the affected wells withappropriate acids and/or biocides.
• Redevelop the affected wells.• Replace the affected wells if
rehabilitation or redevelopment is notpossible.
The contaminantconcentrations in thetarget zone are notdeclining as anticipated
• The airflow through the contaminatedarea is not sufficient.
• The airflow is short-circuiting.• An uncontrolled source area is present.
• Cleanup will not be achieved or will takelonger than estimated due to an inabilityto supply air to all areas of thecontaminated zone.
• The presence of a continuing source willprevent achieving cleanup.
• Increase the airflow to the injection wells.
• Install additional wells in thecontaminated areas located outside thesystem's treatment zone.
• Evaluate the system for evidence ofshort-circuiting; consider repairing,replacing, or relocating the affectedwells.
• Identify the potential source area andimplement control measures.
• Evaluate the use of alternatetechnologies.
The contaminantconcentrations in thetarget zone have reachedasymptotic levels and/orrebound to higher levelswhen sparging isterminated.
• The removal of contaminants sorbed tothe aquifer matrix is limited by site-specific desorption rates.
• The removal of contaminants within lowpermeability zones is diffusion limited.
• The slower rate of contaminant removalwill extend cleanup time.
• The presence of a continuing source willprevent achieving cleanup.
• "Pulse" the injection wells to correspondto the contaminant desorption and/ordiffusion rates.
• Install additional wells in thecontaminated areas.
• Evaluate the use of alternate technologiesincluding natural attenuation.
Sparging vapors are notproperly controlled.
• Sparging is not operated in conjunctionwith an SVE system or the SVE system isnot operating properly.
• Sparging vapors may accumulate in, ormigrate to, undesirable areas.
• Install an SVE system.
• Optimize the performance of the SVEsystem.

Appendix A Interim Final
Guidance to Optimizing Remedial Action Operation A-23 April 2001
A.6 Bioventing
A.6.1 System Description
Bioventing is a source reduction technology primarily used to treat vadose zone soils contaminated withpetroleum hydrocarbons. Bioventing works by introducing air into subsurface zones of contamination tosimulate naturally occurring microorganisms to biodegrade the petroleum components. Airflow isinduced through the use of either extraction wells or injection wells. However, unlike SVE or AS, theprimary contaminant removal mechanism in bioventing is biodegradation of contaminants, not extraction.Therefore, bioventing systems are operated at lower airflow rates than SVE or AS systems and can treatboth volatile and non-volatile petroleum hydrocarbons. In addition to the induced airflow, nutrients aresometimes also injected into the subsurface to facilitate microbial growth in nutrient-deficient soil.Biodegradation is an inherently slow process such that the systems are used with the understanding thatoperation may continue for several years to reach cleanup objectives. However, because it is simple andrelatively inexpensive to use, bioventing is often the remedial technology selected for sites wherehistorical practices have resulted in releases of various fuels.
Bioventing systems are usually installed as stand-alone remedial actions. Figure A-10 illustrates a typicalbioventing system utilizing extraction to induce airflow. The primary components are identical to thoseused in SVE and include extraction wells, piping, and a blower. Off-gas treatment is usually not requiredunless contaminant concentrations in the extracted vapor exceed allowable limits. The bioventing systemmay also incorporate one or more nutrient addition wells or trenches if microbial growth is limited by adeficiency in naturally occurring nutrients.
Figure A-10. Typical bioventing system.

Appendix A Interim Final
Guidance to Optimizing Remedial Action Operation A-24 April 2001
A.6.2 Performance Plots
Because bioventing systems may reduce contaminant mass through volatilization and biodegradation,both mechanisms should be monitored to measure total mass reduction. Contaminant mass extracted canbe estimated from the extracted vapor flow rate and the concentration of VOCs measured in the extractedvapor. The mass of contaminants that is biologically degraded can be interpreted from oxygenconcentrations measured in soil gas respirometry tests, preferably, at vapor monitoring points, or in theextracted vapor. Carbon dioxide concentration may also be measured; however, it is not always a reliableindicator of aerobic biodegradation due to adsorption to soil moisture and buffering in alkaline soil.Performance monitoring of bioventing systems utilizing only injection wells is limited by an inability tocollect extracted vapor. Figure A-11 shows a performance plot for a typical bioventing system. The figureillustrates that the system has achieved asymptotic levels with respect to VOC and carbon dioxideconcentrations. The figure also shows that cumulative mass removed and degraded has similarly reachedan asymptotic level.
Figure A-11. Performance plot of a typical bioventing system.
A.6.3 Common Operational Problems
Two conditions must be met for bioventing to be successful. First, an adequate population of microbesmust be present to sustain biodegradation. A natural population of these microbes is found at a majorityof sites. Second, sufficient air must flow through the treatment zone to maintain aerobic conditions. As inthe case of SVE systems, bioventing performance problems are commonly related to an inability of asystem to induce airflow to all areas of the remediation target zone. Occasionally, other site conditions

Appendix A Interim Final
Guidance to Optimizing Remedial Action Operation A-25 April 2001
may be only marginally suited to support efficient biodegradation, a situation that underscores the needfor adequate bench and/or pilot-scale testing. Table A-5 lists these and other problems common tobioventing systems.
A.6.4 Common Optimization Strategies
Bioventing systems should be made as simple as possible to run continuously with little operatorattention. Automatic dial-out equipment to notify operators of unplanned shutdowns is a convenient wayto reduce the expense of routine system checks, and to optimize system up time. To optimize abioventing system, system parameters are typically recorded weekly or biweekly and a review of thesystem performance should be conducted at a minimum of every 6 months. In-situ respiration testsshould be performed at all injection or extraction wells and at soil vapor monitoring points to assessmicrobial activity if cleanup is taking longer than anticipated. Soil gas samples collected from theselocations are typically analyzed for methane, carbon dioxide, and oxygen. This testing and sampling is tobe used for assessing remedial progress and to ensure that biodegradation is continuing.
When asymptotic conditions for the constituents of concern and oxygen are first established in vapormonitoring points and extracted vapor, if applicable, alternative steps such as initially increasing theairflow rate should be explored in an effort to restore a higher degradation rate. Subsequently, the airflowmay be pulsed when asymptotic conditions are re-established. Should asymptotic levels persist despitethe modifications, continued operation of the bioventing system will generally not produce additionalreduction in the concentration of the constituents. In this case, if further remediation is necessary,implementing either another technology or monitored natural attenuation should be considered.Generally, however, when the high-risk constituents (e.g., benzene) have been degraded, a case should bemade to decommission the system and pursue site closeout. Table A-5 provides additional guidance onbioventing system operation and optimization.
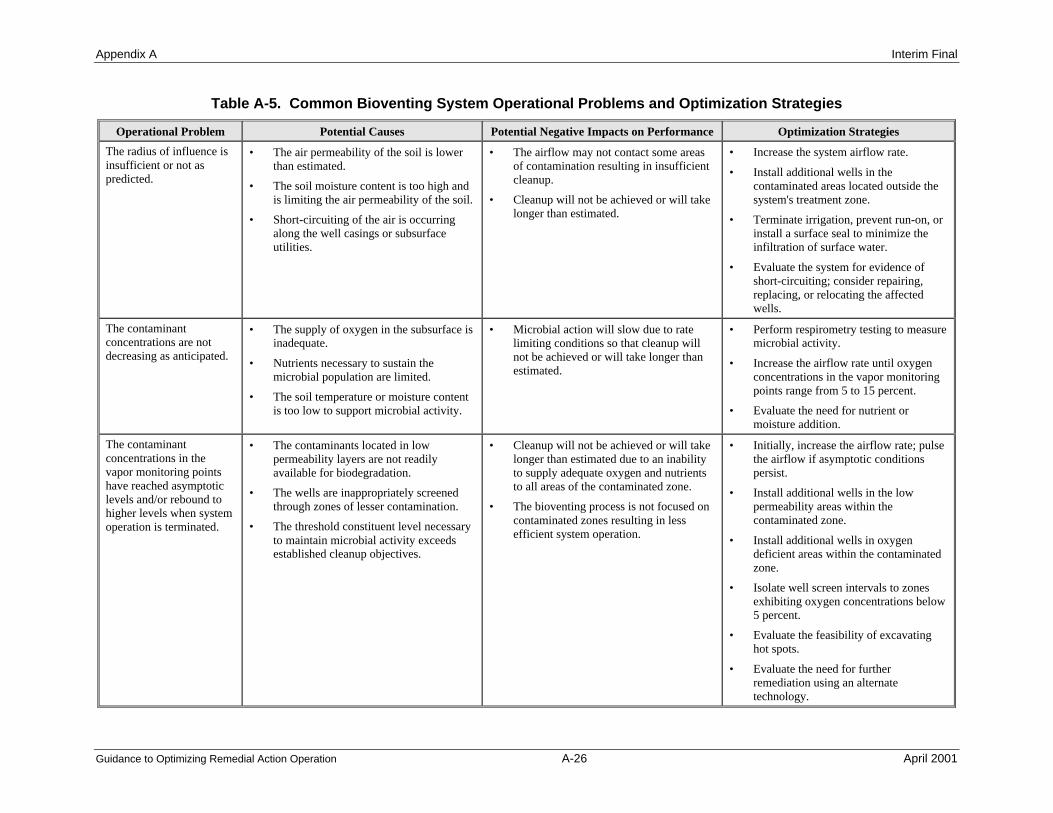
Appendix A Interim Final
Guidance to Optimizing Remedial Action Operation A-26 April 2001
Table A-5. Common Bioventing System Operational Problems and Optimization Strategies
Operational Problem Potential Causes Potential Negative Impacts on Performance Optimization Strategies
The radius of influence isinsufficient or not aspredicted.
• The air permeability of the soil is lowerthan estimated.
• The soil moisture content is too high andis limiting the air permeability of the soil.
• Short-circuiting of the air is occurringalong the well casings or subsurfaceutilities.
• The airflow may not contact some areasof contamination resulting in insufficientcleanup.
• Cleanup will not be achieved or will takelonger than estimated.
• Increase the system airflow rate.
• Install additional wells in thecontaminated areas located outside thesystem's treatment zone.
• Terminate irrigation, prevent run-on, orinstall a surface seal to minimize theinfiltration of surface water.
• Evaluate the system for evidence ofshort-circuiting; consider repairing,replacing, or relocating the affectedwells.
The contaminantconcentrations are notdecreasing as anticipated.
• The supply of oxygen in the subsurface isinadequate.
• Nutrients necessary to sustain themicrobial population are limited.
• The soil temperature or moisture contentis too low to support microbial activity.
• Microbial action will slow due to ratelimiting conditions so that cleanup willnot be achieved or will take longer thanestimated.
• Perform respirometry testing to measuremicrobial activity.
• Increase the airflow rate until oxygenconcentrations in the vapor monitoringpoints range from 5 to 15 percent.
• Evaluate the need for nutrient ormoisture addition.
The contaminantconcentrations in thevapor monitoring pointshave reached asymptoticlevels and/or rebound tohigher levels when systemoperation is terminated.
• The contaminants located in lowpermeability layers are not readilyavailable for biodegradation.
• The wells are inappropriately screenedthrough zones of lesser contamination.
• The threshold constituent level necessaryto maintain microbial activity exceedsestablished cleanup objectives.
• Cleanup will not be achieved or will takelonger than estimated due to an inabilityto supply adequate oxygen and nutrientsto all areas of the contaminated zone.
• The bioventing process is not focused oncontaminated zones resulting in lessefficient system operation.
• Initially, increase the airflow rate; pulsethe airflow if asymptotic conditionspersist.
• Install additional wells in the lowpermeability areas within thecontaminated zone.
• Install additional wells in oxygendeficient areas within the contaminatedzone.
• Isolate well screen intervals to zonesexhibiting oxygen concentrations below5 percent.
• Evaluate the feasibility of excavatinghot spots.
• Evaluate the need for furtherremediation using an alternatetechnology.

Appendix A Interim Final
Guidance to Optimizing Remedial Action Operation A-27 April 2001
Table A-5. Common Bioventing System Operational Problems and Optimization Strategies (continued)
Operational Problem Potential Causes Potential Negative Impacts on Performance Optimization Strategies
The contaminantconcentrations remainconsistently high.
• The contaminant concentrations are toohigh for microbial activity to be effective.
• An uncontrolled source area is present.
• The cleanup goals will not be achieveddue to the presence of conditions that aretoxic to microbial growth.
• The cleanup goals will not be achieveddue to the presence of a continuingsource of contaminants.
• Implement source control measuresincluding excavating hot spots iffeasible.
• Evaluate use of an alternate technology.
The system airflow rate isexcessive.
• The system is being operated at a higherrate than necessary to support microbialoxygen demands.
• The operation of the system may not becost efficient.
• Reduce the airflow rate until oxygenconcentrations in the vapor monitoringpoints range from 5 to 15 percent.

Appendix A Interim Final
Guidance to Optimizing Remedial Action Operation A-28 April 2001
A.7 Multi-Phase Extraction
A.7.1 System Description
Multi-Phase Extraction (MPE) is an enhancement of SVE that simultaneously extracts contaminated soilvapor and groundwater. MPE is designed to depress the water table around each extraction well, creatinga cone of depression. Vacuum applied to each extraction well generates pressure gradients in thesubsurface and induces the flow of air through both the vadose zone and the previously saturated soilwithin the cone of depression. This induced airflow desorbs volatile contaminants from the surroundingsoil and transports them to the surface where they can be treated and/or discharged. The increased airflowmay also enhance the aerobic biodegradation of certain organic compounds. In addition, the inducedpressure gradients enhance the yield of contaminated groundwater that is also conveyed to the surface forsubsequent treatment and discharge.
MPE is most effective with halogenated VOCs in soil and groundwater. MPE is also effective at sitescontaminated with poorly miscible nonhalogenated VOCs and may be appropriate if expedited cleanup isrequired. However, other technologies, which require a longer time to achieve cleanup such as enhancedbioremediation, may be more cost efficient than MPE for nonhalogenated VOCs.
MPE refers to either two-phase extraction (TPE) or dual-phase extraction (DPE). TPE systems applyhigh vacuum (about 18 to 26 inches of mercury) through a suction pipe lowered into the extraction well toextract groundwater and soil vapor. In comparison, DPE can be operated as a high vacuum system or alow vacuum (about 3 to 12 inches of mercury) system. High vacuum DPE uses a submersible orpneumatic pump to extract groundwater and a high vacuum pump or low vacuum blower to extract soilvapor. Low vacuum DPE uses a submersible or pneumatic pump to extract groundwater and a lowvacuum blower to extract soil vapor. Figures A-12 and A-13 illustrate TPE and DPE systems,respectively. Both systems utilize extraction wells, a vacuum pump or blower, an air-water separator,transfer piping, and aqueous- and vapor-phase treatment units.
Generally, TPE is most effective at low to moderately permeable sites. It is less effective at sites havinghigh permeability because the high groundwater pumping rate needed to dewater the aquifers at thesesites is not well suited to TPE. Low vacuum DPE is suitable at more permeable sites provided the aquifercan be dewatered.

Appendix A Interim Final
Guidance to Optimizing Remedial Action Operation A-29 April 2001
Saturated Zone
Static Water Table
Vadose Zone
Operational Water Table
VacuumPump
WaterPump
ToVaporPhase
Treatment
ToWaterPhase
Treatment
Water FlowWater Flow
SoilVaporFlow
SoilVaporFlow
000059C-KL-RTP
Two-Phase Flow
Extraction Straw
ExtractionWell
Figure A-12. Typical two-phase extraction system.
VacuumFlow
Saturated Zone
Static Water Table
Vadose Zone
Operational Water Table
VacuumPump
WaterPump To
VaporPhase
Treatment
ToWaterPhase
Treatment
Water FlowWater Flow
SoilVaporFlow
SoilVaporFlow
ToTreatment& Disposal
GroundwaterFlow
000058C-KL-RTP
SubmersiblePump
ExtractionWell
Figure A-13. Typical dual-phase extraction system.

Appendix A Interim Final
Guidance to Optimizing Remedial Action Operation A-30 April 2001
A.7.2 Performance Plots
An objective inherent to most MPE systems is hydraulic containment of the contaminants dissolved ingroundwater. Therefore, the effectiveness of MPE systems in preventing plume migration should first beevaluated using the procedures described in Section A.2.2.
It is useful, from an operational standpoint, to plot the rate of vapor and groundwater extraction as shownin Figure A-14. The plot illustrates the following phenomena associated with MPE systems:
§ Groundwater extraction rates decline gradually with time as the affected zone is dewatered andtypically stabilize corresponding to recharge in the area.
§ The rate of vapor extraction gradually increases with time because cones of depression are developed,subsurface drying of soils occurs, and channels for airflow are developed.
Plotting the vapor and water flow rates is useful in determining when steady-state conditions have beenreached in the subsurface. Once such conditions occur, it is possible to quantify system performance interms of mass removal rates and unit mass removal cost.
Figure A-14. Performance plot of a typical multi-phase extraction system.
The effectiveness of MPE systems in removing contaminant mass as vapor can be evaluated by plottingthe contaminant concentrations measured in vapor monitoring points and in the extracted vapor versustime. A contaminant concentration response curve for a soil vapor extraction system was presentedpreviously in Figure A-7. This type of curve is also typical of vapor extraction associated with MPEsystems. The effectiveness of MPE systems in removing contaminant mass from groundwater can beevaluated by plotting the contaminant concentrations measured in the system influent versus time. Similarperformance plots can be prepared for individual monitoring wells by graphing contaminantconcentrations in groundwater samples versus time. A contaminant concentration response curve for agroundwater pump and treat system was presented previously in Figure A-4. This type of curve is alsotypical of groundwater extraction associated with MPE. As is typical of technologies that utilizeextraction as a remedial process, MPE performance plots typically exhibit a tailing effect that ultimatelyreaches asymptotic levels.

Appendix A Interim Final
Guidance to Optimizing Remedial Action Operation A-31 April 2001
A.7.3 Common Operational Problems
MPE essentially combines a soil vapor extraction system with a pump and treat system. Therefore,potential operational problems with MPE are those that are generally common to each of the twotechnologies. Table A-6 summarizes operational problems that are typical of MPE systems.
A.7.4 Common Optimization Strategies
Tracking the incremental costs of removing each additional unit of contaminant mass is a good indicatorof MPE system efficiency, and a means of illustrating that the system has reached the practical economiclimits of its usefulness. There are two ways to decrease the incremental cost per pound of operating MPEsystems:
§ Decrease the operating cost§ Increase the mass removal rate; adjustments should be made in both of these areas to maximize the
cost-effectiveness of the remedial action and to satisfy regulatory criteria for accomplishing the sitecleanup
Optimizing the operation of the MPE system requires that reliable data be collected on a routine basis totrack extraction rates for the system as a whole and possibly the extraction rates of each individual well.The types of information that should be collected include:
§ Concentration of contaminants extracted in liquid and vapor streams prior to treatment§ Concentration of contaminants in liquid and vapor from each well§ Total system vacuum and individual well vacuums§ Liquid flow rates for the overall system§ Vapor flow rate at vacuum pump inlet and from individual wells§ The vacuum radius of influence from vacuum monitoring points§ The hydraulic radius of influence from water levels in monitoring wells
When the rate of mass removal first reaches asymptotic conditions, alternative steps such as pulsing oroperating at a lower, sustained extraction rate should be explored in an effort to restore a higher massremoval rate. If plume migration is a concern, any measures adopted should ensure that hydrauliccontainment is maintained. Should asymptotic levels persist despite operational or system changes,continued operation of the MPE system will generally not produce additional reduction in theconcentration of the constituents. In this case, if further remediation is necessary, implementing eitheranother technology or monitored natural attenuation should be considered. Table A-6 provides additionalguidance on optimizing MPE system operations. Certain recommendations applicable to optimizingpump and treat and SVE systems are also applicable to MPE systems.

Appendix A Interim Final
Guidance to Optimizing Remedial Action Operation A-32 April 2001
Table A-6. Common Multi-Phase Extraction System Operational Problems and Optimization Strategies
Operational Problem Potential Causes Potential Negative Impacts on Performance Optimization Strategies The vacuum radius ofinfluence is insufficient ornot as predicted.
• The air permeability of the soil is lowerthan estimated.
• Short-circuiting is occurring due to thepresence of preferential flow paths.
• The extraction wells have beenincorrectly designed or installed.
• The lower mass removal results inincomplete remediation and increasedremediation time.
• Contaminants located outside theeffective radius of the vacuum are notremoved and preclude reaching cleanupgoals.
• The number of pore volumes of soil gasexchanged in the contaminated area islimited and results in low mass removalthat increases cleanup time.
• Perform a subsurface investigation tofurther characterize the soil permeabilityand preferential flow paths.
• Install additional wells in thecontaminated areas located outside thesystem's treatment zone.
• Replace the incorrectly designed orinstalled wells.
The cone of depression isinsufficient or not aspredicted.
• The groundwater pumping rate is toolow.
• The extraction wells were improperlydesigned, installed, or developed.
• The hydraulic conductivity is higher thanestimated.
• The aquifer will not be dewateredresulting in a lower mass removal ratethat increases cleanup time.
• Failure to maintain hydraulic containmentwill allow the plume to enlarge in sizeand potentially reach receptors. Thelarger area of contamination will alsoresult in increased remediation time andrequire expanding the remediationsystem.
• Increase the groundwater extractionrate.
• Redevelop the poorly developed wells.
• Replace the incorrectly designed orinstalled wells.
• Review and potentially revise theaquifer-testing results. Install additionalextraction wells, as necessary.
The vacuum levels aredecreasing and the airflowrate is increasing.
• Short-circuiting is occurring due topreferential flow paths.
• Short-circuiting is occurring throughshallow or improperly sealed wells.
• A lower rate of mass removal will resultin incomplete remediation or increasedremediation time.
• Evaluate the system for evidence ofshort-circuiting; consider repairing,replacing, or relocating the affectedwells.
The contaminantconcentrations have beenreduced in some but notall extraction wells.
• Treatment may be complete in someareas of the site.
• The airflow to some areas of the site maybe inadequate.
• The continued operation ofnonproductive wells is not cost effective.
• The inadequate airflow will limit massremoval and increase cleanup time.
• Shut off the low producing wells orreduce their pumping rates whileincreasing the rates at the moreproductive wells.
• Evaluate the need to install additionalwells in areas with high levels ofcontamination located outside thesystem's treatment zone.

Appendix A Interim Final
Table A-6. Common Multi-Phase Extraction System Operational Problems and Optimization Strategies (continued)
Guidance to Optimizing Remedial Action Operation A-33 April 2001
Operational Problem Potential Causes Potential Negative Impacts on Performance Optimization Strategies
The contaminantconcentrations in theextracted water and vaporand in the monitoringwells have reachedasymptotic levels and/orrebound to higher levelswhen system operation isterminated.
• The removal of contaminants sorbed tothe soil and aquifer matrix is limited bysite-specific desorption rates.
• The removal of contaminants within lowpermeability zones is diffusion limited.
• The extraction wells are improperlylocated or continue to operate in areaswhere contamination has been reduced.
• The extraction wells are inappropriatelyscreened through zones of lessercontamination.
• Contaminants remain at stagnation pointsthat are not flushed by groundwaterextraction.
• The slower rate of contaminant removaldue to desorption/diffusion limitationswill extend cleanup time.
• "Pulse" the wells or reduce the pumpingrates to correspond to the contaminantdesorption and/or diffusion rates.
• Identify unproductive extraction wellsthrough sampling and decrease theextraction rates while increasing therates at the more productive wells.
• Replace the improperly screened wellswith wells isolated to the contaminatedintervals within the aquifer.
• Rebalance the pumping rates betweenwells to eliminate the stagnation pointsor install additional wells to enhanceflushing through the stagnation points.
Low concentrations ofcontaminants aremeasured in the extractedvapor during systemoperation, but highconcentrations appear invapor monitoring pointswhen the system is shutoff.
• The removal of contaminants sorbed tothe soil is desorption or diffusion limited.
• The vapor extraction rate is higher thannecessary.
• Continued operation at the higherextraction rate may not be cost effective.
• "Pulse" the extraction wells or reducethe vapor extraction rate of a DPEsystem.
The contaminantconcentrations remainhigh despite high massremoval rates.
• An uncontrolled source area is present. • The presence of a continuing source ofcontaminants will prevent cleanup.
• Perform further subsurface investigationto identify additional source areas andpotential free product.
• Identify and control source areasincluding excavation if feasible.
The contaminant plume ismigrating.
• The groundwater extraction rate isinsufficient to establish a capture zone.
• The system is subject to prolonged shutdown.
• The number of extraction wells isinadequate or they are improperlylocated.
• Failure to maintain hydraulic containmentwill allow the plume to enlarge in sizeand potentially reach receptors. Thelarger area of contamination will alsoresult in increased remediation time andrequire expanding the remediationsystem.
• Increase the groundwater extractionrate.
• Increase the system uptime through apreventive maintenance program.
• Install additional wells as necessary.
• Evaluate other technologies.

Appendix A Interim Final
Guidance to Optimizing Remedial Action Operation A-34 April 2001
A.8 Free Product Recovery
A.8.1 System Description
At sites where there has been a release of hydrocarbon (petroleum) products, it is usually necessary torecover free-phase petroleum that is found above the water table. Most petroleum cleanup regulationsrequire the removal of free-phase liquid prior to or concurrent with implementing other soil andgroundwater remediation systems. The remedial objective of free product recovery is to remove theliquid-phase contamination as quickly as possible to prevent continued contamination of the surroundingsoil and groundwater. The various methods used to accomplish this are collectively known as free-phaseproduct recovery.
Different techniques are used to recover free-phase petroleum product. Under shallow water tableconditions, trench systems may be used to intercept and collect the free product as it migrates along thecapillary fringe. Under deeper water table conditions, recovery wells screened across the water table canbe used to recover free product. A wide variety of pumps may be used in the trenches and wells. Totalfluids pumps establish a cone of depression and remove both free product and groundwater. Other pumps“skim” the free product from above the water table without pumping groundwater. These pumps may beused alone or in combination with water table depression pumps that are installed below the free productlens to remove groundwater and establish a cone of depression. Components of a typical free productrecovery system include wells or trenches, pumping equipment, transfer piping, separation equipment,and liquid treatment units. Figure A-15 is an illustration of a free product recovery system showing botha recovery well and interceptor trench.
Oil/WaterSeparator
000057C-KL-RTP
Water Level
SkimmerPump
ExtractionWell
Trench
Free Phase Liquid
ProductProduct
Recovered Oil Product Effluent to Treatment Plant
Figure A-15. Free product recovery system.

Appendix A Interim Final
Guidance to Optimizing Remedial Action Operation A-35 April 2001
Another technique, known as bioslurping, utilizes TPE (Section A.7) to recover the free phase petroleumproduct. Bioslurping combines TPE with bioventing to remove free product and to stimulate the aerobicbiodegradation of petroleum contaminated soil in the unsaturated zone, respectively. In bioslurping, freeproduct is removed from the water table and extracted from the capillary fringe by applying a highvacuum to the recovery wells. The vacuum provides the gradient for product recovery, eliminating theneed for water-level depression, and minimizing the formation of a smear zone in the soil. Bioventing ofthe unsaturated zone occurs simultaneously as enhanced airflow is induced by also withdrawing soil gasthrough the recovery wells. Bioslurping systems utilize a suction pipe that is inserted into each recoverywell to the level of the free product layer. Under the high vacuum, free product, some groundwater, andsoil gas are extracted through the suction tube in a single process stream. Like TPE systems, bioslurpingsystems utilize recovery wells, a vacuum pump, an air-water separator, transfer piping, and aqueous- andvapor-phase treatment trains. Figure A-16 illustrates a typical bioslurping system. A variation ofbioslurping, known as Aggressive Fluid-Vapor Recovery, utilizes a TPE unit mounted on a tanker tankthat can mobilize to recovery wells containing free product.
Figure A-16. Bioslurping system.
A.8.2 Performance Plots
Figure A-17 shows a performance plot for a free product recovery system. The plot illustrates theasymptotic behavior that is typical of the recovery rate for this type of system. Initially, product recoveryis relatively rapid but soon decreases as the amount of recoverable free product is diminished. Ultimately,the recovery rate is reduced to only several gallon per month.

Appendix A Interim Final
Guidance to Optimizing Remedial Action Operation A-36 April 2001
Figure A-17. Performance plot of free product recovery systemat MCAS New River.
Example: The system represented in Figure A-16 was installed at MCAS New River, North Carolina,following the discovery of a release from a JP-5 line. The system, which was installed as an interimmeasure, operated for 1 year and recovered over 4,000 gallons of product. Of the total fuel volumerecovered by the interim system, approximately 70% of the product was recovered in the first quarter ofoperation. Eighty-five percent was removed through the second quarter and nearly 100% of the totalvolume was removed by the end of the third quarter.
A.8.3 Common Operational Problems
Practical application of free product recovery systems has shown that even under favorable site conditionsonly a small percentage of the total product released can ever be recovered. Therefore, it is prudent tohave established criteria for suspending free product recovery to avoid needless, nonproductive operationof the system. If not established by regulation, termination criteria may be based on the product recoveryrate such as, less than 2 gallons recovered per month, or less than 0.02 percent of product recovered towater extracted. Alternatively, the criteria may be based on product thickness such as, less than 0.01 footin recovery and monitoring wells. Following termination, monitoring should be conducted for a specifiedtime period to ensure that product does not re-accumulate in the wells. Monitoring results should becompared to a pre-established thickness that serves as an action level for restarting the system.

Appendix A Interim Final
Guidance to Optimizing Remedial Action Operation A-37 April 2001
Example: A bioslurping system is being used to recover free product at Naval Weapons Station (NWS)Earle, New Jersey. In addition to recommending equipment modifications to improve performance, itwas recommended that an exit strategy be developed to justify turning the system off when recovery wascomplete to the extent practicable. The use of cost data (e.g., cost per gallon of product recovered issignificantly higher than at the beginning of the project) was proposed as the criterion for terminatingoperation of the bioslurping system.
Table A-7 lists operational problems common to free product recovery systems. Many of the problemslisted are related to the general operation and maintenance of the recovery wells and pumps. Table A-8lists operational problems specific to bioslurping systems. Depending on the free product recoverytechnique used, problems included in Tables A-2 (Pump and Treat System), A-6 (Bioventing System),and A-7 (MPE) may also be applicable to free product recovery systems.
A.8.4 Common Optimization Recommendations
Reducing the time required to achieve the cleanup objectives can minimize long-term operating costsassociated with operating a free product recovery system. Tables A-7 and A-8 identify optimizationstrategies for conventional free product recovery systems and bioslurping systems, respectively.Depending on the type of free product recovery system utilized, recommendations presented earlier foroptimizing pump and treat, TPE, and bioventing systems may also be applicable.
Example: At MCAS New River, free product recovery by a single-pump system in the JP-5 Line Area hasbeen sporadic and diminishing in return. By comparison, trial application of Aggressive Fluid-VaporRecovery (AFVR) has shown promising results at less cost. Therefore, it was recommended that theexisting free product recovery system be shut down and the frequency of fluid-level monitoring in therecovery and monitoring wells be increased. An action level for the accumulation of free product in thewells was established and serves as a "trigger" for implementing AFVR.

Appendix A Interim Final
Guidance to Optimizing Remedial Action Operation A-38 April 2001
Table A-7. Common Free Product Recovery System Operational Problems and Optimization Strategies
Operational Problem Potential Causes Potential Negative Impacts on Performance Optimization “Rules of Thumb”
The recovery rate declinesover time.
• The pump membranes or intake screensare clogged.
• Excessive water-level drawdown causesthe product to "smear," or adsorb topreviously saturated soil.
• Biological fouling or mineral buildup ofthe well screens has occurred.
• The lower recovery rate may extendduration of recovery system operation.
• Clean pump membranes or intakescreens.
• Adjust the pumping rate to maintainrecovery while minimizing drawdown.
• Perform well rehabilitation using theappropriate acids and/or biocides.
The design recovery ratehas never been achieved.
• Excessive water-level drawdown causesthe product to "smear," or adsorb topreviously saturated soil.
• The wells are poorly developed.
• The well screens do not intersect thewater table.
• The inability to meet design criteria willextend the duration of recovery systemoperation and allow the free product lensto migrate.
• Adjust the pumping rate to maintainrecovery while minimizing drawdown.
• Redevelop poorly developed wells.
• Replace wells that are improperlyscreened.
The ratio of fuel recoveredto groundwater extractedis low despite the presenceof measurable freeproduct.
• The pumps are improperly placed in therecovery wells.
• The pumping rate is greater thannecessary.
• The treatment and disposal of extraneouswater will increase operating costs.
• Adjust the pumping rate to maintainrecovery while minimizing drawdown.
• Modify skimmer settings to minimizewater production.
• Adjust the placement of pump in well.
• Install additional recovery wells in "hotspots."
• Consider implementing an alternatetechnology such as AggressiveVapor/Fluid Recovery.
The free product lens ismigrating or the radius ofinfluence is limited.
• The pumping rate is not sufficient.
• The system is experiencing prolongedperiods of shutdown.
• The number of recovery wells isinadequate or they are improperlylocated.
• Failure to contain the free product willresult in incomplete product recovery andincrease the duration of system operation.
• Increase the pumping rate in the recoverywells.
• Increase the system uptime through apreventative maintenance program.
• Install downgradient wells or aninterceptor trench to halt productmigration.

Appendix A Interim Final
Guidance to Optimizing Remedial Action Operation A-39 April 2001
Table A-8. Common Bioslurping System Operational Problems and Optimization Strategies
Operational Problem Potential Causes Potential Negative Impacts on Performance Optimization “Rules of Thumb”
The recovery rate declinesover time.
• Biological fouling or mineral buildup ofthe well screens has occurred.
• All recoverable product at some wells hasbeen removed.
• The lower recovery rate may extendduration of recovery system operation.
• The continued operation ofnonproductive wells generates excessgroundwater and is not cost effective.
• Perform well rehabilitation using theappropriate acids and/or biocides.
• Pulse low producing wells based on therate of product recovery.
• Shut off nonproductive wells or considermodifying them to a bioventing mode.
The design recovery ratehas never been achieved.
• The wells are poorly developed.
• The well screens do not intersect thewater table.
• The bottoms of the suction tubes areabove the water table, causinggroundwater mounding, and preventingproduct flow to the wells.
• The inability to meet design criteria willextend the duration of recovery systemoperation and allow the free product lensto migrate.
• Redevelop poorly developed wells.
• Replace wells that are improperlyscreened.
• Measure the depth to water after severaldays of system shutdown and repositionthe bottoms of the suction tubesaccordingly.
The ratio of fuel recoveredto groundwater extractedis low despite the presenceof measurable freeproduct.
• The suction tubes extend below the freeproduct layer in the recovery wells.
• The treatment and disposal of extraneouswater will increase operating costs.
• Excessive water-level drawdown willcause product to "smear," or adsorb topreviously saturated soil.
• Raise the bottoms of the suction tubes tothe level of the water table.
• Monitor the depth to water regularly inareas subject to significant water tablefluctuation and reposition the bottoms ofthe suction tubes accordingly.
The vacuum developed ateach recovery well is low.
• Short-circuiting is occurring.
• The vacuum pump is not properly sized.
• The inability to establish an adequatevacuum limits the pumping of productand the radius of influence of vacuumgradients and soil venting.
• Operate sections of the well system on asequential cycle based on the rate of fuelrecovery.
• Install a properly sized pump.
The free product lens ismigrating or the radius ofinfluence is limited.
• The system is experiencing prolongedperiods of shutdown.
• The number of recovery wells isinadequate or they are improperlylocated.
• Failure to contain the free product willresult in incomplete product recovery andincrease the duration of system operation.
• Increase the system uptime through apreventative maintenance program.
• Relocate and/or add recovery wells.
Product is inadequatelyseparated from the processstream.
• The mixing of fuel, water, and vapor inthe process stream is inherent to theextraction technology.
• The incomplete separation of productfrom the process stream may lead togreater treatment costs, increasedmaintenance requirements, and potentialwastewater discharge violations.
• Review the design and operation of theoil/water separator and other treatmentsystem components.
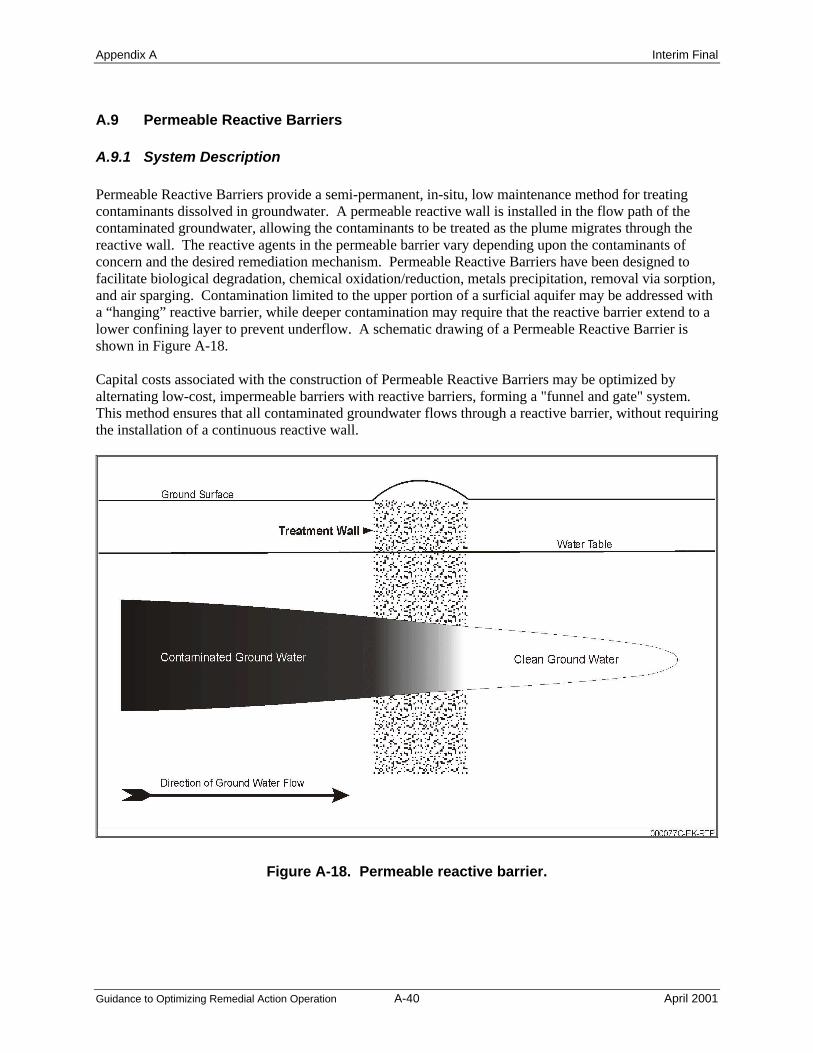
Appendix A Interim Final
Guidance to Optimizing Remedial Action Operation A-40 April 2001
A.9 Permeable Reactive Barriers
A.9.1 System Description
Permeable Reactive Barriers provide a semi-permanent, in-situ, low maintenance method for treatingcontaminants dissolved in groundwater. A permeable reactive wall is installed in the flow path of thecontaminated groundwater, allowing the contaminants to be treated as the plume migrates through thereactive wall. The reactive agents in the permeable barrier vary depending upon the contaminants ofconcern and the desired remediation mechanism. Permeable Reactive Barriers have been designed tofacilitate biological degradation, chemical oxidation/reduction, metals precipitation, removal via sorption,and air sparging. Contamination limited to the upper portion of a surficial aquifer may be addressed witha “hanging” reactive barrier, while deeper contamination may require that the reactive barrier extend to alower confining layer to prevent underflow. A schematic drawing of a Permeable Reactive Barrier isshown in Figure A-18.
Capital costs associated with the construction of Permeable Reactive Barriers may be optimized byalternating low-cost, impermeable barriers with reactive barriers, forming a "funnel and gate" system.This method ensures that all contaminated groundwater flows through a reactive barrier, without requiringthe installation of a continuous reactive wall.
Figure A-18. Permeable reactive barrier.

Appendix A Interim Final
Guidance to Optimizing Remedial Action Operation A-41 April 2001
The passive, in-situ nature of the Permeable Reactive Barrier system yields a system with low operatingand maintenance costs. When designed correctly, the requirements for energy input, equipment repairand manpower are very low when compared to other remedial systems.
A.9.2 Performance Plots
Figure A-19 depicts a conceptual contaminant concentration profile along the flow path through a reactivebarrier. The plot can be prepared from the results of sampling performance-monitoring wells locatedwithin and around the reactive barrier. As contaminants enter the reactive barrier, they are treated via theparticular remediation mechanism selected. The reactive capacity of the wall will be depleted over time.Once the reactive barrier is not able to reduce contaminant concentrations to the required cleanup level,the reactive barrier will need to be replaced. Preferential flow paths may develop within the reactivebarrier resulting in different flow velocities within different parts of the barrier. Consequently, theresidence time of the contaminants within the reactive barrier may represent a range, rather than a valueand a factor of safety should be included in the reactive barrier design.
Potentiometric surface maps should also be prepared from water levels measured in the monitoring wells.The maps should be evaluated for groundwater mounding upgradient of the reactive barrier and for otherhydraulic evidence of changes in groundwater flow that could potentially transport contaminants aroundor beneath the reactive barrier.
Figure A-19. Performance plot of a typical permeable reactive barrier.

Appendix A Interim Final
Guidance to Optimizing Remedial Action Operation A-42 April 2001
A.9.3 Common Operational Problems
Thorough site characterization combined with careful design and construction techniques can minimizethe potential of developing operational problems. Correcting problems that can develop will, by theirnature, require significant effort and resources. Table A-9 lists problems applicable to PermeableReactive Barrier Systems.
A.9.4 Common Optimization Recommendations
A groundwater monitoring system must be installed to track the performance of the Permeable ReactiveBarrier and to identify breakthrough or bypassing of the system. The performance-monitoring program islikely to be a major expense associated with a Permeable Reactive Barrier system. Consequently, thegreatest opportunity to minimize operating costs usually exists in optimizing the monitoring program.Table A-9 identifies optimization strategies for Permeable Reactive Barrier systems.

Appendix A Interim Final
Guidance to Optimizing Remedial Action Operation A-43 April 2001
Table A-9. Common Permeable Reactive Barrier Operational Problems and Optimization Strategies
Operational Problem Potential Causes Potential Negative Impacts on Performance Optimization Strategies
The system performancecannot be accuratelyevaluated.
• The performance-monitoring program isnot adequate.
• An inadequate performance-monitoringprogram may fail to or detect otherpotential problems identified in this table.
• Monitoring wells should be placed:Upgradient and downgradient of thereactive barrier to confirm treatment;Laterally to detect bypassing; and,Within the reactive barrier to warnagainst breakthrough.
The contaminatedgroundwater bypasses thereactive barrier.
• The reactive barrier and/or funnel systemare not wide enough to capture all of thecontaminated groundwater.
• Bypass occurs at the junction betweenfunnel and reactive barrier.
• Contaminated groundwater underflowsthe reactive barrier system
• Untreated contaminants will migratedowngradient allowing the plume toenlarge and potentially reach receptors.The larger area of contamination will alsoresult in increased remediation time andrequire expanding the remediationsystem.
• Extend the reactive or impermeablebarrier to intercept the path of thecontaminated groundwater
• Use grout injection to seal post-installation leaks between the barrierand the funnel walls or the underlyingconfining layer.
The contaminatedgroundwater breaksthrough the reactivebarrier.
• Short-circuiting due to preferential flowpaths is occurring.
• Mineral precipitation or sedimentaccumulation occurs in the reactive celland reduces availability to the activemedia.
• Partially treated contaminants willmigrate downgradient allowing the plumeto enlarge and potentially reach receptors.The larger area of contamination willresult in increased remediation time andrequire expanding the remediationsystem.
• Re-install the reactive barrier.
• Evaluate the use of an alternatetechnology if precipitation or sedimentaccumulation cannot be prevented.
The contaminatedgroundwater breaksthrough the funnel system.
• The permeability of the funnel is greaterthan the design permeability.
• The impermeable barrier is notcontinuous.
• Contaminated groundwater will flowdowngradient allowing the plume toenlarge and potentially reach receptors.The larger area of contamination willresult in increased remediation time andrequire expanding the remediationsystem.
• Upgrade or re-install the impermeablebarrier.
Permeability of thereactive barrier decreases.
• Mineral precipitation or sedimentaccumulation occurs in the reactive celland reduces or prevents the flow ofcontaminated groundwater through thereactive cell.
• The decreased permeability will result ingroundwater mounding and bypassing thereactive barrier.
• Contaminated groundwater will flowdowngradient allowing the plume toenlarge and potentially reach receptors.The larger area of contamination willresult in increased remediation time andrequire expanding the remediationsystem.
• Re-install the reactive barrier.
• Evaluate the use of an alternatetechnology if precipitation or sedimentaccumulation cannot be prevented.

Appendix A Interim Final
Guidance to Optimizing Remedial Action Operation A-44 April 2001
A.10 In-situ Bioremediation of Petroleum Constituents
A.10.1 System Description
Enhanced in-situ bioremediation (EISB) encompasses a group of technologies that increase the growth ofmicroorganisms to enhance biodegradation of organic compounds in the saturated zone. Oxygenrespiration, or aerobic oxidation, is the most effective mode for bioremediating petroleum constituentsand other nonhalogenated organic compounds. In-situ bioremediation of petroleum constituents ingroundwater involves the introduction of oxygen into the saturated zone and may also entail the additionof nutrients and, less frequently, microbial cultures to stimulate degradation. It can be used to remediatepetroleum constituents dissolved in groundwater and sorbed to the aquifer matrix. Common methods forintroducing oxygen are sparging air through injection wells (biosparging); injecting water saturated withair; adding dilute hydrogen peroxide through injection wells or an infiltration trench; and, emplacingoxygen release compound (ORC) in wells or trenches or directly injecting it using direct push technology.Biosparging is a variation of air sparging, which was addressed in Section A.5. Bioventing, discussed inSection A.6, is an in-situ bioremediation technology that is applicable to petroleum constituents in theunsaturated zone.
Figure A-20 illustrates a typical EISB system using an infiltration trench. In the example, groundwater istypically removed using extraction wells, aerated to introduce oxygen, mixed with nutrients, if necessaryand re-injected upgradient of the contaminant plume. Injection wells or, in some cases, infiltrationtrenches are used to re-inject the water. The system operates as a closed loop and water is recirculateduntil cleanup levels are achieved. Extracted water that is not re-injected is treated and discharged.Treatment options for extracted water are discussed separately in Section A.15.2.
000054C-KL-RTP
InfiltrationTrench
MixingTank
WaterTreatment
(ifnecessary)
NutrientsAeration
TransferPump
Effluent
ReintroducedWater
Groundwater Flow Direction
Water Level
ContaminantPlume
ExtractionWell
Figure A-20. In-situ bioremediation system for petroleum constituents.

Appendix A Interim Final
Guidance to Optimizing Remedial Action Operation A-45 April 2001
A.10.2 Performance Plots
A principal objective inherent to most EISB systems is to hydraulically contain the contaminants andprevent their spreading. Therefore, the effectiveness of the EISB systems in preventing plume migrationshould first be evaluated using the procedures described in Section A.2.2.
The effectiveness of EISB systems in restoring groundwater quality should then be evaluated by plottingcontaminant concentrations measured in the extraction wells and monitoring wells over time. During in-situ bioremediation, the concentration of petroleum constituents measured in groundwater will decreaseuntil an asymptotic level is reached. A plot of constituent concentration versus time for in-situbioremediation systems will ultimately resemble a shape similar to that shown in Figure A-4 for pumpand treat systems. Also, as in the case of many pump and treat systems, a plot of constituentconcentration in groundwater may exhibit a rebound to higher levels after operation of the system isterminated.
A.10.3 Common Operational Problems
Provided treatability studies have previously verified that the technology is appropriate for the siteconditions, performance problems with EISB systems for petroleum constituents are generally related tomicroorganism growth requirements and to the delivery system that supplies electron acceptors andnutrients. Table A-10 lists problems common to EISB systems, in general. Table A-1 should also beconsulted to identify hydraulic containment problems potentially associated with closed loop systems thatre-circulate groundwater.
A.10.4 Common Optimization Recommendations
Optimization recommendations for EISB systems should focus on ensuring that oxygen and nutrientlevels are not rate limiting and that the delivery system is operating efficiently. In particular, whenasymptotic conditions are first established the rate and concentration of oxygen and any nutrients beinginjected into the subsurface should be reviewed and adjusted in an effort to restore a higher degradationrate. However, should asymptotic levels persist, continued operation of the in-situ bioremediation systemwill generally not produce additional reduction in the concentration of petroleum constituents. In thiscase, if further remediation is necessary, implementing either another technology or monitored naturalattenuation should be considered. Table A-10 provides guidance on optimizing EISB systems forpetroleum constituents. For closed loop systems that re-circulate groundwater, additionalrecommendations for optimizing hydraulic control are included in Table A-1.

Appendix A Interim Final
Guidance to Optimizing Remedial Action Operation A-46 April 2001
Table A-10. Common Operational Problems and Optimization Strategies of In-situ Bioremediation Systemsfor Petroleum Constituents
Operational Problem Potential Causes Potential Negative Impacts on Performance Optimization Strategy
The contaminantconcentrations have notdeclined in the systeminfluent and in themonitoring wells.
• Source areas or hotspots have not beenadequately controlled.
• High concentrations of petroleumconstituents (>50,000 ppm) may bepresent and toxic to the microorganisms.
• The presence of a continuing source ofcontaminants will prevent cleanup goalsfrom being achieved.
• Microbial growth will not occur andcleanup goals will not be achieved.
• Identify and control source areas andhotspots including excavation, iffeasible
• Evaluate the use of alternatetechnologies, such as physical removalof LNAPL.
The treatment zone isinsufficient or not aspredicted.
• The soil permeability is lower thanestimated.
• The number of injection points is notadequate or they are improperly located.
• Oxygen and nutrients will not reach allcontaminants and cleanup goals will notbe achieved.
• Install additional wells and/or enlargethe infiltration galleries.
Contaminant degradationis slow or incomplete.
• Oxygen distribution to the contaminatedzone is not sufficient to maintain aresidual concentration above 1 mg/L.
• The pH of the groundwater is notbetween 6 and 8.
• Deficiencies of inorganic nutrients suchas nitrogen and phosphate may inhibitmicroorganism growth.
• Low solubility constituents are notbioavailable.
• Preferential air channels are formed byair injection systems causing most of thecontaminants to be bypassed.
• Microbial activity slows and cleanup willbe incomplete or will take longer thanestimated.
• Increase the rate of oxygen injection orevaluate the need for additional wellsand/or infiltration galleries.
• Evaluate the need for nutrient additionand/or pH adjustment.
• Evaluate the use of alternatetechnologies.
• Pulse the air injection wells.
The contaminantconcentrations in thesystem influent and in themonitoring wells havereached asymptotic levelsand/or rebound to higherlevels when pumping isterminated.
• Remediation may only be occurring inthe more permeable units comprising theaquifer.
• The inability to distribute oxygen,nutrients, and amendments to lowpermeability zones will extend cleanuptime or prevent achieving cleanup goals.
• Evaluate the use of alternatetechnologies, including monitorednatural attenuation.

Appendix A Interim Final
Table A-10. Common Operational Problems and Optimization Strategies of In-situ Bioremediation Systemsfor Petroleum Constituents (Continued)
Guidance to Optimizing Remedial Action Operation A-47 April 2001
Operational Problem Potential Causes Potential Negative Impacts on Performance Optimization Strategy Increasingly higherpressure occurs in the re-injection wells and/orinfiltration galleries.
• The wells and/or infiltration gallerieshave become plugged through mineralencrustation or biological fouling.
• Oxygen, nutrients, and amendments willnot reach contaminants and cleanup willnot be achieved or will take longer thanestimated.
• Mechanically rehabilitate affected wellsand/or trenches. Evaluate addinghydrogen peroxide to eliminatebiomass.
• Perform routine cleaning and surging ofthe wells and/or trenches to preventfuture mineral encrustation andbiofouling.
• Install a filtration system to removebiomass and particulates.
• "Pulse" nutrients into the subsurface todiscourage biofouling.
• Replace the affected wells and/ortrenches that cannot be rehabilitated.
The contaminant plumeexpands during theoperation of a liquiddelivery system.
• The extraction well pumping rates are notsufficient to re-circulate groundwaterwithin the treatment zone.
• The number or placement of theextraction wells is not adequate.
• Failure to re-circulate groundwater willallow the plume to enlarge in size andpotentially reach receptors. The largerarea will also result in increasedremediation time and require expandingthe bioremediation system.
• Increase the pumping rates at theextraction wells.
• Install additional extraction wells.
• Expand the bioremediation treatmentzone to include the impacted area.
Appendix A Interim Final
Guidance to Optimizing Remedial Action Operation A-48 April 2001
A.11 In-situ Bioremediation of Chlorinated Compounds
A.11.1 System Description
In-situ bioremediation encompasses a group of technologies that increase the growth of microorganismsto enhance the biodegradation of organic compounds in the subsurface saturated zone. Depending on theparticular technology utilized, in-situ bioremediation can be applied to various chlorinated compounds.These technologies may be used to remediate plumes and restore groundwater quality, to help providecontainment of a chlorinated solvent plume, or to be part of a treatment train downgradient from aprimary cleanup or containment system. Test and evaluation projects are on-going to develop or validateprotocols for applying many of these technologies. Site-specific microcosm/pilot studies are essential toevaluate technical feasibility and to collect design information. Bioaugmentation may be required atsome sites to provide the microbial population necessary for the biological process.
The major biological processes by which chlorinated solvents are degraded include anaerobic reductivedechlorination, also referred to as halorespiration; aerobic cometabolism; and, aerobic or anaerobicoxidation. A brief description of each process follows:
Anaerobic Reductive Dechlorination – A hydrogen source consisting of either H2 or a dissolvedbiodegradable carbon source like lactic acid, molasses, or a slow release formulation like hydrogenrelease compound (HRC) is injected under pressure to initiate the step-wise replacement of chlorineatoms by hydrogen atoms. Microorganisms use the chlorinated solvents as electron acceptors inhalorespiration and may also anaerobically cometabolize the chlorinated solvent. Reductivedechlorination/halorespiration is more effective on the highly chlorinated solvents but will be effective tosome degree on most chlorinated solvents.
Aerobic Cometabolism – Oxygen is used as the electron acceptor in this reaction. Electron donors suchas methane, ethane, propane, butane, toluene, phenol, and ammonia are injected under pressure in gas orliquid form to enhance bacterial growth. Enzymes produced by the microorganisms fortuitously oxidizethe chlorinated solvents. Aerobic cometabolism is effective for a wide range of chlorinated solvents. Itdoes not occur naturally and is ineffective against tetrachloroethene.
Aerobic oxidation – Oxygen is utilized as the electron acceptor and is delivered as air (sparging),peroxide, or Oxygen Release Compound. Microorganisms utilize the chlorinated solvents as a foodsource (electron donor) and gain energy and carbon from its biodegradation. This process is identical tothe process typically used to bioremediate petroleum constituents and is limited to the less-chlorinatedcompounds such as vinyl chloride.
Anaerobic oxidation – In anaerobic oxidation, the chlorinated solvent is again used as the food source bythe microorganisms. However, inorganic compounds other than oxygen serve as the electron acceptors.The process applies to a limited range of chlorinated solvents dependent on specific reducing conditions(i.e., nitrate reducing, sulfate reducing) that occur naturally in the environment and which can be inducedby injecting the inorganic compounds under pressure.
Various types of delivery mechanisms are used, including dual vertical well recirculation, horizontal wellrecirculation, combinations of well-infiltration trench recirculation, direct liquid amendment injectionusing wells or direct push technology, gas amendment injection, and pass-through or reactive cell designs.The primary components of a typical in-situ bioremediation system utilizing injection wells are shown inFigure A-21.

Appendix A Interim Final
Guidance to Optimizing Remedial Action Operation A-49 April 2001
000055C-KL-RTP
MixingTank
NutrientsAmendments
TransferPump
Groundwater Flow Direction
Water Level
ContaminantPlume
Vapor
ExtractionWell
InjectionWell
Figure A-21. In-situ bioremediation system for chlorinated compounds.
A.11.2 Performance Plots
A typical performance plot for reductive dechlorination is shown in Figure A-22. The figure shows thetrend in molar concentrations of parent and daughter compounds in groundwater samples collected from amonitoring well at various times after EISB was implemented. The proportion of the compounds shouldchange over time in a successful application of EISB. In Figure A-21, the concentration oftrichloroethene (TCE) decreases while that of ethene increases. Intermediate compounds such as cis-dichloroethene (cDCE) and vinyl chloride (VC) first increase in concentration before decreasing. Aperformance plot for a system utilizing the aerobic oxidation process was discussed previously inSection A.10.
A.11.3 Common Operational Problems
A number of general problems are commonly associated with in-situ bioremediation systems forchlorinated compounds. As in the case of the previous technology, these problems are related tomicroorganism growth requirements and to the operation of the delivery system. The nature of theproblems may vary from deficiencies in nutrients or substrate to fouling of the injection points.Table A-11 lists operational problems common to in-situ bioremediation systems for chlorinatedcompounds in general. Operational problems specific to each of the four particular bioremediationprocesses described above are beyond the scope of this section. Problems common to systemsspecifically utilizing an aerobic oxidation process are addressed in Section A.10.3.
A.11.4 Common Optimization Recommendations
Optimization recommendations should focus on ensuring that nutrient and substrate levels are not ratelimiting and that the delivery system is operating efficiently. Recommendations for optimizing EISBsystems for chlorinated compounds vary depending on the specific process utilized. The more commonrecommendations include adding substrate to ensure favorable oxidation-reduction conditions, pulsing theinjection of nutrients to minimize biological fouling, or rehabilitating well screens that do become fouled.Table A-10 provides general guidance on optimizing EISB systems for chlorinated compounds.

Appendix A Interim Final
Guidance to Optimizing Remedial Action Operation A-50 April 2001
TCE
VC
Ethene
Time
Co
nce
ntr
atio
n
000
076C
-EK
-RT
P
DCEc
Figure A-22. Performance plot of a typical in-situ bioremediation systemfor chlorinated compounds.

Appendix A Interim Final
Guidance to Optimizing Remedial Action Operation A-51 April 2001
Table A-11. Common Operational Problems and Optimization Strategiesof In-situ Bioremediation Systems for Chlorinated Compounds
Operational Problem Potential Causes Potential Negative Impacts on Performance Optimization Strategies
The contaminantconcentrations have notdeclined in the systeminfluent and in themonitoring wells.
• Source areas or hotspots have not beenadequately controlled.
• High concentrations of constituents arepresent and toxic to the microorganisms.
• The presence of a continuing source ofcontaminants will prevent cleanup goalsfrom being achieved.
• Microbial growth will not occur andcleanup goals will not be achieved.
• Identify and control source areas andhotspots including excavation, if feasible.
• Evaluate the use of alternatetechnologies.
The treatment zone isinsufficient or not aspredicted.
• The soil permeability is lower thanestimated.
• The number of and placement of injectionwells is not adequate.
• Organic substrate, electron acceptors, orother amendments will not reach allcontaminants and cleanup goals will notbe achieved.
• Install additional injection wells.
Contaminant degradationis slow or incomplete.
• The delivery of substrate, electronacceptors, or other amendments is notsufficient to maintain biodegradationrates.
• Redox conditions are not favorable forthe biodegradation process .
• An over abundance of competing electronacceptors is present and inhibits reductivedechlorination.
• Intermediate compounds that are toxic tomicrobes are formed during aerobiccometabolism.
• Preferential channels are formed bysystems that inject gases such ashydrogen and methane causing most ofthe contaminants to be bypassed.
• Biodegradation rates slow and cleanupwill be incomplete or will take longerthan estimated.
• Increase the rate of injection or evaluatethe need for additional wells.
• Evaluate the need for additional ordifferent substrate, electron acceptors, orother amendments.
• Evaluate the need for Eh adjustment.
• For anaerobic and cometabolic systems,pulse substrate to minimize competitiveinhibition of the substrate on thecontaminants.
• Evaluate alternate technologies forpossible implementation.
• "Pulse" the injection wells for gases suchas hydrogen and methane.
The contaminantconcentrations in themonitoring wells havereached asymptotic levelsand/or rebound to higherlevels when pumping isterminated.
• Remediation may only be occurring inmore permeable units comprising theaquifer.
• The inability to distribute organicsubstrate, electron acceptors, or otheramendments to low permeability zoneswill extend cleanup time or preventachieving cleanup goals.
• Evaluate alternate technologies,including monitored natural attenuationfor possible implementation.

Appendix A Interim Final
Table A-11. Common Operational Problems and Optimization Strategiesof In-situ Bioremediation Systems for Chlorinated Compounds (Continued)
Guidance to Optimizing Remedial Action Operation A-52 April 2001
Operational Problem Potential Causes Potential Negative Impacts on Performance Optimization Strategies Increasingly higherpressure in re-injectionwells and/or infiltrationgalleries.
• The re-injection points and/or formationhave become plugged through mineralencrustation, biological fouling, or gasbubbles.
• Organic substrate, electron acceptors, orother amendments will not reachcontaminants and cleanup will not beachieved or will take longer thanestimated.
• Mechanically rehabilitate affected wells.
• Perform routine cleaning and surging ofwells to prevent future mineralencrustation and biofouling.
• Install a filtration system to removebiomass and particulates.
• "Pulse" amendments into the subsurfaceto discourage biofouling.
• Replace affected wells that cannot berehabilitated.
The contaminant plumeexpands during theoperation of a liquiddelivery system.
• The extraction well pumping rates are notsufficient to re-circulate groundwaterwithin the treatment zone.
• The number or placement of theextraction wells is not adequate.
• Failure to re-circulate groundwater willallow the plume to enlarge in size andpotentially reach receptors. The largerarea will also result in increasedremediation time and require expandingthe bioremediation system.
• Increase the pumping rates at theextraction wells.
• Install additional extraction wells.

Appendix A Interim Final
Guidance to Optimizing Remedial Action Operation A-53 April 2001
A.12 In-Situ Chemical Oxidation
A.12.1 System Description
In-situ chemical oxidation is a source reduction technology used to treat soil and groundwatercontaminated with organic compounds. Chemical oxidation of organic contaminants is achieved byinjection of chemicals into the contaminated soil and/or aquifer through injection wells. The chemicalsare then distributed through the affected system by dispersion and diffusion. The chemical oxidationprocess rapidly transforms organic contaminants into less harmful degradation products. The technologyis best suited for treating source areas exhibiting high concentrations of chlorinated compounds. Theprimary components of a typical in-situ chemical oxidation system are shown in Figure A-23.
000051C-KL-RTP
InjectionWell
InjectionWell
InjectionWell
Water Level
ContaminantPlume
Reagent
Reagent
Pump
Pump
ReagentSupply
Figure A-23. In-Situ chemical oxidation treatment system.
The primary in-situ chemical oxidation processes include Fenton’s Reaction and PermanganateOxidation. A description of each in-situ chemical oxidation process follows.
Fenton’s Reaction – Hydrogen peroxide and ferrous iron catalyst are used to initiate the chemicaloxidation process in Fenton’s Reaction. Hydroxide radicals produced from the hydrogen peroxide andferrous iron catalyst oxidize contaminants in an exothermic reaction. The hydroxide radicals are strongnon-specific oxidizers that transform the contaminants into carbon dioxide, water, and other byproducts.
Residual hydrogen peroxide rapidly decomposes to water and oxygen in the subsurface environment, dueto its unstable nature. The soluble iron catalyst added to the aquifer in trace quantities is precipitated.
Permanganate Oxidation – Permanganate oxidation uses potassium permanganate or sodiumpermanganate to initiate the oxidation reaction. Permanganate oxidation is applicable in environmentsnot as favorable for Fenton’s reaction, such as areas characterized by low permeability soil where aslower and longer reaction time is beneficial. Unlike Fenton’s reaction, permanganate acts as a metal-oxoreagent and does not rely on generation of a hydroxyl radical to oxidize organic contaminants.
The ability for most natural aquifer materials to consume permanganate reduces concern that the presenceof permanganate in solution would emerge as a major contaminant problem at most sites. On the other

Appendix A Interim Final
Guidance to Optimizing Remedial Action Operation A-54 April 2001
hand, permanganate oxidation reaction can release metals (e.g., Cr3+) to the aqueous phase atconcentrations that may be of regulatory concern. Other key reaction products include manganesedioxide and carbon dioxide.
A.12.2 Performance Plots
The effectiveness of in-situ chemical oxidation treatment may be determined though performance plots.The data that should be collected for an in-situ chemical oxidation treatment event are described below.
§ Pre-injection sampling. Contaminant concentrations prior to chemical injection will provide thebaseline for source reduction.
§ Injection measurements. The volume and location of chemical injected will provide information onthe system design. Groundwater quality measurements (e.g., pH, alkalinity, oxidation-reductionpotential, and conductivity) will provide an understanding of changing site conditions. Contaminantconcentrations during injection will allow an assessment of system design and treatmenteffectiveness.
§ Post-injection sampling. Contaminant concentrations after treatment will determine the reduction ofthe source area and identify any rebound effects.
The data should be compared with remedial objectives and goals to determine the effectiveness of the in-situ chemical oxidation treatment event. The data will also allow the RPM to assess the conditions tooptimize subsequent treatment events.
Example: In-situ chemical oxidation using the Fenton’s Reagent method has been effectively used toremediate source areas of chlorinated solvents at the NAS Pensacola Industrial Wastewater TreatmentPlant Suldge Drying Bed/Surge Pond site. The remedial objective was to substantially reduceconcentrations of chlorinated hydrocarbons in the source area to ensure natural attenuation would be aneffective remedy. Initial concentrations of TCE historically exceeded 3,000 ug/L in the source area.After two phases of injection, TCE concentrations in the source area ranged from less than 1 ug/L to100 ug/L with no rebound – a reduction of more than 96%. The results of the in-situ chemical oxidationtreatment at NAS Pensacola are shown in Figure A-24.
0
1000
2000
3000
4000
6/15/98 8/14/98 10/13/98 12/12/98 2/10/99 4/11/99 6/10/99 8/9/99 10/8/99 12/7/99 2/5/00
Sample Date
Tri
chlo
roet
hen
e (u
g/L
)
USGS-5
USGS-6
GM-66/66R
Phase I Phase II
Figure A-24. In-situ chemical oxidation treatment at NAS Pensacola.

Appendix A Interim Final
Guidance to Optimizing Remedial Action Operation A-55 April 2001
A.12.3 Common Operational Problems
Chemical oxidation treatments must be conducted under carefully controlled conditions. The existing siteconditions must be evaluated to determine the appropriate use of this process. The effectiveness of in-situchemical oxidation is dependent on site conditions, treatment design, and the consideration of posttreatment effects. While there are differences in the applicability of the different chemical oxidationprocesses, the operational problems associated with these processes are similar. Common operationalproblems related to in-situ chemical oxidation are provided in Table A-12.
A.12.4 Common Optimization Recommendations
Optimization strategies typically cannot be applied during a chemical oxidation treatment event; instead,optimization strategies focus primarily on correcting operational problems for subsequent treatmentevents. Optimization problems resulting from most site condition limitations will require the use of analternative technology. Other optimization recommendations include design modifications and thecombined use of technologies. As these optimization recommendations are generic (i.e., the appropriatealternative technology and the magnitude of design modification must be determined on a site-specificbasis), the expected cost impacts of these recommendations are unknown. Common optimizationstrategies for in-situ chemical oxidation are provided in Table A-12.

Appendix A Interim Final
Guidance to Optimizing Remedial Action Operation A-56 April 2001
Table A-12. Common Oxidation Operational Problems and Optimization Strategies for In-Situ Chemical
Operational Problem Potential Causes Potential Negative Impacts on Performance Optimization Strategies
Contaminant removal isnot complete.
• Too much contamination is present foreffective treatment.
• An insufficient volume of chemicalreagent was injected.
• The reaction proceeds too rapidly due tothe presence of a naturally highconcentration of catalysts.
• The injection wells are improperlylocated.
• The aquifer material interferes with thereaction.
• Oxidation of the contaminants will beincomplete.
• The chemical reagents will not reach thecontaminants.
• The reaction rate is slowed or thechemical reagents are consumed by theaquifer material.
• Increase the volume of chemicalreagents injected.
• Modify the design of the injection wellnetwork.
• Evaluate implementing an alternatetechnology.
• Perform additional site characterization.
The radius of influence islimited.
• The hydraulic conductivity is too low foreffective treatment
• An insufficient volume of chemicalreagent was injected.
• The reaction proceeds too rapidly due tothe presence of a naturally highconcentration of catalysts.
• The aquifer material interferes with thereaction.
• The reaction forms byproducts
• Distribution of the chemical reagents willbe limited.
• Oxidation of the contaminants will beincomplete.
• Chemical distribution limited by rapidreaction
• The chemical reagents are consumed bythe aquifer material
• Plugging and flow diversion The reactionbyproducts will cause plugging and divertflow.
• Increase the volume of chemicalreagents injected.
• Inject additional chemical reagents toinhibit reaction catalyst
• Evaluate the use of an alternatetechnology.
The contaminantconcentrations reboundafter treatment.
• The injection wells are improperlylocated.
• Exothermic reaction effects
• An upgradient source remains untreated.
• The chemical reagents will not treatsources of contamination
• Mounding and mobilization of thecontaminants is occurring.
• Modify the system design.
• Use chemical oxidation in combinationwith other technologies.
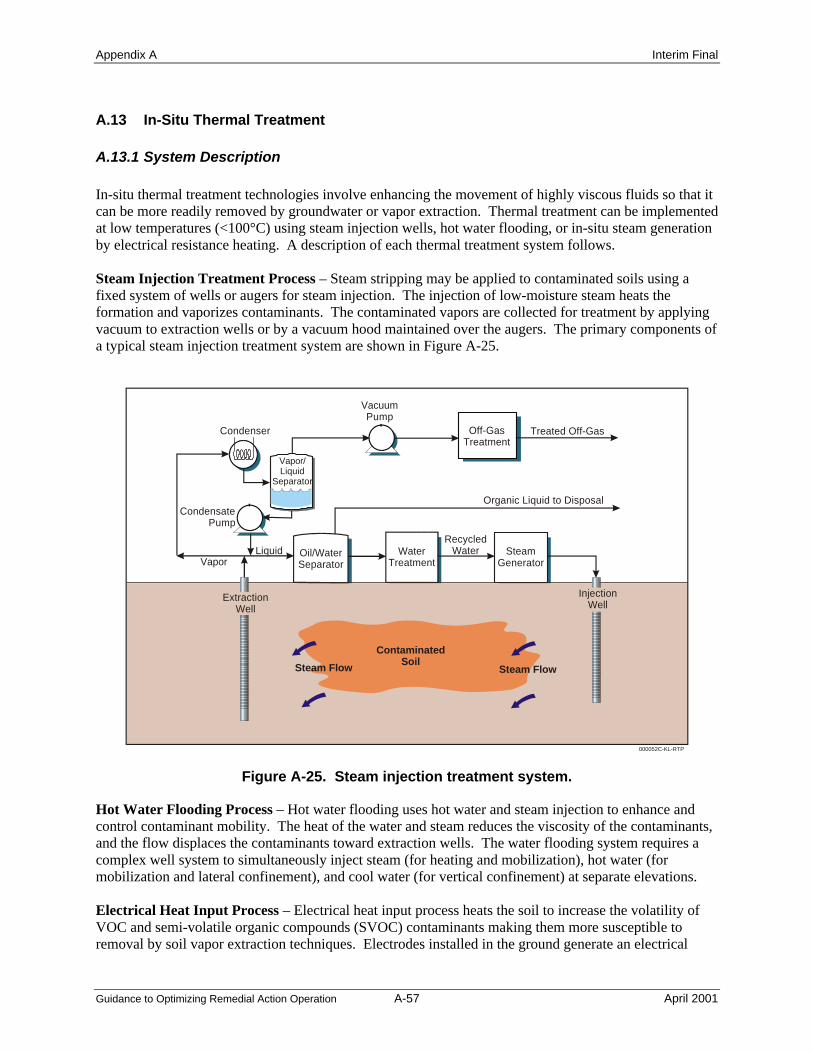
Appendix A Interim Final
Guidance to Optimizing Remedial Action Operation A-57 April 2001
A.13 In-Situ Thermal Treatment
A.13.1 System Description
In-situ thermal treatment technologies involve enhancing the movement of highly viscous fluids so that itcan be more readily removed by groundwater or vapor extraction. Thermal treatment can be implementedat low temperatures (<100°C) using steam injection wells, hot water flooding, or in-situ steam generationby electrical resistance heating. A description of each thermal treatment system follows.
Steam Injection Treatment Process – Steam stripping may be applied to contaminated soils using afixed system of wells or augers for steam injection. The injection of low-moisture steam heats theformation and vaporizes contaminants. The contaminated vapors are collected for treatment by applyingvacuum to extraction wells or by a vacuum hood maintained over the augers. The primary components ofa typical steam injection treatment system are shown in Figure A-25.
Oil/WaterSeparator
000052C-KL-RTP
ContaminatedSoil
Steam Flow Steam Flow
VaporLiquid
Off-GasTreatment
Condenser
VacuumPump
Vapor/Liquid
Separator
WaterTreatment
SteamGenerator
Treated Off-Gas
Organic Liquid to Disposal
RecycledWater
InjectionWell
ExtractionWell
CondensatePump
Figure A-25. Steam injection treatment system.
Hot Water Flooding Process – Hot water flooding uses hot water and steam injection to enhance andcontrol contaminant mobility. The heat of the water and steam reduces the viscosity of the contaminants,and the flow displaces the contaminants toward extraction wells. The water flooding system requires acomplex well system to simultaneously inject steam (for heating and mobilization), hot water (formobilization and lateral confinement), and cool water (for vertical confinement) at separate elevations.
Electrical Heat Input Process – Electrical heat input process heats the soil to increase the volatility ofVOC and semi-volatile organic compounds (SVOC) contaminants making them more susceptible toremoval by soil vapor extraction techniques. Electrodes installed in the ground generate an electrical

Appendix A Interim Final
Guidance to Optimizing Remedial Action Operation A-58 April 2001
current through the soil. The resistance to the flow of current in the soil matrix causes heat to begenerated. Water vapors and volatilized contamination is then removed by soil vapor extraction.
A.13.2 Performance Plots
The effectiveness and efficiency of thermal treatment processes may be determined through performanceplots. The data used to evaluate a thermal treatment system includes contaminant concentrations, thevolume of gas and vapor treated, and cost of system O&M. Performance plots of this data should becompared with remedial performance and cost objectives to determine the effectiveness and efficiency ofthe thermal treatment system.
A typical plot of cumulative mass recovered and concentrations of contaminants (VOCs in this case)versus time is shown in Figure A-26. As shown in the figure, a typical contaminant concentrationresponse curve for in-situ thermal treatment is characterized by initial high contaminant concentrations,followed by declining concentrations, and finally a period of in which concentrations reach asymptoticlow levels. A plot of cumulative contaminant mass removal is a mirror image of the contaminantconcentration response curve. Initially, the cumulative mass of contaminant removed increases rapidly.The initial response is followed by a period during which mass removal rates steadily decrease until,ultimately, asymptotic conditions are reached.
Figure A-26. Performance plot of a typical In-situ thermal treatment system.
A.13.3 Common Operational Problems
Thermal treatment processes must be applied uniformly across the area of contamination. The existingsite conditions must be evaluated to determine the appropriate use of these processes. The effectivenessof thermal treatment processes is primarily dependent of site conditions and treatment system design.Operational problems resulting from improper treatment system design may result in the spread ofcontamination to clean areas. Common operational problems related to thermal treatment are provided inTable A-13.

Appendix A Interim Final
Guidance to Optimizing Remedial Action Operation A-59 April 2001
Table A-13. Common Thermal Treatment Operational Problems and Optimization Strategies
Operational Problem Potential Causes Potential Negative Impacts on Performance Optimization Strategies
The contaminant removalrate is low.
• There is insufficient heating due toheating source inadequacies and/or siteconditions (e.g., high soil moisture).
• The fluid flow is not uniform.
• The permeability of the soil is lower thanestimated.
• The injection wells are not properlylocated.
• There is interference from buriedelectrical conductors
• Low temperatures will not allowcontaminant removal
• The heat will be unevenly distributed
• The heat will be prevented from reachingthe contaminants.
• Increase the size or capacity of the heatsource.
• Relocate and/or modify the injectionwells and recovery system.
• Evaluate use of an alternate technology.
Undesired mobilization ofthe contaminants occurs.
• The injection and recovery system is notproperly designed.
• The contaminants may be spread to cleanareas.
• Relocate and/or modify the injectionwells and recovery system

Appendix A Interim Final
Guidance to Optimizing Remedial Action Operation A-60 April 2001
A.13.4 Common Optimization Recommendations
Optimization of operating problems resulting from site condition limitations will require the use of analternative technology. Design modifications may also be used to optimize thermal treatment systems.Common optimization strategies for thermal treatment systems are provided in Table A-13. Theseoptimization recommendations are generic as the appropriate alternative technology and the magnitude ofdesign modifications must be determined on a site-specific basis.
Appendix A Interim Final
Guidance to Optimizing Remedial Action Operation A-61 April 2001
A.14 Monitored Natural Attenuation
Natural attenuation includes any of a number of biological, chemical, and physical processes that caneffectively reduce contaminant toxicity, mobility, or volume to levels that are protective of human healthand the environment. Some processes such as biodegradation and chemical transformation destroy thecontaminants. Other processes such as dispersion, dilution, sorption, and volatilization simply reduce thecontaminant concentrations.
Natural attenuation processes operate to some degree at all contaminated sites. However, theeffectiveness of the processes in reducing contaminant mass or concentration depends on the type andamount of contaminants present and on the hydrogeology of the site. Natural attenuation is most effectiveagainst petroleum constituents. Aerobic and anaerobic biodegradation are the two main attenuatingmechanisms for petroleum constituents.
Under the proper site conditions, natural attenuation is also effective against chlorinated compounds butthe processes are harder to predict. Incomplete degradation can also produce breakdown products that aremore toxic than the original compounds. The primary attenuating mechanism of chlorinated compoundsis anaerobic reductive dechlorination.
MNA is a cleanup remedy that combines reliance on natural attenuation processes with a programdesigned to monitor the progress of natural attenuation toward achieving cleanup objectives. Theperformance monitoring results are used to calculate the rate at which natural attenuation is occurring,which is compared to the rate predicted from site characterization data.
MNA is gaining acceptance by regulatory agencies as a stand-alone remedy or as a component in a morecomprehensive approach incorporating engineered remediation systems. MNA can usually beimplemented only after source control measures have eliminated the source of contamination. MNA alsorequires a contingency plan in the event that performance monitoring indicates that a cleanup objective(i.e., such as a pre-defined amount of plume spreading) will not be achieved.
In certain situations, MNA can be an effective remedy and the most appropriate way to cleanup acontaminated site. For example, sites contaminated with petroleum constituents are excellent candidatesfor MNA because petroleum constituents are among the compounds most easily destroyed throughbiodegradation. MNA may also be a good option at sites that have undergone some active remediationthat has reduced contaminant concentrations. In particular, MNA may be acceptable to regulators whenactive remediation systems have reached asymptotic conditions and are no longer effective or efficient atreducing contaminant concentrations. However, natural attenuation requires a longer time to achieveremedial objectives and typically requires more extensive site characterization and performancemonitoring than active remedial systems.
The following conditions are an initial indication that natural attenuation is occurring at a site:
§ A contaminant plume that is stable or decreasing in size as documented by monitoring results§ A consistent decreasing trend in contaminant concentrations as documented by monitoring results§ The presence of daughter products, other metabolic byproducts, and process-specific geochemical
indicators
If these conditions occur at a site, the RPM is encouraged to assess and evaluate natural attenuationoccurrence and to develop plans to implement MNA, if it is deemed appropriate and cost effective.

Appendix A Interim Final
Guidance to Optimizing Remedial Action Operation A-62 April 2001
A proposal to implement MNA must first include a demonstration that the natural attenuation processeswill occur at a rate capable of reducing contaminants to acceptable concentrations before reaching areceptor. The demonstration is based on the site's conceptual model and supplemented by an evaluationof nutrients, electron donors, and electron acceptors and by information regarding natural attenuationrates. The data are incorporated in a model that predicts the time-of-travel and the distance and directionthat contaminants will migrate prior to being degraded. Second, the proposal must include a plan formonitoring the progress of natural attenuation. The plan should identify a sufficient number of properlylocated wells for monitoring the constituents of concerns, biodegradation byproducts, and relevantgeochemical parameters. The plan should specify the sampling frequency based on various site-specificfactors including proximity to receptors and constituent time-of-travel estimates. Third, the proposalmust include a contingency plan in the event that performance monitoring indicates that naturalattenuation is not occurring as predicted. The contingency plan should identify the alternative technologyselected and clearly specify the criteria under which it is to be implemented.
Procedures for preparing a demonstration of MNA can be found in a number of readily availabledocuments. These include Technical Guidelines for Evaluating Monitored Natural Attenuation at Navaland Marine Corps Facilities (DON, 1998), Technical Protocol for Implementing Intrinsic Remediationwith Long-Term Monitoring for Natural Attenuation of Fuel Contamination Dissolved in Groundwater(Air Force Center for Environmental Excellence, 1995), and Technical Protocol for Evaluating NaturalAttenuation of Chlorinated Solvents in Groundwater (USEPA, 1998). Tools that may be helpful inevaluating MNA are discussed in Section 9 of this document.

Appendix A Interim Final
Guidance to Optimizing Remedial Action Operation A-63 April 2001
A.15 Above Ground Treatment Systems O&M
There are many liquid phase and vapor phase treatment technologies available for use with remedialsystems. An effluent treatment system can be a combination of many treatment components dependingon the characteristics of the contamination. The best way to optimize the operational cost involved withusing effluent treatment technologies is to:
§ Use the simplest technology possible§ Apply the technology properly§ Modify/change systems as contaminant characteristics/concentrations change§ Look for economical pretreatment processes to reduce maintenance
This section provides an overview of effluent treatment technologies and general guidelines for reducingoperational costs of effluent treatment systems.
A.15.1 Vapor Phase Treatment Technologies
The most common remedial technologies that generate contaminated vapors are SVE systems, MPEsystems, and water treatment systems using air strippers. The appropriate regulatory agency should beconsulted to determine the control level required for the system. Vapor phase treatment technologiesdiscussed in this section include thermal oxidation, catalytic oxidation, and granular activated carbon(GAC). A brief summary of each technology is provided below.
The range of anticipated soil vapor concentrations that will be encountered throughout the project shouldbe considered when selecting a vapor treatment system. Sequential implementation of more than onetreatment system (e.g., catalytic oxidation while high removal rates are occurring followed by activatedcarbon when the concentrations decrease) may be necessary. Table A-14 lists the concentration rangeswhere the technologies are applicable.
Table A-14. Applicability of Vapor Treatment Technologies
Technology Influent Concentration (ppmv)
Thermal oxidation 1,000 to 5,000
Catalytic oxidation 100 to 3,000
Granular activated carbon 1 to 300
Table A-15 identifies optimization guidance for vapor treatment technologies. This guidance can be usedto remedy common problems encountered with these technologies.
Thermal Oxidation – Thermal oxidation is accomplished by direct heating of contaminated vapor streamat elevated temperatures (1,200 to 1,600°F) with resultant production of combustion gases, such as carbondioxide and water vapor. Thermal oxidation units typically are used to treat halogenated and non-halogenated VOCs and SVOCs, and polychlorinated biphenyls (PCB). This technology is often utilizedduring the initial phase of site remediation when contaminant concentrations are high. As concentrationsdrop, power and fuel consumption generally rises dramatically.
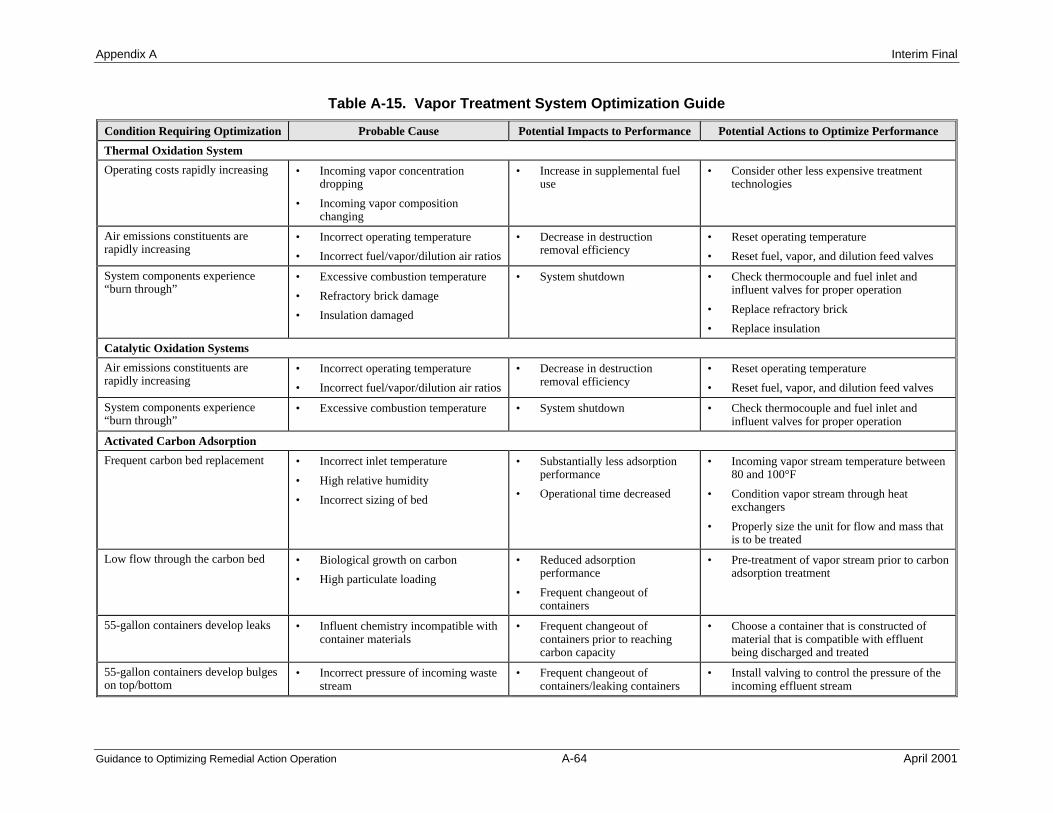
Appendix A Interim Final
Guidance to Optimizing Remedial Action Operation A-64 April 2001
Table A-15. Vapor Treatment System Optimization Guide
Condition Requiring Optimization Probable Cause Potential Impacts to Performance Potential Actions to Optimize Performance
Thermal Oxidation System
Operating costs rapidly increasing • Incoming vapor concentrationdropping
• Incoming vapor compositionchanging
• Increase in supplemental fueluse
• Consider other less expensive treatmenttechnologies
Air emissions constituents arerapidly increasing
• Incorrect operating temperature
• Incorrect fuel/vapor/dilution air ratios
• Decrease in destructionremoval efficiency
• Reset operating temperature
• Reset fuel, vapor, and dilution feed valves
System components experience“burn through”
• Excessive combustion temperature
• Refractory brick damage
• Insulation damaged
• System shutdown • Check thermocouple and fuel inlet andinfluent valves for proper operation
• Replace refractory brick
• Replace insulation
Catalytic Oxidation Systems
Air emissions constituents arerapidly increasing
• Incorrect operating temperature
• Incorrect fuel/vapor/dilution air ratios
• Decrease in destructionremoval efficiency
• Reset operating temperature
• Reset fuel, vapor, and dilution feed valves
System components experience“burn through”
• Excessive combustion temperature • System shutdown • Check thermocouple and fuel inlet andinfluent valves for proper operation
Activated Carbon Adsorption
Frequent carbon bed replacement • Incorrect inlet temperature
• High relative humidity
• Incorrect sizing of bed
• Substantially less adsorptionperformance
• Operational time decreased
• Incoming vapor stream temperature between80 and 100°F
• Condition vapor stream through heatexchangers
• Properly size the unit for flow and mass thatis to be treated
Low flow through the carbon bed • Biological growth on carbon
• High particulate loading
• Reduced adsorptionperformance
• Frequent changeout ofcontainers
• Pre-treatment of vapor stream prior to carbonadsorption treatment
55-gallon containers develop leaks • Influent chemistry incompatible withcontainer materials
• Frequent changeout ofcontainers prior to reachingcarbon capacity
• Choose a container that is constructed ofmaterial that is compatible with effluentbeing discharged and treated
55-gallon containers develop bulgeson top/bottom
• Incorrect pressure of incoming wastestream
• Frequent changeout ofcontainers/leaking containers
• Install valving to control the pressure of theincoming effluent stream

Appendix A Interim Final
Guidance to Optimizing Remedial Action Operation A-65 April 2001
Catalytic Oxidation – Catalytic oxidation thermally oxidizes the contaminated vapor stream by passingthe vapor over an inert catalyst bed, which promotes the oxidative destruction of the contaminants tocombustion gases. The catalyst allows the reaction to occur at much lower temperatures (600 to 1000°F)than during normal combustion processes, which decreases need for supplemental fuel. Because of thecatalyst costs, catalytic oxidizers usually will have a higher capital cost than a thermal oxidizer, althoughthe operating costs are usually lower.
As with thermal oxidation, catalytic oxidation can be used to treat halogenated and non-halogenatedVOCs and SVOCs, and PCBs. A key consideration for catalytic oxidation systems, however, is thepotential for catalyst poisoning or erosion. Materials such as halogens, heavy resins, or heavy solventscan poison or mask the catalyst material, thus requiring either periodic cleaning or premature replacementof the catalyst bed. Vapor streams containing high particulate levels can have a similar effect by erodingthe catalyst material.
Granular Activated Carbon – GAC treatment is performed by passing a contaminated vapor streamthrough one or more vessels containing activated carbon, which removes contaminants from the vapor byadsorption. GAC is used because its high surface area allows for significant adsorption over a wide rangeof concentrations and chemicals. The amount of adsorption is determined by the chemical, temperature,and pressure at which the adsorption takes place. GAC is used to treat halogenated and non-halogenatedVOC and SVOC and PCBs; GAC has limited adsorption capacity for ketones and generally pooradsorption of volatile alcohols.
A.15.2 Liquid Phase Treatment Technology
An extracted water treatment system can be a combination of many treatment components, depending onthe characteristics of the contamination. The most effective treatment technology during the early stagesof the remedial action may not be the most cost-effective during latter stages. In fact, the question ofwhether any treatment is needed should be periodically examined as the remediation progresses. Liquidphase treatment technologies discussed in this section include air stripping, GAC, ultraviolet oxidation,and metals precipitation. A brief summary of each technology is provided below.
Table A-16 identifies the optimization guidance for liquid treatment technologies. Optimization ofpretreatment methods commonly associated with these treatment technologies is also included. Thisguidance can be used to remedy common problems encountered with these technologies.
Air Stripping – Air stripping is used to separate contaminants from groundwater by increasing thesurface area of the contaminated water and exposing it to air. Types of aeration methods include packedtowers, diffused aeration, tray aeration, and spray aeration. Air stripping is used to remove halogenatedand non-halogenated volatile organic compounds, and is less effective for contaminants with low vaporpressure of high solubility.
Granular Activated Carbon – Liquid-phase GAC treatment is performed by pumping groundwaterthrough one or more vessels containing activated carbon, which removes contaminants from the waterstream by adsorption. Liquid-phase GAC is especially effective for polar compounds and can be used totreat halogenated and nonhalogenated VOCs, SVOCs, and PCBs. Carbon adsorption is effective forremoving contaminants at low concentrations (less that 1 mg/L) from water at nearly any flowrate, andfor removing higher concentrations of contaminants from water at low flowrates.

Appendix A Interim Final
Guidance to Optimizing Remedial Action Operation A-66 April 2001
Table A-16. Liquid Treatment System Optimization Guide
Condition Requiring Optimization Probable Cause Potential Impacts to Performance Potential Actions to Optimize PerformancePretreatment SystemsFree-phase oil is enteringgroundwater treatment system
• Oil/water separator is notfunctioning correctly
• Clay/anthracite filter vessel isclogged
• Reduced treatment efficiency oftreatment system
• Clean oil/water separator• Adjust the skimming or coalescing plates in
the oil/water separator• Replace the clay/anthracite filter vessel
Suspended solids are enteringtreatment system components
• Filters are clogged, torn, orundersized
• Creates backpressure on treatmentequipment or clog treatmentequipment, which will make thetreatment less efficient
• Resize bag filters to accept a higher flow• Replace the bag filter with a new one• Consider placing the bag filters in series for
greater efficiency. Use large pore size on thefirst filter with decreasing pore size onsubsequent filter(s)
Suspended solids are being“created” in the treatment systemand clogging system components
• Oxidation of metals (iron ormanganese)
• Scaling due to carbonates
• Premature plugging or coating oftubing, piping, vessel walls, packingmaterials, filters, and carbon
• Use a water softener or adjust the pH• Chelate metals using an oxidation tank• Use a sequestering agent
Air Stripping SystemFlooding of stripping tower • Tower packing is clogged • Loss of treatment efficiency due to
short circuiting or clogging• Clean tower packing and install pretreatment
equipment (filters or oxidation tanks)• Use sequestering agent• Check influent flow rate into tower
Effluent concentration from towersuddenly or slowly rises over time
• Tower packing is clogged• Air blower is not functioning
correctly or duct is leaking
• Loss of treatment efficiency • Clean tower packing and install pretreatmentequipment
• Adjust air/water ratio to correspond to thedesign concentrations of contaminants for theremoval efficiency
Activated Carbon AdsorptionEffluent flow and pressure dropssuddenly
• Carbon media is clogged • Loss of treatment efficiency • Replace carbon media• Install pretreatment filters prior to carbon
mediaPressure vessels leak or bulge • Carbon vessel designed for low
flows• Shutdown of treatment system • Replace with fiberglass vessels that are
designed for higher flow ratesSignificant increase in effluentconcentrations
• Carbon media is “spent” • Loss of treatment efficiency • Replace spent carbon• Install pretreatment units prior to carbon
vesselsUltraviolet-OxidationSignificant increase in effluentconcentrations
• High turbidity causesinterference
• Fouling of quartz sleeves• High concentrations of
chemical additives
• Loss of treatment efficiency • Install pretreatment units prior to UV-oxidation system
• Adjust chemical additive concentrations

Appendix A Interim Final
Table A-16. Liquid Treatment System Optimization Guide (Continued)
Guidance to Optimizing Remedial Action Operation A-67 April 2001
Condition Requiring Optimization Probable Cause Potential Impacts to Performance Potential Actions to Optimize PerformanceMetal PrecipitationIncrease in total residual metalsconcentration
• Presence of organic andinorganic species (other thanhydroxide) resulting in theformation of soluble specieswith metal ions increasing totalresidual metals concentration(particularly cyanide, ammonia,EDTA, and carbonate)
• Process stream temperaturevariations
• Insufficient detention times(i.e., rapid mix, floc, settling,filtration)
• Improper coagulant dosing• Presence of multiple metal
species• Improper pH adjustment• Improper rapid mix and
flocculation mixing rates
• Decrease in treatment efficiency• Deviations between calculated and
observed values of metal removal
• Conduct periodic jar tests to determineoptimal chemical selection and dosing, andoptimal overflow rates
• Modify rapid mix and flocculation mixingrates based on jar test data
Increase in quantity and moisturecontent of sludge
• Improper reagent (i.e.,coagulant, flocculant, caustic,acid) dosing
• Improper mixing rates
• Increase in sludge handling costs • Conduct periodic jar tests to ensure optimalchemical selection and dosing
• Modify rapid mix and flocculation mixingrates based on jar test data
Decrease in settling and filtrationefficiencies
• Excess sludge accumulation infiltration and settling units
• Decrease in treatment efficiency • Perform O&M on settling and filtration unit(e.g., remove sludge)

Appendix A Interim Final
Guidance to Optimizing Remedial Action Operation A-68 April 2001
Ultraviolet-Oxidation – Ultraviolet (UV) light is a destruction process that photochemicallyoxidizes organic contaminants in wastewater. The oxidation reactions are achieved throughirradiation with UV light supplemented by the addition of chemical oxidizing compounds toproduce active hydroxyl radicals that breakdown contaminants to carbon dioxide, water and salts.Ultraviolet-oxidation can be used to treat any organic contaminant that is reactive with hydroxylradicals, including halogenated and non-halogenated VOCs, SVOC, PCBs, and ordnancecompounds.
Metals Precipitation – Metals precipitation involves adding a chemical precipitant to extractedgroundwater to remove inorganic contaminants. The dissolved metals are converted to aninsoluble form by a chemical reaction between the soluble metal compounds and the precipitant.The resultant suspended solids are separated out by settling in a clarifier. Chemical precipitantsinclude calcium hydroxide (lime), sodium hydroxide, ferrous sulfide, sodium sulfide, sodiumhydrosulfide, sodium carbonate, calcium carbonate, and sodium borohydride. Target contaminantgroups are heavy metals.
A.15.3 Discharge and Disposal Options
Treated water disposal/discharge alternatives can include:
§ Discharge to local publicly owned treatment works (POTW)§ Discharge to surface water§ Reinjection§ Other (i.e., irrigation, industrial reuse such as dust control, or use as washwater)
The implementation of these options is highly site-specific, and should be evaluated on a site-specific basis.
A.15.4 Remedial System Decommissioning
After decommissioning, the entire remedial system or its components may be reused or salvaged.Ideally, the entire remedial system or its components would be reused at another remedial site onthe given installation, used for another purpose at the installation, or used at another DOD site orinstallation. A less desirable option is to sell components for salvage value.
Equipment Reuse – RPMs should consider the applicability of existing equipment to their site.The transfer of remediation equipment between sites would result in significant cost savings, aswell as provide other benefits. The following steps should be conducted to determine whether aparticular remedial system can be reused:
§ Maintain an Accurate Remedial System Inventory. The inventory should include pertinentdetails of process equipment, such as discharge pump sizes, blower sizes, treatment systemtype, maximum and minimum system throughput, and instrumentation provided with thesystem. This information will allow RPMs at other installations to determine whether aparticular system will meet the needs of their particular site.
§ Maintain a Current Site Closeout Schedule. If a remedial system is determined to be suitablefor use at another site or installation, the remedial system must be available for use at the

Appendix A Interim Final
Guidance to Optimizing Remedial Action Operation A-69 April 2001
required time. Knowing when a suitable system is available for reuse can allow RPMs toproactively negotiate a schedule extension if reuse of a system can save significant funding.
§ Inform Other Parties of Equipment Availability and Schedule. Other parties should beinformed of equipment inventory and availability. Facilities and engineering support groupsmay identify a need for the remedial system or system components.
Equipment Salvage – If equipment reuse options are not identified, equipment salvage should bepursued. The Defense Reutilization and Marketing Office (DRMO) is usually the appropriateagency to coordinate equipment resale. The DRMO temporarily stores excess materials beforereutilization or public sale. Because DRMOs are permitted hazardous materials/waste treatment,storage, and disposal facilities (TSDF), they could appropriately handle any contaminatedequipment and possibly determine appropriate reuse or disposal options.
Interim Final
Guidance to Optimizing Remedial Action Operation April 2001
Appendix B
Summary of Remedial Action Operation Optimization Case Studies

Appendix B Interim Final
Guidance to Optimizing Remedial Action Operation B-1 April 2001
FINAL
Marine Corps Base Camp LejeuneOperable Units 1 and 2
Remedial Action Operation (RAO) Optimization Case Studies
Contract No. N47408-99-C-7017
Prepared for:
Department of the NavyNaval Facilities Engineering Service Center (NFESC)
1100 23rd AvenuePort Hueneme, CA 93043-4370
Prepared by:
Radian International1600 Perimeter Park Drive
Morrisville, NC 27560
January 2000

Appendix B Interim Final
Guidance to Optimizing Remedial Action Operation B-2 April 2001
EXECUTIVE SUMMARY
ES.1 Purpose of the Case Study Report
This case study report includes an effectiveness evaluation for three separate groundwaterpump and treat (P&T) systems located at Marine Corps Base (MCB) Camp Lejeune, NorthCarolina. The systems evaluated within this report are the North and South P&T systems withinOperable Unit 1 (OU1), and the Operable Unit 2 (OU2) P&T system. The primary purpose of theevaluation is to assess the ongoing remedial action operation (RAO) program for these threesystems, and provide recommendations resulting in attainment of site remedial action objectivesand ultimate closure for optimal life cycle costs. For the purposes of this report, optimal isdefined as the minimum cost without sacrificing data quality or decision-making.
This project was conducted for the Naval Facilities Engineering Service Center (NFESC)under a Broad Agency Announcement (BAA) contract. NFESC is leading a Department of theNavy (DON) working group in developing guidance on optimizing monitoring and remedialaction operations for Navy/Marine Corps activities. This working group is comprised ofmembers from NFESC, Atlantic Division (LANTDIV), other Engineering FieldDivisions/Activities (EFD/A), Naval Facilities Engineering Command (NAVFAC), and Chief ofNaval Operations (CNO).
ES.2 Optimization Approach
The approach employed in this RAO optimization project to achieve site closeout foroptimal life cycle cost is outlined in the steps below. A site visit at MCB Camp Lejeune wasconducted from April 27-30, 1999 to gather the required information for this report.
• Gain a detailed understanding of the remedial decision-making framework, remedialaction objectives, and site closure criteria for each site.
• Describe and understand past investigation and remedial actions taken to date, andhow they have affected the current evolution and understanding of the conceptual sitemodel.
• Describe the current conceptual site model, i.e., geology, pathways, receptors, andcontaminants of concern (COC).
• Gain an understanding of other remedial actions and associated data at MCB CampLejeune having potential applicability at OU1 and OU2.
• Describe the system design basis and operational objectives for the P&T systems,including extraction well network, at each operable unit.
• Baseline the past and current cost and operational data for each system.
• Compare the cost and performance data with the system design basis.

Appendix B Interim Final
Guidance to Optimizing Remedial Action Operation B-3 April 2001
• Assess the need for additional system operation.
• Provide the future decision strategy framework and prioritized recommendations toimprove total system performance and achieve site remedial action objectives foroptimal cost.
ES.3 Operable Unit 1 (OU1) North and South System Descriptions
The OU1 North and South P&T systems were evaluated over an operating period ofapproximately 2.5 years (September 1996 to March 1999). The treatment systems are of identicaldesign and include oil-water separation, followed by air stripping, granular activated carbon(GAC), and discharge to the sanitary sewer system. The systems were designed to accommodateinfluent flowrates up to 80 gallons per minute (gpm). The extraction well fields consist of threeactive wells for OU1 North and seven active wells for OU1 South. Extraction wells wereexpected to produce up to 5 gpm each.
Remedial action objectives for both systems are covered under a Record of Decision(ROD) signed in 1994 which specifies plume capture and treatment to a combination of federalMaximum Contaminant Levels (MCL), State of North Carolina (NC) standards, and risk-basedstandards. The point of compliance for these treatment objectives is throughout the contaminatedplume at OU1. Current total VOC contaminant levels in the influent are 200 to 500 parts perbillion (ppb).
ES.4 OU1 North and South System Performance Summary
The technical and cost effective performance for the North and South systems for theperiod from September 1996 to March 1999 has been poor. It also appears that both the Northand South plumes have been stable for several years and are no longer migrating. The overallperformance for both systems is summarized below:
• Low hydraulic conductivity of the shallow aquifer has resulted in influent treatmentplant flowrates of less than 9% of design capacity.
• Combined total mass removal for both systems has been limited to approximately23 pounds in 2.5 years of operation.
• The average cost per pound of contaminant removed has been approximately$30,000.
• There is little evidence to suggest that either system can achieve ROD-specifiedcleanup objectives throughout the aquifer in their current configuration and mode ofoperation.
• Both systems have a history of significant maintenance problems and associateddowntime.

Appendix B Interim Final
Guidance to Optimizing Remedial Action Operation B-4 April 2001
ES.5 OU1 North System Recommendations
Based on the information reviewed and presented in Section 3.0 of this report, severalprimary recommendations can be made for the OU1 North P&T system. Completeimplementation of these recommendations will likely require an Explanation of SignificantDifference (ESD) or a ROD amendment to the current OU1 ROD.
1. Perform a monitored natural attenuation (MNA) assessment on the OU1 North plume,according to established Department of Defense (DOD) and EnvironmentalProtection Agency (EPA) protocols.
2. In parallel with recommendation 1, continue to operate the OU1 North P&T systemon an interim basis until contaminant mass removal from extraction wells RW-10, 11,and 12 reach asymptotic levels.
3. Shut down the OU1 North system upon achievement of objectives inrecommendation 2.
4. Should state guidelines permit risk assessment in the future, consider revising thebaseline human health risk assessment assumptions and associated cleanup levelcalculations to reflect an industrial future land use category as the most probablescenario.
5. If MNA does not prove feasible as the long-term remedy for OU1 North, considerapplying remedial options currently in use at Hadnot Point Fuel Farm (HPFF), alongwith enhanced biodegradation remedies. These alternative remedies could include airsparging/soil-vapor extraction (AS/SVE) and application of hydrogen releasingcompound (HRC).
6. Leverage the performance assessment within this report, as well as the data andinformation from implementation of the above recommendations, as the foundationfor the upcoming five-year review at OU1.
In addition, detailed recommendations are provided to help optimize the OU1 North P&T systemduring its interim operation period. Several of these recommendations may also be applicable forfuture remedial actions. All recommendations for the extraction and monitoring well networkand the aboveground treatment trains for the OU1 North P&T system are summarized inTable 4-1.
ES.6 OU1 South System Recommendations
Based on the information reviewed and presented in Section 5.0 of this report, severalprimary recommendations can be made for the OU1 South P&T system. As with OU1 North,complete implementation will likely require an ESD or ROD amendment to the current OU1ROD.
1. Shut down the operation of the OU1 South system at the earliest opportunity.Continued active pumping is difficult to justify given the low permeability of the

Appendix B Interim Final
Guidance to Optimizing Remedial Action Operation B-5 April 2001
aquifer, current total VOC concentrations, and the likelihood of passive naturalattenuation processes already at work.
2. In parallel with recommendation 1, perform a monitored natural attenuation (MNA)assessment on the OU1 South plume according to established DOD and EPAprotocols. Data gaps to better define the extent of the plume in three dimensions canbe filled as part of the MNA assessment.
3. Should state guidelines permit risk assessment in the future, consider revising thebaseline human health risk assessment assumptions and associated cleanup levelcalculations to reflect an industrial future land use category as the most probablescenario.
4. If MNA does not prove feasible as the long-term remedy for OU1 South, considerapplying remedial options currently in use at HPFF, along with enhancedbiodegradation remedies. These alternative remedies could include AS/SVE andapplication of hydrogen releasing compound (HRC).
5. Leverage the performance assessment within this report, as well as the data andinformation from implementation of the above recommendations, as the foundationfor the upcoming five-year review at OU1.
In addition, recommendations are provided to optimize the OU1 South P&T system as it iscurrently operating if system shutdown cannot be immediately implemented. Recommendationsare summarized in Table 6-1.
ES.7 OU2 System Description
The OU2 P&T system was evaluated over an operating period of approximately 2 years(January 1997 to March 1999). There are two, co-located aboveground treatment trains for thissystem; one for the shallow aquifer zone, and one for the combined flow of both the shallow anddeep aquifer zones. Water from the shallow aquifer is first treated for iron removal (mix tank,clarifier, and sludge thickening) prior to being combined with extracted groundwater from thedeep aquifer zone. The combined flow is treated via air stripping, filtration, and granularactivated carbon, and then discharged to Wallace Creek. The system capacity flow is 500 gpm.The shallow zone and deep zone extraction well fields consist of six and four wells, respectively.
Remedial action objectives for the system are covered under a Record of Decision (ROD)signed in September 1993 which specifies plume capture and treatment to federal MCLs or Stateof North Carolina (NC) standards, whichever is more stringent. The point of compliance forthese treatment objectives throughout the contaminated plume at OU2. Influent volatile organiccompounds (VOC) contaminant levels at OU2 average 21 parts per million (ppm), indicating thepresence of dense non-aqueous phase liquids (DNAPL) in the subsurface aquifer.

Appendix B Interim Final
Guidance to Optimizing Remedial Action Operation B-6 April 2001
ES.8 OU2 System Performance Summary
The performance of the OU2 treatment system from both mass removal and cost-effectiveness standpoints has been good. Average flow into the system is 60% of the designcapacity of 500 gpm, and more than 40,000 pounds of contamination have been removed fromthe aquifer at an average cost of only $49 per pound. However, the likely presence of DNAPLcoupled with the existence of several critical data gaps, make it highly unlikely that OU2 can beremediated to ROD-specified cleanup levels with existing technology. The data gaps and overallperformance of the OU2 system are summarized below:
• The system has cost-effectively removed significant contaminant mass from theaquifer (more than 40,000 pounds at $49 per pound)
• The vertical and lateral extent of contamination in both the shallow and deep aquiferzones is unknown
• DNAPL source areas require better delineation and definition
• Data to support natural attenuation and passive biodegradation processes for thedissolved phase portions of the plume has not been collected for the shallow and deepaquifer zones
• Plume capture in the shallow zone cannot be confirmed with the current monitoringnetwork
• Due to a dilution effect, the five downgradient extraction wells in the shallow zoneare reducing the mass removal effectiveness of the extraction network
• Plume capture in the deep zone is likely but the hydraulic gradients are insufficient toprevent further downward migration of DNAPL
• Mass removal from the deep aquifer zone may be diluted due to wells being screenedover most of the well depth, instead of being targeted at zones containing the highestconcentrations of contaminants
ES.9 OU2 Recommendations
The primary recommendation for OU2 is to pursue separate but integrated remedialactivities for the DNAPL source areas and dissolved phase portions of the plume, both in theshallow and deep aquifer zones. The initial phase in this approach requires that existing data gapsbe filled to the extent practicable. In particular:
• The extent of contamination in the shallow and deep zones should be delineated,including the DNAPL source areas

Appendix B Interim Final
Guidance to Optimizing Remedial Action Operation B-7 April 2001
• Natural biodegradation data in the wetlands area of Wallace Creek, and monitorednatural attenuation data for the dissolved phase portions of the plume should becollected
• Discussions should begin with the regulatory agencies to establish alternateconcentration limits (ACL) for groundwater discharging to Wallace Creek
For the shallow zone, additional recommendations include monitoring the mass removalfrom each extraction well, and installing additional extraction wells in the vicinity of the currenthot spot. For the deep zone, other recommendations include the use of diffuser sampling bags todelineate the vertical distribution of contamination, and performing additional investigations tobetter define stratigraphy and contaminant extent. Based on an analysis of this data, additionaldeep zone extraction wells may be required.
For the aboveground treatment plant, recommendations include:
• Modifying the National Pollution Discharge Elimination System (NPDES) permit toallow bypass of the GAC polishing step during normal operation
• Replacing the existing polymer feed pump
• Monitoring mass removal from individual extraction wells to optimize operation andplacement of future wells

Appendix B Interim Final
Guidance to Optimizing Remedial Action Operation B-8 April 2001
FINAL
Marine Corps Base Camp LejeuneCampbell Street Fuel Farm
Remedial Action Operation (RAO) Optimization Case Studies
Contract No. N47408-99-C-7017
Prepared for:
Department of the NavyNaval Facilities Engineering Service Center (NFESC)
1100 23rd AvenuePort Hueneme, CA 93043-4370
Prepared by:
Radian International1600 Perimeter Park Drive
Morrisville, NC 27560
January 2000
Appendix B Interim Final
Guidance to Optimizing Remedial Action Operation B-9 April 2001
EXECUTIVE SUMMARY
ES.1 Purpose of the Case Study Report
This case study report includes an effectiveness evaluation for the Campbell Street FuelFarm (CSFF) groundwater pump and treat (P&T) system located at Marine Corps Air Station(MCAS) New River, which is co-located with Marine Corps Base (MCB) Camp Lejeune, NorthCarolina. The primary purpose of the evaluation is to assess the ongoing remedial actionoperation (RAO) program for this system, and provide recommendations resulting in attainmentof site remedial action objectives and closure for optimal life cycle costs. For the purposes of thisreport, optimal is defined as the minimum cost without sacrificing data quality or decision-making.
This project was conducted for the Naval Facilities Engineering Service Center (NFESC)under a Broad Agency Announcement (BAA) contract. NFESC is leading a Department of theNavy (DON) working group in developing guidance on optimizing monitoring and remedialaction operations for Navy/Marine Corps activities. This working group is comprised ofmembers from NFESC, Atlantic Division (LANTDIV), and other Engineering FieldDivisions/Activities (CEFD/A).
ES.2 Optimization Approach
The approach employed in this RAO optimization project to achieve site closure foroptimal life cycle cost is outlined below:
• Gain a detailed understanding of the remedial decision-making framework, remedialaction objectives, and site closure criteria for each site.
• Describe and understand past investigation and remedial actions taken to date, andhow they have affected the evolution and understanding of the conceptual site model(CSM).
• Describe the current conceptual site model, i.e., geology, pathways, receptors, andcontaminants of concern (COC).
• Gain an understanding of other remedial actions and associated data at MCB CampLejeune having potential applicability at CSFF.
• Describe the system design basis and operational objectives for the P&T system,including the extraction trench and well network.
• Baseline the past and current cost and operational data.
• Compare the cost and performance data with the system design basis.

Appendix B Interim Final
Guidance to Optimizing Remedial Action Operation B-10 April 2001
• Assess the need for additional system operation.
• Provide the future decision strategy framework and prioritized recommendations toimprove total system performance and achieve site remedial action objectives foroptimal cost.
A site visit at MCB Camp Lejeune was conducted from April 27 - 30, 1999 to gather therequired information for this report.
ES.3 Campbell Street Fuel Farm (CSFF) System Description
The CSFF P&T system was evaluated over an operating period of approximately2.5 years (July 1996 to March 1999). The system was installed to remove fuel-relatedcontaminants from the groundwater. The treatment system is a skid-mounted package unit andincludes oil/water separation, followed by air stripping, granular activated carbon (GAC), anddischarge to a surface drainage ditch (See Figure 3-6). The system was designed to accommodateinfluent flow rates up to 30 gallons per minute (gpm).
The extraction system consists of a single recovery trench at each of the threecontaminated sites: Campbell Street Fuel Farm, AS-143, and AS-4151. Four recovery wells(RW) were recently installed (two RWs at AS-143, one RW at each of the other sites) to addresshot spot contamination and improve contaminant recovery. These extraction wells containpneumatic submersible pumps rated at 1 gpm.
Remedial action objectives for this system are regulated under the State of NorthCarolina underground storage tank (UST) program. Corrective Action Plans addressing each ofthe three contaminated sites were submitted in 1994. The proposed corrective actions includedsoil removal, free product recovery, operation of a P&T system, and long-term monitoring.Groundwater cleanup standards are those listed in the State of North Carolina GroundwaterStandards.
ES.4 CSFF System Performance Summary
The technical performance and cost effectiveness of the CSFF system for the period fromJuly 1996 to March 1999 has been poor. The overall performance for the system is summarizedas follows:
• The monitoring well network is inadequate to define the plume capture zones;however, it appears the plumes are stable due to natural attenuation processes.
• Influent treatment plant flow rates are less than 10% of design capacity.
• Cumulative mass removal for the system has been limited to approximately3.5 pounds in more than 2.5 years of operation.

Appendix B Interim Final
Guidance to Optimizing Remedial Action Operation B-11 April 2001
• Total volatile organic compound (VOC) contaminant levels in the influent are now440 parts per billion (ppb) in the AS-143 recovery trench and non-detect (ND) in theAS-4151 and Campbell Street recovery trenches.
• The AS-4151 recovery trench has shown consistent non-detect VOC contaminantlevels for 20 months. Additionally, the Campbell Street recovery trench has hoveredaround non-detect for the last 12 months. This asymptotic performance supportsdiscontinuing active remediation in favor of monitored natural attenuation (MNA).
• The cost per pound of contaminant removed has averaged $95,000.
• There is little evidence to suggest that the active pumping has had any significantimpact in achieving site-specific cleanup objectives.
ES.5 CSFF System Recommendations
Recommendations for the CSFF System should be implemented in a phased approach.The AS-4151 and Campbell Street trenches should be shut down immediately, having reachedasymptotic ND levels of contaminants. Based on contaminant spikes at the AS-143 site, hot spotremoval should continue on an interim basis. If the newly installed recovery wells prove to be oflimited benefit, Aggressive Fluid Vapor Recovery (AFVR) should be considered as a more costeffective means of addressing further hot spots. Finally, MNA data should be gathered toconfirm the potential of a passive remedial approach for AS-143 once the remaining hot spotshave been removed.
Appendix B Interim Final
Guidance to Optimizing Remedial Action Operation B-12 April 2001
FINAL
Naval Submarine Base New LondonNaval Exchange (NEX) Service Station and the
Dolphin Mart Service StationAir Sparge / Soil Vapor Extraction
Remedial Action Operation (RAO) Optimization Case Study
Contract No. N47408-99-C-7017
Prepared for:
Department of the NavyNaval Facilities Engineering Service Center (NFESC)
Code ESC4131100 23rd Avenue
Port Hueneme, CA 93043-4370
Prepared by:
Radian International1600 Perimeter Park Drive
Morrisville, NC 27560
May 2000

Appendix B Interim Final
Guidance to Optimizing Remedial Action Operation B-13 April 2001
EXECUTIVE SUMMARY
ES.1 Purpose of the Case Study Report
This case study report includes effectiveness evaluations for the Naval Exchange (NEX)Service Station and the Dolphin Mart Service Station (Dolphin Mart) air sparging/soil vaporextraction (AS/SVE) systems located at Naval Submarine Base (NSB) New London, Groton,Connecticut. The primary purposes of the evaluations were to: assess the ongoing remedialaction operation (RAO) program for this system; and provide recommendations resulting inattainment of site remedial action objectives and ultimate closure for optimal life-cycle costs. Forthe purposes of this report, optimal is defined as the minimum cost without sacrificing dataquality or decision-making. NSB New London and Northern Division (NORTHDIV) view thisindependent confirmation of their optimization plan as an important, proactive step towardoperating and maintaining a cost-effective and protective remedy.
This project was conducted for the Naval Facilities Engineering Service Center (NFESC)under a Broad Agency Announcement (BAA) contract. NFESC is leading a Department of theNavy (DON) working group in developing guidance on optimizing monitoring and remedialaction operations for Navy/Marine Corps activities. This working group is comprised ofmembers from NFESC, NORTHDIV, other Engineering Field Divisions/Activities (EFD/A),Naval Facilities Engineering Command (NAVFAC), and Chief of Naval Operations (CNO).
ES.2 Optimization Approach
The approach employed in this RAO optimization project to achieve site closure foroptimal life-cycle cost is outlined below:
• Gain a detailed understanding of the remedial decision-making framework, remedialaction objectives, and site closure criteria for each site.
• Describe and understand past investigation and remedial actions taken to date, andhow they have affected the evolution and understanding of the conceptual site model.
• Describe the current conceptual site model, i.e., geology, pathways, receptors, andcontaminants of concern (COC).
• Describe the system design basis and operational objectives for the AS/SVE system,including the sparge and extraction well network.
• Baseline the past and current cost and operational data for the system.
• Compare the cost and performance data with the system design basis.

Appendix B Interim Final
Guidance to Optimizing Remedial Action Operation B-14 April 2001
• Assess the need for additional system operation.
• Provide the future decision strategy framework and prioritized recommendations toimprove total system performance and achieve site remedial action objectives foroptimal cost.
A site visit at NSB New London was conducted from November 9 - 10, 1999 to gather therequired information for this report.
ES.3 NEX Remedial Action Overview
The NEX AS/SVE system was evaluated over an operating period of approximately3 years (July 1996 to August 1999). The system was designed to inject air (air sparging) into thegroundwater at the NEX and extract (SVE) the volatized contaminants in the vapor phase fromthe vadose zone. This AS/SVE system was designed with the dual purpose of removal ofcontaminants through volatilization from the light non-aqueous phase liquids (LNAPL),subsurface soils, and groundwater, and to promote aerobic biodegradation by providing oxygento the subsurface. Air is injected into the groundwater through a network of vertical spargingwells, and air and contaminant vapors are extracted through a network of vertical wells.Contaminated vapor and entrained water are then treated and discharged to the atmosphere andto the Thames River via the storm drain system, respectively.
The site is regulated by the Connecticut Department of Environmental Protection(CTDEP). CTDEP, when notified on 11 October 1989 of the release of fuel to groundwater,directed that site investigation and remediation be conducted to mitigate environmental impact.Activities implemented in response to the directive are conducted under a voluntary program inwhich the regulatory agency performs no direct oversight of the responsible party. Groundwaterat the NEX has been classified as GB by the CTDEP.
ES.4 NEX System Performance Summary
The overall performance of the AS/SVE well network and treatment system issummarized below:
• Through AS/SVE operation, contaminant concentrations in groundwater have beenreduced to below remediation standards.
• Typically, the percentage of vapor extraction and air sparging wells operating at anytime has been approximately 50% and 30%, respectively.
• While in operation, the air sparge system has operated at an average flow rate of53 scfm, approximately 35% of its design flow rate of 150 scfm. The soil vaporextraction system has operated at an average flow rate of 299 scfm, approximately36% of its design flow rate of 840 scfm.

Appendix B Interim Final
Guidance to Optimizing Remedial Action Operation B-15 April 2001
• Total mass removal has been 3,769 pounds of VOCs in 3 years of operation at a costof $1.5 million. Approximately half of this mass removal occurred during a suspectednew release in October 1998.
• The average cost per pound of contaminant removed is approximately $255.
ES.5 NEX System Recommendations
The primary recommendations of the case study are summarized as follows:
• Discontinue operation of the AS/SVE system at the NEX site. The AS/SVE systemshould be shut down because: (1) groundwater monitoring results from August 1999indicate that remediation standards applicable to the NEX site have been attained, and(2) the AS/SVE system has reached very low and asymptotic removal rates.
• Continue groundwater monitoring. Initiate post-remediation groundwater monitoringuntil results show a consistent trend of attaining remediation standards. August 1999was the first quarter where all concentrations were detected below the remediationstandards. Groundwater monitoring may be discontinued once eight consecutivequarters of monitoring show all contaminants below remediation standards.
• Implement groundwater monitoring recommendations. Several recommendations areprovided in Section 4.3 to eliminate redundant sampling points, discontinue theanalysis of unnecessary parameters, and improve the current understanding ofcontaminant extent and trends.
• Implement limited AS/SVE or Biosparging as needed for rebound. If monitoringresults begin to show an increase in groundwater concentrations (rebound) aboveremediation standards, perform limited biosparging or limited, pulsed AS/SVE toreduce concentrations to below remediation standards.
• Pursue closure for groundwater. When monitoring results show that groundwaterconcentrations remain below remediation standards for eight consecutive quarters,pursue negotiations with the regulatory agencies to achieve closure for the site.
• Soil Closure. Determine if soil remediation standards applicable to the site have beenmet and, if not, discuss with the regulatory agency how the presence of residual soilcontamination may influence site closeout.
Additional hot spot removal, extraction and monitoring well, and AS/SVE optimizationrecommendations are provided in Section 4.0. Data analysis, trend evaluation, and reportingrecommendations are provided in Section 7.0.

Appendix B Interim Final
Guidance to Optimizing Remedial Action Operation B-16 April 2001
ES.6 Dolphin Mart Remedial Action Overview
Air sparging and soil vapor extraction at the site began 29 June 1996. The Dolphin Martsystem has the same objectives and basic design elements as the NEX AS/SVE system.Contaminated vapor and entrained water are treated and discharged to the atmosphere and to thesanitary sewer system, respectively.
ES.7 Dolphin Mart System Performance Summary
The remediation system began operating on 29 June 1996. In approximately 3 years ofoperation, the AS/SVE system extracted 2,200 pounds of contamination. By 1998, the massremoval rate had reached asymptotic levels and groundwater concentrations were nearremediation levels. Appropriately, the air sparging component was shut down on 30 January1999, and the vapor extraction component was shut down on 21 May 1999 (IT Corporation,August 1999). Consequently, performance of the remediation system was not evaluated. Thegroundwater monitoring program has been continued, because the Dolphin Mart site has not yetmet the regulatory remediation standards. The evaluation of the Dolphin Mart site was limited tothe monitoring well network and the groundwater monitoring program.
ES.8 Dolphin Mart System Recommendations
Primary recommendations for the Dolphin Mart should incorporate the followingelements:
• Evaluate monitored natural attenuation (MNA). Evaluate the site’s potential tosupport natural attenuation to justify having shut down the system prior to attainingremediation standards.
• Implement groundwater monitoring recommendations. Modify the monitoring wellnetwork as recommended in Section 6.3 and continue groundwater monitoring untilconditions allow site closure.
• Implement limited Biosparging. Consider performing limited biosparging to reduceconcentrations in persistent, localized areas of contamination.
• Pursue Soil Closure. Determine if soil remediation standards applicable to the sitehave been met and, if not, discuss with the regulatory agency how the presence ofresidual soil contamination may influence a transition to a passive remedy such asMNA.

Appendix B Interim Final
Guidance to Optimizing Remedial Action Operation B-17 April 2001
FINAL
Eastern Groundwater PlumeNaval Air Station Brunswick
Remedial Action Operation (RAO) Optimization Case Study
Contract No. N47408-99-C-7017
Prepared for:
Department of the NavyNaval Facilities Engineering Service Center (NFESC)
Code ESC4131100 23rd Avenue
Port Hueneme, CA 93043-4370
Prepared by:
Radian International1600 Perimeter Park Drive
Morrisville, NC 27560
January 2000

Appendix B Interim Final
Guidance to Optimizing Remedial Action Operation B-18 April 2001
EXECUTIVE SUMMARY
ES.1 Purpose of the Case Study Report
This case study report includes an effectiveness evaluation for the Eastern GroundwaterPlume (Eastern Plume) pump and treat (P&T) system located at Naval Air Station (NAS)Brunswick, Maine. The primary purpose of the evaluation is to assess the ongoing remedialaction operation (RAO) program for this system; and provide recommendations resulting inattainment of site remedial action objectives and ultimate closure for optimal life-cycle costs. Forthe purposes of this report, optimal is defined as the minimum cost without sacrificing dataquality or decision-making. NAS Brunswick and Northern Division (NORTHDIV) view thisindependent confirmation of their optimization plan as an important, proactive step towardoperating and maintaining a cost-effective and protective remedy.
This project was conducted for the Naval Facilities Engineering Service Center (NFESC)under a Broad Agency Announcement (BAA) contract. NFESC is leading a Department of theNavy (DON) working group in developing guidance on optimizing monitoring and remedialaction operations for Navy/Marine Corps activities. This working group is comprised ofmembers from NFESC, NORTHDIV, other Engineering Field Divisions/Activities (EFD/A),Naval Facilities Engineering Command (NAVFAC), and Chief of Naval Operations (CNO).
ES.2 Optimization Approach
The approach employed in this RAO optimization project to achieve site closure foroptimal life-cycle cost is outlined below:
• Gain a detailed understanding of the remedial decision-making framework, remedialaction objectives, and site closure criteria for each site.
• Describe and understand past investigation and remedial actions taken to date, andhow they have affected the current evolution and understanding of the conceptual sitemodel.
• Describe the current conceptual site model, i.e., geology, pathways, receptors, andcontaminants of concern (COC).
• Gain an understanding of other remedial actions and associated data at NASBrunswick having potential applicability at the Eastern Plume.
• Describe the system design basis and operational objectives for the P&T system,including extraction trench and well network.
• Baseline the past and current cost and operational data.
• Compare the cost and performance data with the system design basis.

Appendix B Interim Final
Guidance to Optimizing Remedial Action Operation B-19 April 2001
• Assess the need for additional system operation.
• Provide the future decision strategy framework and prioritized recommendations toimprove total system performance and achieve site remedial action objectives foroptimal cost.
A site visit at NAS Brunswick was conducted from July 20 - 21, 1999 to gather the requiredinformation for this report.
ES.3 Eastern Plume Remedial Action Overview
The Eastern Plume pump and treat (P&T) system was evaluated over an operating periodof approximately 3 years (July 1996 to May 1999). The treatment system is comprised of anetwork of extraction wells (EWs) with treatment using ultraviolet oxidation (UV-Ox). Thesystem was designed to accommodate influent flow rates up to 110 gallons per minute (gpm).The extraction system consists of 5 EWs. These extraction wells contain pumps rated at over20 gpm.
Remedial action objectives for the system are covered under the United StatesEnvironmental Protection Agency (US EPA) Comprehensive Environmental Response,Compensation and Liability Act (CERCLA) program. A Record of Decision (ROD) for this sitewas signed in February 1998. The remedial action proposed included operation of a P&T systemand long term monitoring. Groundwater cleanup levels are those listed in the State of MaineMaximum Exposure Guidelines (MEGs). Current total volatile organic compound (VOC)contaminant levels in the influent average 500 parts per billion (ppb).
ES.4 Eastern Plume System Performance Summary
The performance of the Eastern Plume system from July 1996 to May 1999 has been fair,with increased performance following the addition of a new extraction well in July 1998. Theoverall performance is summarized below:
• Influent treatment plant flow rates are adequate, averaging 70 percent of designcapacity.
• Total mass removal has been 536 pounds of VOCs in 3 years of operation at a cost of$3.4 million.
• The average mass removal rate of the system has been approximately 15 pounds permonth.
• The average cost per pound of contaminant removed is approximately $7,800.

Appendix B Interim Final
Guidance to Optimizing Remedial Action Operation B-20 April 2001
ES.5 Eastern Plume System Recommendations
The primary recommendation of this case study is to implement four primary, strategicrecommendations. These four parallel activities are as follows:
• As groundwater monitoring results indicate that the downgradient edge of the EasternPlume has not changed position since 1995, focus future investigations on confirmingthat the plume is stable or receding, and begin a formal evaluation of MonitoredNatural Attenuation (MNA).
• Pursue negotiations with the regulators to establish risk-based cleanup levels for theentire Eastern Plume, and Alternate Concentration Limits (ACLs) for anygroundwater discharging to Mere Brook.
• Continue and enhance contaminant mass removal in the Eastern Plume.
• Modify the aboveground treatment system to allow effluent discharge to surfacewater or to an infiltration gallery after confirming the most effective and efficientoption based on a detailed technical review and life cycle cost analysis.
These four parallel activities will enable NAS Brunswick to prepare to work with regulatorsduring any current and future performance evaluations. In addition, this discussion should beused to reach an agreement on how to implement required changes to the ROD, i.e., viaexplanation of significant difference (ESD), or a ROD amendment.

Appendix B Interim Final
Guidance to Optimizing Remedial Action Operation B-21 April 2001
803912.04
FINAL
Remedial Action Operation Optimization Case StudyJP-5 Line Area
Marine Corps Air Station New River, North Carolina
Contract No. N47408-99-C-7035
Prepared for:
Environmental Management DepartmentInstallation Restoration Division
Building 58Camp Lejeune, North Carolina 28542-5000
Prepared by:
Radian International1600 Perimeter Park Drive
Morrisville, NC 27560
May 2000
Appendix B Interim Final
Guidance to Optimizing Remedial Action Operation B-22 April 2001
EXECUTIVE SUMMARY
ES.1 Purpose of the Case Study Report
This case study report includes an effectiveness evaluation for the JP-5 Line Arearecovery system located at Marine Corps Air Station (MCAS) New River, which is co-locatedwith Marine Corps Base (MCB) Camp Lejeune, North Carolina. The primary purpose of theevaluation is to assess the ongoing remedial action operation (RAO) program for this system andprovide recommendations that will result in attainment of site remedial action objectives andclosure at minimal life cycle costs. In addition, site conditions that would allow enhancement offree product recovery and monitored natural attenuation (MNA) actions were assessed.
ES.2 Optimization Approach
The goal of this case study report is to provide a decision framework and associatedrecommendations to achieve site remedial action objectives and closure, while optimizing lifecycle costs. For the purposes of this report, optimal costs are defined as the minimumexpenditures for remediation that do not sacrifice data quality or the ability to reach sounddecisions. The approach employed in this RAO optimization project to achieve this goal isoutlined by the steps below:
• Gain a detailed understanding of the remedial decision-making framework, remedialaction objectives, and site closure criteria for the site.
• Describe and understand past investigation and remedial actions taken to date, andhow they have affected the evolution and understanding of the conceptual site model.
• Describe the current conceptual site model, i.e., geology, pathways, receptors, andcontaminants of concern (COC).
• Gain an understanding of other remedial actions and associated data at MCB CampLejeune having potential applicability at the JP-5 Line Area.
• Describe the system design basis and operational objectives for the recovery system,including the recovery well network.
• Compare the past and current cost and operational data for the system with the systemdesign basis.
• Assess the need to continue operating the system.
• Evaluate site conditions for ways to enhance free product recovery and demonstratethat natural attenuation is occurring.
• Provide the future decision strategy framework and prioritized recommendations toimprove total system performance and achieve site remedial action objectives foroptimal cost.

Appendix B Interim Final
Guidance to Optimizing Remedial Action Operation B-23 April 2001
A site visit at MCB Camp Lejeune was conducted from October 27 - 28, 1999 to gatherthe required information for this report. Field work at MCB Camp Lejeune was conducted from29 November to 2 December 1999 to collect soil and groundwater samples.
ES.3 JP-5 Line Area Recovery System Description
The recovery system at the JP-5 Line Area has been in operation since February 1994.The system was designed to recover free product and to remediate contaminated groundwater.The treatment system includes oil-water separation, followed by air stripping, granular activatedcarbon (GAC) treatment, and discharge into the Base WWTP (see Figure 3-3). An interimrecovery system operated at the site from October 1986 until discontinuation and removal inNovember 1987.
The current recovery system consists of two recovery wells located within thecontaminant plume. The recovery wells are designed to prevent migration of the contaminantplume, recover free product, and extract contaminated groundwater. Each recovery well isequipped with one recovery pump.
Remedial action objectives for this system are based on the State of North Carolinacorrective action rule (15A North Carolina Administrative Code, Subchapter 2L, Section .0106).The JP-5 Line Area was classified as a Class B discharge based on previous site assessmentactivities. A corrective action plan (CAP) for the site was submitted in 1991. The proposedcorrective actions included free product recovery, operation of an extraction and treatmentsystem, and long-term monitoring. Groundwater cleanup standards are those listed in the State ofNorth Carolina groundwater standards.
A risk-based approach for assessment and cleanup of discharges and releases frompetroleum underground storage tanks was adopted on 2 January 1998. According to the new rule,Class AB discharges for which a comprehensive site assessment (CSA) was submitted prior tothe effective date must continue to comply with previously issued notices. The new rule may beapplied, however, if it will result in a more cost-effective cleanup of the discharge or release.
ES.4 JP-5 Line Area Recovery System Performance Summary
The technical performance and cost effectiveness of the JP-5 Line Area recovery systemhave diminished for the period from February 1998 to November 1999. The overall performancefor the system is summarized as follows:
• Diminishing free product removal rates. Approximately 238 gallons of free productwere removed from June 1998 to November 1999, in comparison to a cumulative4,764 gallons removed since October 1986, of which 4,043 gallons were removed bythe interim system during 1 year of operation ending November 1987.
• Very low rate of dissolved contaminant removal from water. Approximately1.1 pounds of dissolved contaminant was removed from June 1998 to November1999.

Appendix B Interim Final
Guidance to Optimizing Remedial Action Operation B-24 April 2001
• Little evidence that the groundwater extraction system is significantly contributing tothe restoration of the aquifer. Concentrations of most contaminants in the extractedgroundwater have been below North Carolina groundwater standards.
• Accelerated removal of product by aggressive fluid vapor recovery (AFVR) whenproduct is present. In September 1999, 78% of the total monthly product recoveredwas removed in approximately two hours with AFVR.
• Greater cost effectiveness in the use of AFVR as a remedial alternative to therecovery system. The average cost of product removed by AFVR is approximately$210/gallon, which is 45% of the average cost of product removed for the currentsystem ($470/gallon).
ES.5 JP-5 Line Area Conclusions
The presence of measurable free product in RW-1 requires continued action to recoverfree product from the JP-5 Line Area. An investigation performed as part of this optimizationstudy indicates that free product occurs in discrete pockets, rather than as a continuous lens. Thefree product is limited to the east side of White Street, with no recoverable free product presenton the west side.
The presence of free product in discrete pockets results in intermittent recovery andreduces the effectiveness of the continuous recovery system. The asymptotic conditionsillustrated by the product recovery plots justify the implementation of an alternative remedialapproach. The use of AFVR at the JP-5 Line Area has proved to be an efficient and effectivemethod to enhance product recovery when product is present.
Soil sampling conducted during the site assessment phase of this study indicated thatresidual fuel exists in the soil. The residual fuel, however, is no longer contributing togroundwater contamination.
The evaluation of natural attenuation conditions indicates that natural attenuation isoccurring at the site.
ES.6 JP-5 Line Area Recommendations
Based on the conclusions, additional source control should be considered and the currentrecovery system at the JP-5 Line Area, including product recovery and groundwater extractionand treatment, should be discontinued. To recover remaining free product, AFVR should beimplemented as the remedial action. Natural attenuation processes will continue to reduce anyremaining contamination in the groundwater. Once recoverable free product is removed,reclassification of the JP-5 Line Area as a low-risk site should be pursued under the risk-basedcorrective action rule. As a low risk site, no further action will be required at the JP-5 Line area.

Appendix B Interim Final
Guidance to Optimizing Remedial Action Operation B-25 April 2001
Appendix B Interim Final
Guidance to Optimizing Remedial Action Operation B-26 April 2001
Executive Summary
Naval Weapons Station (NWS) Earle is located in the town of Colts Neck, in east-centralNew Jersey. The objective of this project is to provide recommendations for optimizing theoperation of the bioslurper system (Units #1 and #2) and site closeout at Site 16F. Theserecommendations are based on review of the design and operation documents for the site and onan observation of the system and site conditions made during a site visit. The scope of thisproject includes an overview of the design and installation of the current system; andrecommendations for exit strategies, system optimization, effluent treatment, and monitoring.An analysis of the costs of implementing the recommended changes is included also.Recommendations are specific to the bioslurper system at NWS Earle, but the generalrecommendations may be extended to bioslurper systems at other sites.
Site 16F, located in the north-central portion of NWS Earle, consists of several areas thatcontain fuel-related contaminants. These areas include a light, nonaqueous-phase liquid(LNAPL) plume southeast of Building C-16, an LNAPL plume northwest of Building C-50, anda former gas station near Building C-17. The LNAPL plume adjacent to Building C-16 issuspected to have been caused by a leaking underground diesel fuel transfer line which led froman underground storage tank (UST) at the northwest corner of Building C-18 to a fuel dispenserlocated between the railroad tracks north of Building C-50. The leak was detected in 1997, andthe use of the transfer line was discontinued. As of 1997, this transfer line was still in place. Airsamples from bioslurper Unit #1 indicate that some residual gasoline contamination also may beassociated with this plume, perhaps due to releases from the former gas station. The plume atBuilding C-50 is reported to be the result of minor spills at the former diesel dispensing station.
The document review and the site visit revealed several factors that reduce theeffectiveness of the bioslurper systems at Site 16F. These factors include:
• Cost of the aqueous effluent treatment system• Restricted hours of operation• Inadequate extraction well network
Several recommendations to optimize the bioslurper system have been made based on theevaluation of site-specific data and experience with the bioslurping technology at other sites.Battelle has made several recommendations to optimize the systems at Site 16F. The firstrecommendation is the installation of additional wells to gain a better understanding of the extentof the LNAPL plume. The plume is poorly delineated, and the bioslurper status reports reviewedby Battelle indicate that the current extraction network does not adequately cover the LNAPLplume. In addition, these wells should be used to improve the recovery of LNAPL. Otherrecommendations include adjusting the placement of the drop tube, replacing the oil/waterseparator, monitoring and possibly discontinuing off-gas treatment, reprogramming the alarmsystem, addition anti-scaling compound to the heat exchangers, and collecting aqueous effluenttreatability data.

Appendix B Interim Final
Guidance to Optimizing Remedial Action Operation B-27 April 2001
Upon implementing these recommendations, the system should be operated continuously.System performance and operating costs may then be evaluated further. Additional systemmodifications and/or operational procedures may be implemented based on revised cost andperformance data. A flow chart for bioslurper system optimization and site closure at Site 16F isincluded with the recommendations in Section 4.0 of this report.
Interim Final
Guidance to Optimizing Remedial Action Operation April 2001
Appendix C
Navy Internal Case Studies

Appendix C Interim Final
NSB Kings Bay, GA
Site 11, Old Camden County LandfillRemedial Action Operation
Guidance to Optimizing Remedial Action Operation C-2 April 2001
Remedial ActionOperation Optimization
Summary Report
Summary
During the early 1990s, a plume of chlorinated aliphatic compounds (CAC) was discovered ingroundwater moving toward a residential area located near Site 11, Old Camden County Landfill, NavalSubmarine Base (NSB) Kings Bay. The major contaminants of the groundwater plume includedtetrachloroethene (PCE), and its breakdown products, trichloroethene (TCE), and cis-1,2-dichloroethene(DCE). To prevent further offsite contamination from reaching the residential area, a pump and treat(P&T) system was designed and installed to hydraulically contain the plume at the perimeter of thelandfill and adjacent to the residential area.
During the early stages of the Resource Conservation and Recovery Act (RCRA) Facility Investigation,the P&T system was expected to be the final remedy for the site. Further investigation of the landfillidentified a source of contamination near the edge of the landfill. In addition, the natural attenuationcapacity of the aquifer was determined to be very effective at this site. Instead of relying solely on theP&T approach, in-situ chemical oxidation was implemented to reduce contaminant concentrations at thesource areas and monitored natural attenuation (MNA) was to be implemented to address residualconcentrations.
After two in-situ chemical oxidation treatments, contaminant concentrations were observed at levelsbelow cleanup objectives. A third treatment is expected to address additional sources of contamination.As a result of the success of the in-situ chemical oxidation treatments, the P&T system was shut down,and MNA was implemented. Based on predictions from a numerical model, MNA at the site is expectedto meet maximum contaminant levels (MCL) within 5 years.
The modification of remedial action operations (RAO) reduced long-term P&T for hydraulic containmentfrom a period that was expected to exceed many decades to less than two months after the chemicaloxidation treatments. Additionally, this modification resulted in savings in excess of several milliondollars over the life of the remedy.

Appendix C Interim Final
NAS Pensacola, FL
Optimization of Remedial Action Operationto Treat Chlorinated Hydrocarbons in Groundwater
Guidance to Optimizing Remedial Action Operation C-3 April 2001
Summary Report
Remedial ActionOperation Optimization
Summary
The Navy, in conjunction with regulators, optimized remedial action operations (RAO) at a former sludgedrying bed and surge pond site at Naval Air Station (NAS) Pensacola, Florida. The RAO optimizationimplemented over the past several years has resulted in improvements in the monitoring program, amodification in remedial strategy, accelerated site cleanup, and significant cost savings.
The monitoring program improvements reduced the sampling frequency and the number of constituentsbeing analyzed. Additionally, the number of monitoring wells was reduced from 19 to 15, and thecontract type was changed from a cost plus to a fixed price contract. These actions have saved the Navyover $200,000 in annual monitoring costs.
Modifications to the remedial strategy have progressed from optimizing the existing pump and treat(P&T) remedy, including reducing the number of recovery wells from seven to three, to redirecting theproject to a passive final remedy, monitored natural attenuation (MNA). The remedy was redirected byassessing the natural attenuation capacity of the aquifer and implementing an aggressive source reductiontechnology, in-situ chemical oxidation, to reduce the relatively high concentrations of trichloroethene(TCE) and other chlorinated volatile organic compounds (CVOC).
The in-situ chemical oxidation treatment substantially reduced contaminant concentrations in the sourcearea and ensured natural attenuation processes would remediate remaining downgradient contamination ina reasonable timeframe and protect the closest receptor, Pensacola Bay. As a result, the regulatory agencyhas allowed the P&T system to be permanently discontinued, and the corrective action plan (CAP) andResource Conservation and Recovery Act (RCRA) permit are being modified to specify MNA as the finalremedy. Engineering this more cost-effective remedy has saved the Navy approximately $2,000,000 inremedial action costs.