guidanace document for the vapor intrusion pathway
TRANSCRIPT


Guidance Document FOR THE VAPOR INTRUSION PATHWAY
MAY 2012 - DRAFT REMEDIATION DIVISION
Prepared by: Michigan Department of Environmental Quality Remediation Division 525 West Allegan Street Lansing, Michigan 48933

THIS PAGE IS INTENTIONALLY LEFT BLANK

GUIDANCE DOCUMENT FOR THE VAPOR INTRUSION PATHWAY MAY 2012 - DRAFT REMEDIATION DIVISION The information contained in this document is drawn from existing manuals, various reference documents, and a broad range of colleagues with considerable practical and educational backgrounds. This document outlines an approach to demonstrate compliance when the generic criteria under Part 201, Environmental Remediation, of the Natural Resources and Environmental Protection Act, 1994 PA 451, as amended (NREPA), and Part 213, Leaking Underground Storage Tanks, of the NREPA, do not apply. Site conditions, contaminants, and geology may require modifications of this approach. This document was developed to provide guidance to the Michigan Department of Environmental Quality (MDEQ) staff and their contractors conducting investigations and remedial activities at sites with known or potential vapor intrusion (VI) issues in order to promote a consistent, informed, and practical approach for MDEQ staff to follow. By following the process outlined in this document, a party can achieve the performance standards required by Part 201 and Part 213 of the NREPA. This document is made available as a technical reference that may be informative when conducting work at sites where VI issues are a concern. The MDEQ is not responsible for the misuse or misinterpretation of the information presented herein. The methods outlined in this document will produce reliable data that can support the various decisions required throughout the environmental process. A guidance document/guideline cannot establish regulatory requirements for parties outside of the MDEQ. It is merely explanatory, does not affect the rights of or procedures and practices available to the public, and does not have the force and effect of law.
DIVISION/OFFICE CHIEF APPROVAL: _______________________ DATE: _________________ DEPUTY DIRECTOR APPROVAL: __________________________ DATE: _________________

The following is a list of some key stakeholders and parties that have provided valuable input and support into the production of various portions of this guidance document. It is through their voluntary support that this document has been able to be produced. Their support of the MDEQ has been wide ranging from providing comments and suggestions on previous documents, providing solutions or approaches in unique situations, providing the use and access of site data for verification of methodologies and approaches, providing access to published papers and/or presentations, and most importantly by providing access to staff and various equipment to assist in formatting many of the ideas presented in this document.
AMEC E & I, Inc. American Petroleum Institute AKT Peerless Environmental & Energy Services AMS, Inc. ARCADIS U.S., Inc. ATC Associates Inc. Atlantic Richfield Company AQR ColorTec CETCO Lining Technologies Chrysler Group LLC Conestoga-Rovers & Associates Cox-Colvin & Associates, Inc. Department of Toxic Substances Control Environmental Resources Management Entech Instruments, Inc. Severstal North America, Inc. Fibertec Environmental Services Ford Motor Company Global Remediation Technologies, Inc. Hamp, Mathews & Associates Hartman Environmental Geoscience H&P Mobile Geochemistry, Inc. Interstate Technology & Regulatory Council (ITRC) Land Science Technologies MHE Products Michigan State Housing Development Authority URS Corporation RAM Group of Gannett Fleming, Inc. Shell Global Solutions Soil and Materials Engineers, Inc. TTL Associates, Inc. Weston Solutions, Inc. W. L. Gore & Associates, Inc.

THIS PAGE IS INTENTIONALLY LEFT BLANK

THIS PAGE IS INTENTIONALLY LEFT BLANK

Acronyms and key definitions for terms used in this document: Acute: Conditions that have the potential for injury or damage to occur to
humans or environmental receptors as a result of an instantaneous or short duration exposure
Acute toxicity: Ability of a hazardous substance to cause a debilitating or injurious effect in an organism as a result of a single or short-term exposure
AGWvi: Groundwater concentrations for consideration of an acute exposure for VI
AGWvi-sump: Groundwater concentrations for consideration of an acute exposure when water is in contact or entering a structure for VI
AIAvi: Acute indoor air value for VI Alpha (Alpha Factor or ): Key parameter in assessing the significance of subsurface VI into
indoor air, defined as the concentration of a particular chemical in indoor air divided by its concentration in soil gas at a specified depth beneath the building floor
ASGvi: Acute soil gas concentrations for VI ASTM: American Society for Testing and Materials atm-m3/mole: Atmosphere per meter cubed per mole bgs: Below ground surface CGI: Combustible gas indicator Contamination: Includes hazardous substances that have been released and are
present above criteria Criteria or Criterion: Includes the cleanup criteria for Part 201 and the Risk-Based
Screening Levels (RBSLs) as defined in Part 213 and R 299.5706a(4)
Csat: Concentrations approach saturation CSM: Conceptual site model ESA Environmental Site Assessment Facility: Includes “facility” as defined by Part 201 and “site” as defined by
Part 213 GC/MS: Gas chromatograph/mass spectrometry GVIIC: Groundwater volatilization to indoor air inhalation criteria GWvi: Groundwater concentrations for VI GWvi-sump: Groundwater concentrations when water is in contact or entering a
structure for VI HVAC: Heating, ventilation or air conditioning IAvi: Acceptable indoor air value for VI IBS: Interior building survey Indoor Air Inhalation Criteria: Groundwater volatilization to indoor air inhalation criteria (GVIIC) as
defined by R 299.5714 and soil volatilization to indoor air inhalation criteria (SVIIC) as defined by R 299.5724
IRASLs: Immediate response activity screening levels J&E Model: Johnson and Ettinger Model (1991) LUSTs: Leaking underground storage tanks MDEQ: Michigan Department of Environmental Quality MEK: Methyl ethyl ketone also known as 2-butanone Mitigation: Proactive remedial actions to reduce risks to receptors MPE: Multi-phase extraction NAPL: Non-aqueous phase liquid

NFA No Further Action NREPA: The Natural Resources and Environmental Protection Act, 1994
PA 451, as amended PAHs: Polynuclear aromatic hydrocarbons Part 201: Part 201, Environmental Remediation, of the NREPA Part 213: Part 213, Leaking Underground Storage Tanks, of the NREPA PCE: Tetrachloroethene also known as perchloroethylene PID: Photoionization detector QA/QC: Quality assurance/quality control RBSL: Risk-based screening levels RD: Remediation Division Release: Includes “release” as defined by both Part 201 and Part 213 Response Action: Includes “response activity” as defined in Part 201 and “corrective
action” as defined in Part 213 SGvi: Soil gas concentrations for VI SGvi-SS: Soil gas concentrations collecting less than five feet bgs or lowest
point of a structure for VI SIM: Selected ion monitoring SMD: Sub-membrane depressurization system Soil Gas: Vapor phase compounds occupying the pore spaces of
unsaturated soil SOP: Standard operating procedures SSD: Sub-slab depressurization system Subsurface Migration Route: Soils in the unsaturated zone through which vapors are
transported SVE: Soil vapor extraction SVvi: Screening values for VI SVIIC: Soil volatilization to indoor air inhalation criteria TCA: Trichloroethane TCE: Trichloroethene TO-15: USEPA method for the determination of toxic organic compounds
in ambient air g/L Micrograms per literg/m3: Micrograms per meter cubed
USEPA: United States Environmental Protection Agency USTs: Underground storage tanks Vapor Intrusion: The process by which chemicals in soil or groundwater migrate to
indoor air Vapor Intrusion Receptor: Human occupants of a current or future building Vapor Intrusion Source: Contaminated soil, groundwater, or NAPL that have the potential
to volatilize and that are sufficiently volatile and toxic to cause a risk
VOCs: Volatile organic compounds VSIC: Volatile soil inhalation criteria

TABLE OF CONTENTS 1.0 Introduction ..................................................................................................................... 1-1
1.1 Generic Criteria ........................................................................................................... 1-1 1.1.1 Construction of Structure .................................................................................... 1-1 1.1.2 Presence of Building Sumps ............................................................................... 1-1 1.1.3 Presence of Shallow Groundwater ...................................................................... 1-2 1.1.4 Other Limitations of the J&E Model ..................................................................... 1-2 1.1.5 Site-Specific Evaluation ...................................................................................... 1-2
1.2 Intent and Scope of this Document .............................................................................. 1-3 1.3 Description of the Vapor Intrusion Pathway ................................................................. 1-3 1.4 Factors Affecting Soil Vapor Migration and Intrusion ................................................... 1-4 1.5 Factors Affecting Indoor Air Quality ............................................................................. 1-4 1.6 Investigative Process ................................................................................................... 1-4
2.0 MDEQ’s Approach for Evaluating the Vapor Intrusion Pathway.................................. 2-1
2.1 Conceptual Site Model ................................................................................................ 2-1 2.2 Investigation Decision Framework ............................................................................... 2-2 2.3 Screening Values for the Vapor Intrusion Pathway ...................................................... 2-3
2.3.1 Screening Values for Vapor ................................................................................ 2-3 2.3.2 Screening Values for Groundwater ..................................................................... 2-4 2.3.3 Screening Values for Soil .................................................................................... 2-5 2.3.4 Screening Values ................................................................................................ 2-5
2.4 Field Sampling and Laboratory Analysis ...................................................................... 2-6 2.4.1 Field Sampling .................................................................................................... 2-6 2.4.2 Target Analytes and Analytical Methods ............................................................. 2-6
2.5 Identify Objectives and Strategy .................................................................................. 2-7 3.0 Step 1: Screening Level Assessment ........................................................................... 3-1
3.1 Consider the Need for Emergency Assessment and Response ................................... 3-1 3.2 Vapor Intrusion Screening and Receptor Evaluation .................................................... 3-2
3.2.1 Identifying Potential Sources of Vapors .............................................................. 3-2 3.2.2 Vapor Intrusion Receptor Survey ........................................................................ 3-4
3.3 Methane ...................................................................................................................... 3-4 4.0 Step 2: Conducting a Soil Gas Investigation ............................................................... 4-1
4.1 Collecting Representative Soil Gas Samples ............................................................... 4-1 4.2 Evaluating Soil Gas Data ............................................................................................. 4-2
4.2.1 Soil Gas Results 10x less than and up to the Soil Gas Concentrations for Vapor Intrusion ................................................................................................... 4-2
4.2.2 Soil Gas Results above the Soil Gas Concentrations for Vapor Intrusion ............ 4-2 4.2.3 Soil Gas Results greater than the Immediate Response Activity Screening
Levels ................................................................................................................. 4-2 4.3 Unique Vapor Intrusion Conditions .............................................................................. 4-3
4.3.1 Petroleum Underground Storage Tanks .............................................................. 4-3 4.3.2 Big Building ......................................................................................................... 4-3 4.3.3 Volatile Soil Inhalation Criteria ............................................................................ 4-4 4.3.4 Facilities with Releases of Hazardous Substances as Vapors ............................ 4-4

4.3.5 Building with Crawlspaces .................................................................................. 4-4 TABLE OF CONTENTS (cont.) 5.0 Step 3: Building-Specific Investigation ........................................................................ 5-1
5.1 Interior Building Survey ............................................................................................... 5-1 5.2 Assessment of Immediate Risk ................................................................................... 5-2 5.3 Sub-Slab Soil Gas Sampling ....................................................................................... 5-2 5.4 Evaluation of Sub-Slab Soil Gas Results ..................................................................... 5-5 5.5 Sampling Indoor Air ..................................................................................................... 5-6 5.6 Using Multiple Lines of Evidence ................................................................................. 5-7
5.6.1 Spatial and Temporal Variations of Data Trends ................................................. 5-7 5.6.2 Physical Building Inspection ................................................................................ 5-7 5.6.3 Common Sources for Background Contamination .............................................. 5-8
6.0 Step 4: Response Actions ............................................................................................. 6-1
6.1 Source-Area Remediation ........................................................................................... 6-1 6.2 Building Controls for Vapor Mitigation .......................................................................... 6-2
6.2.1 Sealing Building Leaks ........................................................................................ 6-2 6.2.2 Sub-Slab Depressurization System ..................................................................... 6-3 6.2.3 Sub-Membrane Depressurization System ........................................................... 6-4 6.2.4 Passive Barrier System ....................................................................................... 6-5 6.2.5 Building Pressurization and Ventilation using Heating, Ventilation or Air
Conditioning ........................................................................................................ 6-5 6.2.6 Indoor Air Cleaners ............................................................................................. 6-6 6.2.7 Other Building Controls used for Mitigation ......................................................... 6-7
6.3 Institutional Controls .................................................................................................... 6-7 6.4 Mitigation Verification, Monitoring, and Closure ........................................................... 6-7
6.4.1 Mitigation Verification .......................................................................................... 6-8 6.4.2 Part 55, Air Pollution Control, of the Natural Resources and Environmental
Protection Act, 1994 PA 451, as amended .......................................................... 6-8 6.4.3 Operation and Maintenance and Long-Term Monitoring ..................................... 6-9 6.4.4 2010 Amendments to Part 201 ......................................................................... 6-10
7.0 References ....................................................................................................................... 7-1

TABLE OF CONTENTS (cont.) Appendix A – Generalized Flowcharts for the Evaulation of the Vapor Intrusion Pathway Appendix B – Supplemental Guidance Information Appendix C – Checklists for Evaluating Compliance with Part 201 Appendix D – Vapor Intrusion Screening Values Appendix E – Soil Gas Compounds Screening List Appendix F – MDEQ’s Standard Operating Procedures Appendix G – Laboratory Quality Assurance and Quality Control for Vapor Intrusion Data Appendix H – Model for a Declaration of a Restrictive Covenant Appendix I – Rule 290, Permit to Install Exemption Figure 1-1 – Simplified Model of Vapor Intrusion Figure 2-1 – Example of a Preliminary CSM Figure 6-1 – Active Sub-Slab Depressurization System Figure 6-2 – Active Sub-Membrane Depressurization System Table 1-1: Building Factors That May Affect Vapor Intrusion Table 1-2: Environmental Factors That May Affect Soil Vapor Intrusion Table 1-3: Alternate Sources of Volatile Chemicals in Indoor Air Table 2-1: Screening Values for the Vapor Intrusion Pathway Table 4-1: Soil Gas Concentrations and Expected Outcomes Table 5-1: Influences on Sampling Density Table 5-2: Sampling Density in Commercial Buildings Table 5-3: Sub-Slab Soil Gas Concentrations and Expected Outcomes Table 5-4: Common Background Sources of Indoor Air Contaminants

THIS PAGE IS INTENTIONALLY LEFT BLANK

1-1
1.0 Introduction Part 201 of the NREPA and the associated Administrative Rules, and Part 213 of the NREPA regulate most sites of environmental contamination in Michigan. This document provides technical support, guidance, and a method for assessing risks associated with the VI pathway at sites where the generic criteria do not apply or are not protective. The procedures and guidance provided in this document were developed based on a compilation of available information, knowledge, field experience, and general industry practices to provide an alternate approach to parties implementing response actions in Michigan. This guidance document is not a statutory requirement when the generic criteria do not apply, but was created to promote an alternate approach that is consistent with Part 201 and Part 213.
1.1 Generic Criteria The J&E Model is the fate and transport model used for development of the Part 201 generic GVIIC, SVIIC, and Part 213 RBSLs. These criteria/screening levels were developed to address human health risks resulting from VOCs volatilizing from the GVIIC and the SVIIC. The GVIIC and the SVIIC were originally developed in 1998, and the methodology (including the J&E Model inputs and exposure assumptions) and resulting generic criteria were promulgated as part of the 2002 Part 201 Administrative Rules. The use of generic criteria for analysis of the GVIIC and the SVIIC pathways must be done with caution. A number of assumptions used in the J&E Model are not applicable for all sites, and it is therefore critical to evaluate whether the J&E Model is the appropriate tool for assessing the VI risk when actual site conditions stray from the assumptions used in the model. To ensure the consideration of critical J&E Model assumptions, Rule 714(2) and 724(2) of the Part 201 Administrative Rules specifically identify conditions when the applicability of the GVIIC and the SVIIC is not appropriate. These conditions are discussed in more detail below.
1.1.1 Construction of Structure The MDEQ’s J&E Model assumes that the proposed or existing structure is constructed with block or poured concrete walls and floor. Should a structure be equipped with earthen walls and/or floors, the flow of vapors into the structure will occur at a much different rate than assumed in the J&E Model. In these circumstances, the generic criteria do not apply for either the GVIIC (Rule 714(2)(a)) or the SVIIC (Rule 724(2)(a)) pathways, and a site-specific evaluation of indoor inhalation risks may be conducted.
1.1.2 Presence of Building Sumps Rules 714(2)(c) for the GVIIC and 724(2)(b) for the SVIIC require a site-specific evaluation to address the VI pathway if there is a sump present in the structure at a facility under investigation. The installation of sump pumps in building foundations, most commonly basements, is required under local building codes in many areas of Michigan to prevent the infiltration of shallow groundwater into the structure. If there is a sump present, even if only a room or portion of a building appears potentially affected by the sump, the sump is assumed to create a preferential pathway for vapor migration.

1-2
Although the isolation and/or venting of vapors from the sump to the outdoors may effectively “seal” or “cap” the actual opening in a slab and eliminate a preferential pathway of vapor flow, these measures are not considered adequate to allow for the use of the J&E Model. The J&E Model assumes the presence of a concrete foundation and a fixed area available for vapor migration, much smaller than the typical area occupied by a sump. The presence of a sump and its associated drainage system may create pockets of vapor accumulation and areas of preferential vapor flow along fill materials surrounding drain tiles, also not consistent with the assumptions of the J&E Model. Capping does not eliminate vapor flow throughout the already established drain tile system nor prevent vapor accumulation in the area of the sump. A sump may also produce its own “zone of influence,” particularly when vented to the outdoors where subsurface vapors may follow a path of least resistance toward the open sump. These factors may or may not cause or contribute to unacceptable VI risk; however, the impacts are not easily quantified.
1.1.3 Presence of Shallow Groundwater It has been documented (USEPA, 2005) that the J&E Model’s predicted outcome become less reliable as groundwater depth becomes more shallow (i.e., closer to the basement foundation or building slab). Rule 714(2)(b) states that the GVIIC are not valid for assessing VI risk at sites where the highest water table is less than three meters from the ground surface. For sites that meet this situation, a site-specific evaluation will need to be performed to adequately assess the VI pathway.
1.1.4 Other Limitations of the J&E Model
Other considerations that limit the reliability as reported by the USEPA (2005) of the J&E Model include the presence of multiple contaminants as well as the presence of NAPLs, which under Part 201 and Part 213 should also be considered when Csat conditions are present. More discussion on soil concentrations that are valid for use in screening can be found in Section 3.
1.1.5 Site-Specific Evaluation A site-specific evaluation of the VI pathway must consider and evaluate site conditions specific to the site. The party conducting the evaluation must be able to demonstrate that the methods being utilized for evaluating the VI pathway are technically valid and appropriate to the site-specific conditions. This document provides an approach that evaluates the site through some of the most common options in performing a site-specific evaluation. This includes:
1. Assessing the potential for VI by comparing hazardous substance concentrations that were developed for site conditions with shallow groundwater or for groundwater that enters into a structure (Section 3).
2. Assessing soil gas or sub-slab soil gas sampling results and comparing them to a
screening value derived from empirical data as part of a site-specific evaluation (Sections 4 and 5).
3. Assuming that an unacceptable VI risk exists and implementing presumptive remedies to
mitigate the potential exposure pathway (Section 6).

1-3
Though not specifically discussed in this document, another available option is the development of site-specific GVIIC using an updated version of the J&E Model that relies on site-specific data. Although this is an option, the site-specific data necessary for development of site-specific GVIIC are rarely available and collection is often cost-prohibitive. As there are many limitations and technical considerations when modifying the J&E Model with site-specific data, consultation with the MDEQ, RD, Toxicology Unit is recommended for this or for any time a party proposes development of site-specific criteria using an alternative procedure.
1.2 Intent and Scope of this Document This document should be used as a reference. Differences may exist between the procedures referenced in this document and what is appropriate under site-specific conditions. This document does not represent an endorsement of practitioners or products mentioned herein nor does it ensure that this approach is appropriate for all sites. It is imperative that the environmental professional implementing this approach provide adequate justification of the development of any and all site-specific criteria, though it is the intent of this document to assist in that justification.
1.3 Description of the Vapor Intrusion Pathway
Vapor intrusion is an exposure pathway resulting from the migration of volatile chemicals from the subsurface into overlying buildings with human receptors. A VI source, migration route, and a human receptor must be present for the pathway to be complete and pose a potential health risk. In addition, the source of chemicals must be sufficiently volatile and toxic to cause a risk or harmful to public safety. Figure 1-1 provides a simplified schematic illustration of the VI pathway for a source of vapors in the groundwater. As shown, VOCs dissolved in groundwater enter into the vapor phase at the boundary between the saturated zone and the vadose zone. These compounds can then migrate within the subsurface as soil gas vertically or laterally by diffusion or advection into an overlying or adjacent structure.
Soil gas migration can occur in any direction due to pressure gradients, variations in soil type, permeability, and moisture content. Pressure gradients influencing soil gas migration can be the result of barometric pressure changes or pressure differences between a building’s interior and the subsurface. Such gradients can cause shallow soil gas to enter buildings through foundation cracks, sumps, or other preferential pathways (ITRC, 2007a). Vapors generated from contaminated soil, groundwater, NAPLs, or buried waste materials (including VOCs and methane gas) preferentially enter structures through very small cracks in foundations, pipe or
Figure 1-1 – Simplified Model of Vapor Intrusion

1-4
utility penetrations through the concrete floor slabs or walls, through foundation drainage, or sump systems. Though this is the most obvious and direct path for vapors to take, it should be noted that there are circumstances where vapors can actually move directly through concrete. The VI can also be influenced from the advective air movement within a building caused by thermal and air density variations between the building interior and the outside air. This creates vertical airflow through the building (i.e., via the chimney or other openings) and is known as the building stack effect.
1.4 Factors Affecting Soil Vapor Migration and Intrusion
Predicting the extent of soil vapor contamination from soil or groundwater, as well as the potential for human exposure from soil VI into buildings, is complicated by multiple factors. For example, soil vapor contaminant plumes may not mimic groundwater contaminant plumes since different factors affect the migration pattern of water compared to vapor. In addition, common building features such as the operation of HVAC systems, the operation of kitchen vents in restaurants, and even elevators in office buildings may induce pressure gradients that result in the migration of vapor-phase contaminants away from a groundwater source of vapors and toward these structures. Factors that can affect soil vapor migration and intrusion generally fall into two categories:
building factors environmental factors
Examples of building factors are provided in Table 1-1 and several environmental factors are included in Table 1-2. It is important to consider these factors when conducting an investigation of the soil VI pathway and evaluating their potential effect on the sampling results.
1.5 Factors Affecting Indoor Air Quality
Other factors that influence how we evaluate the potential of VI are directly related to the fact that chemicals are a part of our everyday life. Chemicals typically investigated as part of a release are found in common household products as well as in items we bring into our homes. As such, chemicals that may be part of a release may also be found in indoor air of homes not affected by VI. This makes the assessment on whether a release is impacting indoor air extremely difficult and in part, is why the MDEQ has a preference for soil vapor samples. It is also important to understand that each home is unique and indoor air concentrations in one home may not be similar to another. Examples of potential sources of volatile chemicals in indoor air are given in Table 1-3.
1.6 Investigative Process
This guidance document is designed to be a general how-to guideline for assessing the VI pathway. Although this document identifies a step-wise investigative approach, it is imperative to understand that it is intended to be a generalized framework which describes the various tools utilized for investigating; assessing; completing the data evaluation; and mitigating the VI pathway. The investigative strategy employed when assessing the VI pathway requires a firm understanding of the desired endpoint (i.e., due diligence for a property transaction, due care assessment, no further action determination, or closure). Often the endpoint, desired outcome,

1-5
and certainty of the conclusions will dictate the approach utilized and the level of investigation required. Appendix A provides a series of flowcharts intended to give a general overview of the framework and overall approach. Key components associated with each step of a VI investigation have been identified within the flowcharts and provide a general framework to promote a greater understanding of the potential paths and relationships of each step in the process. Further discussions on VI issues as they relate to property transactions, due care, and other specialized situations can be found in Appendix B.
Table 1-1: Building Factors That May Affect Vapor Intrusion Building Factor Description
Operation of HVAC systems, fireplaces, and mechanical equipment (e.g., clothes dryers or exhaust fans/vents)
Operation may create a pressure differential between the building or indoor air and the surrounding soil that induces or retards the migration of vapor-phase contaminants toward and into the building. The VI can be enhanced as the air vented outside is replaced.
Heated building
When buildings are closed up and heated, a difference in temperature between the inside and outdoor air induces a stack effect, venting warm air from higher floors to the outside. The VI can be enhanced as the air is replaced in the lower parts of the building.
Air exchange rates
The rate at which outdoor air replenishes indoor air may affect vapor migration into a building as well the indoor air quality. For example, newer construction is typically designed to limit the exchange of air with the outside environment. This may result in the accumulation of vapors within a building.
Foundation type Earthen floors and fieldstone walls may serve as preferential pathways for VI.
Foundation integrity Expansion joints or cold joints, wall cracks, or block wall cavities may serve as preferential pathways for VI.
Subsurface features that penetrate the building's foundation
Foundation perforations for subsurface features (e.g., electrical, gas, sewer or water utility pipes, sumps, and drains) may serve as a preferential pathway for VI.

1-6
Table 1-2: Environmental Factors That May Affect Soil Vapor Intrusion
Environmental Factor Description
Soil conditions Generally, dry, coarse-grained soils facilitate the migration of subsurface vapors and wet, fine-grained or highly organic soils retard migration.
Volatile chemical concentrations The potential for VI generally increases with increasing concentrations of volatile chemicals in groundwater or subsurface soils, as well as with the presence of NAPL.
Source location
The potential for VI generally decreases with increasing distance between the subsurface source(s) of vapor contamination and overlying buildings. For example, the potential for VI associated with contaminated groundwater decreases with increasing depth to groundwater.
Groundwater conditions
Volatile chemicals dissolved in groundwater may off-gas to the vadose zone from the surface of the water table. If contaminated groundwater is overlain by clean water (upper versus lower aquifer systems or significant downward groundwater gradients), then vapor phase migration or partitioning of the volatile chemicals is unlikely. Additionally, fluctuations in the groundwater table may result in contaminant “smear zones.” Chemicals on the water table, such as petroleum components, can sorb onto soils within this zone as the water table fluctuates. Sorption of chemicals can influence their gaseous and aqueous phase diffusion in the subsurface and ultimately the rate at which they migrate.
Surface confining layer
A surface confining layer (e.g., frost layer, pavement, or buildings) may temporarily or permanently retard the migration of vapors to the surface and allow for greater lateral migration of subsurface vapors. Confining layers can also prevent rainfall from reaching subsurface soils, creating relatively dry soils that further increase the potential for soil vapor migration.
Fractures in bedrock and/or tight clay soils
Fractures in both bedrock and clay can facilitate vapor migration (in horizontal and vertical directions) and movement of contaminated groundwater along spaces between fractures. The presence of such fractures can result in an increase in the potential for VI beyond that expected for the bulk, unfractured bedrock or clay matrix.
Underground conduits
Underground conduits (e.g., sewer and utility lines, drains, tree roots, septic systems) can serve as preferential pathways for vapor migration. This is primarily due to the relatively low resistance to flow, relative to the native materials, that results from the highly permeable bedding materials associated with these conduits.
Weather conditions Wind and barometric pressure changes and thermal differences between air and surrounding soils may induce pressure gradients that affect soil VI.
Biodegradation processes
Depending upon environmental conditions (e.g., soil moisture, oxygen levels, potential measurement of the acidic or alkaline nature of a solution (pH), mineral nutrients, organic compounds, and temperature), the presence of appropriate microbial populations, and the degradability of the volatile chemical of concern, biodegradation in the subsurface may reduce the potential for VI. For example, readily biodegradable chemicals in soil vapor may not migrate a significant distance from a source area while less degradable chemicals may travel farther.

1-7
Table 1-3: Alternate Sources of Volatile Chemicals in Indoor Air Source Description
Outdoor air
Outdoor sources of pollution can affect indoor air quality due to the exchange of outdoor and indoor air in buildings through natural ventilation, mechanical ventilation, or infiltration. Outdoor sources of volatile compounds include: automobiles, lawn mowers, oil storage tanks, dry cleaners, gasoline stations, industrial facilities, etc.
Attached or underground garages
Volatile chemicals from sources stored in the garage (e.g., automobiles, lawn mowers, oil storage tanks, gasoline containers, etc.) can affect indoor air quality due to the exchange of air between the garage and indoor space.
Off-gassing
Volatile chemicals may off-gas from building materials (e.g., adhesives or caulk), furnishings (e.g., new carpets or furniture), recently dry-cleaned clothing, or areas contaminated by historical use of volatile chemicals in a building (such as floors or walls). Volatile chemicals may also off-gas from contaminated groundwater that infiltrates into the basement (e.g., at a sump) or during the use of contaminated domestic well water (e.g., at a tap or in a shower).
Household products Household products include, but are not limited to: cleaners, mothballs, cigarette smoke, paints, paint strippers and thinners, air fresheners, lubricants, glues, solvents, pesticides, fuel oil storage, and gasoline storage.
Occupant activities
For example, in nonresidential settings, the use of volatile chemicals in industrial or commercial processes or in products used for building maintenance. In residential settings, the use of products containing volatile chemicals for hobbies (e.g., glues, paints, etc.) or home businesses. People working at industrial or commercial facilities where volatile chemicals are used may bring the chemicals into their home on their clothing.
Indoor emissions These include, but are not limited to, combustion products from gas, oil, and wood heating systems that are vented outside improperly, as well as emissions from industrial process equipment and operations.

2-1
Note: Throughout this document it refers to the presence of a structure. It is important to understand that an evaluation must still be completed for parcels without structures unless the parcel has appropriate building restrictions associated with it. This may require some modifications to this approach.
2.0 MDEQ’s Approach for Evaluating the Vapor Intrusion Pathway The MDEQ’s approach has been established when the generic criteria do not apply and is based on a step-wise, risk-based approach emphasizing the use of empirical field data, rather than fate and transport modeling, to assess human health risks. The empirical approach begins by identifying VI sources and determining if there are (or could be) receptors at risk. If receptors are identified, soil gas concentrations are evaluated near identified receptors, and it is then determined if a building-specific investigation is required. The VI data are interpreted by developing a CSM, which integrates qualitative and quantitative data sources collected throughout the investigative process.
2.1 Conceptual Site Model A CSM for VI provides a three-dimensional conceptual understanding of the:
extent and magnitude of vapor sources confirmed or suspected preferential migration pathways spatial distribution of contaminant soil vapors and concentrations type and location of receptors relative to vapor sources
An accurate CSM is necessary to interpret site investigation results, determine whether additional investigation is required, provide support in selecting appropriate remedial actions, and document that site closure criteria have been achieved. A CSM functions both as an interpretation and communication tool used to describe the site conditions and VI pathway for a given site (Figure 2-1). As additional site information is collected, the CSM should continue to be refined in an iterative fashion.
Figure 2-1 – Example of a Preliminary CSM

2-2
Note: Throughout this document it refers to the presence of a source of vapors or a vapor source. It is important to understand that a source of vapors may be present in either the vadose zone or in the aquifer.
The CSM can be documented with VI investigation reports both within the report narrative and by use of cross-sections, plan-view site figures, and data tables. Cross-sections should identify vapor sources and the interpreted site geology and receptor locations as appropriate. Site maps should identify the spatial relationships between vapor sources, receptors, sample locations, and known or suspected locations of soil gas and groundwater plumes. The information necessary for developing a CSM can be found in the MDEQ’s checklist for evaluating a CSM (Appendix C). Additional resources about CSMs are available in the ITRC guidance (ITRC, 2007a) and the USEPA draft guidance (USEPA, 2002a).
2.2 Investigation Decision Framework The purpose of a VI investigation is to evaluate whether a complete VI pathway exists or could exist and, if so, to determine whether there is or may be a risk to receptors in a structure overlying the area. The four major investigation steps are summarized below and are discussed in Sections 3 through 6.
Step 1: Screening Level Assessment Review existing site information (e.g., MDEQ files, county records, Phase I Environmental Site Assessment [ESA]) and previous investigation results for the site; and develop a CSM (Section 2.1) for the VI pathway. Results of the CSM will assist in determining if the site must be investigated for VI or if VI can be excluded as a pathway of concern. If VI risks to nearby receptors are identified, proceed to Step 2. Step 2: Soil Gas Investigation Conduct or complete a soil gas investigation to determine which receptors may be at risk. Use a CSM to assist in the selection of sampling locations and the assessment of risk for determining whether response actions are necessary. A party may need to proceed to Step 3 (Building-Specific Investigation found in Section 5) if proper soil gas samples cannot be collected due to shallow groundwater, building construction, or site conditions. It may also be warranted to proceed to Step 3 based on the location of the vapor source as well as the size of the structure present (or planned). Step 3: Building-Specific Vapor Investigation Conduct a building-specific vapor investigation to evaluate risks posed to individual receptors which may involve sub-slab soil gas and indoor air sampling. Use a CSM to assist in the selection of sampling locations and the assessment of risk for determining whether response actions are necessary.
Step 4: Response Actions If necessary, evaluate and implement response actions to address unacceptable VI risks. The term response action is used broadly within this document to refer to corrective or remedial actions including, but not limited to, deed restrictions, mitigation, or presumptive mitigation measures.

2-3
Note: The SVvi and IRASLs are generic terms for a group of screening values across multiple media that are utilized to assess the potential for VI.
In using these steps it is assumed that a party has evaluated a site and determined that the generic criteria do not apply and that a site-specific evaluation is necessary. Though this guidance does not establish regulatory requirements for parties, by following the process outlined in this document, a party can achieve the performance standards required by Part 201 and Part 213 of the NREPA. This framework is applicable to most VI investigations, regardless of the type of site or the investigation strategies used. At any point during the investigation and when VI risks are identified or suspected, the party proposing the response action may conduct proactive remedial actions to reduce risks to receptors (Step 4, Response Actions).
2.3 Screening Values for the Vapor Intrusion Pathway The SVvi are based on chronic exposure levels and the IRASLs are intended to assist in identifying those conditions that may present an immediate or imminent threat to the public as a result of a release (an acute condition). Both the SVvi and the IRASLs are intended to assist in identifying those conditions that result in unacceptable exposures and can be found in Appendix D. Both the SVvi and the IRASLs are health-based, hazardous substance-specific benchmarks used to evaluate the potential for unacceptable human health risk from inhalation of contaminants in the indoor air environment resulting from VI sources. The terms and nomenclature for the media-specific SVvi and IRASLs for groundwater, soil gas, and sub-slab sampling are described in Table 2-1. The application of screening values in making risk-based decisions is discussed in more detail in Sections 3, 4, and 5.
2.3.1 Screening Values for Vapor
., The SVvi screening values for soil gas and sub-slab, identified in Table 2-1, are used for evaluating the risk posed to nearby receptors and are based on the CSM whereby contaminant vapor concentrations decrease with distance from vapor sources and move in the subsurface
upwards toward the surface and eventually into buildings. A key parameter in assessing the significance of subsurface vapors, the concentrations required for intrusion into indoor air, and in the development of the SVvi is the vapor attenuation coefficient (“alpha” or ). The alpha is defined as the concentration of a particular chemical in indoor air divided by its concentration in soil gas at a specified depth beneath the building floor. It is commonly referred to as a numerical constant (unitless) either derived empirically, modeled, or estimated to predict a concentration in soil gas that may cause impacts to indoor air above acceptable health-based indoor air screening levels. The chronic SVvi were established by
Soil Gas and Soil Vapor
In many VI guidance documents, “soil gas” and “soil vapor” are used interchangeably. In this document, “soil gas” refers to the gaseous elements and compounds in the small spaces between particles of soil. Once the gaseous elements or compounds migrate into a structure, they are referred to as “vapor.”

2-4
back calculating from the compound-specific IAvi (as Cindoor) and use of an attenuation factor or alpha value particular to that media. When using empirically derived data, the alpha can be represented mathematically by:
αsg = Cindoor/Csoil gas The MDEQ’s αsg and the resulting soil gas and sub-slab SVvi are based on the USEPA’s (2008) dataset. That dataset contains multiple sites across the United States with paired soil gas, sub-slab, and indoor air data. Though many states and the USEPA have selected a more conservative value (i.e., results in a lower screening value), the MDEQ has established an attenuation factor of 0.02 for soil gas collected less than five feet bgs and a 0.002 where deeper soil gas concentrations can be established.
Table 2-1: Screening Values for the Vapor Intrusion Pathway
Sampling Location Appropriate Vapor Intrusion Screening
Value (SVvi) Immediate Response Activity
Screening Levels (IRASLs)
Soil sample Soil concentration that identified a source of
vapors (Svi) - - - - -
Air within the interior space of a building derived from VI sources
Acceptable indoor air value for VI (IAvi) Indoor air values for consideration of an
acute exposure for VI (AIAvi)
Soil gas collected from the subsurface
Soil gas concentrations for VI (SGvi) Soil gas concentrations for consideration
of an acute exposure for VI (ASGvi)
Sub-slab soil gas from beneath a building slab
Soil gas concentrations collecting less than five feet bgs or lowest point of a structure
(SGvi-SS) ASGvi – see description above
Groundwater in contact with a structure
Groundwater concentrations when water is in contact or entering a structure for VI
(GWvi-sump)
Groundwater concentrations for consideration of an acute exposure when water is in contact or entering a structure
for VI (AGWvi-sump)
Groundwater beneath, but not in direct contact with a structure
Groundwater concentrations for VI (GWvi) Groundwater concentrations for
consideration of an acute exposure for VI (AGWvi)
2.3.2 Screening Values for Groundwater Groundwater concentrations for the VI pathway (GWvi) are calculated using both a media-specific attenuation factor (0.001) and the compound-specific Henry’s Law Constant. The MDEQ has also provided a concentration for use if the groundwater is in direct contact or entering into a structure (GWvi-sump) and it is assumed that there is no attenuation. This includes situations were impacted groundwater has been identified in a sump or is actually within a structure.

2-5
Note: Appropriate VI screening values are based on exposure categories identified in Part 201 Section 324.20120a (i.e., residential and nonresidential).
Note: Near-slab soil gas samples are soil vapor samples that are collected less than five feet bgs. Because of the increased variability, additional sampling may be warranted. The SGvi-SS values are appropriate to utilize if the sample is collected from less than five feet bgs.
2.3.3 Screening Values for Soil The MDEQ has developed a value for soil (Svi) that may be considered conservative for some situations. However, establishing the actual conditions when the values are conservative can be a lengthy and intensive process that typically requires the collection of soil gas samples and an evaluation of various lines of evidence. Though soil data are generally not recommended as a stand-alone screening tool for eliminating or identifying the potential for VI, the Svi are established and provided as an initial screening tool to establish a potential source of soil gas within the unsaturated soil column to aid in defining potential sources of vapors that can potentially impact a structure.
2.3.4 Screening Values As previously discussed in Section 1.0, the SVvi and the IRASLs are not promulgated values. The SVvi were developed for air, soil gas, and groundwater to represent an acceptable exposure limit that is not expected to cause adverse health effects after a single or short-term exposure to a single hazardous substance. They are intended to be used, in conjunction with an accurate CSM, to evaluate risks posed to receptors when the generic criteria do not apply and may be utilized as site-specific criteria for addressing the VI pathway. In Appendix D, Table B-1 identifies the SVvi for evaluating chronic risks for residential exposure scenarios. The chronic risks for nonresidential exposure assumptions are identified in Table B-2. The IRASLs are also provided in Appendix D, Table B-3 which is appropriate for assessing the potential of an acute risk and are intended to assist in identifying conditions that may present an immediate or imminent threat to the public as a result of a release. An acute exposure is generally defined as a single or repeated exposure over a 24-hour period.
Response action decisions are typically based on identifying that a completed exposure pathway exists or could exist (if a structure is not present). This is supported by the information presented in a CSM and the detection of elevated constituents in subsurface VI samples (i.e., sub-slab or near-slab soil gas) above the SVvi. Response actions may also be taken when other data sources or site conditions indicate a need to be protective of human health or when a party chooses to implement presumptive corrective measures in lieu of completing a detailed investigation. However, it should be noted that most response actions require some level of investigation to ensure that the design and implementation is protective.

2-6
Note: The SGvi-SS values are appropriate to utilize if the sample is collected from less than five feet bgs.
2.4 Field Sampling and Laboratory Analysis Appendix E contains a standard list of hazardous substances that are to be analyzed and reported on during the course of a normal VI investigation (Sections 4 and 5). Compounds currently without a SVvi or IRASL typically do not have sufficient toxicity data to generate a screening value or may not be common compounds of concern for the VI pathway. For sites in which contaminants not identified in Appendix E are expected to be present and they will meet the definition of a VOC (R 299.5714 and R 299.5724), an assessment of the potential risk from these compounds remains necessary.
2.4.1 Field Sampling Appendix F contains the MDEQ’s SOPs for soil gas and sub-slab soil gas sampling, as well as the MDEQ’s procedures for the collection of indoor air samples. These SOPs are written for the MDEQ staff and its contractors and have been made available as a technical reference that may be informative when conducting work at sites where VI issues are of concern.
Soil gas sampling is conducted using temporary or permanent soil gas monitoring points. Permanent soil gas monitoring points are recommended when multiple sampling events are necessary. In either case, the annular space around the sample device should be sealed off from the ground surface to prevent infiltration of ambient air. Lithology, moisture content, and total organic vapor readings should be recorded at each probe location for the depth interval from which the soil gas sample is collected. Organic vapor readings can be obtained using either a flame ionization detector or a PID, as appropriate.
2.4.2 Target Analytes and Analytical Methods The TO-15 (full scan), a GC/MS method, is the default method for the analysis of soil gas, sub-slab, and indoor air samples. Samples should be analyzed for the compounds on the Soil Gas Compounds Screening List provided in Appendix E. Alternative analytical methods, such as those identified in Table D-3 of the ITRC Toolbox (ITRC, 2007a), may be proposed. However, justification for alternative methods must be provided and must include the use of split samples being analyzed and compared by the TO-15 for verification. It is important to note that QA/QC protocols may vary greatly among laboratories and the practices should be reviewed and specified in the work plan prior to data collection. Laboratory QA/QC expectations for VI data are provided in Appendix G. Samples subject to dilutions by the laboratory, if VOC concentrations are elevated or an insufficient volume of air was collected, will typically have higher reporting limits than those specified on the Soil Gas Compounds Screening List (Appendix E). Such situations could be discussed with the MDEQ specialists to determine if resampling will be necessary or if the diluted results provide the information required. It should be noted that when using the TO-15,

2-7
there may be some compounds that have laboratory reporting limits that are higher than the compound’s SVvi. When this occurs, the TO-15 SIM may be necessary to reach the appropriate detection limits in order to evaluate risk. It should also be noted that there are several compounds not listed in Appendix E that possess the potential to volatilize from groundwater (R 299.5714) and/or soil (R 299.5724). These compounds have a Henry’s Law Constant greater than or equal to 0.00001 atm-m3/mole and cannot be analyzed using the TO-15. Examples include (but are not limited to): mercury, polychlorinated biphenyls, and several PAHs. If these compounds are suspected of posing a VI risk, investigators should coordinate with the MDEQ specialists to determine the appropriate analytical method and sampling procedures.
2.5 Identify Objectives and Strategy Investigations for VI should be based on clearly defined objectives consistent with site-specific conditions. The type of VI sites can vary widely and include releases from LUSTs, dry cleaners, and VOCs from associated soil contamination; as well as VOC impacted groundwater that may impact multiple receptors, and brownfield sites with proposed new construction or redevelopment (ITRC, 2007b). Site-specific conditions may require different investigation objectives and strategies. Some basic questions that must be considered when identifying the objectives and sampling strategy are identified below:
What are the exposure scenarios present? Analyzing exposure scenarios helps to identify the current and future risks of the pathway and to determine the available screening values. Assessing the potential exposure scenarios aids in designing an investigation to know what and how to sample (e.g., media, depths, parameters, etc.).
Are there multiple potential sources of vapors present at a facility? Within a CSM it is
important to identify if there is the potential for multiple sources (on-site and off-site), as this will direct the future site investigation, help to identify acute and potential chronic health issues, explain data variation and results, and identify the need for additional response actions.
Is the groundwater impacted above the GWvi? The presence of contaminants above the
screening concentration in groundwater may identify a VI risk for a structure. The CSM must account for preferred pathways including utility lines, sumps, etc.
Is the groundwater impacted above the GWvi in contact with or entering a structure? If
groundwater is in contact or entering a structure, the generic criteria are not applicable and it would, in most cases, not be possible to do soil gas sub-slab sampling. This condition can result in a more immediate risk and the need to perform further assessment and possible mitigation.
Is there impacted soil in contact with the structure? When contaminated soils are in
contact with a structure, cracks and other foundation penetrations will act as direct conduits for VI. It can result in a risk and the need to perform further assessment and possible mitigation.
Is the release from petroleum hydrocarbons? When the contamination is due to a
release of petroleum hydrocarbons, there is a high potential for attenuation of vapors to

2-8
occur if there is sufficient oxygen present. Further information is available in Appendix B.
Could historical site use or processes have resulted in a release, partially or completely
from vapors? Certain processes may cause a direct release of vapors into the subsurface. A release of vapors, wholly or in part, may be a factor in explaining anomalous vapor data results without a corresponding soil and groundwater source observed.
What is the size and floor plan of the structures that may be impacted by vapors? The
nature of the structure and its layout has a significant impact on pathways and vapor threshold concentrations. The presence of elevators, sumps, and utility corridors can serve as preferential pathways. Structures with large open spaces (big buildings) may be looked at differently than structures with many small separate offices.
Modifications to the approach outlined in this guidance document may be appropriate with the proper understanding of the site-specific conditions that are present. For instance, it would be inappropriate to collect soil gas samples from greater than five feet bgs if groundwater is present at three feet bgs or if a potential source of vapors is located above the sampling point.

3-1
Note: Emergency assessment and immediate response actions may be required if imminent health risks are suspected at any point during a VI investigation. To address an imminent VI risk, an interim emergency response action may need to be implemented.
3.0 Step 1: Screening Level Assessment
Step 1 is a screening level assessment to determine if the VI pathway is complete. If, during Step 1 or at any other step of the investigation, information points to the potential for imminent health impacts, an emergency assessment and interim response actions (R 299.5526) including immediate response actions, must be considered. Section 3.1 identifies and discusses examples of when a site may need to consider an immediate response and Section 3.2 presents the framework for initial screening at sites where the need for emergency assessment and response is not required.
3.1 Consider the Need for Emergency Assessment and Response
Examples of situations that might require an immediate response include:
oil, gas, or chemical infiltration into a basement or sump in a building measured indoor air concentrations near or above the IRASLs uncontrolled potentially flammable or explosive conditions in a building, sewer, or
utility conduit chemical odors in an occupied building with or without exposure symptoms to the
occupants The immediate safety of the building occupants is the first priority when an acute or the immediate hazard from VI is suspected. In such cases, call the local fire department by dialing 911 to activate a local response. Local authorities can typically evaluate the conditions quickly and provide an immediate short-term control measure. Several sampling techniques may be used to make an immediate decision. Depending on the type of release and which compounds of concern are present, an investigator may use appropriate field screening instruments. In most cases, follow-up indoor air sampling using the TO-15 will be a necessary activity to determine specific compounds and their concentrations. Sites where methane may be or is present should consider the need to make an immediate assessment. The presence of methane resulting from a release in soil gas represents conditions that must be further evaluated. To determine the presence of acute hazards, the party must consider the need for emergency assessment and response. Section 3.3 provides additional information regarding how to evaluate the risk of VI associated with the presence of methane.

3-2
3.2 Vapor Intrusion Screening and Receptor Evaluation
3.2.1 Identifying Potential Sources of Vapors A critical component of any VI investigation is establishing the extent and area to evaluate. This should begin with a review of existing site records and data, including: historical information like chemical use history, site investigation data, Phase I and Phase II ESA investigations, and other site-specific information. The following sections include a description of how previously collected existing data can be utilized to establish the area that may represent a potential vapor source. It is also important to note that the release may consist of vapors or be more prevalent in the vapor phase. In these cases the investigation may need to conduct some initial soil gas sampling, similar to that identified in Section 4, to define the extent of the release.
Soil
Soil data are typically less than ideal for evaluating the potential risk from VI because of the uncertainty associated with using partitioning equations, especially when generic SVIIC (R 299.5724) do not apply. However, as there is usually soil data associated with most sites, having the ability to perform basic screening on the potential for the presence of a VI issue is critical. Therefore, the MDEQ has developed for use a value for soil that may be conservative in some situations. As stated above, establishing the actual conditions when the values are conservative can be a lengthy and intensive process that typically requires the collection of soil gas samples and an evaluation of various lines of evidence. It has been well documented that human health risks calculated from soil matrix samples are often biased low (Hewitt, 1994; Hewitt, 1999; Liikala et al., 1996; Vitale et al., 1999) due in part to the use of site-specific assumptions associated with the partitioning of the contaminant into the gas phase. However, it should be noted that Hartman (2002) reported that calculated soil gas values from soil data may actually overestimate actual soil gas concentrations in the case of hydrocarbons. In most cases, the determination on whether the health risks are biased low or high cannot be determined without performing a detailed site analysis including the collection of soil gas or sub-slab soil gas samples (Sections 4 and 5). As a result, soil data should be utilized as one part of a line-of-evidence approach. Though not a stand-alone tool, soil data are effective in assisting the delineation of potential vapor sources within the unsaturated soil column (if the release did not include vapors) or to establish sites for further VI assessment.
Impacted Groundwater
The GWvi are designed to assist in refining the CSM and to help determine the scope of further investigation. The GWvi represent a concentration at which the VOCs may volatize from the aquifer causing a VI risk to a structure. In some cases the GWvi values may be seen as too conservative for sites where the groundwater table is more than 100 feet bgs, clays and silts act as vertical barriers to vapor migration, and/or in areas where uncontaminated groundwater is overlying a contaminated groundwater plume.

3-3
Note: Diffusivity for a volatile compound is approximately 10,000 times lower in water than it is in a gaseous phase (i.e., unsaturated soil gas). As a result, uncontaminated groundwater overlying a contaminated groundwater plume can serve as a barrier for the upward migration of contaminant vapors, due to the reduced diffusivity potential. However, these situations should be interpreted using caution because: (a) dissolved VOCs or residual NAPL may be present in the capillary fringe or vadose zone soils associated with historical groundwater fluctuations; and (b) vapors from nearby soil or groundwater contamination may migrate laterally.
Conversely, the GWvi may not be conservative enough at sites with highly permeable soils and a shallow groundwater table. In such circumstances, and particularly in cases where groundwater is present within a structure or a sump, the GWvi-sump was developed to evaluate groundwater concentrations. Recommendations to ensure that the samples are appropriate for use in defining the extent of a vapor source in groundwater are as follows:
Screen Placement. Contaminants at the water table, rather than deeper contamination, are responsible for causing potential VI problems. Hence, monitoring wells used to make VI evaluations should be screened across the air-water interface. It is therefore important to make sure that the well screens are not submerged below the water table.
Screen Lengths. Monitoring wells with long well screens, regardless of screen
placement, should not be used to make VI evaluations. When sampling long well screens, clean water entering the well screen at depth may dilute the contaminated groundwater near the top of the screen biasing the sampling results and the associated risk determination. Hence, short screen lengths (less than five feet) are preferred for monitoring wells that will be used to make VI evaluations. Longer screens may be warranted under certain geologic conditions or in areas that experience water table fluctuations greater than three feet.
Well Installation. Monitoring wells should be designed and installed to yield
representative samples of groundwater conditions. Monitoring wells should have proper filter packs, slot sizes, and annular seals.
Well Development. Monitoring wells should be developed to: create an effective filter
pack around the well screen, rectify damage to the formation caused by drilling, optimize hydraulic communication between the formation and well screen, and assist in the restoration of natural water quality of the aquifer near the well.
Well Purging. Prior to sampling, monitoring wells should be adequately purged to
remove stagnant casing water from the well that is not representative of aquifer conditions.
Well Sampling. Representative sampling procedures must be utilized which may include
the use of low-flow sampling techniques. When defining the potential extent of a source of vapors in the groundwater, lack of a monitoring network or appropriately collected data does not negate the need to assess the pathway.

3-4
Note: Methane (chemical formula = CH4) is the lightest of all hydrocarbons. It is a colorless, odorless, tasteless, flammable gas that is produced as a result of the microbial or thermal alteration of organic matter and is widely distributed in nature. Sources of methane beside wetlands include solid or industrial waste deposits, oil and gas wells, groundwater contamination plumes (especially biodegrading hydrocarbons), and leaking natural gas pipelines.
Note: Methane is not toxic; the principle health and safety concerns are its explosive, flammable, and asphyxiant properties. Since methane is a simple asphyxiant, acting by displacement of oxygen, no threshold limit value (TLV), permissible exposure limit (PEL), or recommended exposure limit value (REL) has been established. However, migrating methane gas can pose serious public health and safety risks, principally fire and explosion.
3.2.2 Vapor Intrusion Receptor Survey The purpose of a VI receptor survey is to document the location of current or possible future receptors within a 100-foot radius from vapor sources (Section 3.2.1), defined as the preliminary screening area. A secondary objective should include an evaluation of potential future building exposure scenarios if a structure is not present. The VI receptor survey may need to be extended if preferential pathways (e.g., utility corridors, fractured clays, fractured bedrock, etc.) are identified within the area of potential sources. However, the receptor survey may also be reduced under certain conditions; for instance, hydrocarbons (petroleum-based hydrocarbons) are readily degraded to carbon dioxide in the presence of oxygen by ubiquitous soil microbes. Therefore, alternative distances may be proposed similar to those developed by the MDEQ for releases of petroleum-based hydrocarbons in Appendix B. The VI receptor survey represents an integral component of the CSM (Section 2.2 and Appendix C) and must be documented. At a minimum, the VI receptor survey should include a site map of potential receptors and other relevant features with respect to the extent of known vapor sources and information on the type of buildings present, their use, and their construction. Building information and occupancy can be obtained from public records, maps, and available databases. However, occupancy should be verified by field visits and direct contact.
3.3 Methane
The MDEQ has established the following criteria, under Section 20120a(17) and R 299.5728, that the presence of methane (resulting from a release) above 0.52 parts per million in groundwater (the flammability/explosivity screening level) or above 8.4E+6 µg/m3 (1.25 percent by volume) in soil gas represents conditions that must be further evaluated for the presence of acute hazards and the party must consider the need for emergency assessment and response (Section 3.1). The MDEQ has reviewed information about methane in soil and groundwater at several facilities and has determined that these levels are appropriate to protect the public health, safety and welfare because of the acute flammability and explosivity hazards associated with methane when it exceeds these levels.

4-1
4.0 Step 2: Conducting a Soil Gas Investigation Soil gas investigations are performed to assess properties that may have vapor sources as identified in Section 3. It should be noted that soil gas sampling is not always feasible at every site and is dependent on geologic conditions. This section focuses on the following aspects of soil gas investigations:
consideration of investigation objectives and strategies appropriate for different types of sites
sampling locations, depths, and procedures use of screening values to evaluate soil gas data within the context of the CSM
4.1 Collecting Representative Soil Gas Samples
The number of soil gas samples needed and the overall investigation strategies for a soil gas investigation will depend upon the geometry (i.e., shape and extent) of the vapor sources, the location of receptors, and the size and complexity of the site, as well as the specific program requirements for which the soil gas investigation is being completed. Specific locations and methodologies for completing soil gas sampling may include, but are not limited to:
immediately above the identified “worst-case” vapor source area or the area of the highest documented concentrations in soil or groundwater
adjacent to the base of an existing building foundation or basement, or within the proposed footprint of a future building
at or near the outer edges of a soil gas plume In general, it is recommended that soil gas samples should be collected adjacent to specific buildings according to the following depth requirements:
at least two feet above the water table and at least five feet below grade near the basement floor depth of a building being evaluated (typically to a total depth
of eight to ten feet below grade for a typical house) five feet below grade adjacent to slab-on-grade buildings
Structures greater than 2,000 square feet that have a source of vapors present beneath the structure should collect samples in a manner described in Section 5 below. This is especially the case if there are:
shallower sources present vapor sources in contact with the structure groundwater is less than five feet below grade (or known to be in contact or entering
into the structure) The effects of precipitation on soil gas samples are generally less of a concern at depths greater than five feet bgs, under foundations, or from an area that is significantly covered by an impervious surface cover (ITRC, 2007a). Significant precipitation events can displace shallow soil gas and close off pore space pathways. Therefore, samples should not be collected from depths less than five feet bgs following significant precipitation events, as it may provide an inaccurate representation of soil gas conditions. The effect of significant precipitation can be recognized by observing high vacuum readings, extended sample collection time, and visible

4-2
Note: Confusion with Units: One common error that people make with soil-gas programs or data is thinking a ppbv is equivalent to a micrograms per liter (µg/L) or a µg/m3. The units are not equivalent, and the conversion depends on the molecular weight of the compound. Converting between units (e.g., µg/L to µg/m3, percent to ppmv) can also cause issues (Hartman, 2006).
moisture droplets within the sampling train during sample collection. It is generally recommended that at least 48 hours pass after a rain event and prior to sampling.
4.2 Evaluating Soil Gas Data Soil gas sampling results are used in the context of a well understood CSM to assess the potential risk posed to a receptor in a specific building, especially where the vapor source does not lie in contact with or beneath the structure. A checklist for the MDEQ staff is provided in Appendix C to evaluate the use of data for determining compliance.
In general, higher soil gas concentrations are indicative of higher risk to receptors, if other site conditions are the same. The decision framework described below considers four levels of risk that are based solely on soil gas concentration ranges identified from investigation results, as compared with soil gas screening values. The recommendations described in Sections 4.2.1 through 4.2.4 are based on the assumption that soil gas samples were: collected as close as possible to an existing receptor or within the footprint of future building locations; full QA/QC procedures were implemented, documented, and verified; proper sample collection procedures were performed; the vapor source present is either steady state or decreasing; and the vapor samples were analyzed by an approved analytical method (Section 2.4.2). Significant spatial variation (either horizontally or vertically) may be an indication that verification sampling or multiple sampling events over time may be necessary to assess risks more accurately.
4.2.1 Soil Gas Results 10x less than and up to the Soil Gas Concentrations for Vapor Intrusion
As long as the conditions in Section 4.1 are met, soil gas concentrations 10x less than their respective SGvi concentration represent a relatively low risk. It is important to note that if soil gas concentrations are expected at these levels, the samples should undergo a detailed QA/QC procedure in order to document that the samples that are collected are representative of site conditions. Table 4-1 identifies a recommended number of sampling events and the expected outcomes.
4.2.2 Soil Gas Results above the Soil Gas Concentrations for Vapor Intrusion Soil gas concentrations up to their respective IRASL will require further investigation and assessment. Though presumptive mitigation may be pursued (Section 6), in most cases the assessment would include completion of a building survey (Section 5.1), the collection of sub-slab soil gas samples, and possibly confirmation soil gas samples. Table 4.1 identifies a recommended number of sampling events and the expected outcomes.
4.2.3 Soil Gas Results greater than the Immediate Response Activity Screening Levels

4-3
Soil gas concentrations that exceed their compound-specific IRASL indicate a higher VI risk and the potential exists for an acute exposure occurring for the occupants. In these situations, an assessment of the immediate risk (Section 5.2) is performed and presumptive mitigation measures (Section 6) evaluated for immediate implementation.
Table 4-1: Soil Gas Concentrations and Expected Outcomes
SGvi Results Actions Outcome
10x less than and up to SGvi with low or no potential source of vapors
1 sampling event to include full QA/QC
VI pathway is not complete
Less than and up to SGvi after a remedial action has taken place
3 sampling events to include full QA/QC
VI pathway is no longer complete
Less than SGvi with a known source of vapors to remain
4 sampling events to include full QA/QC
VI pathway is not complete
Greater than SGvi, but less than IRASLs
Conduct a building-specific investigation (Section 5)
Assess lines of evidence to determine if mitigation is necessary
Greater than IRASL Conduct a building-specific
investigation and an assessment of immediate risk (Section 5)
Immediately conduct presumptive mitigation or immediately assess the
risk and evaluate future actions
4.3 Unique Vapor Intrusion Conditions The VI investigations should be based on clearly defined objectives consistent with site-specific conditions. Though sites may modify the approach detailed in this document, there are unique situations or conditions that allow for a different approach. The MDEQ has identified the following scenarios as examples of site-specific conditions that may require different investigation objectives and strategies. More information on ways to address these situations is provided in Appendix B.
4.3.1 Petroleum Underground Storage Tanks Petroleum products, such as gasoline and diesel, are complex mixtures containing a wide variety of different hydrocarbons. Subsurface sources can include leakage from USTs, fill ports, pipelines, and various pipe fittings. Many hydrocarbons (notably petroleum-based hydrocarbons) are readily degraded to carbon dioxide in the presence of oxygen by ubiquitous soil microbes. Aerobic degradation is a rapid process and frequently occurs in a relatively thin (a few feet thick) zone where the concentrations of oxygen and hydrocarbons are most conducive for microbial processes. The bioattenuation of hydrocarbons can potentially reduce soil gas concentrations and VI by several orders of magnitude. Therefore, the MDEQ has developed an alternate approach to assess bioattenuation and its potential impact on VI into a structure (Appendix B).
4.3.2 Big Building
Because of the nature of large buildings (e.g., larger footprint, higher air exchange, taller ceilings, lack of a basement, thicker slabs of concrete, and occupational activity patterns resulting in lesser exposure), a generic approach to assessing the potential for VI may overestimate the risk to users of the building. As a result, the MDEQ has identified an approach referred to as the “Big Building Model,” which provides an alternative methodology for large nonresidential buildings (greater than 4,000 m2 or 43,000 ft2) to utilize multiple lines-of-evidence

4-4
to demonstrate compliance with the volatilization to the indoor air exposure pathway (i.e., VI pathway). The MDEQ approach relies primarily on a paper titled, “Prediction of Indoor Air Quality from Soil-Gas Data at Industrial Buildings” (Eklund and Burrows, 2009). This approach is not valid for all large structures and may not be appropriate for use on the entire structure, especially for smaller enclosed areas like offices and meeting rooms. More information on the application of this approach is detailed in Appendix B.
4.3.3 Volatile Soil Inhalation Criteria
Volatilization of organic compounds from contaminated soil or groundwater into the ambient air represents a major potential source of exposure (Radian, 1986). In Michigan, under Part 201, the generic cleanup criteria for soil based on inhalation of volatile hazardous substance emissions to ambient air are called the VSIC. The MDEQ, RD has established an approach that, if implemented as described, would demonstrate compliance with the VSIC using ambient air data in accordance with R 299.5726(8). This is done through the collection of ambient air samples within a flux chamber (flux chamber sampling). More information on the application of this approach is detailed in Appendix B.
4.3.4 Facilities with Releases of Hazardous Substances as Vapors In some cases, the GVIIC and SVIIC are not protective due to facility-specific or contaminant-specific concerns. In situations where these conditions have been identified, additional requirements may be established for response actions (R 299.5532(9)). Situations that require additional response actions include hazardous substances that have been released via a vapor leak or exist as a subsurface vapor cloud. This may occur at facilities that utilize chemicals, such as methylene chloride, ethanol, TCA, TCE, PCE, acetone, and MEK. On-site use of such chemicals could result in vapor leaks from the storage tanks and/or associated piping, even in situations where there is no apparent loss of product from the storage system. These vapor leaks (i.e., vapor clouds) may not only result in soil gas contamination, but could ultimately contribute to soil or groundwater contamination. For instance, due to the high vapor pressures and high vapor densities of chlorinated compounds (e.g., PCE and TCE), vapors may emanate from containers or pipes holding these compounds (in either gaseous or liquid phase) which can collect on the floor, penetrate through the slab, and create a zone of contaminated vapor in the vadose zone. When vapor releases have been confirmed or are suspected at a facility, the collection of soil gas samples in addition to soil and/or groundwater samples will be necessary to adequately evaluate the exposure pathways. In most cases, this will require soil gas samples to be collected from locations alongside or beneath any structures as well as across the facility.
4.3.5 Building with Crawlspaces Buildings with crawlspaces are unique. Therefore, the MDEQ RD has established the approach identified in Appendix B to specifically address these structures. The approach, if implemented as described, would demonstrate compliance using a combination of air samples collected within the crawlspace, as well as shallow soil gas samples collected from the soils underlying the crawlspace.

5-1
Note: It is important to understand that unless a property contains building restrictions, even parcels without structures must consider the type of information gathered for a building-specific investigation. In these circumstances, modifications to the building-specific investigation, that would provide the same type of information, would be necessary. When an answer cannot be definitely obtained, it may be necessary to supplement the approach with restrictive covenants or other measures as identified in Section 6.
5.0 Step 3: Building-Specific Investigation Following a soil gas investigation, it may be determined that further assessment is warranted at a site to adequately address the VI pathway or if the IRASLs have been exceeded. In these circumstances, a building-specific investigation involving the assessment of individual structures may be warranted. The results of a building-specific investigation are used to determine if unacceptable risks exist that require additional response actions.
Building-specific investigations include one or more of the following:
conducting an IBS (Appendix F) conducting sub-slab soil gas sampling (Section 5.3) using information obtained from
the IBS conducting indoor air sampling if water is present within a structure or an acute risk is
being evaluated evaluating the need for response actions throughout each phase of a building-specific
investigation
5.1 Interior Building Survey The IBS consists of two components; a physical building inspection and if warranted, the collection of indoor air samples. The physical building inspection includes, but is not limited to:
the collection of information about building use building construction and condition occupancy and floor plan layout potential vapor entry locations other building features that can influence the potential for VI risk
The physical building inspection should be conducted as part of every building-specific investigation involving sub-slab sampling and prior to the collection of any indoor air samples. This is relevant because it is important to evaluate the potential for background air contamination sources within the structure that could impact the results of the indoor air samples. It should be noted that the presence of a potential source in a structure does not eliminate the need to assess the potential migration of vapors into it; it merely helps in determining how the assessment may need to be performed. The IBS must be completed by an environmental professional, with the approval and assistance of the building owner or other representative, and should include but not be limited to:
results of the physical building inspection scale and basic floor plan layout of the structure documentation of the indoor air quality survey (Section 5.5)

5-2
Note: The immediate safety of the building occupants is the first priority when an acute or immediate hazard from VI is suspected. In such cases, call the local fire department by dialing 911 to activate a local response. Local authorities can typically evaluate the conditions quickly and provide an immediate short-term control measure.
A form similar to the MDEQ’s IBS (Appendix F) should be used to conduct and document the IBS or if an indoor air sample is warranted. The information collected should be included in any document in which the indoor air sampling event is utilized to draw a conclusion.
5.2 Assessment of Immediate Risk As new information is collected, VI risks are evaluated at each step of the investigation. In many cases, unless a detailed assessment of the site has been conducted, it is difficult to determine if an actual acute exposure has occurred or is occurring. The IRASLs were developed to assist in that determination. Although the actual exceedance of an IRASL does not by itself indicate that an acute exposure has occurred or is occurring, it does provide a line of evidence that indicates its potential to occur. Where an exceedance of an IRASL has been identified, indicating a potential risk due to VI (occupants or building), the initial priority should be the immediate safety of the occupants and an assessment of the risk should occur without delay. An exceedance of an IRASL, even in the absence of obvious indicators (odors, physiological symptoms, etc.), is an indication that measures to protect building occupants (e.g., interim response) and conduct immediate actions to determine the risk may be needed. Immediate actions would most likely involve conducting an IBS that included the collection of indoor air samples. In a potential acute/emergency situation, it may not be advisable to wait for laboratory results before making a decision of the risk. In such cases, an investigator may choose to use additional sampling techniques to make an initial acute/emergency decision until the indoor air samples can be analyzed. These techniques may include the use of a PID, CGI, draeger tubes, or similar field screening devices to determine whether volatile gases are present at levels that could indicate an immediate risk and/or even a potential explosion hazard in some circumstances.
If the assessment identifies that an immediate risk is present, response actions should occur that will effectively prevent, minimize, or mitigate injury to the public (R 299.5526(1)(g)). This may include immediately implementing presumptive mitigation measure(s) (Section 6) and possibly temporary evacuation when necessary to protect the public health and safety (R 299.5526(1)(j)).
5.3 Sub-Slab Soil Gas Sampling Sub-slab soil gas sampling involves the collection of samples directly below a building’s foundation. These samples can provide a more direct line of evidence of the risk from VI than soil gas data, as soil gas sampling points may not be located immediately near a building. As a result, sub-slab soil gas sampling can help determine if the VI to indoor air exposure pathway is complete. Indoor air sampling may be conducted concurrently with sub-slab soil gas sampling. However, because of the variation and potential for ambient air samples to be influenced by

5-3
ambient air sources, decisions regarding potential risk and completion of response actions must be weighted toward the sub-slab soil gas sampling results. Existing environmental data (e.g., soil gas, groundwater, and soil data), site information, CSM, and building construction details (e.g., basement, slab-on-grade, or multiple types of foundations, HVAC systems, etc.) must be considered when selecting locations within buildings for sub-slab soil gas sampling points. It is important for the investigator to take into consideration the potential for sub-slab soil gas sampling results to vary both spatially and temporally when planning for and conducting sub-slab soil gas sampling. In general, sub-slab soil gas sample points should include at least one point in a central location away from foundation footings (depending on area). All points should be installed so that the soil gas is collected from within the soil or aggregate immediately below the basement slab or slab-on-grade. The number or density of soil gas sampling points depends on building size, proximity to sources, the scale of soil and groundwater impacts, heterogeneity in subsurface conditions, and the purpose of the data collection. As a general rule, the greater the heterogeneity in a particular exposure unit, the more samples are required for accurate characterization. Additional samples also may be necessary to reduce uncertainty and can be iterative to increase confidence in vapor plume characterization. See Table 5-1 below for a brief discussion of these factors and their influence on a sampling program.
Table 5-1: Influences on Sampling Density
Factor Influence on Sampling Program Rationale
Near Primary Spill/Release Area Increased Sample Density
Soil contamination, or NAPL can produce heterogeneous contaminant distribution; high concentrations can result in a disproportionately large influence on indoor air quality
Large Scale Site Reduced Sample Density
Groundwater as the primary VOC source tends to be more homogeneous than soil sources; contaminant concentrations within larger plumes are more spatially uniform
Reconnaissance Sampling Mode Reduced Sample Density Lower precision required. Primary objective is to define geographic area of concern, not assess risk/compliance
Geologic Heterogeneity Increased Sample Density VI migration rates are sensitive to soil properties, and additional samples are needed to define subsurface variability
Increasing Building Size Reduced Sample Density Conditions tend to be more homogenous in larger commonly ventilated spaces.
When evaluating VI potential beneath single-family residences, collect at least two samples. Collect one sample from beneath the center of the home and the second between the center of the structure and the wall of the building nearest the source of contamination. The exchange of air near the margins of building foundations can locally decrease soil and sub-slab soil gas levels. To obtain the most representative results, collect vapor samples at least 3 feet inside foundation edges. If the contamination is in contact with the structure

5-4
(i.e., footing, wall, etc.) sampling locations will need to be modified. Additional samples should be collected near utility trenches (i.e., vapor transport) that intersect plumes of contamination. For commercial buildings, see Table 5-2 below:
Table 5-2: Sampling Density in Commercial Buildings
Building Size Sample Density Minimum Number of
Samples
Less than 1,000 ft2
NA* 2
1,000 ft2
‐10,000 ft2
One per 1,500 ft2
3
Greater than 10,000 ft2
One per 2,500 ft2
9
*NA = Not Applicable
Table 5-2 identifies a minimum number of sampling points that should be considered in evaluating sub-slab soil gas. The minimum numbers based on field experience have demonstrated spatial variability at structures with differing or multiple foundations and may need to be adjusted based on the factors identified in Table 5-1. The actual number of sub-slab soil gas sample points should be justified and based on the overall aerial extent, number of slabs or multiple levels in contact with the soil (e.g., multiple slabs-on-grade in a large warehouse), and foundation types (e.g., combined basement and slab-on-grade in a residence). For buildings with crawlspaces, the investigation should include the collection of a combination of crawlspace air samples and shallow soil gas samples. Shallow soil gas samples should be collected at least two feet bgs if possible. This is done by modifying the soil gas sample methods in Section 4 and by using lower airflow collection rates. Sample collection rates should be based on site conditions. In the situation where a widespread source area results in the risk of VI to multiple residential properties, it is often difficult to determine where to begin and which properties require the collection of sub-slab soil gas samples. In general, the initial sub-slab sampling focus should be for the following situations:
1. Buildings, including residential dwellings, located above or directly adjacent to known or suspected areas of subsurface volatile chemical contamination.
2. Buildings in which screening with field equipment (e.g., PID, ppbRAE, Jerome Mercury
Vapor Analyzer) suggests VI is occurring.
3. Buildings within known or suspected areas of subsurface volatile chemical contamination that are used or occupied by sensitive populations (e.g., daycare facilities, schools, and nursing homes) should be given special consideration for sub-slab soil gas sampling.
Investigations for sub-slab soil gas and/or indoor air contamination should proceed outward in all directions from known or suspected sources, as appropriate, until the nature and full extent of subsurface soil gas contamination has been characterized and all potential and current human exposures have been identified and addressed. In cases where widespread soil gas contamination is present, statistically valid sampling within a representative number of buildings

5-5
within the study area (rather than all buildings) may be acceptable. Prior to implementation, a statistically based sampling approach can be discussed with the MDEQ specialists as it is important that the approach is based on structures that are similar in construction and condition.
5.4 Evaluation of Sub-Slab Soil Gas Results Sub-slab soil gas results should be used to assess risks posed to receptors in buildings in context with a well developed and understood CSM. The evaluation must consider and use all quantitative and qualitative site investigation results. For risk-based decision making, it is important the investigator use all appropriate lines of evidence collected during the site investigation which should include the spatial and temporal data trends of the site-wide soil gas sources. The recommendations in Table 5-3 assume the collection of at least two sub-slab soil gas samples during a period in which the home is most likely to be influenced by subsurface vapors. This may be in either the heating or the cooling season, depending on the installed heating and cooling systems. Soil gas sample results that vary significantly spatially (either horizontally or vertically) are an indication that verification sampling or multiple sampling events over time may be necessary to assess risks more accurately. As identified in Table 5-2, the sub-slab soil gas results may either indicate that a risk from VI does not exist, indicate the necessity to collect additional samples to determine risk, or evaluate the need for mitigation which may include the need to perform an immediate assessment of risk. Sub-slab soil gas concentrations above a compound’s individual SGvi-SS, even after one sampling event, is a strong indication of a potential for risk. In most cases, the mitigation measures should be implemented within six months, unless quicker implementation is warranted. Sub-slab soil gas concentrations at or approaching an IRASL in any one sampling event provide strong evidence of the need to implement appropriate response actions. In these situations, an assessment of immediate risk (Section 5.2) should also be performed and presumptive mitigation measures should be immediately implemented (Section 6).
Table 5-3: Sub-Slab Soil Gas Concentrations and Expected Outcomes SGvi-SS Results Actions Outcome
> 10x less than the SGvi-SS 2 sampling event to include full QA/QC VI pathway is not complete
Less than SGvi-SS 4 sampling events to include full QA/QC VI pathway is not complete
Less than SGvi-SS after a remedial action has taken place
3 sampling events to include full QA/QC VI pathway is no longer complete
Greater than SGvi-SS, but less than IRASLs
Any sampling event Evaluate the need to mitigate after each
sampling event
Greater than IRASL Any sampling event Perform assessment of immediate risk
or presumptively mitigate

5-6
5.5 Sampling Indoor Air
The MDEQ recommends the collection of indoor air samples only after the evaluation of soil gas, sub-slab soil gas, and other site investigation results indicate the need for an assessment of immediate risk. Indoor air sampling may also be appropriate if groundwater at concentrations above the GWvi-sump is entering or in contact with the structure and cannot be assessed by either soil gas or sub-slab soil gas samples. Where soil gas or sub-slab soil gas samples cannot be collected, the direct assessment of indoor air sampling may be appropriate. Residential indoor air samples should be collected over a 24-hour period. Nonresidential indoor air samples should be adjusted to an 8- or 12-hour exposure scenario and require the use of individual, certified clean canisters. Indoor air samples should be collected under conditions that are representative of normal operational conditions (e.g., doors opened or closed, heating system is in use if winter, etc.). During the collection of indoor air samples, the HVAC system should operate under normal conditions. In summer months, windows should be closed to minimize the contribution of ambient air. The guidelines for the collection of representative indoor air samples include:
in general, samples should be collected from the lowest habitable level and from each occupied building floor at a rate of one indoor air sample per 1,000 sq ft of open space within a structure
placement of the evacuated canister should be in the breathing zone approximately three to five feet from the floor
the samples should be collected away from windows or other sources of exterior air leakage
if direct preferential pathways are identified (e.g., earthen floors, unsealed crawlspaces, sumps), additional indoor air samples should be collected from those areas
multiple indoor air sample locations are necessary for multiple foundations, multifamily residential units, and larger commercial or retail buildings
When indoor air sampling is deemed appropriate for evaluation of immediate risk, the MDEQ recommends consecutively collected indoor air sampling events over at least three seasons. For closure, the MDEQ requires that enough events be collected to account for a statistical evaluation of the data to assess the site conditions and account for seasonal and expected fluctuations. Each sampling event should be documented in a manner similar to that outlined in Appendix F. Results of the indoor air quality survey should be used to identify chemicals that may skew or complicate the interpretation of the indoor air sampling results and to prepare the building for the sampling process by temporarily removing potential background vapor sources. The survey results cannot be used to eliminate any VOCs from consideration. The MDEQ recommends that an indoor air quality survey, similar to the one provided in Appendix F, be completed at least two weeks prior to collecting indoor air samples. The results of the survey should be provided to the building owners or occupants with specific instructions to help minimize the potential for indoor air background contamination. All indoor air sampling results should be accompanied by a completed or updated survey which includes a description of modifications that the occupants were requested to make and to what extent they complied.

5-7
5.6 Using Multiple Lines of Evidence
The use of VI receptor surveys and screening values to evaluate soil gas, sub-slab soil gas, and indoor air sampling results has been previously addressed. This section discusses other important lines of evidence to consider when interpreting investigation results. The lines of evidence discussed below are important in distinguishing whether compounds detected in the indoor air are derived from VI. Contaminant sources not resulting from VI are referred to as background contaminant sources. Identifying the sources of possible indoor air contamination can be difficult; however, the efforts made to distinguish between VI and background sources represent a critical component of interpreting indoor air results, especially when an assessment of immediate risk is occurring.
5.6.1 Spatial and Temporal Variations of Data Trends
The site-wide spatial distribution of vapor sources and concentration trends, relative to receptor locations, can be important qualitative information regarding risks, especially at larger sites. Information regarding whether vapor sources are stable or attenuating is needed to understand whether sampling results are representative of future conditions near receptors. Such
qualitative risk considerations are based on the recognition that actual three-dimensional migration patterns of vapors can be complex and vary spatially and temporally.
5.6.2 Physical Building Inspection A physical building inspection (Section 5.1, Part 1 of the IBS, Appendix F) provides qualitative information regarding the likelihood that subsurface soil gas in close proximity to or beneath a building will enter the building through preferential pathways such as cracks,
sumps, earthen floors, drain tiles, utility penetrations, or other openings. Examples of other lines of evidence for risk evaluation include the condition of the building foundation, the long-term integrity of the building structure, and the magnitude of sub-slab concentrations. The presence of obvious preferential pathways along with elevated soil gas and sub-slab results can indicate that a completed pathway is likely, and in such cases identified entry points should be sealed if possible (Section 6.2.1). Mechanical ventilation systems can influence VI by the amount of ventilation (e.g., air exchanges) provided and how the systems modify the interior building pressure.
Spatial Patterns
It may be discovered that buildings with a specific design feature may be more susceptible to VI and warrant closer attention or proactive mitigation. The building does not necessarily need to be located over the most highly contaminated area.
Note: Multiple rounds of sampling are typically required to demonstrate that the VI pathway is not complete when there is a source of vapor present. The number of sampling events depends on the concentrations detected, location of the source, and the ability to document appropriate sampling procedures, including the use of a tracer gas. In most cases, if proper sampling techniques are employed, enough sampling locations are installed to address potential spatial variability, and the results are 10x less than the SVvi, only two rounds of sampling would be necessary to demonstrate compliance.

5-8
5.6.3 Common Sources for Background Contamination Many common contaminants are typically found in a release such as solvents and petroleum compounds. They can also be derived from common household products, paints, varnishes, household hobbies, building materials, the use of tobacco products, and chemicals stored in basements or in attached garages. Low levels of several common petroleum compounds and other VOCs are present in outdoor ambient air, especially in urban locations. Nearby point source emissions may also contribute to outdoor ambient air contamination. When outdoor ambient air contaminants are present, they are also likely to be found in the indoor air of buildings at varying levels. Several studies have been published in recent years on the subject of the background concentration of VOCs in indoor air which document the widespread occurrence of a large number of VOCs that are consistently found in residential indoor air due to background sources rather than from VI (e.g., Folkes and Kurz, 2002; Dawson and McAlary, 2009). The results of such studies emphasize the importance of conducting building surveys and collecting outside ambient air samples as an integral part of all indoor air site investigations. Some of the common causes of indoor and outdoor background contamination originate from the types of sources listed in Table 5-4.
Table 5-4: Common Background Sources of Indoor Air Contaminants Source
Type Category Examples
Indoor air background sources
Consumer products Household cleaners, dry-cleaning chemicals (i.e., PCE), clothing recently dry- cleaned, air fresheners, aerosols, mothballs, scented candles, insect repellents
Building materials or building sources
Carpets, insulation, paint, varnishes, wood finishing products, polyvinyl chloride (PVC) pipe cleaners and glue, municipal drinking water as a contributor of volatile disinfection products from tap water, contaminated domestic drinking water
Combustion processes Smoking, cooking, home heating
Occupant activities Craft hobbies, woodworking, home repair activities using glues, paints, solvents, etc.; fuels or chemicals stored in attached garages either in storage containers or equipment
Commercial or industrial work place chemicals
Can vary widely depending on past and current use
Residual past chemical use or spills in building
Can vary widely depending on past use
Outdoor ambient air sources
Urban mobile petroleum sources
Cars, trucks, airplanes, boats, construction equipment
Stationary industrial sources
Nearby chemical or fuel spills, bulk fuel storage or distribution

6-1
6.0 Step 4: Response Actions Response actions for the VI pathway are necessary when there is evidence of a completed pathway and the risks posed to human health are deemed unacceptable. The term response action is used in this document to refer to all means of mitigating VI risk through remedial actions. A response action can include one or more of the following measures:
remediation of the source of the vapor contamination preventing VI at the receptor using building control technologies controlling VI risks through institutional controls, long-term monitoring, engineering
controls, or other long-term risk-management tools The primary remedial objective is to eliminate risks to receptors. But the specific remedial actions required to achieve this goal may be site-specific and should be established early during the evaluation of remedial actions and in coordination with the MDEQ project staff. Regulated parties and environmental consultants should consult the specific MDEQ program to determine the programmatic submittal, approval, and other reporting requirements associated with response actions. The following Sections 6.1 through 6.3 provide supporting information and general recommended practices for response actions most commonly used to eliminate VI risks. However, the MDEQ acknowledges that there may be other acceptable response actions and risk reduction strategies for VI beyond those discussed in this section. Section 6.4 discusses operation and maintenance of constructed remedies and long-term monitoring that may be required to ensure remedial objectives are achieved.
6.1 Source-Area Remediation Source-area remediation refers to the response actions conducted to address contaminated soil, groundwater, or NAPL that serves as the source for vapors. Examples of source-area remediation include:
soil excavation SVE MPE air sparging groundwater treatment and containment technologies in-situ chemical oxidation
Source-area remediation alternatives have varying degrees of effectiveness in addressing immediate VI risks, either due to the length of time to implement the remedy or the time required for the remediation to reduce contaminant levels.

6-2
6.2 Building Controls for Vapor Mitigation
Building controls refers to the use of technologies to eliminate completed VI pathways at a building. Building control technologies may be necessary to rapidly respond to unacceptable risks to receptors in buildings. The most common building control design and installation recommendations are discussed in Sections 6.2.2 through 6.2.7 and include:
SSD SMD venting systems for new building construction passive vapor barriers at new building construction building pressurization and ventilation air cleaners (for interim response action)
6.2.1 Sealing Building Leaks
As stated above (Section 1), vapors generated from contaminated soil, groundwater, NAPLs, or buried waste materials can preferentially enter structures through minute cracks in foundations, pipe or utility penetrations through the concrete floor slabs or walls, through foundation drainage, or sump systems. Though gases may also actually move through porous concrete, VI is more likely to occur if there are leaks and openings in the building envelope. When this pressure differential exists, even small leaks in the building envelope can encourage VI. Common building locations where leaks and openings can occur include:
foundation and basement wall cracks floor sumps floor drains floor or wall slab joints cinder blocks and mortar joints penetrations from piping, wiring, and ducts
Note: Mitigation systems can be further classified into two main types: passive and active. Active mitigation systems use mechanical means to redirect subsurface vapors from beneath the structure into the outside atmosphere. Passive mitigation systems reroute the vapors without the use of mechanical means.

6-3
If such entry points are identified for the direct entry of vapors into the structure, the entry points should be sealed by:
using VOC resistant caulk or expanding foam to seal openings and cracks
repairing damaged concrete slabs covering and sealing areas of exposed earth
or pits with VOC resistant materials placing airtight sump covers on existing
sumps and venting to the exterior of the structure
Though sealing a building is not a stand-alone measure to mitigate a structure, the implementation of these measures have been shown to increase the effectiveness of many mitigation techniques described below in Sections 6.2.2 through 6.2.5. Sealing of leaks can be especially important when considering the use of active SSDs since building leaks, depending on their location, can reduce their effectiveness. Leaks in building foundations and floor slabs can often be identified during a physical building inspection or by conducting pre-mitigation diagnostic pressure field extension tests.
6.2.2 Sub-Slab Depressurization System
The SSDs (Figure 6-1) prevent VI into buildings by lowering the air pressure in the soils directly beneath the building’s floor slabs relative to indoor air pressure. The typical residential SSD consists of vertical piping installed into a cavity (known as a suction pit) that is dug below the lower level floor slab. The collected vapors are exhausted to the atmosphere above the building’s roof line by using a mechanical means (i.e., a low wattage fan). As used in the MDEQ guidance, the term SSD implies the use of an active system. The SSDs are considered among the most effective VI mitigation strategies for existing buildings and have been documented to achieve vapor concentration reductions up to 99 percent (USEPA, 1993; Folkes and Kurz, 2002). The SSDs can be used to mitigate both residential as well as larger commercial/industrial buildings where a concrete slab directly overlies soil.
Many best management practices developed and documented within the radon mitigation industry for diagnostic testing, design, and installation of the SSDs are applicable to the SSDs designed for VI. There are two main differences that need to be considered. The SSDs must be designed to:
Key Considerations of the SSDs • Most widely applied and effective systems for VI control • Applicable to new and existing construction • One or two suction pits adequate in most existing single-family homes • Typically combined with venting layer and passive barrier in new construction • Performance may be limited by low permeability subsoils • May be supplemented with other forms of mitigation, like drain tile, block wall depressurization, or passive barrier systems
Figure 6-1 - Active sub-slab depressurization system shown on the outside of a home.
From Kansas Department of Health and Environment

6-4
have complete coverage of a floor slab or have data that supports the installation of a partial system
be able to achieve constant negative pressure in the sub-slab Guidance discussing the SSD construction can be found at the following sources: “Standard Practice for Installing Radon Mitigation Systems in Existing Low-Rise Residential Buildings” (ASTM Standard E2121, 2003); the “Radon Reduction Techniques for Existing Detached Houses – Technical Guidance” (USEPA, 1993), which provides the design considerations for a SSD system in a residential home; and the “Radon Prevention in the Design and Construction of Schools and Other Large Buildings (USEPA, 1994b), which provides design considerations for the SSDs designed for larger buildings. A sub-slab diagnostic test should be conducted prior to installing the SSD to document the operational design needed to successfully mitigate the building. The primary purpose of sub-slab diagnostic testing is to simulate a completed SSD to determine the number and location of suction pits required to obtain sufficient pressure field extension beneath the slab. Detailed guidelines for conducting a sub-slab diagnostic test can be found in “Radon Reduction Techniques for Existing Detached Houses – Technical Guidance” (USEPA, 1993). A checklist for evaluating the design of a SSD is provided in Appendix C.
6.2.3 Sub-Membrane Depressurization System
The SMD utilizes a membrane as a surrogate for a slab to allow depressurization of the soil. The SMD has been demonstrated to be the most effective mitigation method in existing buildings where earthen floors, such as crawlspaces, provide a vapor entry location (USEPA, 1993b). An impermeable membrane covers the exposed dirt surface of a crawlspace while the depressurization system withdraws soil gas from beneath the membrane and prevents its intrusion into the space above. Properly installed SMDs have resulted in vapor concentration reductions of up to 99.5 percent, similar to SSDs (Folkes and Kurz, 2002). Figure 6-2 illustrates its application. Like the SSDs, the SMDs typically require a continuously operated fan to vent vapors from beneath the installed membrane to the atmosphere. Due to the difficulties of sealing the openings and potential for tearing and damage to the membrane, permanently sealing the earthen floor or crawlspaces with a more permanent covering may be a
better alternative to the SMDs. Membranes installed must be well maintained to ensure effectiveness and therefore the SMDs may require more long-term maintenance than a SSD.
Key Considerations of a SMD • Most widely applied and effective systems for crawlspace homes • Applicable to new and existing construction • Suction field extension (e.g., perforated pipe) may be required for tight soils • Liners should be sealed to foundation walls and footings • Liners should be protected against damage where access (e.g., to service furnaces or plumbing) is expected • Performance may be limited by low-permeability sub-soils • May be combined with the SSD, drain tile, and/or block wall systems
Figure 6-2 - Active sub-membrane depressurization system. From Kansas Department of Health and
Environment

6-5
6.2.4 Passive Barrier System
A passive barrier system is a combination of one or more synthetic membranes coupled with a passive or active venting system beneath the liner. This system prevents the migration of subsurface vapors into the building by providing a vapor resistant material to prevent the upward migration. The venting system is designed to allow pressure relief and venting of contaminant vapors collected beneath the liner to the atmosphere above the roof line. Fluid-applied membranes are spray-applied directly to substrates, fabric layers, and building penetrations. These membranes can result in a well adhered and seamless membrane when installed properly by a contractor who has been trained and approved by the membrane provider. Sheet membrane comes in rolls of varying materials and sizes. However, sheet membranes are rarely employed due to the difficulty in sealing penetrations from subsurface utilities.
Care must be taken during installation of a passive barrier system as damage will render the barrier ineffective. Small tears, punctures, gaps, or defects in a membrane can create a pathway for vapor entry into buildings and they must be properly sealed. Penetrations through the membrane for utility conduits piping, etc. must also be properly sealed. When evaluating the performance and effectiveness of various vapor barrier products, the following factors need to be considered: the membrane’s ability to inhibit diffusion or vapor permeation, puncturing and tearing, and the chemical resistance of the membrane. Appropriate testing methods must be incorporated as part of the project’s quality control procedures. The use of a smoke test on a synthetic membrane is an effective method to test for the presence of leaks. A smoke test involves the use of a generator or blower to introduce an inert, nontoxic smoke with sufficient pressure beneath a membrane to visually identify leaks. Appendix C contains a checklist on the key components of the design of a passive barrier system.
6.2.5 Building Pressurization and Ventilation using Heating, Ventilation or Air Conditioning
The HVAC systems in commercial and industrial buildings can help minimize or prevent VI into buildings by providing positive pressure and ventilation. Building pressurization is achieved by having greater air inflow than outflow, resulting in positive pressure differential of the indoor environment relative to the sub-slab environment. This can assist in preventing VI from the subsurface if this pressure differential between indoor air and the sub-slab environment can be established and maintained for interior spaces. Because it is extremely hard to document and verify the effectiveness of positive pressure, and is only possible when the HVAC is in operation, sole use of positive building pressure as a mitigation method is not recommended. Modification of any HVAC system to maintain a positive pressure within the structure can be a valuable component to supplement any active or passive mitigation system.
Key Considerations of a Passive Barrier System • Barrier has been evaluated to withstand the vapor concentrations • Barrier includes a thorough quality control procedure implemented to minimize barrier damage • Inspect barrier seals at all edges, penetrations, and seams • Test barrier integrity and performance after installation • Have contingencies to supplement passive barriers if performance is inadequate

6-6
The HVAC system air exchange rates for buildings undergoing vapor mitigation should be evaluated and compared with industry standards to ensure they are appropriate for the building size and use, sensitive populations, and occupancy rates. Requirements for the HVAC systems, as developed by the American Society of Heating, Refrigerating and Air-Conditioning Engineers (ANSI/ASHRAE Standard 62.2, 2007), are designed to achieve minimum levels of air circulation for occupant health and comfort. These minimum ventilation rates are typically insufficient to address all indoor air risks. Air exchange rates for existing HVACs or other air-exchange systems should be included as part of the physical building inspection conducted for VI investigations and as part of the documentation to support the effectiveness of the HVAC operation (Appendix F). These rates can be obtained from a
building operations manager for a commercial or industrial facility or by contacting the equipment manufacturer. Environmental VI risks in underground parking garages are typically lower than risks or concerns posed from carbon monoxide and automobile fuel vapors, which are necessarily addressed through the use of mechanical ventilation. Unless an enclosed parking garage is adjacent to an occupied structure or near a significant subsurface source of VOC vapors, it is unlikely that the additional risks associated with short-term exposure from vapors would be significant. In these situations, the MDEQ recommends that the ventilation rate and design for the structure be documented and included as part of the assessment and evaluation of whether a risk is present.
6.2.6 Indoor Air Cleaners
Indoor air can also be directed to air pollution control equipment (e.g., activated carbon treatment systems) to remove air contaminants from the building interior. It can be an effective interim response action to address immediate risks that have been identified until a longer more permanent measure can be designed and employed. This technique is dependent on the treatment system’s uninterrupted performance to protect receptors. During the use of these short-term interim systems, there must be an indoor air sampling program to confirm the effectiveness of the
operation. Activated carbon filters are able to remove the VOCs in the indoor air to below detection limits of 1 to 2 μg/m3 for TCE and its daughter products as well as hundreds of other chemicals; however, a carbon filter alone may not be effective. Other factors that need to be considered are proper operation and maintenance, inadequate airflow, unit size relative to the size of the room being treated, contaminant concentrations, and contaminant distribution. In addition, capital costs, annual operating expenses, and waste disposal concerns can be a drawback to using this technology. Nevertheless, there may be circumstances in which this type of mitigation can be useful, i.e., high water and wet soils.
Key Considerations of Indoor Air Treatment • Less effective than other VI control methods • Expensive to install, operate, and maintain • Typically generates waste (e.g., spent carbon)
Key Considerations of Building Pressurization • Not generally practical • Requires relatively “tight” buildings to limit airflow and energy costs • Typically extremely costly as it requires constant air exchange even when the system is not actively heating or cooling • May require new or modified HVAC equipment

6-7
6.2.7 Other Building Controls used for Mitigation Several other building control technologies have been used, particularly in the radon mitigation industry, and although less common, may be an option in some situations. Though in most cases, these additional measures are most appropriate when implemented to supplement the effectiveness of some of the other systems previously discussed.
Block Wall Depressurization Block wall depressurization is a mitigation technique that mechanically depressurizes the void network within a block wall foundation by drawing air from inside the wall. It uses an electric fan and vents the collected vapors to the outside. As with other depressurization systems, diagnostic testing should be conducted to ensure uniform depressurization can be achieved.
Drain Tile Depressurization Drain tile depressurization is a mitigation technique that can be used at a building that has perforated drain tile installed along the inside or outside of its foundation. If the drain piping discharges to a sump pit, the negative pressure field should be applied to the sealed sump pit. Alternatively, if the drain piping discharges to an outdoor location, the negative pressure field should be applied to the terminal end.
6.3 Institutional Controls Institutional controls can provide an administrative or legal control to manage ongoing or future risks, supplement other response actions, and help ensure that potential risks are mitigated. Institutional controls can be used as a component of response actions at remediation sites administered pursuant to Section 20114c of Part 201 to limit unacceptable exposure for either long-term risk management or until site remediation or natural attenuation reduces exposure concentrations to acceptable levels. In situations where response actions may take a considerable amount of time or cannot effectively eliminate long-term VI concerns, institutional controls can help manage long-term risks. Institutional controls include legally enforceable restrictions and deed restrictions. The recording requirements for instruments filed with Michigan County Register of Deeds offices are contained in Section 1 of the Recording Requirements Act, 1937 PA 103, as amended (Act 103), MCL 565.201 et seq. Potential uses for an environmental covenant as a component of a response action to address VI risks include:
requiring the use of building controls (either ongoing use or future use) to address VI risks to on-site or off-site properties
controlling the type of property use (e.g., residential, commercial/industrial) at a property where VI risks are considered likely
Appendix H contains the instructions for the model Declaration of Restrictive Covenant to be used to place land use or resource use restrictions pursuant to Section 20114c(3) of Part 201.
6.4 Mitigation Verification, Monitoring, and Closure Remedial verification, monitoring, and closure criteria will vary depending on site-specific conditions and program-specific requirements. Additional guidelines for conducting remedial verification sampling, monitoring, and system maintenance are provided below.

6-8
6.4.1 Mitigation Verification Mitigation systems must be inspected after they are installed and during their use to ensure they are working effectively. Review checklists for mitigation system design have been included in Appendix C and address the need for post installation system verification. This verification typically includes the testing, measurements, and/or documentation necessary to ensure that the system is functioning as designed. Inspections must be conducted and documented for building sealing activities and other improvements made to building floors or walls, if conducted as components of a remedy. Information to support that the system is effective can include follow-up sub-slab sampling or follow-up indoor air sampling. In some cases, concurrent indoor air and sub-slab vapor sampling may be required after a mitigation system is operational to verify system performance and effectiveness. Indoor air sampling is especially warranted if pre-mitigation sampling results confirmed elevated concentrations either in the sub-slab vapor or indoor air.
6.4.2 Part 55, Air Pollution Control, of the Natural Resources and Environmental Protection Act, 1994 PA 451, as amended
In designing an active mitigation system, the design must consider the requirements of Part 55, including establishing limits on the potential to emit contaminants. Depending on the limits established, a person may need to obtain a permit to install or document any exceptions allowed in R 336.1202, or in R 336.1277 to R 336.1290. The requirements of R 336.1201(1) to obtain a permit to install do not apply to an emission unit if the conditions under R 336.1290 are met. Sources using this exemption must not meet any of the criteria in Rule 278 and must be able to demonstrate compliance with the various emission limits contained in Rule 290. Appendix I provides the details of requirements for the exemption. It should be noted that there are specific requirements that must be met in order for the exemption to be valid. These include:
a description of the emission unit must be maintained throughout the life of the unit records of material use and calculations identifying the quality, nature, and quantity of
the air contaminant emissions must be maintained in sufficient detail to demonstrate that the emissions meet the emission limits outlined in Part 55
the records must be maintained on file for the most recent two-year period and made available to the MDEQ, Air Quality Division upon request.

6-9
6.4.3 Operation and Maintenance and Long-Term Monitoring
Long-term maintenance and monitoring may be necessary at a site with an installed mitigation system to ensure the system is operating (active mitigation) and verify that conditions have not changed (passive mitigation). Long-term monitoring plans must be tailored to the design as well as the components of the installed mitigation system. The need for long-term operation, monitoring, and maintenance plans is greater at sites where:
long-term monitoring is needed to verify and confirm ongoing remedial effectiveness the remedial system requires periodic adjustments and maintenance immediate risks to receptors would result if the system failed or if site conditions
changed the conditions that would trigger specific contingent responses require ongoing
monitoring At sites with ongoing post-construction and remedial actions, the operation and maintenance plans should clearly specify the following information in accordance with R 299.5538:
name, phone number, and address of the person who is responsible for the operation and maintenance
operation and maintenance activities and schedule a discussion of the critical system’s reliability, including options for repair or redundancy design and construction plans equipment diagrams, specifications, operating manuals, and manufacturers’ guidelines emergency plan, including emergency contact phone numbers a contingency plan that addresses response to failure of any critical system component other information required to determine the adequacy of the operation and maintenance
plan Most mitigation systems will also require the use of a contingency plan, or similar corrective action document, to identify conditions that may trigger the need for additional maintenance, collection of additional data, modifications of monitoring frequency, or other responses to ensure the remedy remains effective. Conditions that might trigger additional responses could be based on monitoring results, facility or system inspections, operational problems of the remedial system, or other information that may indicate that the remedial objectives are not being met.
Any monitoring of the mitigation system or of concentrations (R 299.5540) must address the following, as appropriate to the facility:
the effectiveness of the response activities in protecting the public health, safety, and welfare and the environment, including a plan and schedule for determining whether the objectives were achieved
the effectiveness of the response activities in minimizing, mitigating, treating, or removing environmental contamination at a facility
Note: An operation and monitoring plan is reviewed by the MDEQ under a Response Activity Plan under Part 201 and a Final Assessment Report submitted under Part 213.

6-10
location of monitoring points for collection of environmental data environmental media to be monitored such as soil, air, water, sediment, or biota monitoring schedule monitoring methodology, including sample collection procedures substances and conditions to be monitored Laboratory methodology, including the name of the laboratory responsible for analysis of
monitoring samples, and whether target detection limits were achieved for the monitoring samples. The QA/QC samples that document the accuracy and precision of the monitoring samples shall be made available to the MDEQ on request.
QA/QC plan data presentation and evaluation plan contingency plan to address ineffective monitoring operation and maintenance plan for monitoring equipment an explanation of the way in which monitoring data will be used to demonstrate
effectiveness of the response activities other elements required to determine the adequacy of the monitoring plan
6.4.4 2010 Amendments to Part 201
In 2010, Sections 20114a to 20114d of Part 201 were revised to contain a response activity plan submittal and review process. Though Section 20114a expanded the self implementation provisions of Part 201, there are specific situations that continue to require the MDEQ approval, including the use of site-specific criteria. For example, if the generic GVIIC and SVIIC do not apply (R 299.5714 and R 299.5724) and a site-specific criterion is developed in accordance with these rules, the MDEQ approval is necessary. Appendix D represents values that the MDEQ has reviewed and approved when they are used appropriately. Their use, however, does not constitute approval unless, through the submittal of the response activity plan, the MDEQ concurs that they were applied appropriately. Section 20114b (response activity plan review), subject to Section 14, was amended so that submittal of a response activity plan can include a request for MDEQ approval of one or more aspects of a remedial action. Therefore, response activity plans as they relate to the volatilization to indoor air pathway may result in the submittal and request for approval of a deed restriction, a remedial action, or mitigation system (including a presumptive mitigation system). A post-closure monitoring report would be required under Section 20114c (implemented remedial actions) if there are land use or resource use restrictions. As specified in Section 20114d (No further action report), upon completion of a remedial action that satisfies applicable cleanup criteria and all other requirements that are applicable to the remedial action, a No Further Action (NFA) Report may be submitted. Though some mitigation systems may qualify for a NFA Report (e.g., a liner with a passive venting system with appropriate property and deed restrictions (Section 6.3)), most active mitigation systems (SSD or SMD) would not qualify for a NFA Report, as they would fail to meet the requirements established under Section 20114(d)(2)(b). It is anticipated that a mitigation system would require a post-closure plan and most systems will also require a post-closure agreement, even those with a liner and a passive venting system (Section 6.2.5).

7-1
7.0 References American National Standards Institute (ANSI) and American Society of Heating, Refrigerating
and Air-Conditioning Engineers (ASHRAE). 2007. Ventilation and Acceptable Indoor Air Quality in Low-Rise Residential Buildings. ANSI/ASHRAE 62.2-2007.
ASTM Standard E2121. 2003. Standard Practice for Installing Radon Mitigation Systems in
Existing Low-Rise Residential Buildings. ASTM International, West Conshohocken, Pennsylvania, www.astm.org.
Dawson, H. and McAlary, T. “A Compilation of Statistics for VOCs from Post-1990 Indoor Air
Concentration Studies in North American Residences Unaffected by Subsurface Vapor Intrusion.” Groundwater Monitoring & Remediation, 29, No. 1, Winter 2009, pages 60-69.
Eklund, B. and Burrows, D. 2009. “Prediction of Indoor Air Quality from Soil Gas Data at
Industrial Buildings.” Ground Water Monitoring & Remediation, Volume 29, Issue 1, Pages 118-125, Winter 2009.
Folkes, D. J. and D. W. Kurz. 2002. “Efficacy of Sub-Slab Depressurization for Mitigation of
Vapor Intrusion of Chlorinated Compounds.” Presented at Indoor Air 2002, the 9th International Conference on Indoor Air Quality and Climate, International Academy of Indoor Air Sciences, Monterey, California.
Hartman, B. 2002. “Reevaluating the Upward Vapor Migration Risk Pathway.” LUSTLine
Bulletin 41. Hartman, B. 2006. “How to Collect Reliable Soil-Gas Data for Risk-Based Applications-
Specifically Vapor Intrusion, Part 4 - Updates on Soil-Gas Collection and Analytical Procedures.” LUSTLine Bulletin 53.
Hewitt, A. D. 1994. Losses of Trichloroethylene From Soil During Sample Collection, Storage
and Laboratory Handling. U.S. Army Corps of Engineers, Cold Regions Research and Engineering Laboratory. Special Report 94-8.
Hewitt, A. D. 1999. Storage and Preservation of Soil Samples for Volatile Compound Analysis.
U.S. Army Corps of Engineers, Cold Regions Research and Engineering Laboratory. Special Report 99-5.
Interstate Technology & Regulatory Council (ITRC). 2007a. Vapor Intrusion Pathway: A
Practical Guidelines, January 2007. Accessed at http://www.itrcweb.org/Documents/VI-1.pdf.
Interstate Technology & Regulatory Council (ITRC). 2007b. Vapor Intrusion Pathway:
Investigative Approaches for Typical Scenarios, January 2007. Accessed at http://www.itrcweb.org/Documents/VI-1A.pdf.
Liikala, T. L., K. B. Olsen, S. S. Teel, and D. C. Logan. 1996. Volatile Organic Compounds:
Comparison of Two Sample Collection and Preservation Methods. Environmental Science and Technology, Volume 30, N. 12, pages 3441-3447.

7-2
Radian Corporation. 1986. Measurement of Gaseous Emission Rates From Land Surfaces Using an Emission Isolation Flux Chamber User’s Guide. EPA Contract No. 68-02-3889.
USEPA. 1993. Radon Reduction Techniques for Existing Detached House – Technical
Guidance. EPA 625-R-93-001. USEPA. 1993b. Radon Reduction Techniques for Existing Detached Houses, Technical
Guidance for Active Soil Depressurization Systems. EPA/625/R-93/011. USEPA. 1994b. Radon Prevention in the Design and Construction of Schools and Other Large
Buildings, Third Printing With Addendum. EPA 625-R-92-016, June 1994. USEPA. 2002a. Draft Guidance for Evaluating the Vapor Intrusion to Indoor Air Pathway From
Groundwater and Soils. EPA 530-D-02-004, November 2002. USEPA. 2005. Uncertainty and the Johnson and Model for Vapor Intrusion Calculations.
EPA/600/R-05/110, September 2005. USEPA. 2008. Vapor Intrusion Database: Preliminary Evaluation of Attenuation Factors,
Office of Solid Waste, March 4, 2008. Available at http://iavi.rti.org/. Vitale, R. J., R. Forman, and L. Dupes. 1999. Comparison of VOC Results Between Methods
5030 and 5035 on a Large Multi-State Hydrocarbon Investigation. Environmental Testing and Analysis, January 1999, pages 18-39.

APPENDIX A
Generalized Flowcharts for the Evaluation of the Vapor Intrusion
Pathway

Overview of Investigating VI
1
Step 4: Response Actions
Step 3: Building Specific
Investigation
Step 1: Screening Level
Assessment
Step 2: Conducting a Soil Gas Investigation
2
3
No further investigation
warranted
- Multiple decision point
- Additional options
Page 1 of 4

Step 1: Screening Level
Assessment Conditions that may warrant further evaluation:• Ground water exceedance of GWvi• NAPL within critical distances• Indoor Air exceedance of IAvi• Soil Gas exceedance of SGvi• Shallow soil gas exceedance of SGvi-SS• Wet basement or sump above GWvi-sump• Methane present that may cause an explosion hazard• Soils above SVI• Other indications of VI (odor)Evaluate for conditions that may pose
a VI risk (establish receptor screening area)
Review existing site information or collect information necessary
to develop initial CSM
No further investigation warranted
Evaluation identifies
conditions for VI present?
YES
NO
Presumptive mitigation?
YES
NO
Step 4: Response Actions
Evaluate building
first?
Step 2: Conducting a Soil Gas Investigation
Step 3: Building Specific
Investigation
NO
YESIRASLs
exceeded?
YES
NOSufficient data available?
NO
YES
Immediate response required
NO
Page 2 of 4
YES

Step 2: Conducting a Soil Gas Investigation
Refine CSM (if necessary)
Sufficient data to
establish receptor
screening area?
Acquire additional data which may include
groundwater and soil data
Perform soil gas investigation
YES
NO
IRASLs or other site
specific levels exceeded?
NO
YES
Sufficient data to rule out VI?
Proceed to Step 4:
Response Actions
YES
NO
NO
Is an immediate response
appropriate?
NO YES
YES
Results exceed SGvi?
Further refine site specific screening
levels?
YESNO
NO
YES
Collect additional data
Step 3: Building Specific
Investigation
Presumptively mitigate?
No further investigation
warranted
Results exceed new site specific screening
levels?
NO
YES
Refine CSM (if necessary)
Page 3 of 4

Step 3: Building Specific
Investigation
Refine CSM (if necessary)
No further investigation
warranted
YES NO
NO
YES
Collect necessary data
IRASLs exceeded?
Proceed to Step 4:
Response Actions
NO
YES
YES
NO
Refine site specific
screening levels?
Results exceed new site specific screening
levels?
Sufficient data to rule
out VI?
Page 4 of 4

Appendix B – Supplemental Guidance Information Table of Contents
APPENDIX B.1 – Alternate Approach for Demonstrating Compliance with the Volatilization to Indoor
Air Pathway (Big Building Model) APPENDIX B.2 – Alternate Approach for Demonstrating Compliance with the Volatilization to
Ambient Air Pathway APPENDIX B.3 – Alternate Approach for Investigating Vapors for Petroleum Hydrocarbons
Considering Biodegradation APPENDIX B.4 – Approach for Demonstrating Compliance with a Crawlspace

APPENDIX B.1
Alternate Approach for Demonstrating Compliance with the Volatilization to Indoor Air Pathway
(Big Building Model)

Remediation Division
ALTERNATE APPROACH FOR
DEMONSTRATING COMPLIANCE WITH THE VOLATILZATION TO INDOOR AIR PATHWAY
“Big Building Model”
Original Date of Issuance: January 19, 2012
Revision #: 0 Revision Date:
Approved by: ________________________________ Date: _________________ Patty Brandt, Program Specialist Remediation Division Michigan Department of Environmental Quality Written by: Matthew Williams, Vapor Intrusion Specialist Superfund Section Remediation Division Michigan Department of Environmental Quality Amy Salisbury, Vapor Intrusion Specialist Toxicology Unit Remediation Division Michigan Department of Environmental Quality A policy guidance document cannot establish regulatory requirements for parties outside of the Michigan Department of Environmental Quality (MDEQ). This document provides guidance to the MDEQ staff regarding the implementation and interpretation of laws administered by the MDEQ. It is merely explanatory, does not affect the rights of or procedures and practices available to the public, and does not have the force and effect of law.

Remediation Division Alternate Approach
Date: January 19, 2012
Big Building Model
Appendix B.1 Page 2 of 15
PLEASE NOTE: This approach was developed based on a compilation of available information, knowledge, field experience, and general industry practices to provide an alternate approach to parties implementing a response action in Michigan. It was created to promote an alternate approach that is consistent with Part 201, Environmental Remediation, of the Natural Resources and Environmental Protection Act, 1994 PA 451, as amended (NREPA). This document is not a statutory requirement, but could be implemented as an alternate approach under R 299.5714(5) and R 299.5724(5). In general, this document should be used as a reference. Differences may exist between the procedures referenced in this document and what is appropriate under site-specific conditions. This document also does not represent an endorsement of practitioners or products mentioned in the document nor does it ensure that this approach is appropriate for all sites. It is imperative that the environmental professional implementing this approach provide adequate justification. This approach is made available as a technical reference that may be informative when conducting work at sites where vapor intrusion issues are of concern. The MDEQ is not responsible for the misuse or misinterpretation of the information presented herein. Please note that because the approach was written for the MDEQ staff, it may contain references to specific equipment for field investigations that the MDEQ currently uses. Such references do not represent endorsements of particular vendors.

Remediation Division Alternate Approach
Date: January 19, 2012
Big Building Model
Appendix B.1 Page 3 of 15
Introduction Because of the nature of large buildings (e.g., larger footprint, higher air exchange, taller ceilings, lack of a basement, thicker slabs of concrete, and occupational activity patterns resulting in lesser exposure), a generic approach to assessing the potential for vapor intrusion may overestimate the risk to users of the building. Therefore, the MDEQ has identified an approach that is referred to as the “Big Building Model” (BBM) with the intent to provide an alternative methodology for large nonresidential buildings to utilize multiple lines-of-evidence in demonstrating compliance with the volatilization to the indoor air exposure pathway (i.e., vapor intrusion pathway). The MDEQ approach relies primarily on a paper titled, “Prediction of Indoor Air Quality from Soil-Gas Data at Industrial Buildings (Eklund and Burrows, 2009).” The approach has been modified so that it may be utilized to demonstrate compliance with site-specific criteria allowed for under Part 201, including the use of the MDEQ’s acceptable soil gas screening concentrations (ASGSCs) as site-specific criteria in situations where the generic cleanup criteria do not apply.
When relying on soil gas and/or sub-slab soil gas sample data to evaluate the potential for unacceptable human health risks from the volatilization of subsurface contamination to the indoor air (i.e., vapor intrusion), it is common regulatory practice to rely on the maximum soil gas and/or sub-slab soil gas concentrations. This approach is reasonable and often necessary for assessing smaller buildings (less than 5,000 square feet) where a lack of characterization requires the assumption that contamination underlies the entire structure. However, when applied to large nonresidential structures, the use and reliance of the maximum concentration may be overly conservative, especially where localized or discrete areas of contamination have been identified. 1.0 BUILDING CHARACTERISTICS ASSUMED IN GENERIC CRITERIA When comparing the differences and characteristics between small residential buildings and large nonresidential structures, there are several actual building characteristics that may influence how conservative the use of a maximum sub-slab soil gas concentration is. These include (but are not limited to): Building Footprint – 4,000 square feet (ft2) (372 square meters (m2)) was utilized as the floor space area in the
development of the generic groundwater volatilization to indoor air inhalation criteria (GVIIC) and the soil volatilization to indoor air inhalation criteria (SVIIC) (MDEQ, 1998, 2009). However, as identified by Eklund and Burrows (2009), it is not uncommon for large manufacturing and warehouses (i.e., large nonresidential buildings) to have footprints that are greater than 10,500 ft2 (1,000 m2). The size of the floor space utilized in developing the Part 201 criteria was originally guided by a report entitled Commercial Buildings Characteristics 1992 which documents the results of a Commercial Buildings Energy Consumption Survey (CBECS) conducted by the United States Department of Energy (DOE, 1994).
Ceiling Height – Eight feet is the generic commercial building height used in the development of the generic GVIIC and SVIIC (MDEQ, 1998, 2009). It is also the default ceiling height listed in the United States Environmental Protection Agency (USEPA) modeling guidance (USEPA, 2004). However, it is not uncommon for many of the structures addressed by the generic nonresidential criteria (i.e., manufacturing, industrial operations, and warehousing) to exceed interior building heights of 16 feet (NAIOP, 2005). The
Under Section 20120b, the MDEQ must review and approve all site-specific criteria. For those not approved by the MDEQ prior to the 2010 Amendments, this is now
completed through the submittal of a Response Activity Plan.

Remediation Division Alternate Approach
Date: January 19, 2012
Big Building Model
Appendix B.1 Page 4 of 15
larger air volume provided by the increased height provides a greater potential mixing, allowing for the potential for dilution of any chemicals that enter the building via vapor intrusion (Eklund and Burrows, 2009).
Thickness of Flooring – Large nonresidential buildings generally have slabs that are thicker than the default standard established by the generic Part 201 criteria (MDEQ, 1998 and 2009) of six inches (15 centimeters (cm)). Eklund and Burrows (2009) identify that these structures often have slabs up to 12 inches (30 cm). With thicker slabs present, differential settling of the underlying soil is less likely to lead to cracking. In addition, any cracks that are present would be less likely to extend through the entire slab thickness thus creating a preferential pathway that would directly connect the indoor space to the pore spaces in the sub-slab fill material.
Air Exchange Rates – Large nonresidential buildings used for manufacturing, industrial operations, and warehousing tend to have higher air exchange rates than single-family homes. Though typical ventilation rates for these nonresidential structures have not been reported, it can be assumed that the rates are equal to or exceed the rates for office buildings, especially for buildings with bay doors and limited insulation (Eklund and Burrows, 2009). In most large nonresidential buildings, areas of natural ventilation (random cracks, interstices, and other unintentional openings in the building envelope) are easily observable.
Large Open Areas – Large nonresidential buildings may have large and continuous open areas (areas without walls or barriers) in order to complete their intended manufacturing or warehouse use. These areas can easily exceed 40,000 ft2. The greater area of continuous open air allows for a greater potential of mixing for any chemicals that enter the building via vapor intrusion.
2.0 BUILDING CHARACTERISTICS NECESSARY FOR THE USE OF THE BBM When it is desired to utilize the BBM methodology, certain building characteristics must exist that support the model. These characteristics are as follows:
Large continuous open areas greater than 4,000 m2 (43,000 ft2)
Ceiling heights greater than 5 m (16 ft)
Slab-on-grade construction with thicknesses greater than 15 cm (6 inches)
No dry wells, floor drains, sumps, or other building features are present that would provide a direct conduit to the subsurface are present
When groundwater is present, concentrations are stable and/or decreasing When these conditions are not present, it may be possible to provide additional justification for the use of the BBM. However, it should be noted that these situations will be rare and may not be cost efficient to collect the data necessary for the justification. In addition to the building characteristics identified above, there must also be sufficient site characterization such that potential sources of vapors have been identified and a thorough understanding of the site geology and hydrogeology exists. This includes the expected seasonal variation of the groundwater elevation. 3.0 GENERAL APPROACH TO THE BIG BUILDING MODEL Consistent with Eklund and Burrows (2009), the MDEQ’s recommended approach is to divide the building footprint into a number of grids or zones (z1, z2, z3 through zn) that are assigned a representative sub-slab soil gas concentration (Cz) and an area (Az) that is a portion of the total area (A). The resulting zonal average sub-slab soil gas concentration can be compared directly to a screening concentration such as the MDEQ’s ASGSC.

Remediation Division Alternate Approach
Date: January 19, 2012
Big Building Model
Appendix B.1 Page 5 of 15
The MDEQ has developed the ASGSCs using the acceptable indoor air criteria (AIAC) with an attenuation factor (alpha or αDEQ) based on empirical data that a party may use under Part 201 as a site-specific criterion in situations where the generic criteria do not apply. The zonal average sub-slab soil gas concentration is calculated as identified in Equation 1:
As stated in Eklund and Burrows (2009), “The areas should represent a reasonably conservative estimate of the areal extent of the associated sub-slab soil gas concentration.” Estimates of zone average concentrations, geometric mean, and maximum reported values may be included for comparison and discussion; however, in most cases enough data will not be collected to allow for a statistical evaluation including a population analysis of each zone.
3.1 Zones Areas of the structure in which zones for the BBM will be established must be based on an interior structural survey. The structural survey must include the identification of all walls, floor drains, and sumps, and must document that the conditions in Section 2.0 are present. Any variations must be clearly identified in the submitted documentation. Initial sampling locations within each zone must be biased toward each known or potential source of vapor intrusion as well as along walls or other features outside of the area that are known to contain a source of vapors. Though collecting sub-slab samples on a regular spacing interval and/or grid can be utilized; the larger the spacing utilized, the more difficult it may be to establish discrete zones of sub-slab soil gas concentrations above the ASGSC. The MDEQ’s experience has identified spacing intervals of 40 to 50 feet provides the optimum distance for the use with the BBM model. Distances further than 80 feet often do not provide the detail necessary and directly impact the BBM’s ability to demonstrate that sub-slab soil gas vapors will not impact the indoor air above the AIAC. The smaller the area of higher concentrations, the easier it will be to generate the lines-of-evidence discussed below. Larger zones may be utilized for use in the BBM by grouping smaller zones with similar sub-slab soil gas results. A geometric mean, 95 percent upper confidence level, or other statistical methods may be possible; however, in most cases there will not be enough data to complete a statistical evaluation that includes a population analysis. If there is not enough data in each zone to complete a statistical evaluation, an average concentration is not appropriate and a maximum concentration must be utilized. The model must also be run using data collected with the appropriate sampling methods which include the use of the TO-15. Please refer to the MDEQ’s Standard Operating Procedure for the collection and analysis of sub-slab soil gas as an approved sampling methodology. It is important that temporal considerations also be taken into account when establishing sampling locations. For example, as identified by Eklund and Burrows (2009), if a groundwater plume has only reached one end of a building, any sub-slab soil gas measurements may not be predictive of future measurements. It is also necessary to repeat the analysis at select locations to ensure that the results remain consistent due to expected temporal and seasonal variation. A minimum of three rounds of sub-slab soil gas samples from consecutive quarters that are shown to either be stable or decreasing is required to address temporal variability. Figure 1 shows a representative building with a sampling grid and zones across an open manufacturing area. Figure 2 represents a site where smaller zones are grouped together, using maximum concentrations, to create
EQUATION 1: Csubslab = (∑CzAz)/A

Remediation Division Alternate Approach
Date: January 19, 2012
Big Building Model
Appendix B.1 Page 6 of 15
fewer large zones. This is desirable in that it results in having to run the model for less zones. This approach would be typical for sites where there are multiple sources present.
Figure 1 Building with open area and example zones identified.
Figure 2 – Grouping with similar concentrations.

Remediation Division Alternate Approach
Date: January 19, 2012
Big Building Model
Appendix B.1 Page 7 of 15
3.2 Demonstrating Compliance With Site-Specific Criteria Although the term “line-of-evidence” and “weight-of-evidence” is used frequently in assessing the potential for vapor intrusion; there is no consensus on its definition or how it can be applied quantitatively. Each evaluation (risk estimate) will have its own assumptions and associated uncertainties that may not be able to be expressed equivalently. Each line-of-evidence must be evaluated, organized, and explained so that a weight-of evidence evaluation can be made (Suter, 1993). The more the evaluation can be shown to remain protective, as the model inputs exceed the “normal” or “expected” site conditions, the stronger the line-of-evidence supporting the conclusion presented. The weight of a line-of-evidence is reflected in three general characteristics:
The weight assigned to each measurement
The magnitude of response observed in the measurement endpoint
The concurrence among outcomes of multiple measurements Utilizing the BBM presented in this approach is not a line-of-evidence that can be supported until it can be shown that the site conditions can vary considerably from those identified and the site conditions still remain protective of human health. In essence, the larger the zones that can be utilized (over the identified extent of impact) and the higher the concentrations utilized in each zone (over what was detected in multiple rounds of sampling) that still indicate potential compliance with the ASGSC, the stronger the weight-of-evidence. To provide some general guidance on what conditions provide support and strength to the line-of-evidence if the building conditions established in Section 2.0 are met, the MDEQ has established the following guidelines based on a facility that has performed (or will) perform source removal:
Extent of the known sources have been identified and delineated.
Zones are established, are conservative, and at least two times larger in area. Data must not be interpreted between data points unless it can be shown to be overly conservative.
The model still meets the ASGSC utilizing contamination levels that are at least three times the maximum level of contamination identified.
No continued use of the contaminant and the source is expected to attenuate over time.
The modeled area will remain open. If source removal will not occur, the lines-of-evidence will need to be increased and strengthened. The strength of the evidence presented for the BBM is directly related to how much variation can be accounted for in the model. The less variation possible, the less potential that the BBM would support that a risk cannot occur without further remedial action.
3.3 Calculations
The BBM is analyzed using the following equation:
EQUATION 2: BBMconc = [(Zone1max x Zone1area)+(Zone2max x Zone2area)+(ZoneXmax x ZoneXarea)]/AreaTOTAL

Remediation Division Alternate Approach
Date: January 19, 2012
Big Building Model
Appendix B.1 Page 8 of 15
Whereas: BBMconc – Estimated sub-slab soil gas concentration average ZoneXmax – Maximum concentration identified in Zone X ZoneXarea – Area of Zone X AreaTOTAL – Total area
It is possible to compare the BBMconc to the expected indoor air concentration (BBMair) by multiplying the expected sub-slab soil gas concentration by the attenuation factor (αDEQ). The resulting equation is:
4.0 BIG BUILDING MODEL EVALUATION SITE - EXAMPLE
The following example is based on a site that has a single point of release within the structure. The MDEQ’s ASGSC of 540 parts per billion by volume (ppbv) for trichloroethylene (TCE) was utilized as the appropriate site-specific criteria in accordance with Rules 714 and 724 of Part 201. This value represents an acceptable sub-slab soil gas screening concentration appropriate for a nonresidential exposure scenario. The building is a long, single-story with a footprint of over 72,300 ft2 of which 13,980 ft2 are offices and 57,520 ft2 is part of the manufacturing area. A structural survey and picture documentation confirms that the entire manufacturing area is open and there are no walls or partitions present. An additional 800 ft2 of space on the manufacturing floor has been removed from consideration from the manufacturing area as that area contains a bathroom and an office area (no contamination, including vapors, has been found beneath either of these structures). Ceiling heights in the manufacturing area are 25 feet. The foundation is slab-on-grade construction that is at least eight inches thick, based on multiple cores. Figure 3 depicts the building. The site was utilized for manufacturing up until operations ceased in 2007. It contained a former degreasing still and pit (see Figure 3). No other sources of TCE in the open area of the structure were identified. Upon investigation, soils and groundwater were found that contained levels of TCE above Part 201 Csat criteria. In addition, groundwater was less than four feet below the ground surface. Therefore, the Part 201 GVIIC did not apply (see Checklist for Determining if the Generic Volatilization to Indoor Air Inhalation Criteria Apply, Appendix A.1) The investigation identified sub-slab soil gas concentrations of up to 8,000 ppbv. In order to address the pathway, the company voluntarily performed a source removal around the former degreaser that was located within the structure and extracted groundwater from beneath the floor of the building in a continuing effort to reduce the remaining contaminant mass. Confirmation sampling over multiple sampling events showed that the concentrations of sub-slab soil gas continued to decrease; however, values still continued to exceed the MDEQ’s ASGSC. Maximum concentrations from the last three events are identified in Table 1 and the sampling locations are identified on Figure 3.
EQUATION 3: BBMair = BBMconc x αDEQ

Remediation Division Alternate Approach
Date: January 19, 2012
Big Building Model
Appendix B.1 Page 9 of 15
Figure 3 Building Figure
Figure 4 Maximum Concentrations Detected (ppbv of TCE)
Table 1 Maximum Detected Soil Gas Concentrations For TCE
Point ID TCE
(ppbv) Point
ID TCE
(ppbv) Point
ID TCE
(ppbv) Point
ID TCE
(ppbv)
A 1000 G ND M 210 T 2
B 1500 H 290 N 130 U 2
C 580 I 730 P 23 W 260
D 330 J 600 Q 3 X 3
E 130 K 16 R ND Y ND
F 79 L 5 S 140 Z ND

Remediation Division Alternate Approach
Date: January 19, 2012
Big Building Model
Appendix B.1 Page 10 of 15
The responsible party wished to utilize the BBM to further evaluate the site and determine if further response actions were necessary. Based upon the concentrations identified in Table 1 and Figure 4, the responsible party prepared Figure 5 that identified a contour for the area that remained above the ASGSC nonresidential concentration of 540 ppbv (Figure 6). The map also presented a contour that established concentrations below five ppbv (detection limit of the TO-15 analysis). Zone 1 was established to represent the areas above the MDEQ’s ASGSC of 540 ppbv and was expanded to a point that it contained 79 percent more area than presented in Figure 5. Zone 2 was established to represent a “transition” area between the areas with the sub-slab soil gas concentrations above the MDEQ’s ASGSC and the areas where sub-slab soil gas points were analyzed to levels below the detection limit. It also provides an additional zone for modeling. Final square footage of each area utilized in the BBM was: Zone 1 at 5,425 ft2; Zone 2 at 4,300 ft2; and Zone 3 at 47,795 ft2. Zone 3’s square footage was established by:
Figure 5 – Contours associated with the MDEQ’s ASGSC value of 540 ppbv for TCE
EQUATION 4: AreaZONE3 = AreaMANU – (AreaZONE1+AreaZONE2)

Remediation Division Alternate Approach
Date: January 19, 2012
Big Building Model
Appendix B.1 Page 11 of 15
Figure 6 – Establishing the Zones
The inputs for all runs are identified in Table 2. Variations and modifications made for each run of the model are briefly described below. Again, it is important to note that the more the evaluation can be shown to remain protective as the model inputs exceed the “normal” or “expected” site conditions, the stronger is the line-of-evidence supporting the conclusion presented.
Run #1 Base run with expanded areas and maximum concentrations utilized. Even though 540 ppbv was not detected in Zone 2, the concentration is used as it would allow concentrations up to the MDEQ’s ASGSC to exist. Zone 3 is run using the detection limit of the method. The BBM results indicate that the expected air concentration (BBMair) for the above parameters would result in an indoor air concentration of 3.7 ppbv which is 60 percent less then the nonresidential AIAC of 11 ppbv. The BBM in this analysis is conservative based on the following:
Zone 1 was increased to encompass 79 percent more area than presented by the contour map in Figure 5.
Zone 1 utilized a maximum concentration of 1,500 ppbv and most of the area did not have concentrations detected at that level.
Zone 2 utilized the ASGSC for TCE of 540 ppbv even though the maximum concentration detected in this zone is less than 140 ppbv.
Zone 3 utilized a concentration of five ppbv even though no source areas are present in the remaining manufacturing area and sub-slab soil gas concentrations have been successfully defined to below detection levels.
Run #2 The maximum concentration in Zone 1 is increased to 300 percent of the maximum detected value. All other zones remain the same. The BBM results indicate that expected air concentration (BBMair) would result in an indoor air concentration of 9.4 ppbv which is 15 percent less then the nonresidential AIAC.

Remediation Division Alternate Approach
Date: January 19, 2012
Big Building Model
Appendix B.1 Page 12 of 15
The BBM in this analysis is conservative based on the following:
The Zone 1 was increased to encompass 79 percent more area than presented by the contour map in Figure 5
Zone 1 utilized a concentration of 300 percent of the maximum detected
Zone 2 utilized the ASGSC for TCE of 540 ppbv even though the maximum concentration detected in this zone is less than 140 ppbv
Zone 3 utilized a concentration of five ppbv, the method detection limit, even though no source areas are present in the remaining area and sub-slab soil gas concentrations have been successfully defined to below detection levels.
Run #3 Zone 1 concentration remains at 300 percent of the maximum identified concentration. In addition, Zone 2 is increased to 300 percent of its previous value. Zone 3 remains at the detection limit. The BBM results indicate that the expected air concentration (BBMair) would result in an indoor air concentration of 11 ppbv which is the nonresidential AIAC. The BBM in this analysis is conservative based on the following:
Zone 1 was increased to encompass 79 percent more area than presented by the contour map in Figure 5.
Zone 1 utilized a concentration of 300 percent of the maximum detected.
Zone 2 utilized a concentration of 300 percent of the ASGSC even though the maximum concentration detected in this zone is less than 140 ppbv.
Zone 3 utilized a concentration of five ppbv, the method detection limit, even though no source areas are present in the remaining area and sub-slab soil gas concentrations have been successfully defined to below detection levels.
Run #4 Zones 1, 2, and 3 concentrations return to the maximum concentrations identified in Run #1; however, the overall area extent of Zone 1 and Zone 2 is doubled (which results in a decrease in Zone 3). The BBM results indicate that the expected air concentration (BBMair) would result in an indoor air concentration of 7.3 ppbv which is 34 percent less than the nonresidential AIAC. The BBM in this analysis is conservative based on the following:
The area in Zone 1 and Zone 2 was increased to encompass double of the area in Run #1.
Zone 1 utilized a maximum concentration of 1,500 ppbv.
Zone 2 utilized the ASGSC for TCE of 540 ppbv even though the maximum concentration detected in this zone is less than 140 ppbv.
Zone 3 utilized a concentration of five ppbv even though no source areas are present in the remaining manufacturing area and sub-slab soil gas concentrations have been successfully defined to below detection levels.
The submittal to the MDEQ included a detailed discussion of the results of the BBM and ranges and limitations that were experienced. In addition, the following provides a very brief analysis of other supporting lines-of-evidence provided. However, it should be noted that some of the details and information has not been provided.
Multiple sampling rounds were performed with full quality assurance/quality control, showing stable or decreasing concentrations.

Remediation Division Alternate Approach
Date: January 19, 2012
Big Building Model
Appendix B.1 Page 13 of 15
Building does not meet the generic assumptions identified in the generic Part 201 GVIIC and SVIIC. o Building area greatly exceeds generic assumptions o Building interior height greatly exceeds generic assumption o Cement is thicker than the generic assumptions o Air exchange rate is greater than identified in the model
The area of impact is a small percentage of the entire open area. o Concentrations of sub-slab soil gas have been defined o Multiple rounds of sub-slab soil gas samples have been collected
Mixing can/will occur o Air exchange rate exceeds one per hour o Space is large and open with no walls to prevent mixing of indoor air
Floor has been repaired and sealed
Deed and use restrictions o Deed restriction will prevent subdividing the manufacturing area without further testing and/or
installation of a presumptive mitigation system o Use of TCE is prohibited
Source removal has been performed o Csat soils were removed and floors replaced with new cement
TABLE 2 – EXAMPLE DATA AND RESULTS TABLE
Model Input
Variables BBM
Run #1 BBM
Run #2 BBM
Run #3 BBM
Run #4
Zone 1 Square Footage (ft2) Zone1area 5,425 5,425 5,425 10,850
Zone 2 Square Footage (ft2) Zone2area 4,300 4,300 4,300 8,600
Zone 3 Square Footage (ft2) Zone3area 47,795 47,795 47,795 38,070
Total Square Footage (ft2) Zone3area 57,520 57,520 57,520 57,520
MDEQ Attenuation Factor (subslab) Αsubslab 0.02 0.02 0.02 0.02
MDEQ ASGSC for TCE (ppbv) 540 540 540 540 540
AIAC TCE Nonresidential (ppbv) 11 11 11 11 11
Zone 1 Max Concentration Zone1max 1,500 4,500 4,500 1,500
Zone 2 Max Concentration Zone2max 540 540 1,620 540
Zone 3 Max Concentration Zone3max 5 5 5 5
RESULTS
BBM Soil Gas Concentration BBMconc 186 469 550 367
Modeled Air Concentration BBMair 3.7 9.4 11.0 7.3

Remediation Division Alternate Approach
Date: January 19, 2012
Big Building Model
Appendix B.1 Page 14 of 15
Other options that may be pursued as part of analyzing the output provided by the model include, but are not limited to:
Breaking apart the hotter area into multiple zones; however, there is a strong balance between having enough data points in each area and being able to demonstrate that the concentrations represented in the model are conservative.
Establishing multiple hot spots or sources across the facility (each area must be clearly defined by points containing lower concentrations).
Selected mitigation of a portion of the manufacturing area – the model would allow for the evaluation of a partial mitigation system with data that is able to document that the system is effectively mitigating vapors from a discrete area.
Mitigation of selected structures: this approach could be combined with various active or passive mitigation options if it was determined that offices or bathrooms may be at risk.
5.0 PUTTING IT TOGETHER FOR COMPLIANCE In documenting the site conditions are protective for either a parties due care obligations or remedial actions, additional steps must be undertaken to complete the line-of-evidence and provide justification. The documentation must include the following information:
Zoning and a description of the expected future use of the facility
Foundation and/or floor thickness
Source of vapors and/or recognized areas of environmental concern (ASTM Phase I)
Discussion of source removal (if performed)
Data collection methodology and quality assurance/quality control procedures implemented
Monitoring data collected
Detailed explanation on how each of the zones were established
Pictures documenting the area for which the BBM is being utilized
Multiple runs of the model with varying inputs
Discussion of the results and how they document that the approach is conservative and therefore protective
Provide a discussion of the limitations and assumptions that make the model valid
Associated maps, figures, and tables In order for the MDEQ to determine that site-specific criteria intended to be relied upon for remedial action are protective under Sections 20118 and 20120, the party must include the proposed deed restrictions for the property that addresses the following:
Limit the property’s future use to nonresidential, unless a presumptive mitigation system is installed or an evaluation of the potential for vapor intrusion occurs.
Limit and prevent modifications to the building, including the construction of walls within the area of concern, without evaluating the potential for vapor intrusion or installing a mitigation system.
Require all future new construction to evaluate the potential for vapor intrusion or install a presumptive vapor mitigation system.
It is also important to note that for a party pursuing this method as a way to document and fulfill its obligations under due care, the entire sample collection procedure outlined above does not necessarily need to be completed prior to acquisition; although, the initial sampling event should at least be conducted and evaluated to ensure that the approach appears to be reasonable and appropriate. The remaining sampling events could be conducted after

Remediation Division Alternate Approach
Date: January 19, 2012
Big Building Model
Appendix B.1 Page 15 of 15
acquiring the property, if the party’s due care plan identifies a contingency plan if future sampling events show that there is a potential for risk or if the model does not achieve the appropriate results. 6.0 REFERENCES
DOE. 1994. Commercial Buildings Energy Consumption Survey (CBECS) conducted by the United States
Department of Energy. Eklund and Burrows. 2009. Prediction of Indoor Air Quality from Soil-Gas Data at Industrial Buildings. Eklund, Bart
and Burrows, Don. Ground Water Monitoring & Remediation 29, No. 1/Winter 2009/pages 118-125. MDEQ. 2009. DRAFT Michigan Department of Environmental Quality, RRD Operational Memorandum No. 1,
Technical Support Document – Attachment 5, Part 201 Groundwater and Soil Volatilization to Indoor Air Inhalation Criteria, Part 213 Risk-Based Screening Levels for Groundwater and Soil Volatilization to Indoor Air.
MDEQ. 1998. Part 201, Generic Groundwater and Soil Volatilization to Indoor Air Inhalation Criteria: Technical
Support Document, Michigan Department of Environmental Quality, Environmental Response Division. NAIOP. 2005. Terms & Definitions: United States Office and Industrial Market. Suter, G.W. 1993. Ecological Risk Assessment. Lewis Publishers. USEPA. 2004. User’s guide for evaluating subsurface vapor intrusion into buildings. USEPA, OEER. February 22.

APPENDIX B.2
Alternate Approach for Demonstrating Compliance with the Volatilization to Ambient Air
Pathway

Remediation Division
ALTERNATE APPROACH FOR
DEMONSTRATING COMPLIANCE WITH THE VOLATILIZATION TO AMBIENT AIR PATHWAY
Original Date of Issuance: January 19, 2012
Revision #: 0 Revision Date:
Approved by: ________________________________ Date: _________________ Patty Brandt, Program Specialist Remediation Division Michigan Department of Environmental Quality Written by: Matthew Williams, Vapor Intrusion Specialist Superfund Section Remediation Division Michigan Department of Environmental Quality A policy guidance document cannot establish regulatory requirements for parties outside of the Michigan Department of Environmental Quality (MDEQ). This document provides guidance to the MDEQ staff regarding the implementation and interpretation of laws administered by the MDEQ. It is merely explanatory, does not affect the rights of or procedures and practices available to the public, and does not have the force and effect of law. Special thanks for assistance: Conestoga-Rovers & Associates Severstal North America, Inc. Ford Motor Company Hamp, Mathews & Associates

Remediation Division Alternate Approach
Date: January 19, 2012 1
Alternate Approach for Compliance with VSIC
Appendix B.2 Page 2 of 12
PLEASE NOTE: This approach was developed based on a compilation of available information, knowledge, field experience, and general industry practices to provide an alternate approach to parties implementing a response action in Michigan. It was created to promote an alternate approach that is consistent with Part 201, Environmental Remediation, of the Natural Resources and Environmental Protection Act, 1994 PA 451, as amended (NREPA). This document is not a statutory requirement, but could be implemented as an alternate approach under R 299.5714 and R 299.5724. In general, this document should be used as a reference. Differences may exist between the procedures referenced in this document and what is appropriate under site-specific conditions. This document also does not represent an endorsement of practitioners or products mentioned in the document nor does it ensure that this approach is appropriate for all sites. It is imperative that the environmental professional implementing this approach provide adequate justification of this approach. This approach is made available as a technical reference that may be informative when conducting work at sites where vapor intrusion issues are of concern. The MDEQ is not responsible for the misuse or misinterpretation of the information presented herein. Please note that because the approach was written for the MDEQ staff, it may contain references to specific equipment for field investigations that the MDEQ currently uses. Such references do not represent endorsements of particular vendors.

Remediation Division Alternate Approach
Date: January 19, 2012 1
Alternate Approach for Compliance with VSIC
Appendix B.2 Page 3 of 12
Volatilization of organic compounds from contaminated soil or groundwater into the ambient air represents a major potential source of exposure (Radian, 1986). In Michigan under Part 201, the generic cleanup criteria for soil based on inhalation of volatile hazardous substance emissions to ambient air are called the volatile soil inhalation criteria (VSIC). The VSIC represent the concentrations of a contaminant that can remain in soil at a facility while still protecting people who inhale the ambient air. The concentration of the contaminant in the soil is converted to a concentration in ambient air based on assumptions about the upward flux of the contaminant from the soil surface (and indirectly from the groundwater below the soil) and the use of a dispersion model to estimate the contaminant’s concentration in ambient air. R 299.5726(8) states:
A person who is implementing response activity may demonstrate compliance with the generic criteria developed under this rule through the collection and analysis of ambient air samples within the facility boundaries, if the hazardous substance concentration in surficial soil is representative of facility conditions.
Therefore, the rule requires the collection and analysis of air samples from the site to demonstrate compliance with the VSIC. In 2009, the Waste and Hazardous Materials Division (WHMD) of the MDEQ requested the formation of a multi-disciplinary work group to discuss ways to evaluate the VSIC using ambient air samples. The work group, with members representing the MDEQ’s WHMD, Remediation Division (RD), and the Air Quality Division (AQD) concluded that traditional ambient air monitoring is rarely appropriate or technically feasible for demonstrating compliance with the VSIC. The work group concluded that given the complexity of ambient air monitoring and the large number of factors that can contribute to data variability (e.g., sampling procedures, equipment, duration, weather, multiple sources, and data interpretation), each application of R 299.5726(8) would entail a time consuming and costly effort to develop a site-specific solution. Therefore, it was determined that most sites will pose significant technical challenges as a result of multiple stationary and mobile air emission sources, varying meteorological (e.g., wind speed, direction, and local influences) and weather conditions (precipitation and temperature), and site activities (e.g., vehicle traffic) that would make it extremely difficult to design and implement a reliable ambient air monitoring program to demonstrate compliance with the VSIC. Upon consultation with multiple experts, the RD has established the approach identified in this document that, if implemented as described, would demonstrate compliance with the VSIC using ambient air data in accordance with R 299.5726(8). The approach contains three major steps in the evaluation process that consist of:
Defining zones of similar volatile parameter flux from the subsurface
Quantifying flux for each zone by flux chamber sample collection
Using flux as input to dispersion model to estimate relevant receptor concentrations This is done through the collection of ambient air samples within a flux chamber (flux chamber sampling). Flux chamber sampling addresses many of the concerns and issues identified by the MDEQ work group and provides a direct measurement of volatile organic compound (VOC) emissions from soil to the ambient air at the site. The MDEQ believes that the approach outlined below can be representative of the actual volatilization of organic compounds from contaminated soil into the ambient air if implemented with care.

Remediation Division Alternate Approach
Date: January 19, 2012 1
Alternate Approach for Compliance with VSIC
Appendix B.2 Page 4 of 12
Although flux chamber sampling is the approach preferred by the MDEQ, other methods for demonstrating compliance under R 299.5726(8) may be proposed with appropriate technical justification.
1.0 GENERAL INFORMATION
1.1 Emission Process
The rate of emissions from contaminated soil is controlled by the diffusion rate of the chemical compound through the air-filled pore spaces of the soil. The exception occurs when the contaminated material is on or very near the ground surface. In these situations, the emission process and rate can be highly influenced by the rate of evaporation. The parameters that affect the evaporation process are basically the properties of the waste itself (e.g., vapor pressure) and those that affect the air-surface interface (e.g., air temperature, humidity, wind speed, surface roughness). In most cases, the background concentration of the contaminant is usually very low and can be assumed to be negligible.
1.2 Flux Chambers An enclosure or chamber is used to isolate a known area of soil in which the collected vapors are measured over a period of time to measure the direct emissions from a surface. See Figure 1 for a generic representation of a flux chamber. The flux chamber approach provides a direct measurement of the subsurface contaminant flux at the soil-air interface as driven by diffusion and atmospheric conditions, ideally without altering the emission of gases at the surface. The results can be used to evaluate the impact of contaminated soil and other media on ambient air quality. The assessment of soil emissions using flux chambers is usually done in conjunction with sample analysis by Method TO-14A (United States Environmental Protection Agency [USEPA], 1999a) or Method TO-15 (USEPA, 1999b), as appropriate. These methods will yield an analytical detection limit of 0.1 and 0.001 micrograms per liter, respectively, for air in a flux chamber (DTSC, 2004). Other analytical methods may be acceptable and appropriate, depending on the contaminant concentrations expected at the site and the reporting (detection) limits necessary for comparison with criteria.
A Standard Operating Procedure (SOP) for the MDEQ’s use of a flux chamber is provided in Attachment D of the MDEQ’s document titled Sample Collection and Evaluation of the Vapor Intrusion to the Indoor Air Pathway when the Generic Criteria Do Not Apply.
1.3 Soil Flux Chamber Measurements for the Evaluation of Outdoor Air Flux chamber sampling provides a direct measurement of the rate at which the VOCs are entering outdoor air from the soil. Therefore, if the maximum flux at the surface can be measured with properly collected flux chamber samples, then human exposure to air contaminated with the VOCs from subsurface sources can be estimated using a modeling program (see Section 3.0).
1.4 Establishing Site-Specific Criteria When using this approach it is imperative that the party include all of the VOCs associated with the release and the extent of the facility in the analysis and evaluation of potential risks. This approach will not be valid if only an area or the VOCs present at concentrations exceeding the generic criteria are used. Contributions from all ranges of contamination must be considered.

Remediation Division Alternate Approach
Date: January 19, 2012 1
Alternate Approach for Compliance with VSIC
Appendix B.2 Page 5 of 12
Figure 1 General flux chamber construction diagram
2.0 ALTERNATIVE APPROACH FOR DEMONSTRATING COMPLIANCE WITH THE VSIC In general, the approach consists of the facility (i.e., all areas overlying impacted soil and groundwater) being divided into a number of zones (z1, z2, z3 … through zn) and the emission rate for each zone is established. The established emission rates and supporting documentation is then submitted to the AQD by the RD to estimate expected ambient air concentrations at multiple compliance points throughout the facility using AERMOD. The MDEQ has identified two methods for establishing zones to measure emission rates. One is for smaller (less than 4,000 square meters (m2)) less complicated sites and the second is for larger (greater than 4,000 m2) more complicated sites. The method for less complicated sites essentially involves reviewing the geology, topography, soil, and groundwater concentrations to define zones that are similar. With the zones defined you can choose to deploy flux chambers immediately. The method for more complicated sites involves deploying passive soil gas sampling to define areas of similar chemical parameter flux.
2.1 Establishing Zones to Determine Emission Rates Within When establishing zones at the facility, it is imperative that each zone exhibit similar physical and chemical conditions for key characteristics, including (but not limited to):
Concentrations of soil and/or groundwater contamination
Contaminants of concern
Depths/elevations of contamination
Ground surface elevation Zones may be irregular in shape but should be similar in size, unless a smaller zone is established over potential source areas. Smaller areas of potentially higher emission areas may successfully limit the area of higher emission rates to minimize potential areas of contribution to the ambient air in the model.

Remediation Division Alternate Approach
Date: January 19, 2012 1
Alternate Approach for Compliance with VSIC
Appendix B.2 Page 6 of 12
The following methodology provides a means to divide the facility into separate zones (Z) with an imaginary grid based on the overall areal extent of the facility:
The extent of the facility is smaller than 4,000 m2 - divide the facility into at least ten zones with areas not to exceed 200 m2.
The facility’s areal extent is greater than 4,000 m2 but smaller than 8,000 m2 - divide the facility into at least 20 zones with areas not to exceed 400 m2.
The facility’s areal extent is greater than 8,000 m2 but smaller than 16,000 m2 - divide the facility into areas not to exceed five percent of the total overall area.
The facility’s areal extent is greater than 16,000 m2 - all zones must be smaller than 800 m2 with no fewer than 20 zones.
Smaller zones and/or grid sizes may be utilized and are recommended as data has shown the ability to use smaller discrete areas is often beneficial during the modeling process. It is imperative when using this approach that the extent of the contaminant’s flux be established at the surface for the entire facility and not just an area that may exceed the generic criteria. Other methods may be acceptable for establishing zones of surface flux. However, many of the alternatives evaluated by the MDEQ are heavily site- or compound-specific. These methods are not described in this guidance document. The approach outlined here can be employed at the majority of sites across Michigan where a potential source of volatilization to ambient air is proposed to remain in place. Below identifies two different approaches to establishing the emission rates of the zones based on the size of the facility. Each method could be used regardless of size; however, modification of the approach would be necessary.
2.1.1 Facilities Less Than 4,000 Square Meters For smaller facilities, it can be beneficial and cost effective to go directly to the collection of emission rates. However, the collection of flux chamber samples is labor intensive and the number of flux chambers that can be properly deployed and sampled during a day often limits the size of the sampling program. Based on previous flux chamber sampling performed, the MDEQ has determined that collecting flux chamber samples at more than 15 locations on a facility often become logistically challenging. In such cases, the approach identified in 2.1.2 should be considered. For small less complicated facilities, zones can be established using site-specific features that could include but are not limited to the following:
Known subsurface sources of volatile chemical parameters (i.e., leaks from existing or historic process or storage equipment)
Distribution of volatile chemical parameters in soil
Distribution of volatile chemical parameters in groundwater
Groundwater flow direction
Topography
Presence of obstructions to volatilization of chemical parameters (i.e., paved surfaces, concrete floor slabs of demolished buildings, engineered caps, etc.)
Coverage of the lateral extent of the site
Presence of fill material at ground surface

Remediation Division Alternate Approach
Date: January 19, 2012 1
Alternate Approach for Compliance with VSIC
Appendix B.2 Page 7 of 12
2.1.2 Facilities Greater Than 4,000 Square Meters For facilities that contain more than 20 zones, it is often beneficial to first conduct a passive soil gas (PSG) survey with a larger number of measurement locations to group and establish zones with similar flux response levels and then to quantify emission rates in each zone using a smaller number of flux chambers (see Section 2.4). However, the survey must identify the relevant distribution of individual VOCs as opposed to “Total VOCs” or an overall response level. Passive soil gas methods consist of the burial of an adsorbent into soil near the surface for a period of time (typically five to ten days) and the subsequent retrieval of the adsorbent for measurement. Contaminants “passively” diffuse and adsorb onto the collector over time. The method is easy to deploy and is proven to find areas of contamination (Hartman EPA-OUST Petroleum VI Workshop, 2010). The use of these passive methods can be an effective tool in understanding the composition of subsurface soil gases and even identify the location of subsurface vapors, especially as it relates to the surficial flux. As most PSG sampling devices require deployment for extended periods of time, the data are less likely to be biased by site conditions that may vary throughout the day such as weather conditions, barometric pressure, or temperature.
2.2 Establishing the Grid Size for Deployment of Passive Soil Gas Samplers Establishing a grid size for deploying PSG samplers across a site is a difficult balance between being cost effective and being able to provide enough data that discrete zones can accurately be established for modeling that addresses a wide range of emission values. If PSG samplers are to be deployed, then the grid spacing identified in Section 2.1 can be used. The placement of these samplers should be based on the preexisting site knowledge of contamination and must include placing at least one of the samplers directly over the areas that is thought to contain the highest potential to produce the highest emission rates. It is highly recommended that over the known source areas (or areas of contamination within .5 meters of the surface) that a more conservative approach by reducing the area of each zone by at least 50 percent be utilized. The tighter grid spacing over known source areas is highly beneficial in being able to establish smaller zones to input into the model for the areas with potential higher emission rates. In any situation that the extent of the flux is not found to be decreasing toward the extent of the facility, it may be necessary for additional step-outs to occur.
2.3 Grouping Zones and Emission Rates from the Passive Soil Gas Survey With known site conditions and the PSG results, it is possible to limit the amount of emission rates that would need to be collected. This is done by first separating the site into areas with similar site physical and geological characteristics. This separation must occur across the facility based on site conditions (see Section 2.1) and not on response levels of the PSG survey. For instance, if part of the site has had a removal action and clean soil placed on top, it should be separated from areas of the site where a removal has not occurred. It may be beneficial to seek approval of the MDEQ project manager prior to proceeding with the PSG survey in areas with similar site physical and geological characteristics.

Remediation Division Alternate Approach
Date: January 19, 2012 1
Alternate Approach for Compliance with VSIC
Appendix B.2 Page 8 of 12
Each area can then be further refined and grouped based on the PSG response levels for each contaminant. Each group must then utilize the location of the maximum response level to establish the emission rate to be utilized in AERMOD (see Section 3.0). With this approach, emission rates can be established across the facility based on the following requirements:
One emission rate per zone per area
One emission rate established for every four acres of facility
A minimum of ten emission rates per sampling event
2.4 Collection of Flux Samples There are two different types of flux chamber methods:
Static-(Closed) Chamber Method: In this method, contaminants emitted from the soil surface are captured in a closed chamber and the contaminant concentration increases over time until it reaches equilibrium with the soil gas. After this “incubation period,” a discrete sample is drawn from the chamber into an evacuated sample container (e.g., a SUMMA canister) and submitted for chemical analysis. Because the length of the incubation period is usually not known in advance, it is necessary to collect a time series of samples from the chamber at several intervals during the sampling event.
Dynamic-Chamber Method: In this method, an inlet gas (sweep gas) is continuously introduced into the chamber during the incubation period and an equivalent amount of the chamber gas is allowed to escape. The system is assumed to reach a steady-state concentration after four or five chamber-residence times, where one residence time equals the chamber volume divided by the sweep-gas flow rate.
An SOP for the dynamic method is provided in Appendix D. Though both methods provide reliable results, the dynamic method is preferred by the MDEQ as there are less decision points to determine if an appropriate sample has been collected.
2.5 Establishing Compliance Points Evaluation of the model to determine compliance with criteria will be based on compliance points modeled and compared to the appropriate acceptable indoor air criteria (AIACs). The AIACs are appropriate for use to evaluate the risk presented regardless whether a person is indoors or outdoors. Compliance points will be established across the facility based on the following minimum requirements:
Perimeter of the facility on 100 foot grid spacing
Closest point of a property with a sensitive population (i.e., school, day care, nursing home, etc.)
Shallowest contamination present
Source area AERMOD will also establish the area of the highest concentration present. If this is different than one of the areas on the facility identified above, an alternative point of compliance will be established and compared to the appropriate AIACs. On any property that is zoned for nonresidential use and the expected use is to remain nonresidential, possibly (through the implementation of institutional controls) the nonresidential air standard will be utilized. All other properties will utilize the residential AIAC unless proper justification can be provided for alternative criteria.

Remediation Division Alternate Approach
Date: January 19, 2012 1
Alternate Approach for Compliance with VSIC
Appendix B.2 Page 9 of 12
3.0 AERMOD
The AERMOD modeling system replaced the ISCST3 as the preferred recommended model for most regulatory modeling applications, as announced in a November 9, 2005 Federal Register notice, and is listed as such in Appendix A of the USEPA’s “Guideline on Air Quality Models,” (also published as Appendix W of Title 40 of the Code of Federal Regulations (CFR) Part 51). Detailed information and guidance for the use of AERMOD can be found in the attached MDEQ AQD September 2009 document titled “Air Dispersion Modeling Guidance Document.” The information reiterates some of the information found in the attachment; however, it also provides more detailed and specific recommendations and application of the AERMOD in demonstrating compliance with the volatilization to ambient air pathway under Part 201.
The responsible party has the option of conducting their own modeling or having the AQD perform the modeling. In either case, the supporting modeling information listed below must be submitted to the Part 201 project manager for submittal to the AQD to complete the models analysis or for confirmation of the results supplied.
3.1 Evaluating the Results of Model
Utilizing the model prior to the submittal to the MDEQ is a valuable tool for sites that may contain multiple source areas as it allows a responsible party to evaluate various selective response actions across the facility to further assess the potential benefit of a particular remedial action. It must be identified that an exceedance of the AIAC may not present a risk due to some of the conservative nature that is included within this methodology; however, further evaluation of the facility is necessary which could include reducing the area of each zone and/or potential remedial activities being performed.
3.2 Submittal of the Data to the MDEQ
The party is expected to provide all of the information identified below in one submittal. Failure to provide all the information will require the MDEQ to return the submittal as being insufficient. A CD or DVD should be attached to the report that contains all the necessary digital information including the appropriate tables and figures for processing. All coordinates must be provided in Universal Transverse Mercator (UTM) coordinates that indicate which North American Datum System was used (i.e., NAD 1927 or NAD 1983).
The report must contain a general discussion of the following:
Site location including street address, city, and county
General description of the facility and area up to 500 feet beyond the extent of the facility including approved zoning
Contaminants of concern applicable to the project
Discussion on how each zone was established and the methodology utilized to establish the representative emission rates with sample calculations
Other sources of emissions on the facility, whether they are permitted or exempt, sampled emission rates (previous 12 months or maximum concentration identified), and stack heights up to 500 feet beyond the extent of the facility
Discussion of data collection methodologies and analytical results
Discussion of building elevations located in the area up to 500 feet beyond the extent of the facility
Discussion on the quality assurance/quality control performed for the data collected
Discussion of all sensitive receptors up to 500 feet beyond the extent of the facility
Discussion of the location of the proposed compliance monitoring points for the model
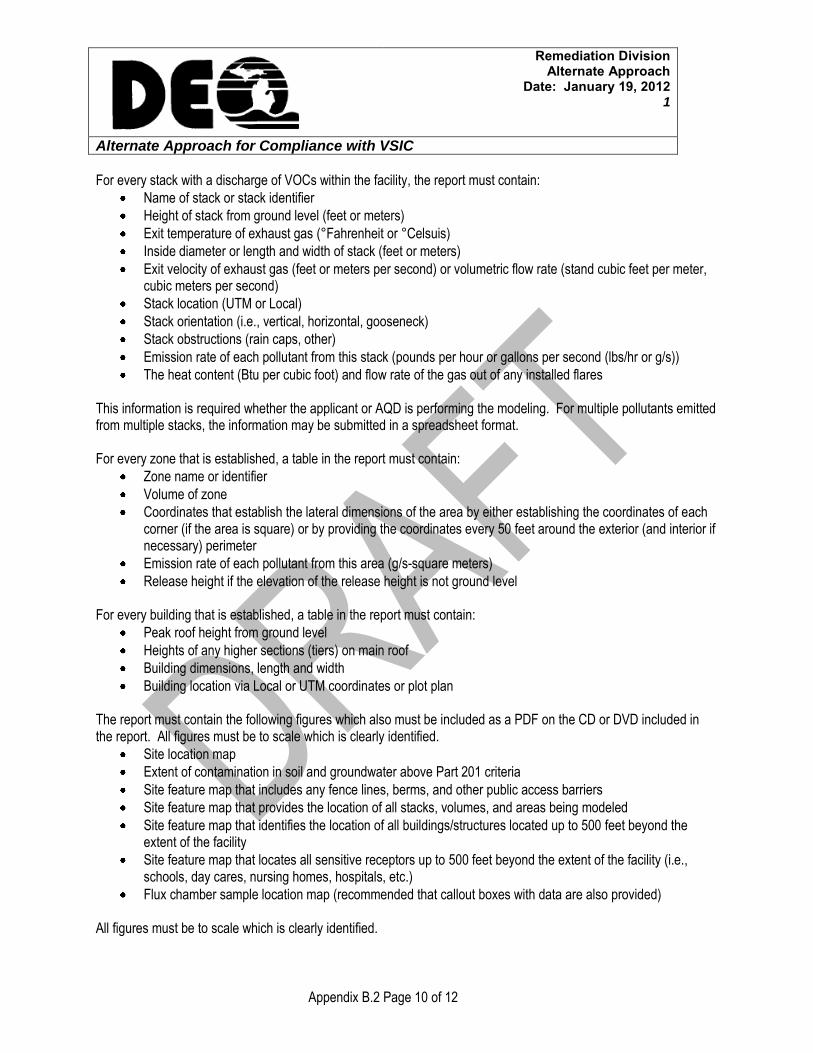
Remediation Division Alternate Approach
Date: January 19, 2012 1
Alternate Approach for Compliance with VSIC
Appendix B.2 Page 10 of 12
For every stack with a discharge of VOCs within the facility, the report must contain:
Name of stack or stack identifier
Height of stack from ground level (feet or meters)
Exit temperature of exhaust gas (°Fahrenheit or °Celsuis)
Inside diameter or length and width of stack (feet or meters)
Exit velocity of exhaust gas (feet or meters per second) or volumetric flow rate (stand cubic feet per meter, cubic meters per second)
Stack location (UTM or Local)
Stack orientation (i.e., vertical, horizontal, gooseneck)
Stack obstructions (rain caps, other)
Emission rate of each pollutant from this stack (pounds per hour or gallons per second (lbs/hr or g/s))
The heat content (Btu per cubic foot) and flow rate of the gas out of any installed flares This information is required whether the applicant or AQD is performing the modeling. For multiple pollutants emitted from multiple stacks, the information may be submitted in a spreadsheet format. For every zone that is established, a table in the report must contain:
Zone name or identifier
Volume of zone
Coordinates that establish the lateral dimensions of the area by either establishing the coordinates of each corner (if the area is square) or by providing the coordinates every 50 feet around the exterior (and interior if necessary) perimeter
Emission rate of each pollutant from this area (g/s-square meters)
Release height if the elevation of the release height is not ground level For every building that is established, a table in the report must contain:
Peak roof height from ground level
Heights of any higher sections (tiers) on main roof
Building dimensions, length and width
Building location via Local or UTM coordinates or plot plan The report must contain the following figures which also must be included as a PDF on the CD or DVD included in the report. All figures must be to scale which is clearly identified.
Site location map
Extent of contamination in soil and groundwater above Part 201 criteria
Site feature map that includes any fence lines, berms, and other public access barriers
Site feature map that provides the location of all stacks, volumes, and areas being modeled
Site feature map that identifies the location of all buildings/structures located up to 500 feet beyond the extent of the facility
Site feature map that locates all sensitive receptors up to 500 feet beyond the extent of the facility (i.e., schools, day cares, nursing homes, hospitals, etc.)
Flux chamber sample location map (recommended that callout boxes with data are also provided)
All figures must be to scale which is clearly identified.

Remediation Division Alternate Approach
Date: January 19, 2012 1
Alternate Approach for Compliance with VSIC
Appendix B.2 Page 11 of 12
If the responsible party has been conducting their own modeling and wishes the MDEQ to confirm the results, the following files must be provided:
Copy of the modeling input files (*.inp, *.dat, *.dta, *.api)
For AERMOD a copy of the Stage 1 and 3 AERMET input files (*.in1, *.in3)
For AERMOD a copy of the AERMAP output file (*.rou)
Copy of the building profile input program (BPIP) file (*.bpi)
Copy of the modeling output files (not as important as the two first items, but helpful)
Toxic air contaminant lists/spreadsheets including emission rates, screening levels, and impacts Tables:
All PSG sampling results including point name and coordinates
Flux chamber results including point name and coordinates
Site contour data tied to the United States Geological Survey elevations (+/- .2 foot)
Center of all buildings located within the downwash area with building heights provided
Center of all sensitive receptors located
Coordinates of the proposed compliance monitoring points Maps and figures (to scale):
Entire site features map
High-resolution aerial photo covering for three kilometers surrounding the project area
Terrain and other identifiable features in the source area
All buildings considered in the downwash analysis and plant property boundaries (building sizes and shapes on the map should be drawn to scale)
Map of the facility clearly delineating the locations of all sources of vapors (groundwater and soil)
Map of the facility clearly delineating the locations of all emissions
Map of the zones established for the emission rates
4.0 COMPLAINCE WITH PART 201 If the modeling performed by the AQD demonstrates that the release does not pose a risk, compliance may be obtained by collecting two to three additional rounds of data. The data must be collected during the summer and during periods of little to no rain. If data is shown to be decreasing or stable, compliance may be obtained by a deed restriction of access and preventing any disturbance of the current cover. Installation of a protective barrier may be warranted if the contamination is within six inches of the surface to ensure the long-term protectiveness of the selected remedy. If modeling has identified the potential for a risk, as identified in Section 3.1, further assessment and/or remedial action may be warranted due to some of the conservative nature that is included within this methodology.

Remediation Division Alternate Approach
Date: January 19, 2012 1
Alternate Approach for Compliance with VSIC
Appendix B.2 Page 12 of 12
5.0 REFERENCES Department of Toxic Substances Control (DTSC). 2004. Guidance for the Evaluation and Mitigation of Subsurface
Vapor Intrusion to Indoor Air. Hartman, B. 2010. Vapor Intrusion Fundamentals. Webinar. EPA-OUST Petroleum VI Workshop. Radian Corporation under contract to the United States Environmental Protection Agency. 1986. Measurement of
Gaseous Emission Rates from Land Surfaces Using an Emission Isolation Flux Chamber, Users Guide. USEPA Environmental Monitoring Systems Laboratory, Las Vegas, Nevada, USEPA Contract No. 68-02-3889, Work Assignment 18. Document No. EPA/600/8-86/008. February 1986.
United States Environmental Protection Agency. 1999a. Compendium of Methods for the Determination of Toxic
Organic Compounds in Ambient Air, Second Edition, Compendium Method TO-14A, Determination of Volatile Organic Compounds (VOCs) in Ambient Air Using Specially Prepared Canisters With Subsequent Analysis By Gas Chromatography. Center for Environmental Research Information, Office of Research and Development, USEPA, Document No. EPA/625/R-96/010b.
United States Environmental Protection Agency. 1999b. Compendium of Methods for the Determination of Toxic
Organic Compounds in Ambient Air, Second Edition, Compendium Method TO-15, Determination of Volatile Organic Compounds (VOCs) in Air Collected in Specially-Prepared Canisters and Analyzed By Gas Chromatography/Mass Spectrometry (GC/MS). Center for Environmental Research Information, Office of Research and Development, USEPA, Document No. EPA/625/R-96/010b.

Air Quality Dispersion Modeling Page 1
Last revised September 2009
AIR DISPERSION MODELING GUIDANCE DOCUMENT
AIR QUALITY DIVISION
MICHIGAN DEPARTMENT OF ENVIRONMENTAL QUALITY
September, 2009
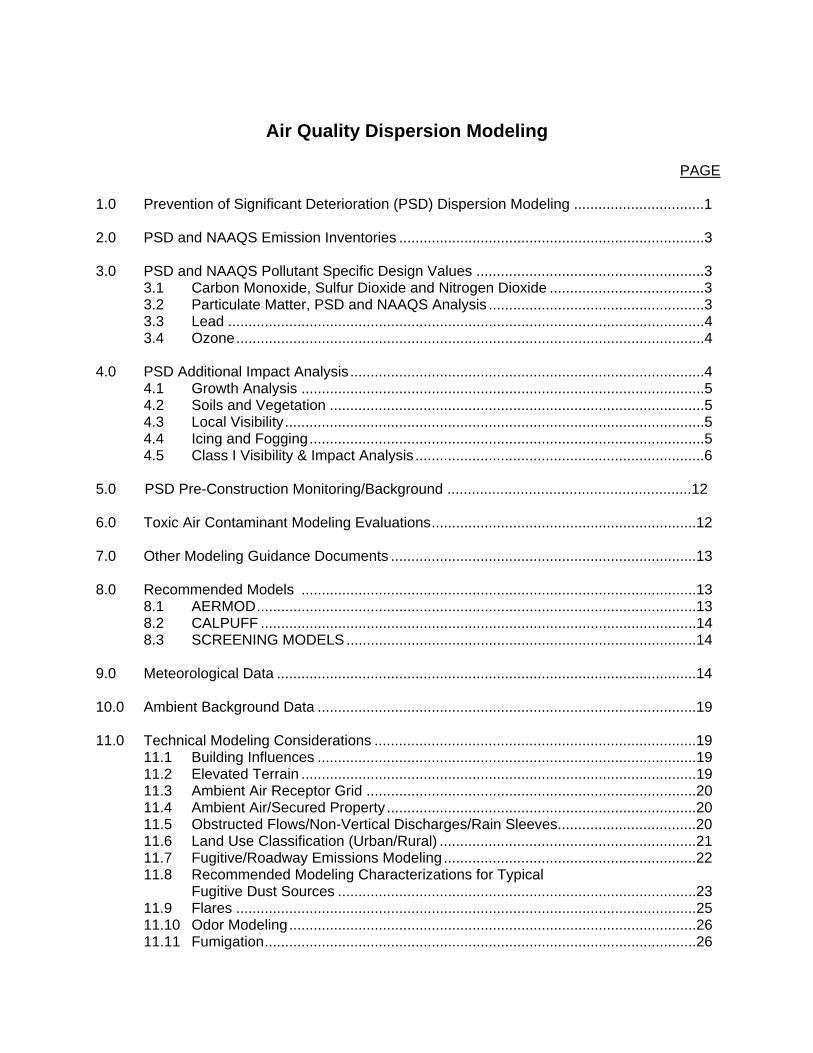
Air Quality Dispersion Modeling PAGE 1.0 Prevention of Significant Deterioration (PSD) Dispersion Modeling ................................1 2.0 PSD and NAAQS Emission Inventories ...........................................................................3 3.0 PSD and NAAQS Pollutant Specific Design Values ........................................................3 3.1 Carbon Monoxide, Sulfur Dioxide and Nitrogen Dioxide ......................................3 3.2 Particulate Matter, PSD and NAAQS Analysis .....................................................3 3.3 Lead .....................................................................................................................4 3.4 Ozone...................................................................................................................4 4.0 PSD Additional Impact Analysis.......................................................................................4 4.1 Growth Analysis ...................................................................................................5 4.2 Soils and Vegetation ............................................................................................5 4.3 Local Visibility.......................................................................................................5 4.4 Icing and Fogging.................................................................................................5 4.5 Class I Visibility & Impact Analysis .......................................................................6 5.0 PSD Pre-Construction Monitoring/Background ............................................................12 6.0 Toxic Air Contaminant Modeling Evaluations.................................................................12 7.0 Other Modeling Guidance Documents ...........................................................................13 8.0 Recommended Models .................................................................................................13 8.1 AERMOD............................................................................................................13 8.2 CALPUFF ...........................................................................................................14 8.3 SCREENING MODELS......................................................................................14 9.0 Meteorological Data .......................................................................................................14 10.0 Ambient Background Data .............................................................................................19 11.0 Technical Modeling Considerations ...............................................................................19 11.1 Building Influences .............................................................................................19 11.2 Elevated Terrain .................................................................................................19 11.3 Ambient Air Receptor Grid .................................................................................20 11.4 Ambient Air/Secured Property ............................................................................20 11.5 Obstructed Flows/Non-Vertical Discharges/Rain Sleeves..................................20 11.6 Land Use Classification (Urban/Rural) ...............................................................21 11.7 Fugitive/Roadway Emissions Modeling ..............................................................22 11.8 Recommended Modeling Characterizations for Typical Fugitive Dust Sources ........................................................................................23 11.9 Flares .................................................................................................................25 11.10 Odor Modeling....................................................................................................26 11.11 Fumigation..........................................................................................................26

Air Quality Dispersion Modeling Page 1
Introduction to Modeling
Dispersion modeling is a tool for predicting source ambient impacts through computer simula-tions. Use of air dispersion modeling is often required to demonstrate compliance with various state and federal ambient air quality standards. The primary federal Environmental Protection Agency’s (EPA’s) modeling guidance document is the “Guideline on Air Quality Models,” 40 CFR Part 51, Appendix W, which may be found at EPA’s Support Center for Regulatory Atmospheric Modeling (SCRAM) website at the following web address (http://www.epa.gov/scram001/). This guidance should be applied to air use permit new source review and prevention of significant deterioration (PSD) modeling to ensure consistency and EPA acceptability in the air quality analysis. The information below reiterates much of the information found in Appendix W and also provides more detailed and specific recommenda-tions applicable to Michigan. 1.0 Prevention of Significant Deterioration (PSD) Dispersion Modeling All air use permit applications for major sources or major modifications of criteria pollutants in an attainment or unclassified area must submit PSD increment modeling for PM10/PM2.5, SO2 and NO2 along with National Ambient Air Quality Standard (NAAQS) modeling for PM10, SO2, NO2, CO and lead. The modeling analysis usually involves two distinct phases: 1) a preliminary analysis, and 2) a full impact analysis. The preliminary analysis models only the significant increase in potential emissions from a proposed new source or the significant “net” increase from a proposed modification. Significant emission increases are those at or above the tons per year values listed in Table 1. If it can be demonstrated that these emissions would not increase ambient concentrations by more than the prescribed significant impact levels listed in Table 1 (based on first high impacts), no further modeling would be required. If, however, the impact is significant, applicants are required to conduct a full impact analysis, which, in Michigan, consists of the following three modeling demonstrations: 1. The applicant does not consume more than 80% of the PSD Class II increment.
2. The applicant plus other increment consuming facilities nearby do not consume more than 100% of increment.
3. All emissions in the area meet the NAAQS. For both the preliminary and full impact analysis, the PSD modeling is required to use five years of the most recent and representative meteorological data. However, if at least a year of quality assured site specific data is available this data would be preferred for use in the analysis. No significant ambient concentration for ozone has been established. Instead, any net emission increase of 100 tons or more per year of volatile organic compounds (VOCs) would need to address the impact of these emissions. Since ozone modeling can be complex and resource intensive, other indirect and qualitative approaches can be used, which are discussed further in Section 3.4. In Michigan, increment consumption is considered to occur as a result of emissions from minor sources, as well as major sources or major modifications. Thus, PSD increment and NAAQS modeling are generally also required from any new or modified minor source if the proposed emission increase is above the significant emission amounts shown in Table 1. For minor

Air Quality Dispersion Modeling Page 2
TABLE 1 – GENERAL POLLUTANT INFORMATION
NAAQS Episode Levels
PSD Permitted Increments
Signif. EmissionsIncrease
Monitoring Exemption
Levels
Pollutants Term
Primary (µg/m3)
Sec-ond-ary (µg/m3)
Alert (µg/m3)
Warn (µg/m3)
Emer-gency
(µg/m3)
1 (µg/m3)
2 (µg/m3)
3 (µg/m3) (ton/yr) (µg/m3) Term
Signif. Impact Levels (µg/m3)
Ann 75 60 5 19 37 25 1 TSP 24-hr. 260 150 375 625 875 10 37 75 10.0 24-hr. 5 Ann 50 50 4 17 34 15 1 PM10 *
24-hr. 150 150 8 30 60 10.0 24-hr. 5 Ann 15 15 10 PM2.5
24-hr. 35 35 Ann 80 2 20 40 40 1
24-hr. 365 800 1,600 2,100 5 91 182 13.0 24-hr. 5 SO2
3-hr. 1300 25 512 700 25 8-hr. 10,000 10,000 17,000 34,000 46,000 100 575.0 8-hr. 500 CO 1-hr. 40,000 40,000 2,000 Ann 100 100 2.5 25 50 40 14.0 Ann 1 8-hr. 282 565 750
NO2
1-hr. 130 2,260 3,000 Ozone 1-hr. 235 235 40 voc 100.0 Ton/yr Lead** 3 mth
rolling .15 .15 0.6 0.1 3- mth
* Note: Due to a lack of evidence linking health problems to long-term exposure to coarse particle pollution, the EPA revoked the annual PM10 standard in 2006 (effective December 17, 2006). ** New NAAQS signed Oct 15, 2008.
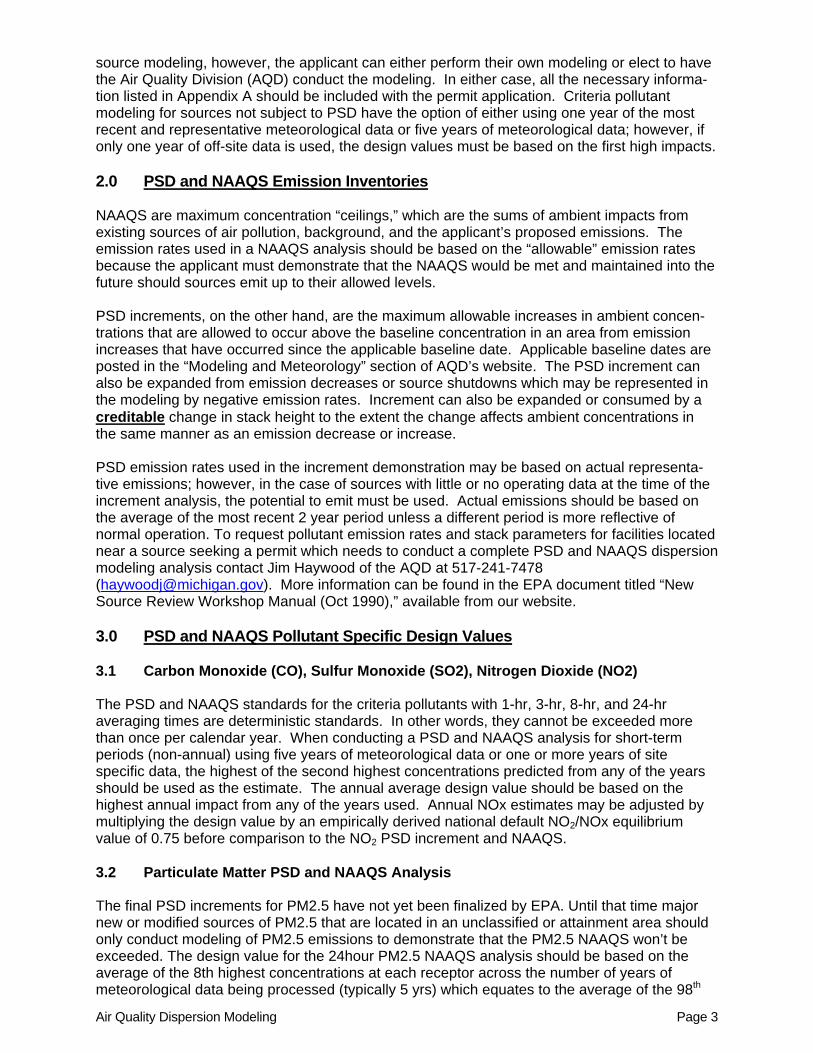
Air Quality Dispersion Modeling Page 3
source modeling, however, the applicant can either perform their own modeling or elect to have the Air Quality Division (AQD) conduct the modeling. In either case, all the necessary informa-tion listed in Appendix A should be included with the permit application. Criteria pollutant modeling for sources not subject to PSD have the option of either using one year of the most recent and representative meteorological data or five years of meteorological data; however, if only one year of off-site data is used, the design values must be based on the first high impacts. 2.0 PSD and NAAQS Emission Inventories NAAQS are maximum concentration “ceilings,” which are the sums of ambient impacts from existing sources of air pollution, background, and the applicant’s proposed emissions. The emission rates used in a NAAQS analysis should be based on the “allowable” emission rates because the applicant must demonstrate that the NAAQS would be met and maintained into the future should sources emit up to their allowed levels. PSD increments, on the other hand, are the maximum allowable increases in ambient concen-trations that are allowed to occur above the baseline concentration in an area from emission increases that have occurred since the applicable baseline date. Applicable baseline dates are posted in the “Modeling and Meteorology” section of AQD’s website. The PSD increment can also be expanded from emission decreases or source shutdowns which may be represented in the modeling by negative emission rates. Increment can also be expanded or consumed by a creditable change in stack height to the extent the change affects ambient concentrations in the same manner as an emission decrease or increase. PSD emission rates used in the increment demonstration may be based on actual representa-tive emissions; however, in the case of sources with little or no operating data at the time of the increment analysis, the potential to emit must be used. Actual emissions should be based on the average of the most recent 2 year period unless a different period is more reflective of normal operation. To request pollutant emission rates and stack parameters for facilities located near a source seeking a permit which needs to conduct a complete PSD and NAAQS dispersion modeling analysis contact Jim Haywood of the AQD at 517-241-7478 ([email protected]). More information can be found in the EPA document titled “New Source Review Workshop Manual (Oct 1990),” available from our website. 3.0 PSD and NAAQS Pollutant Specific Design Values 3.1 Carbon Monoxide (CO), Sulfur Monoxide (SO2), Nitrogen Dioxide (NO2) The PSD and NAAQS standards for the criteria pollutants with 1-hr, 3-hr, 8-hr, and 24-hr averaging times are deterministic standards. In other words, they cannot be exceeded more than once per calendar year. When conducting a PSD and NAAQS analysis for short-term periods (non-annual) using five years of meteorological data or one or more years of site specific data, the highest of the second highest concentrations predicted from any of the years should be used as the estimate. The annual average design value should be based on the highest annual impact from any of the years used. Annual NOx estimates may be adjusted by multiplying the design value by an empirically derived national default NO2/NOx equilibrium value of 0.75 before comparison to the NO2 PSD increment and NAAQS. 3.2 Particulate Matter PSD and NAAQS Analysis The final PSD increments for PM2.5 have not yet been finalized by EPA. Until that time major new or modified sources of PM2.5 that are located in an unclassified or attainment area should only conduct modeling of PM2.5 emissions to demonstrate that the PM2.5 NAAQS won’t be exceeded. The design value for the 24hour PM2.5 NAAQS analysis should be based on the average of the 8th highest concentrations at each receptor across the number of years of meteorological data being processed (typically 5 yrs) which equates to the average of the 98th

Air Quality Dispersion Modeling Page 4
percentile concentration. For the annual PM2.5 standard, the design value should be based on the average of annual impacts predicted over the modeling period. Major new or modified PM2.5 sources located in an PM2.5 non-attainment areas would be require to obtain sufficient emission offsets as required in the AQD’s Part 19 Rules. Until EPA the modeling guidance for modeling PM2.5 for PSD increment, Minor sources of PM2.5, can still use PM10 emissions modeling as a “surrogate” when conducting a full impact analysis for particulate. When conducting a 24-hr average PM10 PSD analysis utilizing five years of meteorological data, the highest second high impact from any of the five years should be used similar to SO2. For the 24-hr PM10 NAAQS analysis, however (which is a probabilistic standard), the highest sixth highest concentration for the whole period becomes the design value. Another way of stating this is that the PM10 24-hour NAAQS is met when the expected number of exceedances is less than or equal to one. The design value for the annual PM10 PSD and NAAQS analysis should be based on the highest annual impact from any of the 5 years used. 3.3 Lead (Pb) On October 15, 2008 the USEPA revised the primary Lead NAAQS from 1.5 µg/m3 on an individual calendar quarterly (3-month) average basis to .15 ug/m3. The averaging time was also changed to a rolling 3-month average evaluated over 3 year period. The rolling 3 month average considers each of the 12 three month periods associated with a given year. Since the preferred refined models are able to report maximum monthly average concentrations directly, evaluations are typically made using a conservative maximum monthly average concentration estimate in lieu of determining the maximum 3 month rolling average concentration to simplify the amount of modeling computation needed. 3.4 Ozone No significant ambient impact concentration has been established for ozone. Instead, any net emissions increase of 100 tons per year of VOCs subject to PSD would be required to address the impact of the emissions. Options include the Reactive Plume Model (RPM) however, for most sources the AQD conducts a city by city emission comparison to satisfy the NSR obligations. As an example of the comparison, proposed VOC emissions from a facility locating in Marquette would be added to the other VOC emissions in the area and compared to another city with larger total VOCs emission that is in attainment with the ozone standard. By comparison therefore, the proposed source should not cause any ozone NAAQS exceedance problems. Before employing any of these techniques, the applicant should contact the AQD modeling staff. In some cases, post construction monitoring may be used in lieu of ozone modeling. For nonattainment areas, modeling is not required. The AQD’s Part 2 offset rules require that all proposed major offset sources or major offset modifications offset any new VOC emissions by obtaining emissions reductions in amounts greater than the new emissions by a specified percentage such that the area would experience a net overall decrease in VOC emissions. 4.0 PSD Additional Impact Analysis All PSD permit applicants must prepare an additional impact analysis for each pollutant subject to PSD (i.e., emitted at greater than their significant emissions threshold). This analysis assesses the impacts on soils, vegetation, and visibility caused by any increase in emissions of a regulated NSR pollutant from the source or modification under review. In most cases, emissions increases will not have adverse impacts on soils, vegetation, or visibility. Regard-less, the additional impacts analysis must be performed. Although each applicant for a PSD permit must perform an additional impacts analysis, the depth of the analysis generally will depend on existing air quality, the quantity of emissions, and the sensitivity of local soils,

Air Quality Dispersion Modeling Page 5
vegetation, and visibility in the source's impact area. It is important that the analysis fully document all sources of information, underlying assumptions, and any agreements made as a part of the analysis. The additional impact analysis generally has three parts: 1) growth, 2) soils and vegetation, and 3) visibility, which are discussed in more detail below. 4.1 Growth Analysis The elements of a growth analysis include a projection of the associated industrial, commercial, and residential growth that will occur in the area due to the proposed project; and an analysis of the emissions generated by the growth as well as from any construction-related activities. 4.2 Soils and Vegetation The analysis of impacts on soils and vegetation should be based on an inventory of the soil and vegetation types found in the impact area. This inventory should include all vegetation with any commercial or recreational value and may be available from several sources (i.e., conservation groups and/or universities). For most types of soil and vegetation, ambient concentrations of criteria pollutants below the NAAQS will not result in harmful effects. However, there are sensitive vegetation species that may be harmed by long-term exposure to low concentrations of pollutants. Good references include:
• “New Source Review Workshop Manual” (EPA); • “Air Quality Criteria Documents” (EPA); • “Impacts of Coal-Fired Plants on Fish, Wildlife, and Their Habitats” (U.S. Department of
the Interior); • “A Screening Procedure to Evaluate Air Pollution Effects on Class I Wilderness Areas”
(U.S. Forest Service); and • “Air Quality in the National Parks” (National Park Service).
4.3 Local Visibility In the visibility impairment analysis, the applicant is especially concerned with impacts that occur within the area affected by applicable emissions. Note that the visibility analysis required here is distinct from the Class I area visibility analysis requirement. The suggested components of a good visibility impairment analysis are:
• A determination of the visual quality of the area; • An initial screening of emission sources to assess the possibility of visibility impairment;
and • If warranted, a more in-depth analysis involving computer models.
To successfully complete a visibility impairments analysis, the applicant is referred to an EPA document titled “Workbook for Plume Visual Impact Screening and Analysis,” available from National Technical Information Service, 1988. The workbook outlines a screening procedure designed to expedite the analysis of emissions impacts on the visual quality of an area. The workbook was designed for Class I area impacts, but the outlined procedures are generally applicable to other areas. The VISCREEN model available from the EPA’s SCRAM website is often used for these demonstrations. 4.4 Icing and Fogging The potential for adverse effects from icing and fogging of nearby roads from mechanical draft cooling towers should be evaluated as part of a PSD additional impact analysis. Fogging is assumed to occur when the visible plume strikes the ground. Icing occurs when the visible plume strikes the ground under freezing conditions. This may be accomplished by utilizing the Seasonal/Annual Cooling Tower Model. The meteorological data used with this model is in a

Air Quality Dispersion Modeling Page 6
different file format compared to other modeling programs. Contact Jim Haywood at 517-241-7478 ([email protected]) for more information on this model and/or for meteorological data. 4.5 Class I Area Impacts (PSD, Visibility, Air Quality Related Values) Class I areas are areas of special national or regional natural, scenic, recreational, or historic value for which the PSD regulations provide special protection. Michigan contains two Class I areas:
1. Seney National Wildlife Refuge; and 2. Isle Royale National Park
One way in which air quality degradation is limited in all Class I areas is by more stringent limits defined by the PSD Class I increment thresholds shown in Table 1. The increments are the maximum increases in ambient pollutant concentrations allowed over baseline concentrations. The Class I increments more stringently limit increases in ambient pollutant concentrations caused by new major sources or major modifications than do the Class II increments. PSD regulations require a PSD increment and NAAQS analysis of any PSD source when the emissions increase pollutant concentrations by 1 µg/m3 or more (24-hr avg) in a class I area. If a Class I area increment and NAAQS analysis is required, modeling for Class I areas should include not only emissions from the proposed source, but also other sources that may consume increment in the Class I area similar to PSD increment analyses elsewhere in the state. Also applicable to Class I areas are Air Quality Related Values (AQRV’s) which are features or properties of the Class I area that could be adversely affected by air pollution even if the pollutant concentrations do not exceed the Class I increments. The Clean Air Act (CAA) gave the Federal land managers (FLMs) an affirmative responsibility to protect AQRVs and they are responsible for evaluating a source’s projected impact on a Class I area’s AQRV’s. These AQRV’s include visibility, vegetation, lakes and streams, soils, fish, animals, and monuments. The appropriate Federal Land Manager can discuss specific AQRVs for a particular Class I area and advise the applicant of the level of analyses needed to assess potential impacts on these resources and the appropriate methods that should be employed. AQRV information for Michigan’s Class I area’s can be obtained from the following National Park Service web site at http://www.nature.nps.gov/air/Permits/Aris/index.cfm FEDERAL LAND MANAGERS (FLM’s) NOTIFICATION Section 165 of the Clean Air Act (CAA) requires the Environmental Protection Agency or the state permitting authority to provide written notification to the Federal Land Manager (FLM) if a proposed major or major modification “may affect” a Class I area. Generally, the permitting authority should notify the FLM of all new or modified major facilities proposing to locate within 100 km (62 miles) of a Class I area. Also, as mentioned in an EPA memo dated March 19, 1979 to the Regional Administrators (attachment 1) and in the Federal Land Managers’ Air Quality Related Values Workgroup (FLAG) Phase I Report available from the web link at http://www.nature.nps.gov/air/permits/flag/flagDoc/flmNew.cfm, the permitting authority should notify the FLM of "very large sources" with the potential to affect Class I areas proposing to locate at distances between 100 km and 300 km. Given the multitude of possible size/distance combinations, the FLMs can not precisely define in advance what constitutes a "very large source" located more than 100 km away that may impact a particular Class I area. Therefore, the FLM and permitting authority will work together to determine which PSD applications the FLM is to be made aware of for facilities located between 100 km and 300km from a class 1 area. The FLM and permitting authority will make this determination on a case-by-case basis, considering such factors as magnitude of emissions, current conditions of air sensitive resources in the Class I area, potential for source growth in an area or region, prevailing meteorological conditions, and cumulative effects of multiple sources to air sensitive resources.

Air Quality Dispersion Modeling Page 7
Figures 1 and 2 below are maps of Michigan Class I areas which depict 100 km and 300 km buffer distance zones. PSD applications that “may affect” a Class I area should be sent to the FLM for review and analysis as soon as possible after receipt, giving the FLM an opportunity to review the applica-tion concurrently with the permitting authority. The FLM’s will keep the Park Superintendent and/or the Refuge Manager informed with respect to any significant actions. Additional procedural requirements apply when a proposed source has the potential to impair visibility in a Class I area (40 CFR §52.27(d)(1998)). Specifically, the permitting authority must notify the FLM in writing and include a copy of all information relevant to the permit application, including the proposed source's anticipated impacts on visibility in a Class I area. The permitting authority should notify the FLM within 30 days of receipt and at least 60 days prior to the close of the comment period. If the FLM notifies the permitting authority that the proposed source may adversely impact visibility in a Class I area, then the permitting authority will work with the FLM to address their concerns. The AQD should be informed of any agreements made between the FLM and the applicant regarding any AQRV’s that are to be evaluated or methodologies to be used in the evaluation.
ISLE ROYAL NATIONAL PARK CONTACT INFORMATION FEDERAL LAND MANAGER PARK SUPERINTENDENT John Bunyak, Chief, Policy Planning and Permit Review Branch: NPS Air Resources Division, (303) 969-2818; P.O. Box 25287, Denver CO, 80225 [email protected]
Park Superintendent Phone Number: (906) 482-0986 87 North Ripley Street Houghton, MI 49931 [email protected]
SENEY NATIONAL WILDLIFE REFUGE CONTACT INFORMATION
FEDERAL LAND MANAGER REFUGE MANAGER Sandra Silva, Chief , FWS Air Quality Branch Air Quality Branch (303) 969-2814; P.O.Box 25287, Denver CO, 80225 [email protected]
Refuge Manager Phone Number: (906) 586-9851 Seney NWR HCR 2, Box 1, Seney, MI 49883 [email protected]
Information on screening models available for visibility analysis can be found in the manual "Workbook for Plume Visual Impact Screening and Analysis," EPA-450/4-88-015 (9/88). If a more refined modeling assessment is needed, the Calpuff model should be utilized, which has been adopted by the EPA in the “Guideline on Air Quality Models, Appendix W,” as the preferred model for assessing long range transport of pollutants and their impacts on Federal Class I areas. Long-range transport is generally considered to apply to distances greater than 50 km from a source. Also, the CALPUFF modeling system is recommended by the Federal Land Managers’ Air Quality Related Values Workgroup (FLAG) for assessing the effects of distant and multi-source plumes on visibility and pollutant wet/dry deposition fluxes. The CALPOST processor implements the FLAG recommended algorithms for assessing the change in plume extinction due to a modeled source or group of sources. CALPUFF postprocessors allow the calculation of pollutant deposition fluxes of nitrogen and sulfur as described by the FLAG guidance found in the FLAG Phase I Report (FLAG, 2000). The Interagency Workgroup on Air Quality Modeling (IWAQM) also recommends the use of CALPUFF and the Phase 2 Summary Report (IWAQM, 1998) includes recommendations for conducting refined analyses with CALPUFF of PSD increment consumption, NAAQS impacts and Air Quality Related Value

Air Quality Dispersion Modeling Page 8
impacts in Class I areas. Links to these documents and the CALPUFF model can be found at EPA’s SCRAM web site (http://www.epa.gov/scram001/). WISCONSIN FOREST COUNTY PATAWATOMI (FCP) CLASS I AREA On April 29th, 2008 the EPA published in the Federal Register a final rule that became effective on May 29th that redesignated certain portions of the FCP Community Reservation as a non-Federal Class I area under the Clean Air Act program for PSD. This area is located near the state border of Wisconsin and the Upper Peninsula of Mi and may affect Class I modeling requirements for sources located in the western most portion of the Upper Peninsula. The 100 km buffer zone from this area essentially encompasses the Mi counties of Menominee, Dickenson, Iron, and the SE half of Gogebic and is shown as Figure 3 below. As EPA codified the FCP Community Class I area as part of a Federal Implementation Plan, it is yet unclear as to whether there will be a Federal Land Manager (FLM) or a non-Federal Land Manager (NFLM) for administering Air Quality Related Values (AQRV) and other reviews. Thus, applicants are advised to check with the AQD for any updated information regarding FLM or NFLM notification requirements.

Air Quality Dispersion Modeling Page 9
FIGURE 1

Air Quality Dispersion Modeling Page 10
FIGURE 2

Air Quality Dispersion Modeling Page 11
FIGURE 3

Air Quality Dispersion Modeling Page 12
5.0 PSD Pre-Construction Monitoring and Background Concentrations For any criteria pollutant that a major source proposes to emit in significant amounts or for a proposed modification that involves a significant net increase, at least a years worth of continuous ambient monitoring data in the affected area is required as part of an full impact air quality analysis. The applicant would be exempt from this requirement, however, if it can be demonstrated that the highest modeled concentration caused by the significant increase or modification for the applicable averaging time is below the significant monitoring concentrations listed below and shown in table 1 – (GENERAL POLLUTANT INFORMATION) of Section 1.0.
PSD Monitoring Exemption Air Quality Conc. in μg/m3. Carbon Monoxide: 8-hr average 575 PM10: 24-hour average 10 Sulfur dioxide: 24-hr average 13 Lead: 3-month average 0.1 Mercury: 24-hr average 0.25 Beryllium: 24-hr average .0001 Fluorides: 24-hr average .25 Vinyl chlorides: 24-hr average 15 Total reduced sulfur: 1-hr average 10 Hydrogen sulfide: 1-hr average 0.2 Reduced sulfur compounds: 1-hr average 10 Nitrogen dioxide: annual average 14
If the maximum predicted ambient impact is above the significant monitoring concentrations, this requirement may be satisfied by using existing representative data if available as an alternative to site specific pre-construction monitoring data. This option is described in subsection 8.2 (background concentrations) of 40 CFR Part 51 - Guideline on Air Quality Models and in Section III, Chapter C of the NSR Workbook Manual. Representative existing data should provide a reasonable estimate of the upwind background air concentration that would be flowing into an area not influenced by the major source or the additional nearby sources that would be explicitly modeled in the impact analysis. In most cases a monitor from the AQD’s extensive statewide monitoring network can be used to obtain representative background pollutant concentrations for use in the analysis. To use existing monitoring data in an analysis, its is recommended that all major new or modified sources that are required to conduct an full impact analysis request a pre-construction monitoring waiver from the AQD. In most cases adequate representative existing monitoring data exists such that a monitoring waiver can be granted by the Division. To inquire as to the availability of this data please contact Mr. Jim Haywood 517-241-7478 ([email protected]) 6.0 Toxic Air Contaminant Modeling Evaluations Dispersion modeling may also be required to demonstrate compliance with the health-based screening level requirements of Rule 225 for emissions of toxic air contaminants (TACs). Refer to “Toxic Air Contaminants - Demonstrating Compliance with Rule 225” for additional information. Click here to view this pdf document. If you do not have access to the Internet, it may be obtained by contacting the AQD receptionist at 517-373-7023. The applicant has the option of conducting their own modeling or having the AQD perform the modeling. In either case, the supporting modeling information listed in Appendix A should be submitted to the AQD. The maximum ambient air impact (design value) used for comparison to the Air Quality Division’s TAC screening levels should based on the first high impact occurring in ambient air using the most recent year of representa-tive meteorological data.

Air Quality Dispersion Modeling Page 13
7.0 Other Modeling Guidance Documents The following information and guidance documents are available on the AQD website at http://www.michigan.gov/deqair. Click “Assessment and Planning” and “Modeling and Meteorology.” To obtain nearby facility source data that includes criteria pollutant emission rates and stack parameters of nearby facilities necessary to conduct a PSD and NAAQS dispersion modeling analysis, or for questions regarding modeling, contact Jim Haywood at 517-241-7478 ([email protected]).
Item Description
EPA Air Toxic Risk Assessment Library (ATRA) Volumes 1,2,& 3
This reference library is for conducting air toxics analyses at the facility and community-scale. (http://www.epa.gov/ttn/fera/risk_atra_main.html)
ISC Users Guide – Volumes 1 & 2
EPA guidance for the Industrial Source Complex (ISC3) Dispersion Model
AERMOD, AERMET, & AERMAP Users Guide’s
EPA guidance documents for the AERMOD modeling system
Meteorological Data Weather data used in conjunction with dispersion models
PSD Baseline Dates Major and minor source baseline dates throughout Michigan that determines whether emissions from a facility consume increment (post baseline)
New Source Review (NSR) Workshop Manual
EPA manual focusing on the PSD portion of the NSR program found in 40 CFR 52.21
Background Values EPA criteria pollutant monitoring data for Michigan and surrounding states (http://www.epa.gov/air/data/)
Human Health Risk Assessment Protocol – Chapter 3
EPA air dispersion and deposition modeling guidance for evaluating risk from both direct and indirect pathways
EPA’s Aermod Implementation Guide
An evolving document containing information on the recommended use of AERMOD for various applica-tions.
8.0 Recommended Models 8.1 AERMOD The AERMOD modeling system replaced ISCST3 as the preferred recommended model for most regulatory modeling applications, as announced in a November 9th, 2005 Federal Register notice, and is listed as such in Appendix A of the EPA’s “Guideline on Air Quality Models,” (also published as Appendix W of 40 CFR Part 51). After November 9th of 2006, all air use permit modeling demonstrations were required to use the AERMOD Modeling System and it is available off EPA’s Support Center for Regulatory Atmospheric Modeling (SCRAM) website (http://www.epa.gov/scram001/). AERMOD requires the use of two preprocessor modules, AERMET and AERMAP that are used to develop necessary files for the model. The AERMET module is the meteorological preprocessor for the AERMOD program. There are three stages to processing AERMET data: 1. Stage 1 extracts meteorological surface and upper air data from archived data files and proc-
esses the data through various quality assessment checks; 2. Stage 2 merges all data available for 24-hour periods (NWS and on-site data) and stores these
data together in a single file; and

Air Quality Dispersion Modeling Page 14
3. Stage 3 reads the merged meteorological data and estimates the necessary boundary layer parameters for use by AERMOD.
Two files are written by AERMET that are used by an AERMOD modeling run. They are the boundary layer parameter file (*.SFC), which contains observed and calculated surface and boundary layer parameters; and the profile file (*.PFL), which contains wind, temperature, and standard deviations of the wind data. The AQD has used AERMET to pre-process both the surface and boundary layer files for all the meteorological stations throughout the State which are available off the AQD web site. The AERMAP module is a terrain preprocessor designed to simplify and standardize the input of terrain elevation data for the AERMOD program. AERMAP raw input terrain data is the Digital Elevation Model (DEM) data obtained from the United States Geological Survey (USGS). DEM data can be obtained from the USGS in either 7.5-minute or 1-degree resolutions. Currently, AERMAP supports both the 7.5-minute and 1-degree DEM data files. DEM files are readily available through the USGS and various third-party commercial vendors. The 7.5- minute DEM format has a resolution of approximately 30 meters by 30 meters and is the preferred choice for use in PSD modeling. Output from AERMAP includes the location and height scale, which are elevations used for the computation of air flow around hills and other terrain features. 8.2 CALPUFF CALPUFF has been adopted by the EPA’s “Guideline on Air Quality Models,” as the preferred model for assessing long range impacts on Federal Class I areas, which include Class I PSD increment consumption, visibility, and deposition. Long-range transport is generally considered to apply to distances greater than 50 km from a source. The Interagency Workgroup on Air Quality Modeling (IWAQM) recommends use of CALPUFF for transport distances of order 200 km and less. The use of CALPUFF for characterizing transport beyond 200 to 300 km should be done cautiously with an awareness of the likely problems involved which are described in the IWAQM Phase 2 Summary Report (Dec 1998) available on-line at http://www.src.com/calpuff/regstat.htm. Consultation with the FLM’s can help determine the appropriate application of CALPUFF. Further information on downloading the model and other regulatory uses of the CALPUFF modeling system may be found at the same web address listed above. 8.3 Screening Models Currently the EPA is developing a screening version of the AERMOD model called AERSCREEN. AERSCREEN will allow users to perform an AERMOD screening run based on conservative meteorological data to obtain ambient concentration estimates for all the common averaging times. Until the EPA officially replaces the SCREEN3 model with the AERSCREEN model, SCREEN3 results will still be accepted. 9.0 Meteorological (Met) Data Dispersion modeling is required to use the most recent representative data available. Spatial representativeness is best achieved by collection of met data obtained from a site in close proximity to a emission source, therefore, site specific data would be preferred if available, otherwise, representative data from a National Weather Service (NMW) may be used. If neither site specific nor representative NWS data is available, the collection of one year of site specific data may be required. The most recent five-year data sets should be used for PSD applications. For non-PSD applications and evaluations involving toxic air contaminants pursuant to Rule 225, only the most recent year of available data should be used. Preprocessed AERMOD meteorological data is available from the AQD’s website at www.michigan.gov/deqair by selecting “Assessment and Planning” from the left menu, choose “Modeling and Meteorology” from the drop-down menu. The surface sites are given in Table 2 with the locations of the sites shown in Figure 1. These files can be used when running the AERMOD model and were developed using the AERMET meteorological preprocessor using surface parameter assumptions representative of the conditions found to exist at most meteorological surface stations, which are typically located at airports.

Air Quality Dispersion Modeling Page 15
Starting with 2007 meteorological data, the AQD plans to use the recently released EPA AERSURFACE tool to generate realistic and reproducible surface characteristic values, including albedo, Bowen ratio, and surface roughness length, for input to AERMET to generate updated 2003 to 2007 met data sets. The tool uses publicly available national land cover datasets and look-up tables of surface characteristics that vary by land cover type and season. According to the September 27, 2005 document titled “AERMOD IMPLEMENTATION GUIDE” available from EPA’s SCRAM web site at http://www.epa.gov/scram001/, the surface parameters should be derived based on the characteristics of the land surrounding the meteorological station used in the modeling and not on the land surround the facility seeking the permit and should be selected based on the guidance found in the EPA’s AERMET User’s Guide.

Air Quality Dispersion Modeling Page 16
TABLE 2
Surface Station FAA Abbr.
Station Number
Upper Air Station Anemometer Data Elev from MSL
Elev from MSL
Name Number Feet Meters Feet Meters
Adrian ADG 04847 White Lake 72632 33 10.06 791 241 Alma AMN 15146 White Lake 72632 33* 10.06* 755 230
Alpena APN 72639 Gaylord 72634 33 10.06 689 210 Ann Arbor ARB 94889 White Lake 72632 33 10.06 823 251 Bad Axe BAX 12417 White Lake 72632 33* 10.06* 768 234
Battle Creek BTL 14801 White Lake 72632 33 10.06 951 290 Bellaire ACB 12662 Gaylord 72634 33* 10.06* 623 190
Beaver Island SJX 04892 Gaylord 72634 33* 10.06* 669 204 Benton Harbor BEH 94871 White Lake 72632 33 10.06 627 191
Big Rapids RQB 14864 Gaylord 72634 33* 10.06* 991 302 Cadillac CAD 14817 Gaylord 72634 33* 10.06* 1306 398
Caro/Tuscola CFS 54828 White Lake 72632 33* 10.06* 702 214 Charlevoix CVX 14867 Gaylord 72634 33* 10.06* 669 204 Charlotte FPK 04877 White Lake 72632 33* 10.06* 891 272
Cheboygan SLH 04893 Gaylord 72634 33* 10.06* 639 195 Coldwater OEB 11675 White Lake 72632 33* 10.06* 958 292
Copper Harbor P59 94899 Green Bay 72645 33 10.06 623 190 Detroit City Airport DET 14822 White Lake 72632 33 10.06 623 190
Detroit - Wayne Co. DTW 94848 White Lake 72632 33 10.06 640 195 Detroit - Willow Run YIP 14853 White Lake 72632 33 10.06 705 215
Escanaba ESC 72648 Green Bay 72645 33* 10.06* 614 187 Flint FNT 14826 White Lake 72632 33 10.06 764 233
Frankfort FKS 54818 Gaylord 72634 33* 10.06* 633 193 Gaylord GLR 14854 Gaylord 72634 33 10.06 1335 407
Grand Rapids GRR 94860 White Lake 72632 33 10.06 778 237 Grayling GOV 04878 Gaylord 72634 33* 10.06* 1158 353
Grosse Ile ONZ 14856 White Lake 72632 33* 10.06* 591 180 Gwinn SAW 94836 Green Bay 72645 33* 10.06* 1220 372
Hancock CMX 72744 Green Bay 72645 26 7.92 1070 326 Harbor Springs MGN 49737 Gaylord 72634 33* 10.06* 685 209
Hillsdale JYM 13823 White Lake 72632 33* 10.06* 1181 360 Holland BIV 12636 White Lake 72632 33 10.06 682 208
Houghton Lake HTL 94814 Gaylord 72634 33 10.06 1152 351 Howell OZW 13947 White Lake 72632 33* 10.06* 961 293
Iron Mountain IMT 94893 Green Bay 72645 26 7.92 1145 349 Ironwood IWD 94926 Green Bay 72645 33* 10.06* 1230 375 Jackson JXN 14833 White Lake 72632 26 7.92 1001 305
Kalamazoo AZO 94815 White Lake 72632 33 10.06 892 272 Lambertville DUH 04872 White Lake 72632 33* 10.06* 668 204
Lansing LAN 14836 White Lake 72632 33 10.06 866 264 Ludington LDM 94816 Green Bay 72645 33* 10.06* 646 197
Mackinac Island MCD 14997 Gaylord 72634 33* 10.06* 741 226 Manistee MBL 94894 Green Bay 72645 33* 10.06* 620 189
Manistique ISQ 14856 Gaylord 72634 33* 10.06* 686 209 Marshall RMY 15195 White Lake 72632 33* 10.06* 942 287 Mason TEW 15200 White Lake 72632 33* 10.06* 919 280
Menominee MNM 94896 Green Bay 72645 33* 10.06* 627 191 Monroe TTF 15553 White Lake 72632 33* 10.06* 617 188

Air Quality Dispersion Modeling Page 17
Surface Station FAA Abbr.
Station Number
Upper Air Station Anemometer Data
Elev from MSL
Elev from MSL
Name Number Feet Meters Feet Meters Mount Plesant MOP 15677 Gaylord 72634 33* 10.06* 755 230
Munising P53 54813 Gaylord 72634 33* 10.06* 613 187 Muskegon MKG 14840 Green Bay 72645 33 10.06 627 191 Newberry ERY 15809 Gaylord 72634 33* 10.06* 869 265 Oscoda OSC 14808 Gaylord 72634 33* 10.06* 633 193 Owosso RNP 54824 White Lake 72632 33* 10.06* 734 224 Pellston PLN 14841 Gaylord 72634 26 7.92 712 217 Pontiac PTK 94817 White Lake 72632 33 10.06 981 299
Port Hope P58 94898 White Lake 72632 33 10.06 587 179 Port Huron PHN 94880 White Lake 72632 33* 10.06* 650 198
Presque Isle PZQ 97089 Gaylord 72634 33* 10.06* 669 204 Saginaw - MBS Int'l MBS 14845 White Lake 72632 33 10.06 663 202
Saginaw - Browne HYX 14829 White Lake 72632 33* 10.06* 600 183 Sault Ste Marie - Sanderson Field ANJ 72734 Gaylord 72634 33 10.06 715 218 Sault Ste Marie - Chippewa Co. CIU 12734 Gaylord 72634 33* 10.06* 801 244
Selfridge MTC 14804 White Lake 72632 33* 10.06* 581 177 South Bend, IN SBN 14848 White Lake 72632 21 6.4 774 236 South Haven LWA 54826 White Lake 72632 33* 10.06* 666 203
Sturgis IRS 17950 White Lake 72632 33* 10.06* 925 282 Three Rivers HAI 04196 White Lake 72632 33* 10.06* 823 251
Toledo, OH TOL 72536 White Lake 72632 30 9.14 692 211 Traverse City TVC 14857 Gaylord 72634 26 7.92 623 190
Troy VLL 54829 White Lake 72632 33* 10.06* 728 222 *Anemometer height for these stations is not known. The default value of 33 feet was used.

Air Quality Dispersion Modeling Page 18
Figure 1 Map of Available Meteorological Stations
The above map depicts stations for which surface meteorological data and wind roses are available for download from the DEQ website. All stations are denoted by their three letter abbreviated call sign. Stations in RED are those for which upper meteorological data is available. For more detailed information about each station, please visit the National Climatic Data Center (NCDC) and search based on call sign.

Air Quality Dispersion Modeling Page 19
10.0 Ambient Background Data Background concentrations are available for criteria pollutants and may be obtained from the following EPA website: http://www.epa.gov/air/data or by calling any AQD modeling staff. Appropriate criteria pollutant background values should be based on the most recent three years of data from the most representative monitor near the modeling domain that would not be influenced by the sources that would be considered in the modeling analysis and determined by the following methodology:
• For pollutants with annual averaging periods, the highest of the three annual concentrations should be used.
• For pollutants with a 24-hour, 8-hour, 3-hour, or 1-hour averaging period (with the exception of PM10), the second high value from each of the three years should be compared with the highest one used.
• For the 24-hour averaging period for PM10, the fourth highest 24-hour concentration observed over the three-year period should be used.
• For the quarterly averaging period for Pb, the highest quarterly concentration observed over the three-year period should be used.
Data from the last three years will not always be available from an otherwise representative monitor. In these cases, the AQD can be consulted as to which alternatives can be considered. Note that when gathering background concentrations from the EPA website above the concentration for some criteria pollutants are in parts per million by volume (ppm) and would need to be converted to micrograms per cubic meter of air µg/m3.. 11.0 Technical Modeling Considerations 11.1 Building Influences Wind fields are perturbed as they flow around buildings and other structures. This phenomenon is commonly referred to as downwash. Downwash occurs when:
H < Hb + 1.5 HL
where H is the stack height, Hb is the height of the building or structure and HL is the lesser of the building's height or length. Generally, a building may cause downwash if it is located within 5 HL of the emitting stack. When employing a model such as AERMOD, the EPA's Building Profile Input Program (BPIP) available off EPA’s SCRAM website should be used to account for building downwash in the model. The bpip input file should be included in all modeling submittals. 11.2 Elevated Terrain Consideration of terrain is the regulatory default with the AERMOD model and should be taken into account in most model evaluations. In certain cases of terrain following plumes in sloping terrain, it may be appropriate to apply the non-DFAULT option in AERMOD to assume flat level terrain. This determination should be made on a case-by-case basis, relying on the modeler’s experience and knowledge of the surrounding terrain and other factors that affect the air flow in the study area, characteristics of the plume (release height and buoyancy), and other factors that may contribute to a terrain-following plume. The decision to use the non-DFAULT option for flat terrain, and details regarding how it will be applied within the overall modeling analysis, should be documented and justified in a modeling protocol submitted to the reviewing authority. Additional information may be found in Section 4.0 of the “AERMOD IMPLEMENTATION GUIDE” available from EPA’s SCRAM web site at http://www.epa.gov/scram001/.

Air Quality Dispersion Modeling Page 20
11.3 Ambient Air Receptor Grids In any modeling demonstration, it is important that the receptor grid (i.e., specific coordinates where the model predicts downwind concentrations) is sufficiently dense to ensure that the point of maximum ambient impact is identified. While each modeling demonstration is unique, grid intervals of 50 meters are generally sufficient to identify the point of maximum impact (i.e., short distance impacts may require an even smaller interval). Polar grids can be used, but the MDEQ generally prefers Cartesian grids since polar grids become less dense farther away from the origin. Discrete receptors should also be placed along secured property lines at intervals not to exceed 25 meters and at any school, hospital, or residence where there is a need to determine pollutant impacts. For facilities without a distinct fenceline or other secured boundary, its reasonable to include a 25 meter buffer distance between receptors and structures with stacks as a practical matter to determine regulatory design values. On a case-by-case basis, closer spacing may be required for projects that involve sources located in very close proximity to sensitive areas including, but not limited to, private residences or public roadways. NAAQS and PSD increment analyses require receptors to be at ground level. Flagpole (above the ground) receptors can be added when elevated areas such as balconies, rooftops, etc. are of concern with respect to the NAAQS, however, increment impacts should be based on receptors located at ground level. Also, it may be necessary to employ "flagpole" receptors to ascertain the toxic pollutant concentrations at locations such as elevated air intake vents on buildings or hospitals, balconies, bridges, and rooftop restaurants. 11.4 Ambient Air/Secured Property Ambient air is defined in 40 CFR Part 50.1(e) as “…that portion of the atmosphere, external to buildings, to which the general public has access…,” which would include areas such as unsecured plant property, railroad tracks, waterways, and roadways. This definition was further clarified in a letter dated December 19, 1980, from Douglas Costle to Senator Jennings Randolph that stated the exemption from ambient air is available only for the atmosphere over land owned or controlled by the source and to which public access is precluded by a fence or other physical barriers. Receptors generally do not need to be placed within secured property. A "secured property line" means a boundary that prevents general public access to property owned by a facility. In certain circumstances, one or more combinations of other barriers and measures such as ones listed below may adequately deem an area as being “secured”; however, this would be subject to the approval of the Department on a case-by-case basis.
• A body of water, such as a ditch, of sufficient size to preclude public access to the property. The body of water must not be available for recreational activities, such as boating, fishing or swimming.
• Regular patrols by staff that are responsible for not allowing unauthorized personnel onto the property. The patrol must be conducted at least several times a day.
• Continuous monitoring by surveillance cameras where staff is assigned to view video monitors and report any unauthorized access.
• All boundaries using the above methods must be clearly posted to communicate private property/no public access.
11.5 Obstructed Flows/Non-Vertical Discharges/Rain Sleeves Stacks that are obstructed or point horizontally or downward will have less plume rise than a vertically-oriented stack having otherwise similar characteristics. To account for this reduced plume rise, the following adjustments should be made: Stack Parameter Horizontal Stacks/Rain Cap/
Wind Turbine Vent Goose
Neck Down Rain Sleeves
Velocity (m/s) see below 0.001 m/s vel of inner flue Temperature (K) see below 294 K unchanged Stack Height (m) see below unchanged Stack+sleeve ht

Air Quality Dispersion Modeling Page 21
For stacks that are fitted with a RAIN CAP or have a HORIZONTAL ORIENTATION, the guidance found in EPA’s AERMOD IMPLEMENTATION GUIDE (available from EPA’s SCRAM website) should be followed. The portion of this guidance portion pertaining to capped and horizontal stacks is shown below: CAPPED AND HORIZONTAL STACKS (from EPA’s AERMOD IMPLEMENTATION GUIDE) “For capped and horizontal stacks that are NOT subject to building downwash influences a simple screening approach (Model Clearinghouse procedure for ISC) can be applied. That is, an effective stack diameter may be used to maintain the flow rate, and hence the buoyancy, of the plume, while suppressing plume momentum by setting the exit velocity to 0.001 m/s. To appropriately account for stack-tip downwash, the user should first apply the non-default option of no stack-tip downwash (i.e., NOSTD keyword). Then, for capped stacks, the stack release height should be reduced by three actual stack diameters to account for the maximum stack-tip downwash adjustment while no adjustment to release height should be made for horizontal releases. Capped and horizontal stacks that are subject to building downwash, should not use an effective stack diameter to simulate the restriction to vertical flow since the PRIME algorithms use the stack diameter to define the plume radius which, in turn, is used to solve conservation laws. The user should input the actual stack diameter and exit temperature but set the exit velocity to a nominally low value, such as 0.001 m/s. This approach will have the desired effect of restricting the vertical flow while avoiding the mass conservation problem inherent with effective diameter approach. The approach suggested here is expected to provide a conservative estimate of impacts. Also, since PRIME does not explicitly consider stack-tip downwash, no adjustments to stack height should be made.” 11.6 Land Use Classification (Urban/Rural) The selection of either rural or urban dispersion coefficients in a specific application should follow one of the procedures described below. Land Use Procedure: 1. Classify the land use within the total area (Ao) circumscribed by a 3-km radius around the source
using the land use typing scheme proposed by Auer (1978). 2. If land use types I1, I2, C1, R2 and R3 account for 50 percent or more of Ao, use urban dispersion
coefficients; otherwise, use appropriate rural dispersion coefficients. Population Density Procedure: 1. Compute the average population density (p) per square kilometer with Ao as defined above. 2. If p is greater than 750 people/km2, use urban dispersion coefficients; otherwise use appropriate
rural dispersion coefficients. Of the two methods, the land use procedure is considered more definitive. Population density should be used with caution. It should not be applied to highly industrialized areas where the population density may be low and thus a rural classification would be indicated, but the area is sufficiently built-up so that the urban land use criteria would be satisfied. Also, there may be sources located within an urban area, but located close enough to a body of water or to other non-urban land use categories to result in a predominately rural land use classification within 3 kilome-ters of the source following the land use procedure. Users are therefore cautioned against applying the Land Use Procedure on a source-by-source basis, but should also consider the potential for urban heat island influences across the full modeling domain. Furthermore, Section 7.2.3(f) of Appendix W recommends modeling all sources within an urban complex using the urban option even if some sources may be defined as rural based on the land use procedure. Such an approach is consistent with the fact that the urban heat island is not a localized effect, but is more regional in character. Another aspect of the urban/rural determination that may require special consideration on a case by-case basis relates to tall stacks located within or adjacent to small to moderate size urban areas. In such cases, the stack height, or effective plume height for very buoyant plumes, may extend above the urban boundary layer height. Application of the urban option in AERMOD for these types of sources may artificially limit the plume height. Therefore, use of the urban option may not be appropriate for these sources, since the actual plume

Air Quality Dispersion Modeling Page 22
is likely to be transported over the urban boundary layer. The determination of whether these sources should be modeled separately without the urban option will depend on a comparison of the stack height or effective plume height with the urban boundary layer height. More information regarding this determination can be found in the “AERMOD IMPLEMENTATION GUIDE” available from EPA’s SCRAM web site (http://www.epa.gov/scram001/). 11.7 Fugitive/Roadway Emissions Modeling Fugitive dust emissions are defined as those emissions which could not reasonably pass through a stack, chimney, vent, or other functionally equivalent opening. Examples of quantifiable fugitive emission sources include coal piles, road dust, quarry emissions, and aggregate stockpiles. For PSD modeling, fugitive dust and roadway emissions should be included in the analysis to the extent they are quantifiable if they occur at one of the following stationary sources:
1. Fossil fuel-fired steam electric plants of more that 250 million British thermal units per hour heat input.
2. Coal cleaning plants (with thermal dryers) 3. Kraft pulp mills 4. Portland cement plants 5. Primary zinc smelters 6. Iron and steel mill plants 7. Primary aluminum ore reduction plants 8. Primary copper smelters 9. Municipal incinerators capable of charging more than 250 tons of refuse per day 10. Hydrofluoric acid plants 11. Sulfuric acid plants 12. Nitric acid plants 13. Petroleum refineries 14. Lime plants 15. Phosphate rock processing plants 16. Coke oven batteries 17. Sulfur recovery plants 18. Carbon black plants (furnace plants) 19. Primary lead smelters 20. Fuel conversion plants 21. Sintering plants 22. Secondary metal production plants 23. Chemical process plants 24. Fossil-fuel boilers (or combination thereof) totaling more than 250 million British thermal units
per hour heat input 25. Petroleum storage and transfer units with a total storage capacity exceeding 300,000 barrels 26. Taconite ore processing plants 27. Glass fiber processing plants 28. Charcoal production plants
These categories are ones were explicitly listed in Section 169 of the Clean Air Act as being subject to a 100 ton per year emission threshold for classification of a major source. For non-PSD modeling reviews, the permit engineer will use discretion on a case-by-case basis to determine whether fugitive dust emissions should be included in the analysis, based their ability to be quantified, the amount of emissions, and how closely they are associated with the operations and activities at the facility. Below are some general guidelines to help categorize a particular source and specific recommendations for deriving the required input parameters for some of the more common types of fugitive emission sources.

Air Quality Dispersion Modeling Page 23
Area Sources: An area source should be used to simulate emissions that initially disperse in two dimensions with little or no plume rise, such as ground-level or low-level emissions from a storage pile, slag dump, landfill, or holding pond. Area sources use an emission rate per unit area instead of total emission, which is calculated by dividing the total emissions in grams per second by the total area in square meters. Volume Sources: Volume sources are used to simulate emissions that initially disperse in three dimensions with no plume rise, such as emissions from roadway truck/vehicle traffic, coke batteries, building vents, conveyor transfer points, screens and crushers, and truck loading/unloading. A recommended method to determine if a volume source is on or adjacent to a structure is to assess whether the structure is greater than 50 percent solid. The release height, initial lateral dimension (σy), and initial vertical dimension (σz) should, in general, be determined according to the suggestions the AERMOD User's Guide and the recommendations in Section 11.8. Pseudo Point Sources: Certain release scenarios such as isolated sidewall vents or a limited number of roof vents could be characterized as a pseudo point source. Horizontal discharges should follow the applicable guidance contained in Section 11.5. For a passive roof vent modeled as a point source, the exit velocity should be set to .001 m/s. 11.8 Recommended Modeling Characterizations for Typical Fugitive Dust Sources Storage Piles Storage piles should be simulated as an area source with the following input parameters:
Release Height = [Height of Pile] / 2 Initial Vertical Dimension (σz) = 0 (optional parameter)
The release height is based on the premise that the wind speed increases with height and the surface area decreases, which tend to counteract each other in terms of emissions. The initial vertical dimension should be 0 because wind erosion emissions from a pile doesn’t have a plume depth, unlike emissions generated by mechanical agitation such as material transfer from a conveyor. Roadway Emissions from Trucks/Vehicles Roadways should be simulated as volume sources using the modeling input parameters derived as shown below:
Side Length of Volume = Truck Width + 6 meters Height of Volume Src = Vehicle Height x 2.0 Release Height = Volume Ht / 2.0 Initial Horizontal Dim (σy) = Vol Width / 2.15 (adjacent vol src’s) or Initial Horizontal Dim (σy) = Center to Center Dist / 2.15 (separated vol src’s) Initial Vertical Dim (σz) = Height of Vol / 2.15
These suggestions are similar to guidance found in other areas of the Country to promote consistent results among the regions. Building Roof /Side Vents Building roof & side vents are categorized as single, elevated sources on a structure and should be simulated using the volume source input parameters derived as shown below: To simulate emissions that emanate from roof & side vents on a building, the following volume source parameters should be used:

Air Quality Dispersion Modeling Page 24
Release Height = Height of vent midpoint Initial Horizontal Dimension (σy) = Avg. Building Width / 4.3 Initial Vertical Dimension (σz) = [Bldg Height ] / 2.15
A release height calculated this way simulates the release with maximum amount of emissions occurring at the roof vent opening, and the initial horizontal and vertical dimensions accounts for the building wake effect on the initial plume growth. Conveyors
Conveyors that transport material into a building or silo would be categorized as a single elevated volume source on or adjacent to a structure. Emissions from the transfer of material from one conveyor to another or to a storage pile would be categorized as a single elevated volume source not on or adjacent to a building. The appropriate volume source modeling parameters would depend on which of these categorizations applies, as shown below:
Parameter Conveyor into Silo/Bldg Conveyor1 to Conveyor2 or Pile Release Height Ht where conveyor enters Bldg Midpt of drop distance Initial Horz Dim Width of Conveyor / 4.3 Width of Conveyor / 4.3 Initial Vert Dim Height of Bldg or Silo / 2.15 Conv1 to Conv2 drop dist / 4.3 Crushers & Screening Again, proper derivation of the appropriate volume source modeling parameters for these source types involves ascertaining whether the source is surface-based or elevated on or adjacent to a building. This determination affects how the initial vertical dimension is calculated as shown below:
Parameter Surface Based Elevated not on or adjacent to a Bldg
Elevated on or adjacent to a Bldg
Release Ht Height of Crusher Height of Crusher Height of Crusher Init Horz Dim Avg Crusher Width/ 4.3 Avg. Crusher Width / 4.3 Avg Crusher Width/4.3 Init Vert Dim Max Ht of Crusher / 4.3 Vert Dim of Source / 4.3 Height of Bldg. / 2.15 Truck Loading with Front-End Loader Emissions are created when material is dropped from the loader bucket into a haul truck. Since the emissions would have to waft over the truck bed to be released, the release height should be set to the top of the truck bed. The initial horizontal dimension should be based on the width of the loader bucket and the initial vertical dimension should be based on the drop distance of the loaded material (same as truck bed sidewall) as noted below:
Release Height = Top of Truck Bed Height Initial Horizontal Dimension (σy) = Width of Front End Loader Bucket / 4.3 Initial Vertical Dimension (σz) = Truck Bed Sidewall Height / 4.3
Truck Loading from Silo/Bin Trucks usually drive under a bin or silo where material is dropped into the truck bed creating a plume of emissions and would be considered a single elevated source on or adjacent to a structure. The release height should be based on the drop distance midpoint between the silo bottom and the truck bed, and the initial vertical and horizontal dimensions on the silo to account for building wake effects, as shown below;

Air Quality Dispersion Modeling Page 25
Release Height = Midpoint of Material Drop Distance Initial Horizontal Dimension (σy) = Width of Silo / 4.3 Initial Vertical Dimension (σz) = Height of Silo / 2.15
Truck Unloading Emissions are created when a haul truck dumps material to a pile or feeder and would be considered a single elevated source on a structure with the structure being the truck. The release height should be set at the height of the truck bed, and the initial horizontal and vertical dimensions, as shown below:
Release Height = Height of Truck Bed Initial Horizontal Dimension (σy) = Width of Truck / 4.3 Initial Vertical Dimension (σz) = Height of Truck / 2.15
If it is unclear how to characterize a fugitive emission source, please contact Jim Haywood at 517-241-7478 ([email protected]) in the modeling group at 517-373-7023. 11.9 Flares Flares are a special type of source that may be modeled as a point source with some adjustments. The EPA SCREEN3 model can be used to predict ambient impacts from these types of sources; however, the total heat release rate in calories/sec is required as an additional modeling input. SCREEN3 uses the total heat release information to calculate an effective release height that is used to determine the 1-hr average maximum ambient concentration. Most modeling software currently available has procedures to handle modeling flare sources that generally follow acceptable EPA methodologies. Flares can be modeling as a point source in a refined model such as AERMOD by following the procedure outlined below, which is contained in the EPA document “WORKBOOK OF SCREENING TECHNIQUES for ASSESSING IMPACTS of TOXIC AIR POLLUTANTS” (Dec 92).
Flare Modeling Procedure Flares can be modeling as a psuedo point source using preferred regulatory refined models such as AERMOD using the technique below to derive the modeling input parameters needed for point sources. Step 1 - Calculate the Total Heat Released (QT) by multiplying the heating value of the flare gas by the gas
flow rate to obtain total potential gross heat release in calories per second (cal/s). Step 2 - Calculate the sensible or Net Heat Available (QH) for plume rise enhancement in cal/s by multiplying
the total heat released by 0.45 which assumes that 55 percent of the total heat is lost due to radia-tion.
QH = (0.45) QT Step 3 – Determine the effective flare stack diameter in meters (m) based on the net heat released as follows: Deff = 9.88x10⁻⁴ (QH)0.5
Step 4 – Calculated the Effective Release Height (He) using the formula below
Heff = HS + [0.00456 x (QT)0.478]
where: Hs = physical stack ht above ground in meters (m) QT = Total Heat Released (cal/s)
Step 5 – Use the effective release height and diameter as calculated above, and an assumed stack gas exit
velocity (Ve) of 20 m/s and gas exit temperature (Te) of 1273 K as point source modeling inputs to model.

Air Quality Dispersion Modeling Page 26
11.10 Odor Modeling The following procedure describes the modeling methodology used when dilution to threshold (D/T) information is available for a stack gas. An ambient concentration of 1 D/T or 1 Odor Unit (OU) means that the odor is just barely perceptible. This procedure yields ambient odor concentrations in terms unit of D/Ts or OUs. 1. Determine the Odor Emission Rate: Multiply the D/T stack value by the volumetric flow rate in
cubic meters per second. Then either multiply this product by 1 x 10E6 to account for default conversion factor of 1 x 10E6 that is imbedded in the ISC model used to convert grams to micrograms, or use the EMISUNIT keyword in the Source pathway to specify a conversion factor of 1, which overrides the default conversion factor yielding modeling results in units of D/Ts.
2. Input Odor Emission Rate: Input the odor emission rate into the model in place of the grams per
second emission rate. 3. Run Model: Run model to produce a 1-hr average estimate and multiply this value by 2 to arrive
at a 10-min average concentration, which is used for odor evaluations. The 10-min concentration predicted by the model would be in units of D/Ts.
11.11 Fumigation Fumigation occurs when a plume is emitted into a stable layer of air and that layer is subsequently mixed to the ground. Mixing occurs through convective transfer of heat from the surface or by advection to less stable surrounding air layers. Fumigation may cause excessively high concentrations but is usually rather short-lived at a given receptor. Fumigation is also an important phenomenon on and near shorelines. This can affect both individual plumes and area-wide emissions. When fumigation conditions are expected to occur from a source or sources with tall stacks located on or just inland of a shoreline, this should be addressed in the air quality modeling analysis. The Shoreline Dispersion Model available from the EPA’s SCRAM website under “Preferred/Recommended Models” may be applied on a case-by-case basis when air quality estimates under shoreline fumigation conditions are needed.

Air Quality Dispersion Modeling Page 27
References Auer, A.H. 1978. Correlation of land use and cover with meteorological anomalies. Journal of Applied Meteorology, 17: 636-643. Michigan Department of Environmental Quality, Administrative Rules for Air Pollution Control, Part 1 - General Provisions. Michigan Department of Environmental Quality, Administrative Rules for Air Pollution Control, Part 2 - Air Use Approval. U.S Environmental Protection Agency. A Workbook of Screening Techniques for Assessing Impacts of Toxic Air Pollutants, EPA 454/R92-024. U.S. Environmental Protection Agency Guideline on Air Quality Models, 40 C.F.R Part 51, Appendix W. U.S. Environmental Protection Agency. Interim Procedures for Evaluating Air Quality Models, EPA 450/4-84-023. U.S. Environmental Protection Agency. September 1995. SCREEN3 Model User's Guide, EPA 454/B-95-004. U.S. Environmental Protection Agency. August 1988. Screening Procedures for Estimating the Air Quality Impact of Stationary Sources, EPA 450/4-88-010. U.S. Environmental Protection Agency. September 1995. User’s Guide for the Industrial Source Complex (ISC3), EPA 450/B-95-003a. Zannetti, Paolo. 1990. Air Pollution Modeling, Theories, Computational Methods and Available Software. Van Nostrand Reinhold. New York: NY. St. Croix Kathryn, Goodman Abby, Heinerikson Arron, June 2003, Defining Appropriate Source Characteris-tics When Modeling Fugitive Sources, Air & Waste Management Paper #69765.
U.S. Environmental Protection Agency. September 2004. USER'S GUIDE FOR THE AMS/EPA REGULATORY MODEL – AERMOD, EPA-454/B-03-001 U.S. Environmental Protection Agency. November 2004. USER’S GUIDE FOR THE AERMOD METEOROLOGICAL PREPROCESSOR (AERMET), EPA-454/B-03-002.
U.S. Environmental Protection Agency. October 2004. USER'S GUIDE FOR THE AERMOD TERRAIN PREPROCESSOR (AERMAP), EPA-454/B-03-003.
U.S. Environmental Protection Agency. January 2008. AERMOD IMPLEMENTATION GUIDE. U.S. Forest Service (Air Quality Program); National Park Service – (Air Resources Division); U.S. Fish and Wildlife Service (Air Quality Branch). December 2000. FEDERAL LAND MANAGERS’ AIR QUALITY RELATED VALUES WORKGROUP (FLAG) - PHASE I REPORT

Air Quality Dispersion Modeling Page 28
APPENDIX A
Information Required For Dispersion Modeling
Please provide the following information, including units, for each pollutant (criteria and toxic air contaminant) emitted from each stack. This information is required whether the applicant or AQD is performing the modeling. For multiple pollutants emitted from multiple stacks, the information may be submitted in a spreadsheet format.
STACK INFORMATION
1. Name of stack or stack identifier 2. Height of stack from ground level (feet or meters) 3. Exit temperature of exhaust gas (°F or °C) 4. Inside diameter or length and width of stack (ft or m) 5. Exit velocity of exhaust gas (ft/s or m/s) OR: Volumetric flow rate (acfm, m3/s) 6. Stack location (UTMs or Local)* 7. Stack Orientation (i.e., vertical, horizontal, gooseneck) 8. Stack Obstructions (rain caps, other) 9. Emission Rate of each pollutant from this stack (lbs/hr or g/s) 10. For FLARES the heat content (Btu/ft3) and flow rate of the gas should be provided * For UTM coordinates please indicate which North American Datum System was used i.e., NAD 1927 or NAD 1983.
VOLUME SOURCE INFORMATION (if applicable)
1. Name of volume identifier 2. Release height (center of volume) (feet or meters) 3. Initial lateral dimension of the volume (meters) 4. Initial vertical dimension of the volume (meters) 5. Center of volume location (UTMs or Local)* 6. Emission Rate of each pollutant from this volume (lbs/hr or g/s) *Provide North American Datum System used (i.e., NAD 1927 or NAD 1983) or Local origin. If local coordi-nates are used, provide a UTM coordinate for the origin.

Air Quality Dispersion Modeling Page 29
AREA SOURCE INFORMATION (if applicable) 1. Name of area identifier 2. Release height above ground (feet or meters) 3. Length of X side (in east-west direction if angle is 0) 4. Length of Y side (in north-south direction if angle is 0) 5. Area rectangle orientation angle from north (degrees) 5. Southwest corner of area source (UTMs or Local)* 6. Emission Rate of each pollutant from this area (g/(s-m2)) *Provide North American Datum System used (i.e., NAD 1927 or NAD 1983) or Local origin. If local coordi-nates are used, provide a UTM coordinate for the (0,0) location.
BUILDING INFORMATION
1. Peak roof height from ground level 2. Heights of any higher sections (tiers) on main roof 3. Building Dimensions, length and width 4. Building Location via Local or UTM coordinates or Plot Plan Please provide the above information for all buildings/structures within a distance of five (5) times the height of that building/structure to any stack
SITE INFORMATION
Please provide a plot plan which includes all of the following: 1. North arrow 2. Distance scale 3. Location of all stacks, volumes, and areas being modeled 4. All buildings/structures located within a distance of 5 times its height to any stack being modeled 5. All property lines 6. Any fence lines, berms, other public access barriers.
ELECTRONIC DATA FILES - CD OR FLOPPY DISK
1. Copy of the modeling input files (*.inp, *.dat, *.dta, *.api) 2. For AERMOD a copy of the Stage 1 and 3 AERMET input files (*.in1, *.in3) 3. For AERMOD a copy of the AERMAP output file (*.rou) 4. Copy of the building profile input (bpip) file (*.bpi) 5. Copy of the modeling output files (not as important as the two first items, but helpful) 6. Toxic Air Contaminant lists/spreadsheets including emission rates, screening levels, and impacts.

Air Quality Dispersion Modeling Page 30
ATTACHMENT 1
UNITED STATES ENVIRONMENTAL PROTECTION AGENCY WASHINGTON, D.C. 20460
OFFICE OF AIR, NOISE, AND RADIATION
DATE: March 19, 1979 SUBJECT: Notification to Federal Land Manager Under Section 165 (d) of the Clean Air Act FROM: David G. Hawkins, Assistant Administrator for Air, Noise, and Radiation (ANR-443) TO: Regional Administrator, Regions I-X The 1977 Clean Air Amendments require the Administrator, under Section 165 (d) 2 (A), to "provide notice of the permit application to the Federal Land Manager and the Federal official charged with direct responsibility for management of any lands within a Class I area which may be affected from a proposed new facility." As you know the Amendments give the Federal Land Manager important new responsibilities for the protection of Class I areas established by Congress. In order to fulfill these responsibilities without causing undue delay in the PSD permit process, EPA should make every effort to provide the Federal Land Manager with as much time as possible to evaluate the effects of the proposed facility's emissions on the air quality related values of nearby Class I areas. Accordingly, each Regional Office should establish a mechanism to ensure that notice is provided to the Federal Land Manager immediately upon receipt of a permit application. In some areas however, depending on the size of the facility and its proximity to a Class I area, it may also be appropriate to notify the Federal Land Manager of the pre-application conference with the owner of a proposed facility. Until we have prepared guidance on determining the impacts a source may have on "air quality related values", notice should be provided for any facility which will be located within 100 kilometers of a Class I area. Very large sources, however, may be expected to affect "air quality related values" at distances greater than 100 kilometers. The appropriate Federal Land Manager should be notified if such impacts are expected on a case-by-case basis. In order to ensure adequate notification, you should notify not only the Federal Land Manager and the Federal official directly responsible for the Class I area but also certain other Federal officials who will be involved in implementing the Federal Land Managers responsibilities under the Act. With this memorandum, I have enclosed a list of the appropriate Federal officials for each of the mandatory Class I areas under the jurisdiction of the National Park Service. Similar listings for the U.S. Fish and Wildlife Service and the U.S. Forest Service will be sent to you at a later date. These lists will be updated periodically as personnel changes occur and new Class I areas are designated.

APPENDIX B.3
Alternate Approach for Investigating Vapors for Petroleum Hydrocarbons
Considering Biodegradation

Remediation Division
ALTERNATE APPROACH FOR
INVESTIGATING VAPORS FOR PETROLEUM HYDROCARBONS CONSIDERING BIODEGRADATION
Original Date of Issuance: January 19, 2012
Revision #: 0 Revision Date:
Approved by: ________________________________ Date: _________________ Patty Brandt, Program Specialist Remediation Division Michigan Department of Environmental Quality Written by: Carrie Geyer Superfund Section Remediation Division Michigan Department of Environmental Quality Matthew Williams, Vapor Intrusion Specialist Superfund Section Remediation Division Michigan Department of Environmental Quality A policy guidance document cannot establish regulatory requirements for parties outside of the Michigan Department of Environmental Quality (MDEQ). This document provides guidance to the MDEQ staff regarding the implementation and interpretation of laws administered by the MDEQ. It is merely explanatory, does not affect the rights of or procedures and practices available to the public, and does not have the force and effect of law.

Remediation Division Alternate Approach
Date: January 19, 2012
Biodegradation Of PHCs
Appendix B.3 Page 2 of 18
PLEASE NOTE: This approach was developed based on a compilation of available information, knowledge, field experience, and general industry practices to provide an alternate approach to parties implementing a response action in Michigan. It was created to promote an alternate approach that is consistent with Part 201, Environmental Remediation, of the Natural Resources and Environmental Protection Act, 1994 PA 451, as amended (NREPA). This document is not a statutory requirement, but could be implemented as an alternate approach under R 299.5714 and R 299.5724. In general, this document should be used as a reference. Differences may exist between the procedures referenced in this document and what is appropriate under site-specific conditions. This document also does not represent an endorsement of practitioners or products mentioned in the document nor does it ensure that this approach is appropriate for all sites. It is imperative that the environmental professional implementing this approach provide adequate justification of this approach. This approach is made available as a technical reference that may be informative when conducting work at sites where vapor intrusion issues are of concern. The MDEQ is not responsible for the misuse or misinterpretation of the information presented herein. Please note that because the approach was written for the MDEQ staff, it may contain references to specific equipment for field investigations that the MDEQ currently uses. Such references do not represent endorsements of particular vendors.

Remediation Division Alternate Approach
Date: January 19, 2012
Biodegradation Of PHCs
Appendix B.3 Page 3 of 18
1.0 INTRODUCTION It has been well documented (USEPA, 2011 and others) that there are differences between petroleum hydrocarbons (PHCs) and chlorinated hydrocarbons (CHCs) with respect to the processes that influence whether and how vapors associated with these compounds migrate into buildings. One of the most significant differences is the relative biodegradability of these compounds. The PHC vapors in the subsurface are known to readily biodegrade in the presence of oxygen (O2), which is referred to as aerobic conditions, thus impacting both their concentration and subsurface migration. Conversely, biodegradation of CHC vapors is an anaerobic process that occurs at a much slower rate (Howard, 1991) and typically does not have a significant impact on contaminant levels or migration in the subsurface. Because of the relatively rapid rate at which PHCs biodegrade when O2 is present, biodegradation can play a significant role in determining if vapor intrusion (VI) is a relevant pathway for PHC impacted sites. Biodegradation occurs when microorganisms in the soil have an easily consumable food source (e.g., PHCs), as well as sufficient O2 for the organisms to metabolize the food. Depending on the depth and concentration of the contaminants, the soil column can act as a natural “biofilter” within which microorganisms consume volatile contaminants and limit the potential for petroleum hydrocarbon-VI(PHC-VI).
Subsurface transport behavior under commonly observed subsurface conditions for CHC and PHC chemicals has been illustrated in Figures 1 and 2. The conceptual scenarios in these figures are overly simplified and do not represent the complexity of actual subsurface environments, such as variations in contaminant distribution due to subsurface heterogeneities. Rather, they are intended to illustrate and contrast several essential behaviors characteristic of petroleum and chlorinated solvent contaminants that are often observed under common site conditions.
As shown in Figures 1 and 2, both the dissolved and vapor plumes associated with CHCs tend to migrate further than the PHC plumes. This is the result of the much slower anaerobic biodegradation process associated with CHCs. In contrast, an aerobic biodegradation zone is typically present along the perimeter of the PHC plumes in both the groundwater and in the soil gas (Figure 2). Within this bioactive zone, natural microbial activity can degrade many PHCs into nontoxic end products like carbon dioxide (CO2) and water (although some biodegradation pathways can produce methane (CH4)). Because soil microbes consume O2 to degrade PHCs, O2 may become depleted where contaminant concentrations are elevated such as in the interior of a groundwater or vapor plume. The
Figure 1 Typical chlorinated hydrocarbon (CHC) Vapor Transport Scenario (USEPA, 2011).
Figure 2 Typical petroleum hydrocarbon (PHC) Vapor Transport Scenario (USEPA, 2011).

Remediation Division Alternate Approach
Date: January 19, 2012
Biodegradation Of PHCs
Appendix B.3 Page 4 of 18
Note: When determining the possible presence and location of vapor sources, it should be noted that both impacted soil and impacted groundwater can serve as sources of vapors.
aerobic biodegradation zone generally develops around the perimeter of the contaminant plume, where O2 transport from the atmosphere or O2ated groundwater (depicted as dashed arrows in Figure 2) can replenish the O2 consumed from degradation in this bioactive zone. Atmospheric O2 migrates into the subsurface through diffusion and advection (e.g., flow of soil gas into and out of the subsurface in response to changes in barometric pressure), as well as through infiltrating rainwater that contains dissolved O2. This document will help to categorize biodegradation at PHC impacted sites into one of three categories:
1. Those in which biodegradation clearly occurs and there is therefore a low potential for VI 2. Those in which biodegradation clearly does not occur and the potential for VI must be evaluated 3. Those in which a conclusion regarding biodegradation cannot be drawn without further evaluation
Though this guidance has tried to make this process applicable for sites that meet the pre-described conditions, when evaluating the potential impact of biodegradation, it is not sufficient to merely reference this guidance and state that biodegradation is occurring or that VI is not occurring. If it is concluded that VI does not pose a risk to the structure identified, it is the responsibility of the party proposing the response action to document the conditions by providing supporting documentation presented in a clear and concise format. It is the intent of this document to help provide the support necessary to document those conditions. If during this evaluation, information is obtained showing that biodegradation is not occurring and vapors are found to be entering into the structure being evaluated, it is expected that the appropriate response actions will be taken. The MDEQ has established the approach outlined in this document as an alternate way to demonstrate compliance with the volatilization to indoor air pathway for PHCs, in accordance with the alternative approaches identified for groundwater (R 299.5714(5)) and soil (R 299.5724(5)). This approach is not applicable to sites with the potential for CHC vapors or for sites that may have areas of commingled PHC and CHC vapors.
2.0 CONCEPTUAL SITE MODEL, SCREENING LEVEL ASSESSMENT, AND RECEPTOR SURVEY An accurate conceptual site model (CSM) is necessary to adequately interpret site investigation results, to determine whether additional investigation is required, to provide support in selecting appropriate remedial actions, and to document that site closure criteria have been achieved. In addition, a screening-level assessment is also needed to determine if the VI pathway is complete, and in some circumstances, to identify the need for an emergency assessment and/or interim response actions (R 299.5526). It should be noted that a CSM is a combination of report narrative, cross-sections, plan-view site figures, and data tables. Cross-sections should identify vapor sources, the interpreted site geology, and receptor locations as appropriate. Site maps should identify the spatial relationships between vapor sources, receptors, sample locations, and known or suspected locations of soil gas and groundwater plumes.

Remediation Division Alternate Approach
Date: January 19, 2012
Biodegradation Of PHCs
Appendix B.3 Page 5 of 18
Note: In circumstances where it is likely that bioattenuation is occurring, the preliminary screening area radius for the VI receptor survey (as identified in Section 3.2.2 of the MDEQ’s VI Guidance Document) can be reduced from 100 feet to 30 feet from the vapor source.
A detailed description of how to develop a CSM and perform a VI screening-level assessment are provided in MDEQ’s document titled Sample Collection and Evaluation of the Vapor Intrusion to the Indoor Air Pathway when the Generic Criteria Do Not Apply (MDEQ VI Guidance Document). In addition to developing a CSM and documenting the extent of the potential sources of vapors, a VI receptor survey should be performed to document possible receptors within the preliminary screening area. More detailed information regarding the VI receptor survey and how to establish the preliminary screening area can be found in the MDEQ VI Guidance Document.
3.0 ESTABLISHING ZONES WHERE BIOATTENUATION IS LIKELY PRESENT Once the site data is compiled, an evaluation of whether bioattenuation is occurring at the site can take place. In general, as part of the evaluation process, a site can fall into one of three possible bioattenuation zones. The zone a site falls within is based on a number of factors, such as the depth of groundwater relative to the structure and the presence of impacted groundwater above the screening values (SVvi) provided in the MDEQ’s VI Guidance Document. These zones are based upon site characteristics that have unique properties and may either encourage or prevent biodegradation from occurring. The zones established in this approach include:
Biodegradation Zone: Conditions exist in which bioattenuation is likely to occur (Davis, 2011). When the conditions for this category are met and able to be documented, no further investigation is warranted and the VI pathway should not be considered complete.
Vapor Intrusion Zone: Conditions will not support biodegradation and therefore are excluded from further modification of a site-specific attenuation factor, site-specific criteria, or even exclusion for further consideration.
Transition Zone: Site conditions are such that a clear determination regarding bioattenuation cannot be made without the collection of additional lines-of-evidence.
It is possible that a site may contain more than one of these zones and if that is the case, a specific CSM should be developed for each of these areas. Information and details of each zone are discussed in more detail below.
3.1 Biodegradation Zone A number of well characterized field studies demonstrate extensive aerobic biodegradation of PHCs in unsaturated soils (Ostendorf and Kampbell, 1991; Ririe and Sweeney, 1995; Ririe et al., 1998; Ostendorf et al., 2000; Hers et al., 2000; Roggemans et al., 2002; Sanders and Hers, 2006; Davis et al., 2009; Patterson and Davis, 2009). Several of these studies documented vapor concentrations at least two to three orders of magnitude lower than would be predicted, in the absence of biodegradation.

Remediation Division Alternate Approach
Date: January 19, 2012
Biodegradation Of PHCs
Appendix B.3 Page 6 of 18
Information provided at several sites investigated by the MDEQ has supported the idea that when certain conditions are present, there is a very low potential for VI to occur. In those situations, a party may be able to conclude that the pathway is not complete and no further investigation of PHC vapors is warranted if certain site conditions are met and are able to be documented. However, as stated above, it remains the responsibility of the party proposing the response action to draw their own conclusions on this approach, as well as to consider the potential for CH4 as a by-product of biodegradation as discussed in Section 4.0 of this document.
A discussion of site conditions conducive for bioremediation is given below. Figure 3 provides an example of the Biodegradation Zone.
Aerobic Conditions. Decades of scientific research and site investigations have demonstrated conclusively that microorganisms capable of aerobically degrading PHCs are present in nearly all subsurface soil environments (Zobell, 1946; Atlas, 1981; Wilson et al., 1986; Leahy and Colwell, 1990; Bedient et al., 1994; USEPA, 1999). If O2 is present at concentrations of five percent or greater, aerobic conditions exist and these organisms will generally consume available PHCs. Furthermore, aerobic biodegradation of petroleum compounds can occur relatively quickly, with degradation half lives as short as hours or days under some conditions (DeVaull, 2007). Some PHCs can also biodegrade under anaerobic conditions; however, this process is less important and generally much slower than aerobic biodegradation.
Figure 3 Typical Biodegradation Zone Scenario
Key processes for the biodegradation of PHCs in the unsaturated zone include: downward O2 transport from the atmosphere, upward hydrocarbon migration from the contaminant source, and aerobic biodegradation along the perimeter of the contamination zone where PHCs are consumed by microbial activity, as previously shown in Figure 1. Important factors influencing aerobic biodegradation include the source concentration, the
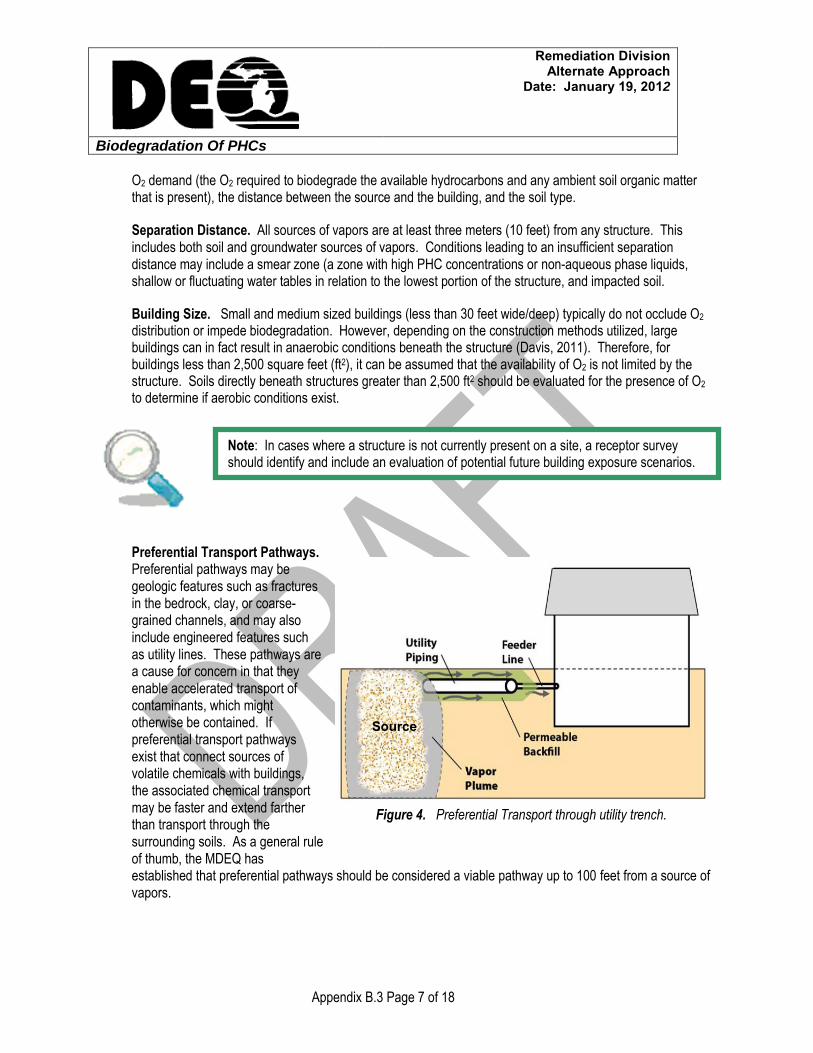
Remediation Division Alternate Approach
Date: January 19, 2012
Biodegradation Of PHCs
Appendix B.3 Page 7 of 18
Note: In cases where a structure is not currently present on a site, a receptor survey should identify and include an evaluation of potential future building exposure scenarios.
O2 demand (the O2 required to biodegrade the available hydrocarbons and any ambient soil organic matter that is present), the distance between the source and the building, and the soil type.
Separation Distance. All sources of vapors are at least three meters (10 feet) from any structure. This includes both soil and groundwater sources of vapors. Conditions leading to an insufficient separation distance may include a smear zone (a zone with high PHC concentrations or non-aqueous phase liquids, shallow or fluctuating water tables in relation to the lowest portion of the structure, and impacted soil.
Building Size. Small and medium sized buildings (less than 30 feet wide/deep) typically do not occlude O2 distribution or impede biodegradation. However, depending on the construction methods utilized, large buildings can in fact result in anaerobic conditions beneath the structure (Davis, 2011). Therefore, for buildings less than 2,500 square feet (ft2), it can be assumed that the availability of O2 is not limited by the structure. Soils directly beneath structures greater than 2,500 ft2 should be evaluated for the presence of O2 to determine if aerobic conditions exist.
Preferential Transport Pathways. Preferential pathways may be geologic features such as fractures in the bedrock, clay, or coarse-grained channels, and may also include engineered features such as utility lines. These pathways are a cause for concern in that they enable accelerated transport of contaminants, which might otherwise be contained. If preferential transport pathways exist that connect sources of volatile chemicals with buildings, the associated chemical transport may be faster and extend farther than transport through the surrounding soils. As a general rule of thumb, the MDEQ has established that preferential pathways should be considered a viable pathway up to 100 feet from a source of vapors.
Source
Figure 4. Preferential Transport through utility trench.

Remediation Division Alternate Approach
Date: January 19, 2012
Biodegradation Of PHCs
Appendix B.3 Page 8 of 18
However, within the Biodegradation Zone, this preliminary screening area can be reduced from 100 feet to 30 feet. If preferential pathways are present, within the 30-foot preliminary screening area, an evaluation of that pathway should be undertaken to adequately consider these conditions. This may result in evaluation of the preferential pathway well beyond the 30-foot distance. Summary. There are a number of site conditions that can result in the conclusion that bioattenuation is occurring in the subsurface. In those circumstances, the potential for VI to occur is greatly reduced and with the proper documentation, a party may be able to conclude that the VI pathway is not complete and no further investigation of PHC vapors is warranted. Documentation of these conditions is typically achieved through the use of a CSM, soil and groundwater data, and site maps. A summary of conditions that typically indicate that biodegradation is occurring, as well as the documentation needed to support that these conditions are present, is provided in Table 1.
TABLE 1
SUMMARY OF CONDITIONS INDICATIVE OF THE BIODEGRADATION ZONE
Condition Supporting Documentation
Aerobic Conditions
Natural conditions are conducive to aerobic conditions -CSM
Separation Distance
All sources of vapors (soil and groundwater) are at least three meters (ten feet) from any structure
-CSM
-Soil and groundwater data
Building Size
Building footprint is less than 2,500 ft2 -CSM
-Site map to scale with structures identified
or
O2 is documented beneath or adjacent to the structure
-Data supporting the presence of O2 beneath and/or adjacent to the structure
Preferential Transport Pathways
Preferential pathways are at least 30 feet from a source of vapors -CSM
or
O2 is present within the preferential pathways up to the structure
-Data supporting the presence of O2 in the preferential pathways
-Boring logs with geological information
3.2 Vapor Intrusion Zone
While the MDEQ concurs that the biodegradation of PHCs is well documented and occurs in many circumstances, it is also true that there are certain site conditions in which biodegradation will not or cannot occur (Roggemans et al., 2001). Because PHCs can pose a VI risk under certain site conditions (DTSC, 2005), utilizing a generic approach for biodegradation to address all sites is not appropriate.

Remediation Division Alternate Approach
Date: January 19, 2012
Biodegradation Of PHCs
Appendix B.3 Page 9 of 18
Should any of the following situations apply, it can be assumed that biodegradation is not likely to occur and that further assessment of the VI pathway is needed. In these circumstances, a party may utilize the MDEQ’s VI Guidance Document to evaluate the pathway (without any additions or modifications) or develop site-specific criteria using site-specific data and an updated version of the Johnson and Ettinger (J&E) Model. Figure 5 provides an example of a VI Zone which typically does not support biodegradation. The conditions associated with this zone are discussed below.
Figure 5 Typical Vapor Intrusion Scenarios for PHCs.
Aerobic Conditions. For biodegradation to limit the potential for PHC-VI, a sufficiently thick layer of biologically active soil is needed between the building foundation and the contamination to allow for biodegradation of PHCs. If site conditions do not promote this biologically active soil layer, bioattenuation will not occur. Aerobic biodegradation requires sufficient O2 in order to be an effective contaminant-removal mechanism. The availability of O2, or lack thereof, can be affected by natural conditions such as elevated water tables or the presence of highly organic soils (e.g., peat). Additional conditions, such as very high PHC concentrations or the presence of concrete foundations and pavement under and adjacent to the structure can also result in limiting the amount of O2 available in the subsurface. Recent studies suggest that in the case of very large building footprints, O2 under the structure may be limited (Patterson and Davis, 2009), though it has been found that the O2 levels in soils beneath average sized structures are not reduced significantly enough to inhibit biodegradation (Lundegard et al., 2008). This issue will be discussed in greater detail under the Building Size section below.

Remediation Division Alternate Approach
Date: January 19, 2012
Biodegradation Of PHCs
Appendix B.3 Page 10 of 18
Separation Distance. As stated above, for biodegradation to occur, a sufficiently thick layer of biologically active soil is needed between the building foundation and the contamination. When a source (either in soil or groundwater) is in direct contact with or has entered into a structure (either directly or in a sump), that layer does not exist and contaminants are able to directly volatize to indoor air preventing any possibility for the biodegradation of vapors. In addition to highly impacted soils that are directly in contact with the structure, impacted groundwater can also be a cause for concern. This is specifically an issue when impacted groundwater enters into a structure or a sump (even seasonally) at concentrations above the GWvi-sump.
For ease of implementation, it should be assumed that if the source of vapors (either soil or groundwater) is within one meter of the structure that it is in contact with it due to the typical presence of footings and other subsurface features. Building Size. Though data provided by Patterson and Davis, 2009 suggest that O2 may be limited if the building footprint is very large (greater than 2,500 ft2), there is also the potential that O2 is present, depending on the construction and use of the structure. Information and data available to date does not provide a conclusion as to what the potential for O2 concentrations should be in these situations and therefore it should undergo further evaluation. If this is the only limiting factor that may prevent biodegradation from occurring, it is highly recommended that the site undergo further evaluation (as discussed in Section 3.3), as there still remains a potential for biodegradation to occur. Preferential Transport Pathways. As discussed earlier, the MDEQ has a general rule of thumb that preferential pathways should be considered a viable pathway for up to 100 feet from a source of vapors. Although the preliminary screening area can be reduced to 30 feet within the Biodegradation Zone, if it is determined that the preferential pathway is within the VI Zone, the 100 foot screening radius should be utilized. Summary. There are a number of site conditions that can result in the conclusion that biodegradation will not reduce or eliminate the potential for VI to occur. When these conditions exist, this alternate approach is not appropriate and the VI pathway should be assessed as outlined in the MDEQ VI Guidance Document. A summary of conditions that typically indicate that biodegradation is not occurring, as well as the documentation that could be used to make this determination, is provided in Table 2. As discussed earlier, documentation of these conditions is typically achieved through the use of a CSM, soil and groundwater data, and site maps.

Remediation Division Alternate Approach
Date: January 19, 2012
Biodegradation Of PHCs
Appendix B.3 Page 11 of 18
TABLE 2 SUMMARY OF CONDITIONS INDICATIVE OF THE VAPOR INTRUSION ZONE
Condition Supporting Documentation
Aerobic Conditions
Site conditions inhibit subsurface O2 -CSM
Separation Distance
Sources of vapors (soil and groundwater) are one meter (three feet) or less from any structure
-CSM
-Soil and groundwater data
Building Size
Building footprint is greater than 2,500 ft2
-CSM
-Site map to scale with structures identified
Preferential Transport Pathways
Preferential pathways exist connecting the structure with a source of vapors
-CSM
3.3 Transition Zone In many circumstances, it cannot be easily determined if site conditions will either promote or prohibit the bioattenuation of PHCs. When the site does not clearly fall into the Biodegradation Zone or the VI Zone, a further evaluation is needed to determine if biodegradation is occurring. In these situations, the site is considered to be in the Transition Zone. Conditions associated with the Transition Zone are summarized in Table 3. The MDEQ has established two methods for evaluating site conditions to determine and document whether bioattenuation is likely present within the Transition Zone. Both methods require the completion of a CSM and identification of any potential source of vapors.
Method 1. The first method relies on the collection of vertical concentration profiles in the unsaturated zone, where O2 concentrations decrease with depth and PHCs and carbon dioxide concentrations increase with depth.
Method 2. The second method utilizes the numerical model, BioVapor, which is verified with site-specific field data.
Although the use of these two methods has been found to successfully provide documentation that biodegradation is likely occurring in the subsurface, and the potential for VI is therefore minimal, the use of these specific methods is not required and another method may be proposed. Both methods will require the collection of soil gas or sub-slab soil gas data. If the results are identified below the SGvi-SS (or other site-specific criteria), the methods presented below will assist in gathering the necessary information to draw the conclusion that the potential for VI is minimal. Note that if concentrations are detected in the sub-slab soil gas above the SGvi-SS (or other site-specific criteria), it is inappropriate to run a model. Further evaluation of the structure should occur.

Remediation Division Alternate Approach
Date: January 19, 2012
Biodegradation Of PHCs
Appendix B.3 Page 12 of 18
3.3.1 Method 1: Collection of Vertical Concentration Profiles
Aerobic biodegradation consumes O2 and generates carbon dioxide (CO2) and water. As shown in Figure 6 (Roggemans et al., 2001), as aerobic biodegradation in unsaturated soil occurs, PHCs will degrade, CO2 will be produced, and O2 will be consumed. The aerobic Biodegradation Zone extends over the area of active biodegradation. The source zone, which is anaerobic, is characterized by the maximum volatile organic compound concentrations and little biodegradation. Creating these concentration profiles (PHC, O2, CO2, and CH4) at a number of locations on the site, by collecting data as a function of depth, will provide the information necessary to determine if and where aerobic biodegradation zones are present. Although this method will require the collection and analysis of more samples initially, once the profiles have been determined, documenting that bioattenuation is occurring may be accomplished in as little as one additional PHC sampling event.
TABLE 3 SUMMARY OF CONDITIONS INDICATIVE OF THE TRANSITION ZONE
Condition Supporting Documentation
Aerobic Conditions
Natural conditions are conducive to aerobic conditions -CSM
Separation Distance
Sources of vapors (soil and groundwater) are greater than one meter (three feet) and less than three meters (ten feet) from any structure
-CSM
-Soil and groundwater data
Building Size
Building footprint is greater than 2,500 ft2
-CSM
-Site map to scale with structures identified
or
O2 is documented beneath or adjacent to the structure
-Data supporting the presence of O2 beneath and/or adjacent to the structure
Preferential Transport Pathways
Preferential pathways are 30 feet (nine meters) from a source of vapors
-CSM
or
O2 is present within the preferential pathways up to the structure
-Data supporting the presence of O2 in the preferential pathways
-Boring logs with geological information

Remediation Division Alternate Approach
Date: January 19, 2012
Biodegradation Of PHCs
Appendix B.3 Page 13 of 18
When utilizing this method, the following guidelines should be used to develop vertical profiles and correlations:
At least 25 percent of the number of sub-slab points recommended in the MDEQ VI Guidance Document should be installed and sampled.
Each sub-slab point should result in a minimum of four vertical sampling locations of equal distance between the groundwater and the lowest surface of the structure being evaluated (not to exceed eight feet in total profile depth).
Monitoring points should be installed using the appropriate methodologies.
Correlating PHC, O2, CO2, and CH4 samples are collected during the sampling event at each sub-slab point and at each depth within each sub-slab sampling location.
Proper sampling methodologies should be utilized with full quality assurance/quality control procedures.
At least three other quarters of O2, CO2, and CH4 should be collected with all profiles showing similar trends.
Assuming proper correlations have been established from the initial round of sampling, a direct read meter can be utilized to evaluate PHC concentrations in lieu of running a Method TO-15 analysis.
Figure 6 Typical vertical concentration profile in the unsaturated zone for
PHCs, O2, CO2. (modified from Roggemans et al, 2001).

Remediation Division Alternate Approach
Date: January 19, 2012
Biodegradation Of PHCs
Appendix B.3 Page 14 of 18
3.3.2 Method 2: Modeling of Site Conditions using BioVapor The method described in this section is based on the collection of site-specific data that is entered into a modeling program called BioVapor. BioVapor was developed by the American Petroleum Institute (API) as a spreadsheet-based model that allows for implementation of an algebraic solution (DeVaull, 2007). This model incorporates steady-state vapor source, diffusion-dominated, soil vapor transport in a homogeneous subsurface soil layer and mixing within a building enclosure. It assumes the soil is divided into a shallow aerobic layer, including first-order biodegradation, and a deeper anaerobic layer in which biodegradation is negligible. The BioVapor Model does not directly account for spatial or temporal variations in parameter values. As a result, the model is not expected to provide highly accurate predictions when a single set of input parameter values are used to represent a single site (API, 2010). Therefore, the model must be run at multiple locations across a project site. More information on the limitations and inputs required for BioVapor can be found in the user guide made available by API on its website at www.api.org. For some scenarios, the model will predict unacceptable PHC concentrations in indoor air when high concentrations of PHC are present in the subsurface. The identification of these concentrations does not necessarily indicate that VI is occurring, but does mean that further investigation is warranted. When interpreting a site using BioVapor, the user must also consider the uncertainty associated with the model inputs, along with the potential effects of spatial and temporal variability. When free-phase hydrocarbons are present in the subsurface in close proximity to the target building, the user is cautioned against relying on BioVapor model results as the primary line-of-evidence that VI is not a concern. In this case, BioVapor model results are more appropriately considered as a secondary or supporting line of evidence when other investigation results also indicate that there is no VI concern (API, 2010). In addition, the user is reminded that BioVapor does not evaluate other potential exposure routes (besides VI), migration pathways, or potential risks (such as fire and explosion) other than health toxicity. The user is responsible for evaluation of these other considerations. The following sections provide information on the data necessary to complete the model and submit it as a line-of-evidence that supports biodegradation of PHC is occurring.
A. Data Collection
The location and frequency of the data necessary to collect for this zone (Transition Zone) is similar to that outlined in the MDEQ’s VI Guidance Document. However, with the collection of the site-specific data and appropriate results from BioVapor, as well as a sensitivity analysis of the data inputs, the sampling frequency may be reduced to just two events. There are additional data collection requirements to support running the BioVapor Model, which include the collection of O2, CO2, and CH4. However, these parameters can typically be collected through the use of a properly calibrated field meter. Additional information on the inputs or selections to be made to support bioattenuation is provided below.
B. Oxygen Boundary Condition
Earthen Floor Foundation. This option can be selected for crawlspaces and in areas where the resistance to O2 flow by a solid foundation is negligible. When this option is utilized it should be supported by the collection of O2 samples within the crawlspace. The amount of O2 and its variability should be evaluated throughout the

Remediation Division Alternate Approach
Date: January 19, 2012
Biodegradation Of PHCs
Appendix B.3 Page 15 of 18
entire year, including the winter. The O2 data should be collected at a frequency that allows for a statistical evaluation of the data and whether multiple populations of data are present. If multiple populations of data are present, the minimum O2 concentration should be utilized, otherwise an upper 90 percent confidence level can be utilized. Slab or Basement Foundation (e.g., specify airflow). If this option is utilized, the maximum O2 availability is limited by atmospheric O2 concentration and resistance to O2 flow by both a building foundation and diffusion of O2 from below the building foundation towards the PHC source. The O2 levels are based on a generic assumption. Unless data is collected from the site at a frequency that allows for a statistical evaluation of the data, it should not be modified. The other parameter that should not be modified without supporting measurements and documentation is the airflow under the foundation which can be found in Section 5.0 of the data inputs in BioVapor. Specify Aerobic Depth Below Foundation. The MDEQ prefers this methodology as it provides a strong line-of-evidence as to the amount of lateral space that exists between the structure and the potential source of vapors. There are also benefits in being able to evaluate single compounds using this method, as discussed in the BioVapor User’s Guide and Section C below. The use of this method requires the ability to document the depth of the aerobic zone based on site-specific O2 profiles collected up to the potential source of vapors (typically not to exceed eight feet in total depth).
C. Sampling the Source of Vapors
It is important for the user to identify all biodegradable vapor-phase hydrocarbons present in the source area. This will require samples that are collected and analyzed for soil gas and/or groundwater. Estimated concentrations are typically not recommended and cannot be utilized for a site-specific closure under Part 213, Leaking Underground Storage Tanks, of the Natural Resources and Environmental Protection Act, 1994 PA 451, as amended. It should be noted that ethanol must be included for new releases. The “Earthen Floor Foundation” and the “Slab or Basement Foundation” boundary conditions discussed above, both utilize an O2 mass balance (demand versus availability) to determine the depth of the aerobic zone. If the user does not identify all volatile chemicals that exert an O2 demand, then the model will over estimate the depth of the aerobic zone and over-predict the effect of biodegradation. If the O2 boundary condition is “Specify Aerobic Depth Below Foundation,” no O2 mass balance is performed and the model results for individual chemicals will not be affected by the total hydrocarbon concentration. More information can be found in the BioVapor User’s Guide.
D. Exposure and Risk Factors
The user must enter exposure and risk factor values to be used for indoor risk calculations. Though default parameters are provided through the “Paste” command available in the model, the MDEQ’s exposure and risk factors should be utilized and are provided in Table 4.

Remediation Division Alternate Approach
Date: January 19, 2012
Biodegradation Of PHCs
Appendix B.3 Page 16 of 18
Table 4
MDEQ Exposure and Risk Factors
Exposure and Risk Factors Residential Nonresidential
Target Hazard Quotient For Individual Chemicals (THQ)
1 1
Target Excess Individual Lifetime Cancer Risk (TR) 1E-05 1E-05
Averaging Time, Carcinogen (ATC) 25,550 days/yr 25,550 days/yr
Averaging Time, Non-carcinogenic (ATNC) 10,950 days/yr 7,665 days/yr
Exposure Duration, Carcinogen & Non-carcinogenic (ED)
30 yrs 21 yrs
Exposure Frequency, Carcinogen & Non-carcinogenic (EF)
350 days/yr 245 days/yr
Body Weight - Adult (BW) 70 kg 70 kg
Indoor Inhalation Rate Exposure Adjustment (CF) 0.25 1.0
E. Building and Vadose Zone Parameters
It is imperative that if any of the building or vadose zone parameters are modified, it is done with data based on site-specific information and measurements that have undergone a sensitivity analysis. One of the easiest ways to perform this test is to enter the parameters into the on-line-calculator available from the United States Environmental Protection Agency at:
http://www.epa.gov/athens/learn2model/part-two/onsite/JnE_lite.html. This on-line calculator implements the J&E Model (Johnson and Ettinger, 1991) simplified to evaluate the VI pathway into buildings, and includes a simplified uncertainty/sensitivity analysis the other implementations lack. Though the outcomes are not expected to match, the uncertainty/sensitivity analysis will provide documentation that the parameters utilized are within the acceptable allowances for the J&E Model.
3.3.3 Output
Both of the methods can be used to determine if bioattenuation is occurring, but with any determination of compliance, will require detailed documentation of the procedures and information utilized. When using the BioVapor Model, the report should include all of the parameters utilized, any modifications from the MDEQ assumptions, and a sensitivity analysis. 4.0 METHANE Sources of CH4 include solid or industrial waste deposits, oil and gas wells, groundwater contamination plumes (especially biodegrading PHCs), and leaking natural gas pipelines. CH4 is not toxic; the principle health and safety concerns are its explosive, flammable, and asphyxiant properties. Since CH4 is a simple asphyxiant, acting by displacement of O2, no threshold limit value (TLV), permissible exposure limit (PEL), or recommended exposure limit value (REL) has been established. However, migrating CH4 gas can pose serious public health and safety risks, principally fire and explosion. In addition, it is known that the presence of CH4 inhibits the biodegradation of PHCs. In sites where biodegradation is known (or thought) to be occurring, a party should evaluate the potential for CH4.

Remediation Division Alternate Approach
Date: January 19, 2012
Biodegradation Of PHCs
Appendix B.3 Page 17 of 18
References American Petroleum Institute (API). 2010. User’s Manual for BioVapor, A 1-D Vapor Intrusion Model with Oxygen-
Limited Aerobic Biodegradation. GSI Environmental Inc., Houston, Texas. Atlas, R.M. 1981. Microbial degradation of petroleum hydrocarbons: an environmental perspective. Microbiological
Reviews 45(1): 180-209. Bedient, P.B., H.S. Rifai, and C.J. Newell. 1994. Ground Water Contamination: Transport and
Remediation. PTR Prentice-Hall, Inc., Englewood Cliffs, New Jersey.
Davis, G.B., B.M. Patterson, and M.G. Trefry. 2009. Evidence for instantaneous oxygen-limited biodegradation of petroleum hydrocarbon vapors in the subsurface. Groundwater Monitoring and Remediation 29(1): 126-137.
Davis, 2011. Attenuation of Subsurface Petroleum Hydrocarbon Vapors Spatial and Temporal Observations AEHS 21st Annual West Coast International Conference on Soil, Sediment, Water, & Energy, Mission Valley, San Diego, California, Platform Session 3, Wednesday, March 16, 2011, 1:30-4:30.
DeVaull, G. 2007. Indoor vapor intrusion with oxygen-limited biodegradation for a subsurface gasoline source.
Environmental Science and Technology 41(9): 3241-3248.
Department of Toxic Substances Control (DTSC). 2005. Interim Final. Response to Public Comments. Guidance for the Evaluation and Mitigation of Subsurface Vapor Intrusion to Indoor Air, February 2005. California Environmental Protection Agency.
Hers, I., J. Atwater, L. Li, and R. Zapf-Gilje. 2000. Evaluation of vadose zone biodegradation of BTX vapours.
Journal of Contaminant Hydrology 46: 233–264. Howard, P.H. 1991. Handbook of Environmental Degradation Rates. Lewis Publishers, Chelsea, Michigan.
Johnson, P.C., and R.A. Ettinger. 1991. Heuristic model for predicting the intrusion rate of contaminant vapors into buildings. Environmental Science and Technology, 25:1445-1452.
Leahy, J.G., and R.R. Colwell. 1990. Microbial degradation of hydrocarbons in the environment.
Microbiological Reviews 54(3): 305-315.
Lundegard, P.D., P.C. Johnson, and P. Dahlen. 2008. Oxygen transport from the atmosphere to soil gas beneath a slab-on-grade foundation overlying petroleum-impacted soil. Environmental Science and Technology, 42(15): 5534-5540.
Ostendorf, D.W., and D.H. Kampbell. 1991. Biodegradation of hydrocarbon vapors in the unsaturated zone. Water Resources Research 27(4): 453-462.
Ostendorf, D.W., E.S. Hinlein, A.J. Lutenegger, and S.P. Kelley. 2000. Soil gas transport above a jet fuel/solvent spill at Plattsburgh Air Force Base. Water Resources Research 36(9): 2531–2547.

Remediation Division Alternate Approach
Date: January 19, 2012
Biodegradation Of PHCs
Appendix B.3 Page 18 of 18
Patterson, B.M., and G.B. Davis. 2009. Quantification of vapor intrusion pathways into a slab-on-ground building under varying environmental conditions. Environmental Science and Technology 43(3): 650-656.
Ririe, T., and R. Sweeney. 1995. Fate and transport of volatile hydrocarbons in the vadose zone. In: Proceedings of the 1995 Petroleum Hydrocarbon and Organic Chemicals in Groundwater Conference, American Petroleum Institute and the National Ground Water Association, Houston, Texas, pages 529-542.
Ririe, T., R. Sweeney, S. Daughery, and P. Peuron. 1998. A vapor transport model that is consistent with field and
laboratory data. In: Proceedings of the 1998 Petroleum Hydrocarbon and Organic Chemicals in Groundwater Conference, American Petroleum Institute and the National Ground Water Association, Houston, Texas.
Roggemans, S., C.L. Bruce, P.C. Johnson, and R.L. Johnson. 2001. Vadose Zone Natural Attenuation of Hydrocarbon Vapors: An Empirical Assessment of Soil Gas Vertical Profile Data. American Petroleum Institute Technical Bulletin No. 15, December 2001.
Roggemans, S., C.L. Bruce, and P.C. Johnson. 2002. Vadose Zone Natural Attenuation of Hydrocarbon Vapors:
An Empirical Assessment of Soil Gas Vertical Profile Data. API Technical Bulletin No. 15, American Petroleum Institute, Washington, DC. Available at http://apiep.api.org/environment.
Sanders, P.F., and I. Hers. 2006. Vapor intrusion into homes over gasoline-contaminated ground water in Stafford,
New Jersey. Groundwater Monitoring and Remediation 26(1): 63-72. USEPA (Environmental Protection Agency). 1999. Monitored Natural Attenuation of Petroleum Hydrocarbons.
Remedial Technology Fact Sheet. EPA/600/F-98/021. Office of Research and Development, Washington, DC. May.
USEPA (Environmental Protection Agency). 2011. Draft Petroleum Vapor Intrusion Information Paper.
Wilson, J.T., L.E. Leach, M. Henson, and J.N. Jones. 1986. In-situ biorestoration as a ground water remediation technique. Ground Water Monitoring Review 6: 56-64.
Zobell, C.E. 1946. Action of microorganisms on hydrocarbons. Bacteriological Reviews 10(1–2): 1-49.
APPENDIX B.4
Approach for Demonstrating Compliance with a Crawlspace
(Currently Under Development)

Appendix C – Checklists for Evaluating Compliance with Part 201 Table of Contents APPENDIX C.1 – Checklist for Determining if the Generic Volatilization to Indoor Air Inhalation Criteria Apply APPENDIX C.2 – Checklist for Developing a Conceptual Site Model APPENDIX C.3 – Checklist for Reviewing Soil Gas Sampling Protocols and Laboratory Data APPENDIX C.4 – Checklist for Reviewing Sub-Slab Sampling Protocols and Laboratory Data APPENDIX C.5 – Checklist for Reviewing the Design of an Active Mitigation System APPENDIX C.6 – Checklist for Reviewing the Design of a Passive Mitigation System

APPENDIX C.1 Checklist for Determining if the Generic
Volatilization to Indoor Air Inhalation Criteria Apply

Appendix C.1 Page 1 of 3
APPENDIX C.1 BACKGROUND
Part 201, Environmental Remediation, of the Natural Resources and Environmental Protection Act, 1994 PA 451, as amended (NREPA), and the associated Administrative Rules regulate most sites of environmental contamination in Michigan. The Part 201 Administrative Rules establish the generic cleanup criteria for the hazardous substances in vapors emanating from groundwater (R 299.5714) and soil (R 299.5724) to indoor air.
GROUNDWATER
Rule 714(2) identifies conditions for which the generic cleanup criteria for groundwater do not apply and a site-specific evaluation is required. If any of the conditions outlined in Rule 714(2)(a-c) apply, then a site-specific evaluation must be completed.
SOIL
Rule 724(2) identifies conditions for which the generic cleanup criteria for soil do not apply and a site-specific evaluation is required. If any of the conditions outlined in Rule 724(2)(a-b) apply, then a site-specific evaluation must be completed.
Rule 714(2): Except as provided in subrule (1) of this rule, if any of the following conditions exist, the generic cleanup criteria developed pursuant to this rule shall not apply and a site-specific evaluation of indoor air inhalation risks shall be conducted: (a) There is a structure present or planned to be constructed at the facility which does not have a concrete block or poured concrete floor and walls. (b) The highest water table elevation of a contaminated saturated zone at the facility, considering seasonal variation, is within three meters of the ground surface. (c) There is a sump present that is not completely isolated from the surrounding soil by its materials of construction; or there is other direct entry of contaminated groundwater into the basement.
Rule 724(2): Except as provided in subrule (1) of this rule, if any of the following conditions exist, the generic cleanup criteria developed pursuant to this rule shall not apply and a site-specific evaluation of indoor air inhalation risks shall be conducted: (a) There is a structure present or planned to be constructed at the facility which does not have a concrete block or poured concrete floor and walls. (b) There is a sump present that is not completely isolated from the surrounding soil by its materials of construction.

Appendix C.1 Page 2 of 3
JOHNSON AND ETTINGER MODEL
The United States Environmental Protection Agency (USEPA) has identified a number of conditions under which the application of the Johnson and Ettinger Model is precluded. These conditions can result in concentrations that may not be protective of public health for the vapor intrusion pathway. Conditions include:
1. The actual or suspected presence of residual or free-phase light and dense non-aqueous phase liquids (LNAPL and DNAPL), i.e., fuels, solvents, etc., or smear zones in the subsurface
2. The presence of heterogeneous geologic materials between the vapor source and the building 3. The presence of geologic materials that are fractured, contain macropores, karst, or other preferential
pathways 4. Sites where significant lateral flow of vapors occur due to preferential pathways 5. Shallow groundwater in contact with the building foundation 6. Small building air exchange rates (e.g., less than 0.25 building exchanges/hour) 7. Buildings with crawlspace structures or other significant openings to the subsurface (e.g., earthen floors,
stone buildings, etc.) 8. Contaminated groundwater sites with large water table fluctuations

Appendix C.1 Page 3 of 3
APPENDIX C.1 Checklist for Determining if the Generic Volatilization to Indoor Air Inhalation Criteria Apply
Site Name: Site ID: Site Address: County:
If any of the following apply then a site-specific evaluation in compliance with R 299.5714(5) and R 299.5724(5) is required:
For groundwater:
There is a structure present or planned to be constructed at the facility which does not have a concrete block or poured concrete floor and walls.
The highest water table elevation of a contaminated saturated zone at the facility, considering seasonal variation, is within three meters of the ground surface.
There is a sump present that is not completely isolated from the surrounding soil by its materials of construction; or there is other direct entry of contaminated groundwater into the basement.
For soil:
There is a structure present or planned to be constructed at the facility which does not have a concrete block or poured concrete floor and walls.
There is a sump present that is not completely isolated from the surrounding soil by its materials of construction.
The USEPA has identified a number of conditions under which the application of the Johnson and Ettinger Model is precluded because these conditions can result in concentrations that may not be protective of public health for the vapor intrusion pathway.
The actual or suspected presence of free-phase non-aqueous phase liquids (LNAPL; DNAPL; i.e., fuels, solvents, etc.) or smear zones in the subsurface.
The presence of heterogeneous geologic materials between the vapor source and the building.
The presence of geologic materials that are fractured, contain macropores, karst, or other preferential pathways.
Sites where significant lateral flow of vapors occur.
Shallow groundwater in contact with the building foundation.
Buildings with crawlspace structures or other significant openings to the subsurface (e.g., earthen floors, stone buildings, etc.).
Contaminated groundwater sites with large water table fluctuations.
The other condition identified by the USEPA (e.g., very small building air exchange rates) is not typically investigated during the course of an investigation. The condition, though not included above, should be considered and evaluated if warranted or knowledge indicates a necessity to consider.
The information included in this checklist may be used by staff to determine if the generic criteria apply and a site-specific evaluation is necessary for evaluating hazardous substances in vapors for the volatilization to indoor air pathway.

APPENDIX C.2
Checklist for Developing a
Conceptual Site Model

Appendix C.2 Page 1 of 3
Figure A.2. CSM illustrating vapors from a
groundwater source
APPENDIX C.2 Developing a Conceptual Site Model
Developing a conceptual site model (CSM) is an important first step for assessing contaminated sites and the potential for vapor intrusion. Briefly, a CSM is a picture and narrative of the site contamination: how it got there, whether or not it is migrating or degrading, its distribution across the site, who might be exposed to it, and what risk-reduction strategies are most feasible. A CSM development actually begins during the Phase I Environmental Site Assessment with collection and evaluation of site history and reconnaissance information.
During subsequent site characterization activities, the CSM can be augmented and refined, as necessary, with site-specific information on source areas, contaminant properties, stratigraphy, hydrogeology, exposure pathways, and potential receptors. Building and refining a thorough CSM may involve a combination of techniques and tools to understand the subsurface, but specifically, investigations for vapor intrusion often include collecting samples of soil, groundwater, soil vapor, and/or indoor air. Investigators may use sampling in combination with predictive models. Constructing a CSM for vapor intrusion requires the integration of important site characteristics to assist in understanding and evaluating the potential impacts that vapor intrusion risks pose to potential receptors. The purpose for developing a CSM for the vapor intrusion pathway is to assemble a three-dimensional concept of the site that is as comprehensive as possible. This is based on reliable data describing the sources of the contamination, the release/transport mechanisms, the
possible subsurface migration routes, the potential receptors, as well as historical uses of the site, cleanup concerns expressed by the community, and future land use plans. All the important features relevant to characterization of a site should be included in a CSM, and any irrelevant ones excluded.
Contents of the Conceptual Site Model
The CSM should present both a narrative and a visual representation of the actual or predicted relationships between the contaminants at the site and receptors (building occupants), as well as reflect any relevant background levels. A basic example of a visual representation is included as Figure A.2. The CSM should also contain a narrative description that clearly distinguishes what aspects are known or determined and what assumptions have been made in its development. Below is a CSM checklist to assist in the review of this component of the vapor intrusion assessment. The CSM provides a conceptual understanding of the potential for exposure to compounds of concern at a site. It is an essential tool to aid management decisions associated with the site and serves as a valuable communication tool both internally with the site team and externally with the community. The CSM is a dynamic tool to be updated as new information becomes available after each stage of investigation.

Appendix C.2 Page 2 of 3
APPENDIX C.2 Checklist for Developing a Conceptual Site Model
Site Name: Site ID: Site Address: County:
1.0 UTILITIES AND PROCESS PIPING
_____ Maps, figures, and cross-sections of the building provide the location and depths of all underground utilities and/or process piping near the soil or groundwater impacts.
_____ All utilities that connect contaminated areas to buildings are shown and described.
2.0 BUILDINGS (RECEPTORS)
_____ Maps identify:
Existing or proposed buildings
Vacant parcels
Property boundaries
_____ Description of the occupancy and use of all properties/buildings is provided.
_____ Construction of each structure is provided and includes (if applicable):
General construction style (e.g., basement, crawlspace, slab on grade)
Floor construction (e.g., concrete, dirt)
Depth below grade of lowest floor
Building layout (e.g., large and open, small rooms)
Height (and number of floors)
Sumps or foundation drains
Alternate ventilation system
Elevator(s)
_____ Heating, ventilation or air conditioning system in each structure is described and includes (if applicable):
Type (e.g., forced air, radiant)
Equipment location (e.g., basement, crawlspace, utility closet, attic, roof)
Source of return air (e.g., inside air, outside air, combination)
System design considerations relating to indoor air pressure (e.g., positive pressure may be the case for commercial office buildings)
_____ All sub-slab ventilation systems or moisture barriers present are described; identified on all building cross-sections; and mapped, if only a portion of the structure.
The information included in this checklist may be useful for evaluating a site-specific conceptual migration model and ensuring that the model contains the necessary elements. A blank is provided before each item to aid in documenting the individual components and where they can be found.

Appendix C.2 Page 3 of 3
3.0 SOURCE AREA(S)
_____ Brief description and known history of the release.
_____ Maps and figures identify and show the location of all vapor source(s) in relation to each structure (including the presence, distribution, and composition of any non-aqueous phase liquid at the site).
_____ Select cross-sections showing example building, construction styles, and relationship to source of vapors are provided (actual number will vary as appropriate).
_____ Description of the potential migration characteristics (e.g., stable, increasing, decreasing) for the distribution of contaminants is provided.
4.0 GEOLOGY/HYDROGEOLOGY
_____ Maps, figures, cross-sections, and/or description identify soil lithology and characteristics:
Heterogeneity/homogeneity of soils and the lithologic units encountered including: o Depth and lateral continuity of any confining units that may impede contaminant migration o Depth and lateral continuity of any highly transmissive units that may enhance contaminant
migration
Depth of vadose zone, capillary fringe, and phreatic zone including: o Any seasonal water table fluctuations o Groundwater flow direction o Presence of any perched groundwater o Note where the water table intersects the well screen interval or the presence of a submerged
screen
_____ Description and location of distinct strata (soil type and moisture content, e.g., moist, wet, dry) and the depth intervals.
_____ Description and location of all fill or non-native materials.
_____ Depth to groundwater identified on all cross-sections.
_____ General groundwater characteristics provided (e.g., seasonal fluctuation, hydraulic gradient).
5.0 SITE CHARACTERISTICS
_____ Map of the site (to scale) showing all paved areas, surface cover, locations of all structures, and ground cover.
_____ Map identifying all potential sources of vapors.
6.0 REFERENCES Interstate Technology & Regulatory Council. 2007. Vapor Intrusion Pathway: A Practical Guideline, January 2007. Accessed at http://www.itrcweb.org/Documents/VI-1.pdf.

APPENDIX C.3
Checklist for Reviewing Soil Gas Sampling Protocols
and Laboratory Data

Appendix C.3 Page 1 of 2
APPENDIX C.3 Checklist for Reviewing Soil Gas Sampling Protocols and Laboratory Data
Site Name: Site ID: Site Address: County:
1.0 SOIL CONDITIONS
_____ No rain before the sampling event.
Standard practice is to wait for at least 48 hours following a rain event; however, the waiting period should be dependent upon soil type, amount of rain, and previous soil moisture content (e.g., longer for clays, longer for heavy rains, shorter for coarse sands, etc.).
Information should be provided showing justification of actual time elapsed between rain and sampling events.
May not be necessary if collected within a structure.
2.0 SOIL GAS SAMPLE COLLECTION
_____ Points purged before sampling.
Gas volume contained in the sampling point and apparatus identified.
Maximum of three volumes was purged from entire sampling system.
Purging rate is less than 200 milliliters per minute (ml/min).
_____ Samples were collected in a manner that ensures no ambient air infiltration has occurred.
Probe is properly constructed and sealed.
Sample collected at less than 200 ml/min.
Points installed at least five feet below ground surface for deep soil gas samples.
Tracer gas or other similar quality assurance/quality control protocols utilized.
_____ Peristaltic pumps were not utilized for sample collection.
_____ Sampling point is documented as being in good condition.
_____ Disposable parts were not reused or parts were adequately decontaminated between samples.
_____ Flow controllers and sampling apparatus were not reused.
The information included in this checklist may be useful for reviewing soil gas data collected outside of a building during the course of an investigation. It is important to understand that data are collected for a variety of purposes and the use of this checklist is only intended for evaluating the use of the data for compliance purposes. A blank is provided before each item to aid in documenting the individual components and where they can be found.

Appendix C.3 Page 2 of 2
3.0 SOIL GAS SAMPLE ANALYSIS
_____ Samples analyzed by TO-15.
Lab sheets indicate TO-15.
Holding time met.
Tedlar sampling bags are not utilized.
Samples not shipped on ice and stored at ambient air temperature.
Chain of Custody review does not identify any issues of concern. OR
_____ Information supplied to evaluate analytical methodology utilized. Alternative methods will need to seek approval.
4.0 ADDITIONAL VERIFICATION OF FIELD METHODS UTILIZED
_____ Copies of the field notes are provided.
_____ Sampling results make sense to the field conditions and concentrations previously identified in soil and groundwater.
_____ Sampling containers were verified as being certified clean from the laboratory.
_____ Utilized industry standard protocols to verify sample was obtained at the screened interval.
_____ Excessive vacuum is not encountered.

APPENDIX C.4
Checklist for Reviewing Sub-Slab Sampling Protocols
and Laboratory Data

Appendix C.4 Page 1 of 2
APPENDIX C.4 Checklist for Reviewing Sub-Slab Sampling Protocols and Laboratory Data
Site Name: Site ID: Site Address: County:
1.0 SUB-SLAB SOIL GAS SAMPLE COLLECTION
_____ Points purged before sampling.
Gas volume contained in the sampling point and apparatus identified.
Maximum of three volumes was purged from entire sampling system.
Purging rate is less than 200 milliliters per minute (ml/min).
_____ Samples were collected in a manner that ensures no ambient air infiltration has occurred.
Probe is properly constructed and sealed.
Sample collected at less than 200 ml/min.
Points installed at least five feet below ground surface for deep soil gas samples.
Tracer gas or other similar quality assurance/quality control protocols utilized.
_____ Vacuum pumps were not utilized in the purging or in the sample collection.
_____ Small sample volumes collected.
_____ Disposable parts were not reused or parts were adequately decontaminated between samples.
_____ Flow controllers and sample trains were not reused unless they were adequately decontaminated between samples.
2.0 SUB-SLAB SOIL GAS SAMPLE ANALYSIS
_____ Samples analyzed by TO-15.
Lab sheets indicate TO-15.
Holding time met.
Samples not shipped on ice and stored at ambient air temperature.
Chain of Custody review does not identify any issues of concern. OR
_____ Information supplied to evaluate analytical methodology utilized. Alternative methods will need to seek approval.
The information included in this checklist may be useful for reviewing sub-slab soil gas data collected during the course of an investigation. It is important to understand that data are collected for a variety of purposes and the use of this checklist is only intended for evaluating the use of the data for compliance purposes. A blank is provided before each item to aid in documenting the individual components and where they can be found.

Appendix C.4 Page 2 of 2
3.0 ADDITIONAL VERIFICATION OF FIELD METHODS UTILIZED _____ Copies of the field notes.
_____ Sampling results make sense to the field conditions and concentrations previously identified.
_____ Sampling containers were verified as being certified clean from the laboratory and contain a statement from the laboratory.
_____ Utilized industry standard protocols to verify sample was obtained at the screened interval.
_____ Thickness and condition of flooring is documented.

APPENDIX C.5
Checklist for Reviewing the
Design of an Active Mitigation System


Appendix C.5 Page 1 of 5
APPENDIX C.5 Checklist for Reviewing the Design of an Active Mitigation System
Site Name: Site ID: Site Address: County:
1.0 DEFINITIONS
Backdrafting: A condition where the normal movement of combustion products up a flue (due to the buoyancy of the hot flue gases) is reversed, so that the combustion products enter the building (see pressure-induced spillage).
Depressurization: A negative pressure induced in one area relative to another.
Diagnostic tests: Procedures used to identify or characterize conditions under, beside, and within buildings that may contribute to radon entry or elevated radon levels or that may provide information regarding the performance of a mitigation system.
Manifold piping: Piping that collects the flow of soil gas from two or more suction points and delivers that collected soil gas to the vent stack piping. In the case of a single suction point system, there is no manifold piping since the suction point piping connects directly to the vent stack piping. The manifold piping starts where it connects to the suction point piping and ends where it connects to the vent stack piping.
Mitigation system: Any system or steps designed to reduce concentrations of a contaminant in the indoor air of a building that originates the in subsurface.
Natural draft combustion appliance: Any fuel burning appliance that relies on a natural convective flow to exhaust combustion products through flues to outside air.
Pressure-field extension: The distance that a pressure change, created by drawing soil gas through a suction point, extends outward in a sub-slab gas permeable layer, under a membrane, behind a solid wall, or in a hollow wall (see communication test).
Pressure-field extension test: A diagnostic test to evaluate the potential effectiveness of a sub-slab depressurization system by applying a vacuum beneath the slab and measuring, either with a micromanometer or with a heatless smoke device, the extension of the vacuum field.
Pressure-induced spillage: The unintended flow of combustion gases from an appliance/venting system into a dwelling, primarily as a result of building depressurization (see backdrafting).
The information included in this checklist may be useful for reviewing the design of an active mitigation system. Though it is generally understood that the actual design of the system may vary, many of the design components should be very similar in purpose. The information in this checklist is based on American Society for Testing and Materials (ASTM Standard E2121, 2009). A blank is provided before each item to aid in documenting the individual components and where they can be found.

Appendix C.5 Page 2 of 5
2.0 GENERAL
_____ Report identifies that the design does not interfere with the normal venting functions for appliances and backdrafting will not occur.
_____ Pressure field extension test (e.g., diagnostic communication test) has been performed.
For buildings over 10,000 square feet multiple tests throughout the building are completed.
_____ Detailed specifications are provided on products utilized including fan, piping, and caulk.
_____ System is designed by a professional engineer with demonstrated experience designing mitigation systems.
_____ Building/Fire Codes: Document states mitigation systems shall be designed and installed to conform to applicable building and fire codes and maintain the function and operation of all existing equipment and building features including doors, windows, access panels, etc.
_____ Discharge Calculations: Estimated calculations for discharge pursuant to Part 55, Air Pollution Control, of the Natural Resources and Environmental Protection Act, 1994 PA 451, as amended (NREPA) and the associated Administrative Rules. Single-family homes are exempt.
3.0 SYSTEM SEALING REQUIREMENTS
Openings that could lessen the effectiveness of the mitigation system are sealed using methods and materials that are permanent and durable.
Cracks and joints: _____ Openings and cracks where the slab meets the foundation wall have been addressed.
_____ Concrete slab (flooring) above the active mitigation system is free of cracks or cracks have been adequately sealed.
_____ For joints greater than 1⁄2 inch (13 millimeters) in width, a foam backer rod or other comparable filler material should be inserted into the joint before the application of the sealant.
Penetrations: _____ Openings around the suction point piping penetrations of the slab have been adequately
addressed.
_____ Vaults, sumps, other large openings, and utility access points in the foundation walls and/or floor slab are sealed using measures that still allow future access.
4.0 SYSTEM MONITORS AND LABELING
_____ Mitigation systems contain mechanisms to monitor performance (airflow or pressure).
_____ Mechanism is simple to read and interpret and is located where it is easily seen or heard.
_____ System provides a visual and/or audible indication of system degradation and failure.
Monitor has reliable power source:
_____ If powered by house current, it shall be installed on a non-switched circuit and be designed to reset automatically after a power failure. Battery backup for the monitoring system in the event of power failure is recommended.
OR _____ If the monitor is battery powered, it shall be equipped with a low-battery power warning feature.
_____ Mechanical system monitors, such as manometer type pressure gauges are clearly marked to indicate the initial pressure readings.
_____ System labels are placed on the mitigation system, the electric service entrance panel, and other prominent locations including the exterior venting locations.

Appendix C.5 Page 3 of 5
_____ The circuit breaker(s) controlling the circuits on which the mitigation system and system failure warning devices operate are labeled using the word “Vapor Mitigation.” For example, “Vapor Intrusion (VI) System” or if multiple circuits “VI System” and “VI Monitor” as appropriate. No other rooms or appliances should be on the same circuit.
_____ Description of signage and locations are provided.
Contain language indicating the mitigation vent that may contain volatile organic compounds.
Figure identifying locations of all signs.
Each roof exhaust point.
Piping run (each individual exhaust line). o Vertical one per floor. o Horizontal one per 25 feet.
_____ For tenants that will be occupying the structure, a notice has been prepared and provided for review.
5.0 PIPING
_____ All pipe joints and connections, both interior and exterior, are permanently sealed.
_____ System piping installed in the interior or on the exterior of a building should be insulated where condensation may occur inside the pipe; and then freeze or block the soil gas exhaust.
_____ Suction point pipes are supported and secured in a permanent manner that prevents their downward movement to the bottom of suction pits, sump pits, or into the soil.
_____ Horizontal piping runs in the mitigation system are sloped to ensure condensation drains downward into the ground beneath the slab.
_____ All vent stack piping is identified as solid, rigid pipe.
_____ For structures less than 2,500 square feet.
Exhaust piping not less than three inches (75 millimeters) inside diameter (ID).
Vent stack piping’s ID shall be at least as large as used in the manifold piping.
Manifold piping’s ID shall be as large as used in any suction point.
Manifold piping to which two or more suction points are connected shall be at least four inches. (100 millimeters) ID.
If smaller IDs are proposed, appropriate documentation showing design calculations has been submitted.
OR _____ For structures greater than 2,500 square feet.
Pipe sizes are identified and justified by field diagnostic measurements and estimated static pressure, air velocity, and rate of airflow measurements.
Piping sizes are justified using the methodologies found in “Industrial Ventilation: A Manual of Standard Practice, 23rd Edition,” or its equivalent.

Appendix C.5 Page 4 of 5
6.0 PIPING COMPLETION SPECIFICATIONS
_____ Pipes are completed with a rain cap or wind turbine.
_____ To reduce the risk of vent stack blockage, confirm that the discharge from vent stack pipes are:
Vertical and upward, outside the structure, at least ten feet (three meters) above the ground level, above the edge of the roof, and shall also meet the separation requirements below. Whenever practicable, they shall be above the highest roof of the building and above the highest ridge.
Twenty feet (six meters) or more away from any window, door, or other opening into conditioned or otherwise occupiable spaces of the structure, if the discharge point is not at least three feet (one meter) above the top of such openings.
Twenty feet (six meters) or more away from any opening, vent, or occupiable spaces of any building (including adjacent structures). Chimney flues shall be considered openings into conditioned or otherwise occupiable space.
For vent stack pipes that penetrate the roof, the point of discharge shall be at least 12 inches (0.3 meters) above the surface of the roof. For vent stack pipes attached to or penetrating the sides of buildings, the point of discharge shall be vertical and a minimum of 12 inches (0.3 meters) above the edge of the roof and in such a position that it can neither be covered with snow or other materials nor be filled with water from the roof or an overflowing gutter.
When a horizontal run of vent stack pipe penetrates the gable end walls, the piping outside the structure shall be routed to a vertical position so that the discharge point meets the requirements described above.
Points of discharge that are not in a direct line of sight from openings into conditioned or otherwise occupiable space because of intervening objects such as dormers, chimneys, windows around the corner, etc., shall meet the separation requirements as stated above.
7.0 FAN INSTALLATION REQUIREMENTS
_____ Fan sizing calculations are provided that estimate the pressure difference and airflow characteristics under which the system will operate.
Schematics identify: _____ Fan(s) are to be installed either outside the building or inside the building, outside of occupiable space, and
above the conditioned (heated/cooled) spaces of a building.
_____ Fan(s) that are mounted on the exterior of buildings are rated for exterior use or installed within a weather proof protective housing.
_____ Fan(s) are to be connected to the vent pipe using removable couplings or flexible connections that can be tightly secured to both the fan and the vent pipe (facilitate maintenance and future replacement).
_____ Outside air intake vents of fan(s) are screened to prevent the intake of debris. Screens shall be removable to permit cleaning or replacement and building owners shall be informed of the need to periodically replace or clean such screens.

Appendix C.5 Page 5 of 5
8.0 ADDITIONAL REQUIREMENTS IN THE DESIGN DOCUMENT
_____ Contractor identifies steps to document the effectiveness of the mitigation system. This is typically demonstrated by measuring the pressure differential across the building slab while the VI mitigation system is operating.
_____ Concentrations in the subsurface have been evaluated for the duration and frequency which the system can be out-of-service (including power outages) prior to implementing actions necessary to address the potential risk to the occupants.
_____ Actions are identified to address conditions during periods the system is not operating.
_____ Establish and identify a negative pressure that will be continuously maintained.
Typically requires higher negative pressure than a radon mitigation system.
Establish a monitoring program.
_____ Establish a monitoring program for Permit or Permit to Install Exemption pursuant to the Part 55 Rules.
9.0 REFERENCES ASTM Standard E2121. 2009. Standard Practice for Installing Radon Mitigation Systems in Existing Low-Rise Residential Buildings.

APPENDIX C.6 Checklist for Reviewing the Design of a
Passive Mitigation System

Appendix C.6 Page 1 of 4
APPENDIX C.6 Checklist for Reviewing the Design of a Passive Mitigation System
Site Name: Site ID: Site Address: County:
1.0 GENERAL
_____ Engineer or design firm is identified and mitigation system is designed by a professional engineer with demonstrated experience designing passive mitigation systems.
_____ Product manufacturer is provided.
_____ Requirements for installation are provided and if required by the manufacturer, the certification for the product applicator.
_____ General site conditions including a conceptual site model are provided.
_____ Concentrations identified at the site are provided including sampling methodology.
_____ All utility and other penetrations are identified on a print.
_____ Surface preparation is identified and includes:
If applied onto an existing concrete surface it shall be free of any dirt, debris, loose material, release agents, or curing compounds.
Voids more than 1/4 inch deep and 1/4 inch wide are filled.
If applied directly on the sub-grade, the sub-grade shall be compacted to a minimum relative compaction of 90 percent or as specified by a civil/geotechnical engineer and the surface prep shall be smooth, uniform, and free of debris and standing water.
_____ Building/Fire Codes: Document states mitigation systems shall be designed and installed to conform to applicable building and fire codes and maintain the function and operation of all existing equipment and building features including doors, windows, access panels, etc.
_____ Drains that perforate the liner must be equipped with a dranjer style drain or dripline to a trap that allows water to flow into sumps and floor drains while sealing out soil gases from the sub-floor area or alternate method is provided.
The information included in this checklist may be useful for reviewing a passive mitigation system. Though it is generally understood that the actual design of the system may vary, many of the design components should be very similar in purpose. A blank is provided before each item to aid in documenting the individual components and where they can be found.

Appendix C.6 Page 2 of 4
2.0 LINER DESIGN AND SPECIFICATIONS
_____ Detailed specifications of the liner are provided including transmission rates and/or diffusion coefficients for compounds of interest.
_____ Concentrations in the subsurface have been evaluated for the liner including the required thickness applied and/or overall selection of the product by the engineer or design firm.
_____ Details are provided for areas that require specialized completion including all penetrations and terminations.
_____ Horizontal venting or perforated piping has a minimum in-plane flow rate of 21 gallons per minute per foot per unit width at a hydraulic gradient of 1.0 percent when tested in accordance with the American Society for Testing and Materials D 4716. Greater flow rates may justify greater spacing.
_____ Dewatering has been considered and incorporated into the design.
_____ Horizontal venting (or perforated piping) runs are identified at a maximum rate of one per every 50 feet perpendicular to the length of the run for the expected coverage. Calculations may provide justification for different spacing.
3.0 SYSTEM MONITORS AND LABELING
_____ System labels are placed on the mitigation system and other prominent locations including the exterior venting locations.
_____ Description of signage and locations are provided.
Contain language indicating the mitigation vent that may contain volatile organic compounds.
Figure identifying locations of all signs.
Each roof exhaust point.
Piping run (each individual exhaust line). o Vertical one per floor. o Horizontal one per 25 feet.
_____ For tenants that will be occupying the structure, a notice has or will be prepared.
4.0 PIPING
_____ When crossing pipe or pipe sleeves over or under footings or grade beams, document identifies it has been evaluated by an environmental engineer and/or structural engineer for appropriate use and placement materials.
_____ Preliminary piping and routing diagrams including manifolds are provided.
_____ Preliminary horizontal vent locations are identified on a print by the professional engineer.
_____ All pipe joints and connections, both interior and exterior, are permanently sealed.
_____ All exhaust pipes are supported and secured in a permanent manner.
_____ Horizontal piping runs in the mitigation system are sloped or designed to ensure condensation drains downward into the ground beneath the slab.
_____ All vent stack piping is identified as solid, rigid pipe.
____ Justification of number and location of vent riser locations either based on Table A.6.1 or alternate method
provided.

Appendix C.6 Page 3 of 4
Table A.6.1 Spacing of Perforated Horizontal Piping
and Number of Vent Risers
Vent Riser Pipe Diameter (inches)
Number of Vent Risers per Building Footprint Area
(Square Feet)
1 1/2 1/1,250 (min of 2 risers)
2 1/2,500 (min of 2 risers)
2 1/2 1/5,000 (min of 3 risers)
3 1/7,500 (min of 4 risers)
4 1/10,000 (min of 4 risers)
Notes: 1) Riser length shall be a maximum of 100 foot measure along solid pipe including bends. 2) Vent risers maximum spacing shall be 100 feet between each. 3) When the application of the spacing and location requirement of this table results in the fractional number of vent risers, any fraction shall be construed as one
vent riser. 4) Number of required vent risers shall be determined by the selected riser pipe diameter and the rate of vent riser per building footprint area.
_____ Vertical piping runs terminate in a location that can drain naturally or that can be verified to be free of water or moisture.
_____ For structures less than 2,500 square feet vertical piping is at least:
Not less than three inches (75 millimeters) inside diameter (ID).
Vent stack piping’s ID shall be at least as large as the largest used in the manifold piping.
Manifold piping’s ID shall be at least as large as that used in any suction point.
Manifold piping to which two or more suction points are connected shall be at least four inches (100 millimeters) ID.
If smaller IDs are proposed, appropriate documentation showing design calculations has been submitted.
OR _____ For structures greater than 2,500 square feet piping is:
Identified and justified by measurements and estimated static pressure, air velocity, and rate of airflow measurements, and head loss calculations based on preliminary exhaust piping design prints.
Documented using the methodologies found in “Industrial Ventilation: A Manual of Standard Practice, 23rd Edition,” or its equivalent.

Appendix C.6 Page 4 of 4
5.0 PIPING COMPLETION SPECIFICATIONS (minimums, further distance may be required by exhaust concentrations and primary wind flow direction)
_____ Pipes are completed with a rain cap or wind turbine.
_____ To reduce the risk of vent stack blockage, confirm that the discharge from vent stack pipes are:
Vertical and upward, outside the structure, at least ten feet (three meters) above the ground level, above the edge of the roof, and shall also meet the separation requirements below. Whenever practicable, they shall be above the highest roof of the building and above the highest ridge.
Twenty feet (six meters) or more away from any window, door, or other opening into conditioned or otherwise occupiable spaces of the structure, if the discharge point is not at least three feet (one meter) above the top of such openings.
Twenty feet (six meters) or more away from any opening, vent, or occupiable spaces of any building including adjacent structures. Chimney flues shall be considered openings into conditioned or otherwise occupiable space.
For vent stack pipes that penetrate the roof, the point of discharge shall be at least 12 inches (0.3 meters) above the surface of the roof. For vent stack pipes attached to or penetrating the sides of buildings, the point of discharge shall be vertical and a minimum of 12 inches (0.3 meters) above the edge of the roof and in such a position that it can neither be covered with snow or other materials nor be filled with water from the roof or an overflowing gutter.
When a horizontal run of vent stack pipe penetrates the gable end walls, the piping outside the structure shall be routed to a vertical position so that the discharge point meets the requirements described above.
Points of discharge that are not in a direct line of sight from openings into conditioned or otherwise occupiable space because of intervening objects such as dormers, chimneys, windows around the corner, etc., shall meet the separation requirements as stated above.
6.0 QUALITY ASSURANCE/QUALITY CONTROL INSTALLATION PLAN REQUIREMENTS IDENTIFIED IN THE DESIGN DOCUMENT
_____ Contractor identifies steps to document the effectiveness of the mitigation system.
Coupon sampling – recommended at one sample per 500 square feet.
Smoke testing – full coverage is necessary and must be based on the area that it can be confirmed that smoke has migrated to through visual observation.
On-site installation oversight by the design firm.
Documentation verifying the installation per project specification and that any areas noted for repair have been completed.
Estimated quantities of the product to be utilized are provided.

Appendix D – Vapor Intrusion Screening Values Table of Contents
Screening Values for the Vapor Intrusion Pathway
Sampling Location Appropriate Vapor Intrusion Screening
Value (SVvi) Immediate Response Activity
Screening Levels (IRASLs)
Soil sample Soil concentration that identified a source of
vapors (Svi) - - - - -
Air within the interior space of a building derived from VI sources
Acceptable indoor air value for VI (IAvi) Indoor air values for consideration of an
acute exposure for VI (AIAvi)
Soil gas collected from the subsurface
Soil gas concentrations for VI (SGvi) Soil gas concentrations for consideration
of an acute exposure for VI (ASGvi)
Sub-slab soil gas from beneath a building slab
Soil gas concentrations collecting less than five feet bgs or lowest point of a structure
(SGvi-SS) ASGvi – see description above
Groundwater in contact with a structure
Groundwater concentrations when water is in contact or entering a structure for VI
(GWvi-sump)
Groundwater concentrations for consideration of an acute exposure when water is in contact or entering a structure
for VI (AGWvi-sump)
Groundwater beneath, but not in direct contact with a structure
Groundwater concentrations for VI (GWvi) Groundwater concentrations for
consideration of an acute exposure for VI (AGWvi)
APPENDIX D.1 – Residential Vapor Intrusion Screening Values (SVvi) APPENDIX D.2 – Nonresidential Vapor Intrusion Screening Values (SVvi) APPENDIX D.3 – Acute Exposure Immediate Response Activity Screening Levels (IRASLs)

APPENDIX D.1
Residential Vapor Intrusion Screening Values (SVvi)

2012 Collaborative Stakeholder InitiativeDraft Indoor Air, Soil Gas, Groundwater, Soil, and Sump Screening Values for the Vapor Intrusion Pathway
RESIDENTIAL LAND USE
Remediation Division
(ug/m3) (ppbv)(b) (ug/m3) (ppbv)(b) (ug/m3) (ppbv)(b)
Acenaphthene 83329 2.2E+02 3.3E+1 1.1E+4 1.6E+3 1.1E+5 1.6E+4 5.5E+04 6.48E+04 5.5E+01 Acenaphthylene 208968 3.7E+01 5.6E+0 1.8E+3 2.8E+2 1.8E+4 2.8E+3 1.5E+04 2.52E+04 1.5E+01 Acetaldehyde 75070 9.4E+00 4.9E+0 4.7E+2 2.5E+2 4.7E+3 2.5E+3 6.5E+03 2.50E+03 t 1.0E+02 tAcetone 67641 6.2E+03 2.5E+3 3.1E+5 1.2E+5 3.1E+6 1.2E+6 8.2E+06 4.67E+04 8.2E+03 Acetonitrile 75058 6.3E+01 3.5E+1 3.1E+3 1.8E+3 3.1E+4 1.8E+4 8.4E+04 2.50E+03 t 8.4E+01 Acetophenone 98862 5.1E+02 9.9E+1 2.6E+4 4.9E+3 2.6E+5 4.9E+4 2.3E+06 5.46E+04 2.3E+03 Acrolein 107028 2.1E-02 8.6E-3 1.0E+0 4.3E-1 1.0E+1 4.3E+0 2.0E+01 t 2.50E+02 t 2.0E+01 tAcrylonitrile 107131 4.0E-01 1.7E-1 2.0E+1 8.7E+0 2.0E+2 8.7E+1 1.3E+02 1.00E+02 t 2.0E+00 tAldrin 309002 5.5E-03 3.5E-4 2.8E-1 1.8E-2 2.8E+0 1.8E-1 5.8E+00 8.59E+01 1.0E-02 tAmmonia 7664417 1.0E+02 1.4E+2 5.2E+3 7.1E+3 5.2E+4 7.1E+4 3.0E+05 ID 3.0E+02 t-Amyl methyl ether (TAME) 994058 6.5E+01 1.5E+1 3.2E+3 7.4E+2 3.2E+4 7.4E+3 2.3E+03 2.50E+02 t 5.0E+00 tAnthracene 120127 1.0E+03 1.4E+2 5.2E+4 6.8E+3 5.2E+5 6.8E+4 8.7E+05 5.34E+06 8.7E+02 Azobenzene 103333 8.7E-01 1.1E-1 4.4E+1 5.6E+0 4.4E+2 5.6E+1 3.0E+03 1.82E+03 3.0E+00 Benzene 71432 3.3E+00 9.7E-1 1.6E+2 4.9E+1 1.6E+3 4.9E+2 2.7E+01 5.00E+01 t 5.0E+00 dBenzo(a)anthracene 56553 ID ID ID ID ID ID ID ID ID Benzyl chloride 100447 5.5E-01 1.0E-1 2.8E+1 5.1E+0 2.8E+2 5.1E+1 6.2E+01 1.50E+02 t 5.0E+00 tbis(2-Chloroethyl)ether 111444 8.2E-02 1.3E-2 4.1E+0 6.7E-1 4.1E+1 6.7E+0 2.2E+02 1.00E+02 t 1.0E+00 tBromobenzene 108861 8.3E+00 1.2E+0 4.2E+2 6.2E+1 4.2E+3 6.2E+2 1.6E+02 1.00E+02 t 1.0E+00 tBromodichloromethane 75274 1.5E+00 2.1E-1 7.5E+1 1.1E+1 7.5E+2 1.1E+2 8.0E+01 d 1.00E+02 t 8.0E+01 dBromoform 75252 2.5E+01 2.3E+0 1.2E+3 1.1E+2 1.2E+4 1.1E+3 2.1E+03 1.00E+02 t 8.0E+01 dBromomethane 74839 5.2E+00 1.3E+0 2.6E+2 6.4E+1 2.6E+3 6.4E+2 3.3E+01 2.00E+02 t 5.0E+00 t2-Butanone (MEK) 78933 5.2E+03 1.7E+3 2.6E+5 8.4E+4 2.6E+6 8.4E+5 4.3E+06 2.71E+04 4.3E+03 n-Butyl acetate 123864 7.4E+03 1.5E+3 3.7E+5 7.4E+4 3.7E+6 7.4E+5 1.2E+06 1.30E+04 1.2E+03 n-Butylbenzene 104518 3.1E+01 5.4E+0 1.6E+3 2.7E+2 1.6E+4 2.7E+3 9.1E+01 6.75E+01 1.0E+00 tsec-Butylbenzene 135988 6.3E+00 1.1E+0 3.1E+2 5.4E+1 3.1E+3 5.4E+2 1.6E+01 5.00E+01 t 1.0E+00 ttert-Butylbenzene 98066 1.0E+01 1.8E+0 5.2E+2 9.0E+1 5.2E+3 9.0E+2 3.7E+01 5.00E+01 t 1.0E+00 tCamphene 79925 8.3E+01 1.4E+1 4.2E+3 7.1E+2 4.2E+4 7.1E+3 2.4E+01 ID 2.4E-02 Carbon disulfide 75150 7.3E+02 2.2E+2 3.7E+4 1.1E+4 3.7E+5 1.1E+5 2.4E+03 2.50E+02 t 5.0E+00 tCarbon tetrachloride 56235 4.5E+00 6.8E-1 2.3E+2 3.4E+1 2.3E+3 3.4E+2 7.6E+00 5.00E+01 t 5.0E+00 dChlordane 57749 2.7E-01 1.5E-2 1.4E+1 7.7E-1 1.4E+2 7.7E+0 2.6E+02 4.69E+03 2.0E+00 dChlorobenzene 108907 7.3E+01 1.5E+1 3.7E+3 7.5E+2 3.7E+4 7.5E+3 1.1E+03 5.23E+01 1.0E+02 d1-chloro-1,1-difluoroethane 75683 5.2E+04 1.2E+4 2.6E+6 6.0E+5 2.6E+7 6.0E+6 4.1E+04 ID 4.1E+01
(ug/kg)
Soil Matrix Vapor Intrusion Concentration(t)
Soil Gas Concentrations for Vapor Intrusion(a)
Sub-Slab Soil Gas Concentrations for Vapor Intrusion Collected Less
Than 5 feet bgs or building foundation(a)
GWVI-res SVI-res
Groundwater Concentration
for Vapor Intrusion(d,t)
(ug/L)
IAVI-res SGVI-SS-res SGVI-res
Acceptable Indoor Air Value for Vapor Intrusion(a)
GWVI-SUMP-res
(ug/L)
Groundwater Sump Concentration for Vapor Intrusion(d,t) Hazardous Substance
Chemical Abstract Service Number
Draft Vapor Intrusion Screening Values - SUBJECT TO CHANGEFor Internal Use OnlyDo Not Distribute Prepared by Dept. of Environmental Quality 5/8/2012 Page 1

2012 Collaborative Stakeholder InitiativeDraft Indoor Air, Soil Gas, Groundwater, Soil, and Sump Screening Values for the Vapor Intrusion Pathway
RESIDENTIAL LAND USE
Remediation Division
(ug/m3) (ppbv)(b) (ug/m3) (ppbv)(b) (ug/m3) (ppbv)(b) (ug/kg)
Soil Matrix Vapor Intrusion Concentration(t)
Soil Gas Concentrations for Vapor Intrusion(a)
Sub-Slab Soil Gas Concentrations for Vapor Intrusion Collected Less
Than 5 feet bgs or building foundation(a)
GWVI-res SVI-res
Groundwater Concentration
for Vapor Intrusion(d,t)
(ug/L)
IAVI-res SGVI-SS-res SGVI-res
Acceptable Indoor Air Value for Vapor Intrusion(a)
GWVI-SUMP-res
(ug/L)
Groundwater Sump Concentration for Vapor Intrusion(d,t) Hazardous Substance
Chemical Abstract Service Number
Chloroethane 75003 1.0E+04 3.8E+3 5.2E+5 1.9E+5 5.2E+6 1.9E+6 4.4E+04 6.00E+02 4.4E+01 2-Chloroethyl vinyl ether 110758 ID ID ID ID ID ID ID ID ID Chloroform 67663 1.1E+01 2.2E+0 5.6E+2 1.1E+2 5.6E+3 1.1E+3 1.4E+02 5.00E+01 t 8.0E+01 dChloromethane 74873 4.2E+01 2.0E+1 2.1E+3 9.8E+2 2.1E+4 9.8E+3 2.2E+02 2.50E+02 t 5.0E+00 tbeta-Chloronaphthalene 91587 ID ID ID ID ID ID ID ID ID 2-Chlorophenol 95578 1.9E+01 3.4E+0 9.4E+2 1.7E+2 9.4E+3 1.7E+3 7.8E+04 9.69E+03 7.8E+01 o-Chlorotoluene 95498 7.3E+01 1.3E+1 3.7E+3 6.7E+2 3.7E+4 6.7E+3 9.5E+02 1.15E+02 5.0E+00 tCyclohexane 110827 6.3E+03 1.7E+3 3.1E+5 8.6E+4 3.1E+6 8.6E+5 1.9E+03 5.00E+02 t 1.0E+01 t4-4'-DDE 72559 2.8E-01 1.3E-2 1.4E+1 6.3E-1 1.4E+2 6.3E+0 3.1E+02 6.18E+03 3.1E-01 Dibenzofuran 132649 1.0E-01 1.4E-2 5.2E+0 7.2E-1 5.2E+1 7.2E+0 2.3E+01 3.30E+02 t 4.0E+00 tDibromochloromethane 124481 1.1E+00 1.2E-1 5.5E+1 6.2E+0 5.5E+2 6.2E+1 8.0E+01 d 1.00E+02 t 8.0E+01 dDibromochloropropane 96128 2.1E-01 2.1E-2 1.0E+1 1.0E+0 1.0E+2 1.0E+1 6.6E+01 1.00E+01 t 2.0E-01 t,dDibromomethane 74953 ID ID ID ID ID ID ID ID ID 1,2-Dichlorobenzene 95501 3.1E+02 4.9E+1 1.6E+4 2.5E+3 1.6E+5 2.5E+4 7.6E+03 8.65E+02 6.0E+02 d1,3-Dichlorobenzene 541731 3.1E+00 4.9E-1 1.6E+2 2.5E+1 1.6E+3 2.5E+2 5.5E+01 1.00E+02 t 1.0E+00 t1,4-Dichlorobenzene 106467 3.9E+00 6.2E-1 2.0E+2 3.1E+1 2.0E+3 3.1E+2 7.6E+01 1.00E+02 t 7.5E+01 dDichlorodifluoromethane 75718 5.2E+04 9.9E+3 2.6E+6 5.0E+5 2.6E+7 5.0E+6 7.0E+03 6.09E+02 7.0E+00 1,1-Dichloroethane 75343 5.2E+02 1.2E+2 2.6E+4 6.1E+3 2.6E+5 6.1E+4 4.3E+03 6.55E+01 4.3E+00 1,2-Dichloroethane 107062 1.0E+00 2.4E-1 5.2E+1 1.2E+1 5.2E+2 1.2E+2 4.1E+01 5.00E+01 t 5.0E+00 d1,1-Dichloroethylene 75354 2.1E+02 5.0E+1 1.0E+4 2.5E+3 1.0E+5 2.5E+4 3.7E+02 5.00E+01 t 7.0E+00 dcis-1,2-Dichloroethylene 156592 3.5E+01 8.5E+0 1.8E+3 4.2E+2 1.8E+4 4.2E+3 4.0E+02 5.00E+01 t 7.0E+01 dtrans-1,2-Dichloroethylene 156605 7.3E+01 1.7E+1 3.7E+3 8.7E+2 3.7E+4 8.7E+3 3.6E+02 5.00E+01 t 1.0E+02 d1,2-Dichloropropane 78875 4.2E+00 8.6E-1 2.1E+2 4.3E+1 2.1E+3 4.3E+2 6.9E+01 5.00E+01 t 5.0E+00 d1,3-Dichloropropene 542756 6.8E+00 1.4E+0 3.4E+2 7.1E+1 3.4E+3 7.1E+2 8.9E+01 1.00E+02 t 1.0E+00 tDieldrin 60571 5.9E-03 3.6E-4 2.9E-1 1.8E-2 2.9E+0 1.8E-1 2.7E+01 9.87E+01 2.7E-02 Diethyl ether 60297 1.3E+04 3.9E+3 6.3E+5 2.0E+5 6.3E+6 2.0E+6 4.7E+05 3.86E+03 4.7E+02 Diisopropyl ether 108203 3.7E+02 8.5E+1 1.9E+4 4.2E+3 1.9E+5 4.2E+4 6.8E+03 2.50E+02 t 6.8E+00 Diisopropylamine 108189 2.1E+02 4.8E+1 1.0E+4 2.4E+3 1.0E+5 2.4E+4 1.0E+05 ID 1.0E+02 N,N-Dimethylaniline 121697 2.3E+00 4.4E-1 1.1E+2 2.2E+1 1.1E+3 2.2E+2 1.9E+03 ID 1.9E+00 Endosulfan 115297 ID ID ID ID ID ID ID ID ID Epichlorohydrin 106898 1.0E+00 2.6E-1 5.2E+1 1.3E+1 5.2E+2 1.3E+2 1.6E+03 1.00E+02 t 5.0E+00 tEthyl acetate 141786 3.3E+03 8.8E+2 1.7E+5 4.4E+4 1.7E+6 4.4E+5 1.2E+06 ID 1.2E+03
Draft Vapor Intrusion Screening Values - SUBJECT TO CHANGEFor Internal Use OnlyDo Not Distribute Prepared by Dept. of Environmental Quality 5/8/2012 Page 2

2012 Collaborative Stakeholder InitiativeDraft Indoor Air, Soil Gas, Groundwater, Soil, and Sump Screening Values for the Vapor Intrusion Pathway
RESIDENTIAL LAND USE
Remediation Division
(ug/m3) (ppbv)(b) (ug/m3) (ppbv)(b) (ug/m3) (ppbv)(b) (ug/kg)
Soil Matrix Vapor Intrusion Concentration(t)
Soil Gas Concentrations for Vapor Intrusion(a)
Sub-Slab Soil Gas Concentrations for Vapor Intrusion Collected Less
Than 5 feet bgs or building foundation(a)
GWVI-res SVI-res
Groundwater Concentration
for Vapor Intrusion(d,t)
(ug/L)
IAVI-res SGVI-SS-res SGVI-res
Acceptable Indoor Air Value for Vapor Intrusion(a)
GWVI-SUMP-res
(ug/L)
Groundwater Sump Concentration for Vapor Intrusion(d,t) Hazardous Substance
Chemical Abstract Service Number
Ethyl tertiary butyl ether (ETBE) 637923 3.9E+02 8.8E+1 1.9E+4 4.4E+3 1.9E+5 4.4E+4 1.1E+04 2.50E+02 t 1.1E+01 Ethylbenzene 100414 8.7E+01 1.9E+1 4.4E+3 9.6E+2 4.4E+4 9.6E+3 7.0E+02 d 5.00E+01 t 7.0E+02 dEthylene dibromide 106934 4.5E-02 5.6E-3 2.3E+0 2.8E-1 2.3E+1 2.8E+0 3.2E+00 2.00E+01 t 5.0E-02 t,dFluorene 86737 1.5E+02 2.0E+1 7.3E+3 1.0E+3 7.3E+4 1.0E+4 7.1E+04 1.06E+05 7.1E+01 Heptachlor 76448 2.1E-02 1.3E-3 1.0E+0 6.5E-2 1.0E+1 6.5E-1 3.3E+00 2.38E+01 4.0E-01 dHeptachlor epoxide 1024573 1.0E-02 6.2E-4 5.2E-1 3.1E-2 5.2E+0 3.1E-1 2.3E+01 7.28E+01 2.0E-01 dn-Heptane 142825 3.7E+03 8.5E+2 1.8E+5 4.2E+4 1.8E+6 4.2E+5 8.5E+01 ID 8.5E-02 Hexabromobenzene 87821 ID ID ID ID ID ID ID ID ID Hexachlorobenzene (C-66) 118741 5.9E-02 4.8E-3 2.9E+0 2.4E-1 2.9E+1 2.4E+0 1.6E+00 3.30E+02 t 1.0E+00 dHexachlorobutadiene (C-46) 87683 1.2E+00 1.1E-1 6.2E+1 5.5E+0 6.2E+2 5.5E+1 5.6E+00 5.00E+01 t 5.0E-02 tHexachlorocyclopentadiene (C-56) 77474 2.1E-01 1.8E-2 1.0E+1 8.9E-1 1.0E+2 8.9E+0 5.0E+01 d 3.30E+02 t 5.0E+01 dHexachloroethane 67721 3.7E+00 3.6E-1 1.8E+2 1.8E+1 1.8E+3 1.8E+2 4.4E+01 3.00E+02 t 5.0E+00 tn-Hexane 110543 2.1E+02 5.6E+1 1.0E+4 2.8E+3 1.0E+5 2.8E+4 5.4E+00 ID 5.4E-03 2-Hexanone 591786 4.2E+01 9.7E+0 2.1E+3 4.8E+2 2.1E+4 4.8E+3 2.1E+04 2.50E+03 t 5.0E+01 tIsopropyl benzene 98828 2.6E+00 4.9E-1 1.3E+2 2.5E+1 1.3E+3 2.5E+2 1.0E+01 2.50E+02 t 5.0E+00 tMethane 74828 ID ID ID ID ID ID ID ID ID 4-Methyl-2-pentanone (MIBK) 108101 3.1E+03 7.3E+2 1.6E+5 3.6E+4 1.6E+6 3.6E+5 1.1E+06 9.28E+03 1.1E+03 Methyl-tert-butyl ether (MTBE) 1634044 3.1E+03 8.2E+2 1.6E+5 4.1E+4 1.6E+6 4.1E+5 2.5E+05 2.13E+03 2.5E+02 Methylcyclopentane 96377 ID ID ID ID ID ID ID ID ID Methylene chloride 75092 5.8E+01 2.7E+1 2.9E+3 1.3E+3 2.9E+4 1.3E+4 8.2E+02 1.00E+02 t 5.0E+00 t,d2-Methylnaphthalene 91576 1.0E+01 1.7E+0 5.2E+2 8.5E+1 5.2E+3 8.5E+2 9.4E+02 1.12E+03 5.0E+00 tMirex 2385855 ID ID ID ID ID ID ID ID ID Naphthalene 91203 2.3E+00 4.1E-1 1.1E+2 2.0E+1 1.1E+3 2.0E+2 2.4E+02 3.30E+02 t 5.0E+00 tNitrobenzene 98953 6.8E-01 1.3E-1 3.4E+1 6.4E+0 3.4E+2 6.4E+1 1.3E+03 3.30E+02 t 3.0E+00 t2-Nitrophenol 88755 ID ID ID ID ID ID ID ID ID Oxo-hexyl acetate 88230357 3.2E+01 5.2E+0 1.6E+3 2.6E+2 1.6E+4 2.6E+3 2.8E+03 ID 2.8E+00 Pentachlorobenzene 608935 ID ID ID ID ID ID ID ID ID Pentachloronitrobenzene 82688 5.2E+00 4.1E-1 2.6E+2 2.1E+1 2.6E+3 2.1E+2 5.5E+03 1.57E+04 2.0E+01 tPentane 109660 1.9E+04 6.0E+3 9.4E+5 3.0E+5 9.4E+6 3.0E+6 7.0E+02 5.00E+03 t 1.0E+02 t2-Pentene 109682 ID ID ID ID ID ID ID ID ID Phenanthrene 85018 1.0E-01 1.4E-2 5.2E+0 6.8E-1 5.2E+1 6.8E+0 1.1E+02 7.70E+02 2.0E+00 tPolychlorinated biphenyls (PCBs) 1336363 4.5E-02 3.9E-3 2.3E+0 2.0E-1 2.3E+1 2.0E+0 7.4E+00 3.30E+02 t 5.0E-01 d
Draft Vapor Intrusion Screening Values - SUBJECT TO CHANGEFor Internal Use OnlyDo Not Distribute Prepared by Dept. of Environmental Quality 5/8/2012 Page 3

2012 Collaborative Stakeholder InitiativeDraft Indoor Air, Soil Gas, Groundwater, Soil, and Sump Screening Values for the Vapor Intrusion Pathway
RESIDENTIAL LAND USE
Remediation Division
(ug/m3) (ppbv)(b) (ug/m3) (ppbv)(b) (ug/m3) (ppbv)(b) (ug/kg)
Soil Matrix Vapor Intrusion Concentration(t)
Soil Gas Concentrations for Vapor Intrusion(a)
Sub-Slab Soil Gas Concentrations for Vapor Intrusion Collected Less
Than 5 feet bgs or building foundation(a)
GWVI-res SVI-res
Groundwater Concentration
for Vapor Intrusion(d,t)
(ug/L)
IAVI-res SGVI-SS-res SGVI-res
Acceptable Indoor Air Value for Vapor Intrusion(a)
GWVI-SUMP-res
(ug/L)
Groundwater Sump Concentration for Vapor Intrusion(d,t) Hazardous Substance
Chemical Abstract Service Number
n-Propylbenzene 103651 2.1E+01 4.0E+0 1.0E+3 2.0E+2 1.0E+4 2.0E+3 9.2E+01 1.00E+02 t 1.0E+00 tPyrene 129000 1.0E+02 1.2E+1 5.2E+3 6.0E+2 5.2E+4 6.0E+3 4.1E+05 9.70E+06 4.1E+02 Pyridine 110861 3.7E+00 1.1E+0 1.8E+2 5.4E+1 1.8E+3 5.4E+2 1.5E+04 3.30E+02 t 2.0E+01 tStyrene 100425 4.8E+01 1.1E+1 2.4E+3 5.3E+2 2.4E+4 5.3E+3 8.0E+02 2.24E+02 1.0E+02 d1,2,4,5-Tetrachlorobenzene 95943 1.0E+00 1.1E-1 5.2E+1 5.6E+0 5.2E+2 5.6E+1 4.8E+01 3.30E+02 t 2.0E+00 t2,3,7,8-Tetrachlorodibenzo-p-dioxin 1746016 6.2E-07 4.4E-8 3.1E-5 2.2E-6 3.1E-4 2.2E-5 5.7E-04 5.43E-01 3.0E-05 d1,1,1,2-Tetrachloroethane 630206 3.7E+00 5.1E-1 1.8E+2 2.5E+1 1.8E+3 2.5E+2 6.9E+01 1.00E+02 t 1.0E+00 t1,1,2,2-Tetrachloroethane 79345 4.7E-01 6.5E-2 2.3E+1 3.2E+0 2.3E+2 3.2E+1 5.9E+01 5.00E+01 t 1.0E+00 tTetrachloroethylene 127184 2.6E+01 3.6E+0 1.3E+3 1.8E+2 1.3E+4 1.8E+3 6.7E+01 5.00E+01 t 5.0E+00 dTetrahydrofuran 109999 1.4E+01 4.4E+0 6.8E+2 2.2E+2 6.8E+3 2.2E+3 8.9E+03 1.00E+03 t 9.0E+01 tTetranitromethane 509148 1.8E-03 2.1E-4 9.0E-2 1.1E-2 9.0E-1 1.1E-1 1.0E+02 t 5.00E+02 t 1.0E+02 tToluene 108883 5.2E+03 1.3E+3 2.6E+5 6.6E+4 2.6E+6 6.6E+5 3.6E+04 1.51E+03 1.0E+03 dTriallate 2303175 ID ID ID ID ID ID ID ID ID Tributylamine 102829 7.3E+00 9.1E-1 3.7E+2 4.6E+1 3.7E+3 4.6E+2 2.1E+03 ID 2.1E+00 1,2,3-Trichlorobenzene 87616 2.8E+01 3.6E+0 1.4E+3 1.8E+2 1.4E+4 1.8E+3 1.0E+03 6.77E+02 5.0E+00 t1,2,4-Trichlorobenzene 120821 3.9E+02 4.9E+1 1.9E+4 2.5E+3 1.9E+5 2.5E+4 1.3E+04 4.84E+03 7.0E+01 d1,1,1-Trichloroethane 71556 1.0E+03 1.8E+2 5.2E+4 9.1E+3 5.2E+5 9.1E+4 2.8E+03 9.91E+01 2.0E+02 d1,1,2-Trichloroethane 79005 1.7E+00 3.0E-1 8.5E+1 1.5E+1 8.5E+2 1.5E+2 9.6E+01 5.00E+01 t 5.0E+00 dTrichloroethylene(e) 79016 2.1E+00 3.7E-1 1.0E+2 1.8E+1 1.0E+3 1.8E+2 9.8E+00 5.00E+01 t 5.0E+00 dTrichlorofluoromethane 75694 5.9E+04 9.9E+3 2.9E+6 5.0E+5 2.9E+7 5.0E+6 2.8E+04 1.06E+03 2.8E+01 1,2,3-Trichloropropane 96184 ID ID ID ID ID ID ID ID ID 1,1,2-Trichloro-1,2,2-trifluoroethane 76131 8.0E+04 9.9E+3 4.0E+6 5.0E+5 4.0E+7 5.0E+6 7.1E+03 1.20E+03 7.1E+00 Trifluralin 1582098 ID ID ID ID ID ID ID ID ID 2,2,4-Trimethyl pentane 540841 3.7E+03 7.4E+2 1.8E+5 3.7E+4 1.8E+6 3.7E+5 5.6E+01 2.50E+03 t 5.0E+01 t2,4,4-Trimethyl-2-pentene 107404 ID ID ID ID ID ID ID ID ID 1,2,3-Trimethylbenznene 526738 2.3E+02 4.4E+1 1.1E+4 2.2E+3 1.1E+5 2.2E+4 2.4E+03 4.77E+02 5.0E+00 t1,2,4-Trimethylbenzene 95636 2.3E+02 4.4E+1 1.1E+4 2.2E+3 1.1E+5 2.2E+4 1.7E+03 3.30E+02 1.7E+00 1,3,5-Trimethylbenzene 108678 2.3E+02 4.4E+1 1.1E+4 2.2E+3 1.1E+5 2.2E+4 1.2E+03 2.49E+02 1.2E+00 tris(2,3-Dibromopropyl)phosphate 126727 5.1E-02 1.7E-3 2.6E+0 8.5E-2 2.6E+1 8.5E-1 1.1E+02 3.30E+02 t 1.0E+01 tVinyl acetate 108054 2.1E+02 5.6E+1 1.0E+4 2.8E+3 1.0E+5 2.8E+4 1.9E+04 5.00E+03 t 1.0E+02 tVinyl chloride(f) 75014 1.1E+00 4.0E-1 5.4E+1 2.0E+1 5.4E+2 2.0E+2 2.0E+00 d 4.00E+01 t 2.0E+00 d
Draft Vapor Intrusion Screening Values - SUBJECT TO CHANGEFor Internal Use OnlyDo Not Distribute Prepared by Dept. of Environmental Quality 5/8/2012 Page 4

2012 Collaborative Stakeholder InitiativeDraft Indoor Air, Soil Gas, Groundwater, Soil, and Sump Screening Values for the Vapor Intrusion Pathway
RESIDENTIAL LAND USE
Remediation Division
(ug/m3) (ppbv)(b) (ug/m3) (ppbv)(b) (ug/m3) (ppbv)(b) (ug/kg)
Soil Matrix Vapor Intrusion Concentration(t)
Soil Gas Concentrations for Vapor Intrusion(a)
Sub-Slab Soil Gas Concentrations for Vapor Intrusion Collected Less
Than 5 feet bgs or building foundation(a)
GWVI-res SVI-res
Groundwater Concentration
for Vapor Intrusion(d,t)
(ug/L)
IAVI-res SGVI-SS-res SGVI-res
Acceptable Indoor Air Value for Vapor Intrusion(a)
GWVI-SUMP-res
(ug/L)
Groundwater Sump Concentration for Vapor Intrusion(d,t) Hazardous Substance
Chemical Abstract Service Number
Xylenes 1330207 1.0E+02 2.3E+1 5.2E+3 1.1E+3 5.2E+4 1.1E+4 1.0E+04 d 1.50E+02 t 1.0E+04 d
a) The IAVI and SGVI presented in this table are health-based values. The applicable IAVI and SGVI are based on the higher of the health-based value and the appropriate analytical reporting limit.
b) Conversion from ug/m3 to parts per billion by volume (ppbv) uses this equation: ppbv = ([ug/m3] x (283.15ºK)) / (12.187 x Molecular Weight(g/mol))
d) If the calculated criterion is below State of Michigan Safe Drinking Water Standard established pursuant to Section 5 of 1976 PA 399, MCL 325.1005, the criterion defaults to the Safe Drinking Water Standard.
e) TCE IURs for different scenarios as follows: Residential mutagenic = 1.0E-06; Residential cancer = 3.1E-06; Nonresidential cancer = 4.1E-06 (see EPA VISL calculator)
f) "IAVIres cancer" for vinyl chloride is based on EPA recommendation to apply an uncertainty factor of 2 (i.e., multiply IURF by 2) to quantify risk from continuous exposure during childhood. The final "IAVIres" is based on updated EPA methodology specifically for vinyl chloride to address mutagenicity. The algorithm is found in the Regional Screening Level User's Guide at http://www.epa.gov/reg3hwmd/risk/human/rb-concentration_table/usersguide.htm.
t) If the calculated criterion is below the analytical target detection limit (TDL), the criterion defaults to the target detection limit.
"NLV" means a hazardous substance is "Not Likely to Volatilize". This designation is given to any hazardous substance with a Henry’s Law Constant of less than 1.0 x 10 -5 atm-m3/mol. However, any hazardous substance detected above a TDL in the vapor phase in soil gas or indoor air shall be considered a VOC. A hazardous substance may not be excluded from consideration as a VOC if detection limits exceed the TDL in the vapor phase.
"ID" means "Insufficient Data" to develop a criterion at the date of publication of these tables.
Draft Vapor Intrusion Screening Values - SUBJECT TO CHANGEFor Internal Use OnlyDo Not Distribute Prepared by Dept. of Environmental Quality 5/8/2012 Page 5

APPENDIX D.2
Nonresidential Vapor Intrusion Screening Values (SVvi)

2012 Collaborative Stakeholder InitiativeDraft Indoor Air, Soil Gas, Groundwater, Soil, and Sump Screening Values for the Vapor Intrusion Pathway
NON-RESIDENTIAL LAND USE
Remediation Division
(ug/m3) (ppbv)(b) (ug/m3) (ppbv)(b) (ug/m3) (ppbv)(b)
Acenaphthene 83329 9.2E+02 1.4E+2 4.6E+4 6.9E+3 4.6E+5 6.9E+4 2.3E+05 2.72E+05 2.3E+02 Acenaphthylene 208968 1.5E+02 2.3E+1 7.7E+3 1.2E+3 7.7E+4 1.2E+4 6.2E+04 1.06E+05 6.2E+01 Acetaldehyde 75070 3.9E+01 2.1E+1 2.0E+3 1.0E+3 2.0E+4 1.0E+4 2.7E+04 2.50E+03 t 1.0E+02 tAcetone 67641 2.6E+04 1.0E+4 1.3E+6 5.2E+5 1.3E+7 5.2E+6 3.4E+07 1.96E+05 3.4E+04 Acetonitrile 75058 2.6E+02 1.5E+2 1.3E+4 7.4E+3 1.3E+5 7.4E+4 3.5E+05 2.50E+03 t 3.5E+02 Acetophenone 98862 2.1E+03 4.1E+2 1.1E+5 2.1E+4 1.1E+6 2.1E+5 9.6E+06 2.30E+05 9.6E+03 Acrolein 107028 8.8E-02 3.6E-2 4.4E+0 1.8E+0 4.4E+1 1.8E+1 3.3E+01 2.50E+02 t 2.0E+01 tAcrylonitrile 107131 1.3E+00 5.9E-1 6.7E+1 2.9E+1 6.7E+2 2.9E+2 4.5E+02 1.00E+02 t 2.0E+00 tAldrin 309002 1.9E-02 1.2E-3 9.3E-1 5.9E-2 9.3E+0 5.9E-1 2.0E+01 2.89E+02 2.0E-02 Ammonia 7664417 4.4E+02 6.0E+2 2.2E+4 3.0E+4 2.2E+5 3.0E+5 1.3E+06 ID 1.3E+03 t-Amyl methyl ether (TAME) 994058 2.7E+02 6.2E+1 1.4E+4 3.1E+3 1.4E+5 3.1E+4 9.6E+03 2.50E+02 t 9.6E+00 Anthracene 120127 4.4E+03 5.7E+2 2.2E+5 2.9E+4 2.2E+6 2.9E+5 3.7E+06 2.24E+07 3.7E+03 Azobenzene 103333 2.9E+00 3.7E-1 1.5E+2 1.9E+1 1.5E+3 1.9E+2 1.0E+04 6.12E+03 1.0E+01 Benzene 71432 1.1E+01 3.3E+0 5.5E+2 1.6E+2 5.5E+3 1.6E+3 9.2E+01 5.00E+01 t 5.0E+00 dBenzo(a)anthracene 56553 ID ID ID ID ID ID ID ID ID Benzyl chloride 100447 1.9E+00 3.4E-1 9.3E+1 1.7E+1 9.3E+2 1.7E+2 2.1E+02 1.50E+02 t 5.0E+00 tbis(2-Chloroethyl)ether 111444 2.8E-01 4.5E-2 1.4E+1 2.2E+0 1.4E+2 2.2E+1 7.5E+02 1.00E+02 t 1.0E+00 tBromobenzene 108861 3.5E+01 5.2E+0 1.8E+3 2.6E+2 1.8E+4 2.6E+3 6.6E+02 1.00E+02 t 1.0E+00 tBromodichloromethane 75274 5.1E+00 7.2E-1 2.5E+2 3.6E+1 2.5E+3 3.6E+2 1.1E+02 1.00E+02 t 8.0E+01 dBromoform 75252 8.3E+01 7.6E+0 4.1E+3 3.8E+2 4.1E+4 3.8E+3 7.2E+03 2.85E+02 8.0E+01 dBromomethane 74839 2.2E+01 5.4E+0 1.1E+3 2.7E+2 1.1E+4 2.7E+3 1.4E+02 2.00E+02 t 5.0E+00 t2-Butanone (MEK) 78933 2.2E+04 7.1E+3 1.1E+6 3.5E+5 1.1E+7 3.5E+6 1.8E+07 1.14E+05 1.8E+04 n-Butyl acetate 123864 3.1E+04 6.2E+3 1.6E+6 3.1E+5 1.6E+7 3.1E+6 5.1E+06 5.46E+04 5.1E+03 n-Butylbenzene 104518 1.3E+02 2.3E+1 6.6E+3 1.1E+3 6.6E+4 1.1E+4 3.8E+02 2.84E+02 1.0E+00 tsec-Butylbenzene 135988 2.6E+01 4.5E+0 1.3E+3 2.3E+2 1.3E+4 2.3E+3 6.8E+01 5.00E+01 t 1.0E+00 ttert-Butylbenzene 98066 4.4E+01 7.6E+0 2.2E+3 3.8E+2 2.2E+4 3.8E+3 1.6E+02 5.00E+01 t 1.0E+00 tCamphene 79925 3.5E+02 6.0E+1 1.8E+4 3.0E+3 1.8E+5 3.0E+4 1.0E+02 ID 1.0E-01 Carbon disulfide 75150 3.1E+03 9.4E+2 1.5E+5 4.7E+4 1.5E+6 4.7E+5 9.9E+03 2.50E+02 t 9.9E+00 Carbon tetrachloride 56235 1.5E+01 2.3E+0 7.6E+2 1.1E+2 7.6E+3 1.1E+3 2.6E+01 5.00E+01 t 5.0E+00 dChlordane 57749 9.1E-01 5.2E-2 4.6E+1 2.6E+0 4.6E+2 2.6E+1 8.7E+02 1.58E+04 2.0E+00 dChlorobenzene 108907 3.1E+02 6.3E+1 1.5E+4 3.2E+3 1.5E+5 3.2E+4 4.6E+03 2.20E+02 1.0E+02 d1-chloro-1,1-difluoroethane 75683 2.2E+05 5.1E+4 1.1E+7 2.5E+6 1.1E+8 2.5E+7 1.7E+05 ID 1.7E+02
GWVI-SUMP-nr
(ug/L)
Groundwater Sump Concentration for Vapor Intrusion(d,t) Hazardous Substance
Chemical Abstract Service Number
IAVI-nr SGVI-SS-nr
Acceptable Indoor Air Value for Vapor Intrusion(a)
Groundwater Concentration for
Vapor Intrusion(d,t)
Soil Matrix Vapor Intrusion
Concentration(t)
Soil Gas Concentrations for Vapor Intrusion(a)
Sub-Slab Soil Gas Concentrations for Vapor Intrusion Collected Less
Than 5 feet bgs or building foundation(a)
SVI-nrGWVI-nrSGVI-nr
(ug/kg) (ug/L)
Draft Vapor Intrusion Screening Values - SUBJECT TO CHANGEFor Internal Use OnlyDo Not Distribute Prepared by Dept. of Environmental Quality 5/8/2012 Page 1

2012 Collaborative Stakeholder InitiativeDraft Indoor Air, Soil Gas, Groundwater, Soil, and Sump Screening Values for the Vapor Intrusion Pathway
NON-RESIDENTIAL LAND USE
Remediation Division
(ug/m3) (ppbv)(b) (ug/m3) (ppbv)(b) (ug/m3) (ppbv)(b)
GWVI-SUMP-nr
(ug/L)
Groundwater Sump Concentration for Vapor Intrusion(d,t) Hazardous Substance
Chemical Abstract Service Number
IAVI-nr SGVI-SS-nr
Acceptable Indoor Air Value for Vapor Intrusion(a)
Groundwater Concentration for
Vapor Intrusion(d,t)
Soil Matrix Vapor Intrusion
Concentration(t)
Soil Gas Concentrations for Vapor Intrusion(a)
Sub-Slab Soil Gas Concentrations for Vapor Intrusion Collected Less
Than 5 feet bgs or building foundation(a)
SVI-nrGWVI-nrSGVI-nr
(ug/kg) (ug/L) Chloroethane 75003 4.4E+04 1.6E+4 2.2E+6 7.9E+5 2.2E+7 7.9E+6 1.8E+05 2.52E+03 1.8E+02 2-Chloroethyl vinyl ether 110758 ID ID ID ID ID ID ID ID ID Chloroform 67663 3.8E+01 7.4E+0 1.9E+3 3.7E+2 1.9E+4 3.7E+3 4.8E+02 5.00E+01 t 8.0E+01 dChloromethane 74873 1.4E+02 6.6E+1 7.1E+3 3.3E+3 7.1E+4 3.3E+4 7.5E+02 2.50E+02 t 5.0E+00 tbeta-Chloronaphthalene 91587 ID ID ID ID ID ID ID ID ID 2-Chlorophenol 95578 7.9E+01 1.4E+1 3.9E+3 7.1E+2 3.9E+4 7.1E+3 3.3E+05 4.07E+04 3.3E+02 o-Chlorotoluene 95498 3.1E+02 5.6E+1 1.5E+4 2.8E+3 1.5E+5 2.8E+4 4.0E+03 4.81E+02 5.0E+00 tCyclohexane 110827 2.6E+04 7.3E+3 1.3E+6 3.6E+5 1.3E+7 3.6E+6 8.1E+03 6.42E+02 1.0E+01 t4-4'-DDE 72559 9.4E-01 4.2E-2 4.7E+1 2.1E+0 4.7E+2 2.1E+1 1.0E+03 2.08E+04 1.0E+00 Dibenzofuran 132649 4.4E-01 6.0E-2 2.2E+1 3.0E+0 2.2E+2 3.0E+1 9.6E+01 3.30E+02 t 4.0E+00 tDibromochloromethane 124481 3.7E+00 4.1E-1 1.9E+2 2.1E+1 1.9E+3 2.1E+2 2.2E+02 1.00E+02 t 8.0E+01 dDibromochloropropane 96128 8.8E-01 8.6E-2 4.4E+1 4.3E+0 4.4E+2 4.3E+1 2.8E+02 1.00E+01 t 2.8E-01 Dibromomethane 74953 ID ID ID ID ID ID ID ID ID 1,2-Dichlorobenzene 95501 1.3E+03 2.1E+2 6.6E+4 1.0E+4 6.6E+5 1.0E+5 3.2E+04 3.63E+03 6.0E+02 d1,3-Dichlorobenzene 541731 1.3E+01 2.1E+0 6.6E+2 1.0E+2 6.6E+3 1.0E+3 2.3E+02 1.00E+02 t 1.0E+00 t1,4-Dichlorobenzene 106467 1.3E+01 2.1E+0 6.6E+2 1.0E+2 6.6E+3 1.0E+3 2.5E+02 1.00E+02 t 7.5E+01 dDichlorodifluoromethane 75718 2.2E+05 4.2E+4 1.1E+7 2.1E+6 1.1E+8 2.1E+7 2.9E+04 2.56E+03 2.9E+01 1,1-Dichloroethane 75343 2.2E+03 5.1E+2 1.1E+5 2.6E+4 1.1E+6 2.6E+5 1.8E+04 2.75E+02 1.8E+01 1,2-Dichloroethane 107062 3.5E+00 8.2E-1 1.8E+2 4.1E+1 1.8E+3 4.1E+2 1.4E+02 5.00E+01 t 5.0E+00 d1,1-Dichloroethylene 75354 8.8E+02 2.1E+2 4.4E+4 1.0E+4 4.4E+5 1.0E+5 1.6E+03 5.00E+01 t 7.0E+00 dcis-1,2-Dichloroethylene 156592 1.5E+02 3.6E+1 7.4E+3 1.8E+3 7.4E+4 1.8E+4 1.7E+03 5.00E+01 t 7.0E+01 dtrans-1,2-Dichloroethylene 156605 3.1E+02 7.3E+1 1.5E+4 3.7E+3 1.5E+5 3.7E+4 1.5E+03 5.00E+01 t 1.0E+02 d1,2-Dichloropropane 78875 1.8E+01 3.6E+0 8.8E+2 1.8E+2 8.8E+3 1.8E+3 2.9E+02 5.00E+01 t 5.0E+00 d1,3-Dichloropropene 542756 2.3E+01 4.8E+0 1.1E+3 2.4E+2 1.1E+4 2.4E+3 3.0E+02 1.00E+02 t 1.0E+00 tDieldrin 60571 2.0E-02 1.2E-3 9.9E-1 6.0E-2 9.9E+0 6.0E-1 9.2E+01 3.32E+02 9.2E-02 Diethyl ether 60297 5.3E+04 1.6E+4 2.6E+6 8.2E+5 2.6E+7 8.2E+6 2.0E+06 1.62E+04 2.0E+03 Diisopropyl ether 108203 1.6E+03 3.6E+2 7.8E+4 1.8E+4 7.8E+5 1.8E+5 2.8E+04 3.52E+02 2.8E+01 Diisopropylamine 108189 8.8E+02 2.0E+2 4.4E+4 1.0E+4 4.4E+5 1.0E+5 4.2E+05 ID 4.2E+02 N,N-Dimethylaniline 121697 7.7E+00 1.5E+0 3.9E+2 7.4E+1 3.9E+3 7.4E+2 6.3E+03 ID 6.3E+00 Endosulfan 115297 ID ID ID ID ID ID ID ID ID Epichlorohydrin 106898 4.4E+00 1.1E+0 2.2E+2 5.5E+1 2.2E+3 5.5E+2 6.7E+03 1.00E+02 t 6.7E+00 Ethyl acetate 141786 1.4E+04 3.7E+3 7.0E+5 1.8E+5 7.0E+6 1.8E+6 4.9E+06 ID 4.9E+03
Draft Vapor Intrusion Screening Values - SUBJECT TO CHANGEFor Internal Use OnlyDo Not Distribute Prepared by Dept. of Environmental Quality 5/8/2012 Page 2

2012 Collaborative Stakeholder InitiativeDraft Indoor Air, Soil Gas, Groundwater, Soil, and Sump Screening Values for the Vapor Intrusion Pathway
NON-RESIDENTIAL LAND USE
Remediation Division
(ug/m3) (ppbv)(b) (ug/m3) (ppbv)(b) (ug/m3) (ppbv)(b)
GWVI-SUMP-nr
(ug/L)
Groundwater Sump Concentration for Vapor Intrusion(d,t) Hazardous Substance
Chemical Abstract Service Number
IAVI-nr SGVI-SS-nr
Acceptable Indoor Air Value for Vapor Intrusion(a)
Groundwater Concentration for
Vapor Intrusion(d,t)
Soil Matrix Vapor Intrusion
Concentration(t)
Soil Gas Concentrations for Vapor Intrusion(a)
Sub-Slab Soil Gas Concentrations for Vapor Intrusion Collected Less
Than 5 feet bgs or building foundation(a)
SVI-nrGWVI-nrSGVI-nr
(ug/kg) (ug/L) Ethyl tertiary butyl ether (ETBE) 637923 1.6E+03 3.7E+2 8.2E+4 1.9E+4 8.2E+5 1.9E+5 4.6E+04 5.39E+02 4.6E+01 Ethylbenzene 100414 2.9E+02 6.4E+1 1.5E+4 3.2E+3 1.5E+5 3.2E+4 1.7E+03 9.98E+01 7.0E+02 dEthylene dibromide 106934 1.5E-01 1.9E-2 7.6E+0 9.4E-1 7.6E+1 9.4E+0 1.1E+01 2.00E+01 t 5.0E-02 t,dFluorene 86737 6.1E+02 8.6E+1 3.1E+4 4.3E+3 3.1E+5 4.3E+4 3.0E+05 4.47E+05 3.0E+02 Heptachlor 76448 7.0E-02 4.4E-3 3.5E+0 2.2E-1 3.5E+1 2.2E+0 1.1E+01 7.98E+01 4.0E-01 dHeptachlor epoxide 1024573 3.5E-02 2.1E-3 1.8E+0 1.0E-1 1.8E+1 1.0E+0 7.8E+01 2.45E+02 2.0E-01 dn-Heptane 142825 1.5E+04 3.6E+3 7.7E+5 1.8E+5 7.7E+6 1.8E+6 3.6E+02 ID 3.6E-01 Hexabromobenzene 87821 ID ID ID ID ID ID ID ID ID Hexachlorobenzene (C-66) 118741 2.0E-01 1.6E-2 9.9E+0 8.1E-1 9.9E+1 8.1E+0 5.4E+00 3.30E+02 t 1.0E+00 dHexachlorobutadiene (C-46) 87683 4.1E+00 3.7E-1 2.1E+2 1.8E+1 2.1E+3 1.8E+2 1.9E+01 5.00E+01 t 5.0E-02 tHexachlorocyclopentadiene (C-56) 77474 8.8E-01 7.5E-2 4.4E+1 3.7E+0 4.4E+2 3.7E+1 5.0E+01 d 3.30E+02 t 5.0E+01 dHexachloroethane 67721 1.5E+01 1.5E+0 7.7E+2 7.5E+1 7.7E+3 7.5E+2 1.8E+02 3.00E+02 t 5.0E+00 tn-Hexane 110543 8.8E+02 2.4E+2 4.4E+4 1.2E+4 4.4E+5 1.2E+5 2.3E+01 ID 2.3E-02 2-Hexanone 591786 1.8E+02 4.1E+1 8.8E+3 2.0E+3 8.8E+4 2.0E+4 8.7E+04 2.50E+03 t 8.7E+01 Isopropyl benzene 98828 8.7E+00 1.7E+0 4.3E+2 8.3E+1 4.3E+3 8.3E+2 3.5E+01 2.50E+02 t 5.0E+00 tMethane 74828 ID ID ID ID ID ID ID ID ID 4-Methyl-2-pentanone (MIBK) 108101 1.3E+04 3.0E+3 6.6E+5 1.5E+5 6.6E+6 1.5E+6 4.4E+06 3.90E+04 4.4E+03 Methyl-tert-butyl ether (MTBE) 1634044 1.3E+04 3.5E+3 6.6E+5 1.7E+5 6.6E+6 1.7E+6 1.0E+06 8.93E+03 1.0E+03 Methylcyclopentane 96377 ID ID ID ID ID ID ID ID ID Methylene chloride 75092 1.9E+02 8.9E+1 9.7E+3 4.5E+3 9.7E+4 4.5E+4 2.8E+03 1.00E+02 t 5.0E+00 t,d2-Methylnaphthalene 91576 4.4E+01 7.2E+0 2.2E+3 3.6E+2 2.2E+4 3.6E+3 3.9E+03 4.71E+03 5.0E+00 tMirex 2385855 ID ID ID ID ID ID ID ID ID Naphthalene 91203 7.6E+00 1.4E+0 3.8E+2 6.9E+1 3.8E+3 6.9E+2 8.0E+02 3.30E+02 t 5.0E+00 tNitrobenzene 98953 2.3E+00 4.3E-1 1.1E+2 2.1E+1 1.1E+3 2.1E+2 4.4E+03 3.30E+02 t 4.4E+00 2-Nitrophenol 88755 ID ID ID ID ID ID ID ID ID Oxo-hexyl acetate 88230357 1.4E+02 2.2E+1 6.8E+3 1.1E+3 6.8E+4 1.1E+4 1.2E+04 ID 1.2E+01 Pentachlorobenzene 608935 ID ID ID ID ID ID ID ID ID Pentachloronitrobenzene 82688 2.2E+01 1.7E+0 1.1E+3 8.6E+1 1.1E+4 8.6E+2 2.3E+04 6.61E+04 2.3E+01 Pentane 109660 7.9E+04 2.5E+4 3.9E+6 1.3E+6 3.9E+7 1.3E+7 2.9E+03 5.00E+03 t 1.0E+02 t2-Pentene 109682 ID ID ID ID ID ID ID ID ID Phenanthrene 85018 4.4E-01 5.7E-2 2.2E+1 2.9E+0 2.2E+2 2.9E+1 4.8E+02 3.24E+03 2.0E+00 tPolychlorinated biphenyls (PCBs) 1336363 1.5E-01 1.3E-2 7.6E+0 6.6E-1 7.6E+1 6.6E+0 2.5E+01 9.76E+02 5.0E-01 d
Draft Vapor Intrusion Screening Values - SUBJECT TO CHANGEFor Internal Use OnlyDo Not Distribute Prepared by Dept. of Environmental Quality 5/8/2012 Page 3

2012 Collaborative Stakeholder InitiativeDraft Indoor Air, Soil Gas, Groundwater, Soil, and Sump Screening Values for the Vapor Intrusion Pathway
NON-RESIDENTIAL LAND USE
Remediation Division
(ug/m3) (ppbv)(b) (ug/m3) (ppbv)(b) (ug/m3) (ppbv)(b)
GWVI-SUMP-nr
(ug/L)
Groundwater Sump Concentration for Vapor Intrusion(d,t) Hazardous Substance
Chemical Abstract Service Number
IAVI-nr SGVI-SS-nr
Acceptable Indoor Air Value for Vapor Intrusion(a)
Groundwater Concentration for
Vapor Intrusion(d,t)
Soil Matrix Vapor Intrusion
Concentration(t)
Soil Gas Concentrations for Vapor Intrusion(a)
Sub-Slab Soil Gas Concentrations for Vapor Intrusion Collected Less
Than 5 feet bgs or building foundation(a)
SVI-nrGWVI-nrSGVI-nr
(ug/kg) (ug/L) n-Propylbenzene 103651 8.8E+01 1.7E+1 4.4E+3 8.5E+2 4.4E+4 8.5E+3 3.9E+02 1.00E+02 t 1.0E+00 tPyrene 129000 4.4E+02 5.0E+1 2.2E+4 2.5E+3 2.2E+5 2.5E+4 1.7E+06 4.08E+07 1.7E+03 Pyridine 110861 1.5E+01 4.5E+0 7.7E+2 2.3E+2 7.7E+3 2.3E+3 6.5E+04 1.10E+03 6.5E+01 Styrene 100425 1.6E+02 3.6E+1 8.0E+3 1.8E+3 8.0E+4 1.8E+4 2.7E+03 7.54E+02 1.0E+02 d1,2,4,5-Tetrachlorobenzene 95943 4.4E+00 4.7E-1 2.2E+2 2.4E+1 2.2E+3 2.4E+2 2.0E+02 5.21E+02 2.0E+00 t2,3,7,8-Tetrachlorodibenzo-p-dioxin 1746016 2.1E-06 1.5E-7 1.0E-4 7.5E-6 1.0E-3 7.5E-5 1.9E-03 1.82E+00 3.0E-05 d1,1,1,2-Tetrachloroethane 630206 1.2E+01 1.7E+0 6.2E+2 8.5E+1 6.2E+3 8.5E+2 2.3E+02 1.00E+02 t 1.0E+00 t1,1,2,2-Tetrachloroethane 79345 1.6E+00 2.2E-1 7.9E+1 1.1E+1 7.9E+2 1.1E+2 2.0E+02 5.00E+01 t 1.0E+00 tTetrachloroethylene 127184 1.8E+02 2.5E+1 8.8E+3 1.2E+3 8.8E+4 1.2E+4 4.6E+02 5.00E+01 t 5.0E+00 dTetrahydrofuran 109999 4.6E+01 1.5E+1 2.3E+3 7.3E+2 2.3E+4 7.3E+3 3.0E+04 1.00E+03 t 9.0E+01 tTetranitromethane 509148 6.1E-03 7.2E-4 3.0E-1 3.6E-2 3.0E+0 3.6E-1 1.0E+02 t 5.00E+02 t 1.0E+02 tToluene 108883 2.2E+04 5.5E+3 1.1E+6 2.8E+5 1.1E+7 2.8E+6 1.5E+05 6.35E+03 1.0E+03 dTriallate 2303175 ID ID ID ID ID ID ID ID ID Tributylamine 102829 3.1E+01 3.8E+0 1.5E+3 1.9E+2 1.5E+4 1.9E+3 8.9E+03 ID 8.9E+00 1,2,3-Trichlorobenzene 87616 1.2E+02 1.5E+1 5.9E+3 7.6E+2 5.9E+4 7.6E+3 4.4E+03 2.84E+03 5.0E+00 t1,2,4-Trichlorobenzene 120821 1.6E+03 2.1E+2 8.1E+4 1.0E+4 8.1E+5 1.0E+5 5.3E+04 2.03E+04 7.0E+01 d1,1,1-Trichloroethane 71556 4.4E+03 7.6E+2 2.2E+5 3.8E+4 2.2E+6 3.8E+5 1.2E+04 4.16E+02 2.0E+02 d1,1,2-Trichloroethane 79005 5.7E+00 9.9E-1 2.8E+2 5.0E+1 2.8E+3 5.0E+2 3.2E+02 5.00E+01 t 5.0E+00 dTrichloroethylene(e) 79016 8.8E+00 1.5E+0 4.4E+2 7.7E+1 4.4E+3 7.7E+2 4.1E+01 5.00E+01 t 5.0E+00 dTrichlorofluoromethane 75694 2.5E+05 4.2E+4 1.2E+7 2.1E+6 1.2E+8 2.1E+7 1.2E+05 4.44E+03 1.2E+02 1,2,3-Trichloropropane 96184 ID ID ID ID ID ID ID ID ID 1,1,2-Trichloro-1,2,2-trifluoroethane 76131 3.4E+05 4.2E+4 1.7E+7 2.1E+6 1.7E+8 2.1E+7 3.0E+04 5.04E+03 3.0E+01 Trifluralin 1582098 ID ID ID ID ID ID ID ID ID 2,2,4-Trimethyl pentane 540841 1.5E+04 3.1E+3 7.7E+5 1.6E+5 7.7E+6 1.6E+6 2.3E+02 2.50E+03 t 5.0E+01 t2,4,4-Trimethyl-2-pentene 107404 ID ID ID ID ID ID ID ID ID 1,2,3-Trimethylbenznene 526738 9.6E+02 1.9E+2 4.8E+4 9.3E+3 4.8E+5 9.3E+4 1.0E+04 2.00E+03 1.0E+01 1,2,4-Trimethylbenzene 95636 9.6E+02 1.9E+2 4.8E+4 9.3E+3 4.8E+5 9.3E+4 7.3E+03 1.39E+03 7.3E+00 1,3,5-Trimethylbenzene 108678 9.6E+02 1.9E+2 4.8E+4 9.3E+3 4.8E+5 9.3E+4 5.1E+03 1.05E+03 5.1E+00 tris(2,3-Dibromopropyl)phosphate 126727 1.7E-01 5.7E-3 8.6E+0 2.9E-1 8.6E+1 2.9E+0 3.7E+02 1.07E+03 1.0E+01 tVinyl acetate 108054 8.8E+02 2.4E+2 4.4E+4 1.2E+4 4.4E+5 1.2E+5 8.0E+04 5.00E+03 t 1.0E+02 tVinyl chloride(f) 75014 2.1E+01 7.7E+0 1.0E+3 3.8E+2 1.0E+4 3.8E+3 3.5E+01 4.00E+01 t 2.0E+00 d
Draft Vapor Intrusion Screening Values - SUBJECT TO CHANGEFor Internal Use OnlyDo Not Distribute Prepared by Dept. of Environmental Quality 5/8/2012 Page 4

2012 Collaborative Stakeholder InitiativeDraft Indoor Air, Soil Gas, Groundwater, Soil, and Sump Screening Values for the Vapor Intrusion Pathway
NON-RESIDENTIAL LAND USE
Remediation Division
(ug/m3) (ppbv)(b) (ug/m3) (ppbv)(b) (ug/m3) (ppbv)(b)
GWVI-SUMP-nr
(ug/L)
Groundwater Sump Concentration for Vapor Intrusion(d,t) Hazardous Substance
Chemical Abstract Service Number
IAVI-nr SGVI-SS-nr
Acceptable Indoor Air Value for Vapor Intrusion(a)
Groundwater Concentration for
Vapor Intrusion(d,t)
Soil Matrix Vapor Intrusion
Concentration(t)
Soil Gas Concentrations for Vapor Intrusion(a)
Sub-Slab Soil Gas Concentrations for Vapor Intrusion Collected Less
Than 5 feet bgs or building foundation(a)
SVI-nrGWVI-nrSGVI-nr
(ug/kg) (ug/L) Xylenes 1330207 4.4E+02 9.6E+1 2.2E+4 4.8E+3 2.2E+5 4.8E+4 1.0E+04 d 1.83E+02 1.0E+04 d
"ID" means "Insufficient Data" to develop a criterion at the date of publication of these tables.
t) If the calculated criterion is below the analytical target detection limit (TDL), the criterion defaults to the target detection limit.
d) If the calculated criterion is below State of Michigan Safe Drinking Water Standard established pursuant to Section 5 of 1976 PA 399, MCL 325.1005, the criterion defaults to the Safe Drinking Water Standard.
e) TCE IURs for different scenarios as follows: Residential mutagenic = 1.0E-06; Residential cancer = 3.1E-06; Nonresidential cancer = 4.1E-06 (see EPA VISL calculator)
"NLV" means a hazardous substance is "Not Likely to Volatilize". This designation is given to any hazardous substance with a Henry’s Law Constant of less than 1.0 x 10 -
5 atm-m3/mol. However, any hazardous substance detected above a TDL in the vapor phase in soil gas or indoor air shall be considered a VOC. A hazardous substance may not be excluded from consideration as a VOC if detection limits exceed the TDL in the vapor phase.
f) "IAVIres cancer" for vinyl chloride is based on EPA recommendation to apply an uncertainty factor of 2 (i.e., multiply IURF by 2) to quantify risk from continuous exposure during childhood. The final "IAVIres" is based on updated EPA methodology specifically for vinyl chloride to address mutagenicity. The algorithm is found in the Regional Screening Level User's Guide at http://www.epa.gov/reg3hwmd/risk/human/rb-concentration_table/usersguide.htm.
a) The IAVI and SGVI presented in this table are health-based values. The applicable IAVI and SGVI are based on the higher of the health-based value and the appropriate analytical reporting limit.
b) Conversion from ug/m3 to parts per billion by volume (ppbv) uses this equation: ppbv = ([ug/m3] x (283.15ºK)) / (12.187 x Molecular Weight(g/mol))
Draft Vapor Intrusion Screening Values - SUBJECT TO CHANGEFor Internal Use OnlyDo Not Distribute Prepared by Dept. of Environmental Quality 5/8/2012 Page 5

APPENDIX D.3 Acute Exposure Immediate Response
Activity Screening Levels (IRASLs)
(Currently Under Development)

APPENDIX E Soil Gas Compounds Screening List

Appendix E Page 1 of 2
APPENDIX E – Soil Gas Compounds Screening List Below is a list of the compounds that must be analyzed for in evaluating the potential for vapor intrusion. This list must be modified to include site contaminants that are not identified. In addition, each TO-15 analysis is to include the reporting of the top five Tentatively Identified Compounds greater than five parts per billion by volume (ppbv) (reported as micrograms per cubic meters (μg/m3])) that are not attributed to column breakdown, as compared to response of the nearest internal standard.
COMPOUND CAS No. Acetone 67-64-1 Benzene 71-43-2 Benzyl chloride 100-44-7 Bromodichloromethane 75-27-4 Bromoform 75-25-2 Bromomethane (Methyl Bromide) 74-83-9 1,3-Butadiene 106-99-0 2-Butanone (Methyl ethyl ketone, MEK) 78-93-3 Carbon disulfide 75-15-0 Carbon tetrachloride 56-23-5 Chlorobenzene 108-90-7 Chloroethane (Ethyl chloride) 75-00-3 Chloroform 67-66-3 Chloromethane (Methyl chloride) 74-87-3 Cyclohexane 110-82-7 Dibromochloromethane 124-48-1 1,2-Dibromoethane (Ethylene dibromide) 106-93-4 1,2-Dichlorobenzene 95-50-1 1,3-Dichlorobenzene 541-73-1 1,4-Dichlorobenzene 106-46-7 1,1-Dichloroethane 75-34-3 1,2-Dichloroethane 107-06-2 1,1-Dichloroethene (DCE) 75-35-4 cis-1,2-Dichloroethene 156-59-2 trans-1,2-Dichloroethene 156-60-5 Dichlorodifluoromethane (Freon 12) 75-71-8 1,2-Dichloropropane 78-87-5 cis-1,3-Dichloropropene 10061-01-5 trans-1,3-Dichloropropene 10061-02-6 Dichlorotetrafluoroethane (Freon 114) 76-14-2 Ethanol 64-17-5 Ethyl acetate 141-78-6 Ethylbenzene 100-41-4 4-Ethyltoluene 622-96-8 n-Heptane 142-82-5 Hexachloro-1,3-butadiene 87-68-3 n-Hexane 110-54-3 4-Methyl-2-pentanone (Methyl isobutyl ketone) 108-10-1 Methylene Chloride (Dichloromethane) 75-09-2 Methyl-tert-butyl ether (MTBE) 1634-04-4 Naphthalene 91-20-3 2-Propanol (isopropyl alcohol) 67-63-0

Appendix E Page 2 of 2
Propylene (Propene) 115-07-1 Styrene 100-42-5 1,1,2,2-Tetrachloroethane 79-34-5 Tetrachloroethylene (PCE) 127-18-4 Tetrahydrofuran 109-99-9 Toluene (Methylbenzene) 108-88-3 1,2,4-Trichlorobenzene 120-82-1 1,1,1-Trichloroethane (Methyl chloroform) 71-55-6 1,1,2-Trichloroethane 79-00-5 Trichloroethylene (TCE) 79-01-6 Trichlorofluoromethane (Freon 11) 75-69-4 1,1,2-Trichlorotrifluoroethane (Freon-113) 76-13-1 1,2,4-Trimethylbenzene 95-63-6 1,3,5-Trimethylbenzene 108-67-8 Vinyl chloride 75-01-4 m&p-Xylene 108-38-3 o-Xylene 95-47-6

Appendix F – MDEQ’s Standard Operating Procedures Table of Contents APPENDIX F.1 – Installation of a Soil Gas Probe/Vapor Monitoring Point to Support Vapor Intrusion Investigations APPENDIX F.2 – Installation of a Sub-Slab Soil Gas Probe/Vapor Monitoring Point to Support Vapor Intrusion Investigations APPENDIX F.3 – Sampling Utilizing USEPA Method TO-15 via Bottle-Vac® to Support Vapor Intrusion
Investigations APPENDIX F.4 – Indoor Air Sampling via USEPA TO-15 APPENDIX F.5 – Dynamic Flux Chamber Method for Monitoring Soil Surface Emission Rates APPENDIX F.6 – Vapor Point Naming Convention APPENDIX F.7 – Installation of a Vapor Pin™ to Support Vapor Intrusion Investigations

APPENDIX F.1 Installation of a Soil Gas Probe/Vapor
Monitoring Point to Support Vapor Intrusion
Investigations


Remediation Division Standard Operating Procedure
Date: April 30, 2012
Installation of a Soil Gas Probe/Vapor Monitoring Point
Page 2 of 7
PLEASE NOTE: This SOP was developed based on a compilation of available information, knowledge, field experience, and general industry practices to provide guidance to the Michigan Department of Environmental Quality (MDEQ) staff and their contractors conducting investigations and remedial activities at sites with known or potential vapor intrusion issues. The SOP was created to promote a consistent, informed, and practical approach for the MDEQ staff to follow that achieves the performance standards required by Part 201, Environmental Remediation, of the Natural Resources and Environmental Protection Act, 1994 PA 451, as amended (NREPA), and Part 213, Leaking Underground Storage Tanks, of the NREPA. The methods outlined in this document will produce reliable data that can support the various decisions required throughout the environmental process. This SOP is available as a technical reference that may be informative when conducting work at sites where vapor intrusion issues are of concern and may be used as a reference for those conducting vapor intrusion evaluations under Part 201 or Part 213. This SOP is not intended to prohibit those conducting evaluations from using means other than those specified herein to measure soil gas concentrations; however, departures from this guidance will often need to include information for a more detailed review. The MDEQ is not responsible for the misuse or misinterpretation of the information presented herein. Please note that because the SOP was written for the MDEQ staff, it may contain references to specific equipment for field investigations that the MDEQ currently uses. Such references do not represent endorsements of particular vendors.

Remediation Division Standard Operating Procedure
Date: April 30, 2012
Installation of a Soil Gas Probe/Vapor Monitoring Point
Page 3 of 7
1.0 SCOPE AND APPLICATION This SOP describes the MDEQ’s procedure for installing a Soil Gas Probe/Vapor Monitoring Point. Soil gas samples collected less than five feet below ground surface must be referenced as shallow soil gas samples. Though these samples may provide beneficial information to support various lines of evidence, the effects due to barometric pressure, temperature, and the potential breakthrough of ambient air from the surface have the potential to cause these samples to be less reliable than soil gas samples collected at depths greater than five feet below the surface. This SOP does not cover, nor is it intended to provide, a justification or rationale for where a sampling point is installed. It is assumed by using this SOP that site conditions have been fully evaluated and that the sampling location and depth meet the objectives outlined in the work plan or scope of work. For example, considerations must be given to the types of chemicals of concern, lithology encountered, surrounding buildings and underground structures, and the depth of the vapor source. Samples collected deeper than any potential source of vapors may not fully characterize the potential risk and sampling points should never be installed or collected within the zone of saturation.
2.0 SAMPLING POINT INSTALLATION Prior to selecting sample locations, an underground utility search is required. Miss Dig and, if necessary, the local utility companies must be contacted and requested to mark the locations of their underground lines. Each sample location should also be screened in the field with a metal detector or magnetometer to verify that no underground utilities or structures exist.
2.1 Boring Advancement There are many methods to advance a boring intended to install a soil gas sampling point. It is highly recommended that the methodology utilized have the following characteristics:
Nominal in diameter (less than three inches is recommended)
Provide minimal disturbance to the surrounding soil
Does not inject air or water fluids
Provides a soil core that can be screened, visibly classified, and if necessary collected for chemical analysis A hydraulic probe is often utilized to advance a boring utilizing two different sampling devices. Those are:
Open-tube sampling device – A direct push sampler for collecting continuous core samples of stable, unconsolidated materials. Although other lengths are available, a standard macro-core sampler (MC5) available from Geoprobe® is available in lengths between 48 and 60 inches with an outside diameter of 2.25 inches (Figure 1). Soil is collected inside a removable liner. Macro-core samplers are readily available and easy to use in most unsaturated soil conditions to at least ten feet below ground surface.
Figure 1. Example of an
open-tube sampling device

Remediation Division Standard Operating Procedure
Date: April 30, 2012
Installation of a Soil Gas Probe/Vapor Monitoring Point
Page 4 of 7
Dual-tube sampling system – Dual-tube sampling systems are efficient methods of collecting continuous soil cores with the added benefit of a cased hole. Dual-tube sampling is beneficial in loose or unstable soils as a casing is advanced that prevents soil samples from falling into the boring (Figure 2).
Other methods for advancing boring include the use of hand augers, slab bars, and electric hammers. Each methodology has benefits and drawbacks and should be evaluated before a specific use is decided upon. The hydraulic probe methods identified above can be deployed in a wide variety of site conditions that allows the probe to be driven past some dense stratigraphic horizons.
2.2 Soil Gas Well Materials (General List of Materials)
Tubing – Sample probe tubing should be of a small diameter (1/8 to 1/4 inch) and made of materials that will not react or interact with target compounds. The size should also correspond to the size and construction of the sample point. Suggested materials are nylon, polyethylene, copper, polyvinyl chloride (PVC), or stainless steel. Generally, nylon tubing is preferred as it exhibits lower adsorption rates and is more flexible and easier to work with than stainless steel.
Soil Gas Well Screen – Screens must be less than six inches in length and configured to allow soil gas to enter along the entire length (Figure 3). This typically results in a fine mesh or screen being utilized to prevent dirt or other debris from entering into the sample tubing. Sand Pack – The grain size of the sand pack should be sized appropriately (i.e., no smaller than the adjacent formation) and installed in a manner to minimize disruption of airflow to the sampling tip. Bentonite – Bentonite is utilized to form a chemically resilient, low-permeability, flexible seal from above the well screen to the ground surface. In single vapor point well construction, granular bentonite or bentonite crumbles can be utilized. If multiple well screens are to be
utilized, then a coated and compressed bentonite pellet or “tablet” must be utilized (1/4 inch) to prevent any bentonite dust from sealing portions of the borehole. It must be noted that adequately sealing soil gas sampling probes is very important to minimize the exchange of atmospheric air with the soil gas and to maximize the representativeness of the sample.
2.3 Soil Gas Well Installation The following procedure does not account for the advancement of the boring due to the number of available methodologies available; however, it is imperative that for each boring a soil boring log is competed that provides details on the soil conditions and potential contamination encountered. The procedure below starts after the boring
Figure 2. Example of a dual-tube sampling device
Figure 3. Vapor point examples

Remediation Division Standard Operating Procedure
Date: April 30, 2012
Installation of a Soil Gas Probe/Vapor Monitoring Point
Page 5 of 7
has been advanced and may need to be modified based on the boring methodology utilized. Construction details for each point must be documented in a field log. A. Inspect the borehole to ensure that it has remained open and is free of water to the depth were the well screen is
to be placed. B. Place four to six inches of sand pack on the bottom of the boring. C. Pre-assemble screen and tubing and lower into borehole in an upright position on top of the sand pack. If the
boring is deep and narrow, adding a small inert weight (e.g., nut) may be utilized to facilitate the tube reaching the bottom.
D. Cut the tubing and temporarily terminate the surface end with a Swagelok cap or other fitting to prevent debris from entering into the line.
E. Mark tubing using tape and a ball-point pen to identify the probe location and depth. All marks should be on tags attached to the tubing and not on the tubing itself. Note: Permanent markers must not be used.
F. Place sand pack around the screen and extend the sand pack to six inches above the top of the screen. G. Confirm the depth to the top of the sand pack. H. Record all measurements on the field log. I. Place one foot of dry granular bentonite or bentonite pellets on top of the sand pack. J. Avoid lateral movement between the tubing and the bentonite as much as possible once a point has been
installed. K. Install bentonite pellets until six inches below the next screen interval and then hydrate with minimal water or
one foot from the ground surface ensuring that the bentonite does not bridge during the placement. If an additional vapor point in the same boring is to be installed, return to Step A and repeat.
L. Ensure that the final bentonite seal is at least 2.5 feet thick. M. Cut the protruding lengths of tubing successively shorter so the deepest sample tube is the longest length and
the others progressively shorter. This is helpful if the labels on each tube are lost or illegible upon resampling. N. Terminate surface ends of tubes with Swagelok caps, valves, or other desired terminations. O. Complete all required field documentation. P. Unless soil gas points are to be abandoned the same day they are installed, probes must be properly secured,
capped, and completed to prevent infiltration of water or ambient air into the subsurface. For surface completions, the following components may be installed, as necessary:
1. Fitting for connection to above ground sampling equipment 2. Protective flush-mounted or above ground well vaults; and/or 3. Guard posts

Remediation Division Standard Operating Procedure
Date: April 30, 2012
Installation of a Soil Gas Probe/Vapor Monitoring Point
Page 6 of 7
Examples of a single depth soil gas probe and a multi-depth or “nested” soil gas probe are shown in Figure 4. Figure 5 shows example pictures of surface completion.
Figure 4. Examples of complete vapor monitoring points
[Hartman, 2004 (left and center) and Vonder Haar, S., 2000 (right)]
Figure 5. Examples of various surface completions for vapor wells. (Hartman, 2004)
2.4 Soil Gas Well Abandonment All vapor monitoring wells, including those used for soil gas monitoring, must be abandoned upon completion of site activities. Vapor wells constructed in the manner identified above and that are less than 20 feet in depth may be abandoned by removing any tubing and all surface protective covers. The boring annulus can then be backfilled with uncontaminated native material or grout and returned as close as possible to original site conditions. If the tubing cannot be removed, the tubing should be filled with liquid grout and cut off at least one foot below the ground surface. All surface protective covers must be removed and the boring annulus backfilled with uncontaminated native material or grout and returned to as close as possible to original site conditions.

Remediation Division Standard Operating Procedure
Date: April 30, 2012
Installation of a Soil Gas Probe/Vapor Monitoring Point
Page 7 of 7
3.0 SOIL BORING LOGS AND VAPOR COMPLETION DIAGRAM Boring logs and diagrams may be completed utilizing a variety of programs. The following information must be included for every vapor point installed:
Project information
Boring location
Date Installed
Total depth
Project personnel including drilling contractor, driller, and geologist
Drilling method
Boring diameter
Soil sampler utilized for lithology
Sample recovery
Soil description
Field screening performed
Samples sent for analysis
Unified soil classification system classification
Boring coordinates (state plane)
A diagram representing installed sampling point that includes: o Surface completion o Bentonite seal used o Probe and screen construction materials and specifications o Depth of all installed materials including screen, bottom of screen, sand pack, tubing, and various
bentonite seals 4.0 REFERENCES Hartman, B., 2004. Vapor Monitoring Wells/Implants Standard Operating Procedures. Vonder Haar, S., 2000. ERD SOP 1.10: Soil Vapor Surveys - Revision: 4.

APPENDIX F.2
Installation of a Sub-Slab Soil Gas Probe/Vapor Monitoring Point to
Support Vapor Intrusion Investigations


Remediation Division Standard Operating Procedure
Date: April 30, 2012
Installation of a Sub-Slab Soil Gas Probe/Vapor Monitoring Point
Page 2 of 6
PLEASE NOTE: This SOP was developed based on a compilation of available information, knowledge, field experience, and general industry practices to provide guidance to the Michigan Department of Environmental Quality (MDEQ) staff and their contractors conducting investigations and remedial activities at sites with known or potential vapor intrusion issues. The SOP was created to promote a consistent, informed, and practical approach for the MDEQ staff to follow that achieves the performance standards required by Part 201, Environmental Remediation, of the Natural Resources and Environmental Protection Act, 1994 PA 451, as amended (NREPA), and Part 213, Leaking Underground Storage Tanks, of the NREPA. The methods outlined in this document will produce reliable data that can support the various decisions required throughout the environmental process. This SOP is available as a technical reference that may be informative when conducting work at sites where vapor intrusion issues are of concern and may be used as a reference for those conducting vapor intrusion evaluations under Part 201 or Part 213. This SOP is not intended to prohibit those conducting evaluations from using means other than those specified herein to measure soil gas concentrations; however, departures from this guidance will often need to include information for a more detailed review. The MDEQ is not responsible for the misuse or misinterpretation of the information presented herein. Please note that because the SOP was written for the MDEQ staff, it may contain references to specific equipment for field investigations that the MDEQ currently uses. Such references do not represent endorsements of particular vendors.

Remediation Division Standard Operating Procedure
Date: April 30, 2012
Installation of a Sub-Slab Soil Gas Probe/Vapor Monitoring Point
Page 3 of 6
1.0 SCOPE AND APPLICATION
This SOP describes the MDEQ’s procedure for installing a sub-slab soil gas probe/vapor monitoring point. Sub-slab soil gas samples are vapor samples collected within two feet of the floor of the lowest point of the structure and must be referenced as sub-slab soil gas samples. Though these samples may provide beneficial information to support various lines of evidence, the effects due to barometric pressure, temperature, and the potential breakthrough of ambient air from the surface have the potential to cause these samples to be less reliable than soil samples collected at depths greater than five feet below the surface. This SOP does not cover, nor is it intended to provide, a justification or rationale for where a sampling point is installed. It is assumed by using this SOP that site conditions have been fully evaluated and that the sampling location and depth meet the objectives outlined in the work plan or scope of work. For example, considerations must be given to the types of chemicals of concern, lithology encountered, surrounding buildings and underground structures, and the depth of the vapor source. 2.0 SAMPLING POINT INSTALLATION
2.1 Boring Advancement Borings should be through the use of a rotary hammer drill. The specific drill utilized must be capable of utilizing the drill and coring bits identified by the SOP (see below) as well as be of sufficient size to penetrate the expected thickness of concrete present.
2.2 Sub-Slab Point Well Materials (General List of Materials) Tubing: 1/4 inch diameter x 0.35 inch wall thickness stainless steel tubing for implant Screen: 3 inch stainless steel implant with 1/4 inch stainless steel compression fittings Misc: mini SST ball-valve adapter, rubber shaft plug, top plug, hose barb, compression fittings Expendable supplies: neat cement, bentonite, or plumbers putty Surface termination: Various surface terminations are available and the selection often depends on whether
the probes are temporary or permanent and whether they need to be installed flush with the surface. This SOP utilizes products available from AMS, Inc.
Tools: shop vac® rotary hammer drill 1 inch x 16 inch x 21 inch SDS max bit
2 inch x 3 inch x 16 inch SDS max core bit 50 cubic centimeter (cc) syringe

Remediation Division Standard Operating Procedure
Date: April 30, 2012
Installation of a Sub-Slab Soil Gas Probe/Vapor Monitoring Point
Page 4 of 6
2.3 Sub-Slab Vapor Probe Installation Protocol
1. Prior to drilling holes in a foundation or slab, contact local utility companies to identify
and mark utilities coming into the building from the outside (e.g., gas, water, sewer, refrigerant, and electrical lines). Consult with a local electrician and plumber to identify the location of utilities inside the building.
2. Prior to fabrication of the sub-slab vapor probes, use the rotary drill and the two inch diameter drill bit to create a shallow (e.g., 1/4 to 1/2 inch in depth) outer hole that partially penetrates the slab. This outer hole will allow the protective cap to be flush with the concrete surface (Figure 1).
3. Use a small portable vacuum cleaner to remove cuttings from the hole. 4. Then use the rotary hammer drill and the one inch drill bit to create a smaller
diameter “inner” hole through the remainder of the slab and some depth (e.g., seven to eight centimeters or three inches) into the sub-slab material. Figure 2 illustrates the appearance of “inner” and “outer” holes. Drilling into the sub-slab material will create an open cavity which will prevent obstruction of probes during sampling by small pieces of gravel.
5. Use a small portable vacuum cleaner to remove cuttings from the hole. 6. Determine the thickness of the slab and record the measurement. 7. Assemble the vapor point using the basic design of a sub-slab vapor probe illustrated
in Figure 3. 8. Place the assembled vapor point (Figure 4) into the hole and ensure the screen
extends beyond the concrete and the top of the probe will be completed flush with the slab once the tamper resistant cap is applied, so as not to interfere with day-to-day use of the buildings. Cut tubing if necessary (Figure 4).
9. Confirm the fit of the rubber shaft plug to the sides of the boring. It should be snug and no gaps present. If additional thickness is necessary, plumbers putty can be added to the sides of the rubber.
10. Mix a quick-drying Portland cement which expands upon drying (to ensure a tight seal) with water to form a slurry.
11. Inject the Portland cement with a 50 cc syringe or push into the annular space between the probe and outside of the “outer” hole (Figure 6).
12. Complete installed vapor point (Figure 7) with a tamper-resistant cap (Figure 8) or plug (Figure 9).
13. Allow cement to cure for at least 24 hours prior to sampling.
Figure 2
Figure 5
Figure 1
Figure 6
Figure 3
Figure 4
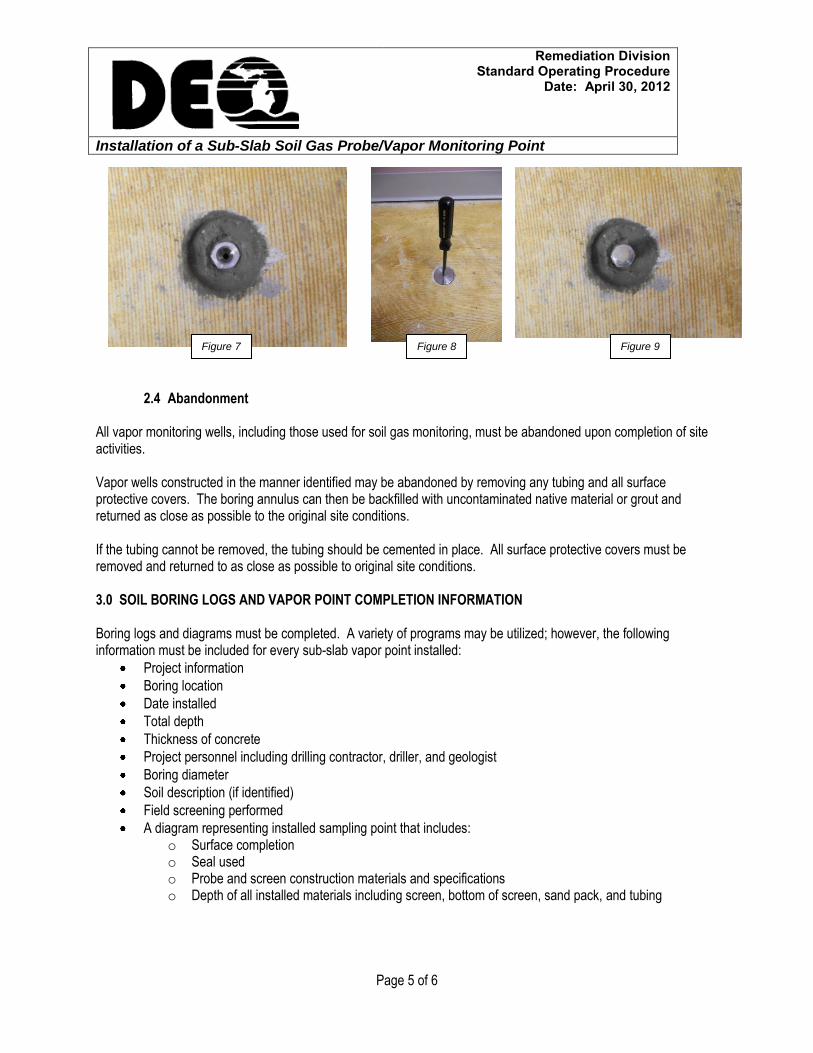
Remediation Division Standard Operating Procedure
Date: April 30, 2012
Installation of a Sub-Slab Soil Gas Probe/Vapor Monitoring Point
Page 5 of 6
2.4 Abandonment All vapor monitoring wells, including those used for soil gas monitoring, must be abandoned upon completion of site activities. Vapor wells constructed in the manner identified may be abandoned by removing any tubing and all surface protective covers. The boring annulus can then be backfilled with uncontaminated native material or grout and returned as close as possible to the original site conditions. If the tubing cannot be removed, the tubing should be cemented in place. All surface protective covers must be removed and returned to as close as possible to original site conditions. 3.0 SOIL BORING LOGS AND VAPOR POINT COMPLETION INFORMATION Boring logs and diagrams must be completed. A variety of programs may be utilized; however, the following information must be included for every sub-slab vapor point installed:
Project information
Boring location
Date installed
Total depth
Thickness of concrete
Project personnel including drilling contractor, driller, and geologist
Boring diameter
Soil description (if identified)
Field screening performed
A diagram representing installed sampling point that includes: o Surface completion o Seal used o Probe and screen construction materials and specifications o Depth of all installed materials including screen, bottom of screen, sand pack, and tubing
Figure 8 Figure 9 Figure 7

Remediation Division Standard Operating Procedure
Date: April 30, 2012
Installation of a Sub-Slab Soil Gas Probe/Vapor Monitoring Point
Page 6 of 6
4.0 REFERENCES Though not specifically referenced, the SOP is based upon the following: DiGiulio, Dominic. DRAFT Standard Operating Procedure (SOP) for Installation of Sub-Slab Vapor Probes and
Sampling Using EPA Method TO-15 to Support Vapor Intrusion Investigations. United States Environmental Protection Agency, Office of Research and Development, National Risk Management Research Laboratory, Ground-Water and Ecosystem Restoration Division, Ada, Oklahoma.
Hartman, B., 2004. Vapor Monitoring Wells/Implants Standard Operating Procedures.

APPENDIX F.3
Sampling Utilizing USEPA Method TO-15 via Bottle-Vac® to Support
Vapor Intrusion Investigations
Special thanks for assistance: Daryl Strandbergh – Fibertec Environmental Services Brian Trent – Soil and Materials Engineers, Inc.


Remediation Division Standard Operating Procedure
Date: April 30, 2011
Sampling Utilizing USEPA Method TO-15 Via Bottle-Vac®
Page 2 of 9
PLEASE NOTE: This SOP was developed based on a compilation of available information, knowledge, field experience, and general industry practices to provide guidance to the Michigan Department of Environmental Quality (MDEQ) staff and their contractors conducting investigations and remedial activities at sites with known or potential vapor intrusion issues. The SOP was created to promote a consistent, informed, and practical approach for the MDEQ staff to follow that achieves the performance standards required by Part 201, Environmental Remediation, of the Natural Resources and Environmental Protection Act, 1994 PA 451, as amended (NREPA), and Part 213, Leaking Underground Storage Tanks, of the NREPA. The methods outlined in this document will produce reliable data that can support the various decisions required throughout the environmental process. This SOP is available as a technical reference that may be informative when conducting work at sites where vapor intrusion issues are of concern and may be used as a reference for those conducting vapor intrusion evaluations under Part 201 or Part 213. This SOP is not intended to prohibit those conducting evaluations from using means other than those specified herein to measure soil gas concentrations; however, departures from this guidance will often need to include information for a more detailed review. The MDEQ is not responsible for the misuse or misinterpretation of the information presented herein. Please note that because the SOP was written for the MDEQ staff, it may contain references to specific equipment for field investigations that the MDEQ currently uses. Such references do not represent endorsements of particular vendors.

Remediation Division Standard Operating Procedure
Date: April 30, 2011
Sampling Utilizing USEPA Method TO-15 Via Bottle-Vac®
Page 3 of 9
1.0 SCOPE AND APPLICATION
This SOP describes the MDEQ’s procedure for collecting a vapor sample through either a soil gas probe/vapor monitoring point and/or sub-slab monitoring point for the analysis of volatile organic compounds (VOCs) by the United States Environmental Protection Agency Method TO-15 (USEPA, 1999). This SOP does not cover, nor is it intended to provide, a justification or rationale for where a sampling point is installed. It is assumed by using this SOP that site conditions have been fully evaluated and that the sampling location and depth meet the objectives outlined in the work plan or scope of work. Considerations must be given to the types of chemicals of concern, lithology encountered, and the depth of the vapor source. Samples collected deeper than any potential source of vapors may not fully characterize the potential risk and sampling points should never be installed or collected within the zone of saturation. The Method TO-15 in this procedure has been modified for use with one-liter Bottle-Vac® samplers by Entech Instruments, Inc. Bottle-Vacs® are utilized by the MDEQ’s Laboratory in all soil gas sampling applications. Bottle-Vac® has been shown by internal testing performed by the MDEQ Laboratory to be reliable for both holding times and reporting requirements in soil gas sampling applications. 2.0 SOIL GAS COLLECTION Most vapor wells are installed at relatively shallow depths (less than ten feet below ground surface) so minimum purge volumes and low-volume samples must be performed to minimize potential breakthrough from the surface or between sampling intervals. Tracer/leak gas is necessary to ensure breakthrough does not occur and that a leak does not occur at any fitting above grade. Samples must not be collected for a minimum of 72 hours after any rain event and until site conditions (including moisture content) return to typical site conditions. Samples from wells with multiple points installed must not be collected simultaneously and approximately 30 minutes must elapse between each sampled interval which should be documented on the field log. Sample flow rates are not to exceed 200 milliliters per minute (ml/min) to minimize the potential for vacuum extraction of contaminants from the soil phase. Volumes of various tubing sizes are provided in Table 1 in order to aid in calculating purge volumes. Care must be used during all aspects of sample collection to ensure that sampling error is minimized and high quality data are obtained. Care must also be taken to avoid excessive purging prior to sample collection and prevent pressure build-up in the enclosure during introduction of the tracer gas. Inspection of the installed sample probe, specifically noting the integrity of the surface seal and the porosity of the soil in which the probe is installed, will help to determine the tracer gas setup. The sampling team must avoid actions (e.g., fueling vehicles, using permanent marking pens, and wearing freshly dry-cleaned clothing or personal fragrances) which could potentially cause sample interference in the field.
Table 1 Volumes for Select Tubing Sizes
Tubing Size (inches ID)
Volume/ft. (liters)
3/16 0.005
1/4 0.010
1/2 0.039

Remediation Division Standard Operating Procedure
Date: April 30, 2011
Sampling Utilizing USEPA Method TO-15 Via Bottle-Vac®
Page 4 of 9
IMPORTANT SAMPLING NOTES:
An initial vacuum test must be performed on each point. This is done by attaching a 50-ml syringe and pulling back on a point to ensure that the point is able to provide adequate vapor without obtaining a vacuum. If a point is installed in which the syringe cannot be withdrawn without generating a vacuum, the sampling point may not be valid and may need to be replaced.
If water droplets are observed in the tubing or in a Bottle-Vac®, the sampling crew must note the presence of water on the sample label and Chain of Custody and recollect the sample.
Bottle-Vac® must remain out of the sun and not placed on ice or chilled.
Collected Bottle-Vac® samples must be stored at room temperature and not left in a hot vehicle or freezing vehicle.
Label all samples with the label provided by the lab using a ballpoint pen. DO NOT USE A SHARPIE!
Wash hands or replace sampling gloves between samples to ensure the leak/tracer compound is not on your fingers when connecting fittings.
Disposable equipment and supplies must not be used for multiple sampling points.
Do not write on boxes provided by the MDEQ Laboratory.
Do not remove the green tape from the flow regulator. Do not adjust; the flow regulator has been calibrated to the correct flow rate of 100 to 200 ml/min.
The MDEQ provides a dedicated regulator for each sample that is collected. The ID of each regulator should be referenced on the sampling form and any issues reported to the MDEQ Laboratory.
2.1 Soil Gas Collection General List of Materials
The equipment required for soil gas sample collection is as follows: Flow Meters and Detectors
Flow regulator with vacuum gauge. Flow regulators provided by the MDEQ Laboratory are pre-calibrated to a specified flow rate (e.g., 100 ml/min).
Photoionization detector (with appropriate lamp)
Helium detector (if helium is utilized as a tracer gas)
Methane meter for petroleum sites that is capable of also measuring percent of methane (CH4), carbon dioxide (CO2), and oxygen (O2)
Tooling and Supplies
Bottle-Vac® (one per location)
Regulated flow meter assembly set to a maximum of 200 ml/min (one per location)
1/4 inch tubing (Teflon®, polyethylene, or similar) and assorted fittings
Plastic housing for using tracer gas
50 ml syringe (for purging)
Camera
Adjustable crescent wrenches, small to medium size, and/or open end combo wrenches 9/16 to 1/2 inch
Scissors/snips to cut tubing
Ballpoint pens
Nitrile gloves
Compound to be used as tracer gas - lab grade helium or isopropyl alcohol (IPA)

Remediation Division Standard Operating Procedure
Date: April 30, 2011
Sampling Utilizing USEPA Method TO-15 Via Bottle-Vac®
Page 5 of 9
Forms:
Chain of Custody forms
Soil gas sample collection log (example attached)
Field notebook
2.2 Soil Gas Tracer Compounds
A leak in the sampling assembly may allow ambient air into the system and dilute the soil gas results (Benton, 2007). Therefore, tracer gases must be utilized during the collection of soil gas samples to verify that the sample collected is from the installed sampling point. The presence of a tracer compound, whether liquid or gaseous, can confirm a leak in the sampling train and the usability of the sample will need to undergo further evaluation. Careful thought and consideration must be used when choosing a leak check compound as a tracer as each compound utilized can have specific benefits and drawbacks that should be considered. Figure 1 depicts a typical sub-slab sampling setup utilizing helium as a tracer gas. Though other compounds may be utilized, the MDEQ Laboratory has identified a preference for helium.
Helium used as a tracer gas beneath a shroud as shown in Figure 1 allows for the screening of the sampling train in the field. The use of a field meter capable of detecting helium may be able to resolve and correct any leaks by reevaluating the sampling train and retightening all fittings prior to collecting the sample for analysis. If a leak has been detected and is unable to be resolved, the sampling point may need to be decommissioned and a new one installed. Lab grade helium must be utilized to eliminate possible contribution issues as helium available at general merchandise stores may contain secondary contaminants such as benzene. Understanding the relationship between a leak and the concentration detected of the tracer gas used to check for leaks, the potential for absorption of the tracer gas (i.e., helium) onto sample train tubing, and the potential for interference by the tracer gas compound with VOCs is important in answering the data usability. An ambient air leak up to five percent may be acceptable if quantitative tracer testing is performed. Otherwise, the soil gas vapor well should be decommissioned if the leak cannot be corrected. Replacement vapor wells should be installed at least five feet from the location where the original vapor well was decommissioned due to a confirmed leak.
Figure 1. Sampling shroud being pressurized with helium.

Remediation Division Standard Operating Procedure
Date: April 30, 2011
Sampling Utilizing USEPA Method TO-15 Via Bottle-Vac®
Page 6 of 9
2.3 Sample Collection Procedure
1. Allow for subsurface conditions to equilibrate and vapor concentrations to stabilize after vapor point installation:
Do not conduct the purge volume test, leak test, and soil gas sampling for at least 45 minutes.
Do not conduct the purge volume test, leak test, and soil gas sampling for at least 48 hours after vapor probe installation with augers.
Do not conduct the purge volume test, leak test, and soil gas sampling for a minimum of 72 hours after any rain event (until site conditions return to normal).
2. Assemble the aboveground sampling equipment which consists of new connector tubing, regulated flow meter assembly including pressure gauge, purging equipment, and label for the Bottle-Vac®.
3. Connect aboveground sampling equipment lines and the regulated flow meter assembly to vapor monitoring point and place the completed sampling label on the Bottle-Vac®.
4. Calculate volume of air contained within the vapor point and sampling assembly up to the point where the sample will be collected and record on the field sampling form.
5. Check all sampling system connections and fittings for tightness and/or obvious deterioration. 6. Run all sampling lines through the helium shroud and place the enclosure on the ground. It may be
appropriate to seal the enclosure to the ground using plumbers putty or hydrated bentonite. 7. Connect the helium cylinder to the tracer gas port (see Figure 1) and begin the flow of helium into the
enclosure. 8. Confirm that the enclosure contains helium through the use of the helium detector. 9. Connect a 50 cubic centimeter (cc) syringe to the sampling port line and purge at least three volumes of air
from the sampling system. After purging is complete, close the valve to the sampling line, disconnect the syringe, and close valve to the helium cylinder.
10. Calibrate the helium detector and zero for existing site conditions. 11. Connect the helium detector to the sampling port, collect, and record a reading. 12. If helium is detected, return to Step 5 and repeat process until no helium is detected. If a leak is unable to
be resolved, the sampling point may need to be decommissioned and a new one installed. 13. Reaffirm that the enclosure contains helium through the use of the helium detector. If helium is not detected
in the sampling enclosure, identify how the helium is leaving the enclosure and return to Step 6 and seal the enclosure as appropriate.
14. Disconnect or remove the sampling lines from the sampling enclosure leaving the flow regulator assembly and the lines connecting it into the sampling point in place.
15. Open the valve on sampling line. 16. Immediately connect the flow regulator assembly to the Bottle-Vac® using the quick connect adaptor and
record the start time. The vacuum gauge should register about -28 millimeters mercury when it is first attached.
17. Check every two minutes and record the time at which the vacuum gauge reaches 0 pounds per square inch.
18. Calculate and confirm that the sampling rate is less than 200 ml/min. Record the flow regulator number on the sampling form and note any sampling discrepancies in the field notes and sampling form.
19. Disconnect the quick connect adaptor from the Bottle-Vac® and place parafilm on the top of the Entech Micro-QT® Valve.
20. Confirm the container has the proper label with the sample identification information. 21. Remove the flow regulator from the tubing and record the regulator number on the sampling form. 22. Complete the air volatiles request form. Be sure to circle Bottle-Vac® in the upper right.

Remediation Division Standard Operating Procedure
Date: April 30, 2011
Sampling Utilizing USEPA Method TO-15 Via Bottle-Vac®
Page 7 of 9
23. Return everything including the Bottle-Vac®, adaptor, vacuum gauge, flow regulator assembly, and notes on equipment issues to the MDEQ Laboratory for analysis, cleaning, and calibration.
(a) (b) (c) (d) Figure 2.
(a) – Bottle-Vac®; (b) – Flow regulator for Bottle-Vac®; (c) – Assembled sampling device; (d) 50 cc syringe utilized for purging vapor point
3.0 QUALITY ASSURANCE/QUALITY CONTROL PROCEDURES AND FIELD RECORDS The Quality Assurance/Quality Control (QA/QC) procedures are an integral part of any sampling activities. The most important QA/QC procedures in collecting soil gas sampling are ensuring that the samples are representative of the subsurface conditions. For soil gas sampling, that means the QA/QC program identify procedures that verify that the sample is properly collected. Recording the pressure reading throughout the process is a critical component. Unlike soil or groundwater sampling, most of the containers and sampling devices utilized for sampling are verified clean. Upon request, the laboratory can provide laboratory batch cleaning results. Trip blanks are typically not collected due to the sampling process and sampling devices that prevent the intrusion of (or introduction) air or other media into the sampling device. In addition, the failure of one flow regulator sampling assembly or on a specific Bottle-Vac® does not provide an indication that any of the other sampling assemblies or Bottle-Vacs® have failed. Sampling blanks for tubing and fittings may be collected if the source of the material is unknown or suspected to be contaminated. Duplicate samples including blind duplicates are recommended to be collected to verify laboratory procedures and should include the collection of at least one field duplicate per sampling event or one per 20 samples, whichever is greater. When collecting duplicate samples in the field, it is imperative that the duplicate samples are collected simultaneous to collection of the primary sample using a sampling tee and at a combined sample rate to not exceed 200 ml/min from each point. Laboratory duplicate samples can also be collected from the same sampling Bottle-Vac® if the duplicate is not required to be a blind sample.
3.1 Soil Gas Sampling Record
The following information should be recorded in a field notebook or on sampling forms similar to those shown in Attachment 1 to document the procedures utilized at a specific site to collect soil gas data. In general, the fields should include the following information:
1. Sample identification information including the locations and depths at which the samples were collected, sample identifiers, date, and time
2. Identify the field personnel involved in the sample collection

Remediation Division Standard Operating Procedure
Date: April 30, 2011
Sampling Utilizing USEPA Method TO-15 Via Bottle-Vac®
Page 8 of 9
3. Weather conditions (e.g., temperature, wind speed, barometric pressure, precipitation, etc.) 4. Sampling methods, devices, and equipment used 5. Purge volumes prior to sample collection. Relate the purge volumes to the volume of the sampling
equipment, including the tubing connecting the sampling interval to the surface. 6. Volume of soil gas extracted (i.e., volume of each sample) 7. Vacuum of canisters before and after samples collected 8. Tracer gas utilized and whether it is a liquid or a solid 9. Field screening of any tracer gas
4.0 REFERENCES Benton, Diane and Shafer, Nathan. 2007. Evaluating Leaks in a Soil Gas Sample Train, Paper #45 Extended
Abstract, Air Toxics, Ltd. United States Environmental Protection Agency. 1999. Compendium of Methods for the Determination of Toxic
Organic Compounds in Ambient Air. Second Edition. Compendium Method TO-15 Determination of Volatile Organic Compounds (VOCs) in Air Collected in Specially-Prepared Canisters and Analyzed By Gas Chromatography/Mass Spectrometry (GC/MS). Center for Environmental Research Information, Office of Research and Development, United States Environmental Protection Agency. Document No. EPA/625/R-96/010b.

Remediation Division Standard Operating Procedure
Date: April 30, 2011
Sampling Utilizing USEPA Method TO-15 Via Bottle-Vac®
Page 9 of 9
Attachment 1
APPENDIX F.4
Indoor Air Sampling via
USEPA TO-15


Remediation Division Standard Operating Procedure
Date: April 30, 2012
Indoor Air Sampling Procedure Via USEPA Method TO-15
Page 2 of 23
PLEASE NOTE: This SOP was developed based on a compilation of available information, knowledge, field experience, and general industry practices to provide guidance to the Michigan Department of Environmental Quality (MDEQ) staff and their contractors conducting investigations and remedial activities at sites with known or potential vapor intrusion issues. The SOP was created to promote a consistent, informed, and practical approach for the MDEQ staff to follow that achieves the performance standards required by Part 201, Environmental Remediation, of the Natural Resources and Environmental Protection Act, 1994 PA 451, as amended (NREPA), and Part 213, Leaking Underground Storage Tanks, of the NREPA. The methods outlined in this document will produce reliable data that can support the various decisions required throughout the environmental process. This SOP is available as a technical reference that may be informative when conducting work at sites where vapor intrusion issues are of concern and may be used as a reference for those conducting vapor intrusion evaluations under Part 201 or Part 213. This SOP is not intended to prohibit those conducting evaluations from using means other than those specified herein to measure soil gas concentrations; however, departures from this guidance will often need to include information for a more detailed review. The MDEQ is not responsible for the misuse or misinterpretation of the information presented herein. Please note that because the SOP was written for the MDEQ staff, it may contain references to specific equipment for field investigations that the MDEQ currently uses. Such references do not represent endorsements of particular vendors.

Remediation Division Standard Operating Procedure
Date: April 30, 2012
Indoor Air Sampling Procedure Via USEPA Method TO-15
Page 3 of 23
1.0 SCOPE AND APPLICATION
This SOP describes the MDEQ’s procedure for the collection of an indoor air sample and the analysis of volatile organic compounds (VOCs) by the United States Environmental Protection Agency Method TO-15 (TO-15) (USEPA, 1999). The objective is to describe the equipment and techniques for the collection of time-integrated air samples in a SUMMA® canister with the ultimate goal of ensuring that similar methods and protocols are used when collecting such samples for analysis of VOCs to evaluate vapor intrusion. This is a SOP (i.e., typically applicable) which may need to be varied or changed dependent on site conditions, equipment limitations, or limitations imposed by the procedure. In all instances, the ultimate procedures employed should be documented. This SOP does not cover, nor is it intended to provide, a justification or rationale for when this sampling is conducted. It is assumed by using this SOP that site conditions have been fully evaluated and that the sampling location and depth meet the objectives outlined in the work plan or scope of work. The TO-15 Method in this procedure has been established for the use of a SUMMA® canister equipped with a regulator that will collect an indoor air sample continually over a 24-hour period. If a shorter time frame is necessary to evaluate nonresidential conditions, the following procedures will need to be modified accordingly. Laboratory detection limits must be compared from each method to the acceptable indoor air concentrations (AIAC) to assure that the detection limits will be equal to or less than the corresponding generic AIACs. 2.0 PRE-SAMPLING INSPECTION
An adequate background review must be conducted before sampling to obtain information on each structure from which a sample is collected. The background review should include a visual survey of each structure to ascertain the basement, crawl space, or slab-on-grade building configuration; determine if sumps, wells, or cisterns are associated with each structure; evaluate the condition of the floors and walls; and describe the heating and ventilation system within each structure. These features may act as conduits that will facilitate the migration of VOC vapors from the subsurface. An attached garage, basement, or workshop may store products that can contribute to indoor air impacts.
Interviews should be conducted with the owner/occupant of the building(s) to assess the use of potential contaminants, frequency of use, storage, as well as methods of handling and disposal. This information is vital to adequately evaluate activities that may influence the air sampling results and includes, but is not limited to: the length of occupant residency; ages of adults and children living in the structure; if occupants smoke and how often; and any hobbies using paints, solvents, and/or other potential contaminants. A pre-sampling inspection must be performed prior to each sampling event to identify conditions that may affect or interfere with the proposed testing. The inspection should evaluate the type of structure, floor layout, physical conditions, and airflow of the building(s) being studied. The inspection information should be identified on a form similar to those included in Attachment 1. In addition, potential sources of chemicals of concern should be evaluated within the building by conducting a product inventory. The primary objective of the product inventory is to identify potential air sampling interference by characterizing the occurrence and use of chemicals and products throughout the building, keeping in mind the goal of the investigation and site-specific contaminants of concern (COCs). For example, it is not necessary to provide detailed information for each individual container of like items. However, it is necessary to indicate that “20 bottles of perfume” or “12 cans of latex paint” were present with containers in good condition. This information is used to help formulate the indoor environment profile.

Remediation Division Standard Operating Procedure
Date: April 30, 2012
Indoor Air Sampling Procedure Via USEPA Method TO-15
Page 4 of 23
Each room on the floor of the building being tested and on lower floors, if possible, should be inspected and an inventory provided. This is important because even products stored in another area of a building can affect the air of the room being tested. For example, when testing for a petroleum spill, all indoor sources of petroleum hydrocarbons should be scrutinized. These can include household and commercial products containing VOCs, petroleum products including fuel from gasoline-operated equipment, unvented space heaters and heating oil tanks, storage and/or recent use of petroleum-based finishes and paints, or products containing petroleum distillates. This information should be detailed in the survey forms in Attachment 1. The presence and description of odors (e.g., solvent, moldy) and portable vapor monitoring equipment readings (e.g., photoionization detectors (PIDs) for VOCs, Jerome Mercury Vapor Analyzer for mercury) should be used to help evaluate potential sources. This includes taking readings near products stored or used in the building. Products in buildings should be inventoried every time air is tested to provide an accurate assessment of the potential contribution of volatile chemicals. If available, chemical ingredients of interest should be recorded for each product. If the ingredients are not listed on the label, record the product’s exact full name, and the manufacturer’s name, address, and phone number, if available. In some cases, Material Safety Data Sheets may be useful for identifying confounding sources. 3.0 PREPARATION OF BUILDING Potential interference from products or activities releasing volatile chemicals may need to be controlled. Removing the source from the indoor environment prior to testing is the most effective means of reducing the interference. Ensuring that containers are tightly sealed may be acceptable. When testing for VOCs, containers should be tested with a field instrument to assess whether VOCs are leaking. The investigator should consider the possibility that chemicals may adsorb onto porous materials and may take time to dissipate. The goal of the testing is to evaluate the impact from products used or stored in the building (e.g., pesticide misapplications, school renovation projects).
Once interfering conditions are corrected (if applicable), ventilation may be needed prior to testing to eliminate residual contamination in the indoor air. If ventilation is appropriate, it should be completed 24 hours or more prior to the scheduled sampling time. Where applicable, ventilation can be accomplished by operating the building’s heating, ventilation, or air conditioning (HVAC) system to maximize outside air intake. Opening windows and doors and operating exhaust fans may also help or may be needed if the building has no HVAC system.
Air samples are sometimes designed to represent a typical exposure in a mechanically ventilated building, and the operation of the HVAC systems during sampling should be noted (see HVAC section on the attached indoor air quality questionnaire). In general, the building’s HVAC system should be operating under normal conditions. Unnecessary building ventilation should be avoided within the 24 hours prior to and during testing. During colder months, heating systems should be operating under normal occupied conditions (i.e., 65° to 75°Fahrenheit) for at least 24 hours prior to and during the scheduled sampling time.
Depending on the goal of the indoor air sampling, some situations may warrant deviation from the above protocol regarding building ventilation. In such instances, building conditions and sampling efforts should be understood and noted within the framework and scope of the investigation.

Remediation Division Standard Operating Procedure
Date: April 30, 2012
Indoor Air Sampling Procedure Via USEPA Method TO-15
Page 5 of 23
FOR 24 HOURS PRIOR TO SAMPLING, ALL REASONABLE MEASURES SHOULD BE TAKEN TO AVOID:
Opening any windows, fireplace dampers, openings, or vents
Operating ventilation fans unless special arrangements are made
Smoking in the house
Painting
Using wood stoves, fireplaces, or other auxiliary heating equipment (e.g., kerosene heaters)
Operating or storing automobiles in an attached garage
Allowing containers of gasoline or oil to remain within the house, except for fuel oil tanks
Cleaning, waxing, or polishing furniture or floors with petroleum- or oil-based products
Using air fresheners or odor eliminators
Engaging in any hobbies that use materials containing VOCs
Using cosmetics, including hairspray, nail polish, nail polish removers, perfume/cologne, etc.
Applying pesticides
4.0 COLLECTION OF SAMPLES
Air samples should be collected from an adequate number of locations to assess potential exposures to occupants. In private residences, air samples should be collected from each floor including: the basement, first floor living space, and from outdoors. Minimum sample frequencies are one sample per 250 square feet (ft2) for residential, and one per 1,000 ft2 for nonresidential settings. Sampling devices should not be placed near doors, windows, stairways, or air supplies. In settings with diurnal occupancy patterns, such as schools and office buildings, samples should be collected during normally occupied periods to be representative of typical exposure. However, in special circumstances it may be necessary to collect air samples at other times in order to minimize disruptions to normal building activities. Sample collection intakes should be located to approximate the breathing zone for building occupants (i.e., three feet above the floor level where occupants are normally seated or sleep). To ensure that an air sample is representative of the conditions being tested and to avoid undue influence from sampling personnel, personnel should avoid lingering in the immediate area of the sampling device while samples are being collected. If the goal of the sampling is to represent average concentrations over longer time periods, then longer duration sampling periods may be appropriate. The sampling team members should avoid actions (e.g., fueling vehicles, using permanent marking pens) that can cause sample interference in the field.
4.1 Sample Analysis Indoor air samples must be collected and analyzed in accordance with this SOP. In determining laboratory detection limits, the samples must be compared from each method to the AIACs to assure that the detection limits will be equal to or less than the corresponding generic AIACs. Indoor air sampling to evaluate potential impacts from chemical contaminant sources (i.e., old spills, soil vapor, groundwater) should generally include the full list of compounds identified in Appendix C of the Remediation Division Guidance Document. The “Target Compounds List” identified in Appendix C includes a smaller subset of compounds than the entire list of compounds capable of being identified. Each analysis must also include the reporting of the top five Tentatively Identified Compounds greater than five parts per billion by volume that are not attributed to column breakdown, as compared to response of the nearest internal standard, when using the full-scan mode of the mass spectrometer. The laboratory will also report within the narrative if a hump is seen within the chromatogram such as is typical for gasoline, fuel oil, mineral spirits, etc.

Remediation Division Standard Operating Procedure
Date: April 30, 2012
Indoor Air Sampling Procedure Via USEPA Method TO-15
Page 6 of 23
4.2 Sampling Equipment Time-integrated indoor air samples will be collected in specially prepared six liter (L) SUMMA® canisters. Airflow into the canister is regulated by a sampling valve or a pneumatic flow controller attached to an in-line particulate filter. The sampling valve is typically used for short duration grab samples; however, the valve can be set for longer duration sampling. Flow controllers are precalibrated to regulate flow for sample collection times of 8 hours, 12 hours, or 24 hours. Canisters will be cleaned and certified by the laboratory as per the USEPA TO-15 Method guidelines. During the planning stage for the sampling event, the laboratory will need information on the contaminants of interest, the analytical method, and reporting limits required for the project so that appropriately cleaned canisters can be selected. Also, the sampling team should consider requesting extra canisters and flow controllers from the laboratory due to the potential for equipment failure. A vacuum gauge is utilized to measure and record the initial canister vacuum. A post-sampling vacuum reading is also taken to ensure that a sufficient sample has been collected and that some residual vacuum remains in the canister. The initial canister vacuum should be at least -26 inches of mercury (Hg). If the initial vacuum is less than -26 inches Hg (i.e., between 0 inches Hg and -25 inches Hg), the canister should be rejected and returned to the laboratory. Stainless steel, Teflon, or nylon tubing can be attached to the in-line filter to obtain samples from the breathing zone or a remote location. The inlet manifold is placed in the breathing zone at approximately three to six feet above grade.
4.3 Quality Assurance/Quality Control
Extreme care should be taken during all aspects of sample collection to ensure that high quality data are obtained. Appropriate quality assurance/quality control measures must be followed for sample collection and laboratory analysis. Items that should be addressed in sampling protocols include sampling techniques, certified-clean sampling apparatus, appropriate sample holding times, temperatures, and pressures. In addition, laboratory procedures must be followed including: field documentation (sample collection information and locations), Chain-of-Custody, field blanks, field sample duplicates and laboratory duplicates, as appropriate.
4.4 Sampling Information Detailed information must be gathered at the time of sampling to document conditions prior to and during sampling to aid in the interpretation of the test results. The information should be recorded on the building inventory form along with the date and the investigator’s initials. Floor plan sketches must be drawn for each floor and should include the floor layout with sample locations; chemical storage areas; garages; doorways; stairways; location of basement sumps; HVAC systems, including air supplies and returns; compass orientation (north); and any other pertinent information. In addition, observations such as odors, PID readings, and airflow patterns should be recorded on the building inventory form. Smoke tubes or other devices are helpful and should be used to confirm pressure relationships and airflow patterns, especially between floor levels and between suspected contaminant sources and other areas. Photos should be collected of each sampling container deployed within the structure.

Remediation Division Standard Operating Procedure
Date: April 30, 2012
Indoor Air Sampling Procedure Via USEPA Method TO-15
Page 7 of 23
Outdoor plot sketches must include the building site, area streets, outdoor sample location, the location of potential interference (e.g., gas stations, factories, lawn mowers), wind direction, and compass orientation (north arrow identified).
4.5 Sample Hold Time The hold time is very compound-specific. For example, compounds such as chloroform, benzene, and vinyl chloride are typically stable in a canister for at least 30 days. The USEPA TO-15 Method states, “Fortunately, under conditions of normal usage for sampling ambient air, most VOCs may be recovered from canisters near their original concentrations for after storage times of up to thirty days.” However, some VOCs degrade quickly and demonstrate low recovery even after seven days (Hayes, 2007). The MDEQ recommends a maximum of 14 days for most compounds; however, identification of all the COCs at a site should be provided to the laboratory to determine if a shorter holding time is necessary. 5.0 SAMPLING PROCEDURES
5.1 Associated Hardware
5.1.1 Valve A 1/4 inch stainless steel bellows valve (manufactured by Swagelok or Parker Instruments) should be mounted at the top of the canister. The valve allows vacuum to be maintained in the canister prior to sampling and seals off the canister once the sample has been collected. No more than a half-turn by hand is required to open the valve. Do not over tighten the valve after sampling or it may become damaged. A damaged valve can leak, possibly compromising the sample. Some canisters have a metal cage near the top to protect the valve (Hayes, 2007).
5.1.2 Brass Cap Each canister comes with a brass cap (i.e., Swagelok 1/4 inch plug) secured to the inlet of the valve assembly. The cap serves two purposes: first, it ensures that there is no loss of vacuum due to a leaky valve or a valve that is accidentally opened during handling; second, it prevents dust and other particulate matter from fouling the valve. The cap is removed prior to sampling and replaced following sample collection (Hayes, 2007).
5.1.3 Particulate Filter Particulate filters may be used when sampling with a canister. A separate filter (Figure 1) should be used for each sample collection to prevent any cross-contamination (Hayes, 2007).
Figure 1. Provided by Hayes, 2007

Remediation Division Standard Operating Procedure
Date: April 30, 2012
Indoor Air Sampling Procedure Via USEPA Method TO-15
Page 8 of 23
Figure 2. Provided
by Hayes, 2007
5.1.4 Fittings Standard hardware fittings are 1/4 inch Swagelok; a 9/16 inch wrench is used to assemble the hardware. Compression fittings should be used for all connections; never use tube-in-tube connections. It is critical to avoid leaks in the sampling train. Leaks of ambient air through fittings between pieces of the sampling train (e.g., tubing to particulate filter) will dilute the sample and cause the canister to fill at a faster rate than desired (Hayes, 2007).
5.1.5 Vacuum Gauge A vacuum gauge (Figure 2) is used to measure the initial vacuum of the canister before sampling and the final vacuum upon completion. A gauge can also be used to monitor the fill rate of the canister; however, most gauges should be considered as only a rough estimate of the pressure and should only be used to obtain a relative measure of “change” (Hayes, 2007).
5.1.6 Flow Controllers An air sample collected over time is referred to as an integrated sample and can provide information on compound concentrations in air averaged or composited over time. Illustrated here are some of the most common hardware configurations used to take an integrated sample. Flow controllers are devices that regulate the flow of air during sampling into an evacuated canister, (also known as flow restrictors). These devices enable a sampler to achieve a desired flow rate and, thus, a sampling interval. The flow controller (Figure 3) should allow the sample to be collected equally over a set period of time (Hayes, 2007).
5.2 Final Canister Vacuum and Flow Controller Performance The final vacuum of a six L canister should be between five and ten inches Hg. As long as the differential pressure is greater than four inches Hg ambient pressure, the flow through the device will remain approximately constant as the canister fills. If there is insufficient differential pressure, the flow through the controller will decrease as the canister pressure approaches ambient. Because of the normal fluctuations in the flow rate (due to changes in ambient temperature, pressure, and diaphragm instabilities) during sampling, the final vacuum will range between two and ten inches Hg. General considerations of the final canister vacuum include:
If the residual canister vacuum is greater than five inches Hg (i.e., more vacuum), and less than five L of sample was collected in a six L canister. When the canister is pressurized to five pounds per square inch prior to analysis, sample dilution will be greater than normal. This will result in elevated reporting limits.
If the residual canister vacuum is less than five inches Hg (i.e., less vacuum), the initial flow rate was high or there was a leak in the connection. Once the vacuum decreases below five inches Hg, the flow rate begins to drop significantly. This scenario indicates that the sample is skewed in favor of the first portion of the sampling interval.
If the final vacuum is near ambient (i.e., less than one inch Hg), there is inadequate differential pressure to drive the flow controller. The sampler cannot be certain the desired sampling interval was achieved before
Figure 3. Provided by Hayes, 2007

Remediation Division Standard Operating Procedure
Date: April 30, 2012
Indoor Air Sampling Procedure Via USEPA Method TO-15
Page 9 of 23
the canister arrived at ambient conditions. Although the actual sampling interval is uncertain, the canister still contains a sample from the site.
Table 5.1 identifies the relationship between the final canister vacuum and the dilution factor, which may affect the ability of the sample to reach the required detection limits (Hayes, 2007).
Table 5.1: Relationship between Final Canister Vacuum, Volume Sampled, and Dilution Factor of a 6 L Canister
(Provided by Hayes, 2007)
5.3 Considerations for Sampling with Canisters Avoid Leaks in the Sampling Train: A leak in any connection will mean that some air will be pulled in through the leak and not through the flow controller. A final pressure reading near ambient is one indication that there may have been a leak. Verify Initial Vacuum of Canister: See Section 4.2 for detailed instructions on verifying initial canister vacuum. Monitor Integrated Sampling Progress: It is a good idea to monitor the progress of the sampling during the sampling interval. The volume of air sampled is a linear function of the canister vacuum. For example, halfway (four hours) into an eight-hour sampling interval, the canister should be half filled (2.5 L), and the gauge should read approximately 17 inches Hg. More vacuum than 17 inches Hg indicates that the canister is filling too slowly; less than 17 inches Hg and the canister is filling too quickly. If the canister is filling too quickly because of a leak or incorrect flow controller setting, corrective action can be taken. Ensuring all connections are tight may eliminate a leak. It is possible to take an intermittent sample. Avoid Contamination: Flow controllers should be cleaned between uses. This is done by returning them to the laboratory. Caution Against Sampling in Extreme Temperatures: There can be some flow rate drift if the temperature of the controllers is allowed to vary significantly.

Remediation Division Standard Operating Procedure
Date: April 30, 2012
Indoor Air Sampling Procedure Via USEPA Method TO-15
Page 10 of 23
5.4 Step-by-Step Procedures for Integrated Sampling
These procedures are for a typical air sampling application and must be documented; actual field conditions and procedures may vary. Before Arriving at the Field
1. Verify contents of the shipped package (e.g., Chain of Custody, canister, particulate filter, and flow controller)
2. Verify the gauge is working properly 3. Verify the initial vacuum of the canister
It is important to check the vacuum of the canister prior to use. The initial vacuum of the canister should be greater than -26 inches Hg. If the canister vacuum is less than -26 inches Hg, do not use it. Vacuum Verification The procedure to verify the initial vacuum of a canister is simple but unforgiving:
1. Confirm the valve is closed (knob should already be tightened clockwise) 2. Remove the brass cap 3. Attach gauge 4. Attach brass cap to side of gauge tee fitting, if one is not already there, to ensure a closed train 5. Open and close valve quickly (a few seconds) 6. Read vacuum on the gauge 7. Record gauge reading on “Initial Vacuum” column of Chain of Custody 8. Verify the canister valve is closed and remove gauge 9. Replace the brass cap
Sample Collection
1. Confirm the valve is closed (knob should already be tightened clockwise) 2. Remove brass cap from canister 3. Attach flow controller to canister 4. Place the brass cap at the end of the flow controller creating an airtight train, and quickly open and close
the canister valve in order to check for leaks. If the needle on the gauge drops, your train is not airtight. In this case, try refitting your connections and/or tightening them until the needle holds steady.
5. Once the sample train is airtight, remove the brass cap from the flow controller and open the canister valve, one-half turn.
6. Monitor integrated sampling progress periodically 7. Verify and record final vacuum of canister (simply read built-in gauge) 8. Close valve by hand tightening knob clockwise 9. Replace brass cap 10. Fill out canister sample tag (make sure the sample identification (ID) and date of collection recorded on
the sample tag matches what is recorded on the COC exactly). 11. Return canisters in boxes provided 12. Return sample media in packaging provided

Remediation Division Standard Operating Procedure
Date: April 30, 2012
Indoor Air Sampling Procedure Via USEPA Method TO-15
Page 11 of 23
13. Fill out chain-of-custody and relinquish samples properly (it is important to note the canister serial numbers on the chain-of-custody)
14. Place Chain of Custody in box and retain copy 15. Tape box shut and affix custody seal at each opening (if applicable) 16. Ship accordingly to meet method holding times
The final vacuum of a six L canister should be between five and ten inches Hg and the final vacuum should be noted on the Chain of Custody. This will enable the laboratory to compare the final vacuum with the receipt vacuum (i.e., the vacuum measured upon arrival at the laboratory). Important Information for Canister Sampling
DO NOT use a canister to collect explosive substances, radiological or biological agents, corrosives, extremely toxic substances, or other hazardous materials. It is illegal to ship such substances.
ALWAYS use a filter when sampling.
NEVER allow liquids (including water) or corrosive vapors to enter canister.
DO NOT attach labels to the surface of the canister or write on the canister.
DO NOT over-tighten the valve and remember to replace the brass cap. 6.0 REFERENCES Hayes, H. 2007. Canister and Bag Sampling Guide. Air Toxics Ltd. Publication, Revision 5, March 2007,
http://www.airtoxics.com/literature/AirToxicsLtdSamplingGuide.pdf. United States Environmental Protection Agency. 1999. Compendium of Methods for the Determination of Toxic
Organic Compounds in Ambient Air. Second Edition. Compendium Method TO-15 Determination of Volatile Organic Compounds (VOCs) in Air Collected in Specially-Prepared Canisters and Analyzed By Gas Chromatography/Mass Spectrometry (GC/MS). Center for Environmental Research Information, Office of Research and Development, United States Environmental Protection Agency. Document No. EPA/625/R-96/010b.
Remediation Division Standard Operating Procedure
Date: April 30, 2012
Indoor Air Sampling Procedure Via USEPA Method TO-15
Page 12 of 23
ATTACHMENT 1
INDOOR AIR SAMPLING EVENT INSTRUCTIONS
and
INDOOR AIR BUILDING SURVEY AND SAMPLING FORM

Remediation Division Standard Operating Procedure
Date: April 30, 2012
Indoor Air Sampling Procedure Via USEPA Method TO-15
Page 13 of 23
Instructions for Occupants
INDOOR AIR SAMPLING EVENTS will be collecting one or more indoor air samples from your building in the near future. In order to collect an indoor air sample in your structure that is both representative of indoor conditions and avoids the common sources of background air contamination associated with household activities and consumer products, your assistance is requested. Please follow the instructions below starting at least 48 hours prior to and during the indoor air sampling event:
Operate your furnace and whole house air conditioner as appropriate for the current weather conditions.
Do not use wood stoves, fireplaces, or auxiliary heating equipment.
Do not open windows or keep doors open.
Avoid using window air conditioners, fans, or vents.
Do not smoke in the building.
Do not use air fresheners or odor eliminators.
Do not use paints or varnishes (up to a week in advance, if possible).
Do not use cleaning products (e.g., bathroom cleaners, furniture polish, appliance cleaners, all-purpose cleaners, floor cleaners).
Do not use cosmetics, including hair spray, nail polish remover, perfume, etc.
Avoid bringing freshly dry-cleaned clothes into the building.
Do not partake in hobbies indoors that use solvents.
Do not apply pesticides.
Do not store containers of gasoline, oil, or petroleum based or other solvents within the building or attached garages (except for fuel oil tanks).
Do not operate or store automobiles in an attached garage.
Do not operate gasoline powered equipment within the building, attached garage, or around the immediate perimeter of the building.
You will be asked a series of questions about the structure, consumer products you store in your building, and household activities typically occurring in the building. These questions are designed to help us differentiate chemical vapors from your household products from those related to subsurface contamination. Additionally, the analyte list may include only a select few target analytes and not a “wide variety of chemicals.” Various compounds found in common household products (such as paint, new carpeting, nail polish remover), might be found in your sample results. Your cooperation is greatly appreciated. If you have any questions about these instructions, please feel free to contact: ___________________________________________________________________________________________
_________________________________________________________________________________________________

Remediation Division Standard Operating Procedure
Date: April 30, 2012
Indoor Air Sampling Procedure Via USEPA Method TO-15
Page 14 of 23
INDOOR AIR BUILDING SURVEY AND SAMPLING FORM Date: Survey Performed by: 1. OCCUPANT: Rent: _____ Own: _____ Resident Name: ___________________________________________________________ Address: _______________________________________________________________ Telephone: Home: ______________________ Work: ________________________ How long have you lived at this location? _________________________ List current occupants/occupation below (attach additional pages if necessary):
Age (If under 18)
Sex (M/F)
Occupation
2. OWNER OR LANDLORD: (If same as occupant, check here ___ and go to Item No. 3). Last Name: ______________________________ First Name: _____________________ Address: City and State: County: Home Phone: ___________________________ Office Phone: ________________________

Remediation Division Standard Operating Procedure
Date: April 30, 2012
Indoor Air Sampling Procedure Via USEPA Method TO-15
Page 15 of 23
INDOOR AIR BUILDING SURVEY AND SAMPLING FORM (continued)
3. SENSITIVE POPULATION:
Daycare/Nursing Home/Hospital/School/Other (specify): ________________________ 4. BUILDING CHARACTERISTICS:
Residential/Multi-family Residential/Office/Strip Mall/Commercial/Industrial/School Describe Building: ___________________________________ Year Constructed: ______ Number of floors at or above grade: ______ Number of floors below grade: _______ (full basement/crawl space/slab on grade) Depth of structure below grade: _______ ft. Basement size: ________ ft2
If the property is residential, what type? (Circle all appropriate responses.) Ranch 2-Family 3-Family Raised Ranch Split Level Colonial Cape Cod Contemporary Mobile Home Duplex Apartment House Townhouses/Condos Modular Log Home Other: _________________________________ If multiple units, how many? ________
If the property is commercial: Business type(s) _____________________________________________ Does it include residences (i.e., multi-use)? Yes No If yes, how many? _____
5. OCCUPANCY:
Is basement/lowest level occupied? (Circle one) Full-time Occasionally Seldom Almost Never

Remediation Division Standard Operating Procedure
Date: April 30, 2012
Indoor Air Sampling Procedure Via USEPA Method TO-15
Page 16 of 23
INDOOR AIR BUILDING SURVEY AND SAMPLING FORM (continued)
Level General Use (e.g., family room, bedroom, laundry, workshop, storage) Basement _________________________________________________________ 1st Floor _________________________________________________________ 2nd Floor _________________________________________________________ 3rd Floor _________________________________________________________ 4th Floor _________________________________________________________
(Use additional page(s) as necessary)
6. CONSTRUCTION CHARACTERISTICS: (Circle all that apply.) a. Above Grade Construction: (Describe type: wood frame, concrete, stone, brick). b. Basement Type: Full Crawlspace Slab Other: __________ c. Basement Floor: Concrete Dirt Stone Other: __________ d. Finished Basement Floor: Uncovered Covered
If covered, what with? ___________________________________________ e. Foundation Walls: Poured Block Stone Other: __________ f. Foundation Walls: Unsealed Sealed Sealed with: ______________ g. The Basement is: Wet Damp Dry h. The Basement is: Finished Unfinished Partially Finished i. Sump Present (Y / N) If yes, how many? __________________
Where Discharged? ______________________________
Water in Sump? Yes No Not Applicable

Remediation Division Standard Operating Procedure
Date: April 30, 2012
Indoor Air Sampling Procedure Via USEPA Method TO-15
Page 17 of 23
INDOOR AIR BUILDING SURVEY AND SAMPLING FORM (continued) Identify all potential soil vapor entry points and estimated size (e.g., cracks, utility parts, drains).
Are the basement walls or floor sealed with waterproof paint or epoxy coatings? Yes No Type of ground cover outside of building: Grass Concrete Asphalt Other _________ Is an existing subsurface depressurization (radon) system in place? Yes No If yes, is it active, or passive? Is a sub-slab vapor/moisture barrier in place? Yes No Type of barrier: ___________________________________________________________________________ 7. HEATING, VENTING, and AIR CONDITIONING Type of heating system(s) used in this building: (Circle all that apply: Note the primary).
Hot Air Circulation Heat Pump Hot Water Baseboard Space Heaters Steam Radiation Radiant Floor Electric Baseboard Wood Stove Outdoor Wood Boiler Other:
The primary type of fuel used is:
Natural Gas Fuel Oil Kerosene Electric Propane Solar Wood Coal
Domestic hot water tank fueled by: _________________________________________________________________ Location of Boiler/Furnace: Basement Outdoors Main Floor Other _______________

Remediation Division Standard Operating Procedure
Date: April 30, 2012
Indoor Air Sampling Procedure Via USEPA Method TO-15
Page 18 of 23
INDOOR AIR BUILDING SURVEY AND SAMPLING FORM (continued) Air Conditioning: Central Air Window Units Open Windows None Are air distribution ducts present? Yes No Is there a whole house fan? Yes No Describe the air intake system (outside air supply, cold air return, ductwork, etc.) and its condition where visible. Indicate the locations on the floor plan diagram.
8. FACTORS THAT MAY INFLUENCE INDOOR AIR QUALITY
a) Is there an attached garage? Yes No
If yes, does it have a separate heating unit? Yes No
b) Are any petroleum-powered machines or vehicles stored in an attached garage (e.g., lawn mower, ATV, car) Yes No
c) Has the building ever had a fire? Yes No
d) Is there a fuel burning or unvented gas space heater? Yes No
e) Is there a workshop or hobby/craft area? Yes No
If yes, where and what type? ______________________________________________________________
f) Is there smoking in the building? Yes No
If yes, how frequently? ___________________________________________________________________

Remediation Division Standard Operating Procedure
Date: April 30, 2012
Indoor Air Sampling Procedure Via USEPA Method TO-15
Page 19 of 23
INDOOR AIR BUILDING SURVEY AND SAMPLING FORM (continued)
g) Have cleaning products been used recently? Yes No
If yes, when and what type? _______________________________________________________________
h) Have cosmetic products been used recently? Yes No
If yes, when and what type? _______________________________________________________________
i) Has there been painting or staining in the last six months? Yes No
If yes, when and where? __________________________________________________________________
j) Is there new carpet, drapes, or other textiles? Yes No
If yes, when and where? __________________________________________________________________
k) Have air fresheners been used recently? Yes No
If yes, when and what type? ______________________________________________________________
l) Is there a kitchen exhaust fan? Yes No
If yes, where is it vented? _________________________________________________________________
m) Is there a clothes dryer? Yes No
If yes, is it vented outside? Yes No
n) Has there been a pesticide application? Yes No
If yes, when and what type? _______________________________________________________________ _____________________________________________________________________________________
o) Are there odors in the building? Yes No
If yes, please describe: ___________________________________________________________________ _____________________________________________________________________________________

Remediation Division Standard Operating Procedure
Date: April 30, 2012
Indoor Air Sampling Procedure Via USEPA Method TO-15
Page 20 of 23
INDOOR AIR BUILDING SURVEY AND SAMPLING FORM (continued)
p) Do any of the building occupants use solvents at work (e.g., chemical manufacturing or laboratory, auto mechanic or auto body shop, painting, fuel oil delivery, boiler mechanic, pesticide application, cosmetology)?
Yes No
If yes, what types of solvents are used? ______________________________________________________ _____________________________________________________________________________________
If yes, are their clothes washed at work? Yes No
q) Do any of the building occupants regularly use or work at a dry-cleaning service? (Circle appropriate response.)
No Unknown
Yes, use dry-cleaning regularly (weekly)
Yes, use dry-cleaning infrequently (monthly or less)
Yes, work at a dry-cleaning service
r) Is there a radon mitigation system for the building/structure? Yes No
If yes, what is date of installation? _________________ Active Passive
s) Additional mitigation system information (fan size, location, operating status, liner installed, etc.):
_____________________________________________________________________________________ _____________________________________________________________________________________
_____________________________________________________________________________________ _____________________________________________________________________________________

Remediation Division Standard Operating Procedure
Date: April 30, 2012
Indoor Air Sampling Procedure Via USEPA Method TO-15
Page 21 of 23
INDOOR AIR BUILDING SURVEY AND SAMPLING FORM (continued) 9. SAMPLE COLLECTION This is to be completed by the sample collection team. On a separate sheet(s), provide a sketch of the building (including each floor as applicable), all (nonremovable) potential indoor sources found in the building (including attached garages), the location of the source (floor and room), and each sample location (see below). Any ventilation implemented after removal of potential sources shall be completed at least 24 hours prior to the commencement of the indoor air sampling event. Photographs should be taken at each sample location, and of any nonremovable source, to supplement the documentation recorded below. The photographs must be of good quality and any labels must be legible.
Location Sample ID Sample
Container Size
Sample Duration
Flow Rate Verification
(Y / N) Comments
Sampling Information: Sample Technician: _______________________________ Telephone No.:_________________ Analytical Method: TO-15 / TO-17 / Other: _________________________________________ Laboratory: ____________________________________________________________________

Remediation Division Standard Operating Procedure
Date: April 30, 2012
Indoor Air Sampling Procedure Via USEPA Method TO-15
Page 22 of 23
INDOOR AIR BUILDING SURVEY AND SAMPLING FORM (continued)
Were “Instructions for Occupants” followed? Yes No
If not, describe modifications:
_____________________________________________________________________________________ _____________________________________________________________________________________
_____________________________________________________________________________________ _____________________________________________________________________________________
Was field screening performed? Yes No
If yes, describe Make and Model of field instrument used: _____________________________________________________________________________________
Meteorological Conditions Was there significant precipitation within 12 hours prior to (or during) the sampling event? Yes No Describe the general weather conditions:
_____________________________________________________________________________________ _____________________________________________________________________________________
_____________________________________________________________________________________ _____________________________________________________________________________________
General Observations: Provide any information that may be pertinent to the sampling event and may assist in the data interpretation process:
_____________________________________________________________________________________ _____________________________________________________________________________________
_____________________________________________________________________________________

Remediation Division Standard Operating Procedure
Date: April 30, 2012
Indoor Air Sampling Procedure Via USEPA Method TO-15
Page 23 of 23
_____________________________________________________________________________________
BUILDING: _________________________
FLOOR: ___________________________
ATTACH ADDITIONAL DETAIL AS NECESSARY

APPENDIX F.5
Dynamic Flux Chamber Method for Monitoring Soil Surface Emission
Rates
Special thanks for assistance: Blayne Hartman – Hartman Environmental Geoscience Michael O’Hearn – AMEC E & I, Inc.


Remediation Division Standard Operating Procedure
Date: April 30, 2012
Dynamic Flux Chamber Method For Monitoring Soil Surface Emission Rates
Page 2 of 12
PLEASE NOTE: This SOP was developed based on a compilation of available information, knowledge, field experience, and general industry practices to provide guidance to the Michigan Department of Environmental Quality (MDEQ) staff and their contractors conducting investigations and remedial activities at sites with known or potential vapor intrusion issues. The SOP was created to promote a consistent, informed, and practical approach for the MDEQ staff to follow that achieves the performance standards required by Part 201, Environmental Remediation, of the Natural Resources and Environmental Protection Act, 1994 PA 451, as amended (NREPA), and Part 213, Leaking Underground Storage Tanks, of the NREPA. The methods outlined in this document will produce reliable data that can support the various decisions required throughout the environmental process. This SOP is available as a technical reference that may be informative when conducting work at sites where vapor intrusion issues are of concern and may be used as a reference for those conducting vapor intrusion evaluations under Part 201 or Part 213. Differences may exist between the procedures referenced in this SOP and what is appropriate under site-specific conditions. This SOP is not intended to prohibit those conducting evaluations from using means other than those specified herein to measure soil gas concentrations; however, departures from this guidance will often need to include information for a more detailed review. The MDEQ is not responsible for the misuse or misinterpretation of the information presented herein. Please note that because the SOP was written for the MDEQ staff, it may contain references to specific equipment for field investigations that the MDEQ currently uses. Such references do not represent endorsements of particular vendors.

Remediation Division Standard Operating Procedure
Date: April 30, 2012
Dynamic Flux Chamber Method For Monitoring Soil Surface Emission Rates
Page 3 of 12
1.0 INTRODUCTION This SOP outlines the MDEQ’s method and considerations for Dynamic Flux Chamber sampling and is based on the methodology outlined by Radian, 1986, with consideration of issues identified by Eklund, 1992 and Hartman, 2003. Volatile organic compounds (VOCs) in contaminated soil have the potential to migrate into ambient or indoor air where they may be inhaled by people or animals. The rate at which a vapor-phase chemical crosses the soil-air interface is called the contaminant “flux” rate, which is measured as mass per unit area per unit time (e.g., micrograms of contaminant per square meter of soil surface per minute). Contaminant flux rates can be estimated based on general assumptions about chemical characteristics, partitioning, soil conditions, diffusion rates, and attenuation, among other things (Radian, 1986). However, flux estimates based on mathematical models may not be sufficiently accurate for assessing risks in some circumstances. In such cases, the isolation flux chamber method can be used to directly measure the contaminant’s concentration at the soil-air interface as well as the rate at which the compound moves from soil to air. The isolation flux chamber approach uses an enclosure device, referred to as a flux chamber, to sample gaseous emissions from a defined surface area. The chambers may be used with a flow of sweep gas through the chamber (a “dynamic” test) or without a flow of sweep gas (a “static” test). With the dynamic-chamber method, a clean, dry sweep gas (e.g., high-purity “zero” air) is introduced to the chamber at a fixed, controlled rate (e.g., 0.005 cubic meters per minute (m3/min)) that is selected based on site conditions. The volumetric flow rate of sweep air through the chamber is recorded, and the concentrations of the VOCs of interest are measured at the exit port of the chamber (Eklund, 1992). As the flux chamber isolates the soil surface from external site conditions, the potential impacts of many meteorological conditions that may be highly variable throughout the day are minimized. The emission rate of each contaminant can be calculated as:
EF1 = C1 * Q / A (1) where:
EF1 = emission rate of contaminant 1 (micrograms per square meter per minute (ug/m2 –min)) C1 = measured concentration of contaminant 1 (units must be micrograms per cubic meter (ug/m3])) Q = sweep airflow rate (m3/min) A = surface area (m2) enclosed by flux chamber
In this method, all parameters in Equation 1 are measured directly through the collection of air samples exiting the chamber. The use of this equation assumes that: (1) the chamber is operating under steady state (i.e., the rate of air flow through the chamber is constant and not a function of time); (2) contaminant flux is uniform over the entire covered surface and relatively constant during the sampling interval of (t2 – t1); (3) the incoming air stream and the emissions from the soil are well mixed inside the chamber; and (4) the diffusive process is dominant and the advective mass flow from the soil is negligible (Gao et al., 1997).

Remediation Division Standard Operating Procedure
Date: April 30, 2012
Dynamic Flux Chamber Method For Monitoring Soil Surface Emission Rates
Page 4 of 12
2.0 GENERAL CONSIDERATIONS FOR FLUX CHAMBER SAMPLING As with any environmental sampling effort, the overall goal of flux chamber sampling is to obtain representative samples. Care should be taken to avoid cross-contamination or other poor field practices that could bias the analytical data either high or low. Each sampling event must be guided by a sampling and analytical plan prepared in advance and all field conditions and methodology must be documented. The sampling and analytical plan must contain a discussion of the following:
Equipment – The typical flux chamber is a hemispherical “bowl” or cylinder fitted with a number of small-diameter ports for controlling the flow of gas into and out of the chamber and for measuring the temperature, pressure, or other conditions inside the chamber. See Figure 1. Flux chambers should be constructed from stainless steel or polycarbonate; flexible plastic materials are unacceptable. Various sample trains can be attached to an outlet port to collect samples for analysis in the field or at a fixed laboratory. See Section 3.0 for more information on the construction of a flux chamber.
Figure 1 Dynamic flux chamber before deployment.
Sealing the Chamber – When measuring the flux from the soil surface, the edge of the chamber should be pushed approximately two centimeters (cm) into the soil to minimize the entry of ambient air around the edge of the chamber. In compacted soil or similar locations where a reasonably tight seal may be difficult to achieve in this way, hydrated bentonite should be placed around the edge of the chamber to improve the seal and prevent leakage.
Background Concentrations – To the extent practicable, avoid collecting samples near potential sources of VOCs in ambient air that could enter the flux chamber and affect the results (e.g., motor vehicle exhaust, gasoline and other fuels, aerosol sprays, marking pens, adhesive tape, insect repellent, sunscreen, etc.). Note the presence of such factors in the field documentation.
Time of Deployment – It is necessary to make a series of flux measurements in several locations to assess the spatial variability in emissions for a given source. It is also important that repeated measurements at a given location are performed to assess the temporal variability (Eklund, 1992). The collection of this data allows an estimation of an emission rate with a known confidence limit.
Sweep Air – The sweep air carrier gas should be dry, organic-free air, equal to or better than commercial ultrahigh-purity grade (less than 0.01 parts per million by volume total hydrocarbons).
Sweep Airflow Rate – This is perhaps the single most important operating factor. The sweep airflow rate can be varied to achieve the desired analytical sensitivity. The slower the flow rate, the lower the

Remediation Division Standard Operating Procedure
Date: April 30, 2012
Dynamic Flux Chamber Method For Monitoring Soil Surface Emission Rates
Page 5 of 12
detection limits, but the longer it will take to reach steady-state concentrations within the chamber. However, the sweep airflow rate must be high enough to ensure that good mixing occurs within the chamber and to create sufficient turbulence to disrupt any laminar film boundary that may form above the soil surface. It is generally recommended that the sweep airflow rate be established based on a ratio of 25 liters of air per minute per square meter (L/min/m2) of exposed surface area (St. Croix Sensory, Inc., 2010). The sweep gas must be allowed to exit at the same rate at which it is added to prevent a buildup of pressure or the formation of a vacuum inside the chamber, which would alter the flux rate and bias the data.
Chamber Purging – The residence time (T) is defined as the chamber volume divided by the sweep air flow rate. It typically takes three to four residence times before steady-state concentrations are reached inside the chamber and sampling can be initiated. For example, a 0.030 m3 chamber with a sweep air flow rate of 0.005 m3/min has a residence time of six minutes, which means that sample collection can be started 24 minutes after the chamber is placed on the surface.
Sampling Time – The minimum sampling time necessary is that time required to approach a steady-state concentration within the flux chamber (at least three to four residence times). The maximum acceptable sampling time will depend on the nature of the emission source and the objectives of the monitoring program. In general, whenever possible the sampling duration for soil should be held to
30 to 60 minutes.
Sampling Rate – The sampling rate (i.e., the rate at which the gas sample is withdrawn from the discharge line) should be less than the flow rate of sweep gas. Otherwise, the outside air would be drawn into the chamber to dilute the sampling gas, which may result in inaccuracy of calculated emissions. Therefore, the sampling rate must be equal to or less than 0.75 times the flow rate of sweep gas.
Environmental Conditions – Emission rates from soil immediately after a significant rainfall event typically will be lower than from drier soils, as a greater portion of the soil pore space is blocked by water. It is not acceptable for flux chamber sampling to occur for several days after a minor rain event and for up to seven days after 0.3 inches of rain or more has fallen (Radian, 1986). Barometric pressure has also been documented to have an effect on emission rate - higher emission rates are found during periods of lower atmospheric pressure. An effort should be made to avoid flux chamber sampling during periods of unusually high or low barometric pressure. Historical barometric pressure measurements should be reviewed to establish a normal range for the area and weather forecasts should be consulted during the project planning stage.
Chamber Pressure and Temperature – The pressure and temperature inside the flux chamber should be kept as close to ambient conditions as possible. The temperature inside and outside of the flux chamber must be recorded several times during the sampling event and each time a sample is drawn from the chamber.
Analytical Techniques – Assessing VOC emissions from soil using flux chambers is done by the USEPA TO-15 Method(USEPA, 1999) via Bottle-Vac®. This method provides the typical reporting limit of 0.1 to 0.001 micrograms per liter.
Sample Collection Intervals – In addition to the initial (t0) sample, at least three flux chamber samples should be collected at the same grid coordinates throughout the day to evaluate the daily variation of flux. If a 95 percent upper confidence limit is to be used in future calculations for determining an emission rate, then an appropriate number of samples (e.g., a minimum of nine samples) must be collected from each location.

Remediation Division Standard Operating Procedure
Date: April 30, 2012
Dynamic Flux Chamber Method For Monitoring Soil Surface Emission Rates
Page 6 of 12
FLUX CHAMBER CONSTRUCTION AND DESIGN Flux chamber data can be significantly affected by chamber design and the rules-of-thumb applicable to one design may or may not be applicable to an alternate design (Eklund, 1992). As a result, widely different design and operating practices can produce significantly different results. This section is included as a general guide to the construction of flux chambers, additional information can be found in Eklund, 1992. Important design factors include chamber size, volume, geometry, construction materials, length of sampling lines, line construction, and air delivery system, some of which are described further below. Figure 2 represents a generic construction diagram and its supporting equipment as depicted by Radian, 1986.
Figure 2 Flux chamber construction diagram
3.1. Chamber Size and Volume
In general, flux chamber sampling results are not heavily dependent on the chamber size and volume. The chamber size used is a trade-off among several considerations. The surface area enclosed should be as large as is feasible so that the observed emission flux is not unduly biased by relatively small areas of unrepresentative emissions, the areas perturbed by the chamber edge or seal are a small percentage of the total sampling area, and the wall effects are minimal (Eklund, 1992). A smaller chamber volume may be advantageous since it minimizes the amount of sweep air used per measurement, is lightweight and easier to transport, and is simpler to fabricate. The volume should be large enough, however, that the volume of gas withdrawn for analysis is a small fraction of the volume in the flux chamber (i.e., the collection of samples from the discharge line does not significantly perturb the chamber atmosphere or pressure). As a general rule of thumb, flux chambers should not be smaller than 0.0074 m3.

Remediation Division Standard Operating Procedure
Date: April 30, 2012
Dynamic Flux Chamber Method For Monitoring Soil Surface Emission Rates
Page 7 of 12
3.2 Materials of Construction Typically, the flux chamber is constructed with a cylindrical skirt of stainless steel that has the necessary rigidity to be pushed into the soil with a dome made of polycarbonate, acrylic, or stainless steel. Preferably, all components in contact with the gas are glass, Teflon®, or stainless steel. The sampling lines used for gas sample collections are typically Teflon® with stainless steel fittings. Based on this construction (and assuming the chamber is cleaned between sampling events), the carry-over of the VOCs from the chamber has never proven to be a problem under field conditions. In addition, sorption of the VOCs has typically not been found to be a problem, although adsorption onto long Teflon® lines (e.g., greater than three meters) is a potential concern, as is adsorption of polar VOCs such as methanol and acetone onto chamber surfaces (Eklund, 1992).
3.3 Air Delivery System The introduction of sweep air into the flux chamber is perhaps the most important design factor. The air delivery system consists of a cylinder of compressed air fitted with a pressure regulator, small-diameter tubing, a flow meter, and small-diameter tubing inside the chamber to encourage mixing and minimize “short circuiting” between the inlet and outlet ports. Based on a typical sweep airflow rate of 0.005 m3/min, a standard 149 foot3 tank of gas should be sufficient for one flux chamber over two days of non-continuous sampling. The USEPA’s approach to the air delivery system (shown on Figure 2) is to place 0.6-cm diameter tubing around the inside of the chamber near the intersection of the cylinder and the dome. The line must contain at least four perforations spaced uniformly around the base of the entire chamber that are parallel to the soil surface to eliminate components of airflow perpendicular to the soil surface (either downward or upward) (Gao et al., 1997). 4.0 SAMPLING METHODOLOGY
4.1 Office Preparation Prior to departure for the field site, the following supplies should be assembled:
Log book
Appropriate field forms such as Soil Surface Flux Log Sheets (Attachment A) and Chain of Custody forms
Flux chambers
Sample containers with pressure regulators
Cylinder of compressed zero-air or nitrogen
Flow meters
Ground probe or rod (minimum of three feet in length)
Clean tubing and fittings
Ground tarp or plastic
Weather station for measuring ambient temperature, barometric pressure, and relative humidity
Temperature probes
Handheld VOC detector
Laptop computer with charged internal battery and a sufficient number of charged external batteries to last over the sampling period

Remediation Division Standard Operating Procedure
Date: April 30, 2012
Dynamic Flux Chamber Method For Monitoring Soil Surface Emission Rates
Page 8 of 12
In addition, it is important to confirm that the volume of the flux chamber is several times greater than the volume of the container (e.g., SUMMA canister or “Bottle-Vac®”) used to collect the sample. Flux chamber volumes of ten liters or greater are typical. Flux chambers must be cleaned using Alconox (or equivalent) and/or heated and then wrapped in aluminum foil for transport.
4.2 Field Procedures
1. Sample locations must be cleared of all vegetation, gravel, or manmade surfaces (concrete, asphalt) to a depth where the upper soil horizon is visible. Where pavement or asphalt must be cut to access the soil surface, the hole will be sized to allow at least 6 to 12 inches of open area around the chamber. Locations where soil pores are likely to be plugged (e.g., by standing water or extreme compaction) will be recorded in the field notes and avoided.
2. At each location identified in the sampling plan, a probe will be pushed into the ground to a depth of at least two feet to check for the presence of buried foundations or pavement that could limit vapor migration and emissions.
3. Unwrap and inspect the flux chamber. Any residue should be removed using high pressure steam, then rinsed, and dried before use. Wipe the flux chamber clean using a clean cloth.
4. Position the flux chamber on the substrate at the sample location. The rim of the flux chamber should be worked into the surface a minimum of one inch (2 to 3cm) to minimize ambient air intrusion. If a seal between the soil and the chamber cannot be established, hydrated bentonite should be placed around the edge of the chamber.
5. Attach all sampling lines and meters to the flux chamber (and to the sample canister) using a clean, 1/8 or 1/4 inch Teflon® or stainless steel tubing with Swagelok® (or equivalent) valve fittings.
6. Prepare all necessary equipment and supplies. Sample containers, equipment, and supplies should not be placed directly on the ground, on top of waste containers (e.g., drums), or on other potentially contaminated surfaces. Disposable tarps or construction plastic can be spread on the ground downwind from the chamber to provide a clean surface for temporary placement of the sampling equipment.
7. Seal all probes and access points, and/or close off all tubing so that the flux chamber is isolated from the ambient air, with the exception of the exhaust/sampling port, which should remain open.
8. Connect the flux chamber to the sweep air through the inlet port. 9. Record the air temperature inside the flux chamber, the air temperature outside the flux chamber, and the
barometric pressure. 10. Open the chamber inlet valve and begin airflow into the chamber at a predetermined rate. 11. For each chamber volume (residence time) record the flow rate, internal temperature, and reading collected with
the handheld VOC detector. 12. Monitor emissions and note when steady-state concentrations are reached (approximately 3 to 5 residence
times). 13. Record the air temperature inside the flux chamber, the air temperature outside the flux chamber, and the
barometric pressure and begin sample collection. 4.3 Sample Collection
1. At the designated sampling time, attach the sampling device to the tubing connected to the exhaust/sampling
port. 2. Record the starting canister vacuum and air temperature inside and outside of the flux chamber. The initial
pressure of the canister should be between -30 and -27 inches of mercury. However, the canister will be considered acceptable (useable) if the pressure reading is between -30 and -24 inches of mercury.
3. Enter the sample number on the field sample data logging form as provided in Figure 3.

Remediation Division Standard Operating Procedure
Date: April 30, 2012
Dynamic Flux Chamber Method For Monitoring Soil Surface Emission Rates
Page 9 of 12
4. Record the start time on the data sheet and open canister inlet valve slowly (in some cases, the canister will begin filling at a predetermined rate as soon as it is connected to the flux chamber). The canister grab samples typically will be collected over a 1 to 3 minute period. A slight hissing sound can be heard during sampling by placing an ear against the canister. Sample containers will remain connected to the flux chamber until the pressure gauge reads zero.
5. After the sample container is filled, close the canister inlet valve and disconnect the sample line from the canister. Some quick-connect fittings will close automatically when they are disconnected from the flux chamber.
6. Record the final pressure reading shown on the gauge attached to the canister (it should be zero). Enter this information along with the stop time on the field sample record and on the sample Chain of Custody form.
7. Enter the sample number, the serial number of the sampling device (canister or sorbent cartridge), and other requisite information on the Chain of Custody form. Label the sampling device with the sample number, date, and time.
8. Ensure that all canister valves are tight and stem nuts are sealed with Swagelok® (or equivalent) plugs before transporting sample containers to the laboratory.
4.4 Quality Assurance/Quality Control Samples
4.4.1 Equipment Blanks
One equipment blank is taken at the beginning of the day and at the conclusion of sampling for each flux chamber. This is done by placing the flux chamber on a contaminant-free stainless steel surface and sealing it around the edge with bentonite or a product like plumber’s putty that is determined to be free of potential VOCs. After the chamber is affixed to the stainless steel surface, the chamber is purged with zero-air or nitrogen and a blank sample is collected.
4.4.2 Collocated Samples
Collocated samples should be collected at the frequency indicated by the sampling plan, which for SUMMA canisters, is typically ten percent.
5.0 FORMS
Sample possession during all testing efforts must be traceable from the time of collection until the results are verified and reported. Sample custody procedures provide a mechanism for documentation of all information related to sample collection and handling to achieve this objective.
5.1 Documentation Procedures
5.1.1 Field Records
In addition to the Field Sample Data Logging Form shown in Figure 3, all field personnel will be required to keep accurate written records of their daily activities in a bound log book. All entries will be legible, written in waterproof ink, and contain accurate and inclusive documentation of an individual’s field activities, including field data and observations, any problems encountered, and actions taken to solve the problem. The type of data recorded in the field log book includes field measurements, ambient conditions, and any other information pertinent to the sample collection. Entry errors or changes will be crossed out with a single line, dated, and initialed by the person making the correction. Entries made by individuals other than the person to whom the log book was assigned will be dated and signed by the individual making the entry.

Remediation Division Standard Operating Procedure
Date: April 30, 2012
Dynamic Flux Chamber Method For Monitoring Soil Surface Emission Rates
Page 10 of 12
Figure 3. Field Sample Data Logging Form

Remediation Division Standard Operating Procedure
Date: April 30, 2012
Dynamic Flux Chamber Method For Monitoring Soil Surface Emission Rates
Page 11 of 12
5.1.2 Sample Labels
Each sample will receive a sample label that identifies the sample by a unique sample identification number. These labels are affixed to the sample container prior to the sample collection.
5.1.3 Sample Log Book A sample master log will be maintained for all samples collected. Each sample will be assigned a unique identification number, a full description of the sample, its origin, and disposition will be included in the log entry.
5.1.4 Chain of Custody Procedures
Team members collecting the samples are responsible for the care and custody of the samples until they are transferred or dispatched to the appropriate laboratory. When transferring samples, the individuals relinquishing and receiving the samples will sign, date, and note the time on the record. This record documents sample possession from the time of collection to the time the sample is dropped off at the laboratory. When the samples are received by the laboratory, the sample control officer will verify the Chain of Custody form against the samples received. If any discrepancies are observed, they will be recorded on the Chain of Custody Form and the project manager will be notified.
5.2 Shipment
All sample shipments will be accompanied by the Chain of Custody form, which identifies the contents of each crate. The person relinquishing the samples to the laboratory will request the signature of a laboratory representative to acknowledge receipt of the samples. Sample collection and shipment will be coordinated to ensure that the receiving laboratory has staff available to process the samples according to the method specifications. All shipping containers will be secured for safe transportation to the laboratory. The method of shipment, courier name(s), and other pertinent information is entered in the “Remarks” section when the samples are to be shipped (i.e., FedEx, Express Mail, etc.) instead of hand delivered.
5.2.1 Sample Handling Procedures
The objective of the sample handling procedures is to ensure that samples arrive at the laboratory intact, at the proper temperature, and free of external contamination. Sample packaging requirements for hazardous materials requiring interstate transport are defined in Title 40 of the Code of Federal Regulations (CFR), Chapter 1, Part 171. These requirements outline in detail the proper classification and transportation procedures for hazardous materials that will be used in the transporting of samples.
5.2.2 Sample Preservation
Sample preservation, storage requirements, and holding time limitations are specified in the standard analytical methods. In general, soil gas samples should be placed in a container without ice and stored at room temperature in an area away from direct sunlight.

Remediation Division Standard Operating Procedure
Date: April 30, 2012
Dynamic Flux Chamber Method For Monitoring Soil Surface Emission Rates
Page 12 of 12
6.0 REFERENCES Eklund, B. 1992. Practical Guidance for Flux Chamber Measurements of Fugitive Volatile Organic Emission Rates.
Journal of Air Waste Management Association 42:1583-1591. Gao, Fang, S. R. Yates, M. V. Yates, Jianying Gan, and F. F. Ernst. 1997. Design, Fabrication, and Application of a
Dynamic Chamber for Measuring Gas Emissions from Soil. Hartman, B. 2003. How to Collect Reliable Soil-Gas Data for Upward Risk Assessments Part 2: Surface Flux-
Chamber Method. LUSTLine #44. Kienbusch, M.R., D. Ranum. 1985. Validation of Flux Chamber Emission Measurements on Soil Surfaces. EPA,
EMSL, Contract No. 68-02-3889, Work Assignment 18. Radian Corporation under contract to the United States Environmental Protection Agency. 1986. Measurement of
Gaseous Emission Rates From Land Surfaces Using an Emission Isolation Flux Chamber, Users Guide. EPA Environmental Monitoring Systems Laboratory, Las Vegas, Nevada, EPA Contract No. 68-02-3889, Work Assignment 18. Document No. EPA/600/8-86/008. February 1986.
St. Croix Sensory, Inc. 2010. AC’SCENT® Emission Isolation Flux Hood Operation. United States Environmental Protection Agency. 1999. Compendium of Methods for the Determination of Toxic
Organic Compounds in Ambient Air, Second Edition, Compendium Method TO-14A Determination of Volatile Organic Compounds (VOCs) in Ambient Air Using Specially Prepared Canisters With Subsequent Analysis By Gas Chromatography, Center for Environmental Research Information, Office of Research and Development, USEPA, Document No. EPA/625/R-96/010b.
United States Environmental Protection Agency. 1999. Compendium of Methods for the Determination of Toxic
Organic Compounds in Ambient Air, Second Edition, Compendium Method TO-15 Determination of Volatile Organic Compounds (VOCs) in Air Collected In Specially-Prepared Canisters and Analyzed By Gas Chromatography/Mass Spectrometry (GC/MS), Center for Environmental Research Information, Office of Research and Development, USEPA, Document No. EPA/625/R-96/010b.

APPENDIX F.6
Vapor Point Naming Convention


Remediation Division Standard Operating Procedure
Date: April 30, 2012
Vapor Point Naming Convention
Page 2 of 3
PLEASE NOTE: This SOP was developed based on a compilation of available information, knowledge, field experience, and general industry practices to provide guidance to the Michigan Department of Environmental Quality (MDEQ) staff and their contractors conducting investigations and remedial activities at sites with known or potential vapor intrusion issues. The SOP was created to promote a consistent, informed, and practical approach for the MDEQ staff to follow that achieves the performance standards required by Part 201, Environmental Remediation, of the Natural Resources and Environmental Protection Act, 1994 PA 451, as amended (NREPA), and Part 213, Leaking Underground Storage Tanks, of the NREPA. The methods outlined in this document will produce reliable data that can support the various decisions required throughout the environmental process. This SOP is available as a technical reference that may be informative when conducting work at sites where vapor intrusion issues are of concern and may be used as a reference for those conducting vapor intrusion evaluations under Part 201 or Part 213. This SOP is not intended to prohibit those conducting evaluations from using means other than those specified herein to measure soil gas concentrations; however, departures from this guidance will often need to include information for a more detailed review. The MDEQ is not responsible for the misuse or misinterpretation of the information presented herein. Please note that because the SOP was written for the MDEQ staff, it may contain references to specific equipment for field investigations that the MDEQ currently uses. Such references do not represent endorsements of particular vendors.

Remediation Division Standard Operating Procedure
Date: April 30, 2012
Vapor Point Naming Convention
Page 3 of 3
1.0 SCOPE AND APPLICATION This SOP describes the MDEQ’s procedure for the naming convention for the sampling points that are installed as a vapor intrusion investigation. The naming convention is utilized to provide vital information for future sampling as most vapor points are not constructed in a manner to confirm the depth of installation. In all instances, the ultimate procedures employed must be documented. This SOP does not cover, nor is it intended to provide, a justification or rationale for when this sampling is conducted. It is assumed by using this SOP that site conditions have been fully evaluated and that the sampling location and depth meet the objectives outlined in the work plan or scope of work. 2.0 NAMING CONVENTION A vapor point must be named using a minimal of three unique number/letter designations to provide clarification and vital information for field sampling and inspection personal. Each boring has a unique number regardless of the horizontal distance between sampling points. Multiple points installed within the same boring will carry an identical numerical identification (see C below). Each of the designations are detailed below. Format:
A B C D
A (optional) – Two digit number representing the year the vapor point was installed may be utilized. B – The code VP must be utilized to represent that the point is installed as a vapor point. C – The sequential number of the point that has been installed. No numbers must be skipped or repeated even if a point is intended to replace a point that had been previously installed in the same area. D – Depth of the installed sampling point. Sub-slab or foundation samples may be designated with the optional use of an SS.
Please Note: Items B, C, and D must be included in the name of each vapor point.
Examples of naming designations:
(1) 11VP7SS Description: Vapor Point installed in 2011, the 7th Vapor Point installed in the series, and the point is installed within one foot of the floor (2) VP2 -16 Description: Vapor Point installed as the 2nd in the series, installed 16 feet below the ground surface (3) 09VP11-10 Description: Vapor Point installed in 2009, the 11th in the series, installed 10 feet below the ground surface

APPENDIX F.7
Installation of a Vapor PinTM to Support Vapor Intrusion
Investigations


Remediation Division Standard Operating Procedure
Date: April 30, 2012
Installation of a Vapor PinTM
Page 2 of 6
PLEASE NOTE: This SOP was developed based on a compilation of available information, knowledge, field experience, and general industry practices to provide guidance to the Michigan Department of Environmental Quality (MDEQ) staff and their contractors conducting investigations and remedial activities at sites with known or potential vapor intrusion issues. The SOP was created to promote a consistent, informed, and practical approach for the MDEQ staff to follow that achieves the performance standards required by Part 201, Environmental Remediation, of the Natural Resources and Environmental Protection Act, 1994 PA 451, as amended (NREPA), and Part 213, Leaking Underground Storage Tanks, of the NREPA. The methods outlined in this document will produce reliable data that can support the various decisions required throughout the environmental process. This SOP is available as a technical reference that may be informative when conducting work at sites where vapor intrusion issues are of concern and may be used as a reference for those conducting vapor intrusion evaluations under Part 201 or Part 213. This SOP is not intended to prohibit those conducting evaluations from using means other than those specified herein to measure soil gas concentrations; however, departures from this guidance will often need to include information for a more detailed review. The MDEQ is not responsible for the misuse or misinterpretation of the information presented herein. Please note that because the SOP was written for the MDEQ staff, it may contain references to specific equipment for field investigations that the MDEQ currently uses. Such references do not represent endorsements of particular vendors. .

Remediation Division Standard Operating Procedure
Date: April 30, 2012
Installation of a Vapor PinTM
Page 3 of 6
1.0 SCOPE AND APPLICATION This SOP describes the MDEQ’s procedure for installing a sub-slab soil gas probe/vapor monitoring point using a Vapor Pin™. Sub-slab soil gas samples are vapor samples collected within two feet of the floor of the lowest point of the structure and must be referenced as sub-slab soil gas samples. Though these samples may provide beneficial information to support various lines of evidence, the effects due to barometric pressure, temperature, and the potential breakthrough of ambient air from the surface have the potential to cause these samples to be less reliable than soil gas samples collected at greater depths. This SOP does not cover, nor is it intended to provide, a justification or rationale for where a sampling point is installed. It is assumed by using this SOP that site conditions have been fully evaluated and that the sampling location and depth meet the objectives outlined in the work plan or scope of work. For example, considerations must be given to the types of chemicals of concern, lithology encountered, surrounding buildings and underground structures, and the depth of the vapor source. 2.0 SAMPLING POINT INSTALLATION
1.1 Boring Advancement Borings should be through the use of a rotary hammer drill. The specific drill utilized must be capable of utilizing the drill and coring bits identified by the SOP (see below) as well as sufficient size to penetrate the expected thickness of the concrete present.
1.2 Soil Gas Well Materials (General List of Materials) This SOP utilizes products available from Cox-Colvin & Associates, Inc. Equipment needed for installation:
Vapor Pin™
Silicone sleeve
Hammer drill
5/8 inch diameter hammer bit (Hilti™ TEYX 5/8” x 22” #00206514 or equivalent)
1½ inch diameter hammer bit (Hilti™ TEYX 1½” x 23” #00293032 or equivalent) for flush mount applications
3/4 inch diameter bottle brush
Wet/dry vacuum with HEPA filter (optional)
Vapor Pin™ installation/extraction tool
Dead blow hammer
Vapor Pin™ flush mount cover, as necessary
Vapor Pin™ protective cap

Remediation Division Standard Operating Procedure
Date: April 30, 2012
Installation of a Vapor PinTM
Page 4 of 6
Equipment needed for abandonment:
Vapor Pin™ installation/extraction tool
Dead blow hammer
Volatile organic compound-free hole patching material (hydraulic cement) and putty knife or trowel
1.3 Flushmount Vapor Pin™ Installation Protocol
1) Prior to drilling holes in a foundation or slab, contact local utility
companies to identify and mark utilities coming into the building from the outside (e.g., gas, water, sewer, refrigerant, and electrical lines). Consult with a local electrician and plumber to identify the location of utilities inside the building.
2) Set up wet/dry vacuum to collect drill cuttings. 3) Drill a 1½ inch diameter hole at least 1¾ inches into the slab. 4) Remove the drill bit, brush the hole with the bottle brush, and
remove the loose cuttings with the vacuum. 5) Drill a 5/8 inch diameter hole through the slab and at least
six inches into the underlying soil to form a void. 6) Remove the drill bit, brush the hole with the bottle brush, and
remove the loose cuttings with the vacuum. 7) Assemble the Vapor Pin™ assembly (Figure 1) by threading
the Vapor Pin™ into the extraction/installation tool and placing the silicone sleeve over the barbed end.
8) Place the lower end of the Vapor Pin™ assembly into the drilled hole. Place the small hole located in the handle of the extraction/installation tool over the Vapor Pin™ to protect the barb fitting and cap, and tap the Vapor Pin™ into place using a dead blow hammer (Figure 2). Make sure the extraction/installation tool is aligned parallel to the Vapor Pin™ to avoid damaging the barb fitting.
9) Unscrew the threaded coupling from the installation/extraction handle and use the hole in the end of the tool to assist with the installation (Figure 3). During installation, the silicone sleeve will form a slight bulge between the slab and the Vapor Pin™ shoulder.
10) Place the protective cap on the Vapor Pin™ (Figure 4). 11) Cover the Vapor Pin™ with a flushmount cover. 12) Allow 20 minutes or more (consult applicable guidance for your
situation) for the sub-slab soil gas conditions to equilibrate prior to sampling.
13) Remove protective cap and connect sample tubing to the barb fitting of the Vapor Pin™.
14) Collect sample in accordance with the MDEQ’s “Sampling Utilizing USEPA Method TO-15 via Bottle-Vac® Samplers to Support Vapor Intrusion Investigations.”
Figure 1. Vapor Pin™ assembly with silicone sleeve over the barbed end
Figure 2. Installing the Vapor Pin™.
Figure 3. Flush-mount installation
Figure 4. Installed Vapor Pin™ with the protective cap

Remediation Division Standard Operating Procedure
Date: April 30, 2012
Installation of a Vapor PinTM
Page 5 of 6
Figure 5. Removing the Vapor Pin™
1.4 Temporary Vapor Pin™ Installation Protocol
1) Prior to drilling holes in a foundation or slab, contact local utility companies to identify and mark utilities coming into the building from the outside (e.g., gas, water, sewer, refrigerant, and electrical lines). Consult with a local electrician and plumber to identify the location of utilities inside the building.
2) Set up wet/dry vacuum to collect drill cuttings. 3) Drill a 5/8 inch diameter hole through the slab and at least six inches into the underlying soil to form a
void. 4) Remove the drill bit, brush the hole with the bottle brush, and remove the loose cuttings with the
vacuum. 5) Assemble the Vapor Pin™ assembly (Figure 1) by threading the Vapor Pin™ into the
extraction/installation tool and placing the silicone sleeve over the barbed end. 6) Place the lower end of the Vapor Pin™ assembly into the drilled hole. Place the small hole located in
the handle of the extraction/installation tool over the Vapor Pin™ to protect the barb fitting and cap, and tap the Vapor Pin™ into place using a dead blow hammer (Figure 2). Make sure the extraction/installation tool is aligned parallel to the Vapor Pin™ to avoid damaging the barb fitting.
7) Place the protective cap on the Vapor Pin™ (Figure 4). 8) Allow 20 minutes or more (consult applicable guidance for your situation) for the sub-slab soil gas
conditions to equilibrate prior to sampling. 9) Remove protective cap and connect sample tubing to the barb fitting of the Vapor Pin™. 10) Collect sample in accordance with the MDEQ’s “Sampling Utilizing USEPA Method TO-15 via
Bottle-Vac® Samplers to Support Vapor Intrusion Investigations.”
1.5 Abandonment
All vapor monitoring wells, including those used for soil gas monitoring, must be abandoned upon completion of site activities. Vapor wells constructed in the manner identified by this SOP may be abandoned by removing any tubing and all surface protective covers. The boring annulus can then be backfilled with uncontaminated native material or grout and returned as close as possible to the original site conditions. The Vapor Pin™ is designed to be used repeatedly; however, replacement parts and supplies will be required periodically. If the tubing cannot be removed, the tubing should be cemented in place. All surface protective covers must be removed and returned to as close as possible to the original site conditions.
Extraction procedure: 1) Remove the protective cap and thread the
installation/extraction tool onto the barrel of the Vapor Pin™ (Figure 5) and continue turning the tool to assist in extraction, then pull the Vapor Pin™ from the hole.
2) Fill the void with hydraulic cement and smooth with the trowel or putty knife.
3) Prior to reuse, remove the silicone sleeve and discard. 4) Decontaminate the Vapor Pin™ in a hot water and Alconox®
wash, then heat in an oven to a temperature of 130o Celsius.

Remediation Division Standard Operating Procedure
Date: April 30, 2012
Installation of a Vapor PinTM
Page 6 of 6
3.0 SOIL BORING LOGS AND VAPOR COMPLETION DIAGRAM Boring logs and diagrams may be completed utilizing a variety of programs. The following information must be included for every sub-slab vapor point installed:
Project information
Boring location
Date installed
Total depth
Thickness of concrete
Project personnel including drilling contractor, driller, and geologist
Boring diameter
Soil description (if identified)
Field screening performed
A diagram representing installed sampling point that includes: o Surface completion o Seal used o Probe and screen construction materials and specifications o Depth of all installed materials including screen, bottom of screen, sand pack, and tubing
4.0 REFERENCES Though not specifically referenced, the SOP is based upon the SOP by Cox-Colvin & Associates, Inc. with some modifications.

Appendix G – Laboratory Quality Assurance and Quality Control for Vapor Intrusion Data Each laboratory analyzing samples by Method TO-15 shall follow the method as defined by the United States Environmental Protection Agency in the EPA/625/R-96/010b dated January 1999 or subsequent updates or revisions. Additional details and/or modifications are included in the following:
Section A – Method TO-15 Standard
Section B – Method TO-15 Modified for Bottle-Vac® Air Samplers by Entech Instruments, Inc.
Special thanks for assistance: Fibertec Environmental Services

Appendix G.1 – Page 1 of 4
Section A – Method TO-15 Standard
1. The laboratory shall supply the following data with each report: a. All results from analysis of the method blank should be less than the reporting limits. If concentrations are
reported above the reporting limits, the laboratory will document this occurrence within the narrative and flag any concentration reported above the reporting limit for this compound up to ten times the level measured in the blank. The area responses for the internal standards (ISs) must be within ± 50 percent of the area response of the ISs of the mean area response of the most recent calibration. The response time (RT) for each IS must be within ± 0.33 minutes between the blank and the most recent calibration. Method blanks shall be run every 20 environmental samples or once per day, whichever is more frequent.
b. Laboratory Control Sample (LCS): The laboratory will report the percent of recoveries from all analytes spiked into the LCS. One LCS will be run within each 24-hour period of Method TO-15 samples analyzed.
c. The narrative of the laboratory report will define if the initial calibration curve, continuing calibration check sample (when appropriate), and internal quality assurance (such as ISs, blanks, etc.), and the receipt of the samples met the method requirements for each report.
d. The chromatogram for each analysis will be available electronically and the data will have at least 50 percent of the compounds identified in Appendix C clearly identified.
e. The laboratory shall report the results using the field sample identification (ID) and the associated laboratory sample number.
f. The laboratory shall report all compounds in units of micrograms per cubic meters (μg/m3) at the standard temperature and pressure (STP).
g. The laboratory report must contain the following information: Cover sheet with signature of a laboratory supervisor or designee, a narrative discussing the sample results and any irregularities that were found during the analysis, Chain of Custody and sample condition upon receipt forms, tables containing the volatile organic compounds (VOCs), the chemical abstract service (CAS) number of each reported compound, measured concentration in μg/m3, reporting limit, date of analysis, method blank data for the batch, assigned regulator, flow rate, and a summary of applicable quality control.
2. The laboratory is required to maintain the data for a minimum of ten years with the ability to reconstruct the data either via a computer or paper.
3. Laboratories must verify their reporting limits by running a standard at the reporting limit once every month. The recovery of the reporting limit shall be +/- 40 percent of the true value or limit of quantification (LOQ) as defined by the National Environmental Laboratory Accreditation Conference (NELAC).
4. Laboratories shall verify their calibration curve a minimum of every 24 hours. The 24-hour clock will begin at the injection of a standard for tuning the instrument (bromofluorobenzene [BFB] is the suggested tuning standard). The calibration verification standard must be at the midpoint (or lower) of the calibration curve. The standard must meet Method TO-15 or laboratory generated limits for the compounds of interest/target compounds (as identified on the Chain of Custody), not a set of continuing calibration check compounds. If no direction is given to the laboratory for check compounds, then the laboratory Standard Operating Procedures (SOPs) shall be followed.
5. Laboratories should run ten percent laboratory duplicates. Duplicate samples should have less than or equal to 25 percent relative percent difference or corrective action should be initiated.
6. The Michigan Department of Environmental Quality (MDEQ) accepts a holding time of 21 days for the Method TO-15 analysis.
7. Reporting Limits: The MDEQ expects that for the following compounds: benzene, toluene, the xylenes, ethylbenzene, the trimethylbenzenes, trichloroethene, and vinyl chloride will have reporting limits between 0.2-0.4 parts per billion per volume (ppbv) (reported as μg/m3). The other compounds in Appendix C should have reporting limits between 0.5-1.0 ppbv (reported as μg/m3). The MDEQ does recognize that some compounds will have issues with chromatography or interferences that will prevent the expected reporting limits

Appendix G.1 – Page 2 of 4
from being met. Laboratories should clearly document these cases within their SOPs and on reports as necessary.
8. Canisters: The laboratory providing SUMMA canisters shall verify each batch of 20 canisters by analyzing one container after cleaning. The canister chosen for post-cleaning analysis shall be the canister with the highest recorded VOC concentration from prior analyses. The container shall be verified by charging the canister with clean zero-air or nitrogen, analyzing the container by Method TO-15, and verifying no compounds are found above the required reporting limits. Additionally, the supplier of SUMMA canisters is expected to verify the operability of the canisters. The Method TO-15 SOP (or equivalent) should describe the preventative maintenance performed on the canisters. One hundred percent certified canisters may be required in certain situations.
9. Flow Restrictor/Regulator: Each canister assigned to a site must also have a dedicated regulator assigned that has a flow rate established and clearly referenced. Each regulator should be assigned a unique designation for tracking and cleaning purposes. The laboratory is required to verify the flow rate of each regulator at a minimum of every three months and should be used as part of the assembly identified in the batch cleaning process identified above. The dedicated flow regulator must be calibrated to a flow rate that is identified and reported in the laboratory report discussed in item 1.g. above.
10. Whenever a high concentration sample is analyzed (sample with concentrations outside the calibration curves), a zero canister analysis should be performed to check for carry-over. If carry-over is detected, column bake out shall be performed.
11. Tentatively Identified Compounds: Each Method TO-15 analysis is to include the reporting of the top five tentatively identified compounds greater than five ppbv that are not attributed to column breakdown, as compared to response of the nearest IS, when using full scan mode of the mass spectrometer. The laboratory will also report within the narrative if a hump is seen within the chromatogram such as is typical for gasoline, fuel oil, mineral spirits, etc. The laboratory is not required to quantify this as part of the analysis, although this may be requested of the laboratory at a later date for an additional cost.
12. Method Detection Limit (MDL) studies must be performed at least annually. The MDLs should be ≤ 0.5 ppbv for all target analytes. The LOQs may be adequate if done in compliance with NELAC requirements.
13. Field samples can be analyzed after successfully meeting all criteria established for instrument performance checks, calibrations, and blanks. All target analyte peaks should be within the initial calibration range. The RT for each IS must be within ± 0.33 minutes of the IS in the most recent calibration. The area response for the ISs must be within ± 50 percent of the area response of the ISs of the mean area response of the most recent initial calibration.
14. Daily check standard must be analyzed every 24 hours. This standard is at the midpoint of the calibration curve (ten ppbv suggested). The %D must be within ± 30 percent for each target analyte. Control charts should be maintained for the %D values.
15. Internal Standard: A suggested IS mixture of bromochloromethane, chlorobenzene-d5, and 1,4-difluorobenzene will be added to each sample as standard. The resulting concentrations are at ten ppbv (suggested).

Appendix G.1 – Page 3 of 4
Section B – Method TO-15 Modified for Bottle-Vac® Air Samplers by Entech Instruments, Inc.
1. The laboratory shall supply the following data with each report: a. All results from analysis of the method blank should be less than the reporting limits. If concentrations are
reported above the reporting limits, the laboratory will document this occurrence within the narrative and flag any concentration reported above the reporting limit for this compound up to ten times the level measured in the blank. The area responses for the ISs must be within ± 50 percent of the area response of the ISs of the mean area response of the most recent calibration. The RT for each IS must be within ± 0.33 minutes between the blank and the most recent calibration. Method blanks shall be run every 20 environmental samples or once per day, whichever is more frequent.
b. Laboratory Control Sample: The laboratory will report the percent of recoveries from all analytes spiked into the LCS. One LCS will be run within each 24-hour period of Method TO-15 samples analyzed.
c. The narrative of the laboratory report will define if the initial calibration curve, continuing calibration check sample (when appropriate), and internal quality assurance (such as ISs, blanks, etc.), and the receipt of the samples met the method requirements for each report.
d. The chromatogram for each analysis will be available electronically and the data will have at least 50 percent of the compounds identified in Appendix C clearly identified.
e. The laboratory shall report the results using the field sample ID and the associated laboratory sample number.
f. The laboratory shall report all compounds in units of μg/m3 at the STP. g. The laboratory report must contain the following information: Cover sheet with signature of a laboratory
supervisor or designee, a narrative discussing the sample results and any irregularities that were found during the analysis, Chain of Custody and sample condition upon receipt forms, tables containing the VOCs, the CAS number of each reported compound, measured concentration in μg/m3, reporting limit, date of analysis, labeled sample chromatograms, method blank data for the batch, and a summary of applicable quality control.
2. The laboratory is required to maintain the data for a minimum of ten years with the ability to reconstruct the data
either via a computer or paper.
3. Laboratories must verify their reporting limits by running a standard at the reporting limit once every month. The recovery of the reporting limit shall be +/- 40 percent of the true value or LOQ as defined by the NELAC.
4. Laboratories shall verify their calibration curve a minimum of every 24 hours. The 24-hour clock will begin at the injection of a standard for tuning the instrument, (BFB is the suggested tuning standard). The calibration verification standard must be at the midpoint (or lower) of the calibration curve. The standard must meet Method TO-15 or laboratory generated limits for the compounds of interest/target compounds (as identified on the Chain of Custody), not a set of continuing calibration check compounds. If no direction is given to the laboratory for check compounds, then the laboratory SOP shall be followed.
5. Laboratories should run ten percent laboratory duplicates. Duplicate samples should have less than or equal to 25 percent relative percent difference or corrective action should be initiated.
6. The MDEQ accepts a holding time of 21 days for the Method TO-15 analysis.
7. Reporting Limits: The MDEQ expects that for the following compounds: benzene, toluene, the xylenes, ethylbenzene, the trimethylbenzenes, trichloroethene, and vinyl chloride will have reporting limits between 0.2-0.4 ppbv (reported as μg/m3). The other compounds in Appendix C should have reporting limits between 0.5-1.0 ppbv (reported as μg/m3). The MDEQ does recognize that some compounds will have issues with chromatography or interferences that will prevent the expected reporting limits from being met. Laboratories should clearly document these cases within their SOPs and on reports as necessary.
8. Bottle-Vac® Air Sampler: The laboratory providing the Bottle-Vac® shall supply a pre-cleaned or new one-liter amber bottle for each sampling event. Each batch of bottles utilized shall be verified for by analyzing one container for every 20 bottles utilized. The container shall be verified by charging the Bottle-Vac® with clean

Appendix G.1 – Page 4 of 4
zero-air or nitrogen, through a Entech Micro-QT™ Valve and a dedicated regulator; and then analyzing the container by Method TO-15 and verifying no compounds are found above the reporting limits required by the MDEQ. Additionally, the supplier of Bottle-Vac® is expected to verify the operability of the Entech Micro-QT™ Valves and any other flow restrictors provided.
9. Flow Restrictor/Regulator: Each Bottle-Vac® assigned to a site must also have a dedicated regulator assigned that has a flow rate established and clearly referenced. Each regulator should be assigned a unique designation for tracking and cleaning purposes. The laboratory is required to verify the flow rate of each regulator at a minimum of every three months and should be used as part of the assembly identified in the batch cleaning process identified above. The dedicated flow regulator must be calibrated to a flow rate that is identified and reported in the laboratory report discussed in item 1.g. above
10. Whenever a high concentration sample is analyzed (sample with concentrations outside the calibration curves), a zero canister analysis should be performed to check for carryover. If carry-over is detected, during the verification with clean zero-air, the bottles must be replaced and each Entech Micro-QT™ Valve and a dedicated regulator must be re-cleaned prior to retesting the batch in accordance with item 8 above.
11. Tentatively Identified Compounds: The MDEQ requires each Method TO-15 analysis to include the reporting of the top five tentatively identified compounds greater than five ppbv that are not attributed to column breakdown, as compared to the response of the nearest IS, when using full scan mode of the mass spectrometer. The laboratory will also report within the narrative if a hump is seen within the chromatogram such as is typical for gasoline, fuel oil, mineral spirits, etc. The laboratory is not required to quantify this as part of the analysis, although this may be requested of the laboratory at a later date for an additional cost.
12. MDL studies must be performed at least annually. The MDLs should be ≤ 0.5 ppbv for all target analytes. The LOQs may be adequate if done in compliance with NELAC requirements.
13. Field samples can be analyzed after successfully meeting all criteria established for instrument performance checks, calibrations, and blanks. All target analyte peaks should be within the initial calibration range. The RT for each IS must be within ± 0.33 minutes of the IS in the most recent calibration. The area response for the ISs must be within ± 50 percent of the area response of the ISs of the mean area response of the most recent initial calibration.
14. Daily check standard must be analyzed every 24 hours. This standard is at the midpoint of the calibration curve (ten ppbv suggested). The %D must be within ± 30 percent for each target analyte. Control charts should be maintained for the %D values.
15. Internal Standard: A suggested IS mixture of bromochloromethane, chlorobenzene-d5, and 1,4-difluorobenzene will be added to each sample as standard. The resulting concentrations are at ten ppbv (suggested).

APPENDIX H
Model for a Declaration of a Restrictive Covenant

Remediation Division
Michigan Department of Environmental Quality
8/8/2011
DECLARATION OF RESTRICTIVE COVENANT
This document provides instruction for the model Declaration of Restrictive Covenant to be used to place land use or resource use restrictions pursuant to Section 20114c(3) of Part 201, Environmental Remediation, of the Natural Resources and Environmental Protection Act, 1994 PA 451, as amended (NREPA), MCL 324.20101 et seq. Pursuant to Section 20114c(5) of Part 201, a copy of the recorded Declaration of Restrictive Covenant shall be provided to the Michigan Department of Environmental Quality within 30 days after recording with the appropriate Register of Deeds. The recording requirements for instruments filed with Michigan County Register of Deeds offices are contained in Section 1 of the Recording Requirements Act, 1937 PA 103, as amended (Act 103), MCL 565.201 et seq.
The lettered instructions below explain what information should be inserted into the corresponding blanks identified by letter in the Declaration of Restrictive Covenant Model. Drafting notes, examples, and insertion directions appear as bold italicized print.
A. DEQ Reference No: RC-RD-201-[year]-[number]. This Reference Number ensures the protectiveness, enforcement, and tracking of land use and resource use restrictions. All restrictive covenants must have a Reference Number assigned and prominently displayed on the first page of the document. The DEQ Reference Number will be assigned by DEQ Remediation Division staff. The DEQ Reference Number can be obtained by contacting the Remediation Division at [email protected] or by calling 517-373-4805.
B. Enter the name of the county where the property is located. C. Enter the address location of the property including city or township and county. D. Select one of the following options as appropriate:
OPTION 1: If the DEQ reviewed and approved a Response Activity Plan to address the environmental contamination at the Property, insert the following paragraph: Response activities [insert as appropriate: are being OR were] implemented to address environmental contamination at the Property pursuant to Part 201, Environmental Remediation, of the Natural Resources and Environmental Protection Act, 1994 PA 451, as amended (NREPA), MCL 324.20101 et seq. The response activities that [insert as appropriate: are being OR were] implemented to address environmental contamination are fully described in the Response Activity Plan titled [insert the title of plan] dated [Insert date], and prepared by [insert the name of the entity that prepared the plan]. The Michigan Department of Environmental Quality (DEQ) approved the Response Activity Plan on [insert the date the DEQ approved the

- 2 -
plan], pursuant to Part 201 of the NREPA.
OPTION 2: If the DEQ did not review and approve a Response Activity Plan to address the environmental contamination at the Property, insert the following paragraph: Response activities [insert as appropriate: are being OR were] implemented to address environmental contamination at the Property pursuant to Part 201, Environmental Remediation, of the Natural Resources and Environmental Protection Act, 1994 PA 451, as amended (NREPA), MCL 324.20101 et seq. The adequacy of the response activities implemented at the Property has not been subject to a facility-specific review by the Michigan Department of Environmental Quality (DEQ) nor has the DEQ determined that the response activities comply with Part 201 of the NREPA.
E. Insert as appropriate: Residential cleanup criteria under Section 20120a(1)(a) Nonresidential cleanup criteria under Section 20120a(1)(b) Site-specific cleanup criteria under Sections 20120a(2) and 20120b
F. Insert the following sentence if there is a long-term physical component of the
response activity (e.g., exposure barrier, permanent marker, or monitoring wells): and 3) to prevent damage or disturbance of any element of the response activity constructed on the Property.
If there is no long-term physical component of the response activity, remove the
semi-colon and end the sentence. G. Select one of the following options as appropriate:
OPTION 1: If the entire Property will be subject to all of the land or resource use restrictions provided in the restrictive covenant, insert the following:
Exhibit 2 provides a survey of the Property that is subject to the land use or resource use restrictions specified herein. OPTION 2: If not all of the Property is to be subject to all of the land or resource use restrictions provided in the restrictive covenant, insert the following: The “Survey of Property and Limits of Land or Resource Use Restrictions,” attached as Exhibit 2, provides a survey of the Property that depicts the area or areas subject to restriction and contains legal descriptions that distinguish those portions of the Property that are subject to land use or resource use restrictions specified in this Restrictive Covenant.
H. Insert a paragraph similar to the following that briefly describes the nature of the
hazardous substances, the affected media, and how the response activities implemented, including the land or resource use restrictions, will be effective to address risks for all relevant pathways that require restrictions.
Example: Hazardous substances including lead, trichloroethylene (TCE), cyanide

- 3 -
and phenols have been released and/or disposed of on the Property. Prior to the recording of this Restrictive Covenant, response activities have been undertaken to remove or treat in-place some of the hazardous substances. Lead and TCE remain present at levels that require controls to prevent unacceptable exposures. An exposure barrier, consisting of six (6) inches of clean soil and vegetation, has been placed, as described below, to prevent direct contact with the lead impacted soils. A vapor barrier has been placed under Building B (identified in Exhibit 2) to prevent migration of TCE into the building at levels that would result in unacceptable exposures through inhalation.
I. If the Restrictive Covenant is being recorded in association with response
activities that do not address all areas of the Property that contain hazardous substances, insert the following paragraph and attach an exhibit which provides a survey and legal description of the areas of the Property or general description of the specific media (i.e., groundwater, soils, etc.) that are not being addressed pursuant to the response activities:
Areas of the Property described in Exhibit [insert appropriate Exhibit #] have not been addressed through the response activities undertaken at the Property and may contain hazardous substances in excess of the concentrations developed as the unrestricted residential criteria under Section 20120a(1)(a) or (17) of the NREPA.
J. Enter the name of the owner of the property or the name of the person proposing to file the Restrictive Covenant.
K. Insert as appropriate:
as the Owner of the Property with the express written permission of the Owner of the Property
L. Select one of the following options as appropriate to describe the restrictions on
land use necessary to comply with the appropriate cleanup criteria:
OPTION 1: If the property is subject to land use restrictions required to satisfy the nonresidential cleanup criteria, insert the following paragraph below: a. Prohibited Land Uses: The Owner shall prohibit all uses of [insert as appropriate: the Property OR portions of the Property as described in Exhibit 2] that are not compatible with or are inconsistent with the assumptions and basis for the nonresidential cleanup criteria established pursuant to Section 20120a(1)(b) of the NREPA. Uses that are compatible with nonresidential cleanup criteria are generally described in Exhibit 3 (Allowable Uses). [If the local zoning ordinance allows for residential uses within the Property’s current zoning, insert the following: The following uses allowed under the [insert name of local zoning authority and zoning code designation] zoning code designation are prohibited: [list prohibited uses.]] Cleanup criteria for land-use based response activities are located in the Government Documents Section of the State of Michigan Library. OPTION 2: If the property is subject to land use restrictions required to satisfy site-specific cleanup criteria, insert the following paragraph below:
a. Prohibited Land Uses: The Owner shall prohibit all uses of [insert as appropriate:

- 4 -
the Property OR portions of the Property as described in Exhibit 2] that are not compatible with or are inconsistent with the assumptions and basis for the site-specific cleanup criteria developed for the Property pursuant to Section 20120a(2) and 20120b of the NREPA. Uses that are compatible with the site-specific criteria developed for the Property are generally described in Exhibit 3 (Allowable Uses).
OPTION 3: If the property does not require any restrictions on land use because hazardous substances left in place would allow for a limited or restricted residential cleanup with the appropriate resource use restrictions, there is no need to insert any restriction language under “Prohibited Land Uses.” Therefore this paragraph should be excluded from the restrictive covenant and the remainder of the paragraphs should be renumbered accordingly.
M. Insert as appropriate: on the Property within the portions of the Property designated in Exhibit 2 as [insert
designation]. N. Enter additional paragraphs, as appropriate, to describe the prohibited activities
necessary to reliably restrict exposure to hazardous substances located on the Property or within the portions of the Property designated in Exhibit 2.
Example exposure restriction for use of groundwater: The construction and use of wells or other devices on the Property to extract groundwater for consumption, irrigation, or any other purpose, except as provided below:
(a) Wells and other devices constructed as part of a response activity for the purpose of evaluating groundwater quality or to remediate subsurface contamination associated with a release of hazardous substances into the environment are permitted provided the construction of the wells or devices complies with all applicable local, state, and federal laws and regulations and does not cause or result in a new release, exacerbation of existing contamination, or any other violation of local, state, or federal laws or regulations.
(b) Short-term dewatering for construction purposes is permitted provided
the dewatering, including management and disposal of the groundwater, is conducted in accordance with all applicable local, state, and federal laws and regulations and does not cause or result in a new release, exacerbation of existing contamination, or any other violation of local, state, and federal environmental laws and regulations.
Example direct contact exposure barrier restriction: The [insert thickness and material of barrier] that has a base elevation of [insert reproducible benchmark] at the locations shown in Exhibit 2 serves to prevent exposures to contaminated soils at the Property. Any excavation or other intrusive activity that could affect the integrity of the [insert material of barrier] is prohibited, except during short-term construction or repair projects or for purposes of further treating or remediating the subject contamination. Any excavation or other intrusive activity, including removing, altering, or disturbing the [insert material of barrier], that could affect the integrity of the barrier, must be

- 5 -
replaced with a cover that provides at least an equivalent degree of protection as the original barrier within 14 days of completion of the work. Repair and/or replacement of the barrier must be completed unless additional sampling is conducted that demonstrates that a barrier in the area is no longer necessary in accordance with the applicable provisions and requirements of Part 201 of the NREPA.
Example vapor intrusion exposure restriction (no buildings): The construction of new structures, unless such construction incorporates engineering controls designed to eliminate the potential for subsurface vapor phase hazardous substances to migrate into the new structure at concentrations greater than applicable criteria; or, unless prior to construction of any structure, an evaluation of the potential for any hazardous substances to volatilize into indoor air assures the protection of persons who may be present in the buildings and is in compliance with Section 20107a of the NREPA.
O. Enter additional paragraphs, as appropriate, to describe the prohibited activities
necessary to maintain the effectiveness and integrity of the response activity implemented at the Property.
Example infiltration barrier restriction: The [insert thickness and material of barrier] that has a base elevation of [insert reproducible benchmark] at the locations shown in Exhibit 2 serves to prevent infiltration of water through contaminated soil at the Property. Any excavation or other intrusive activity that could affect the integrity of the [insert material of barrier] is prohibited, except during short-term construction or repair projects or for purposes of further treating or remediating the subject contamination. Any excavation or other intrusive activity, including removing, altering, or disturbing the [insert material of barrier], that could affect the integrity of the barrier, must include the use of engineering controls to prevent the infiltration of water into the contaminated soil underlying the barrier until the barrier is repaired or replaced. The barrier must be repaired or replaced with a cover that provides at least an equivalent degree of protection as the original barrier within 14 days of completion of the work. Repair and/or replacement of the barrier must be completed unless additional sampling is conducted which demonstrates that a barrier in the area is no longer necessary in accordance with the applicable provisions and requirements of Part 201 of the NREPA.
Example monitoring well disturbance restriction: Any activity that would interfere with the function of or obstruct access to any
monitoring wells and devices located on the Property. This includes, but is not limited to, removing, destroying, or altering any well or device in any way that renders it inoperable or incapable of functioning as intended.
Example treatment system restriction: Any activity that could affect the integrity, effectiveness, and operation of the groundwater interception trench and treatment system depicted in Exhibit 2. Example containment and treatment system restriction:

- 6 -
Any excavation or other intrusive activity that could affect the integrity, effectiveness, and operation of the slurry wall and Light Non-Aqueous Phase Liquid (LNAPL) collection system as designated in Exhibit 2, and any activities that would interfere with access to the slurry wall and LNAPL collection system.
P. Insert as appropriate:
on the Property within the portions of the Property designated in Exhibit 2 as [insert
designation]. Q. Insert the following paragraph if permanent markers are required; if not, renumber
the paragraphs as appropriate:
Permanent Markers. The Owner shall not remove, cover, obscure, or otherwise alter or interfere with the permanent markers placed at the locations noted in Exhibit 2. The Owner shall keep vegetation and other materials clear of the permanent markers to assure that the markers are readily visible.
R. Enter the name of the owner of the entity responsible for assuring compliance with the Restrictive Covenant.
S. Insert the following if portions of the property subject to land use or resource use
restrictions overlap and affect any easement holders’ property interests:
and all other holders of a legal interest whose interest is materially affected by this Restrictive Covenant as documented and attached hereto as Exhibit [insert number of the exhibit that contains the Consent of Easement Holder documentation].
T. Enter the name of the person proposing to file the Restrictive Covenant. U. Insert the day of the month. V. Insert the month and year. W. Insert Notary Public information as:
Name of state County
X. Insert the appropriate form of acknowledgement from the following: OPTION 1: For an individual:
The foregoing instrument was acknowledged before me this [date] by [name of individual].
OPTION 2: For a corporation:
The foregoing instrument was acknowledged before me this [date] by [name of officer or agent, title of officer or agent] of [name of corporation], a [state or place of incorporation], on behalf of the corporation.
OPTION 3: For a partnership:

- 7 -
The foregoing instrument was acknowledged before me this [date] by [name of partnership or agent], partner [or agent] on behalf of [name of partnership], a partnership.
OPTION 4: For an individual acting as principal by an attorney in fact (power of attorney): The foregoing instrument was acknowledged before me this [date] by [name of attorney in fact] as attorney in fact on behalf of [name of principal].
Y. Print, Type, or Stamp name of Notary Public. Z. Insert name of the person who prepared the restrictive covenant. AA. Insert the address of the person who prepared the restrictive covenant. CONSENT OF OWNER ATTACHMENT:
This form is only necessary if the current property owner and the person signing the restrictive covenant are not the same person. This document provides the express written permission of the current property owner for recording.
A. Enter the name of the current property owner. B. Insert the year and number of the DEQ assigned reference number. C. Enter the name of the person recording the restrictive covenant. D. Enter the name of the county where the property is located. E. Insert Notary Public information as:
Name of state County
F. Insert the appropriate form of acknowledgement from the following: OPTION 1: For an individual:
The foregoing instrument was acknowledged before me this [date] by [name of individual].
OPTION 2: For a corporation:
The foregoing instrument was acknowledged before me this [date] by [name of officer or agent, title of officer or agent] of [name of corporation], a [state or place of incorporation corporation], on behalf of the corporation.
OPTION 3: For a partnership:
The foregoing instrument was acknowledged before me this [date] by [name of partnership or agent], partner [or agent] on behalf of [name of partnership], a partnership.
OPTION 4: For an individual acting as principal by an attorney in fact (power of attorney):

- 8 -
The foregoing instrument was acknowledged before me this [date] by [name of attorney in fact] as attorney in fact on behalf of [name of principal].
G. Print, Type, or Stamp name of Notary Public. EXHIBIT 1 LEGAL DESCRIPTION OF PROPERTY:
This exhibit must provide the legal description of the property, including parcel identification number(s) of the property.
EXHIBIT 2 SURVEY OF PROPERTY OR SURVEY OF THE PROPERTY AND LIMITS OF LAND AND RESOURCE USE RESTRICTIONS.
This exhibit must be titled as appropriate for the restricted area. All surveys must be conducted by a licensed surveyor; identify, clearly delineate, and graphically depict the spatial extent of all restricted areas in relation to the Property boundaries and the key features of the response activities, including permanent markers if required; and provide a legal description of the restricted areas of the Property if not all areas of the Property are subject to the same restrictions.
EXHIBIT 3 DESCRIPTION OF ALLOWABLE USES
This exhibit is only necessary when the property is restricted to nonresidential or site-specific land uses. It must be consistent with the zoning of the property and with the generic exposure assumptions used to develop the cleanup criteria established pursuant to Section 20120a(1)(b) of the NREPA or the alternative exposure assumptions used to develop site-specific criteria pursuant to Section 20120a(2) and 20120b of the NREPA. OPTION 1: Insert the following if the property is restricted to the nonresidential land use category: Nonresidential Land Use: This land use is characterized by any use which is not residential in nature and is primarily characterized by industrial and commercial uses. Industrial uses typically involve manufacturing operations engaged in processing and manufacturing of materials or products. Other examples of industrial uses are utility companies, industrial research and development, and petroleum bulk storage. Commercial uses include any business or income-producing use such as commercial warehouses, lumber yards, retail gas stations, auto dealerships and service stations, as well as office buildings, banks, and medical/dental offices (not including hospitals). Commercial uses also include retail businesses whose principal activity is the sale of food or merchandise within an enclosed building and personal service establishments which perform services indoors such as health clubs, barber/beauty salons, photographic studios, etc.
Any residential use is specifically prohibited from the non-residential land use category. This would include the primary use of the property for human habitation and includes structures such as single family dwellings, multiple family structures, mobile homes, condominiums, and apartment buildings. Residential use is also characterized by any use which is intended to house, educate, or provide care for children, the elderly, the infirm, or other sensitive populations, and therefore could include day care centers,

- 9 -
educational facilities, hospitals, elder care facilities, and nursing homes. The use of any accessory building or portion of an existing building as a dwelling unit permitted for a proprietor or storekeeper and their families, located in the same building as their place of occupation, or for a watchman or caretaker is also prohibited. Any authority that allows for residential use of the Property as a legal non-conforming is also restricted per the prohibitions contained in this restrictive covenant.
OPTION 2: If the property is restricted to the site-specific land use category, insert a paragraph that describes those uses that are consistent with assumptions used to develop site-specific criteria pursuant to Section 20120a(2) and 20120b of the NREPA as approved by the DEQ.
EXHBIT 4 CONSENT OF EASEMENT HOLDERS
This Exhibit is only necessary if easement holders on the property have their rights materially impacted by the restrictions set forth in the Restrictive Covenant. This document provides the express written permission of the easement holder to record the restrictive covenant and have their property rights subject to and subordinate to the terms of the restrictive covenant. Insert additional pages if multiple easement holders exist for the Property.
A. Insert name of the easement holder. B. Insert Notary Public information as:
Name of state County
C. Insert the appropriate form of acknowledgement from the following: OPTION 1: For an individual:
The foregoing instrument was acknowledged before me this [date] by [name of individual].
OPTION 2: For a corporation:
The foregoing instrument was acknowledged before me this [date] by [name of officer or agent, title of officer or agent] of [name of corporation], a [state or place of incorporation], on behalf of the corporation.
OPTION 3: For a partnership:
The foregoing instrument was acknowledged before me this [date] by [name of partnership or agent], partner [or agent] on behalf of [name of partnership], a partnership.
OPTION 4: For an individual acting as principal by an attorney in fact (power of attorney): The foregoing instrument was acknowledged before me this [date] by [name of attorney in fact] as attorney in fact on behalf of [name of principal].
D. Print, Type, or Stamp name of Notary Public. EXHIBIT [ ] AREAS OF THE PROPERTY NOT ADDRESSSED BY THE RESPONSE ACTIVITIES

- 10 -
This Exhibit is to be used when certain areas of the Property will not be addressed by the response activities implemented at the Property. The survey must be conducted by a licensed surveyor. The survey shall include the legal descriptions of those areas on the Property that are not addressed by the response activities and clearly delineate and graphically depict those areas in relation to the Property boundaries.
-- END OF INSTRUCTIONS --

Michigan Department of Environmental Quality Restrictive_Covenant.doc Remediation Division 8/1/2011
THE ATTACHED MODEL DOCUMENT ENTITLED:
DECLARATION OF RESTRICTIVE COVENANT
IS A DRAFT DOCUMENT WHICH IS SUBJECT TO REVISION. IT IS PROVIDED TO THE PUBLIC AS PRELIMINARY GUIDANCE AS TO THE CONTENT, FORMAT, AND TERMS OF THIS COVENANT. IT IS NOT INTENDED, NOR CAN IT BE RELIED UPON, TO CREATE ANY SUBSTANTIVE OR PROCEDURAL RIGHTS BY ANY OTHER PARTY. PLEASE CONTACT THE COMPLIANCE AND ENFORCEMENT SECTION, REMEDIATION DIVISION, MICHIGAN DEPARTMENT OF ENVIRONMENTAL QUALITY, AT 517-373-7818 TO RECEIVE THE MOST RECENT DRAFT OF THIS DOCUMENT.
NOTE: There are recording requirements for instruments filed with Michigan county register of deeds offices contained in Section 1 of the Recording Requirements Act, 1937 PA 103, as amended (Act 103), MCL 565.201, link to Act 103.
The Michigan Department of Environmental Quality (DEQ) will not discriminate against any individual or group on the basis of race, sex, religion, age, national origin, color, marital status, disability or political beliefs. Questions or concerns should be directed to the DEQ Office of Human Resources, P.O. Box 30473, Lansing, MI 48909.

DECLARATION OF RESTRICTIVE COVENANT
DEQ Reference No: RC-RD-201-____(A)____ This Declaration of Restrictive Covenant ("Restrictive Covenant") has been recorded with the ____(B)____ County Register of Deeds for the purpose of protecting public health, safety, and welfare, and the environment by prohibiting or restricting activities that could result in unacceptable exposure to environmental contamination present at the property located at ____(C)____ and legally described in Exhibit 1 attached hereto (“Property”). ____(D)____ The Property described contains hazardous substances in excess of the concentrations developed as the unrestricted residential criteria under Section 20120a(1)(a) or (17) of the NREPA. The DEQ recommends that prospective purchasers or users of the Property undertake appropriate due diligence prior to acquiring or using this Property, and undertake appropriate actions to comply with the requirements of Section 20107a of the NREPA. The response activities required the recording of this Restrictive Covenant with the ____(B)____ County Register of Deeds to: 1) restrict unacceptable exposures to hazardous substances located on the Property; 2) assure that the use of Property is consistent with the exposure assumptions used to develop the ____(E)____ of the NREPA and the exposure control measures relied upon at the Property; ____(F)____. The restrictions contained in this Restrictive Covenant are based upon information available at the time the response activities were implemented. Failure of the response activities to achieve and maintain the criteria, exposure controls, and any requirements specified by the response activities; future changes in the environmental condition of the Property or changes in the ____(E)____ of the NREPA; the discovery of environmental conditions at the Property that were not accounted for during implementation of the response activities; or use of the Property in a manner inconsistent with the restrictions described herein, may result in this Restrictive Covenant not being protective of public health, safety, and welfare, and the environment. ____(G)____ Definitions For the purposes of this Restrictive Covenant, the following definitions shall apply: “DEQ” means the Michigan Department of Environmental Quality, its successor entities, and those persons or entities acting on its behalf.

2
"Owner" means at any given time the then current title holder of the Property or any portion thereof. All other terms used in this document which are defined in Part 3, Definitions, of the NREPA; Part 201 of the NREPA; or the Part 201 Administrative Rules, 2002 Michigan Register; Effective December 21, 2002, shall have the same meaning in this document as in Parts 3 and 201 of the NREPA and the Part 201 Administrative Rules, as of the date of filing of this Restrictive Covenant. Summary of Response Activities ____(H)____ ____(I)_____ NOW THEREFORE, 1. Declaration of Land Use or Resource Use Restrictions ____(J)____, ____(K)_____, hereby declares and covenants that the Property shall be subject to the following restrictions and conditions:
a. ____(L)____
b. Prohibited Activities to Eliminate Unacceptable Exposure to Hazardous Substances. The Owner shall prohibit activities ____(M)____ that may result in exposures to hazardous substances at the Property. These prohibited activities include:
____(N)____
c. Prohibited Activities to Ensure the Effectiveness and Integrity of the Response Activity. The Owner shall prohibit activities on the Property that may interfere with any element of the response activities, including the performance of operation and maintenance activities, monitoring, or other measures necessary to ensure the effectiveness and integrity of the response activities implemented at the Property. These prohibited activities include: ____(O)____ d. Contaminated Soil Management. The Owner shall manage all soils, media and/or debris located ____(P)____ in accordance with the applicable requirements of Section 20120c of the NREPA; Part 111, Hazardous Waste Management, of the NREPA; Subtitle C of the Resource Conservation and Recovery Act, 42 U.S.C. Section 6901 et seq.; the administrative rules promulgated thereunder; and all other relevant state and federal laws. 2. ____(Q)____ 3. Access. The Owner grants to the DEQ and its designated representatives the right to enter the Property at reasonable times for the purpose of determining and monitoring compliance with the response activities, including the right to take samples, inspect the operation of the response activities and inspect any records relating thereto, and to perform any actions necessary to maintain compliance with Part 201.

3
4. Conveyance of Property Interest. The Owner shall provide notice to the DEQ of the Owner’s intent to transfer any interest in the Property at least fourteen (14) business days prior to consummating the conveyance. A conveyance of title, easement, or other interest in the Property shall not be consummated by the Owner without adequate and complete provision for compliance with the applicable provisions of Section 20116 of the NREPA. The notice required to be made to the DEQ under this Paragraph shall be made to: Chief, Remediation Division, Michigan DEQ, P.O. Box 30426, Lansing, Michigan 48909-7926; and shall include a statement that the notice is being made pursuant to the requirements of this Restrictive Covenant, DEQ Reference Number RC-RD-201-____(A)____. A copy of this Restrictive Covenant shall be provided to all future owners, heirs, successors, lessees, easement holders, assigns, and transferees by the person transferring the interest. 5. Term of Restrictive Covenant. This Restrictive Covenant shall run with the Property and shall be binding on the Owner; future owners; and their successors and assigns, lessees, easement holders, and any authorized agents, employees, or persons acting under their direction and control. This Restrictive Covenant shall continue in effect until the DEQ or its successor determines that hazardous substances no longer present an unacceptable risk to the public health, safety, or welfare, or the environment. This Restrictive Covenant may only be modified or rescinded with the written approval of the DEQ. 6. Enforcement of Restrictive Covenant. The State of Michigan, through the DEQ, and ____(R)____ may individually enforce the restrictions set forth in this Restrictive Covenant by legal action in a court of competent jurisdiction. 7. Severability. If any provision of this Restrictive Covenant is held to be invalid by any court of competent jurisdiction, the invalidity of such provision shall not affect the validity of any other provisions hereof, and all such other provisions shall continue unimpaired and in full force and effect. 8. Authority to Execute Restrictive Covenant. The undersigned person executing this Restrictive Covenant is the Owner, or has the express written permission of the Owner ____(S)____, and represents and certifies that he or she is duly authorized and has been empowered to execute and deliver this Restrictive Covenant

IN WITNESS WHEREOF, ____(T)____ has caused this Restrictive Covenant, RC-RD-201-____(A)____, to be executed on this ____(U)____ day of ____(V)____. ____(T)____ By: ____________________________ Signature Name: _________________________ Print or Type Name Its: ____________________________ Title STATE OF ____(W)____ COUNTY OF ____(W)____ ____(X)____ _____________________________________
Notary Public Signature ____(Y)____ Notary Public, State of ___________________ County of _____________________________ My Commission Expires: _________________ Acting in the County of ___________________
Prepared by and when recorded return to:
____(Z)____ ____(AA)____

CONSENT OF OWNER
I, ____(A)____, the current and legal Owner of the Property, do hereby consent to the recording of this Restrictive Covenant, RC-RD-201-____(B)____, and authorize ____(C)____ to file the Restrictive Covenant with the ____(D)____ County Register of Deeds for recording. ____(A)____ By: ____________________________ Signature Name: _________________________ Print or Type Name Its: ____________________________ Title STATE OF ____(E)____ COUNTY OF ____(E)____ ____(F)____ _____________________________________
Notary Public Signature ____(G)____ Notary Public, State of ___________________ County of _____________________________ My Commission Expires: _________________ Acting in the County of ___________________

EXHIBIT 1
LEGAL DECRIPTION OF PROPERTY

EXHIBIT 2
SURVEY OF THE PROPERTY
OR
SURVEY OF THE PROPERTY AND LIMITS OF LAND OR RESOURCE USE RESTRICTIONS

EXHIBIT 3
DESCRIPTION OF ALLOWABLE USES

EXHIBIT 4
CONSENT OF EASEMENT HOLDERS
As evidenced below by my signature, I agree and consent to the recording of the land use and resource use restrictions specified in this Restrictive Covenant and hereby agree that my property interest shall be subject to, and subordinate to, the terms of the Restrictive Covenant. ____(A)____ By: ______________________________ Signature Name: ___________________________ Print or Type Name Its: ______________________________ Title STATE OF ____(B)____ COUNTY OF ____(B)____ ____(C)____ _____________________________________
Notary Public Signature ____(D)____ Notary Public, State of ___________________ County of _____________________________ My Commission Expires: _________________ Acting in the County of ___________________

EXHIBIT [ ]
AREAS OF THE PROPERTY NOT ADDRESSED BY THE RESPONSE ACTIVITIES

Appendix I – Table of Contents APPENDIX I.1 – Rule 290 of the Michigan Air Pollution Control Rules APPENDIX I.2 – Rule 290 Permit to Install Exemption: Sources with Limited Emissions Record

APPENDIX I.1 Rule 290 of the Michigan Air Pollution
Control Rules

Rule 290 of the Michigan Air Pollution Control Rules is provided as an exert below:
R 336.1290 Permit to install exemptions; emission units with limited emissions. Rule 290. The requirement of R 336.1201(1) to obtain a permit to install does not apply to any of the emission units listed in (a) if the conditions listed in (b), (c), and (d) are met. Notwithstanding the definition in R 336.1121(a), for the purpose of this rule, uncontrolled emissions are the emissions from an emission unit based on actual operation, not taking into account any emission control equipment. Controlled emissions are the emissions from an emission unit based on actual operation, taking into account the control equipment.
(a) An emission unit which meets any of the following criteria:
(i) Any emission unit that emits only noncarcinogenic volatile organic compounds or noncarcinogenic materials which are listed in R 336.1122(f) as not contributing appreciably to the formation of ozone, if the uncontrolled or controlled emissions of air contaminants are not more than 1,000 or 500 pounds per month, respectively.
(ii) Any emission unit that the total uncontrolled or controlled emissions of air contaminants are not more than 1,000 or 500 pounds per month, respectively, and all of the following criteria are met: (A) For noncarcinogenic air contaminants, excluding noncarcinogenic volatile organic compounds and noncarcinogenic materials which are listed in R 336.1122(f) as not contributing appreciably to the formation of ozone, with initial threshold screening levels greater than or equal to 2.0 micrograms per cubic meter, the uncontrolled or controlled emissions shall not exceed 1,000 or 500 pounds per month, respectively. (B) For noncarcinogenic air contaminants, excluding noncarcinogenic volatile organic compounds and noncarcinogenic materials which are listed in R 336.1122(f) as not contributing appreciably to the formation of ozone, with initial threshold screening levels greater than or equal to 0.04 micrograms per cubic meter and less than 2.0 micrograms per cubic meter, the uncontrolled or controlled emissions shall not exceed 20 or 10 pounds per month, respectively. (C) For carcinogenic air contaminants with initial risk screening levels greater than or equal to 0.04 micrograms per cubic meter, the uncontrolled or controlled emissions shall not exceed 20 or 10 pounds per month, respectively.
(D) The emission unit shall not emit any air contaminants, excluding noncarcinogenic volatile organic compounds and noncarcinogenic materials which are listed in R 336.1122(f) as not contributing appreciably to the formation of ozone, with an initial threshold screening level or initial risk screening level less than 0.04 micrograms per cubic meter.
(iii) Any emission unit that emits only noncarcinogenic particulate air contaminants and other air contaminants that are exempted under paragraphs (i) or (ii) of this subdivision if all of the following provisions are met: (A) The particulate emissions are controlled by an appropriately designed and operated fabric filter collector or an equivalent control system which is designed to control particulate matter to a concentration of less than or equal to 0.01 pounds of R 336.1290 2-83 As Amended 6/20/2008

particulate per 1,000 pounds of exhaust gases and which do not have an exhaust gas flow rate more than 30,000 actual cubic feet per minute. (B) The visible emissions from the emission unit are not more than 5% opacity in accordance with the methods contained in R 336.1303.
(C) The initial threshold screening level for each particulate air contaminant, excluding nuisance particulate, is more than 2.0 micrograms per cubic meter.
(b) A description of the emission unit is maintained throughout the life of the unit.
(c) Records of material use and calculations identifying the quality, nature, and quantity of the air contaminant emissions are maintained in sufficient detail to demonstrate that the emissions meet the emission limits outlined in this rule.
(d) The records are maintained on file for the most recent 2-year period and are made available to the air quality division upon request.

APPENDIX I.2 Rule 290 Permit to Install Exemption:
Sources with Limited Emissions Record

EQP 3558 (Rev. 2/05) Page 1 of 7
MICHIGAN DEPARTMENT OF ENVIRONMENTAL QUALITY, ENVIRONMENTAL SCIENCE AND SERVICES DIVISION
RULE 290 PERMIT TO INSTALL EXEMPTION: SOURCES WITH LIMITED EMISSIONS RECORD
This record is provided as a courtesy for businesses by the Michigan Department of Environmental Quality (MDEQ), Environmental Science and Services Division, Clean Air Assistance Program, and is not required to be returned or submitted to the MDEQ. Applicable Rule: Rule 290 of the Michigan Air Pollution Control Rules NOTE: • Rule 290 of the Michigan Air Pollution Control Rules exempts an emission unit with limited emissions from
having to apply for Permit to Install. Rule 201 requires sources to obtain a Permit to Install prior to the installation, construction, reconstruction, relocation, or modification of an emission unit. Sources using this exemption must not meet any of the criteria in Rule 278 and must be able to demonstrate compliance with the various emission limits contained in Rule 290.
• Utilization of this form is not the sole method of demonstrating compliance with the requirements of Rule 290, unless required by a permit such as a Renewable Operating Permit (ROP). For example, an alternative method of demonstrating compliance could be determining the emissions of air contaminants from a single unit of production and recording the number of production units generated per month.
• ROP subject sources – This document must be used to track emissions unless an alternate format has been
approved by the District Supervisor or alternate format is cited in the ROP.
• An emission unit that emits an air contaminant, excluding noncarcinogenic Volatile Organic Compounds (VOCs) and noncarcinogenic, non-ozone forming materials listed in Rule 122(f), which has an Initial Threshold Screening Level (ITSL) or Initial Risk Screening Level (IRSL) less than 0.04 micrograms per cubic meter (ug/m3) cannot use Rule 290.
• For all emission units exempt pursuant to Rule 290 that emit particulate emissions which have an ITSL equal to or less than 2.0 ug/m3 and greater than or equal 0.04 ug/m3, the particulate emissions must be included in Section 2.
• For all emission units exempt pursuant to Rule 290 that emit particulate emissions which have an IRSL equal
to or greater than 0.04 ug/m3, the particulate emissions must be included in Section 3. • Perchloroethylene is the only non-ozone forming material listed in Rule 122(f) that is a carcinogen. Two of
the stabilizers in Rule 122(f) Table 11, tertiary butyl alcohol and 1,2-butylene oxide, are carcinogenic and are ozone forming materials.
• If an emission unit is equipped with a control device (i.e., equipment that captures and/or destroys air contaminants) and the control device is not vital to production of the normal product of the process or to its normal operation, then there are two options of recording emissions in Sections 2, 3, and 4:
1. record all uncontrolled emissions of air contaminants (i.e., all air contaminants entering the control device); or
2. record all controlled emissions of air contaminants (all air contaminants leaving the control device). Whatever option is chosen, make sure that option is used consistently throughout Sections 2, 3, 4, and 5.
• If the emission unit is not equipped with a control device or the control device is vital to production of the normal product of the process or to its normal operation, then the quantity of each emission of air contaminant identified in Sections 2, 3, 4, and 5 should be recorded as uncontrolled emissions.
• Monthly emission records are required to be maintained on file for the most recent two-year period and made available to the MDEQ, Air Quality Division upon request. (ROP subject sources must keep records for the most recent five year period.)

RULE 290 PERMIT TO INSTALL EXEMPTION: SOURCES WITH LIMITED EMISSIONS RECORD (continued)
EQP 3558 (Rev. 2/05) Page 2 of 7
Please print or type all information. 1. COMPLETE FOR EACH EMISSION UNIT USING THE EXEMPTION IN RULE 290.
SOURCE NAME:
MONTH/YEAR:
DESCRIPTION OF EMISSION UNIT (including control devices):
2. RECORD EMISSIONS OF NONCARCINOGENIC AIR CONTAMINANTS (EXCLUDING NONCARCINOGENIC VOCS AND
NONCARCINOGENIC, NON-OZONE FORMING MATERIALS LISTED IN RULE 122(f)) (see Appendix A)
ITSL ≥ 2.0 ug/m3 (The emissions of noncarcinogenic particulate air contaminants with an ITSL > 2.0 ug/m3 do not have to be recorded in this table as
long as the emission unit is in compliance with the requirements in Section 6.)
CAS # Chemical Name Uncontrolled Emissions (lbs/month)
Controlled Emissions (lbs/month)
Monthly Total
2.0 ug/m3 > ITSL ≥ 0.04 ug/m3
CAS # Chemical Name Uncontrolled Emissions (lbs/month)
Controlled Emissions (lbs/month)
Monthly Total Compliance Criteria: • The total in Box must be ≤ 1,000 pounds or the total in Box must be ≤ 500 pounds. If the total in Box or in Box is
greater than the respective emission limitations, contact your local district office. • The total in Box must be ≤ 20 pounds or the total in Box must be ≤ 10 pounds. If the total in Box or in Box is greater
than the respective emission limitations, contact your local district office.

MICHIGAN DEPARTMENT OF ENVIRONMENTAL QUALITY, ENVIRONMENTAL SCIENCE AND SERVICES DIVISION RULE 290 PERMIT TO INSTALL EXEMPTION: SOURCES WITH LIMITED EMISSIONS RECORD (continued)
EQP 3558 (Rev. 2/05) Page 3 of 7
3. RECORD EMISSIONS OF CARCINOGENIC AIR CONTAMINANTS
IRSL ≥ 0.04 ug/m3 (The emissions of carcinogenic particulate air contaminants with an IRSL ≥ 0.04 ug/m3 must be recorded in this table even though it
is also exempt under Section 6.)
CAS # Chemical Name Uncontrolled Emissions (lbs/month)
Controlled Emissions (lbs/month)
Monthly Total
Compliance Criteria: • The total in Box must be ≤ 20 pounds or the total in Box must be ≤ 10 pounds. If the total in Box or in Box is greater
than the respective emission limitations, contact your local district office.
4. RECORD EMISSIONS OF ALL NONCARCINOGENIC VOCS AND NONCARCINOGENIC, NON-OZONE FORMING MATERIALS LISTED IN RULE 122(f) (see Appendix A)
CAS # Chemical Name Uncontrolled Emissions (lbs/month)
Controlled Emissions (lbs/month)
Monthly Total
Compliance Criteria: • The total in Box must be ≤ 1,000 pounds or the total in Box must be ≤ 500 pounds. If the total in Box or in Box is
greater than the respective emission limitations, contact your local district office.
5. RECORD TOTAL MONTHLY EMISSIONS lbs/monthTotal uncontrolled emissions (Box + Box + Box + Box ) Total controlled emissions (Box + Box + Box + Box ) Compliance Criteria: • The total uncontrolled emissions (Box + Box + Box + Box ) must be ≤ 1,000 pounds. If the total uncontrolled
emissions are greater than 1,000 pounds, contact your local district office; or • The total controlled emissions (Box + Box + Box + Box ) must be ≤ 500 pounds. If the total controlled emissions are
greater than 500 pounds, contact your local district office.

RULE 290 PERMIT TO INSTALL EXEMPTION: SOURCES WITH LIMITED EMISSIONS RECORD (continued)
EQP 3558 (Rev. 2/05) Page 4 of 7
6. NONCARCINOGENIC PARTICULATE AIR CONTAMINANTS
The emission unit may emit noncarcinogenic particulate air contaminants provided that the emission unit is in compliance with the following:
Y N
Are the particulate emissions controlled by an appropriately designed and operated fabric filter collector or an equivalent control system which is designed to control particulate matter to a concentration of less than or equal to 0.01 pounds of particulate per 1,000 pounds of exhaust gases and which do not have an exhaust gas flow rate of more than 30,000 actual cubic feet per minute?
Are the visible emissions from the emission unit not more than 5% opacity in accordance with the methods contained in
Rule 303?
Is the Initial Threshold Screening Level (ITSL) for each particulate air contaminant, excluding nuisance particulate > 2.0 ug/m3?
Notes:
• Quantities of particulates being emitted from an emission unit complying with the requirements in this Section should not be included in Section 2.
• Quantities of noncarcinogenic particulates with an ITSL ≤ 2.0 ug/m3 and ≥ 0.04 ug/m3 must be included in Section 2.
• Quantities of carcinogenic particulates ≥ 0.04 ug/m3 must be included in Section 3. Compliance Criteria:
• If any of the preceding questions concerning noncarcinogenic particulate air contaminants are answered “No”, contact your local district office.
7. OTHER REQUIREMENTS
• Attach emission calculations to demonstrate compliance with the emission limits identified in Sections 2, 3, 4, and 5. • Keep this record on file for a minimum of 2 years, if not required for a longer period from other requirements, i.e. ROP.

MICHIGAN DEPARTMENT OF ENVIRONMENTAL QUALITY, ENVIRONMENTAL SCIENCE AND SERVICES DIVISION RULE 290 PERMIT TO INSTALL EXEMPTION: SOURCES WITH LIMITED EMISSIONS RECORD (continued)
EQP 3558 (Rev. 2/05) Page 5 of 7
APPENDIX A
R 336.1122 Definitions; V.
Rule 122. As used in these rules: (f) "Volatile organic compound" means any compound of carbon or mixture of compounds of carbon that participates in photochemical reactions, excluding the following materials, all of which have been determined by the United States environmental protection agency to have negligible photochemical reactivity:
(i) Carbon monoxide.
(ii) Carbon dioxide.
(iii) Carbonic acid.
(iv) Metallic carbides or carbonates.
(v) Boron carbide.
(vi) Silicon carbide.
(vii) Ammonium carbonate.
(viii) Ammonium bicarbonate.
(ix) Methane.
(x) Ethane.
(xi) The methyl chloroform portion of commercial grades of methyl chloroform, if all of the following provisions are complied with:
(A) The commercial grade of methyl chloroform is used only in a surface coating or coating line that is subject to the requirements of part 6 or 7 of these rules. (B) The commercial grade of methyl chloroform contains no stabilizers other than those listed in table 11. (C) Compliance with the applicable limits specified in part 6 or 7 of these rules is otherwise not technically or economically reasonable. (D) All measures to reduce the levels of all organic solvents, including the commercial grade of methyl chloroform, from the surface coating or coating line to the lowest reasonable level will be implemented. (E) The emissions of the commercial grade of methyl chloroform do not result in a maximum ambient air concentration exceeding any of the allowable ambient air concentrations listed in table 11. (F) The use of the commercial grade of methyl chloroform is specifically identified and allowed by a permit to install, permit to operate, or order of the department. (G) Table 11 reads as follows:

RULE 290 PERMIT TO INSTALL EXEMPTION: SOURCES WITH LIMITED EMISSIONS RECORD (continued)
EQP 3558 (Rev. 2/05) Page 6 of 7
TABLE 11
Commercial grade of methyl chloroform --
allowable ambient air concentrations
Compound ppm1 Time2
Methyl chloroform 3.5 1 hour Tertiary butyl alcohol3 1.0 1 hour Secondary butyl alcohol3 1.0 1 hour Methylal3 10.0 1 hour 1,2-butylene oxide3 0.028
and 0.00041
1 hour annual
1. Parts per million, by volume 2. Averaging time period 3. This compound is a stabilizer
(xii) The methyl chloroform portion of commercial grades of methyl chloroform that contain any other stabilizer not listed in table 11 of this rule, if all of the following provisions are complied with:
(A) The commercial grade of methyl chloroform is used only in a surface coating or coating line that is subject to the requirements of part 6 or 7 of these rules. (B) Compliance with the applicable limits specified in part 6 or 7 of these rules is otherwise not technically or economically reasonable. (C) All measures to reduce the levels of all organic solvents, including the commercial grade of methyl chloroform, from the surface coating or coating line to the lowest reasonable level will be implemented. (D) The emissions of any compound in the commercial grade of methyl chloroform that is listed in table 11 of this rule do not result in a maximum ambient air concentration exceeding any of the allowable ambient air concentrations listed in table 11. (E) The emission of all compounds in the commercial grade of methyl chloroform that are not listed in table 11 is demonstrated to comply with R 336.1901. (F) The use of the commercial grade of methyl chloroform is specifically identified and allowed by a permit to install, permit to operate, or order of the department.
(xiii) Acetone.
(xiv) Cyclic, branched, or linear completely methylated siloxanes.
(xv) Parachlorobenzotrifluoride.
(xvi) Perchloroethylene.
(xvii) Trichlorofluoromethane (CFC-11).
(xviii) Dichlorodifluoromethane (CFC-12).
(xix) 1,1,2-trichloro-1,2,2-trifluoroethane (CFC-113).
(xx) 1,2-dichloro 1,1,2,2-tetrafluoroethane (CFC-114).
(xxi) Chloropentafluoroethane (CFC-115).
(xxii) 1,1-dichloro 1-fluoroethane (HCFC-141b).
(xxiii) 1,chloro 1,1-difluoroethane (HCFC-142b).
(xxiv) Chlorodifluoromethane (HCFC-22).
(xxv) 1,1,1-trifluoro 2,2-dichloroethane (HCFC-123).

MICHIGAN DEPARTMENT OF ENVIRONMENTAL QUALITY, ENVIRONMENTAL SCIENCE AND SERVICES DIVISION RULE 290 PERMIT TO INSTALL EXEMPTION: SOURCES WITH LIMITED EMISSIONS RECORD (continued)
EQP 3558 (Rev. 2/05) Page 7 of 7
(xxvi) 2-chloro-1,1,1,2-tetrafluoroethane (HCFC-124).
(xxvii) Trifluoromethane (HFC-23).
(xxviii) Pentafluoroethane (HFC-125).
(xxix) 1,1,2,2-tetrafluoroethane (HFC-134).
(xxx) 1,1,1,2-tetrafluoroethane (HFC-134a).
(xxxi) 1,1,1-trifluoroethane (HFC-143a).
(xxxii) 1,1-difluoroethane (HFC-152a).
(xxxiii) 3,3-dichloro-1, 1,1,2,2-pentafluoropropane (HCFC-225ca).
(xxxiv) 1,3-dichloro-1,1,2,2,3-pentafluoropropane (HCFC-225cb).
(xxxv) 1,1,1,2,3,4,4,5,5,5-decafluoropentane (HFC 43-10mee).
(xxxvi) Difluoromethane (HFC-32).
(xxxvii) Ethyl fluoride (HFC-161).
(xxxviii) 1,1,1,3,3,3-hexafluoropropane (HFC-236fa).
(xxxix) 1,1,2,2,3-pentafluoropropane (HFC-245ca).
(xl) 1,1,2,3,3- pentafluoropropane ( HFC-245ea).
(xli) 1,1,1,2,3- pentafluoropropane (HFC-245eb).
(xlii) 1,1,1,3,3- pentafluoropropane (HFC-245fa).
(xliii) 1,1,1,2,3,3-hexafluoropropane (HFC-236ea).
(xliv) 1,1,1,3,3-pentafluorobutane (HFC365mfc).
(xlv) Chlorofluoromethane (HCFC-31).
(xlvi) 1,2-dichloro-1,1,2-trifluoroethane (HCFC-123a).
(xlvii) 1-chlor-1-fluoroethane (HCFC-151a).
(xlviii) 1,1,1,2,2,3,3,4,4-nonafluoro-4-methoxybutane.
(xlix) 2-(difluoromethoxymethyl)-1,1,1,2,3,3,3-heptafluoropropane.
(l) 1-ethoxy-1,1,2,2,3,3,4,4,4-nonafluorobutane.
(li) 2-(ethoxydifluoromethyl)-1,1,1,2,3,3,3-heptafluoropropane.
(lii) Methyl acetate.
(liii) Perfluorocarbon compounds that fall into the following classes:
(A) Cyclic, branched, or linear, completely fluorinated alkanes. (B) Cyclic, branched, or linear, completely fluorinated ethers with no unsaturations. (C) Cyclic, branched, or linear, completely fluorinated tertiary amines with no unsaturations. (D) Sulfur-containing perfluorocarbons with no unsaturations and with sulfur bonds only to carbon and fluorine.
(liv) Methylene chloride.
The methods described in R 336.2004 and R 336.2040 shall be used for measuring volatile organic compounds for purposes of determining compliance with emission limits. Where such a method also measures compounds with negligible photochemical reactivity, these negligibly-photochemical reactive compounds may be excluded as volatile organic compounds if the amount of such compounds is accurately quantified and such exclusion is approved by the department.
History: 1979 ACS 1, Eff. Jan. 19, 1980; 1985 MR 2, Eff. Feb. 22, 1985; 1988 MR 5, Eff. May 20, 1988; 1989 MR 4, Eff. Apr. 19, 1989; 1993 MR 4, Eff. Apr. 28, 1993; 1997 MR 5, Eff. June 15, 1997; 2000 MR 18, Eff. November 30, 2000; 2003 MR 5, Eff. March 13, 2003.