guatemala exporter guide annual - usda gain publications/exporter guide... · 20 percent of the...
TRANSCRIPT
THIS REPORT CONTAINS ASSESSMENTS OF COMMODITY AND TRADE ISSUES MADE BY
USDA STAFF AND NOT NECESSARILY STATEMENTS OF OFFICIAL U.S. GOVERNMENT
POLICY
Date:
GAIN Report Number:
Approved By:
Prepared By:
Report Highlights:
The Guatemalan economy relies on foreign exchange generated by the tourism sector, remittances from
the United States and international trade, especially exports to the United States and other Central
American countries.
In 2016, the United States exported a total of $1.1 billion of agricultural products to Guatemala. Some
of the most top U.S. agricultural exports are yellow corn, wheat, soybean meal, and poultry meat.
Post:
I MARKET OVERVIEW
Guatemala City
Edith Vasquez, Marketing Specialist
Sean Cox, Regional Agricultural Attache
Annual
Exporter Guide
Guatemala
GT1715
12/21/2017
Required Report - public distribution

A. Current Economic Situation
Guatemala is Central America’s largest economy, accounting for almost one-third of the region’s gross
domestic product (GDP). In 2016, Guatemala’s GDP was $68.7 billion, a 2.9 percent increase from
2015. Agriculture is one of the main economic drivers. The economy relies on foreign exchange
generated by the tourism sector, remittances from the United States and international trade, especially
exports of goods to the United States and other Central American countries.
The agricultural sector contributes around 13.5 percent of GDP and accounts for 41 percent of total
exports. Industry accounts for 24 percent and services more than 63 percent of the country’s GDP.
Most manufacturing is light assembly and food processing for domestic consumption and export to the
United States and Central America.
The United States-Central America-Dominican Republic Free Trade Agreement (CAFTA-DR) entered
into force in Guatemala on July 1, 2006. CAFTA-DR has led to an increase in bilateral trade between
Guatemala and the United States over the past ten years. In 2016, the United States exported a total of
$1.1 billion of agricultural to Guatemala. Some of the most important exported agricultural products to
Guatemala are yellow corn, wheat, soybean meal, and poultry meat.
Besides CAFTA-DR, Guatemala has free trade agreements (FTA) with Central America (including
Panama), Colombia, Mexico, Dominican Republic, Taiwan, Chile, and the European Union (EU.)
Other partial free trade agreements were signed with Belize, Cuba, Ecuador, and Venezuela. These
negotiations, but specifically the FTA with the European Union, are forcing greater integration within
the Central American Customs Union. The customs union between Guatemala and Honduras officially
started in June 2017.Almost all external import tariffs have been harmonized in the two countries to
facilitate cross-border trade and eliminate opportunities for triangulation of imports.
B. Demographics and Income Distribution
Guatemala has an estimated population of 16 million, the largest in Central America. According to the
National Statistics Institute (INE), in 2016, the labor force in Guatemala was 6.8 million people, the
unemployment rate was 2.4 percent, and the informal economy made up around 4.6 million people, or
65% of Guatemala’s workforce.
In Guatemala City and the surrounding region there are five million people, according to INE.
Guatemala is a young country as almost 35 percent of the population is under 15 years of age compared
to the rest of Central American countries’ average of 25 percent.
Most economic activity in the country revolves around metropolitan areas. Guatemala City and its
surrounding areas offer the biggest concentrated market and are considered the business hub for the rest
of the country.
Guatemala has one of the most unequal income distributions in the Western Hemisphere with the richest
20 percent of the population accounting for more than 51 percent of Guatemala's overall wealth. More
than half of the population is below the national poverty line, and is mostly concentrated in the interior
of the country where up to 40 percent of the people are indigenous. In 2016, the exchange rate was

steady at 7.5 quetzales per 1 U.S. dollar. The skewed income distribution creates a particular pattern of
consumption, where the majority of the population consumes merely for subsistence. Therefore, luxury
goods can only be targeted to a small portion of society. However, U.S. food products are very
competitively priced and are sought out by both high- and middle-income consumers. Other U.S. food
products such as cereals, poultry (chicken leg quarters), pork, fats and oils, and preserved foods, are
normally cheaper than domestically produced products.
It is important for U.S. firms considering exporting to Guatemala to understand that market conditions
are strongly affected by income distribution and there is a major difference in consumer taste and
purchasing decisions between Guatemalans who live in the interior of the country (with the exception of
the tourist areas in Antigua, Panajachel, and Puerto Barrios) and those who live in Guatemala City.
C. Market Size
U.S. agricultural exports to Guatemala:
Product 2012 2013 2014 2015 2016
Bulk Total 358 321 412 393 396
Consumer Oriented Total 300 317 369 367 385
Intermediate Total 315 313 342 315 305
Ag Related Products 12 14 18 16 15
Total 986 966 1,141 1,091 1,101
1. Data Source: U.S. Census Bureau Trade Data
2. Values in millions of dollars
Guatemalan exports to the U.S.:
Product 2012 2013 2014 2015 2016
Bulk Total 792 546 535 473 440
Consumer Oriented Total 1,123 1,224 1,308 1,386 1,430
Intermediate Total 92 48 52 60 45
Forest Products 19 21 23 33 38
Seafood Products 29 30 34 41 31
Total 986 966 1,141 1,091 1,101
1. Data Source: U.S. Census Bureau Trade Data
2. Values in millions of dollars
D. Advantages and Challenges in the Market Facing U.S. Exporters
Advantages Challenges
Strategic geographic access to Guatemala on
both the Atlantic and Pacific Oceans, with
Roads throughout the country are in poor
condition and transportation companies have
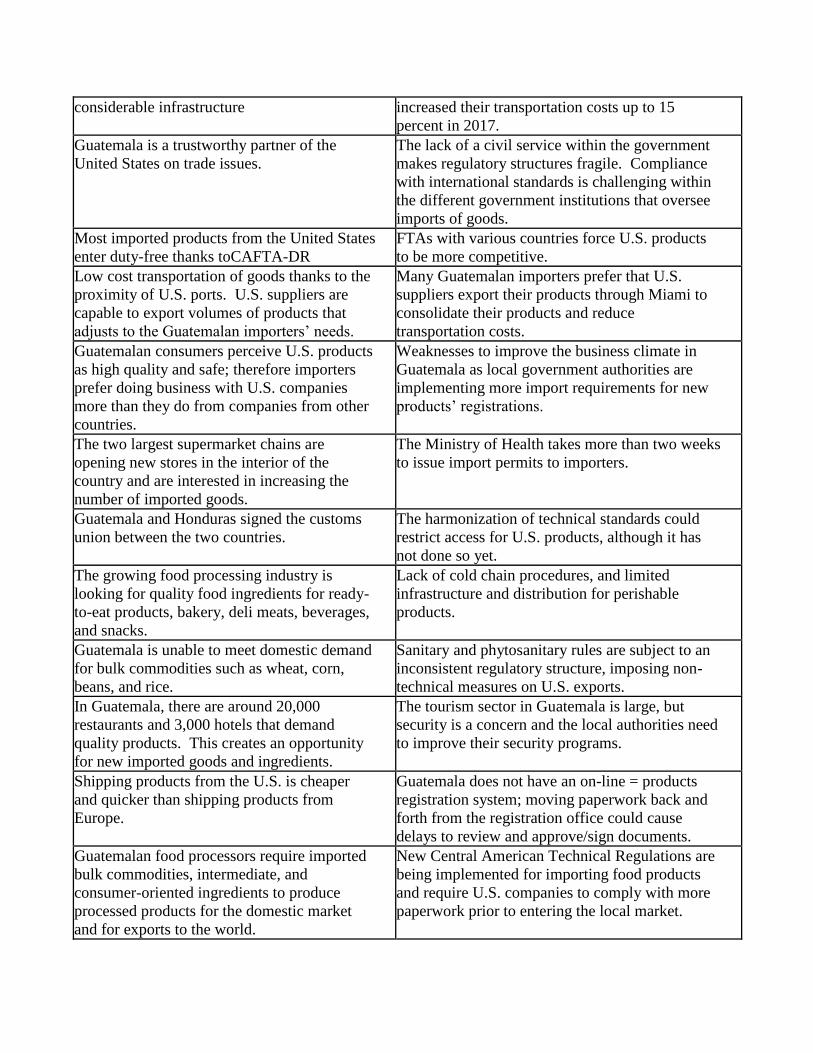
considerable infrastructure increased their transportation costs up to 15
percent in 2017.
Guatemala is a trustworthy partner of the
United States on trade issues.
The lack of a civil service within the government
makes regulatory structures fragile. Compliance
with international standards is challenging within
the different government institutions that oversee
imports of goods.
Most imported products from the United States
enter duty-free thanks toCAFTA-DR
FTAs with various countries force U.S. products
to be more competitive.
Low cost transportation of goods thanks to the
proximity of U.S. ports. U.S. suppliers are
capable to export volumes of products that
adjusts to the Guatemalan importers’ needs.
Many Guatemalan importers prefer that U.S.
suppliers export their products through Miami to
consolidate their products and reduce
transportation costs.
Guatemalan consumers perceive U.S. products
as high quality and safe; therefore importers
prefer doing business with U.S. companies
more than they do from companies from other
countries.
Weaknesses to improve the business climate in
Guatemala as local government authorities are
implementing more import requirements for new
products’ registrations.
The two largest supermarket chains are
opening new stores in the interior of the
country and are interested in increasing the
number of imported goods.
The Ministry of Health takes more than two weeks
to issue import permits to importers.
Guatemala and Honduras signed the customs
union between the two countries.
The harmonization of technical standards could
restrict access for U.S. products, although it has
not done so yet.
The growing food processing industry is
looking for quality food ingredients for ready-
to-eat products, bakery, deli meats, beverages,
and snacks.
Lack of cold chain procedures, and limited
infrastructure and distribution for perishable
products.
Guatemala is unable to meet domestic demand
for bulk commodities such as wheat, corn,
beans, and rice.
Sanitary and phytosanitary rules are subject to an
inconsistent regulatory structure, imposing non-
technical measures on U.S. exports.
In Guatemala, there are around 20,000
restaurants and 3,000 hotels that demand
quality products. This creates an opportunity
for new imported goods and ingredients.
The tourism sector in Guatemala is large, but
security is a concern and the local authorities need
to improve their security programs.
Shipping products from the U.S. is cheaper
and quicker than shipping products from
Europe.
Guatemala does not have an on-line = products
registration system; moving paperwork back and
forth from the registration office could cause
delays to review and approve/sign documents.
Guatemalan food processors require imported
bulk commodities, intermediate, and
consumer-oriented ingredients to produce
processed products for the domestic market
and for exports to the world.
New Central American Technical Regulations are
being implemented for importing food products
and require U.S. companies to comply with more
paperwork prior to entering the local market.

II. EXPORTER’S BUSINESS TIPS
A. Business Customs
The Government of Guatemala (GOG) welcomes foreign investment and generally places few legal or
regulatory restrictions on foreign investors. Guatemala represents a growing market for U.S. companies
and is a country with economic stability, a strategic location with ports on both the Atlantic and Pacific
Oceans, and a close proximity to the United States.
Most business conducted in Guatemala is based on personal relationships. Business executives and
government officials place great importance on personal contacts with suppliers. U.S. suppliers should
be prepared to have a local representative or distributor and be prepared to travel to Guatemala. U.S.
businesspersons often are surprised at the accessibility to key decision-makers and the openness and
frankness of local buyers.
Sales, service, and support rank high in the minds of Guatemalan buyers. U.S. firms, more than other
foreign firms, generally have a reputation for providing good service and support. U.S. firms interested
in penetrating the Guatemalan market should make a commitment to offer excellent customer service to
their buyers, agents or distributors. This commitment should be made clear. Poor or mediocre service
often results in lower sales. The Guatemalan business community is comparatively small and word
travels fast about local and foreign firms that offer poor customer service. Guatemalan importers
normally will require samples of products to look for potential buyers, request U.S. companies to
provide support on marketing efforts of new products, and when placing orders for products, they will
require specific volumes of products; meeting these requirements will result in successful business
relationships.
B. Consumer Taste’s and Preferences
Culturally speaking, Guatemalans have adopted much of the U.S. culture such as music, sports, fashion,
and fast food. Through remittances sent by Guatemalans in the United States, local food tastes are
changing and more high-value foods are now preferred. In addition, many Guatemalans that travel to
the United States on business or tourism are introduced to American food products; therefore,
consumers prefer U.S. products as they are viewed of higher quality. Approximately 43 percent of all
Guatemalan imports of agriculture, fish, and forestry products come from the United States.
Guatemalans have also followed the U.S. trend towards more natural and healthy products, and
consumers are demanding food with less sugar, saturated fat, and cholesterol.
Convenience products have more demand and there is a niche market for refrigerated, ready-to-eat
products, and organic foods. The local processing industry is developing and increasing the production
of processed products such as refried beans, tacos, tortillas, burritos, and corn-based tamales, which are
among the preferred foods in the supermarkets because they are easy to cook/heat and cheap.
Traffic during rush hour is becoming a common problem during the work week (Monday – Friday) and
the majority of people that have a full time work schedule are not able to go back home for lunch which

is the main meal of the day. Full-time workers that do not bring lunch commonly eat at street food
stands (where hot dogs also knowns as “shukos” are widely sold); cafeterias located nearby their office;
or fast food restaurants. Fine dining is more common on the weekends or to celebrate special occasions
for middle and upper class consumers.
In 2015, the Guatemalan Food Trucks Chamber was created and presently, there are 10 food truck
companies that sell gourmet coffee, sandwiches, tacos, hot dogs, pizzas, hamburgers, and Chinese food.
The food trucks do not have a specific location as they move to different areas where most businesses
are located and mainly sell food during lunch hours. Also, they cater to specific social events or they
partner with the Municipality and sell food at public events. This is still a new trend and is becoming
more popular in Guatemala City.
C. Food Standards & Regulations
Import Procedures and Product Registration
The first step to import food products in Guatemala is to register a product. Any producer, processor,
packer, or distributor operating in Guatemala must operate under a sanitary license issued by the
Ministry of Public Health’s Food Control Division. Both the importers and the imported product must
be registered. Product registration is required for all packaged food products in Guatemala.
Food Control in the Ministry of Public Health is responsible for all registrations of processed products.
Regulations and registration procedures and requirements can be consulted on-line at:
http://portal.mspas.gob.gt/index.php/en/servicios/regulacion-y-control-de-alimentos-menu-
servicios.html
For animal origin products, Food Control requires a laboratory test before granting a sanitary
registration number; this registration number is valid for five years and takes six weeks to be issued.
For additional information on import regulations and standards please refer to the FAIRS Report 2017 at
www.fas.usda.gov/scriptsw/attacherep/default.asp.
III. MARKET SECTORS
A. Informal Market
According to the National Employment and Income Survey (INAE), around 4.6 million people work in
the informal market. The informal market is composed of corner stores, open air markets and street
vendors. The corner stores, also known as “tiendas de barrio,” are small stores with an inventory of
$500 of products that mostly sell individual-sized products. Consumers prefer to do their grocery
shopping every day at these stores because of their reduced budget. There are more than 115,000 corner
stores throughout the country. Their major suppliers are distributors, wholesalers and importers, which
also supply to supermarkets. However, they offer very few imported products.
Open-air markets are mainly located in rural areas of the country; however, Guatemala City has 43

open-air markets registered within the city limits. The consumers that shop in the informal market are
middle to low-income groups, but some local restaurants also shop in these markets for fresh produce,
condiments, and other ingredients that can be purchased at lower prices. In Guatemala City there are
two big open markets: La Terminal and Cenma which mainly sell fresh produce from the interior of the
country at very competitive prices.
In terms of street sales, most food products are seasonal fruits and vegetables (strawberries, mushrooms,
loroco, mangoes, tangerines, candies, nuts, snacks, baked goods, and candy cotton). Street vendors
often migrate from the interior to Guatemala City.
B. Retail Sector
It is estimated that only 30 percent of food sales are made through the supermarkets. The retail sector in
Guatemala is dominated by three supermarket chains: PriceSmart, Walmart, and Unisuper (La
Torre/Econosuper.) Walmart continues to be the leading supermarket with 15 percent of the retail value
share. There are some other smaller supermarkets that are trying to gain market share in the retail
sector, but these supermarkets are more targeted to the lower-middle and lower-income consumers.
These stores are smaller with less shelf space to display their products. These supermarkets are: 1)
Super Elmar, S.A., a family-owned company with eight stores in Guatemala City. This supermarket has
stores located within walking distance of residential areas and far away from the traditional commercial
areas where most of the bigger supermarket chains are located. The company buys imported products
from local distributors and is not currently planning to import directly. For the past five years Super
Elmar has not opened any new stores. 2) Comercializadora Gigante, S.A., also known as La Barata, has
10 stores that are mainly located near the open-air markets within Guatemala City and Mixco, Villa
Nueva and Amatitlan. They carry very few imported products and more than 80 percent of their food
items are locally produced goods. 3) Super Del Barrio started its operations in 2007 and by the end of
2014 had opened 28 stores. In 2016, the company opened 5 new stores. The store offers daily discounts
for food items and competes with larger stores attracting costumers that live in nearby residential areas.
In 2016, Save a Lot opened their first store in Guatemala City and most of their products are imported
store-branded goods; however, the store also offers some domestic brands.
Grocery Retailers GBO Company Shares: % Value 2012-2016 % retail value rsp excl sales tax 2012 2013 2014 2015 2016
Wal-Mart Stores Inc 13.7 13.9 14.0 14.5 14.5
Unisuper SA 3.5 3.9 4.4 4.8 5.2
Pastelería Holandesa SA 0.3 0.3 0.4 0.4 0.5
Cervecería Centroamericana SA 0.2 0.2 0.4 0.4 0.4
La Barata SA 0.3 0.3 0.3 0.3 0.3
Super del Barrio 0.3 0.3 0.4 0.3 0.3
La Panería SA 0.2 0.2 0.2 0.2 0.2
Grupo Terra 0.1 0.1 0.1 0.2 0.2
Imaginova SA 0.1 0.1 0.1 0.1 0.1
Del Barrio Tiendas SA - - 0.0 0.1 0.1
Pan Pavallier SA 0.1 0.1 0.1 0.1 0.1
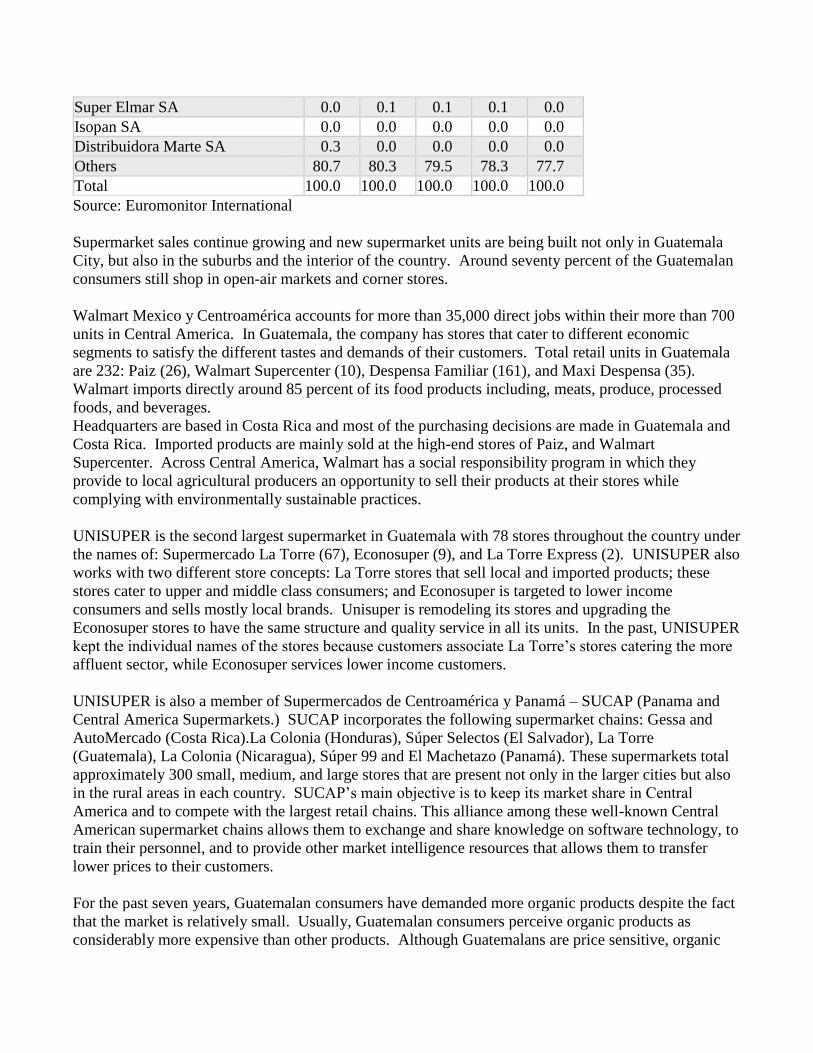
Super Elmar SA 0.0 0.1 0.1 0.1 0.0
Isopan SA 0.0 0.0 0.0 0.0 0.0
Distribuidora Marte SA 0.3 0.0 0.0 0.0 0.0
Others 80.7 80.3 79.5 78.3 77.7
Total 100.0 100.0 100.0 100.0 100.0
Source: Euromonitor International
Supermarket sales continue growing and new supermarket units are being built not only in Guatemala
City, but also in the suburbs and the interior of the country. Around seventy percent of the Guatemalan
consumers still shop in open-air markets and corner stores.
Walmart Mexico y Centroamérica accounts for more than 35,000 direct jobs within their more than 700
units in Central America. In Guatemala, the company has stores that cater to different economic
segments to satisfy the different tastes and demands of their customers. Total retail units in Guatemala
are 232: Paiz (26), Walmart Supercenter (10), Despensa Familiar (161), and Maxi Despensa (35).
Walmart imports directly around 85 percent of its food products including, meats, produce, processed
foods, and beverages.
Headquarters are based in Costa Rica and most of the purchasing decisions are made in Guatemala and
Costa Rica. Imported products are mainly sold at the high-end stores of Paiz, and Walmart
Supercenter. Across Central America, Walmart has a social responsibility program in which they
provide to local agricultural producers an opportunity to sell their products at their stores while
complying with environmentally sustainable practices.
UNISUPER is the second largest supermarket in Guatemala with 78 stores throughout the country under
the names of: Supermercado La Torre (67), Econosuper (9), and La Torre Express (2). UNISUPER also
works with two different store concepts: La Torre stores that sell local and imported products; these
stores cater to upper and middle class consumers; and Econosuper is targeted to lower income
consumers and sells mostly local brands. Unisuper is remodeling its stores and upgrading the
Econosuper stores to have the same structure and quality service in all its units. In the past, UNISUPER
kept the individual names of the stores because customers associate La Torre’s stores catering the more
affluent sector, while Econosuper services lower income customers.
UNISUPER is also a member of Supermercados de Centroamérica y Panamá – SUCAP (Panama and
Central America Supermarkets.) SUCAP incorporates the following supermarket chains: Gessa and
AutoMercado (Costa Rica).La Colonia (Honduras), Súper Selectos (El Salvador), La Torre
(Guatemala), La Colonia (Nicaragua), Súper 99 and El Machetazo (Panamá). These supermarkets total
approximately 300 small, medium, and large stores that are present not only in the larger cities but also
in the rural areas in each country. SUCAP’s main objective is to keep its market share in Central
America and to compete with the largest retail chains. This alliance among these well-known Central
American supermarket chains allows them to exchange and share knowledge on software technology, to
train their personnel, and to provide other market intelligence resources that allows them to transfer
lower prices to their customers.
For the past seven years, Guatemalan consumers have demanded more organic products despite the fact
that the market is relatively small. Usually, Guatemalan consumers perceive organic products as
considerably more expensive than other products. Although Guatemalans are price sensitive, organic

buyers do not see price as an issue when making purchasing decisions.
It is estimated that around 90 percent of organic products are sold and distributed through specialized
stores. Presently, Orgánica (5 stores) and Fresko (1 store) sell organic fresh and processed products.
Natura Foods Market is an on-line supplier of organic foods. Caoba Farms also offers organic fresh
produce that is sold at their farm in Antigua, Guatemala.
U.S. organic products have export opportunities to the Guatemalan market in the following product
categories: processed fruits and vegetables, juices, energy drinks, cooking oils, dairy, tree nuts, snacks,
breakfast cereals, condiments & sauces, confectionary products, and sweeteners.
Trends and Highlights
Supermarkets continue their expansion to other cities in the interior of the country and to some
of the nearby areas around Guatemala City.
Supermarket sales continue to grow and are still competing with open markets and corner stores.
For this reason, supermarkets are building stores closer to residential areas to capture more
costumers.
Consumers that live in residential areas outside city limits have no option but to go to a
supermarket close to their homes for smaller purchases during the week.
The membership discount club and bulk purchase concept has gained acceptance among
consumers, as many find it more convenient for one-stop shopping.
Going to the supermarkets is a family activity and therefore, marketing activities to promote new
products during the weekends occur more often than any other day of the week. Many products
are sampled during peak hours to motivate and attract consumers.
In the three major supermarket chains, convenience and prepared foods are gaining acceptance
as consumers try to reduce time spent preparing foods at home. Also, business people tired of
fast-food restaurants for lunch, look for prepared meals sold in supermarkets. A wide variety
can be found from local typical foods to imported foods.
Overall, frozen prepared foods account for 10 percent of imported food sales. The product
variety is very limited.
There is a growing trend to eat healthier foods low in calories and cholesterol. Most
supermarkets have a diversity of dry, frozen and ready-to-eat products. Also, organic, sugar and
gluten-free products are expanding their shelf share and grow every year. These products
include products such as yogurts, candies, jams, cookies, cereals, and crackers.
Supermarkets offer a variety of services under the same roof from bill payment services, coffee
shops, drugstores, and delis to dry cleaning services.
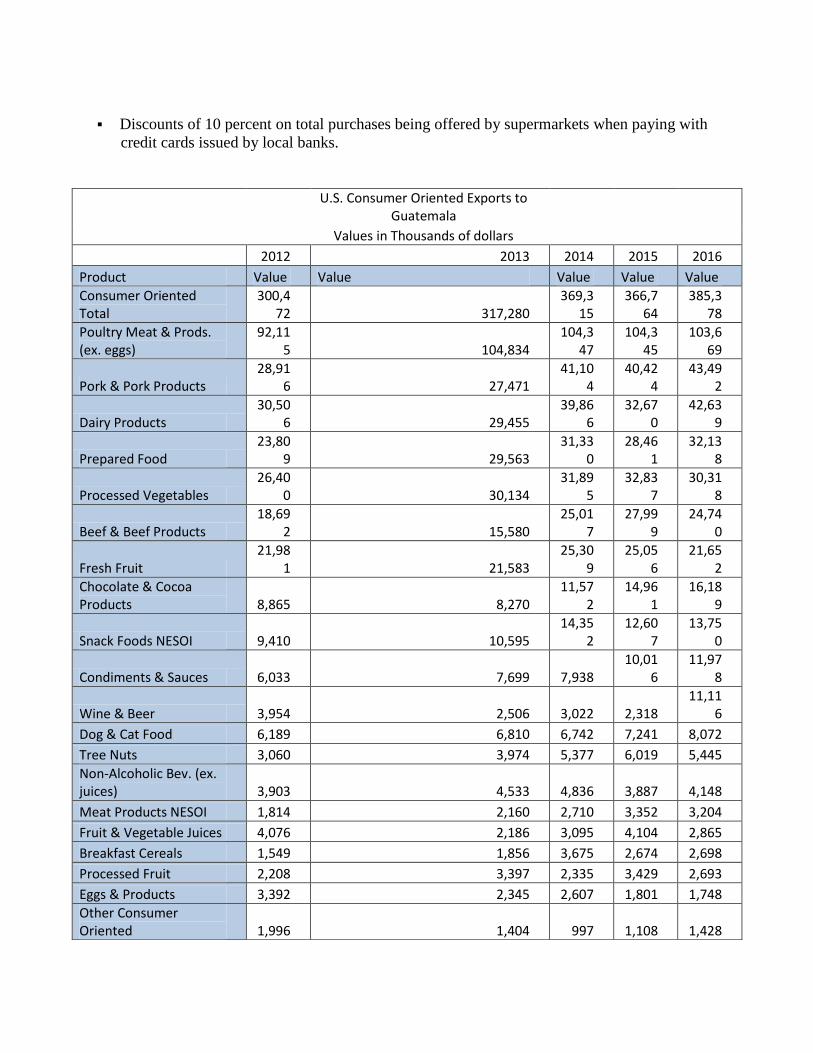
Discounts of 10 percent on total purchases being offered by supermarkets when paying with
credit cards issued by local banks.
U.S. Consumer Oriented Exports to
Guatemala
Values in Thousands of dollars
2012 2013 2014 2015 2016
Product Value Value Value Value Value
Consumer Oriented Total
300,472 317,280
369,315
366,764
385,378
Poultry Meat & Prods. (ex. eggs)
92,115 104,834
104,347
104,345
103,669
Pork & Pork Products 28,91
6 27,471 41,10
4 40,42
4 43,49
2
Dairy Products 30,50
6 29,455 39,86
6 32,67
0 42,63
9
Prepared Food 23,80
9 29,563 31,33
0 28,46
1 32,13
8
Processed Vegetables 26,40
0 30,134 31,89
5 32,83
7 30,31
8
Beef & Beef Products 18,69
2 15,580 25,01
7 27,99
9 24,74
0
Fresh Fruit 21,98
1 21,583 25,30
9 25,05
6 21,65
2
Chocolate & Cocoa Products 8,865 8,270
11,572
14,961
16,189
Snack Foods NESOI 9,410 10,595 14,35
2 12,60
7 13,75
0
Condiments & Sauces 6,033 7,699 7,938 10,01
6 11,97
8
Wine & Beer 3,954 2,506 3,022 2,318 11,11
6
Dog & Cat Food 6,189 6,810 6,742 7,241 8,072
Tree Nuts 3,060 3,974 5,377 6,019 5,445
Non-Alcoholic Bev. (ex. juices) 3,903 4,533 4,836 3,887 4,148
Meat Products NESOI 1,814 2,160 2,710 3,352 3,204
Fruit & Vegetable Juices 4,076 2,186 3,095 4,104 2,865
Breakfast Cereals 1,549 1,856 3,675 2,674 2,698
Processed Fruit 2,208 3,397 2,335 3,429 2,693
Eggs & Products 3,392 2,345 2,607 1,801 1,748
Other Consumer Oriented 1,996 1,404 997 1,108 1,428

Fresh Vegetables 1,606 926 1,189 1,455 1,396
Grand Total 300,4
72 317,280 369,3
15 366,7
64 385,3
78
1. Data Source: U.S. Census Bureau Trade Data
C. Hotel, Restaurant and Institutions
Hotels
Approximately 2,700 hotels, motels and bed and breakfasts operate in Guatemala and provide
accommodation for both the business and the tourism sector. In 2017, four new hotels began
operations in Guatemala: Hyatt Centric with an investment of almost $29 million offering 138 rooms;
and Marriott International with an investment of $25 million, which opened two units: Courtyard
Marriot with 147 rooms; AC Marriott with 114 rooms; and Hotel Latam in the interior of the country,
offering 69 rooms.
Antigua Guatemala is the closest tourism destination to Guatemala City and has more than 150 hotels of
which 15 are boutique hotels. According to the Guatemalan Tourism Institute (INGUAT), close to 70
percent of all tourists that travel to Guatemala visit Antigua Guatemala. Vacation rentals in Guatemala
through services such as Airbnb are becoming more popular for international visitors as well for
Guatemalan tourists.
INGUAT reported that 1.9 million tourists visited Guatemala generating an income in 2016 of more
than $1.7 billion. This sector also contributes 3.4 percent to the country’s GDP. Guatemala City is
where the greatest number of three to five-star hotels are located.
In 2016, the highest number of travelers to Guatemala was from Central America totaling 1million
visitors, followed by North America with 491,591 visitors.
According to INGUAT 40 percent of the travelers visited Guatemala on vacations and spent 32 percent
of their travel funds to eat. The most visited places were Antigua, followed by Guatemala City, and
Peten (where the Mayan ruins of Tikal are located.)
Hotels rely on food service importers to purchase high-end products such as fine wines, meats, gourmet
style dips, jellies, sauces, deli-meats, dairy products, baking mixes, and seafood. The purchase of fresh
produce is regularly done at the farmer markets and supermarkets. Guatemala also has a well-developed
food processing industry that offers a variety of food products that service most hotels and restaurants
throughout the country.
D. Restaurants
According to the Guatemalan Restaurant Council (GREGUA), over the past ten years the number of
restaurants increased from 13,605 restaurants in 2013 to 22,000 in 2015. Fast food restaurants have
grown in sales by offering home delivery services. Fast food restaurants are also an option for business
people.
A study carried out by Millward Brow, an American research organization, estimated that 76 out of 100
Guatemalans prefer to eat at fast food restaurants rather than formal dining restaurants. The preference
for fast food restaurants is due to pricing, proximity to work and residential areas, and kids’
entertainment areas. Consumer preferences are divided as follows: 19 percent prefer casual restaurants,
7 percent gourmet restaurants and the rest are divided among food stalls (27 percent), food carts (17
percent), sales on the street (12 percent) and other options (17 percent). The most popular types of fast
food in Guatemala are hamburgers, pizza, tacos, and fried chicken.
There are more than 20 U.S. franchises in Guatemala and new ones are opening each year.
Guatemalan cuisine is diverse but most local dishes include white corn, the main staple of the country.
Restaurants also buy products directly from food service suppliers, local food processing companies,
importers, supermarkets, and farmer markets.
E. The Institutional Market
The following sectors are considered important within the institutional market in Guatemala and depend
on the Government of Guatemala (GOG) for acquisition of food products:
Government social programs
Public hospitals
Penitentiary system
Public schools for their feeding programs
In Guatemala there are more than twenty social and sport clubs; most of them are located within
Guatemala City. These clubs buy food and beverages from local importers/distributors, farmer markets,
and wholesale markets. Many of the clubs rent their facilities for social activities like weddings and
baby showers, and are available for members and non-members.
F. Food Processing
The food and beverage processing industry represents more than 42 percent of industrial production.
There are more than two hundred food processing companies that produce the following:
Beverages: juice concentrates, powder drinks, alcoholic, and non-alcoholic beverages
Preserved foods: canned fruits and vegetables, jams, jellies
Confectionary: hard candies, chewing gum, chocolates, traditional candies
Other processed foods: soups, snacks, condiments, sauces, bakery, deli meats, dairy
Guatemala is a major importer of raw materials and ingredients; therefore, U.S. ingredients have a big
opportunity in the Guatemalan food processing industry. Guatemala imported a total of $1.5 billion in
2016 of consumer oriented products from the world (from which $385 million were exported from the
U.S.) and exported $2.4 billion mainly to the United States and Central America.
Since the implementation of CAFTA-DR, Guatemala has found new opportunities to increase exports of
processed food products to other Central American countries and some companies are also focusing on
the nostalgia market composed of Guatemalans and other Central Americans living in the United States.
The main basket of products exported to Guatemalans living in the United States is made up of tamales
(corn based food), alcoholic drinks, preserved foods, dehydrated fruit punch, and plantain leaves used to
prepare homemade tamales. Every year exports of these products increases approximately five percent
during the Christmas holidays.
The food processing industry is divided into several different sub-sectors, but non-alcoholic beverages
and preserved foods are two main categories that capture around 40 percent of total national production
followed by baked goods, which has 15 percent of total exports.
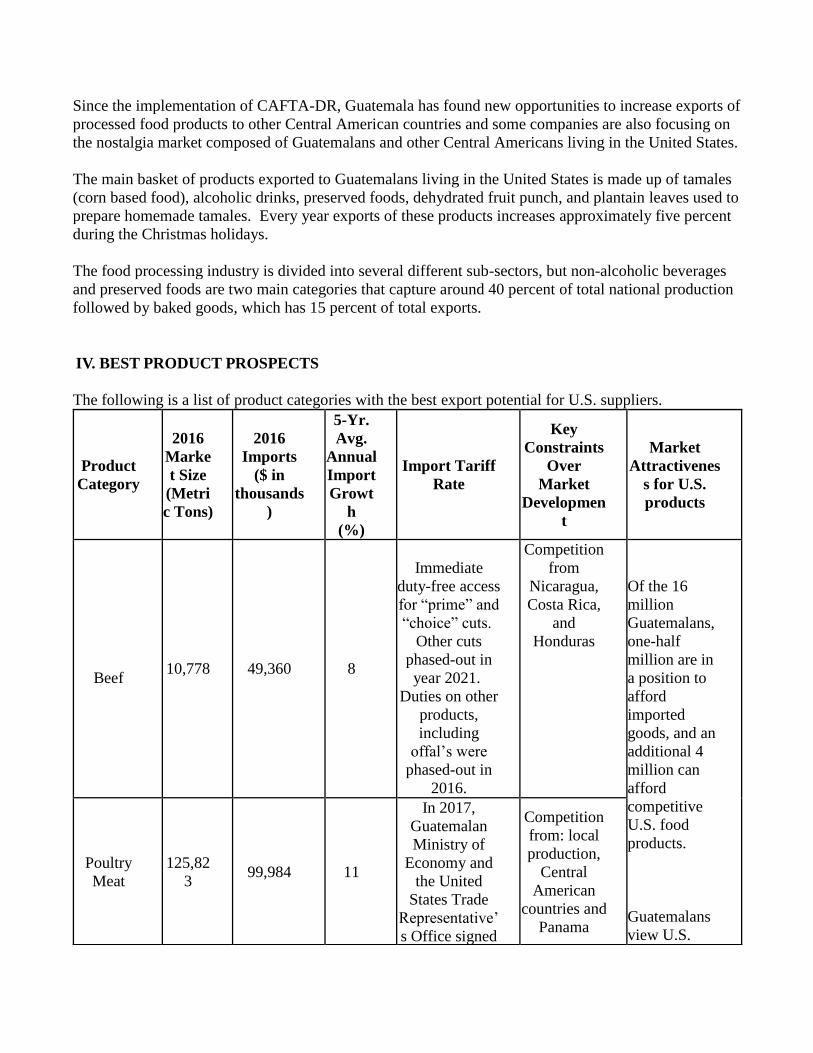
IV. BEST PRODUCT PROSPECTS
The following is a list of product categories with the best export potential for U.S. suppliers.
Product
Category
2016
Marke
t Size
(Metri
c Tons)
2016
Imports
($ in
thousands
)
5-Yr.
Avg.
Annual
Import
Growt
h
(%)
Import Tariff
Rate
Key
Constraints
Over
Market
Developmen
t
Market
Attractivenes
s for U.S.
products
Beef 10,778 49,360 8
Immediate
duty-free access
for “prime” and
“choice” cuts.
Other cuts
phased-out in
year 2021.
Duties on other
products,
including
offal’s were
phased-out in
2016.
Competition
from
Nicaragua,
Costa Rica,
and
Honduras
Of the 16
million
Guatemalans,
one-half
million are in
a position to
afford
imported
goods, and an
additional 4
million can
afford
competitive
U.S. food
products.
Guatemalans
view U.S.
Poultry
Meat
125,82
3 99,984 11
In 2017,
Guatemalan
Ministry of
Economy and
the United
States Trade
Representative’
s Office signed
Competition
from: local
production,
Central
American
countries and
Panama

an agreement to
eliminate the
tariff on U.S.
chicken leg
quarters. The
elimination of
the tariff will
allow U.S. leg
quarters to
continue
entering into
Guatemala
duty-free.
products as of
higher quality
and safer than
local products.
Importers are
eager to take
full advantage
of CAFTA-
DR and favor
trading with
U.S.
exporters.
Processed
Fruit &
Vegetable
s
85,394 125,936 7
Competition
from: Chile,
Mexico,
Peru, and
Canada
Dairy
Products
(excl.
cheese)
92,533 167,160 2
Under CAFTA-
DR dairy
products will
achieve free
trade in year
2025.
Costa Rica
and
Nicaragua
offer
competitive
prices due to
low
transportatio
n costs.
Snack
Foods
52,527 118,425 2
Competition
from:
Mexico, El
Salvador,
and Costa
Rica
V. POST INFORMATION
If you need assistance exporting to Guatemala, please contact the U.S. Agricultural Affairs Office at the
following address:
Office of Agricultural Affairs
Avenida Reforma 7-01, Zona 10
Guatemala, Ciudad 01010
Tel: (502) 2332-4030
Fax: (502) 2331-8293
Email: [email protected]
For more information on exporting U.S. agricultural products to other countries, please visit the Foreign
Agricultural Service home page: http://www.fas.usda.gov
VI. LIST OF MAJOR REGULATORY AGENCIES
Name: Bernardo Molina
Title: Deputy Director
Institution: Food Control Unit/Ministry of Health (MSPAS)
Address: 3 Calle final, 2-10 Zona 15. Valles de Vista Hermosa. Guatemala
Telefax: (502) 2502-2502
Website: www.mspas.gob.gt
Name: Lic. Guillermo Ortiz
Title: SPS Director
Institution: Norms and Regulations Unit/Ministry of Agriculture (MAGA)
Address: 7 Avenida 3-67 Zona 13, Guatemala City, Guatemala
Telephone: (502) 2413-7000
Website: http://www.maga.gob.gt
Name: Nidia Sandoval
Title: Representative for OIRSA-Guatemala
Institution: Inter-Regional Organism for Plant and Animal Health/Ministry of Agriculture
(MAGA)
Address: 21 Avenida 3-12, Zona 15, Guatemala
Telephone: (502) 2500-9200
Fax: (502) 2500-9349
Website: www.oirsa.org
Name: Lic. Alexander Cutz
Title: CAFTA-DR Administrator
Institution: Foreign Commerce Administration Direction/Ministry of Economy
Address: 6 Avenida 10-43 Zona 1, Guatemala
Telephone: (502) 2412-0200
Website: http://www.mineco.gob.gt/
Name: Maria Elisa Chang
Title: International Agreements Unit
Institution: Superintendence of Tax Administration (SAT)/Customs Authority
Address: 7a Av. 3-73, Zona 9, Edificio Torre SAT, Guatemala
Telephone: (502) 2329-7070 ext. 1313
Website: http://portal.sat.gob.gt/sitio/
APPENDIXES
APPENDIX I STATISTICS
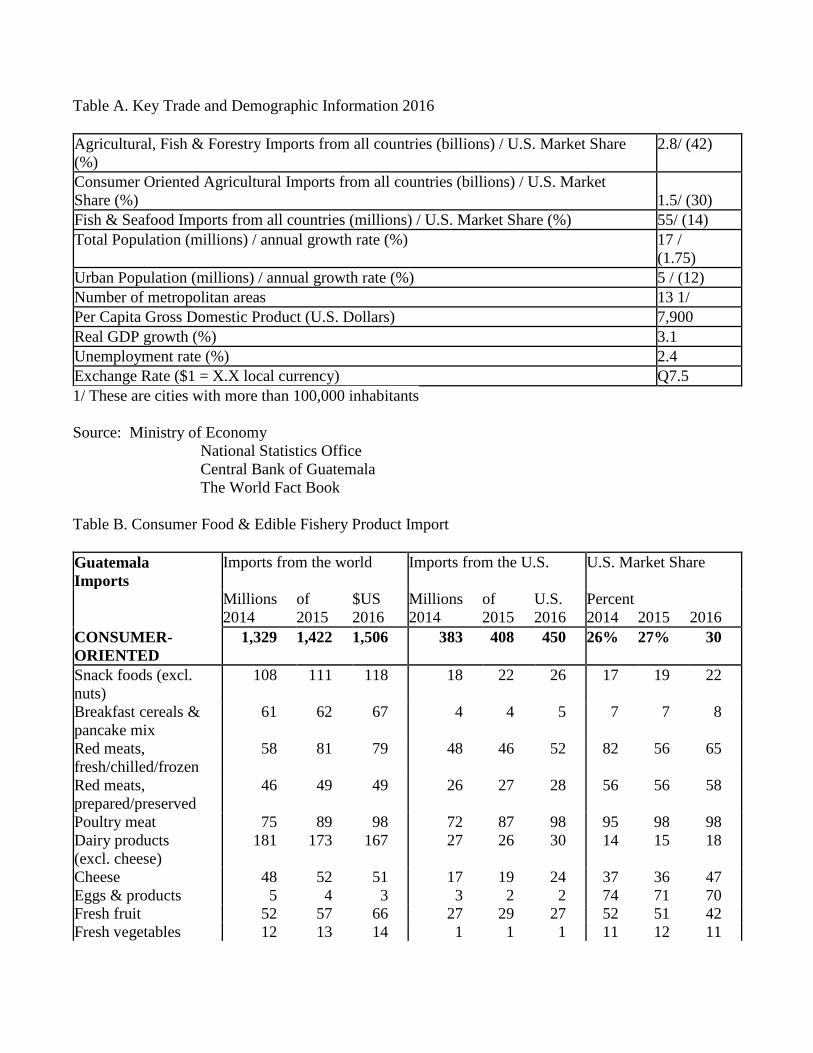
Table A. Key Trade and Demographic Information 2016
Agricultural, Fish & Forestry Imports from all countries (billions) / U.S. Market Share
(%)
2.8/ (42)
Consumer Oriented Agricultural Imports from all countries (billions) / U.S. Market
Share (%)
1.5/ (30)
Fish & Seafood Imports from all countries (millions) / U.S. Market Share (%) 55/ (14)
Total Population (millions) / annual growth rate (%) 17 /
(1.75)
Urban Population (millions) / annual growth rate (%) 5 / (12)
Number of metropolitan areas 13 1/
Per Capita Gross Domestic Product (U.S. Dollars) 7,900
Real GDP growth (%) 3.1
Unemployment rate (%) 2.4
Exchange Rate ($1 = X.X local currency) Q7.5
1/ These are cities with more than 100,000 inhabitants
Source: Ministry of Economy
National Statistics Office
Central Bank of Guatemala
The World Fact Book
Table B. Consumer Food & Edible Fishery Product Import
Guatemala
Imports
Imports from the world Imports from the U.S. U.S. Market Share
Millions of $US Millions of U.S. Percent
2014 2015 2016 2014 2015 2016 2014 2015 2016
CONSUMER-
ORIENTED
1,329 1,422 1,506 383 408 450 26% 27% 30
Snack foods (excl.
nuts)
108 111 118 18 22 26 17 19 22
Breakfast cereals &
pancake mix
61 62 67 4 4 5 7 7 8
Red meats,
fresh/chilled/frozen
58 81 79 48 46 52 82 56 65
Red meats,
prepared/preserved
46 49 49 26 27 28 56 56 58
Poultry meat 75 89 98 72 87 98 95 98 98
Dairy products
(excl. cheese)
181 173 167 27 26 30 14 15 18
Cheese 48 52 51 17 19 24 37 36 47
Eggs & products 5 4 3 3 2 2 74 71 70
Fresh fruit 52 57 66 27 29 27 52 51 42
Fresh vegetables 12 13 14 1 1 1 11 12 11
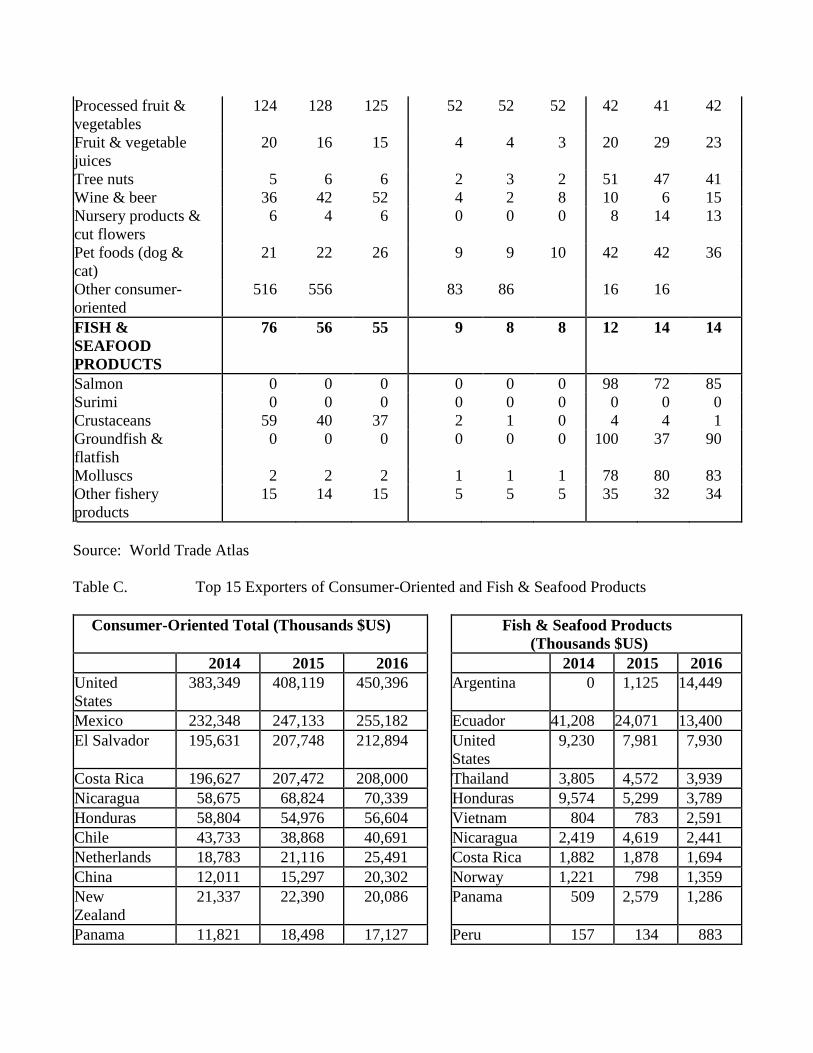
Processed fruit &
vegetables
124 128 125 52 52 52 42 41 42
Fruit & vegetable
juices
20 16 15 4 4 3 20 29 23
Tree nuts 5 6 6 2 3 2 51 47 41
Wine & beer 36 42 52 4 2 8 10 6 15
Nursery products &
cut flowers
6 4 6 0 0 0 8 14 13
Pet foods (dog &
cat)
21 22 26 9 9 10 42 42 36
Other consumer-
oriented
516 556 83 86 16 16
FISH &
SEAFOOD
PRODUCTS
76 56 55 9 8 8 12 14 14
Salmon 0 0 0 0 0 0 98 72 85
Surimi 0 0 0 0 0 0 0 0 0
Crustaceans 59 40 37 2 1 0 4 4 1
Groundfish &
flatfish
0 0 0 0 0 0 100 37 90
Molluscs 2 2 2 1 1 1 78 80 83
Other fishery
products
15 14 15 5 5 5 35 32 34
Source: World Trade Atlas
Table C. Top 15 Exporters of Consumer-Oriented and Fish & Seafood Products
Consumer-Oriented Total (Thousands $US) Fish & Seafood Products
(Thousands $US)
2014 2015 2016 2014 2015 2016
United
States
383,349 408,119 450,396 Argentina 0 1,125 14,449
Mexico 232,348 247,133 255,182 Ecuador 41,208 24,071 13,400
El Salvador 195,631 207,748 212,894 United
States
9,230 7,981 7,930
Costa Rica 196,627 207,472 208,000 Thailand 3,805 4,572 3,939
Nicaragua 58,675 68,824 70,339 Honduras 9,574 5,299 3,789
Honduras 58,804 54,976 56,604 Vietnam 804 783 2,591
Chile 43,733 38,868 40,691 Nicaragua 2,419 4,619 2,441
Netherlands 18,783 21,116 25,491 Costa Rica 1,882 1,878 1,694
China 12,011 15,297 20,302 Norway 1,221 798 1,359
New
Zealand
21,337 22,390 20,086 Panama 509 2,579 1,286
Panama 11,821 18,498 17,127 Peru 157 134 883

Spain 14,882 12,741 16,142 China 495 469 255
Colombia 9,631 14,041 14,415 Spain 266 205 227
Germany 8,040 7,991 11,833 India 84 0 170
Ireland 4,788 6,561 10,646 Indonesia 263 348 136
World 1,329,752 1,422,245 1,506,475 World 76,305 56,940 55,145
Source: World Trade Atlas