guam - usda - nass, census of agriculture · guam island data volume 1 • geographic area series...
TRANSCRIPT

GuamIsland Data
Volume 1 • Geographic Area Series • Part 53
Issued February 2009
United States Department of AgricultureNational Agricultural Statistics ServiceCynthia Z.F. Clark, Administrator

2007 CENSUS OF AGRICULTURE CONTENTS III
Contents
Page
Introduction . . . . . . . . . . . . . . . . . . . . . . . . . . . . . . . . . . . . . . . . . . . . . . . . . . . . . . . . . . . . . . . . . . . . . . . . . . . . . . . . . . . . . . V
Island Map . . . . . . . . . . . . . . . . . . . . . . . . . . . . . . . . . . . . . . . . . . . . . . . . . . . . . . . . . . . . . . . . . . . . . . . . . . . . . . . . . . . . . . 1
TABLES
Island Data
1. Farms, Land in Farms, and Land Use: 2007 and 2002 . . . . . . . . . . . . . . . . . . . . . . . . . . . . . . . . . . . . . . . . . . . . . . . 2
2. Farms and Land in Farms by Size of Farm: 2007 and 2002 . . . . . . . . . . . . . . . . . . . . . . . . . . . . . . . . . . . . . . . . . . . 2
3. Tenure and Characteristics of Operators: 2007 and 2002 . . . . . . . . . . . . . . . . . . . . . . . . . . . . . . . . . . . . . . . . . . . . 2
4. Farm Characteristics: 2007 and 2002 . . . . . . . . . . . . . . . . . . . . . . . . . . . . . . . . . . . . . . . . . . . . . . . . . . . . . . . . . . . . 3
5. Irrigation: 2007 and 2002 . . . . . . . . . . . . . . . . . . . . . . . . . . . . . . . . . . . . . . . . . . . . . . . . . . . . . . . . . . . . . . . . . . . . . . 3
6. Market Value of Agricultural Products Sold: 2007 and 2002 . . . . . . . . . . . . . . . . . . . . . . . . . . . . . . . . . . . . . . . . . . . 3
7. Selected Farm Production Expenses: 2007 and 2002 . . . . . . . . . . . . . . . . . . . . . . . . . . . . . . . . . . . . . . . . . . . . . . . 4
8. Root Crops Harvested for Sale: 2007 and 2002 . . . . . . . . . . . . . . . . . . . . . . . . . . . . . . . . . . . . . . . . . . . . . . . . . . . . 4
9. Vegetables and Melons Harvested for Sale: 2007 and 2002 . . . . . . . . . . . . . . . . . . . . . . . . . . . . . . . . . . . . . . . . . . . 4
10. Fruits, Nuts, and Nursery Crops (including ornamental plants) Harvested for Sale: 2007 and 2002 . . . . . . . . . . . . . 5
11. Livestock, Poultry, and Their Products: 2007 and 2002 . . . . . . . . . . . . . . . . . . . . . . . . . . . . . . . . . . . . . . . . . . . . . . . 6
12. Fish and Other Aquaculture Products: 2007 and 2002 . . . . . . . . . . . . . . . . . . . . . . . . . . . . . . . . . . . . . . . . . . . . . . . 6
Summary Data
13. Summary by Tenure of Operator: 2007 . . . . . . . . . . . . . . . . . . . . . . . . . . . . . . . . . . . . . . . . . . . . . . . . . . . . . . . . . . . 7
14. Summary by Age of Operator: 2007 . . . . . . . . . . . . . . . . . . . . . . . . . . . . . . . . . . . . . . . . . . . . . . . . . . . . . . . . . . . . 10
15. Summary by Size of Farm: 2007 . . . . . . . . . . . . . . . . . . . . . . . . . . . . . . . . . . . . . . . . . . . . . . . . . . . . . . . . . . . . . . . 16
16. Summary by Market Value of Agricultural Products Sold: 2007 . . . . . . . . . . . . . . . . . . . . . . . . . . . . . . . . . . . . . . . 22
APPENDIXES
A. General Explanation . . . . . . . . . . . . . . . . . . . . . . . . . . . . . . . . . . . . . . . . . . . . . . . . . . . . . . . . . . . . . . . . . . . . . . . . . A-1
B. Report Form . . . . . . . . . . . . . . . . . . . . . . . . . . . . . . . . . . . . . . . . . . . . . . . . . . . . . . . . . . . . . . . . . . . . . . . . . . . . . . . B-1
Index . . . . . . . . . . . . . . . . . . . . . . . . . . . . . . . . . . . . . . . . . . . . . . . . . . . . . . . . . . . . . . . . . . . . . . . . . . . . . . . . . . . . . Index 1
2007 CENSUS OF AGRICULTURE INTRODUCTION V
HISTORY
For more than 150 years, the U.S. Department of Commerce, Bureau of the Census, conducted the census of agriculture. However,the 1997 Appropriations Act transferred the responsibility from the Bureau of the Census to the U.S. Department of Agriculture (USDA),National Agricultural Statistics Service (NASS). The 2007 Census of Agriculture for Guam is the second census to be conducted by theNational Agricultural Statistics Service.
The census of agriculture is taken to obtain agricultural statistics for each county, State (including territories and protectorates), andthe Nation. The first U.S. agricultural census data were collected in 1840 as a part of the sixth decennial census. From 1840 to 1920,an agricultural census was taken as a part of each decennial census. Since 1920, a separate national agricultural census has beentaken every 5 years.
The 2007 census is the 14th census of agriculture of Guam. The first, taken in 1920, was a special census authorized by theSecretary of Commerce. The next agriculture census was taken in 1930 in conjunction with the decennial census, a practice thatcontinued every 10 years through 1960. The 1964 Census of Agriculture was the first quinquennial (5-year) census to be taken inGuam. In 1976, Congress authorized the census of agriculture to be taken for 1978 and 1982 to adjust the data-reference year tocoincide with other economic censuses. After 1982, the agriculture census reverted to a 5-year cycle for the years ending in 2 and 7.
CENSUS USES
The census of agriculture is the leading source of statistics about Guam’s agricultural production and the only source of
consistent, comparable data at the election district level. Census statistics are used to measure agricultural production
and to identify trends in an ever-changing agricultural sector. Many local programs use census data as a benchmark for
designing and evaluating surveys. Private industry uses census statistics to provide a more effective production and
distribution system for the agricultural community.
AUTHORITY AND AREA COVERED
The census of agriculture is required by law under the “Census of Agriculture Act of 1997,” Public Law 105-113 (Title 7,
United States Code, Section 2204g). The law directs the Secretary of Agriculture to conduct a census of agriculture in
1998 and in every fifth year thereafter, covering the prior year. The census of agriculture includes each State, Puerto Rico,
Guam, the U.S. Virgin Islands, and the Commonwealth of Northern Mariana Islands.
The census data for Guam were collected in accordance with a Memorandum of Understanding approved by the
Administrator of NASS and by the Commissioner of Agriculture of Guam. It was conducted with the cooperation and
assistance of the Guam Department of Agriculture.
FARM DEFINITION
The statistics collected in the census relate to places with agricultural operations qualifying as farms according to the
census definition. In Guam this included all places from which $1,000 or more of agricultural products were produced and
sold, or normally would have been sold, during the 12-month period between January 1 and December 31, 2007. The farm
definition is the same as used in the 1998 Census of Agriculture for Guam.
COMPARABILITY OF DATA
In general, the data from the 2007 census are comparable with those of previous censuses. All dollar values
presented in this report are in current dollars, i.e., 2007 data are in 2007 dollars and 1997 data in 1997 dollars. The dollar
values have not been adjusted for changes in price levels between census years.
Introduction

INTRODUCTION VI 2007 CENSUS OF AGRICULTURE
TABULAR PRESENTATION
Tables 1 through 12 show detailed island data accompanied by historic data from the previous census. Tables 13
through 16 provide 2007 island data cross-tabulated by tenure of operator, age of operator, size of farm, and market value
of agricultural products sold. Because of the declining number of farms, tables providing data by election district which
have been provided in the past, are not available for 2007.
RESPONDENT CONFIDENTIALITY
In keeping with the provisions of Title 7, United States Code, no data are published that would disclose the operations
of an individual farm. However, the number of farms in a given size category or other classification is not considered a
release of confidential information and is provided, even though other information may be withheld.
REFERENCE PERIODS
Inventories of livestock, poultry, and machinery and equipment are the number on hand on the day of enumeration.
Crop production, crop and livestock sales, and expense data are for the 12-month period between January 1 and
December 31, 2007.
SPECIAL TABULATIONS
Custom-designed tabulations can be developed to individual user specifications on a programming cost reimbursable
basis. Inquiries about special tabulations should be directed to Data Lab Administrator, Marketing and Information
Services Office, National Agricultural Statistics Service, U.S. Department of Agriculture, 1200 Independence Ave., S.W .,
W ashington, DC 20250; by telephone on 1-800-727-9540; or by e-mail at [email protected].
ABBREVIATIONS AND SYMBOLS
The following abbreviations and symbols are used throughout the tables:
- Represents zero.
(D) W ithheld to avoid disclosing data for individual farms
(NA) Not available
sq. ft. Square feet
(X) Not applicable
(Z) Less than ½ the unit of tabulation

2007 CENSUS OF AGRICULTURE GUAM 1
GUAM - Election Districts
N o t e : A l l b o u n d a r i e s a n d n a m e s a r e
a s o f J a n u a r y 1, 1 9 9 8

2 GUAM 2007 CENSUS OF AGRICULTURE
Table 1. Farms, Land in Farms, and Land Use: 2007 and 2002(For enumeration periods, see appendix A; and for meaning of abbreviations and symbols, see introductory text)
Farms 2007 2002 Farms 2007 2002
Farms . . . . . . . . . . . . . . . . . . . . . . . . . . . . . . . . . . . . . . . number..Land in farms . . . . . . . . . . . . . . . . . . . . . . . . . . . . . . . . . . .1 acres.. Average size of farm . . . . . . . . . . . . . . . . . . . . . . . . . . . acres..
Approximate land area . . . . . . . . . . . . . . . . . . . . . . . . . . . . acres.. Proportion in farms . . . . . . . . . . . . . . . . . . . . . . . . . . percent..
Total cropland . . . . . . . . . . . . . . . . . . . . . . . . . . . . . . . . . . . farms..acres..
Harvested . . . . . . . . . . . . . . . . . . . . . . . . . . . . . . . . . . . . farms..acres..
Other . . . . . . . . . . . . . . . . . . . . . . . . . . . . . . . . . . . . . . . . farms..acres..
104 1,000
9.6
13,376 12.3
97 831
95 498
53 332
1531 648
10.8
13 376 12.3
1431 230
141744
79485
Pasture or grazing land . . . . . . . . . . . . . . . . . . . . . . . . farms..acres..
Woodland . . . . . . . . . . . . . . . . . . . . . . . . . . . . . . . . . . . farms..acres..
Other land . . . . . . . . . . . . . . . . . . . . . . . . . . . . . . . . . . . farms..acres..
10 58
5 51
50 60
16226
933
102159
Detail may not add to total due to rounding.1
Table 2. Farms and Land in Farms by Size of Farm: 2007 and 2002(For enumeration periods, see appendix A; and for meaning of abbreviations and symbols, see introductory text)
Farms TotalLess than
1 acre1 to 2acres
3 to 4acres
5 to 7acres
8 to 9acres
10 to 19acres
20 acresor more
Farms . . . . . . . . . . . . . . . . . . . . . . . . . . . . . . . . . . . number, 2007..2002..
Percent of farms . . . . . . . . . . . . . . . . . . . . . . . . number, 2007..2002..
Land in farms . . . . . . . . . . . . . . . . . . . . . . . . . . . . . . .1 acres, 2007..2002..
Percent distribution . . . . . . . . . . . . . . . . . . . . . . number, 2007..2002..
Average size of farm . . . . . . . . . . . . . . . . . . . . . number, 2007..2002..
104 153
100.0 100.0
1,0001,648
100.0 100.0
9.6 10.8
13 16
12.5 10.5
68
0.6 0.5 0.4 0.5
27 38
26.0 24.8
4553
4.5 3.2 1.6
1.4
13 16
12.5 10.5
4553
4.5 3.2 3.4 3.3
15 21
14.4 13.7
81116 8.1 7.0 5.4 5.5
4 11
3.8 7.2
3391
3.3 5.5 8.1 8.3
15 27
14.4 17.6
208313
20.8 19.0 13.9 11.6
1724
16.3 15.7
5831,014 58.3 61.5 34.3 42.3
Detail may not add to total due to rounding.1
Table 3. Tenure and Characteristics of Operators: 2007 and 2002(For enumeration periods, see appendix A; and for meaning of abbreviations and symbols, see introductory text)
Item 2007 2002 Item 2007 2002
TENURE OF OPERATOR
Operators . . . . . . . . . . . . . . . . . . . . . . . . . . . . . . . . . . . . . . . farms..acres..
Total cropland . . . . . . . . . . . . . . . . . . . . . . . . . . . . . . . . .1 farms..acres..
Full owners . . . . . . . . . . . . . . . . . . . . . . . . . . . . . . . . . . . . farms..
acres.. Total cropland . . . . . . . . . . . . . . . . . . . . . . . . . . . . . . . . . farms..
acres.. Part owners . . . . . . . . . . . . . . . . . . . . . . . . . . . . . . . . . . . . farms..
acres.. Total cropland . . . . . . . . . . . . . . . . . . . . . . . . . . . . . . . . . farms..
acres.. Tenants . . . . . . . . . . . . . . . . . . . . . . . . . . . . . . . . . . . . . . . farms..
acres.. Total cropland . . . . . . . . . . . . . . . . . . . . . . . . . . . . . . . . . farms..
acres..
OPERATOR CHARACTERISTICS
Operators by place of residence: On farm operated . . . . . . . . . . . . . . . . . . . . . . . . . . . . . . . . . . . . . Not on farm operated . . . . . . . . . . . . . . . . . . . . . . . . . . . . . . . . . . .
Operators by years on present farm: Less than 2 years . . . . . . . . . . . . . . . . . . . . . . . . . . . . . . . . . . . . . 2 to 4 years . . . . . . . . . . . . . . . . . . . . . . . . . . . . . . . . . . . . . . . . . . 5 to 9 years . . . . . . . . . . . . . . . . . . . . . . . . . . . . . . . . . . . . . . . . . . 10 years or more . . . . . . . . . . . . . . . . . . . . . . . . . . . . . . . . . . . . . .
104 1,000
97 831
79 741
73 623
4 72
4 47
21 186
20 162
48 56
8 4
16 76
1531 648
1431 230
75 689
68 390
7 112
6 94
71 847
69 746
8469
16124877
OPERATOR CHARACTERISTICS–Con.
Operators by age group: Under 35 years . . . . . . . . . . . . . . . . . . . . . . . . . . . . . . . . . . . . . . . 35 to 44 years . . . . . . . . . . . . . . . . . . . . . . . . . . . . . . . . . . . . . . . . 45 to 54 years . . . . . . . . . . . . . . . . . . . . . . . . . . . . . . . . . . . . . . . . 55 to 64 years . . . . . . . . . . . . . . . . . . . . . . . . . . . . . . . . . . . . . . . . 65 years and over . . . . . . . . . . . . . . . . . . . . . . . . . . . . . . . . . . . . . Average age . . . . . . . . . . . . . . . . . . . . . . . . . . . . . . . . . . . . . . . .
Operators by main occupation: Agricultural . . . . . . . . . . . . . . . . . . . . . . . . . . . . . . . . . . number..
acres.. Nonagricultural . . . . . . . . . . . . . . . . . . . . . . . . . . . . . . . number..
acres..
Operators by days of work off farm: None . . . . . . . . . . . . . . . . . . . . . . . . . . . . . . . . . . . . . . . . . . . . . . . Any . . . . . . . . . . . . . . . . . . . . . . . . . . . . . . . . . . . . . . . . . . . . . . . . 1 to 49 days . . . . . . . . . . . . . . . . . . . . . . . . . . . . . . . . . . . . . . . . 50 to 99 days . . . . . . . . . . . . . . . . . . . . . . . . . . . . . . . . . . . . . . . 100 to 149 days . . . . . . . . . . . . . . . . . . . . . . . . . . . . . . . . . . . . . 150 to 199 days . . . . . . . . . . . . . . . . . . . . . . . . . . . . . . . . . . . . . 200 days or more . . . . . . . . . . . . . . . . . . . . . . . . . . . . . . . . . . . .
Operators by race: Chamorro . . . . . . . . . . . . . . . . . . . . . . . . . . . . . . . . . . . . . . . . . . . . Chinese . . . . . . . . . . . . . . . . . . . . . . . . . . . . . . . . . . . . . . . . . . . . . Filipino . . . . . . . . . . . . . . . . . . . . . . . . . . . . . . . . . . . . . . . . . . . . . . Japanese . . . . . . . . . . . . . . . . . . . . . . . . . . . . . . . . . . . . . . . . . . . . White . . . . . . . . . . . . . . . . . . . . . . . . . . . . . . . . . . . . . . . . . . . . . . . Other . . . . . . . . . . . . . . . . . . . . . . . . . . . . . . . . . . . . . . . . . . . . . . . Operators by sex: Male . . . . . . . . . . . . . . . . . . . . . . . . . . . . . . . . . . . . . . . . . . . . . . . . Female . . . . . . . . . . . . . . . . . . . . . . . . . . . . . . . . . . . . . . . . . . . . . . . . . .
3 15 19 32 35 59
80 874 24
126
74 30 2 4 6 6
12
77 3
16 1 3 4
91 13
31949433956
1341 559
1989
106479229
25
1095
26157
12825
Detail may not add to total due to rounding.1

2007 CENSUS OF AGRICULTURE GUAM 3
Table 4. Farm Characteristics: 2007 and 2002(For enumeration periods, see appendix A; and for meaning of abbreviations and symbols, see introductory text)
Item 2007 2002 Item 2007 2002
LABOR STATUS
Farms . . . . . . . . . . . . . . . . . . . . . . . . . . . . . . . . . . . . . . . . numbers..workers..
Unpaid labor . . . . . . . . . . . . . . . . . . . . . . . . . . . . . . . . . . . . . . . . . farms..workers..
Less than 25 days . . . . . . . . . . . . . . . . . . . . . . . . . . . . . . . . . . . farms..workers..
25 to 149 days . . . . . . . . . . . . . . . . . . . . . . . . . . . . . . . . . . . . . . farms..workers..
150 days or more . . . . . . . . . . . . . . . . . . . . . . . . . . . . . . . . . . . . farms..workers..
Paid labor . . . . . . . . . . . . . . . . . . . . . . . . . . . . . . . . . . . . . . . . . . . farms..workers..
Less than 25 days . . . . . . . . . . . . . . . . . . . . . . . . . . . . . . . . . . . farms..workers..
25 to 149 days . . . . . . . . . . . . . . . . . . . . . . . . . . . . . . . . . . . . . . farms..workers..
150 days or more . . . . . . . . . . . . . . . . . . . . . . . . . . . . . . . . . . . . farms..workers..
SELECTED EQUIPMENT
Tractors (all kinds) . . . . . . . . . . . . . . . . . . . . . . . . . . . . . . . . . . . . . farms..number..
Motortrucks . . . . . . . . . . . . . . . . . . . . . . . . . . . . . . . . . . . . . . . . . . farms..number..
104 368 91
232 1
(D) 18
(D) 82
181
49 136
6 11
8 23 39
102
44 84 96
143
153 525 147 361
2(D) 30
(D) 136 287
54 164
7 16 19 54 34 94
86 138 143 213
SELECTED EQUIPMENT – Con.
Automobiles . . . . . . . . . . . . . . . . . . . . . . . . . . . . . . . . . . . . . . farms..number..
Tillers (all kinds) . . . . . . . . . . . . . . . . . . . . . . . . . . . . . . . . . . . farms..number..
TYPE OF ORGANIZATION
Individual . . . . . . . . . . . . . . . . . . . . . . . . . . . . . . . . . . . . . . . . . . . . . .Partnership . . . . . . . . . . . . . . . . . . . . . . . . . . . . . . . . . . . . . . . . . . . . .Corporation . . . . . . . . . . . . . . . . . . . . . . . . . . . . . . . . . . . . . . . . . . . . .Other . . . . . . . . . . . . . . . . . . . . . . . . . . . . . . . . . . . . . . . . . . . . . . . . . .
TYPE OF LAND OWNERSHIP
Farms . . . . . . . . . . . . . . . . . . . . . . . . . . . . . . . . . . . . . . . . . . number..acres..
Owned . . . . . . . . . . . . . . . . . . . . . . . . . . . . . . . . . . . . . . . . . farms..acres..
Rented from others . . . . . . . . . . . . . . . . . . . . . . . . . . . . . . . .farms..acres..
Rented to others . . . . . . . . . . . . . . . . . . . . . . . . . . . . . . . . . farms..acres..
48 61 58 97
87 10
7 0
104 1,000
83 791
25 209
--
52 66
114 158
135 11
7-
153 1 648
82 709
78 938
--
Table 5. Irrigation: 2007 and 2002(For enumeration periods, see appendix A; and for meaning of abbreviations and symbols, see introductory text)
Farms with irrigation 2007 2002 Farms with irrigation 2007 2002
Land irrigated . . . . . . . . . . . . . . . . . . . . . . . . . . . . . . . . . . . . farms..acres..
Private system . . . . . . . . . . . . . . . . . . . . . . . . . . . . . . . . . . farms..acres..
Public system . . . . . . . . . . . . . . . . . . . . . . . . . . . . . . . . . . farms..acres..
Public system water rate:Agricultural . . . . . . . . . . . . . . . . . . . . . . . . . . . . . . . . . . . . . . farms..Residential . . . . . . . . . . . . . . . . . . . . . . . . . . . . . . . . . . . . . . farms..
96 565
8 62 91
503
81 10
142 772
7 70
139 703
125 14
Farms by major source of irrigation water:
Well or cistern . . . . . . . . . . . . . . . . . . . . . . . . . . . . . . . . . . . . . . . . . .River or stream . . . . . . . . . . . . . . . . . . . . . . . . . . . . . . . . . . . . . . . . .Lake or private pond . . . . . . . . . . . . . . . . . . . . . . . . . . . . . . . . . . . . .Canal or irrigation district . . . . . . . . . . . . . . . . . . . . . . . . . . . . . . . . .Public utility . . . . . . . . . . . . . . . . . . . . . . . . . . . . . . . . . . . . . . . . . . .Other . . . . . . . . . . . . . . . . . . . . . . . . . . . . . . . . . . . . . . . . . . . . . . . . .
- 4 1-
89 2
- 5--
136 1
Table 6. Market Value of Agricultural Products Sold: 2007 and 2002(For enumeration periods, see appendix A; and for meaning of abbreviations and symbols, see introductory text)
Item Farms
Value(dollars)
ItemFarms
Value(dollars)
2007 2002 2007 2002 2007 2002 2007 2002
Total sales . . . . . . . . . . . . . . . . . . . . . . . . . . Average per farm . . . . . . . . . . . . . . . . . . . .
Farms by value of sales: Less than $1,200 . . . . . . . . . . . . . . . . . . . . . . . $1,200 to $2,499 . . . . . . . . . . . . . . . . . . . . . . . $2,500 to $4,999 . . . . . . . . . . . . . . . . . . . . . . . $5,000 to $7,499 . . . . . . . . . . . . . . . . . . . . . . . $7,500 to $9,999 . . . . . . . . . . . . . . . . . . . . . . . $10,000 or more . . . . . . . . . . . . . . . . . . . . . . .
Sales by commodity group or product:
Root crops . . . . . . . . . . . . . . . . . . . . . . . . . . . . Sales of $500 or more . . . . . . . . . . . . . . . . .
104 (X)
6 15 18 14
6 45
17 12
153 (X)
19 20 19 24
8 63
51 47
2 796 17326 886
6 400 27 080 67 185 87 476 51 378
2 556 654
46 701 45 076
4 197 680 27 436
19 450 34 907 66 131
155 361 70 371
3 851 460
210 700 210 450
Sales by commodity group or product - Con.
Vegetables and melons . . . . . . . . . . . . . . . . . . . . Sales of $500 or more . . . . . . . . . . . . . . . . . . . Fruits and nuts . . . . . . . . . . . . . . . . . . . . . . . . . . . Sales of $500 or more . . . . . . . . . . . . . . . . . . .
Nursery crops ( including ornamental plants) . . . Sales of $500 or more . . . . . . . . . . . . . . . . . . . Livestock . . . . . . . . . . . . . . . . . . . . . . . . . . . . . . . Sales of $500 or more . . . . . . . . . . . . . . . . . . .
Poultry and poultry products . . . . . . . . . . . . . . . . Sales of $500 or more . . . . . . . . . . . . . . . . . . . Fish and aquaculture products . . . . . . . . . . . . . . Sales of $500 or more . . . . . . . . . . . . . . . . . . .
56 55 53 40
22 20 25 22
6 3 3 2
116 116 75 67
16 16 37 35
19 11 6 6
1 497 580 1 497 390
287 074 282 539
604 868 604 068 52 900 51 600
(D) 4 100
(D) (D)
2 577 845 2 577 845
311 288 310 563
475 907 475 907 132 950 132 500
28 490 26 538
460 500 460 500

4 GUAM 2007 CENSUS OF AGRICULTURE
Table 7. Selected Farm Production Expenses: 2007 and 2002(For enumeration periods, see appendix A; and for meaning of abbreviations and symbols, see introductory text)
Item Farms
Expenses(dollars)
ItemFarms
Expenses(dollars)
2007 2002 2007 2002 2007 2002 2007 2002
Machine hire and customwork . . . . . . . . . . . . . . . Expenses of $100 or more . . . . . . . . . . . . . . . . .
Hired farm labor . . . . . . . . . . . . . . . . . . . . . . . . . . Expenses of $100 or more . . . . . . . . . . . . . . . . .
Feed purchased for livestock poultry, and fish . . . Expenses of $100 or more . . . . . . . . . . . . . . . . .
32 27
49 44
23 15
50 47
57 54
60 56
66 140 64 950
548 760 546 760
128 562 125 464
136 084 135 824
669 125 668 865
204 459 204 194
Insecticides, fungicides, and herbicides . . . . . . . . . Expenses of $100 or more . . . . . . . . . . . . . . . . . .
Fertilizers and manure purchased . . . . . . . . . . . . . Expenses of $100 or more . . . . . . . . . . . . . . . . . .
Livestock, poultry, and fish purchased . . . . . . . . . . Expenses of $100 or more . . . . . . . . . . . . . . . . . .
Seed cost - including seedlings . . . . . . . . . . . . . . . Expenses of $100 or more . . . . . . . . . . . . . . . . . . . . .
67 23
79 35
3 2
58 18
104 83
128 111
19 17
104 65
94 024 83 272
196 070 182 678
20 620 (D)
56 786 49 460
106 969 105 614
193 664 192 284
67 928 67 728
73 350 70 792
Table 8. Root Crops Harvested for Sale: 2007 and 2002(For enumeration periods, see appendix A; and for meaning of abbreviations and symbols, see introductory text)
Crop 2007 2002 Crop 2007 2002
Cassava (tapioca) . . . . . . . . . . . . . . . . . . . . . . . . . . . . . . farms..acres..
pounds harvested..
Gado . . . . . . . . . . . . . . . . . . . . . . . . . . . . . . . . . . . . . . . . farms.. acres..
pounds harvested..
Ginger . . . . . . . . . . . . . . . . . . . . . . . . . . . . . . . . . . . . . . . farms.. acres..
pounds harvested..
Sweetpotatoes . . . . . . . . . . . . . . . . . . . . . . . . . . . . . . . . farms..acres..
pounds harvested..
7 5
7 750
3 1
4 100
1(D)(D)
8 9
18 800
159
18 360
31
700
---
2538
128 360
Taro . . . . . . . . . . . . . . . . . . . . . . . . . . . . . . . . . . . . . . . . farms..acres..
pounds harvested..
Yams . . . . . . . . . . . . . . . . . . . . . . . . . . . . . . . . . . . . . . . . farms..acres..
pounds harvested..
Other root crops . . . . . . . . . . . . . . . . . . . . . . . . . . . . . . . farms..acres..
pounds harvested..
10 6
13 000
9 7
23 000
2(D)(D)
3016
42 225
114
10 710
---
Table 9. Vegetables and Melons Harvested for Sale: 2007 and 2002(For enumeration periods, see appendix A; and for meaning of abbreviations and symbols, see introductory text)
Crop 2007 2002 Crop 2007 2002
Alfalfa and/or bean sprouts . . . . . . . . . . . . . . . . . . . . . .1 farms..pounds harvested..
Beans, yard long . . . . . . . . . . . . . . . . . . . . . . . . . . . . . . . farms..acres..
pounds harvested..
Beans, all other . . . . . . . . . . . . . . . . . . . . . . . . . . . . . . . farms..acres..
pounds harvested..
Bittermelons . . . . . . . . . . . . . . . . . . . . . . . . . . . . . . . . . . farms..acres..
pounds harvested..
Cabbage, Chinese . . . . . . . . . . . . . . . . . . . . . . . . . . . . . farms..acres..
pounds harvested..
Cabbage, head . . . . . . . . . . . . . . . . . . . . . . . . . . . . . . . . farms..acres..
pounds harvested..
Cantaloups . . . . . . . . . . . . . . . . . . . . . . . . . . . . . . . . . . . farms..acres..
pounds harvested..
Corn . . . . . . . . . . . . . . . . . . . . . . . . . . . . . . . . . . . . . . . .2 farms..acres..
pounds harvested..
Cucumbers . . . . . . . . . . . . . . . . . . . . . . . . . . . . . . . . . . . farms..acres..
pounds harvested..
Eggplant . . . . . . . . . . . . . . . . . . . . . . . . . . . . . . . . . . . . . farms..acres..
pounds harvested..
2(D)
25 43
126 203
11 2
9 020
17 27
73 950
5 3
4 930
1(D)(D)
5
12 66 000
4
21 123 250
22 92
1 354 320
44 43
164 959
2 95 950
5571
259 400
2313
47 800
3121
173 245
2219
72 740
10
1 000
315
24 000
821
80 300
51101
673 460
8567
426 545
Muskmelons and pepinos . . . . . . . . . . . . . . . . . . . . . . . . farms..acres..
pounds harvested..
Okra . . . . . . . . . . . . . . . . . . . . . . . . . . . . . . . . . . . . . . . . farms..acres..
pounds harvested..
Onions, green . . . . . . . . . . . . . . . . . . . . . . . . . . . . . . . . . farms..acres..
pounds harvested..
Peppers, hot . . . . . . . . . . . . . . . . . . . . . . . . . . . . . . . . . . farms..acres..
pounds harvested..
Peppers, sweet . . . . . . . . . . . . . . . . . . . . . . . . . . . . . . . . farms..acres..
pounds harvested..
Pumpkins and squash . . . . . . . . . . . . . . . . . . . . . . . . . . farms..acres..
pounds harvested..
Radishes . . . . . . . . . . . . . . . . . . . . . . . . . . . . . . . . . . . . . farms..acres..
pounds harvested..
Tomatoes . . . . . . . . . . . . . . . . . . . . . . . . . . . . . . . . . . . . farms..acres..
pounds harvested..
Watermelons . . . . . . . . . . . . . . . . . . . . . . . . . . . . . . . . . farms..acres..
pounds harvested..
Other vegetables and melons . . . . . . . . . . . . . . . . . . . . . farms..acres..
pounds harvested..
1(D)(D)
19 15
36 229
9 3
5 210
28 9
27 858
4 11
13 220
10 14
45 350
9 3
12 340
27 19
86 425
7 88
772 000
10 2
9 525
1(D)(D)
3524
49 445
225
14 605
5214
24 490
41
1 120
3426
118 495
2011
19 280
4420
68 480
19175
736 300
2334
71 195
The acres reported for alfalfa and/or bean sprouts do not reflect multiple crops harvested during the census year.1
Includes dry and green corn.2

2007 CENSUS OF AGRICULTURE GUAM 5
Table 10. Fruits, Nuts, and Nursery Crops (including ornamental plants) Harvested for Sale: 2007 and 2002(For enumeration periods, see appendix A; and for meaning of abbreviations and symbols, see introductory text)
Crop 2007 2002 Crop 2007 2002
Land in bearing and nonbearing fruit and nut trees and plants . . . . . . . . . . . . . . . . . . . . . . . . . . . . . . . . . . . . . . . . . farms..
acres..
Avocados . . . . . . . . . . . . . . . . . . . . . . . . . . . . . . . . . . . . . . farms..trees not of bearing age..
trees of bearing age..pounds harvested..
Bananas (all types) . . . . . . . . . . . . . . . . . . . . . . . . . . . . farms..trees not of bearing age..
trees of bearing age..pounds harvested..
Betelnuts . . . . . . . . . . . . . . . . . . . . . . . . . . . . . . . . . . . . farms..trees not of bearing age..
trees of bearing age..pounds harvested..
Breadfruits . . . . . . . . . . . . . . . . . . . . . . . . . . . . . . . . . . farms..trees not of bearing age..
trees of bearing age..pounds harvested..
Coconuts . . . . . . . . . . . . . . . . . . . . . . . . . . . . . . . . . . . farms..trees not of bearing age..
trees of bearing age..pounds harvested..
Grapefruit . . . . . . . . . . . . . . . . . . . . . . . . . . . . . . . . . . . farms..trees not of bearing age..
trees of bearing age..pounds harvested..
Guavas . . . . . . . . . . . . . . . . . . . . . . . . . . . . . . . . . . . . . farms..trees not of bearing age..
trees of bearing age..pounds harvested..
Lemons and limes . . . . . . . . . . . . . . . . . . . . . . . . . . . . . farms..trees not of bearing age..
trees of bearing age..pounds harvested..
Mangos . . . . . . . . . . . . . . . . . . . . . . . . . . . . . . . . . . . . . farms..trees not of bearing age..
trees of bearing age..pounds harvested..
57 145
16 94
168 7 770
31 5 526
13 673 238 246
16 774
2 771 4 100
14 61
258 9 650
17 1 172 1 323
20 200
4 2
35 4 200
7 120 153
7 390
21 768 384
9 760
15 247 103
18 150
81146
63052
1 280
516 878
21 266194 800
151 109
5166 825
533
1072 430
8781460
3 530
----
835
1241 175
26230
3 21917 490
9132143
2 125
Oranges . . . . . . . . . . . . . . . . . . . . . . . . . . . . . . . . . . . . farms..trees not of bearing age..
trees of bearing age..pounds harvested..
Papayas . . . . . . . . . . . . . . . . . . . . . . . . . . . . . . . . . . . . farms..trees not of bearing age..
trees of bearing age..pounds harvested..
Pineapples . . . . . . . . . . . . . . . . . . . . . . . . . . . . . . . . . . farms..plants not of bearing age..
plants of bearing age..pounds harvested..
Soursops . . . . . . . . . . . . . . . . . . . . . . . . . . . . . . . . . . . farms..trees not of bearing age..
trees of bearing age..pounds harvested..
Starfruits . . . . . . . . . . . . . . . . . . . . . . . . . . . . . . . . . . . . farms..trees not of bearing age..
trees of bearing age..pounds harvested..
Sweetsops . . . . . . . . . . . . . . . . . . . . . . . . . . . . . . . . . . farms..trees not of bearing age..
trees of bearing age..pounds harvested..
Tangerines . . . . . . . . . . . . . . . . . . . . . . . . . . . . . . . . . . farms..trees not of bearing age..
trees of bearing age..pounds harvested..
Other fruits, nuts, and tree crops . . . . . . . . . . . . . . . . . farms..plants or trees not of bearing age..
plants or trees of bearing age..pounds harvested..
Nursery crops (including ornamental plants) . . . . . . . . . . . . . . . . . . . . . . . . . . . . . . . . . . . . farms..
sq. ft. under cover..acres in the open..
4 47
4 130
25 205
2 153 51 330
4 600
6 600 17 570
12 68
101 1 850
3-
5 275
13 54
348 1 280
12 442 207
11 110
4 481
17 436
22 110 350
21
1(D)(D)(D)
25940
3 02370 635
1(D)(D)(D)
51881
295
57
23990
1129
24311 290
2(D)(D)(D)
61426
825
1633 300
21

6 GUAM 2007 CENSUS OF AGRICULTURE
Table 11. Livestock, Poultry, and Their Products: 2007 and 2002(For enumeration periods, see appendix A; and for meaning of abbreviations and symbols, see introductory text)
Item 2007 2002 Item 2007 2002
INVENTORY
Livestock
Carabaos . . . . . . . . . . . . . . . . . . . . . . . . . . . . . . . . . . . . . farms..number..
Cattle and calves of all ages . . . . . . . . . . . . . . . . . . . . . . farms..number..
Milk cows . . . . . . . . . . . . . . . . . . . . . . . . . . . . . . . . . . . farms..number..
All other cattle and calves . . . . . . . . . . . . . . . . . . . . . . . farms..number..
Hogs and pigs of all ages . . . . . . . . . . . . . . . . . . . . . . . . . farms..number..
Goats and kids of all ages . . . . . . . . . . . . . . . . . . . . . . . . farms..number..
Horses, mules, and colts of all ages . . . . . . . . . . . . . . . . . farms..number..
Poultry
Chicken hens 4 months old or older . . . . . . . . . . . . . . . . . farms..number..
Commercial layers . . . . . . . . . . . . . . . . . . . . . . . . . . . . . farms..number..
Other chicken hens . . . . . . . . . . . . . . . . . . . . . . . . . . . . farms..number..
Chickens less than 4 months old . . . . . . . . . . . . . . . . . . . farms..number..
Roosters and pullets . . . . . . . . . . . . . . . . . . . . . . . . . . . . . farms..number..
Fighting roosters . . . . . . . . . . . . . . . . . . . . . . . . . . . . . . . . farms..number..
Ducks . . . . . . . . . . . . . . . . . . . . . . . . . . . . . . . . . . . . . . . . farms..number..
Pigeons . . . . . . . . . . . . . . . . . . . . . . . . . . . . . . . . . . . . . . . farms..number..
Other poultry . . . . . . . . . . . . . . . . . . . . . . . . . . . . . . . . . . . farms..number..
4 12
13 112
1(D)
13 110
22 635
10 124
2(D)
8182
1(D)
7172
6272
679
2(D)
2(D)
1(D)
--
8 97
12154
2 (D)
12134
34675
681
1 (D)
261 046
5135
22911
171 657
17271
11224
11450
1 (D)
--
SALES
Livestock
Carabaos . . . . . . . . . . . . . . . . . . . . . . . . . . . . . . . . . . . . . . farms..number..
Cattle and calves of all ages . . . . . . . . . . . . . . . . . . . . . . . farms..number..
Milk cows . . . . . . . . . . . . . . . . . . . . . . . . . . . . . . . . . . . . farms..number..
Other cattle and calves . . . . . . . . . . . . . . . . . . . . . . . . . . farms..number..
Hogs and pigs of all ages . . . . . . . . . . . . . . . . . . . . . . . . . . farms..number..
Goats and kids of all ages . . . . . . . . . . . . . . . . . . . . . . . . . farms..number..
Horses, mules, and colts of all ages . . . . . . . . . . . . . . . . . . farms..number..
Poultry
Chicken hens 4 months old or older . . . . . . . . . . . . . . . . . . farms..number..
Commercial layers . . . . . . . . . . . . . . . . . . . . . . . . . . . . . . farms..number..
Other chicken hens . . . . . . . . . . . . . . . . . . . . . . . . . . . . . farms..number..
Chickens less than 4 months old . . . . . . . . . . . . . . . . . . . . farms..number..
Roosters and pullets . . . . . . . . . . . . . . . . . . . . . . . . . . . . . . farms..number..
Fighting roosters . . . . . . . . . . . . . . . . . . . . . . . . . . . . . . . . . farms..number..
Ducks . . . . . . . . . . . . . . . . . . . . . . . . . . . . . . . . . . . . . . . . . farms..number..
Pigeons . . . . . . . . . . . . . . . . . . . . . . . . . . . . . . . . . . . . . . . . farms..number..
Chicken eggs . . . . . . . . . . . . . . . . . . . . . . . . . . . . . . . . . . . farms..dozens..
Other poultry and poultry products (excluding chicken eggs) . . . . . . . . . . . . . . . . . . . . . . . . . . . . . . . . . farms..
number..
1(D)
9 19
1(D)
8 17
20 356
4 11
--
3 37
--
3 37
--
1(D)
1(D)
1(D)
--
1(D)
1(D)
5 21
938
--
938
31764
312
--
12881
4111
8770
22 700
5149
5155
4146
--
43 752
--
Table 12. Fish and Other Aquaculture Products: 2007 and 2002(For enumeration periods, see appendix A; and for meaning of abbreviations and symbols, see introductory text)
Item
Farms Ponds Tanks Quantity sold(pounds)
Sales(dollars)
2007 2002 2007 2002 2007 2002 2007 2002 2007 2002
Fish and other aquaculture products . . . . . . . . . . . . . . . . . . . . . . . . . .
3 6 8 44 3 29 (D) 192 700 (D) 460 500
2007 CENSUS OF AGRICULTURE GUAM 7
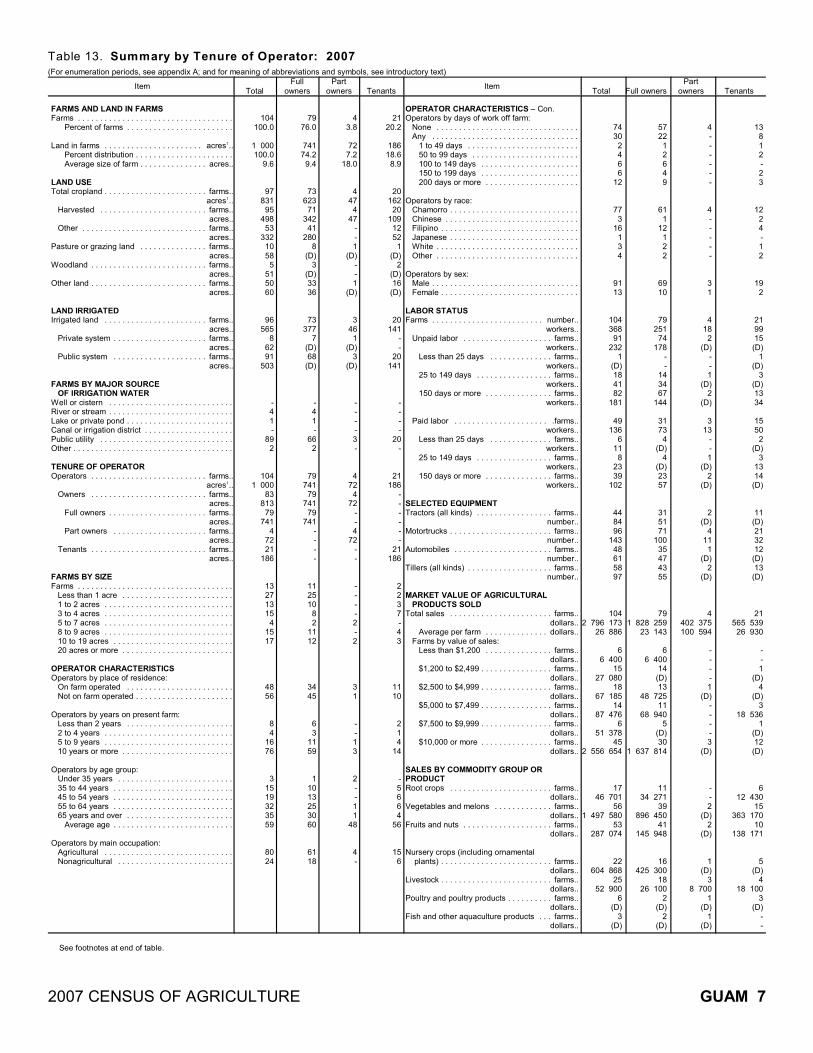
Table 13. Summary by Tenure of Operator: 2007 (For enumeration periods, see appendix A; and for meaning of abbreviations and symbols, see introductory text)
ItemTotal
Fullowners
Partowners Tenants
ItemTotal Full owners
Partowners Tenants
FARMS AND LAND IN FARMSFarms . . . . . . . . . . . . . . . . . . . . . . . . . . . . . . . . . . . Percent of farms . . . . . . . . . . . . . . . . . . . . . . . .
Land in farms . . . . . . . . . . . . . . . . . . . . . . acres ..1
Percent distribution . . . . . . . . . . . . . . . . . . . . . . Average size of farm . . . . . . . . . . . . . . . acres..
LAND USETotal cropland . . . . . . . . . . . . . . . . . . . . . . . farms..
acres ..1
Harvested . . . . . . . . . . . . . . . . . . . . . . . . farms.. acres.. Other . . . . . . . . . . . . . . . . . . . . . . . . . . . . farms..
acres..Pasture or grazing land . . . . . . . . . . . . . . . farms.. acres..Woodland . . . . . . . . . . . . . . . . . . . . . . . . . . farms..
acres..Other land . . . . . . . . . . . . . . . . . . . . . . . . . . farms..
acres..
LAND IRRIGATEDIrrigated land . . . . . . . . . . . . . . . . . . . . . . . farms..
acres.. Private system . . . . . . . . . . . . . . . . . . . . . farms..
acres.. Public system . . . . . . . . . . . . . . . . . . . . . farms..
acres..
FARMS BY MAJOR SOURCE OF IRRIGATION WATERWell or cistern . . . . . . . . . . . . . . . . . . . . . . . . . . . .River or stream . . . . . . . . . . . . . . . . . . . . . . . . . . . .Lake or private pond . . . . . . . . . . . . . . . . . . . . . . . .Canal or irrigation district . . . . . . . . . . . . . . . . . . . .Public utility . . . . . . . . . . . . . . . . . . . . . . . . . . . . . .Other . . . . . . . . . . . . . . . . . . . . . . . . . . . . . . . . . . . .
TENURE OF OPERATOROperators . . . . . . . . . . . . . . . . . . . . . . . . . . farms..
acres ..1
Owners . . . . . . . . . . . . . . . . . . . . . . . . . . farms..acres..
Full owners . . . . . . . . . . . . . . . . . . . . . . farms..acres..
Part owners . . . . . . . . . . . . . . . . . . . . . farms..acres..
Tenants . . . . . . . . . . . . . . . . . . . . . . . . . . farms..acres..
FARMS BY SIZEFarms . . . . . . . . . . . . . . . . . . . . . . . . . . . . . . . . . . . Less than 1 acre . . . . . . . . . . . . . . . . . . . . . . . . . 1 to 2 acres . . . . . . . . . . . . . . . . . . . . . . . . . . . . . 3 to 4 acres . . . . . . . . . . . . . . . . . . . . . . . . . . . . . 5 to 7 acres . . . . . . . . . . . . . . . . . . . . . . . . . . . . . 8 to 9 acres . . . . . . . . . . . . . . . . . . . . . . . . . . . . . 10 to 19 acres . . . . . . . . . . . . . . . . . . . . . . . . . . . 20 acres or more . . . . . . . . . . . . . . . . . . . . . . . . .
OPERATOR CHARACTERISTICSOperators by place of residence: On farm operated . . . . . . . . . . . . . . . . . . . . . . . . Not on farm operated . . . . . . . . . . . . . . . . . . . . . .
Operators by years on present farm: Less than 2 years . . . . . . . . . . . . . . . . . . . . . . . . 2 to 4 years . . . . . . . . . . . . . . . . . . . . . . . . . . . . . 5 to 9 years . . . . . . . . . . . . . . . . . . . . . . . . . . . . . 10 years or more . . . . . . . . . . . . . . . . . . . . . . . . .
Operators by age group: Under 35 years . . . . . . . . . . . . . . . . . . . . . . . . . . 35 to 44 years . . . . . . . . . . . . . . . . . . . . . . . . . . . 45 to 54 years . . . . . . . . . . . . . . . . . . . . . . . . . . . 55 to 64 years . . . . . . . . . . . . . . . . . . . . . . . . . . . 65 years and over . . . . . . . . . . . . . . . . . . . . . . . . Average age . . . . . . . . . . . . . . . . . . . . . . . . . . .
Operators by main occupation: Agricultural . . . . . . . . . . . . . . . . . . . . . . . . . . . . . Nonagricultural . . . . . . . . . . . . . . . . . . . . . . . . . .
104 100.0
1 000 100.0
9.6
97 831
95 498
53 332
10 58
5 51 50 60
96 565
8 62 91
503
- 4 1-
89 2
1041 000
83813 79
741 4
72 21
186
13 27 13 15
4 15 17
48 56
8 4
16 76
3 15 19 32 35 59
80 24
79 76.0
741 74.2
9.4
73 623
71 342
41 280
8(D)
3(D) 33 36
73 377
7(D) 68(D)
- 4 1-
66 2
79 741
79 741
79 741
----
11 25 10
8 2
11 12
34 45
6 3
11 59
1 10 13 25 30 60
61 18
4 3.8
72 7.2
18.0
4 47
4 47
--
1(D)
--
1(D)
3 46
1(D)
3(D)
----
3-
4 72
4 72
--
4 72
--
----
2-
2
3 1
--
1 3
2--
1 1
48
4-
21 20.2
186 18.6
8.9
20 162
20 109
12 52
1(D)
2(D) 16(D)
20 141
--
20 141
----
20-
21 186
------
21 186
2 2 3 7-
4 3
11 10
2 1 4
14
- 5 6 6 4
56
15 6
OPERATOR CHARACTERISTICS – Con.Operators by days of work off farm: None . . . . . . . . . . . . . . . . . . . . . . . . . . . . . . . . Any . . . . . . . . . . . . . . . . . . . . . . . . . . . . . . . . . 1 to 49 days . . . . . . . . . . . . . . . . . . . . . . . . . 50 to 99 days . . . . . . . . . . . . . . . . . . . . . . . . 100 to 149 days . . . . . . . . . . . . . . . . . . . . . . 150 to 199 days . . . . . . . . . . . . . . . . . . . . . . 200 days or more . . . . . . . . . . . . . . . . . . . . .
Operators by race: Chamorro . . . . . . . . . . . . . . . . . . . . . . . . . . . . . Chinese . . . . . . . . . . . . . . . . . . . . . . . . . . . . . . Filipino . . . . . . . . . . . . . . . . . . . . . . . . . . . . . . . Japanese . . . . . . . . . . . . . . . . . . . . . . . . . . . . . White . . . . . . . . . . . . . . . . . . . . . . . . . . . . . . . . Other . . . . . . . . . . . . . . . . . . . . . . . . . . . . . . . . Operators by sex: Male . . . . . . . . . . . . . . . . . . . . . . . . . . . . . . . . . Female . . . . . . . . . . . . . . . . . . . . . . . . . . . . . . .
LABOR STATUSFarms . . . . . . . . . . . . . . . . . . . . . . . . . number..
workers.. Unpaid labor . . . . . . . . . . . . . . . . . . . . farms..
workers.. Less than 25 days . . . . . . . . . . . . . . farms..
workers.. 25 to 149 days . . . . . . . . . . . . . . . . . farms..
workers.. 150 days or more . . . . . . . . . . . . . . . farms..
workers..
Paid labor . . . . . . . . . . . . . . . . . . . . . .farms..workers..
Less than 25 days . . . . . . . . . . . . . . farms..workers..
25 to 149 days . . . . . . . . . . . . . . . . . farms..workers..
150 days or more . . . . . . . . . . . . . . . farms..workers..
SELECTED EQUIPMENTTractors (all kinds) . . . . . . . . . . . . . . . . . farms..
number..Motortrucks . . . . . . . . . . . . . . . . . . . . . . . farms..
number..Automobiles . . . . . . . . . . . . . . . . . . . . . . farms..
number..Tillers (all kinds) . . . . . . . . . . . . . . . . . . . farms..
number..
MARKET VALUE OF AGRICULTURAL PRODUCTS SOLDTotal sales . . . . . . . . . . . . . . . . . . . . . . . farms..
dollars.. Average per farm . . . . . . . . . . . . . . dollars.. Farms by value of sales: Less than $1,200 . . . . . . . . . . . . . . . farms.. dollars.. $1,200 to $2,499 . . . . . . . . . . . . . . . . farms..
dollars.. $2,500 to $4,999 . . . . . . . . . . . . . . . . farms..
dollars.. $5,000 to $7,499 . . . . . . . . . . . . . . . . farms..
dollars.. $7,500 to $9,999 . . . . . . . . . . . . . . . . farms..
dollars.. $10,000 or more . . . . . . . . . . . . . . . . farms..
dollars..
SALES BY COMMODITY GROUP OR PRODUCTRoot crops . . . . . . . . . . . . . . . . . . . . . . . farms..
dollars..Vegetables and melons . . . . . . . . . . . . . farms..
dollars..Fruits and nuts . . . . . . . . . . . . . . . . . . . . farms..
dollars..
Nursery crops (including ornamental plants) . . . . . . . . . . . . . . . . . . . . . . . . . farms..
dollars..Livestock . . . . . . . . . . . . . . . . . . . . . . . . . farms..
dollars..Poultry and poultry products . . . . . . . . . . farms..
dollars..Fish and other aquaculture products . . . farms..
dollars..
74 30
2 4 6 6
12
77 3
16 1 3 4
91 13
104 368
91 232
1(D) 18 41 82
181
49 136
6 11
8 23 39
102
44 84 96
143 48 61 58 97
1042 796 173
26 886
66 400
1527 080
1867 185
1487 476
651 378
452 556 654
1746 701
561 497 580
53287 074
22604 868
2552 900
6(D)
3(D)
57 22
1 2 6 4 9
61 1
12 1 2 2
69 10
79 251
74 178
--
14 34 67
144
31 73
4(D)
4(D) 23 57
31 51 71
100 35 47 43 55
791 828 259
23 143
66 400
14(D)13
48 72511
68 9405
(D)30
1 637 814
1134 271
39896 450
41145 948
16425 300
1826 100
2(D)
2(D)
4------
4-----
3 1
4 18
2 (D)
--
1(D)
2(D)
3 13
--
1(D)
2(D)
2(D)
4 11
1(D)
2(D)
4402 375100 594
----1
(D)----3
(D)
--2
(D)2
(D)
1(D)
38 700
1(D)
1(D)
13 8 1 2-
2 3
12 2 4-
1 2
19 2
21 99 15
(D) 1
(D) 3
(D) 13 34
15 50
2(D)
3 13 14(D)
11(D) 21 32 12(D) 13(D)
21565 539
26 930
--1
(D)4
(D)3
18 5361
(D)12
(D)
612 430
15363 170
10138 171
5(D)
418 100
3(D)
--
See footnotes at end of table.

8 GUAM 2007 CENSUS OF AGRICULTURE
Table 13. Summary by Tenure of Operator: 2007 – (Cont.) (For enumeration periods, see appendix A; and for meaning of abbreviations and symbols, see introductory text)
ItemTotal
Fullowners
Partowners Tenants
ItemTotal
Fullowners
Partowners Tenants
SELECTED FARM PRODUCTION EXPENSES
Machine hire and customwork . . . . . . . . . farms..dollars..
Hired farm labor . . . . . . . . . . . . . . . . . . . . farms..dollars..
Feed purchased for livestock, poultry, and fish . . . . . . . . . . . . . . . . . . . farms..
dollars..Insecticides, fungicides, and herbicides . . farms..
dollars..Fertilizers and manure purchased . . . . . . farms..
dollars..Livestock, poultry, and fish purchased . . . farms..
dollars..Seed cost - including seedlings . . . . . . . . farms..
dollars..
ROOT CROPS HARVESTED FOR SALE
Cassava (tapioca) . . . . . . . . . . . . . . . . . . . farms..acres..
pounds harvested..
Gado . . . . . . . . . . . . . . . . . . . . . . . . . . . . . farms..acres..
pounds harvested..
Ginger . . . . . . . . . . . . . . . . . . . . . . . . . . . . farms..acres..
pounds harvested..
Sweetpotatoes . . . . . . . . . . . . . . . . . . . . . farms..acres..
pounds harvested..
Taro . . . . . . . . . . . . . . . . . . . . . . . . . . . . . farms..acres..
pounds harvested..
Yams . . . . . . . . . . . . . . . . . . . . . . . . . . . . . farms..acres..
pounds harvested..
Other root crops . . . . . . . . . . . . . . . . . . . . farms..acres..
pounds harvested..
VEGETABLES AND MELONS HARVESTED FOR SALE
Alfalfa and/or bean sprouts . . . . . . . . . . .2 farms..pounds harvested..
Beans, yard long . . . . . . . . . . . . . . . . . . . . farms..acres..
pounds harvested..
Beans, all other . . . . . . . . . . . . . . . . . . . . farms..acres..
pounds harvested..
Bittermelons . . . . . . . . . . . . . . . . . . . . . . . farms..acres..
pounds harvested..
Cabbage, Chinese . . . . . . . . . . . . . . . . . . farms..acres..
pounds harvested..
Cabbage, head . . . . . . . . . . . . . . . . . . . . . farms..acres..
pounds harvested..
Cantaloups . . . . . . . . . . . . . . . . . . . . . . . . farms..acres..
pounds harvested..
Corn . . . . . . . . . . . . . . . . . . . . . . . . . . . . .3 farms..acres..
pounds harvested..
Cucumbers . . . . . . . . . . . . . . . . . . . . . . . . farms..acres..
pounds harvested..
Eggplant . . . . . . . . . . . . . . . . . . . . . . . . . . farms..acres..
pounds harvested..
3266 140
49548 760
23128 562
6794 024
79196 070
320 620
5856 786
75
7 750
31
4 100
1(D)(D)
89
18 800
106
13 000
97
23 000
2(D)(D)
2(D)
2543
126 203
112
9 020
1727
73 950
53
4 930
1(D)(D)
512
66 000
421
123 250
2292
1 354 320
4443
164 959
2234 390
35305 200
15114 984
4961 157
58132 830
320 620
4237 275
42
6 550
2(D)(D)
1(D)(D)
54
12 500
63
11 100
65
19 500
1(D)(D)
2(D)
1625
67 383
82
4 800
1112
38 150
4(D)(D)
1(D)(D)
4(D)(D)
421
123 250
1332
200 500
2921
95 105
37 400
3105 280
2(D)
2(D)
2(D)
--2
(D)
---
---
---
---
---
---
---
--
1(D)(D)
---
---
---
---
1(D)(D)
---
2(D)(D)
2(D)(D)
724 350
11138 280
6(D)16
(D)19
(D)--
14(D)
33
1 200
1(D)(D)
---
35
6 300
43
1 900
33
3 500
1(D)(D)
--
8(D)(D)
31
4 220
615
35 800
1(D)(D)
---
---
---
7(D)(D)
13(D)(D)
VEGETABLES AND MELONS HARVESTEDFOR SALE – Con.
Muskmelons and pepinos . . . . . . . . . . . . farms..acres..
pounds harvested..
Okra . . . . . . . . . . . . . . . . . . . . . . . . . . . . farms..acres..
pounds harvested..
Onions, green . . . . . . . . . . . . . . . . . . . . . farms..acres..
pounds harvested..
Peppers, hot . . . . . . . . . . . . . . . . . . . . . . farms..acres..
pounds harvested..
Peppers, sweet . . . . . . . . . . . . . . . . . . . . farms..acres..
pounds harvested..
Pumpkins and squash . . . . . . . . . . . . . . farms..acres..
pounds harvested..
Radishes . . . . . . . . . . . . . . . . . . . . . . . . . farms..acres..
pounds harvested..
Tomatoes . . . . . . . . . . . . . . . . . . . . . . . . farms..acres..
pounds harvested..
Watermelons . . . . . . . . . . . . . . . . . . . . . farms..acres..
pounds harvested..
Other vegetables and melons . . . . . . . . . farms..acres..
pounds harvested..
FRUITS, NUTS, AND NURSERY CROPS (including ornamental plants )HARVESTED FOR SALE
Land in bearing and nonbearing fruit trees and plants . . . . . . . . . . . . . . . . . . farms..
acres..
Avocados . . . . . . . . . . . . . . . . . . . . . . . . farms..trees not of bearing age..
trees of bearing age..pounds harvested..
Bananas (all types) . . . . . . . . . . . . . . . . . farms..trees not of bearing age..
trees of bearing age..pounds harvested..
Betelnuts . . . . . . . . . . . . . . . . . . . . . . . . . farms..trees not of bearing age..
trees of bearing age..pounds harvested..
Breadfruits . . . . . . . . . . . . . . . . . . . . . . . farms..trees not of bearing age..
trees of bearing age..pounds harvested..
Coconuts . . . . . . . . . . . . . . . . . . . . . . . . farms..trees not of bearing age..
trees of bearing age..pounds harvested..
Grapefruit . . . . . . . . . . . . . . . . . . . . . . . . farms..trees not of bearing age..
trees of bearing age..pounds harvested..
Guavas . . . . . . . . . . . . . . . . . . . . . . . . . . farms..trees not of bearing age..
trees of bearing age..pounds harvested..
Lemons and limes . . . . . . . . . . . . . . . . . . farms..trees not of bearing age..
trees of bearing age..pounds harvested..
Mangos . . . . . . . . . . . . . . . . . . . . . . . . . . farms..trees not of bearing age..
trees of bearing age..pounds harvested..
1(D)(D)
1915
36 229
93
5 210
289
27 858
411
13 220
1014
45 350
93
12 340
2719
86 425
788
772 000
102
9 525
57145
1694
1687 770
315 526
13 673238 246
16774
2 7714 100
1461
2589 650
171 1721 323
20 200
42
354 200
7120153
7 390
21768384
9 760
15247103
18 150
1(D)(D)
139
28 069
7(D)(D)
195
22 478
3(D)(D)
610
38 300
8(D)(D)
1810
53 115
568
552 000
9(D)(D)
45111
137078
7 090
234 2967 181
120 790
15(D)(D)(D)
93336
5 750
11597
1 0548 130
3(D)(D)(D)
6(D)(D)(D)
16453251
8 650
14(D)(D)(D)
---
2(D)(D)
---
---
---
1(D)(D)
---
1(D)(D)
1(D)(D)
---
2(D)
1(D)(D)(D)
2(D)(D)(D)
----
1(D)(D)(D)
----
----
----
----
----
---
4(D)(D)
2(D)(D)
94
5 380
1(D)(D)
3(D)(D)
1(D)(D)
8(D)(D)
1(D)(D)
1(D)(D)
10(D)
2(D)(D)(D)
6(D)(D)(D)
1(D)(D)(D)
4(D)(D)(D)
6575269
12 070
1(D)(D)(D)
1(D)(D)(D)
5315133
1 110
1(D)(D)(D)
See footnotes at end of table.
2007 CENSUS OF AGRICULTURE GUAM 9
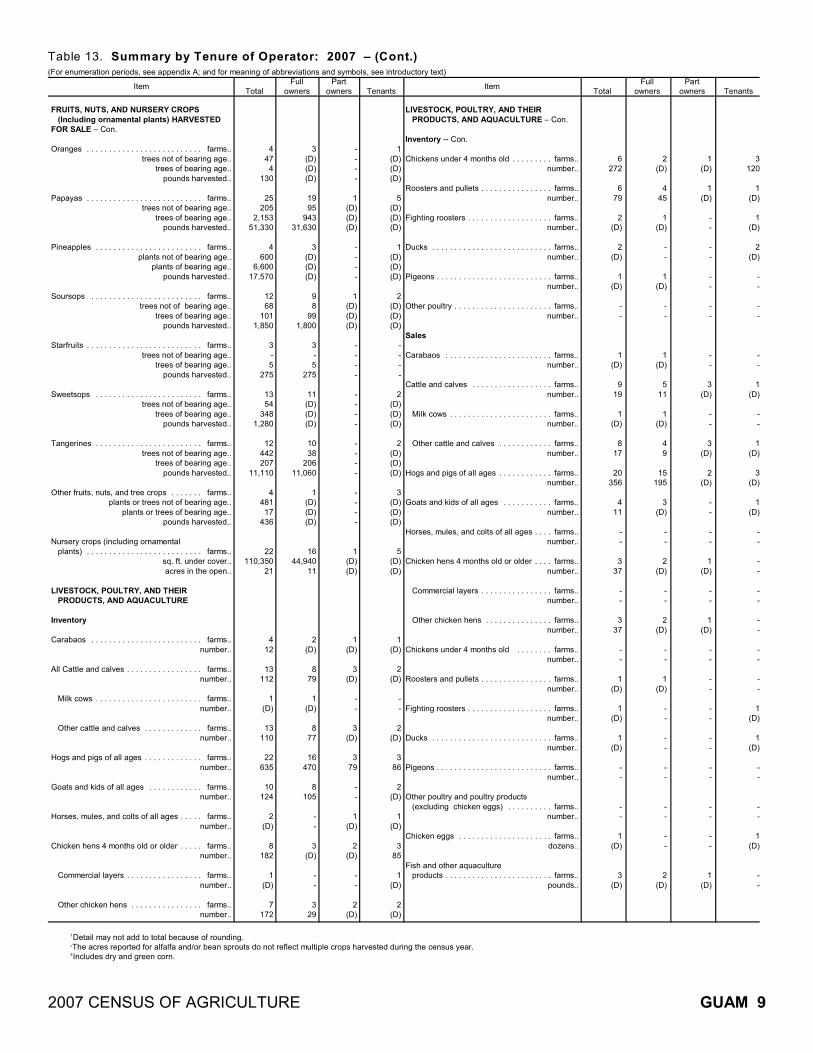
Table 13. Summary by Tenure of Operator: 2007 – (Cont.)(For enumeration periods, see appendix A; and for meaning of abbreviations and symbols, see introductory text)
ItemTotal
Fullowners
Partowners Tenants
ItemTotal
Fullowners
Partowners Tenants
FRUITS, NUTS, AND NURSERY CROPS (Including ornamental plants) HARVESTED FOR SALE – Con.
Oranges . . . . . . . . . . . . . . . . . . . . . . . . . . farms..trees not of bearing age..
trees of bearing age..pounds harvested..
Papayas . . . . . . . . . . . . . . . . . . . . . . . . . . farms..trees not of bearing age..
trees of bearing age..pounds harvested..
Pineapples . . . . . . . . . . . . . . . . . . . . . . . . farms..plants not of bearing age..
plants of bearing age..pounds harvested..
Soursops . . . . . . . . . . . . . . . . . . . . . . . . . farms..trees not of bearing age..
trees of bearing age..pounds harvested..
Starfruits . . . . . . . . . . . . . . . . . . . . . . . . . . farms..trees not of bearing age..
trees of bearing age..pounds harvested..
Sweetsops . . . . . . . . . . . . . . . . . . . . . . . . farms..trees not of bearing age..
trees of bearing age..pounds harvested..
Tangerines . . . . . . . . . . . . . . . . . . . . . . . . farms..trees not of bearing age..
trees of bearing age..pounds harvested..
Other fruits, nuts, and tree crops . . . . . . . farms..plants or trees not of bearing age..
plants or trees of bearing age..pounds harvested..
Nursery crops (including ornamental plants) . . . . . . . . . . . . . . . . . . . . . . . . . . farms..
sq. ft. under cover..acres in the open..
LIVESTOCK, POULTRY, AND THEIR PRODUCTS, AND AQUACULTURE
Inventory
Carabaos . . . . . . . . . . . . . . . . . . . . . . . . . farms..number..
All Cattle and calves . . . . . . . . . . . . . . . . . farms..number..
Milk cows . . . . . . . . . . . . . . . . . . . . . . . . farms..number..
Other cattle and calves . . . . . . . . . . . . . farms..number..
Hogs and pigs of all ages . . . . . . . . . . . . . farms..number..
Goats and kids of all ages . . . . . . . . . . . . farms..number..
Horses, mules, and colts of all ages . . . . . farms..number..
Chicken hens 4 months old or older . . . . . farms..number..
Commercial layers . . . . . . . . . . . . . . . . . farms..number..
Other chicken hens . . . . . . . . . . . . . . . . farms..number..
447
4130
25205
2,15351,330
4600
6,60017,570
1268
1011,850
3-5
275
1354
3481,280
12442207
11,110
4481
17436
22110,350
21
412
13112
1(D)
13110
22635
10124
2(D)
8182
1(D)
7172
3(D)(D)(D)
1995
94331,630
3(D)(D)(D)
98
991,800
3-5
275
11(D)(D)(D)
1038
20611,060
1(D)(D)(D)
1644,940
11
2(D)
879
1(D)
877
16470
8105
--
3(D)
--
329
----
1(D)(D)(D)
----
1(D)(D)(D)
----
----
----
----
1(D)(D)
1(D)
3(D)
--
3(D)
379
--
1 (D)
2(D)
--
2(D)
1(D)(D)(D)
5(D)(D)(D)
1(D)(D)(D)
2(D)(D)(D)
----
2(D)(D)(D)
2(D)(D)(D)
3(D)(D)(D)
5(D)(D)
1(D)
2(D)
--
2(D)
386
2(D)
1 (D)
385
1(D)
2(D)
LIVESTOCK, POULTRY, AND THEIR PRODUCTS, AND AQUACULTURE – Con.
Inventory -- Con.
Chickens under 4 months old . . . . . . . . . farms..number..
Roosters and pullets . . . . . . . . . . . . . . . . farms..number..
Fighting roosters . . . . . . . . . . . . . . . . . . . farms..number..
Ducks . . . . . . . . . . . . . . . . . . . . . . . . . . . farms..number..
Pigeons . . . . . . . . . . . . . . . . . . . . . . . . . . farms..number..
Other poultry . . . . . . . . . . . . . . . . . . . . . . farms..number..
Sales
Carabaos . . . . . . . . . . . . . . . . . . . . . . . . farms..number..
Cattle and calves . . . . . . . . . . . . . . . . . . farms..number..
Milk cows . . . . . . . . . . . . . . . . . . . . . . . farms..number..
Other cattle and calves . . . . . . . . . . . . farms..number..
Hogs and pigs of all ages . . . . . . . . . . . . farms..number..
Goats and kids of all ages . . . . . . . . . . . farms..number..
Horses, mules, and colts of all ages . . . . farms..number..
Chicken hens 4 months old or older . . . . farms..number..
Commercial layers . . . . . . . . . . . . . . . . farms..number..
Other chicken hens . . . . . . . . . . . . . . . farms..number..
Chickens under 4 months old . . . . . . . . farms..number..
Roosters and pullets . . . . . . . . . . . . . . . . farms..number..
Fighting roosters . . . . . . . . . . . . . . . . . . . farms..number..
Ducks . . . . . . . . . . . . . . . . . . . . . . . . . . . farms..number..
Pigeons . . . . . . . . . . . . . . . . . . . . . . . . . . farms..number..
Other poultry and poultry products (excluding chicken eggs) . . . . . . . . . . farms..
number..
Chicken eggs . . . . . . . . . . . . . . . . . . . . . farms..dozens..
Fish and other aquaculture products . . . . . . . . . . . . . . . . . . . . . . . . farms..
pounds..
6272
679
2(D)
2(D)
1(D)
--
1(D)
919
1(D)
817
20356
411
--
337
--
337
--
1(D)
1(D)
1(D)
--
--
1(D)
3(D)
2(D)
445
1(D)
--
1(D)
--
1(D)
511
1(D)
49
15195
3(D)
--
2(D)
--
2(D)
--
1(D)
--
--
--
--
--
2(D)
1(D)
1(D)
--
--
--
--
--
3(D)
--
3(D)
2(D)
--
--
1(D)
--
1(D)
--
--
--
--
--
--
--
1(D)
3120
1(D)
1(D)
2(D)
--
--
--
1(D)
--
1(D)
3(D)
1(D)
--
--
--
--
--
--
1(D)
1(D)
--
--
1(D)
--
Detail may not add to total because of rounding.1
The acres reported for alfalfa and/or bean sprouts do not reflect multiple crops harvested during the census year. 2
Includes dry and green corn.3

10 GUAM 2007 CENSUS OF AGRICULTURE
Table 14. Summary by Age of Operator: 2007 (For enumeration periods, see appendix A; and for meaning of abbreviations and symbols, see introductory text)
Item Total Under 35 years 35 to 44 years 45 to 54 years 55 to 64 years 65 years and over
FARMS AND LAND IN FARMS
Farms . . . . . . . . . . . . . . . . . . . . . . . . . . . . . . . Percent of farms . . . . . . . . . . . . . . . . . . . .
Land in farms . . . . . . . . . . . . . . . . . . acres ..1
Percent distribution . . . . . . . . . . . . . . . . . . Average size of farm . . . . . . . . . . . acres..
LAND USETotal cropland . . . . . . . . . . . . . . . . . . . farms..
acres ..1
Harvested . . . . . . . . . . . . . . . . . . . . farms.. acres.. Other . . . . . . . . . . . . . . . . . . . . . . . . farms..
acres..Pasture or grazing land . . . . . . . . . . . farms.. acres..Woodland . . . . . . . . . . . . . . . . . . . . . . farms..
acres..Other land . . . . . . . . . . . . . . . . . . . . . . farms..
acres..
LAND IRRIGATEDIrrigated land . . . . . . . . . . . . . . . . . . . farms..
acres.. Private system . . . . . . . . . . . . . . . . . farms..
acres.. Public system . . . . . . . . . . . . . . . . . farms..
acres..
FARMS BY MAJOR SOURCE OF IRRIGATION WATERWell or cistern . . . . . . . . . . . . . . . . . . . . . . . .River or stream . . . . . . . . . . . . . . . . . . . . . . . .Lake or private pond . . . . . . . . . . . . . . . . . . . .Canal or irrigation district . . . . . . . . . . . . . . . .Public utility . . . . . . . . . . . . . . . . . . . . . . . . . .Other . . . . . . . . . . . . . . . . . . . . . . . . . . . . . . . .
TENURE OF OPERATOROperators . . . . . . . . . . . . . . . . . . . . . . farms..
acres ..1
Owners . . . . . . . . . . . . . . . . . . . . . . farms..acres..
Full owners . . . . . . . . . . . . . . . . . . farms..acres..
Part owners . . . . . . . . . . . . . . . . . farms..acres..
Tenants . . . . . . . . . . . . . . . . . . . . . . farms..acres..
FARMS BY SIZEFarms . . . . . . . . . . . . . . . . . . . . . . . . . . . . . . . Less than 1 acre . . . . . . . . . . . . . . . . . . . . . 1 to 2 acres . . . . . . . . . . . . . . . . . . . . . . . . . 3 to 4 acres . . . . . . . . . . . . . . . . . . . . . . . . . 5 to 7 acres . . . . . . . . . . . . . . . . . . . . . . . . . 8 to 9 acres . . . . . . . . . . . . . . . . . . . . . . . . . 10 to 19 acres . . . . . . . . . . . . . . . . . . . . . . . 20 acres or more . . . . . . . . . . . . . . . . . . . . .
OPERATOR CHARACTERISTICSOperators by place of residence: On farm operated . . . . . . . . . . . . . . . . . . . . Not on farm operated . . . . . . . . . . . . . . . . . .
Operators by years on present farm: Less than 2 years . . . . . . . . . . . . . . . . . . . . 2 to 4 years . . . . . . . . . . . . . . . . . . . . . . . . . 5 to 9 years . . . . . . . . . . . . . . . . . . . . . . . . . 10 years or more . . . . . . . . . . . . . . . . . . . . .
Operators by age group: Under 35 years . . . . . . . . . . . . . . . . . . . . . . 35 to 44 years . . . . . . . . . . . . . . . . . . . . . . . 45 to 54 years . . . . . . . . . . . . . . . . . . . . . . . 55 to 64 years . . . . . . . . . . . . . . . . . . . . . . . 65 years and over . . . . . . . . . . . . . . . . . . . . Average age . . . . . . . . . . . . . . . . . . . . . . .
Operators by main occupation: Agricultural . . . . . . . . . . . . . . . . . . . . . . . . . Nonagricultural . . . . . . . . . . . . . . . . . . . . . .
104 100.0
1000 100.0
9.6
97 831
95 498
53 332
10 58
5 51 50 60
96 565
8 62 91
503
- 4 1-
89 2
1041,000
83813 79
741 4
72 21
186
13 27 13 15
4 15 17
48 56
8 4
16 76
3 15 19 32 35 59
80 24
3 2.9
59 5.9
19.5
3 38
3 38
--
1(D)
--
2(D)
3 39
1(D)
3(D)
----
3-
359 3
59 1
(D) 2
(D)--
- 1----
2
1 2
- 1 1 1
3----
33
2 1
15 14.4
104 10.4
7.0
14 69 13 48
4 21
4(D)
1(D) 10
5
14 86
1(D) 13(D)
----
13 1
15104 1051
10 51
--
5 54
4 6---
3 2
7 8
3 2 4 6
- 15
---
41
6 9
19 18.3
267 26.7 14.0
18 234
18 119
11 115
1(D)
1(D)
9 5
18 136
1(D) 17(D)
--
1-
17-
19267 13
188 13
188--
6 79
2 4 1 5-
3 4
13 6
3 1 4
11
--
19--
51
14 5
32 30.8
316 31.6
9.9
28 240
28 148
17 92
4 14
2(D) 16(D)
28 153
3 44 27
109
- 3--
25-
32316 26
289 25(D)
1(D)
6 27
3 8 5 6 2 2 6
15 17
1-
4 27
---
32-
60
26 6
35 33.7
254 25.4
7.3
34 250
33 145
21 104
--
1(D) 13(D)
33 151
2(D) 31(D)
- 1--
31 1
35254 31
227 30(D)
1(D)
4 27
4 8 7 4 2 7 3
12 23
1-
3 31
----
35 73
32 3
See footnotes at end of table.

2007 CENSUS OF AGRICULTURE GUAM 11
Table 14. Summary by Age of Operator: 2007 – (Cont.)(For enumeration periods, see appendix A; and for meaning of abbreviations and symbols, see introductory text)
Item Total Under 35 years 35 to 44 years 45 to 54 years 55 to 64 years 65 years and over
OPERATOR CHARACTERISTICS – Con.
Operators by days of work off farm: None . . . . . . . . . . . . . . . . . . . . . . . . . . . . . Any . . . . . . . . . . . . . . . . . . . . . . . . . . . . . . 1 to 49 days . . . . . . . . . . . . . . . . . . . . . . 50 to 99 days . . . . . . . . . . . . . . . . . . . . . 100 to 149 days . . . . . . . . . . . . . . . . . . . 150 to 199 days . . . . . . . . . . . . . . . . . . . 200 days or more . . . . . . . . . . . . . . . . . .
Operators by race: Chamorro . . . . . . . . . . . . . . . . . . . . . . . . . . Chinese . . . . . . . . . . . . . . . . . . . . . . . . . . . Filipino . . . . . . . . . . . . . . . . . . . . . . . . . . . . Japanese . . . . . . . . . . . . . . . . . . . . . . . . . . White . . . . . . . . . . . . . . . . . . . . . . . . . . . . . Other . . . . . . . . . . . . . . . . . . . . . . . . . . . . . Operators by sex: Male . . . . . . . . . . . . . . . . . . . . . . . . . . . . . . Female . . . . . . . . . . . . . . . . . . . . . . . . . . . .
LABOR STATUSFarms . . . . . . . . . . . . . . . . . . . . . . . number..
workers.. Unpaid labor . . . . . . . . . . . . . . . . . farms..
workers.. Less than 25 days . . . . . . . . . . . farms..
workers.. 25 to 149 days . . . . . . . . . . . . . . farms..
workers.. 150 days or more . . . . . . . . . . . . farms..
workers..
Paid labor . . . . . . . . . . . . . . . . . . . .farms..workers..
Less than 25 days . . . . . . . . . . . farms..workers..
25 to 149 days . . . . . . . . . . . . . . farms..workers..
150 days or more . . . . . . . . . . . . farms..workers..
SELECTED EQUIPMENTTractors (all kinds) . . . . . . . . . . . . . . farms..
number..Motortrucks . . . . . . . . . . . . . . . . . . . . farms..
number..Automobiles . . . . . . . . . . . . . . . . . . . farms..
number..Tillers (all kinds) . . . . . . . . . . . . . . . . farms..
number..
MARKET VALUE OF AGRICULTURAL PRODUCTS SOLDTotal sales . . . . . . . . . . . . . . . . . . . . farms..
dollars.. Average per farm . . . . . . . . . . . dollars.. Farms by value of sales: Less than $1,200 . . . . . . . . . . . . farms.. dollars.. $1,200 to $2,499 . . . . . . . . . . . . . farms..
dollars.. $2,500 to $4,999 . . . . . . . . . . . . . farms..
dollars.. $5,000 to $7,499 . . . . . . . . . . . . . farms..
dollars.. $7,500 to $9,999 . . . . . . . . . . . . . farms..
dollars.. $10,000 or more . . . . . . . . . . . . . farms..
dollars..
SALES BY COMMODITY GROUP OR PRODUCT:Root crops . . . . . . . . . . . . . . . . . . . . farms..
dollars..Vegetables and melons . . . . . . . . . . farms..
dollars..Fruits and nuts . . . . . . . . . . . . . . . . . farms..
dollars..Nursery crops (including ornamental plants) . . . . . . . . . . . . . . . . . . . . . . farms..
dollars..Livestock . . . . . . . . . . . . . . . . . . . . . . farms..
dollars..Poultry and eggs . . . . . . . . . . . . . . . . farms..
dollars..Fish and other aquaculture products farms..
dollars..
74 30 2 4 6 6
12
77 3
16 1 3 4
91 13
104 368 91
232 1
(D) 18
(D) 82
181
49 136
6 11
8 23 39
102
44 84 96
143 48 61 58 97
1042 796 173
26 886
66 400
1527 080
1867 185
1487 476
651 378
452 556 654
1746 701
561 497 580
53287 074
22604 868
2552 900
6(D)
3(D)
2 1--
1--
3-----
2 1
3 16
1(D)
--
1(D)
--
3(D)
1(D)
--
2(D)
1(D)
2(D)
2(D)
1(D)
3216 500
72 167
1(D)
--------2
(D)
--1
(D)2
(D)
1(D)
2(D)
----
5 10
1 1 2 2 4
12-
2-
1-
13 2
15 51 12(D)
--
5(D) 11 27
7(D)
2(D)
--
5(D)
4(D) 12(D)
9(D)
5(D)
15170 686
11 379
1(D)
46 050
2(D)
--1
(D)7
146 383
2(D)
5(D)
5(D)
773 988
57 100
----
11 8 1 1 1 1 4
12 1 4-
1 1
15 4
19 95 16(D)
1(D)
3(D) 13 30
12(D)
2(D)
5(D)
9 22
9 21 19 32 11 16 12 24
19978 155
51 482
--3
6 4002
(D)3
19 150--
11946 805
1(D)10
510 39513
155 960
6302 800
3(D)
----
25 7-
2 1 1 3
25 2 3 1 1-
30 2
32 107
27 70
--
4 11 26 59
15 37
--
1(D) 14(D)
10 15 30 45 15 18 15 27
32869 126
27 160
1(D)
47 680
622 675
532 136
325 500
13779 995
512 650
16393 475
1771 451
467 500
821 850
4(D)
1(D)
31 4--
1 2 1
25-
7--
3
31 4
35 99 35 74
--
5 9
32 65
12 25
1(D)
2(D)
9 22
20 34 33 42 11 13 25 37
35561 706
16 049
33 260
46 950
831 335
636 190
2(D)12
467 971
924 146
24455 110
1649 570
4(D)
717 450
2(D)
2(D)
See footnotes at end of table.

12 GUAM 2007 CENSUS OF AGRICULTURE
Table 14. Summary by Age of Operator: 2007 – (Cont.)(For enumeration periods, see appendix A; and for meaning of abbreviations and symbols, see introductory text)
Item Total Under 35 years 35 to 44 years 45 to 54 years 55 to 64 years 65 years and over
SELECTED FARM PRODUCTION EXPENSESMachine hire and customwork . . . . . . . . . farms..
dollars..Hired farm labor . . . . . . . . . . . . . . . . . . . . farms..
dollars..Feed purchased for livestock, poultry, and fish . . . . . . . . . . . . . . . . . . . farms..
dollars..Insecticides, fungicides, and herbicides . . farms..
dollars..Fertilizers and manure purchased . . . . . . farms..
dollars..Livestock, poultry, and fish purchased . . . farms..
dollars..Seed cost - including seedlings . . . . . . . . farms..
dollars..ROOT CROPS HARVESTED FOR SALE
Cassava (tapioca) . . . . . . . . . . . . . . . . . . . farms..acres..
pounds harvested..
Gado . . . . . . . . . . . . . . . . . . . . . . . . . . . . . farms..acres..
pounds harvested..
Sweetpotatoes . . . . . . . . . . . . . . . . . . . . . farms..acres..
pounds harvested..
Taro . . . . . . . . . . . . . . . . . . . . . . . . . . . . . farms..acres..
pounds harvested..
Yams . . . . . . . . . . . . . . . . . . . . . . . . . . . . . farms..acres..
pounds harvested..
Ginger . . . . . . . . . . . . . . . . . . . . . . . . . . . . farms..acres..
pounds harvested..
Other root crops . . . . . . . . . . . . . . . . . . . . farms..acres..
pounds harvested..
VEGETABLES AND MELONS HARVESTED FOR SALE
Alfalfa and/or bean sprouts . . . . . . . . . . .2 farms..pounds harvested..
Beans, yard long . . . . . . . . . . . . . . . . . . . . farms..acres..
pounds harvested..
Beans, all other . . . . . . . . . . . . . . . . . . . . farms..acres..
pounds harvested..
Bittermelons . . . . . . . . . . . . . . . . . . . . . . . farms..acres..
pounds harvested..
Cabbage, Chinese . . . . . . . . . . . . . . . . . . farms..acres..
pounds harvested..
Cabbage, head . . . . . . . . . . . . . . . . . . . . . farms..acres..
pounds harvested..
Cantaloups . . . . . . . . . . . . . . . . . . . . . . . . farms..acres..
pounds harvested..
Corn . . . . . . . . . . . . . . . . . . . . . . . . . . . . .3 farms..acres..
pounds harvested..
Cucumbers . . . . . . . . . . . . . . . . . . . . . . . . farms..acres..
pounds harvested..
Eggplant . . . . . . . . . . . . . . . . . . . . . . . . . . farms..acres..
pounds harvested..
3266 140
49548 760
23128 562
6794 024
79196 070
320 620
5856 786
75
7 750
31
4 100
1(D)(D)
89
18 800
106
13 000
97
23 000
2(D)(D)
2(D)
2543
126 203
112
9 020
1727
73 950
53
4 930
1(D)(D)
512
66 000
421
123 250
2292
1 354 320
4443
164 959
36 150
3100 500
--2
(D)1
12 500--2
(D)
---
---
---
---
---
---
---
--
1(D)(D)
---
---
---
---
1(D)(D)
---
1(D)(D)
1(D)(D)
47 800
751 020
1(D)10
(D)11
13 940--6
(D)
1(D)(D)
---
---
2(D)(D)
---
1(D)(D)
---
--
1 (D) (D)
1(D)(D)
1(D)(D)
1(D)(D)
---
---
---
2(D)(D)
5(D)(D)
819 100
12180 500
35 400
1129 210
1551 170
--
1418 885
---
---
---
1(D)(D)
1(D)(D)
1(D)(D)
---
--
66
31 680
1(D)(D)
55
19 100
---
---
1(D)(D)
---
423
190 400
96
61 100
67 350
14130 300
9112 058
2139 575
2367 200
2(D)17
18 080
1(D)(D)
1(D)(D)
---
1(D)(D)
2(D)(D)
43
14 400
1(D)(D)
1(D)
819
38 640
31
2 300
79
32 100
1(D)(D)
1(D)(D)
2(D)(D)
3(D)(D)
614
32 620
116
17 504
1125 740
1386 440
10(D)23
14 95229
51 2601
(D)19
10 563
54
6 450
2(D)(D)
1(D)(D)
45
12 050
75
10 900
32
5 200
1(D)(D)
1(D)
97
31 383
62
3 620
4(D)(D)
3(D)(D)
---
1(D)(D)
1(D)(D)
925
891 300
1817
62 955
See footnotes at end of table.

2007 CENSUS OF AGRICULTURE GUAM 13
Table 14. Summary by Age of Operator: 2007 – (Cont.)(For enumeration periods, see appendix A; and for meaning of abbreviations and symbols, see introductory text)
Item Total Under 35 years 35 to 44 years 45 to 54 years 55 to 64 years 65 years and over
VEGETABLES AND MELONSHARVESTED FOR SALE – Con.
Muskmelons and pepinos . . . . . . . . . farms..acres..
pounds harvested..
Okra . . . . . . . . . . . . . . . . . . . . . . . . . farms..acres..
pounds harvested..
Onions, green . . . . . . . . . . . . . . . . . . farms..acres..
pounds harvested..
Peppers, hot . . . . . . . . . . . . . . . . . . . farms..acres..
pounds harvested..
Peppers, sweet . . . . . . . . . . . . . . . . . farms..acres..
pounds harvested..
Pumpkins and squash . . . . . . . . . . . farms..acres..
pounds harvested..
Radishes . . . . . . . . . . . . . . . . . . . . . . farms..acres..
pounds harvested..
Tomatoes . . . . . . . . . . . . . . . . . . . . . farms..acres..
pounds harvested..
Watermelons . . . . . . . . . . . . . . . . . . farms..acres..
pounds harvested..
Other vegetables and melons . . . . . . farms..acres..
pounds harvested..
FRUITS, NUTS, AND NURSERY CROPS (including ornamental plants) HARVESTED FOR SALE
Land in bearing and nonbearing fruit trees and plants . . . . . . . . . . . . . . . farms..
acres..
Avocados . . . . . . . . . . . . . . . . . . . . . farms..trees not of bearing age..
trees of bearing age..pounds harvested..
Bananas (all types) . . . . . . . . . . . . . . farms..trees not of bearing age..
trees of bearing age..pounds harvested..
Betelnuts . . . . . . . . . . . . . . . . . . . . . . farms..trees not of bearing age..
trees of bearing age..pounds harvested..
Breadfruits . . . . . . . . . . . . . . . . . . . . farms..trees not of bearing age..
trees of bearing age..pounds harvested..
Coconuts . . . . . . . . . . . . . . . . . . . . . farms..trees not of bearing age..
trees of bearing age..pounds harvested..
Grapefruit . . . . . . . . . . . . . . . . . . . . . farms..trees not of bearing age..
trees of bearing age..pounds harvested..
Guavas . . . . . . . . . . . . . . . . . . . . . . . farms..trees not of bearing age..
trees of bearing age..pounds harvested..
Lemons and limes . . . . . . . . . . . . . . . farms..trees not of bearing age..
trees of bearing age..pounds harvested..
Mangos . . . . . . . . . . . . . . . . . . . . . . . farms..trees not of bearing age..
trees of bearing age..pounds harvested..
1(D)(D)
1915
36,229
93
5,210
289
27,858
411
13,220
1014
45,350
93
12,340
2719
86,425
788
772,000
102
9,525
57145
1694
1687,770
315,526
13,673238,246
16774
2,7714,100
1461
2589,650
171,1721,323
20,200
42
354,200
7120153
7,390
21768384
9,760
15247103
18,150
---
1(D)(D)
---
---
---
1(D)(D)
---
1(D)(D)
1(D)(D)
---
2 (D)
----
2(D)(D)(D)
1(D)(D)(D)
----
----
----
----
----
----
---
1(D)(D)
2(D)(D)
2(D)(D)
1(D)(D)
---
2(D)(D)
2(D)(D)
1(D)(D)
1(D)(D)
5 (D)
31216
2,280
3(D)(D)(D)
3(D)(D)(D)
31411
2,400
4(D)(D)(D)
32
303,200
2(D)(D)(D)
41553
2,850
314
9350
---
---
2(D)(D)
6(D)(D)
---
3(D)(D)
2(D)(D)
53
21,700
1(D)(D)
41
5,600
1529
4(D)(D)(D)
6480
6,712123,840
3135370850
31011
1,300
2(D)(D)(D)
----
1(D)(D)(D)
4108
26350
3164
10100
1(D)(D)
64
4,630
1(D)(D)
51
5,790
2(D)(D)
36
29,000
2(D)(D)
73
30,460
323
152,000
1(D)(D)
1847
2(D)(D)(D)
111,1501,607
19,356
429
1421,100
3-
142,300
665
4943,700
----
2(D)(D)(D)
552
1672,560
41851
12,500
---
118
29,599
42
3,950
154
7,028
1(D)(D)
33
2,450
31
4,040
129
23,015
1(D)(D)
4(D)(D)
1753
756
1274,150
93,8164,265
77,550
5191
2,2052,050
537
2223,650
5920355
3,280
1(D)(D)(D)
2(D)(D)(D)
8593138
4,000
55133
5,200
See footnotes at end of table.

14 GUAM 2007 CENSUS OF AGRICULTURE
Table 14. Summary by Age of Operator: 2007 – (Cont.)(For enumeration periods, see appendix A; and for meaning of abbreviations and symbols, see introductory text)
Item Total Under 35 years 35 to 44 years 45 to 54 years 55 to 64 years 65 years and over
FRUITS, NUTS, AND NURSERY CROPS (Including ornamental plants) – Con.
Oranges . . . . . . . . . . . . . . . . . . . . . . farms..trees not of bearing age..
trees of bearing age..pounds harvested..
Papayas . . . . . . . . . . . . . . . . . . . . . . farms..trees not of bearing age..
trees of bearing age..pounds harvested..
Pineapples . . . . . . . . . . . . . . . . . . . . farms..plants not of bearing age..
plants of bearing age..pounds harvested..
Soursops . . . . . . . . . . . . . . . . . . . . . farms..trees not of bearing age..
trees of bearing age..pounds harvested..
Starfruits . . . . . . . . . . . . . . . . . . . . . . farms..trees not of bearing age..
trees of bearing age..pounds harvested..
Sweetsops . . . . . . . . . . . . . . . . . . . . farms..trees not of bearing age..
trees of bearing age..pounds harvested..
Tangerines . . . . . . . . . . . . . . . . . . . . farms..trees not of bearing age..
trees of bearing age..pounds harvested..
Other fruits, nuts, and tree crops . . . farms..plants or trees not of bearing age..
plants or trees of bearing age..pounds harvested..
Nursery crops (including ornamental plants) . . . . . . . . . . . . . . . . . . . . . . farms..
sq. ft. under cover..acres in the open..
LIVESTOCK, POULTRY, AND THEIR PRODUCTS, AND FISH
Inventory
Carabaos . . . . . . . . . . . . . . . . . . . . . farms..number..
All Cattle and calves . . . . . . . . . . . . . farms..number..
Milk cows . . . . . . . . . . . . . . . . . . . . farms..number..
Other cattle and calves . . . . . . . . . farms..number..
Hogs and pigs of all ages . . . . . . . . . farms..number..
Goats and kids of all ages . . . . . . . . farms..number..
Horses, mules, and colts of all ages . farms..number..
Chicken hens 4 months old or older . farms..number..
Commercial layers . . . . . . . . . . . . . farms..number..
Other chicken hens . . . . . . . . . . . . farms..number..
Chickens under 4 months old . . . . . . . farms..number..
4474
130
25205
2 15351 330
4600
6 60017 570
1268
1011 850
3-5
275
1354
3481 280
12442207
11 110
448117
436
22110 350
21
4 12
13112
1(D)
13110
22635
10124
2(D)
8182
1(D)
7172
6272
----
2(D)(D)(D)
----
1(D)(D)(D)
----
1(D)(D)(D)
----
----
1(D)(D)
1(D)
2(D)
--
2(D)
2(D)
--
1(D)
--
--
--
--
2(D)(D)(D)
1(D)(D)(D)
----
2(D)(D)(D)
1(D)(D)(D)
1(D)(D)(D)
334
1094 750
----
733 700
5
--
319
--
319
4(D)
2(D)
1(D)
1(D)
--
1(D)
1(D)
----
880
1 11224 280
2(D)(D)(D)
1(D)(D)(D)
----
2(D)(D)(D)
1(D)(D)(D)
----
63 900
6
1(D)
1(D)
--
1(D)
3228
1(D)
--
--
--
--
--
1(D)(D)(D)
7105520
20 000
2(D)(D)(D)
68
861 600
1(D)(D)(D)
34
50150
4(D)(D)(D)
1(D)(D)(D)
4(D)(D)
2(D)
669
1(D)
667
6130
436
--
4105
1(D)
395
4(D)
1(D)(D)(D)
720
2104 150
----
2(D)(D)(D)
1(D)(D)(D)
630
104580
440321
1 260
3(D)(D)(D)
412 100
1
--
1(D)
--
1(D)
7194
324
--
3(D)
--
3(D)
1(D)
See footnotes at end of table.

2007 CENSUS OF AGRICULTURE GUAM 15
Table 14. Summary by Age of Operator: 2007 – (Cont.)(For enumeration periods, see appendix A; and for meaning of abbreviations and symbols, see introductory text)
Item Total Under 35 years 35 to 44 years 45 to 54 years 55 to 64 years 65 years and over
LIVESTOCK, POULTRY, AND THEIR PRODUCTS, AND FISH – Con.
Inventory
Roosters and pullets . . . . . . . . . . . . . . . . farms..number..
Fighting roosters . . . . . . . . . . . . . . . . . . . farms..number..
Ducks . . . . . . . . . . . . . . . . . . . . . . . . . . . farms..number..
Pigeons . . . . . . . . . . . . . . . . . . . . . . . . . . farms..number..
Other poultry . . . . . . . . . . . . . . . . . . . . . . farms..number..
Sales
Carabaos . . . . . . . . . . . . . . . . . . . . . . . . farms..number..
Cattle and calves . . . . . . . . . . . . . . . . . . farms..number..
Milk cows . . . . . . . . . . . . . . . . . . . . . . . farms..number..
Other cattle and calves . . . . . . . . . . . . farms..number..
Hogs and pigs of all ages . . . . . . . . . . . . farms..number..
Goats and kids of all ages . . . . . . . . . . . farms..number..
Horses, mules, and colts of all ages . . . . farms..number..
Chicken hens 4 months old or older . . . . farms..number..
Commercial layers . . . . . . . . . . . . . . . . farms..number..
Other chicken hens . . . . . . . . . . . . . . . farms..number..
Chickens under 4 months old . . . . . . . . farms..number..
Roosters and pullets . . . . . . . . . . . . . . . . farms..number..
Fighting roosters . . . . . . . . . . . . . . . . . . . farms..number..
Ducks . . . . . . . . . . . . . . . . . . . . . . . . . . . farms..number..
Pigeons . . . . . . . . . . . . . . . . . . . . . . . . . . farms..number..
Other poultry and poultry products (excluding chicken eggs) . . . . . . . . . . farms..
number..
Chicken eggs . . . . . . . . . . . . . . . . . . . . . farms..dozens..
Fish and other aquaculture products . . . . . . . . . . . . . . . . . . . . . . . . farms..
pounds..
679
2(D)
2(D)
1(D)
--
1(D)
919
1(D)
817
20356
411
--
337
--
337
--
1(D)
1(D)
1(D)
--
--
1(D)
3(D)
--
--
--
--
--
--
1(D)
--
1(D)
1(D)
--
--
--
--
--
--
--
--
--
--
--
--
--
1(D)
--
--
--
--
--
1(D)
--
1(D)
436
1(D)
--
--
--
--
--
--
--
--
--
--
--
--
--
1(D)
--
--
--
--
1(D)
--
1(D)
3(D)
--
--
--
--
--
--
--
--
--
--
--
--
--
354
--
2(D)
--
--
1(D)
512
1(D)
410
559
2(D)
--
2(D)
--
2(D)
--
1(D)
--
1(D)
--
--
1 (D)
1(D)
2(D)
1(D)
--
1(D)
--
--
1(D)
--
1(D)
7152
1(D)
--
1(D)
--
1(D)
--
--
1(D)
--
--
--
--
2(D)
Detail may not add to total because of rounding.1
The acres reported for alfalfa and/or bean sprouts do not reflect multiple crops harvested during the census year.2
Includes dry and green corn.3

16 GUAM 2007 CENSUS OF AGRICULTURE
Table 15. Summary by Size of Farm: 2007 (For enumeration periods, see appendix A; and for meaning of abbreviations and symbols, see introductory text)
ItemTotal
Less than1 acre
1 to 2 acres
3 to 4 acres
5 to 7 acres
8 to 9 acres
10 to 19 acres
20 acresor more
FARMS AND LAND IN FARMS
Farms . . . . . . . . . . . . . . . . . . . . . . . . . . . . . . . . Percent of farms . . . . . . . . . . . . . . . . . . . . .
Land in farms . . . . . . . . . . . . . . . . . . . . acres ..1
Percent distribution . . . . . . . . . . . . . . . . . . . Average size of farm . . . . . . . . . . . . acres..
LAND USETotal cropland . . . . . . . . . . . . . . . . . . . . farms..
acres ..1
Harvested . . . . . . . . . . . . . . . . . . . . . farms.. acres.. Other . . . . . . . . . . . . . . . . . . . . . . . . . farms..
acres..Pasture or grazing land . . . . . . . . . . . . farms.. acres..Woodland . . . . . . . . . . . . . . . . . . . . . . . farms..
acres..Other land . . . . . . . . . . . . . . . . . . . . . . . farms..
acres..
LAND IRRIGATEDIrrigated land . . . . . . . . . . . . . . . . . . . . farms..
acres.. Private system . . . . . . . . . . . . . . . . . . farms..
acres.. Public system . . . . . . . . . . . . . . . . . . farms..
acres..
FARMS BY MAJOR SOURCE OF IRRIGATION WATERWell or cistern . . . . . . . . . . . . . . . . . . . . . . . . .River or stream . . . . . . . . . . . . . . . . . . . . . . . . .Lake or private pond . . . . . . . . . . . . . . . . . . . . .Canal or irrigation district . . . . . . . . . . . . . . . . .Public utility . . . . . . . . . . . . . . . . . . . . . . . . . . .Other . . . . . . . . . . . . . . . . . . . . . . . . . . . . . . . . .
TENURE OF OPERATOROperators . . . . . . . . . . . . . . . . . . . . . . . farms..
acres ..1
Owners . . . . . . . . . . . . . . . . . . . . . . . farms..acres..
Full owners . . . . . . . . . . . . . . . . . . . farms..acres..
Part owners . . . . . . . . . . . . . . . . . . farms..acres..
Tenants . . . . . . . . . . . . . . . . . . . . . . . farms..acres..
FARMS BY SIZEFarms . . . . . . . . . . . . . . . . . . . . . . . . . . . . . . . . Less than 1 acre . . . . . . . . . . . . . . . . . . . . . . 1 to 2 acres . . . . . . . . . . . . . . . . . . . . . . . . . . 3 to 4 acres . . . . . . . . . . . . . . . . . . . . . . . . . . 5 to 7 acres . . . . . . . . . . . . . . . . . . . . . . . . . . 8 to 9 acres . . . . . . . . . . . . . . . . . . . . . . . . . . 10 to 19 acres . . . . . . . . . . . . . . . . . . . . . . . . 20 acres or more . . . . . . . . . . . . . . . . . . . . . .
OPERATOR CHARACTERISTICSOperators by place of residence: On farm operated . . . . . . . . . . . . . . . . . . . . . Not on farm operated . . . . . . . . . . . . . . . . . . .
Operators by years on present farm: Less than 2 years . . . . . . . . . . . . . . . . . . . . . 2 to 4 years . . . . . . . . . . . . . . . . . . . . . . . . . . 5 to 9 years . . . . . . . . . . . . . . . . . . . . . . . . . . 10 years or more . . . . . . . . . . . . . . . . . . . . . .
Operators by age group: Under 35 years . . . . . . . . . . . . . . . . . . . . . . . 35 to 44 years . . . . . . . . . . . . . . . . . . . . . . . . 45 to 54 years . . . . . . . . . . . . . . . . . . . . . . . . 55 to 64 years . . . . . . . . . . . . . . . . . . . . . . . . 65 years and over . . . . . . . . . . . . . . . . . . . . . Average age . . . . . . . . . . . . . . . . . . . . . . .
Operators by main occupation: Agricultural . . . . . . . . . . . . . . . . . . . . . . . . . . Nonagricultural . . . . . . . . . . . . . . . . . . . . . . .
104 100.0
1000 100.0
9.6
97 831
95 498
53 332
10 58
5 51 50 60
96 565
8 62 91
503
- 4 1-
89 2
1041 000
83813 79
741 4
72 21
186
13 27 13 15
4 15 17
48 56
8 4
16 76
3 15 19 32 35 59
80 24
13 12.5
6 0.6 0.4
12 4
12 4----
1(D)
7(D)
12 4--
12 4
----
12-
136
11 (D) 11(D)
--
2(D)
13------
6 7
3 1 2 7
- 4 2 3 4
57
8 5
27 26.0
45 4.5 1.6
26 38 25 30 10
9 4 3--
9 4
27 34
2(D) 25(D)
- 1--
25 1
2745
25 (D) 25(D)
--
2(D)
- 27
-----
12 15
2 2 4
19
1 6 4 8 8
55
18 9
13 12.5
45 4.5 3.4
12 41 12 26 10 15
1(D)
1(D)
5 2
12 26
--
12 26
----
12-
1345
1035
10 35
--
3 10
--
13----
5 8
1-
2 10
--
1 5 7
70
11 2
15 14.4
81 8.1 5.4
14 72 14(D)
9(D)
1(D)
--
10(D)
14 51
2(D) 12(D)
- 1 1-
12-
1581 8
43 8
43--
7 39
---
15---
6 9
1 1 1
12
--
5 6 4
59
13 2
4 3.8
33 3.3 8.1
4 25
4(D)
2(D)
1(D)
--
1(D)
3 13
--
3 13
----
3-
433 4
33 2
(D) 2
(D)--
----
4--
3 1
1--
3
---
2 2
66
3 1
15 14.4
208 20.8 13.9
13 163
12 78 10 85
3 42
1(D)
7(D)
12 117
1(D) 11(D)
----
11 1
15208 11
145 11
145--
4 63
-----
15-
8 7
--
3 12
- 3 3 2 7
60
11 4
17 16.3
583 58.3 34.3
16 486
16 296
12 190
--
2(D) 11(D)
16 319
3 52 16
267
- 2--
14-
17583 14
513 12(D)
2(D)
3 70
------
17
8 9
--
4 13
2 2 4 6 3
54
16 1
See footnotes at end of table.

2007 CENSUS OF AGRICULTURE GUAM 17
Table 15. Summary by Size of Farm: 2007 – (Cont.)(For enumeration periods, see appendix A; and for meaning of abbreviations and symbols, see introductory text)
ItemTotal
Less than1 acre
1 to 2 acres
3 to 4 acres
5 to 7 acres
8 to 9 acres
10 to 19 acres
20 acresor more
OPERATOR CHARACTERISTICS – Con.
Operators by days of work off farm: None . . . . . . . . . . . . . . . . . . . . . . . . . . . . . Any . . . . . . . . . . . . . . . . . . . . . . . . . . . . . . 1 to 49 days . . . . . . . . . . . . . . . . . . . . . . 50 to 99 days . . . . . . . . . . . . . . . . . . . . . 100 to 149 days . . . . . . . . . . . . . . . . . . . 150 to 199 days . . . . . . . . . . . . . . . . . . . 200 days or more . . . . . . . . . . . . . . . . . .
Operators by race: Chamorro . . . . . . . . . . . . . . . . . . . . . . . . . . Chinese . . . . . . . . . . . . . . . . . . . . . . . . . . . Filipino . . . . . . . . . . . . . . . . . . . . . . . . . . . . Japanese . . . . . . . . . . . . . . . . . . . . . . . . . . White . . . . . . . . . . . . . . . . . . . . . . . . . . . . . Other . . . . . . . . . . . . . . . . . . . . . . . . . . . . . Operators by sex: Male . . . . . . . . . . . . . . . . . . . . . . . . . . . . . . Female . . . . . . . . . . . . . . . . . . . . . . . . . . . .
LABOR STATUSFarms . . . . . . . . . . . . . . . . . . . . . . . number..
workers.. Unpaid labor . . . . . . . . . . . . . . . . . farms..
workers.. Less than 25 days . . . . . . . . . . . farms..
workers.. 25 to 149 days . . . . . . . . . . . . . . farms..
workers.. 150 days or more . . . . . . . . . . . . farms..
workers..
Paid labor . . . . . . . . . . . . . . . . . . . .farms..workers..
Less than 25 days . . . . . . . . . . . farms..workers..
25 to 149 days . . . . . . . . . . . . . . farms..workers..
150 days or more . . . . . . . . . . . . farms..workers..
SELECTED EQUIPMENTTractors (all kinds) . . . . . . . . . . . . . . farms..
number..Motortrucks . . . . . . . . . . . . . . . . . . . . farms..
number..Automobiles . . . . . . . . . . . . . . . . . . . farms..
number..Tillers (all kinds) . . . . . . . . . . . . . . . . farms..
number..
MARKET VALUE OF AGRICULTURAL PRODUCTS SOLDTotal sales . . . . . . . . . . . . . . . . . . . . farms..
dollars.. Average per farm . . . . . . . . . . . . dollars.. Farms by value of sales: Less than $1,200 . . . . . . . . . . . . farms.. dollars.. $1,200 to $2,499 . . . . . . . . . . . . . farms..
dollars.. $2,500 to $4,999 . . . . . . . . . . . . . farms..
dollars.. $5,000 to $7,499 . . . . . . . . . . . . . farms..
dollars.. $7,500 to $9,999 . . . . . . . . . . . . . farms..
dollars.. $10,000 or more . . . . . . . . . . . . . farms..
dollars..
SALES BY COMMODITY GROUP OR PRODUCT:Root crops . . . . . . . . . . . . . . . . . . . . farms..
dollars..Vegetables and melons . . . . . . . . . . farms..
dollars..Fruits and nuts . . . . . . . . . . . . . . . . . farms..
dollars..Nursery crops (including ornamental plants) . . . . . . . . . . . . . . . . . . . . . . . . farms..
dollars..Livestock . . . . . . . . . . . . . . . . . . . . . . farms..
dollars..Poultry and poultry products . . . . . . . farms..
dollars..Fish and other aquaculture products farms..
dollars..
74 30 2 4 6 6
12
77 3
16 1 3 4
91 13
104 368 91
232 1
(D) 18
(D) 82
181
49 136
6 11
8 23 39
102
44 84 96
143 48 61 58 97
1042 796 173
26 886
66 400
1527 080
1867 185
1487 476
651 378
452 556 654
1746 701
561 497 580
53287 074
22604 868
2552 900
6(D)
3(D)
4 9 1-
1 3 4
4-
6-
3-
10 3
13 34
9(D)
--
2(D)
8(D)
7(D)
--
1(D)
6(D)
1(D) 13 14
2(D)
3 4
13149 560
11 505
2(D)
--2
(D)2
(D)--7
128 875
1(D)
4(D)
46 150
8101 500
1(D)
1(D)
--
17 10
- 1 5 1 3
24-
3---
24 3
27 70 25 55
--
6 14 22 41
10 15
3 6 2
(D) 5
(D)
5 6
22 27 15 19 14 18
27237 198
8 785
2(D)
712 280
828 710
2(D)
--8
180 358
57 350
1347 305
1329 643
7142 500
710 400
----
11 2---
1 1
10-
2--
1
13-
13 39 13 33
--
2(D) 13(D)
3 6----
3 6
5 6
10 10
6 7 7 8
1394 296
7 254
1(D)
1(D)
312 250
532 650
1(D)
2(D)
36 746
853 355
924 305
--3
(D)2
(D)--
12 3-
2--
1
11 2 2---
14 1
15 62 13 33
--
2(D) 12(D)
10 29
2(D)
3(D)
7 14
8 12 15 25
9 10 10 23
15434 371
28 958
--1
(D)--4
24 8262
(D)8
390 245
413 000
11170 890
727 791
3207 000
312 100
2(D)
1(D)
3 1-
1---
3-
1---
4-
4 10
4(D)
--
1(D)
4(D)
1(D)
--
1(D)
--
2(D)
4 6 1
(D) 3
11
4190 325
47 581
--2
(D)1
(D)----1
(D)
--2
(D)3
1 455
--3
6 9501
(D)1
(D)
11 4 1--
1 2
13----
2
14 1
15 51 15 42
--
3 5
13 37
3 9----
3 9
9 16 15 20
8 9
10 14
1593 023
6 202
1(D)
35 050
415 035
1(D)
326 378
340 460
313 230
539 095
929 730
3(D)
5(D)
----
16 1----
1
12 1 2 1-
1
12 5
17 102
12 35
1(D)
2(D) 10 23
15 67
1(D)
1(D) 15 59
14 38 17 41
7 13 11 19
171 597 400
93 965
--1
(D)------
16(D)
1(D)13
967 4008
168 000
1(D)
36 000
--1
(D)
See footnotes at end of table.

18 GUAM 2007 CENSUS OF AGRICULTURE
Table 15. Summary by Size of Farm: 2007 – (Cont.)(For enumeration periods, see appendix A; and for meaning of abbreviations and symbols, see introductory text)
ItemTotal
Less than1 acre
1 to 2 acres
3 to 4 acres
5 to 7 acres
8 to 9 acres
10 to 19 acres
20 acresor more
SELECTED FARM PRODUCTION EXPENSES
Machine hire and customwork . . . . . . . . farms..dollars..
Hired farm labor . . . . . . . . . . . . . . . . . . . farms..dollars..
Feed purchased for livestock, poultry, and fish . . . . . . . . . . . . . . . . . . farms..
dollars..Insecticides, fungicides, and herbicides . farms..
dollars..Fertilizers and manure purchased . . . . . farms..
dollars..Livestock, poultry, and fish purchased . . farms..
dollars..Seed cost - including seedlings . . . . . . . farms..
dollars..ROOT CROPS HARVESTED FOR SALE
Cassava (tapioca) . . . . . . . . . . . . . . . . . . farms..acres..
pounds harvested..
Gado . . . . . . . . . . . . . . . . . . . . . . . . . . . . farms..acres..
pounds harvested..
Sweetpotatoes . . . . . . . . . . . . . . . . . . . . farms..acres..
pounds harvested..
Taro . . . . . . . . . . . . . . . . . . . . . . . . . . . . farms..acres..
pounds harvested..
Yams . . . . . . . . . . . . . . . . . . . . . . . . . . . . farms..acres..
pounds harvested..
Ginger . . . . . . . . . . . . . . . . . . . . . . . . . . . farms..acres..
pounds harvested..
Other root crops . . . . . . . . . . . . . . . . . . . farms..acres..
pounds harvested..VEGETABLES AND MELONS HARVESTED FOR SALE
Alfalfa and/or bean sprouts . . . . . . . . . .2 farms..pounds harvested..
Beans, yard long . . . . . . . . . . . . . . . . . . . farms..acres..
pounds harvested..
Beans, all other . . . . . . . . . . . . . . . . . . . farms..acres..
pounds harvested..
Bittermelons . . . . . . . . . . . . . . . . . . . . . . farms..acres..
pounds harvested..
Cabbage, Chinese . . . . . . . . . . . . . . . . . farms..acres..
pounds harvested..
Cabbage, head . . . . . . . . . . . . . . . . . . . . farms..acres..
pounds harvested..
Cantaloups . . . . . . . . . . . . . . . . . . . . . . . farms..acres..
pounds harvested..
Corn . . . . . . . . . . . . . . . . . . . . . . . . . . . .3 farms..acres..
pounds harvested..
Cucumbers . . . . . . . . . . . . . . . . . . . . . . . farms..acres..
pounds harvested..
Eggplant . . . . . . . . . . . . . . . . . . . . . . . . . farms..acres..
pounds harvested..
3266 140
49548 760
23128 562
6794 024
79196 070
320 620
5856 786
75
7 750
31
4 100
1(D)(D)
89
18 800
106
13 000
97
23 000
2(D)(D)
2(D)
2543
126 203
112
9 020
1727
73 950
53
4 930
1(D)(D)
512
66 000
421
123 250
2292
1 354 320
4443
164 959
1(D)
675 820
2(D)10
2 04212
(D)--8
2 005
---
---
---
1(D)(D)
---
---
---
1(D)
---
1(D)(D)
---
1(D)(D)
---
---
---
---
2(D)(D)
58 390
1033 260
43 100
206 970
2213 230
--
122 041
2(D)(D)
---
---
1(D)(D)
31
3 850
31
3 700
---
--
3(D)(D)
41
4 020
1(D)(D)
---
1(D)(D)
1(D)(D)
1(D)(D)
2(D)(D)
103
8 300
2(D)
412 200
34 540
74 968
910 826
1(D)
94 543
32
4 150
1(D)(D)
1(D)(D)
2(D)(D)
2(D)(D)
32
3 900
---
1(D)
43
11 035
1(D)(D)
2(D)(D)
1(D)(D)
---
---
---
52
14 500
62
14 791
44 300
985 700
68 588
1112 075
1327 956
1(D)12
17 911
---
2(D)(D)
---
1(D)(D)
32
6 200
1(D)(D)
2(D)(D)
--
63
30 320
31
3 650
42
14 400
1(D)(D)
---
---
1(D)(D)
34
37 120
97
43 554
2(D)
1(D)
34 834
1(D)
2(D)
----
---
---
---
---
---
---
---
--
---
---
---
---
---
---
---
1(D)(D)
2(D)(D)
816 950
3(D)
32 580
5(D)
77 470
--4
1 236
2(D)(D)
---
---
2(D)(D)
1(D)(D)
2(D)(D)
---
--
2(D)(D)
1(D)(D)
2(D)(D)
1(D)(D)
---
---
---
34
10 700
48
16 350
1033 100
16317 200
2(D)13
65 27214
129 4281
(D)13
29 050
---
---
---
1(D)(D)
1(D)(D)
---
---
--
1034
69 648
1(D)(D)
824
55 800
1(D)(D)
---
4(D)(D)
2(D)(D)
866
442 500
1120
68 964
See footnotes at end of table.

2007 CENSUS OF AGRICULTURE GUAM 19
Table 15. Summary by Size of Farm: 2007 – (Cont.)(For enumeration periods, see appendix A; and for meaning of abbreviations and symbols, see introductory text)
ItemTotal
Less than1 acre
1 to 2 acres
3 to 4 acres
5 to 7 acres
8 to 9 acres
10 to 19 acres
20 acresor more
VEGETABLES AND MELONS HARVESTED FOR SALE – Con.
Muskmelons and pepinos . . . . . . . . . farms..acres..
pounds harvested..
Okra . . . . . . . . . . . . . . . . . . . . . . . . . farms..acres..
pounds harvested..
Onions, green . . . . . . . . . . . . . . . . . . farms..acres..
pounds harvested..
Peppers, hot . . . . . . . . . . . . . . . . . . . farms..acres..
pounds harvested..
Peppers, sweet . . . . . . . . . . . . . . . . . farms..acres..
pounds harvested..
Pumpkins and squash . . . . . . . . . . . farms..acres..
pounds harvested..
Radishes . . . . . . . . . . . . . . . . . . . . . . farms..acres..
pounds harvested..
Tomatoes . . . . . . . . . . . . . . . . . . . . . farms..acres..
pounds harvested..
Watermelons . . . . . . . . . . . . . . . . . . farms..acres..
pounds harvested..
Other vegetables and melons . . . . . . farms..acres..
pounds harvested..
FRUITS, NUTS, AND NURSERY CROPS (including ornamental plants) HARVESTED FOR SALE
Land in bearing and nonbearing fruit trees and plants . . . . . . . . . . . . . . . farms..
acres..
Avocados . . . . . . . . . . . . . . . . . . . . . farms..trees not of bearing age..
trees of bearing age..pounds harvested..
Bananas . . . . . . . . . . . . . . . . . . . . .4 farms..trees not of bearing age..
trees of bearing age..pounds harvested..
Betelnuts . . . . . . . . . . . . . . . . . . . . . . farms..trees not of bearing age..
trees of bearing age..pounds harvested..
Breadfruits . . . . . . . . . . . . . . . . . . . . farms..trees not of bearing age..
trees of bearing age..pounds harvested..
Coconuts . . . . . . . . . . . . . . . . . . . . . farms..trees not of bearing age..
trees of bearing age..pounds harvested..
Grapefruit . . . . . . . . . . . . . . . . . . . . . farms..trees not of bearing age..
trees of bearing age..pounds harvested..
Guavas . . . . . . . . . . . . . . . . . . . . . . . farms..trees not of bearing age..
trees of bearing age..pounds harvested..
Lemons and limes . . . . . . . . . . . . . . . farms..trees not of bearing age..
trees of bearing age..pounds harvested..
Mangos . . . . . . . . . . . . . . . . . . . . . . . farms..trees not of bearing age..
trees of bearing age..pounds harvested..
1(D)(D)
1915
36 229
93
5 210
289
27 858
411
13 220
1014
45 350
93
12 340
2719
86 425
788
772 000
102
9 525
57145
1694
1687 770
315 526
13 673238 246
16774
2 7714 100
1461
2589 650
171 1721 323
20 200
42
354 200
7120153
7 390
21768384
9 760
15247103
18 150
---
---
1(D)(D)
---
---
---
1(D)(D)
1(D)(D)
---
31
1 050
41
----
----
----
----
----
----
1(D)(D)(D)
2(D)(D)(D)
----
---
52
4 905
1(D)(D)
61
3 950
2(D)(D)
---
1(D)(D)
3(D)(D)
1(D)(D)
1(D)(D)
1412
3-
14500
8230
1 21617 500
7518426
1 800
41313
1 300
3(D)(D)(D)
1(D)(D)(D)
1(D)(D)(D)
1(D)(D)(D)
34
6312 950
---
31
1 468
3(Z)
400
62
3 071
1(D)(D)
1(D)(D)
2(D)(D)
52
5 793
---
1(D)(D)
913
44
283 050
5(D)(D)(D)
351
1 9151 350
1(D)(D)(D)
385
2841 330
1(D)(D)(D)
1(D)(D)(D)
32
371 150
399
2 400
---
36
20 830
2(D)(D)
82
3 355
---
33
3 900
2(D)(D)
63
27 460
---
31
6 300
914
2(D)(D)(D)
6220
1 30015 136
1(D)(D)(D)
31516
1 500
4120305
11 970
----
1(D)(D)(D)
43073
610
2(D)(D)(D)
---
2(D)(D)
---
---
---
---
---
---
---
---
34
1(D)(D)(D)
1(D)(D)(D)
----
1(D)(D)(D)
----
----
----
1(D)(D)(D)
1(D)(D)(D)
---
2(D)(D)
---
31
1 500
---
2(D)(D)
2(D)(D)
44
7 750
---
---
947
444
1111 220
53 6803 415
59 000
4(D)(D)(D)
2(D)(D)(D)
5830415
3 750
1(D)(D)(D)
2(D)(D)(D)
6318132
1 650
53228
2 300
1(D)(D)
42
4 176
2(D)(D)
53
15 982
1(D)(D)
49
39 000
1(D)(D)
89
39 172
6(D)(D)
2(D)(D)
954
2(D)(D)(D)
6600
7 115130 200
1(D)(D)(D)
33
204 100
2(D)(D)(D)
1(D)(D)(D)
1(D)(D)(D)
4150104
3 750
1(D)(D)(D)
See footnotes at end of table.

20 GUAM 2007 CENSUS OF AGRICULTURE
Table 15. Summary by Size of Farm: 2007 – (Cont.)(For enumeration periods, see appendix A; and for meaning of abbreviations and symbols, see introductory text)
ItemTotal
Less than1 acre
1 to 2 acres
3 to 4 acres
5 to 7 acres
8 to 9 acres
10 to 19 acres
20 acresor more
FRUITS, NUTS, AND NURSERY CROPS (including ornamental plants) HARVESTED FOR SALE – Con.
Oranges . . . . . . . . . . . . . . . . . . . . . . farms..trees not of bearing age..
trees of bearing age..pounds harvested..
Papayas . . . . . . . . . . . . . . . . . . . . . . farms..trees not of bearing age..
trees of bearing age..pounds harvested..
Pineapples . . . . . . . . . . . . . . . . . . . . farms..plants not of bearing age..
plants of bearing age..pounds harvested..
Soursops . . . . . . . . . . . . . . . . . . . . . farms..trees not of bearing age..
trees of bearing age..pounds harvested..
Starfruits . . . . . . . . . . . . . . . . . . . . . . farms..trees not of bearing age..
trees of bearing age..pounds harvested..
Sweetsops . . . . . . . . . . . . . . . . . . . . farms..trees not of bearing age..
trees of bearing age..pounds harvested..
Tangerines . . . . . . . . . . . . . . . . . . . . farms..trees not of bearing age..
trees of bearing age..pounds harvested..
Other fruits, nuts, and tree crops . . . farms..plants or trees not of bearing ag..
plants or trees of bearing age..pounds harvested..
Nursery crops (including ornamental plants) . . . . . . . . . . . . . . . . . . . . . . farms..
sq. ft. under cover..acres in the open..
LIVESTOCK, POULTRY, AND THEIR PRODUCTS, AND FISH
Inventory
Carabaos . . . . . . . . . . . . . . . . . . . . . farms..number..
All Cattle and calves . . . . . . . . . . . . . farms..number..
Milk cows . . . . . . . . . . . . . . . . . . . . farms..number..
Other cattle and calves . . . . . . . . . farms..number..
Hogs and pigs of all ages . . . . . . . . . farms..number..
Goats and kids of all ages . . . . . . . . farms..number..
Horses, mules, and colts of all ages . farms..number..
Chicken hens 4 months old or older . farms..number..
Commercial layers . . . . . . . . . . . . . farms..number..
Other chicken hens . . . . . . . . . . . . farms..number..
Chickens under 4 months old . . . . . . farms..number..
447
4130
25205
2 15351 330
4600
6 60017 570
1268
1011 850
3-5
275
1354
3481 280
12442207
11 110
4481
17436
22110 350
21
4 12
13112
1(D)
13110
22635
10124
2(D)
8182
1(D)
7172
6272
----
2(D)(D)(D)
----
----
----
2(D)(D)(D)
----
----
819 340
4
--
--
--
--
1(D)
1(D)
--
1(D)
--
1(D)
--
1(D)(D)(D)
715
1534 080
----
55
32650
1(D)(D)(D)
3-
19150
2(D)(D)(D)
----
729 200
6
1(D)
313
--
313
7127
2(D)
--
--
--
--
--
1(D)(D)(D)
690
3755 250
1(D)(D)(D)
2(D)(D)(D)
1(D)(D)(D)
2(D)(D)(D)
1(D)(D)(D)
----
---
1(D)
313
1(D)
311
373
1(D)
--
2(D)
1(D)
1(D)
2(D)
----
480
2405 000
1(D)(D)(D)
----
----
1(D)(D)(D)
----
3(D)(D)(D)
3(D)(D)
1(D)
--
--
--
2(D)
2(D)
--
2(D)
--
2(D)
2(D)
----
----
----
1(D)(D)(D)
----
----
1(D)(D)(D)
----
---
--
2(D)
--
2(D)
3104
--
--
2(D)
--
2(D)
1(D)
2(D)(D)(D)
1(D)(D)(D)
----
36035
800
1(D)(D)(D)
350
110400
6439166
4 430
1(D)(D)(D)
34 000
3
1 (D)
327
--
327
482
2(D)
1(D)
1(D)
--
1(D)
1(D)
----
5-
1 28033 000
2(D)(D)(D)
1(D)(D)(D)
----
2(D)(D)(D)
2(D)(D)(D)
----
1(D)(D)
1(D)
2(D)
--
2(D)
2(D)
2(D)
1(D)
--
--
--
--
See footnotes at end of table.

2007 CENSUS OF AGRICULTURE GUAM 21
Table 15. Summary by Size of Farm: 2007 – (Cont.)(For enumeration periods, see appendix A; and for meaning of abbreviations and symbols, see introductory text)
ItemTotal
Less than1 acre
1 to 2 acres
3 to 4 acres
5 to 7 acres
8 to 9 acres
10 to 19 acres
20 acresor more
LIVESTOCK, POULTRY, AND THEIR PRODUCTS, AND FISH – Con.
Inventory-Con.
Roosters and pullets . . . . . . . . . . . . . farms..number..
Fighting roosters . . . . . . . . . . . . . . . . farms..number..
Ducks . . . . . . . . . . . . . . . . . . . . . . . . farms..number..
Pigeons . . . . . . . . . . . . . . . . . . . . . . . farms..number..
Other poultry . . . . . . . . . . . . . . . . . . . farms..number..
Sales
Carabaos . . . . . . . . . . . . . . . . . . . . . farms..number..
All Cattle and calves . . . . . . . . . . . . . farms..number..
Milk cows . . . . . . . . . . . . . . . . . . . . farms..number..
Other cattle and calves . . . . . . . . . farms..number..
Hogs and pigs of all ages . . . . . . . . . farms..number..
Goats and kids of all ages . . . . . . . . farms..number..
Horses, mules, and colts of all ages . farms..number..
Chicken hens 4 months old or older . farms..number..
Commercial layers . . . . . . . . . . . . . farms..number..
Other chicken hens . . . . . . . . . . . . farms..number..
Chickens under 4 months old . . . . . farms..number..
Roosters and pullets . . . . . . . . . . . . . farms..number..
Fighting roosters . . . . . . . . . . . . . . . . farms..number..
Ducks . . . . . . . . . . . . . . . . . . . . . . . . farms..number..
Pigeons . . . . . . . . . . . . . . . . . . . . . . . farms..number..
Other poultry and poultry products (excluding chicken eggs) . . . . . . . farms..
number..
Chicken eggs . . . . . . . . . . . . . . . . . . farms..dozens..
Fish and other aquaculture products . . . . . . . . . . . . . . . . . . . . . farms..
pounds..
679
2(D)
2(D)
1(D)
--
1(D)
919
1(D)
817
20356
411
--
337
--
337
--
1(D)
1(D)
1(D)
--
--
1(D)
3(D)
2(D)
1(D)
--
1(D)
--
--
--
--
--
1(D)
1(D)
--
1(D)
--
1(D)
--
--
--
--
--
--
--
--
--
--
--
--
--
--
1(D)
--
1(D)
796
--
--
--
--
--
--
--
--
--
--
--
--
--
2(D)
--
1(D)
--
--
1(D)
2(D)
1(D)
1(D)
2(D)
--
--
1(D)
--
1(D)
--
1(D)
--
--
--
--
1(D)
--
--
1(D)
1(D)
--
--
--
--
--
--
2(D)
1(D)
--
--
--
--
--
--
1(D)
1(D)
--
--
00
1(D)
1(D)
--
--
--
--
--
2(D)
--
2(D)
351
--
--
1(D)
--
1(D)
--
--
--
--
--
--
00
1(D)
1(D)
--
--
--
--
--
2(D)
--
2(D)
427
1(D)
--
--
--
--
--
--
--
--
--
--
00
00
--
--
--
--
--
--
2(D)
--
2(D)
1(D)
1(D)
--
--
--
--
--
--
--
--
--
--
00
1(D)
Detail may not add to total because of rounding.1
The acres reported for alfalfa and/or bean sprouts do not reflect multiple crops harvested during the census year.2
Includes dry and green corn.3

22 GUAM 2007 CENSUS OF AGRICULTURE
Table 16. Summary by Market Value of Agricultural Products Sold: 2007 (For enumeration periods, see appendix A; and for meaning of abbreviations and symbols, see introductory text)
ItemTotal
Less than$1,200
$1,200 to$2,499
$2,500 to$4,999
$5,000 to$7,499
$7,500 to$9,999
$10,000or more
FARMS AND LAND IN FARMS
Farms . . . . . . . . . . . . . . . . . . . . . . . . . . . . . . . Percent of farms . . . . . . . . . . . . . . . . . . . .
Land in farms . . . . . . . . . . . . . . . . . . acres ..1
Percent distribution . . . . . . . . . . . . . . . . . . Average size of farm . . . . . . . . . . . acres..
LAND USETotal cropland . . . . . . . . . . . . . . . . . . . farms..
acres ..1
Harvested . . . . . . . . . . . . . . . . . . . . farms.. acres.. Other . . . . . . . . . . . . . . . . . . . . . . . . farms..
acres..Pasture or grazing land . . . . . . . . . . . farms.. acres..Woodland . . . . . . . . . . . . . . . . . . . . . . farms..
acres..Other land . . . . . . . . . . . . . . . . . . . . . . farms..
acres..
LAND IRRIGATEDIrrigated land . . . . . . . . . . . . . . . . . . . farms..
acres.. Private system . . . . . . . . . . . . . . . . . farms..
acres.. Public system . . . . . . . . . . . . . . . . . farms..
acres..
FARMS BY MAJOR SOURCE OF IRRIGATION WATERWell or cistern . . . . . . . . . . . . . . . . . . . . . . . .River or stream . . . . . . . . . . . . . . . . . . . . . . . .Lake or private pond . . . . . . . . . . . . . . . . . . . .Canal or irrigation district . . . . . . . . . . . . . . . .Public utility . . . . . . . . . . . . . . . . . . . . . . . . . .Other . . . . . . . . . . . . . . . . . . . . . . . . . . . . . . . .
TENURE OF OPERATOROperators . . . . . . . . . . . . . . . . . . . . . . farms..
acres ..1
Owners . . . . . . . . . . . . . . . . . . . . . . farms..acres..
Full owners . . . . . . . . . . . . . . . . . . farms..acres..
Part owners . . . . . . . . . . . . . . . . . farms..acres..
Tenants . . . . . . . . . . . . . . . . . . . . . . farms..acres..
FARMS BY SIZEFarms . . . . . . . . . . . . . . . . . . . . . . . . . . . . . . Less than 1 acre . . . . . . . . . . . . . . . . . . . . . 1 to 2 acres . . . . . . . . . . . . . . . . . . . . . . . . . 3 to 4 acres . . . . . . . . . . . . . . . . . . . . . . . . . 5 to 7 acres . . . . . . . . . . . . . . . . . . . . . . . . . 8 to 9 acres . . . . . . . . . . . . . . . . . . . . . . . . . 10 to 19 acres . . . . . . . . . . . . . . . . . . . . . . . 20 acres or more . . . . . . . . . . . . . . . . . . . . .
OPERATOR CHARACTERISTICSOperators by place of residence: On farm operated . . . . . . . . . . . . . . . . . . . . Not on farm operated . . . . . . . . . . . . . . . . . .
Operators by years on present farm: Less than 2 years . . . . . . . . . . . . . . . . . . . . 2 to 4 years . . . . . . . . . . . . . . . . . . . . . . . . . 5 to 9 years . . . . . . . . . . . . . . . . . . . . . . . . . 10 years or more . . . . . . . . . . . . . . . . . . . . .
Operators by age group: Under 35 years . . . . . . . . . . . . . . . . . . . . . . 35 to 44 years . . . . . . . . . . . . . . . . . . . . . . . 45 to 54 years . . . . . . . . . . . . . . . . . . . . . . . 55 to 64 years . . . . . . . . . . . . . . . . . . . . . . . 65 years and over . . . . . . . . . . . . . . . . . . . . Average age . . . . . . . . . . . . . . . . . . . . . .
Operators by main occupation: Agricultural . . . . . . . . . . . . . . . . . . . . . . . . . Nonagricultural . . . . . . . . . . . . . . . . . . . . . .
104 100.0
1000 100.0
9.6
97 831
95 498
53 332
10 58
5 51 50 60
96 565
8 62 91
503
- 4 1-
89 2
1041 000
83813 79
741 4
72 21
186
13 27 13 15
4 15 17
48 56
8 4
16 76
3 15 19 32 35 59
80 24
6 5.8
23 2.3 3.9
4 17
3(D)
2(D)
3 21
(D) 6
(D)
4 3--
4 3
----
4-
623 6
23 6
23----
2 2 1--
1-
- 6
- 1 1 4
1 1-
1 3
61
3 3
15 14.4
114 11.4
7.6
13 67 12 30
8 37
4 30
1(D)
8(D)
12 30
2(D) 10(D)
- 1--
10 1
15114 14(D) 14(D)
--
1(D)
- 7 1 1 2 3 1
6 9
3-
3 9
- 4 3 4 4
55
8 7
18 17.3
92 9.2 5.1
16 66 16 34
9 32
3 26
--
4 1
17 64
--
17 64
----
17-
1892
1454
13(D)
1(D)
4 38
2 8 3-
1 4-
9 9
1-
1 16
- 2 2 6 8
61
14 4
14 13.5
55 5.5 3.9
14 54 14 35
8 19
--
1(D)
4(D)
13 33
1(D) 12(D)
--
1-
12-
1455
1141
11 41
--
3 14
2 2 5 4-
1-
6 8
--
4 10
--
3 5 6
64
12 2
6 5.8
54 5.4 9.0
6 53
6 23
5 30
--
1(D)
2(D)
6 26
1(D)
5(D)
- 1--
5-
654 5
(D) 5
(D)--
1(D)
--
1 2-
3-
4 2
---
6
- 1-
3 2
62
6-
45 43.3
661 66.1 14.7
44 575
44(D) 21(D)
--
1(D) 26 52
44 408
4 55 43
353
- 2--
41 1
45661 33
545 30(D)
3(D) 12
117
7 8 2 8 1 3
16
23 22
4 3 7
31
2 7
11 13 12 57
37 8
See footnotes at end of table.

2007 CENSUS OF AGRICULTURE GUAM 23
Table 16. Summary by Market Value of Agricultural Products Sold: 2007 – (Cont.)(For enumeration periods, see appendix A; and for meaning of abbreviations and symbols, see introductory text)
ItemTotal
Less than$1,200
$1,200 to$2,499
$2,500 to$4,999
$5,000 to$7,499
$7,500 to$9,999
$10,000or more
OPERATOR CHARACTERISTICS – Con.Operators by days of work off farm: None . . . . . . . . . . . . . . . . . . . . . . . . . . . . . Any . . . . . . . . . . . . . . . . . . . . . . . . . . . . . . 1 to 49 days . . . . . . . . . . . . . . . . . . . . . . 50 to 99 days . . . . . . . . . . . . . . . . . . . . . 100 to 149 days . . . . . . . . . . . . . . . . . . . 150 to 199 days . . . . . . . . . . . . . . . . . . . 200 days or more . . . . . . . . . . . . . . . . . .
Operators by race: Chamorro . . . . . . . . . . . . . . . . . . . . . . . . . . Chinese . . . . . . . . . . . . . . . . . . . . . . . . . . . Filipino . . . . . . . . . . . . . . . . . . . . . . . . . . . . Japanese . . . . . . . . . . . . . . . . . . . . . . . . . . White . . . . . . . . . . . . . . . . . . . . . . . . . . . . . Other . . . . . . . . . . . . . . . . . . . . . . . . . . . . . Operators by sex: Male . . . . . . . . . . . . . . . . . . . . . . . . . . . . . . Female . . . . . . . . . . . . . . . . . . . . . . . . . . . .
LABOR STATUSFarms . . . . . . . . . . . . . . . . . . . . . . . number..
workers.. Unpaid labor . . . . . . . . . . . . . . . . . farms..
workers.. Less than 25 days . . . . . . . . . . . farms..
workers.. 25 to 149 days . . . . . . . . . . . . . . farms..
workers.. 150 days or more . . . . . . . . . . . . farms..
workers..
Paid labor . . . . . . . . . . . . . . . . . . . .farms..workers..
Less than 25 days . . . . . . . . . . . farms..workers..
25 to 149 days . . . . . . . . . . . . . . farms..workers..
150 days or more . . . . . . . . . . . . farms..workers..
SELECTED EQUIPMENTTractors (all kinds) . . . . . . . . . . . . . . farms..
number..Motortrucks . . . . . . . . . . . . . . . . . . . . farms..
number..Automobiles . . . . . . . . . . . . . . . . . . . farms..
number..Tillers (all kinds) . . . . . . . . . . . . . . . . farms..
number..
MARKET VALUE OF AGRICULTURAL PRODUCTS SOLDTotal sales . . . . . . . . . . . . . . . . . . . . farms..
dollars.. Average per farm . . . . . . . . . . . dollars.. Farms by value of sales: Less than $1,200 . . . . . . . . . . . . farms.. dollars.. $1,200 to $2,499 . . . . . . . . . . . . . farms..
dollars.. $2,500 to $4,999 . . . . . . . . . . . . . farms..
dollars.. $5,000 to $7,499 . . . . . . . . . . . . . farms..
dollars.. $7,500 to $9,999 . . . . . . . . . . . . . farms..
dollars.. $10,000 or more . . . . . . . . . . . . . farms..
dollars..
SALES BY COMMODITY GROUP OR PRODUCT:Root crops . . . . . . . . . . . . . . . . . . . . farms..
dollars..Vegetables and melons . . . . . . . . . . farms..
dollars..Fruits and nuts . . . . . . . . . . . . . . . . . farms..
dollars..Nursery crops (including ornamental plants) . . . . . . . . . . . . . . . . . . . . . . farms..
dollars..Livestock . . . . . . . . . . . . . . . . . . . . . . farms..
dollars..Poultry and poultry products . . . . . . . farms..
dollars..Fish and other aquaculture products farms..
dollars..
74 30 2 4 6 6
12
77 3
16 1 3 4
91 13
104 368 91
232 1
(D) 18
(D) 82
181
49 136
6 11
8 23 39
102
44 84 96
143 48 61 58 97
1042 796 173
26 886
66 400
1527 080
1867 185
1487 476
651 378
452 556 654
1746 701
561 497 580
53287 074
22604 868
2552 900
6(D)
3(D)
2 4--
1-
3
5-
1---
5 1
6 19
6 14
--
3 7 4 7
3 5 2
(D)--
1(D)
--
3 3 3 4--
66 4001 067
66 400
----------
----2
(D)
1(D)
5(D)
2(D)
--
7 8-
2 1 3 2
13-
2---
15-
15 32 15 30
--
3 7
14 23
1(D)
1(D)
----
3(D) 13 15
7 9
10 12
1527 080
1 805
--
1527 080
--------
--5
7 0009
(D)
1(D)
89 550
----
15 3 2-
1--
14-
2-
1 1
16 2
18 56 17 47
--
3 10 16 37
5 9--
2(D)
3(D)
8 13 17 22
8 11 11 14
1867 185
3 733
----
1867 185
------
5(D)
824 465
915 755
32 380
615 950
1(D)
--
11 3-
1-
1 1
9 1 4---
12 2
14 33 14 27
--
3 5
12 22
5 6 1
(D) 1
(D) 3
(D)
7 9
13 15
6 6 8
14
1487 476
6 248
------
1487 476
----
2(D)
942 870
1028 266
37 500
1(D)
2(D)
1(D)
6------
5----
1
6-
6 18
6 17
----
6 17
1(D)
----
1(D)
2(D)
5 6 5 5 3 3
651 378
8 563
--------6
51 378--
3(D)
310 580
520 280
1(D)
------
33 12
- 1 3 2 6
31 2 7 1 2 2
37 8
45 210
33 97
1(D)
6 (D) 30 75
34 113
2(D)
5(D) 31 90
24 57 45 82 19 26 26 54
452 556 654
56 815
----------
452 556 654
718 746
311 412 665
18213 643
13589 000
517 900
1(D)
2(D)
See footnotes at end of table.

24 GUAM 2007 CENSUS OF AGRICULTURE
Table 16. Summary by Market Value of Agricultural Products Sold: 2007 – (Cont.)(For enumeration periods, see appendix A; and for meaning of abbreviations and symbols, see introductory text)
ItemTotal
Less than$1,200
$1,200 to$2,499
$2,500 to$4,999
$5,000 to$7,499
$7,500 to$9,999
$10,000or more
SELECTED FARM PRODUCTION EXPENSES
Machine hire and customwork . . . . . . . . farms..dollars..
Hired farm labor . . . . . . . . . . . . . . . . . . . farms..dollars..
Feed purchased for livestock, poultry, and fish . . . . . . . . . . . . . . . . . . farms..
dollars..Insecticides, fungicides, and herbicides . farms..
dollars..Fertilizers and manure purchased . . . . . farms..
dollars..Livestock, poultry, and fish purchased . . farms..
dollars..Seed cost - including seedlings . . . . . . . farms..
dollars..ROOT CROPS HARVESTED FOR SALE
Cassava (tapioca) . . . . . . . . . . . . . . . . . . farms..acres..
pounds harvested..
Gado . . . . . . . . . . . . . . . . . . . . . . . . . . . . farms..acres..
pounds harvested..
Sweetpotatoes . . . . . . . . . . . . . . . . . . . . farms..acres..
pounds harvested..
Taro . . . . . . . . . . . . . . . . . . . . . . . . . . . . farms..acres..
pounds harvested..
Yams . . . . . . . . . . . . . . . . . . . . . . . . . . . . farms..acres..
pounds harvested..
Ginger . . . . . . . . . . . . . . . . . . . . . . . . . . . farms..acres..
pounds harvested..
Other root crops . . . . . . . . . . . . . . . . . . . farms..acres..
pounds harvested..VEGETABLES AND MELONS HARVESTED FOR SALE
Alfalfa and/or bean sprouts . . . . . . . . . .2 farms..pounds harvested..
Beans, yard long . . . . . . . . . . . . . . . . . . . farms..acres..
pounds harvested..
Beans, all other . . . . . . . . . . . . . . . . . . . farms..acres..
pounds harvested..
Bittermelons . . . . . . . . . . . . . . . . . . . . . . farms..acres..
pounds harvested..
Cabbage, Chinese . . . . . . . . . . . . . . . . . farms..acres..
pounds harvested..
Cabbage, head . . . . . . . . . . . . . . . . . . . . farms..acres..
pounds harvested..
Cantaloups . . . . . . . . . . . . . . . . . . . . . . . farms..acres..
pounds harvested..
Corn . . . . . . . . . . . . . . . . . . . . . . . . . . . .3 farms..acres..
pounds harvested..
Cucumbers . . . . . . . . . . . . . . . . . . . . . . . farms..acres..
pounds harvested..
Eggplant . . . . . . . . . . . . . . . . . . . . . . . . . farms..acres..
pounds harvested..
3266 140
49548 760
23128 562
6794 024
79196 070
320 620
5856 786
75
7 750
31
4 100
1(D)(D)
89
18 800
106
13 000
97
23 000
2(D)(D)
2(D)
2543
126 203
112
9 020
1727
73 950
53
4 930
1(D)(D)
512
66 000
421
123 250
2292
1 354 320
4443
164 959
1(D)
34 800
32 420
1(D)
1(D)
1(D)
--
---
---
---
---
---
---
---
--
---
---
---
---
---
---
---
---
---
67 250
1(D)
66 360
71 770
9(D)
--5
1 080
---
---
---
---
---
---
---
--
---
---
---
---
1(D)(D)
1(D)(D)
---
1(D)(D)
3(D)(D)
514 340
418 860
56 334
113 790
128 880
--8
1 244
32
3 300
---
---
2(D)(D)
43
4 250
2(D)(D)
---
--
3(D)(D)
41
4 570
1(D)(D)
1(D)(D)
---
---
---
2(D)(D)
83
8 350
2(D)
42 800
33 744
102 718
148 772
1(D)11
3 439
1(D)(D)
1(D)(D)
---
2(D)(D)
1(D)(D)
31
1 900
---
--
32
7 035
2(D)(D)
2(D)(D)
---
---
---
2(D)(D)
2(D)(D)
53
4 795
2(D)
2(D)
--2
(D)3
(D)--4
1 536
1(D)(D)
1(D)(D)
---
1(D)(D)
1(D)(D)
2(D)(D)
1(D)(D)
1(D)
1(D)(D)
1(D)(D)
---
---
---
---
---
---
2(D)(D)
16(D)35
519 000
6109 704
3684 547
40171 378
1(D)30
49 487
2(D)(D)
1(D)(D)
1(D)(D)
35
13 000
4(D)(D)
2(D)(D)
1(D)(D)
1(D)
1839
114 968
41
3 700
1427
72 850
4(D)(D)
---
4(D)(D)
2(D)(D)
1790
1 344 020
2633
144 214
See footnotes at end of table.

2007 CENSUS OF AGRICULTURE GUAM 25
Table 16. Summary by Market Value of Agricultural Products Sold: 2007 – (Cont.)(For enumeration periods, see appendix A; and for meaning of abbreviations and symbols, see introductory text)
ItemTotal
Less than$1,200
$1,200 to$2,499
$2,500 to$4,999
$5,000 to$7,499
$7,500 to$9,999
$10,000or more
VEGETABLES AND MELONSHARVESTED FOR SALE – Con.
Muskmelons and pepinos . . . . . . . . . farms..acres..
pounds harvested..
Okra . . . . . . . . . . . . . . . . . . . . . . . . . farms..acres..
pounds harvested..
Onions, green . . . . . . . . . . . . . . . . . . farms..acres..
pounds harvested..
Peppers, hot . . . . . . . . . . . . . . . . . . . farms..acres..
pounds harvested..
Peppers, sweet . . . . . . . . . . . . . . . . . farms..acres..
pounds harvested..
Pumpkins and squash . . . . . . . . . . . farms..acres..
pounds harvested..
Radishes . . . . . . . . . . . . . . . . . . . . . . farms..acres..
pounds harvested..
Tomatoes . . . . . . . . . . . . . . . . . . . . . farms..acres..
pounds harvested..
Watermelons . . . . . . . . . . . . . . . . . . farms..acres..
pounds harvested..
Other vegetables and melons . . . . . . farms..acres..
pounds harvested..
FRUITS, NUTS, AND NURSERY CROPS (including ornamental plants) HARVESTED FOR SALE
Land in bearing and nonbearing fruit trees and plants . . . . . . . . . . . . . . . farms..
acres..
Avocados . . . . . . . . . . . . . . . . . . . . . farms..trees not of bearing age..
trees of bearing age..pounds harvested..
Bananas (all types) . . . . . . . . . . . . . . farms..trees not of bearing age..
trees of bearing age..pounds harvested..
Betelnuts . . . . . . . . . . . . . . . . . . . . . . farms..trees not of bearing age..
trees of bearing age..pounds harvested..
Breadfruits . . . . . . . . . . . . . . . . . . . . farms..trees not of bearing age..
trees of bearing age..pounds harvested..
Coconuts . . . . . . . . . . . . . . . . . . . . . farms..trees not of bearing age..
trees of bearing age..pounds harvested..
Grapefruit . . . . . . . . . . . . . . . . . . . . . farms..trees not of bearing age..
trees of bearing age..pounds harvested..
Guavas . . . . . . . . . . . . . . . . . . . . . . . farms..trees not of bearing age..
trees of bearing age..pounds harvested..
Lemons and limes . . . . . . . . . . . . . . . farms..trees not of bearing age..
trees of bearing age..pounds harvested..
Mangos . . . . . . . . . . . . . . . . . . . . . . . farms..trees not of bearing age..
trees of bearing age..pounds harvested..
1(D)(D)
1915
36 229
93
5 210
289
27 858
411
13 220
1014
45 350
93
12 340
2719
86 425
788
772 000
102
9 525
57145
1694
1687 770
315 526
13 673238 246
16774
2 7714 100
1461
2589 650
171 1721 323
20 200
42
354 200
7120153
7 390
21768384
9 760
15247103
18 150
---
---
---
---
---
---
---
---
---
---
2 (D)
----
1(D)(D)(D)
1(D)(D)(D)
----
1(D)(D)(D)
----
----
----
----
---
31
3 050
---
1(D)(D)
1(D)(D)
---
---
---
---
---
925
----
5400395
5 000
459
1721 000
2(D)(D)(D)
3510455
3 500
----
2(D)(D)(D)
3360
31850
3153
11700
---
42
3 305
2(D)(D)
31
1 900
---
1(D)(D)
2(D)(D)
3 (D) (D)
---
1(D)(D)
916
4(D)(D)(D)
5600662
7 060
4151
2 1701 600
320
2123 200
2(D)(D)(D)
----
1(D)(D)(D)
3302
60500
2(D)(D)(D)
---
3(D)(D)
---
41
2 071
1(D)(D)
---
---
41
3 583
1(D)(D)
2(D)(D)
1124
44018
1 050
7900
1 55020 696
2(D)(D)(D)
1(D)(D)(D)
43594
700
----
1(D)(D)(D)
44177
760
34917
4 000
---
1(D)(D)
---
2(D)(D)
---
---
1(D)(D)
2(D)(D)
---
1(D)(D)
5 (D)
2(D)(D)(D)
3(D)(D)(D)
2(D)(D)(D)
1(D)(D)(D)
2(D)(D)(D)
2(D)(D)(D)
1(D)(D)(D)
31570
1 600
2(D)(D)(D)
1(D)(D)
88
27 076
7(D)(D)
186
23 237
2(D)(D)
9(D)(D)
62
11 340
1817
80 592
6(D)(D)
61
6 975
2165
69
283 500
103 596
10 327195 840
3380
59600
71837
6 050
5152314
13 800
2(D)(D)(D)
2(D)(D)(D)
850
1466 050
51065
13 350
See footnotes at end of table.

26 GUAM 2007 CENSUS OF AGRICULTURE
Table 16. Summary by Market Value of Agricultural Products Sold: 2007 – (Cont.)(For enumeration periods, see appendix A; and for meaning of abbreviations and symbols, see introductory text)
ItemTotal
Less than$1,200
$1,200 to$2,499
$2,500 to$4,999
$5,000 to$7,499
$7,500 to$9,999
$10,000or more
FRUITS, NUTS, AND NURSERY CROPS (including ornamental plants) HARVESTED FOR SALE – Con.
Oranges . . . . . . . . . . . . . . . . . . . . . . farms..trees not of bearing age..
trees of bearing age..pounds harvested..
Papayas . . . . . . . . . . . . . . . . . . . . . . farms..trees not of bearing age..
trees of bearing age..pounds harvested..
Pineapples . . . . . . . . . . . . . . . . . . . . farms..plants not of bearing age..
plants of bearing age..pounds harvested..
Soursops . . . . . . . . . . . . . . . . . . . . . farms..trees not of bearing age..
trees of bearing age..pounds harvested..
Starfruits . . . . . . . . . . . . . . . . . . . . . . farms..trees not of bearing age..
trees of bearing age..pounds harvested..
Sweetsops . . . . . . . . . . . . . . . . . . . . farms..trees not of bearing age..
trees of bearing age..pounds harvested..
Tangerines . . . . . . . . . . . . . . . . . . . . farms..trees not of bearing age..
trees of bearing age..pounds harvested..
Other fruits, nuts, and tree crops . . . farms..plants or trees not of bearing ag..
plants or trees of bearing age..pounds harvested..
Nursery crops (including ornamental plants) . . . . . . . . . . . . . . . . . . . . . . farms..
sq. ft. under cover..acres in the open..
LIVESTOCK, POULTRY, AND THEIR PRODUCTS, AND FISH
Inventory
Carabaos . . . . . . . . . . . . . . . . . . . . . farms..number..
All Cattle and calves . . . . . . . . . . . . . farms..number..
Milk cows . . . . . . . . . . . . . . . . . . . . farms..number..
Other cattle and calves . . . . . . . . . farms..number..
Hogs and pigs of all ages . . . . . . . . . farms..number..
Goats and kids of all ages . . . . . . . . farms..number..
Horses, mules, and colts of all ages . farms..number..
Chicken hens 4 months old or older . farms..number..
Commercial layers . . . . . . . . . . . . . farms..number..
Other chicken hens . . . . . . . . . . . . farms..number..
Chickens under 4 months old . . . . . . farms..number..
447
4130
25205
2 15351 330
4600
6 60017 570
1268
1011850
3-5
275
1354
3481280
12442207
11110
4481
17436
22110 350
21
4 12
13112
1(D)
13110
22635
10124
2(D)
8182
1(D)
7172
6272
----
1(D)(D)(D)
----
1(D)(D)(D)
----
1(D)(D)(D)
----
----
1(D)(D)
--
2(D)
--
2(D)
582
1(D)
--
2(D)
--
2(D)
1(D)
----
1(D)(D)(D)
----
1(D)(D)(D)
----
----
2(D)(D)(D)
----
1(D)(D)
--
2(D)
--
2(D)
7318
369
--
1(D)
--
1(D)
1(D)
1(D)(D)(D)
36070
2 200
----
443
4100
----
454
102330
3405
403 080
1(D)(D)(D)
3200
1
2(D)
430
1(D)
428
594
322
1(D)
1(D)
--
1(D)
1(D)
----
785
2575 580
2(D)(D)(D)
1(D)(D)(D)
----
2(D)(D)(D)
2(D)(D)(D)
2(D)(D)(D)
3800(Z)
--
1(D)
--
1(D)
1(D)
2(D)
--
2(D)
1(D)
1(D)
2(D)
2(D)(D)(D)
1(D)(D)(D)
----
2(D)(D)(D)
1(D)(D)(D)
1(D)(D)(D)
2(D)(D)(D)
----
1(D)(D)
--
--
--
--
00
00
--
--
--
--
--
1(D)(D)(D)
1260
1 61140 750
2(D)(D)(D)
3-
38450
2(D)(D)(D)
5-
185550
33
216 000
1(D)(D)(D)
13103 350
17
2(D)
453
--
453
4(D)
1(D)
1(D)
2(D)
--
2(D)
1(D)
See footnotes at end of table.
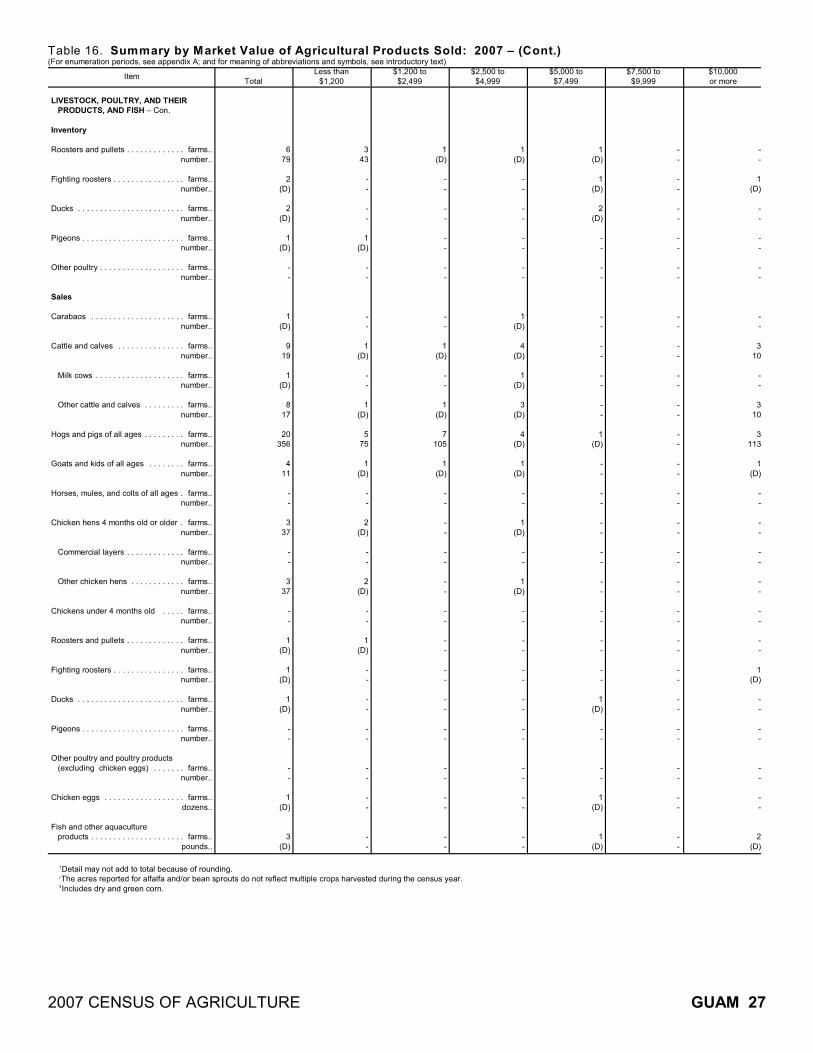
2007 CENSUS OF AGRICULTURE GUAM 27
Table 16. Summary by Market Value of Agricultural Products Sold: 2007 – (Cont.)(For enumeration periods, see appendix A; and for meaning of abbreviations and symbols, see introductory text)
ItemTotal
Less than$1,200
$1,200 to$2,499
$2,500 to$4,999
$5,000 to$7,499
$7,500 to$9,999
$10,000or more
LIVESTOCK, POULTRY, AND THEIR PRODUCTS, AND FISH – Con.
Inventory
Roosters and pullets . . . . . . . . . . . . . farms..number..
Fighting roosters . . . . . . . . . . . . . . . . farms..number..
Ducks . . . . . . . . . . . . . . . . . . . . . . . . farms..number..
Pigeons . . . . . . . . . . . . . . . . . . . . . . . farms..number..
Other poultry . . . . . . . . . . . . . . . . . . . farms..number..
Sales
Carabaos . . . . . . . . . . . . . . . . . . . . . farms..number..
Cattle and calves . . . . . . . . . . . . . . . farms..number..
Milk cows . . . . . . . . . . . . . . . . . . . . farms..number..
Other cattle and calves . . . . . . . . . farms..number..
Hogs and pigs of all ages . . . . . . . . . farms..number..
Goats and kids of all ages . . . . . . . . farms..number..
Horses, mules, and colts of all ages . farms..number..
Chicken hens 4 months old or older . farms..number..
Commercial layers . . . . . . . . . . . . . farms..number..
Other chicken hens . . . . . . . . . . . . farms..number..
Chickens under 4 months old . . . . . farms..number..
Roosters and pullets . . . . . . . . . . . . . farms..number..
Fighting roosters . . . . . . . . . . . . . . . . farms..number..
Ducks . . . . . . . . . . . . . . . . . . . . . . . . farms..number..
Pigeons . . . . . . . . . . . . . . . . . . . . . . . farms..number..
Other poultry and poultry products (excluding chicken eggs) . . . . . . . farms..
number..
Chicken eggs . . . . . . . . . . . . . . . . . . farms..dozens..
Fish and other aquaculture products . . . . . . . . . . . . . . . . . . . . . farms..
pounds..
679
2(D)
2(D)
1(D)
--
1(D)
919
1(D)
817
20356
411
--
337
--
337
--
1(D)
1(D)
1(D)
--
--
1(D)
3(D)
343
--
--
1(D)
--
--
1(D)
--
1(D)
575
1(D)
--
2(D)
--
2(D)
--
1(D)
--
--
--
--
--
--
1(D)
--
--
--
--
--
1(D)
--
1(D)
7105
1(D)
--
--
--
--
--
--
--
--
--
--
--
--
1(D)
--
--
--
--
1(D)
4(D)
1(D)
3(D)
4(D)
1(D)
--
1(D)
--
1(D)
--
--
--
--
--
--
--
--
1(D)
1(D)
2(D)
--
--
--
--
--
--
1(D)
--
--
--
--
--
--
--
--
1(D)
--
--
1(D)
1(D)
--
--
--
--
--
--
--
--
--
--
--
--
--
--
--
--
--
--
--
--
--
--
--
--
1(D)
--
--
--
--
310
--
310
3113
1(D)
--
--
--
--
--
--
1(D)
--
--
--
--
2(D)
Detail may not add to total because of rounding.1
The acres reported for alfalfa and/or bean sprouts do not reflect multiple crops harvested during the census year.2
Includes dry and green corn.3


2007 CENSUS OF AGRICULTURE APPENDIX A A-1
APPENDIX A. General Explanation
DATA COLLECTION
Method of Enumeration
As in the previous censuses of Guam, a direct enumeration procedure was used in the 2007 Census of Agriculture,
and as in the 2002 Census of Agriculture, enumeration was based on a list of farm operators compiled by the Guam
Department of Agriculture. The statistics in this report were collected from farm operators during the spring of 2008.
Each enumerator is an employee of the Department of Agriculture who has responsibility for specified enumeration
districts. The enumerators contacted all persons or operations engaged in agriculture in their assigned area and
completed a census report form for all farm operations that met the farm definition. If the person on the list was not
operating a farm, the enumerator recorded whether the land had been sold or rented to someone else and was still being
used for agriculture. If the land was sold or rented out, the enumerator got the name of the new operator and contacted
that person, to ensure that he/she was included in the census.
Training Program
The project manager, crew leaders, and enumerators employed for the census in Guam received special training in
accordance with instructions prepared by NASS. The training included practice in interviewing and filling out the report
form and a detailed discussion of the enumerator's instructions.
Report Form
Prior to each agriculture census, the content of all census report forms is reviewed to eliminate inquiries no longer
needed, to identify new items necessary to meet user needs, and to better describe the agricultural situation in Guam.
Data requests are solicited from farm organizations, land-grant colleges and universities, State and Federal agencies,
State Departments of Agriculture, agribusinesses, and other users. Each respondent is asked to identify and justify its
specific data needs.
The report form for the 2007 Census of Agriculture for Guam was prepared by NASS, in cooperation with the Guam
Department of Agriculture. Based on comments from the Guam Department of Agriculture (which coordinated review of
the report form by data users in Guam), the content of the 2007 census report form remained almost unchanged from the
previous census.
DATA PROCESSING
The processing of the 2007 Census of Agriculture for Guam was done by NASS. Each report form was reviewed and
coded prior to data keying. Report forms not meeting the census farm definition were voided. The remaining report forms
were examined for accuracy, consistency, and completeness. Reporting errors in computations, units of measures, data
inconsistencies, and misplaced entries were corrected. Missing information was derived using reported data for similar
type and size farms in nearby areas.
After all the report forms had been reviewed and coded, the data were keyed and subjected to a thorough computer
edit. The edit performed comprehensive checks for consistency and reasonableness, corrected erroneous or inconsistent
data, supplied missing data based on similar farms, and assigned farm classification codes necessary for tabulating the
data. All substantial changes to the data generated by the computer edits were reviewed and verified by analysts.
Inconsistencies were reviewed, corrected, and keyed to a correction file. The corrected data were then tabulated by the
computer and reviewed by analysts.

A-2 APPENDIX A 2007 CENSUS OF AGRICULTURE
Prior to publication, tabulated totals were reviewed by analysts to identify inconsistencies and potential coverage
problems. Comparisons were made with previous census data, as well as other available data. The computer system
provided the capability to review up-to-date tallies of all selected data items for various sets of criteria which included, but
were not limited to, geographic levels, farm types, and sales levels. Data were examined for each set of criteria and a
write-up (criticism) was produced for data that were inconsistent. Each criticism was then researched by examining
individual data records contributing to the tabulated total. W hen necessary, data inconsistencies were resolved by carrying
corrections to data records.
DEFINITIONS AND EXPLANATION
The following definitions and explanations relate to items that are in the tables. For an exact wording of the questions
and instructions on the report form, see the report form in appendix B.
Crops. The report form contained individual inquiries for crops commonly grown and space to write in those less
frequently produced. The information requested for 2007 included acres of crops harvested and pounds harvested for
sale.
The units of measure for reporting quantities of some crops have varied from one census to another. The aim has been
to permit reporting in the units of measure currently in use. The quantities harvested for each crop are expressed in the
units of measure given on the 2007 report form.
Root crops. The land area from which individual root crops were harvested for sale was obtained in acres and tenths
of acres. W hen two or more crops were harvested from the same land, the area was to be reported for each separate
crop or planting. Total quantities of each crop harvested for sale were also reported.
Vegetables and melons. Land area for individual crops and the quantity harvested for sale for each crop were
collected.
Fruits, nuts, and nursery crops. The total number of acres planted in bearing and nonbearing fruit and nut trees and
plants was collected. For individual fruit or nut crops, data on the number of bearing and nonbearing trees and plants,
and the quantity harvested for sale, were reported. For nursery crops, the land area harvested, both square feet under
cover and acres in the open, was collected, along with the value of sales.
Equipment. The following types of equipment on the place at time of enumeration regardless of ownership, were reported
if they were operable:
Automobiles. This includes all vehicles used primarily as passenger cars.
Motortrucks. This includes pickup trucks and truck- trailer combinations.
Tillers of all kinds. This includes all types of tillers used to prepare soil for planting.
Tractors. This includes all wheel and tracklaying (crawler) tractors and garden tractors.
Expenses. The 2007 report form contained questions on seven types of farm expenses incurred between January 1 and
December 31, 2007, whether made by the farm operator, his/her landlord, or both. A farm operator who rented part of
his/her land to others reported only the expenses on the land he/she operated.
Feed purchased for livestock, poultry, and fish. Expenses for feed for livestock, poultry, and fish include total cash
payments made for pasture used, salt concentrates, mineral supplements, grain, hay, mill feeds, and any other items
purchased for feeding livestock, poultry, and fish on the place. Expenses made for the grinding and mixing of feed and
the estimated cost of items furnished to the operator by a landlord or others are also included. Payments made by a
tenant to a landlord for feed grown on the tenant's farm are excluded.
Machine hire and customwork. Expenses for machine hire and customwork relate to tractor hire, plowing, and
spraying. Any amount spent for the labor involved is considered to be part of the expense. The costs of hauling,
trucking, or exchange work without pay are omitted.

2007 CENSUS OF AGRICULTURE APPENDIX A A-3
Purchases of fertilizers and manure. These expenses include the total amount spent for manure and commercial
fertilizers of all kinds for use on the farm.
Purchases of insecticides, fungicides, and herbicides. This item relates to total cash expenses for all chemicals,
sprays, dusts, etc., used to control weeds, pests, insects, or disease on crops.
Purchases of livestock, poultry, and fish. This item includes all cash expenses for livestock, poultry, and fish
purchased for the place. The cost of livestock and poultry bought and resold within 30 days is not included.
Seed cost. These expenses include all seed purchased for planting, as well as seedlings.
Wages and salaries paid to employees or hired farm workers. Expenses for hired farm labor include total cash
payments made to family members and others for farm labor. Payments to persons supplied by a contractor or a
cooperative organization and paid directly by them or by the person in charge are also included.
Farm operator. The term "operator" designates a person who operates a farm, either by doing the work himself/herself or
by directly supervising the work. The operator may be the owner, a member of the owner's household, a hired manager,
or a tenant, renter, or sharecropper. If the operator rents land to others or has land worked on shares by others, he/she is
considered the operator only if the land is retained for his/her own operation. In the case of partnership, only one partner
is counted as an operator. By definition, the number of operators is the same as the number of farms.
Farms or operators reporting. Figures for "farms reporting" or "operators reporting" represent the number of farms or
operators reporting the specified item. The difference between the total number of farms and the number of farms
reporting a particular item represents the number of farms not having that item.
Land in farms. The land in farms was determined from the answers to questions 1 through 4 in section 1 of the report
form (see appendix B). The amounts of land reported as owned and reported as rented from others were added together,
and the amount of land reported as rented to others was subtracted from that sum. The result represents "land in farms."
Land owned. This includes all land that the operator or his/her spouse held under title, purchased contract, homestead
law, or as heir or trustee of an undivided estate at the time of enumeration.
Land rented from others. This includes not only land the operator rented or leased from others, but also land worked on
shares for others or land occupied rent free.
Land rented to others. This includes all land that the operator rented to others and all land assigned to others on shares
or rent free. For the most part, land rented to others represents agricultural land, but it also includes land rented for
residential or other purposes. The tenant is considered to be the operator of land leased, rented, or worked on shares,
even though his/her landlord may supervise the operations. The landlord is considered to be the operator of only that
portion of the land not assigned to tenants.
Land use. Land in farms at the time of enumeration is categorized according to the way it was used between January 1
and December 31, 2007. The land is counted only once, even though it may have had more than one use during the year.
Cropland harvested. This refers to all land from which any crop was harvested. It also includes land in field crops that
were grazed when mature or almost mature, and land in nonbearing fruit or nut trees and plants. Land from which two
or more crops were harvested and which was also used for other purposes, either before or after the crops were
harvested, was to be reported as cropland harvested without regard to the other uses.
Other cropland. This includes all cropland on the place that was used for pasture, and cropland on the place that was
not used for crops or pasture. It includes land on which there was total crop failure due to hurricane, flood, drought,
insects, fire, or other causes; cropland lying idle; and cropland planted with soil improvement grasses or other cover
crops planted for improvement. It does not include land so hilly, rocky, or wet that the cost of improving it for
cultivation would be more than the operator could pay. It does not include land in roads, streams, or swamps.
Pasture or grazing land. This refers to all land used for pasture or grazing, except cropland. It includes all woodland
where livestock pastured or grazed. It does not include cropland, even though cattle or other livestock may have been
grazed on it.

A-4 APPENDIX A 2007 CENSUS OF AGRICULTURE
Woodland. This includes all land that is covered in woods or forests. It does not include woodland pasture.
Other land. This refers to all land not included in the other land use classifications, such as house and other building
lots, lanes, roads, ditches, and land area of ponds and wasteland.
Livestock and poultry. Inventory data for livestock and poultry relate to the number on hand at the time of enumeration.
All livestock and poultry were to be enumerated on the place where they were at the time of enumeration regardless of
who owned them. Livestock on unfenced land were to be reported as being on the place identified as the headquarters of
the person who had control over them.
Operator characteristics. Data were obtained to classify the operators according to the following seven characteristics:
Age of operator. Operators were classified by age into six groups. The average age was obtained by dividing the sum
of the ages of all operators reporting by the number reporting.
Main occupation. If the operator devoted 50 percent or more of his/her work time to agricultural activities, his/her main
occupation was considered to be agriculture, otherwise his/her occupation was considered to be nonagricultural.
Race of operator. The race, or national origin, of the operator was collected for the first time in 1993. Respondents
were asked to choose between Chamorro, Chinese, Filipino, Japanese, W hite, or Other to describe their race or
national origin.
Residence of operator. Operators were classified by residence according to whether or not they lived on the farms
operated. W here all the land was rented from others or worked on shares for others, the dwelling was considered to
be on the farm operated provided the dwelling he/she occupied was included in the rental agreement. In such cases,
the dwelling was not necessarily on the land being operated. Similarly, an operator who did not live on the land being
cultivated or grazed, but who had some agricultural operations (other than a home garden) at his/her dwelling, was
considered to be living on the farm.
Sex of operator. Operators are classified as male or female.
Work off farm. The extent to which operators rely on nonfarm sources for part of their income is indicated by the
number of days worked off the farm during the year. W ork off the farm was defined to include work on someone else's
farm for pay as well as all types of nonfarm jobs, businesses, and professions whether the work was done on the farm
premises or elsewhere. Exchange work was not included.
Years on present farm. Operators were classified by years on present farm into four groups. These data were based
on the question asking the year the operator began operation of the present farm or any part of it.
Value of products sold. Data for value of products sold were obtained for each group of crops or main type of livestock
sold from the farm. Data were obtained for sales of field and forage crops, vegetables, fruits and nuts, nursery crops,
poultry and poultry products, cattle and calves, hogs and pigs, fish and other aquaculture products, other livestock and
livestock products and chicken eggs.
Farms by age of operator. Enumerators entered the operator's age, as of his/her last birthday, on the report form. The
computer edit classified the operator's age into one of the following age groups:
Under 35 years 45 to 54 years 65 years and over
35 to 44 years 55 to 64 years
Farms by size. All farms were classified by size on the basis of the total land area established in each farm. According to
the census definition, a farm is essentially an operating unit, not an ownership tract. All land operated or managed by one
person or partnership represents one farm. In the case of tenants, the land assigned to each tenant is considered a
separate farm, even though the landlord may consider the entire landholding to be one unit rather than several separate
units.

2007 CENSUS OF AGRICULTURE APPENDIX A A-5
Farms by tenure of operator. In the 2007 census, all farms were classified by tenure of operator on the basis of data
reported for land owned, rented from others, worked on shares for others, and managed for others. The same
classification has been used since 1964. During processing operations, each report form was coded to indicate whether
the operator was a full owner, part owner, or tenant.
Full owners. Operate only land they own
Part owners. Operate land they own and also land they rent from others
Tenants. Rent from others or work the land they operate on shares for others
Farms by value of agricultural products sold. All farms were classified on the basis of the total value of agricultural
products sold. The total was obtained by adding the reported values of all products sold from the farm. The value of
livestock, milk, poultry and eggs, fish, vegetables, fruits and nuts, all field crops, ornamental plants, and all other crops was
obtained from the operator at the time of enumeration. The computer edit classified the value of agricultural products sold
into one of the following groups:
Less than $1,200 $2,500 to $4,999 $7,500 to $9,999
$1,200 to $2,499 $5,000 to $7,499 $10,000 or more
RELIABILITY OF DATA
All data compiled in this report originated from a complete enumeration and, therefore, are not subject to sampling
variability. However, the data are subject to nonsampling errors. Nonsampling errors can be attributed to many sources:
inability to identify all cases in the actual universe; inability or unwillingness on the part of respondents to provide correct
information; definition and classification difficulties; differences in the interpretation of questions; errors in recording or
coding the data obtained; and other errors of collection, response, coverage, and estimation for missing or misreported
data.
The accuracy of these tabulated data is determined by the joint effects of the various nonsampling errors. No direct
measures of these effects have been obtained; however, precautionary steps were taken in all phases of data collection,
processing, and tabulation of the data in an effort to minimize the effects of nonsampling errors.

2007 CENSUS OF AGRICULTURE INDEX 1
INDEX
ItemIsland
Tables
Summary
TablesItem
Island
Tables
Summary
Tables
A
Age of farm operator . . . . . . . . . . . . .
Agricultural products sold . . . . . . . . . .
Alfalfa sprouts . . . . . . . . . . . . . . . . . . .
Aquaculture . . . . . . . . . . . . . . . . . . . .
Automobiles . . . . . . . . . . . . . . . . . . . .
Average size of farm . . . . . . . . . . . . .
Avocados . . . . . . . . . . . . . . . . . . . . . .
B
Bananas . . . . . . . . . . . . . . . . . . . . . . .
Beans . . . . . . . . . . . . . . . . . . . . . . . . .
Bean sprouts . . . . . . . . . . . . . . . . . . .
Betelnuts . . . . . . . . . . . . . . . . . . . . . . .
Bittermelons . . . . . . . . . . . . . . . . . . . .
Breadfruits . . . . . . . . . . . . . . . . . . . . .
C
Cabbage . . . . . . . . . . . . . . . . . . . . . . .
Cantaloups . . . . . . . . . . . . . . . . . . . . .
Carabaos . . . . . . . . . . . . . . . . . . . . . .
Cassava (tapioca) . . . . . . . . . . . . . . .
Cattle and calves . . . . . . . . . . . . . . . .
Chickens (see Poultry)
Coconuts . . . . . . . . . . . . . . . . . . . . . .
Corn . . . . . . . . . . . . . . . . . . . . . . . . . .
Cropland:
Harvested . . . . . . . . . . . . . . . . . . . .
Other . . . . . . . . . . . . . . . . . . . . . . .
Cucumbers . . . . . . . . . . . . . . . . . . . . .
Customwork . . . . . . . . . . . . . . . . . . . .
D
Ducks . . . . . . . . . . . . . . . . . . . . . . . . .
E
Eggplant . . . . . . . . . . . . . . . . . . . . . . .
Egg sales . . . . . . . . . . . . . . . . . . . . . .
Equipment:
Automobiles . . . . . . . . . . . . . . . . . .
Motortrucks . . . . . . . . . . . . . . . . . . .
Tillers (all kinds) . . . . . . . . . . . . . . .
Tractors (all kinds) . . . . . . . . . . . . .
3
6
9
6,12
4
1, 2
10
10
9
9
10
9
10
9
9
11
8
11
10
9
1
1
9
7
11
9
11
4
4
4
4
13 - 16
13 - 16
13 - 16
13 - 16
13 - 16
13 - 16
13 - 16
13 - 16
13 - 16
13 - 16
13 - 16
13 - 16
13 - 16
13 - 16
13 - 16
13 - 16
13 - 16
13 - 16
13 - 16
13 - 16
13 - 16
13 - 16
13 - 16
13 - 16
13 - 16
13 - 16
13 - 16
13 - 16
13 - 16
13 - 16
13 - 16
Expenses:
Feed for livestock, poultry,
and fish . . . . . . . . . . . . . . . . . . . .
Fertilizers and manure . . . . . . . . . .
Hired farm labor . . . . . . . . . . . . . . .
Insecticides, fungicides,
and herbicides . . . . . . . . . . . . . . .
Livestock, poultry, and fish
purchased . . . . . . . . . . . . . . . . . .
Machine hire and
customwork . . . . . . . . . . . . . . . . .
Seed cost . . . . . . . . . . . . . . . . . . . .
F
Farm labor, paid and unpaid . . . . . . .
Farms classified by:
Age of operator . . . . . . . . . . . . . . . .
Size of farm . . . . . . . . . . . . . . . . . .
Tenure of operator . . . . . . . . . . . . .
Type of organization . . . . . . . . . . . .
Value of agricultural products
sold . . . . . . . . . . . . . . . . . . . . . . .
Farms, number . . . . . . . . . . . . . . . . . .
Feed purchased . . . . . . . . . . . . . . . . .
Fighting roosters . . . . . . . . . . . . . . . . .
Fish . . . . . . . . . . . . . . . . . . . . . . . . . . .
Fruits and nuts . . . . . . . . . . . . . . . . . .
Fungicides . . . . . . . . . . . . . . . . . . . . .
G
Gado . . . . . . . . . . . . . . . . . . . . . . . . . .
Ginger . . . . . . . . . . . . . . . . . . . . . . . . .
Goats and kids . . . . . . . . . . . . . . . . . .
Green onions . . . . . . . . . . . . . . . . . . .
Guava . . . . . . . . . . . . . . . . . . . . . . . . .
H
Herbicides . . . . . . . . . . . . . . . . . . . . .
Hired labor . . . . . . . . . . . . . . . . . . . . .
Hogs and pigs . . . . . . . . . . . . . . . . . .
Horses and colts . . . . . . . . . . . . . . . . .
I
Insecticides . . . . . . . . . . . . . . . . . . . . .
Irrigation . . . . . . . . . . . . . . . . . . . . . . .
7
7
7
7
7
7
7
4
3
2
3
4
6
1 - 12
7
11
6,12
10
7
8
8
11
9
10
7
4,7
11
11
7
5
13 - 16
13 - 16
13 - 16
13 - 16
13 - 16
13 - 16
13 - 16
13 - 16
13 - 16
13 - 16
13 - 16
13 - 16
13 - 16
13 - 16
13 - 16
13 - 16
13 - 16
13 - 16
13 - 16
13 - 16
13 - 16
13 - 16
13 - 16
13 - 16
13 - 16
13 - 16
13 - 16
13 - 16
13 - 16
13 - 16

2 INDEX 2007 CENSUS OF AGRICULTURE
INDEX–Con.
ItemArea
Tables
Summary
TablesItem
Area
Tables
Summary
Tables
L
Labor, expenses . . . . . . . . . . . . . . . . .
Labor, paid and unpaid . . . . . . . . . . . .
Land area . . . . . . . . . . . . . . . . . . . . . .
Land in farms . . . . . . . . . . . . . . . . . . .
Land use . . . . . . . . . . . . . . . . . . . . . . .
Lemons and limes . . . . . . . . . . . . . . .
Livestock:
Inventory . . . . . . . . . . . . . . . . . . . . .
Number sold . . . . . . . . . . . . . . . . . .
Value of sales . . . . . . . . . . . . . . . . .
M
Machine hire . . . . . . . . . . . . . . . . . . . .
Machinery (see Equipment and
Facilities)
Mangos . . . . . . . . . . . . . . . . . . . . . . . .
Market value of agricultural
products sold . . . . . . . . . . . . . . . . .
Melons . . . . . . . . . . . . . . . . . . . . . . . .
Motortrucks . . . . . . . . . . . . . . . . . . . . .
Muskmelons and pepinos . . . . . . . . . .
N
Nursery crops . . . . . . . . . . . . . . . . . . .
O
Occupation of operator . . . . . . . . . . . .
Off-farm work . . . . . . . . . . . . . . . . . . .
Onions . . . . . . . . . . . . . . . . . . . . . . . .
Operator characteristics . . . . . . . . . . .
Operators by–
Age . . . . . . . . . . . . . . . . . . . . . . . . .
Occupation . . . . . . . . . . . . . . . . . . .
Off-farm work . . . . . . . . . . . . . . . . .
Race . . . . . . . . . . . . . . . . . . . . . . . .
Residence . . . . . . . . . . . . . . . . . . .
Sex . . . . . . . . . . . . . . . . . . . . . . . . .
Years on present farm . . . . . . . . . .
Oranges . . . . . . . . . . . . . . . . . . . . . . .
Organization, type of . . . . . . . . . . . . .
Ornamental plants . . . . . . . . . . . . . . .
7
4
1
1, 2
1
10
11
11
6
7
10
6
9
4
9
6, 10
3
3
9
3
3
3
3
3
3
3
3
10
4
10
13 - 16
13 - 16
13 - 16
13 - 16
13 - 16
13 - 16
13 - 16
13 - 16
13 - 16
13 - 16
13 - 16
13 - 16
13 - 16
13 - 16
13 - 16
13 - 16
13 - 16
13 - 16
13 - 16
13 - 16
13 - 16
13 - 16
13 - 16
13 - 16
13 - 16
13 - 16
13 - 16
13 - 16
13 - 16
13 - 16
P
Paid labor . . . . . . . . . . . . . . . . . . . . . .
Papayas . . . . . . . . . . . . . . . . . . . . . . .
Pastureland . . . . . . . . . . . . . . . . . . . .
Peppers . . . . . . . . . . . . . . . . . . . . . . .
Pigeons . . . . . . . . . . . . . . . . . . . . . . . .
Pineapples . . . . . . . . . . . . . . . . . . . . .
Poultry:
Inventory . . . . . . . . . . . . . . . . . . . . .
Number sold . . . . . . . . . . . . . . . . . .
Value of sales . . . . . . . . . . . . . . . . .
R
Race of Operator . . . . . . . . . . . . . . . .
Radishes . . . . . . . . . . . . . . . . . . . . . .
Residence of operator . . . . . . . . . . . .
Roosters . . . . . . . . . . . . . . . . . . . . . . .
Root crops . . . . . . . . . . . . . . . . . . . . .
S
Sales of agricultural products
(see also individual products) . . . . .
Seed cost . . . . . . . . . . . . . . . . . . . . . .
Size of farm . . . . . . . . . . . . . . . . . . . .
Soursops . . . . . . . . . . . . . . . . . . . . . .
Squash . . . . . . . . . . . . . . . . . . . . . . . .
Starfruits . . . . . . . . . . . . . . . . . . . . . . .
Sweetpotatoes . . . . . . . . . . . . . . . . . .
Sweetsops . . . . . . . . . . . . . . . . . . . . .
T
Tangerines . . . . . . . . . . . . . . . . . . . . .
Taro . . . . . . . . . . . . . . . . . . . . . . . . . .
Tenure of operator . . . . . . . . . . . . . . .
Tillers (all kinds) . . . . . . . . . . . . . . . . .
Tomatoes . . . . . . . . . . . . . . . . . . . . . .
Tractors (all kinds) . . . . . . . . . . . . . . .
U-V
Unpaid labor. . . . . . . . . . . . . . . . . .
Vegetables . . . . . . . . . . . . . . . . . . . . .
W
W atermelons . . . . . . . . . . . . . . .
W oodland . . . . . . . . . . . . . . . . . .
W ork off farm . . . . . . . . . . . . . . .
Y
Yams . . . . . . . . . . . . . . . . . . . . .
Years on present farm . . . . . . . .
4, 7
10
1
9
11
10
11
11
6
3
9
3
11
6, 8
6
7
2
10
9
10
8
10
10
8
3
4
9
4
4,7
9
9
1
3
8
3
13 - 16
13 - 16
13 - 16
13 - 16
13 - 16
13 - 16
13 - 16
13 - 16
13 - 16
13 - 16
13 - 16
13 - 16
13 - 16
13 - 16
13 - 16
13 - 16
13 - 16
13 - 16
13 - 16
13 - 16
13 - 16
13 - 16
13 - 16
13 - 16
13 - 16
13 - 16
13 - 16
13 - 16
13 - 16
13 - 16
13 - 16
13 - 16
13 - 16
13 - 16
13 - 16