gta board of directors - georgia technology authority
TRANSCRIPT
GTA Board of Directors December 5, 2013
Our Strategic Vision
▪ A transparent, integrated enterprise where technology decisions
are made with the citizen in mind
Our Mission
▪ To provide technology leadership to the state of Georgia for
sound IT enterprise management

Agenda
• Welcome
• Financial Update
– Federal Liability Update
• Enterprise Governance and Planning
– Enterprise Data Lifecycle Management
– Agency Security Report Cards
• IT Transformation and Performance Update
– GTA Review
– IBM Update
– Q&A
• Obamacare Update: Impact to GTA
• Closing and Adjournment
2
Financial Update
Joe Webb
GTA Deputy Executive Director
3

State Revenues: FY 2009 to FY 2014
4
Revenues were 5.9% higher through October than the prior fiscal year
$0
$200,000,000
$400,000,000
$600,000,000
$800,000,000
$1,000,000,000
$1,200,000,000
$1,400,000,000
$1,600,000,000
$1,800,000,000
$2,000,000,000
Jul Aug Sept Oct Nov Dec Jan Feb Mar Apr May Jun
FY 2009
FY 2010
FY 2011
FY 2012
FY 2013
FY 2014
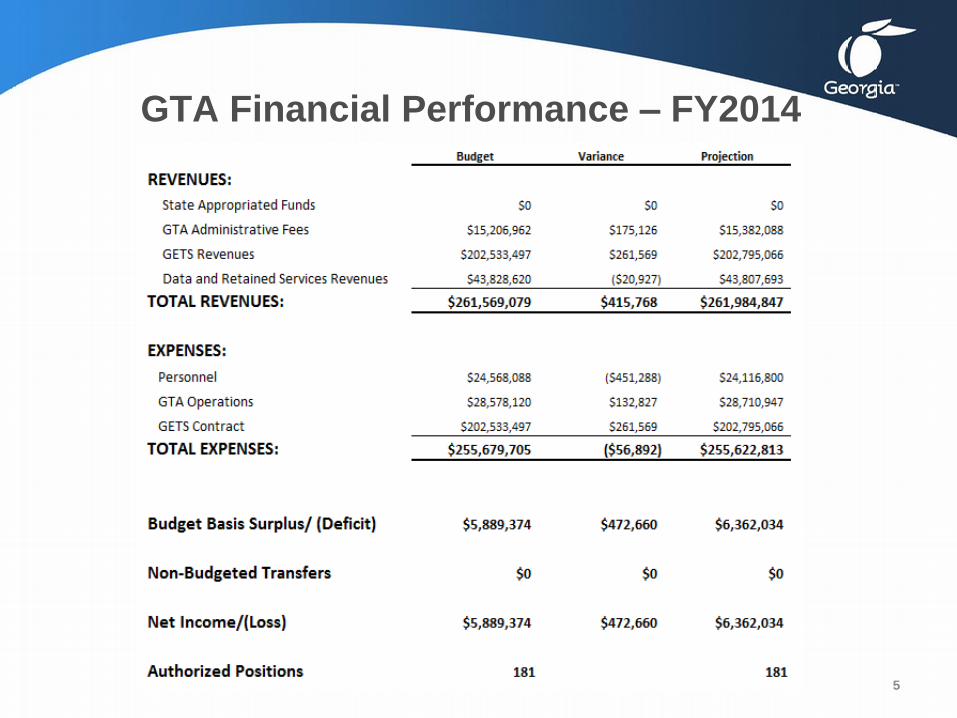
GTA Financial Performance – FY2014
5

Financial Summary
6
• State revenues continue to improve – 5.9% higher through October
• Data Sales revenues in line with FY 2014 forecast - $32.9m
• Continued success in improving invoice collections
• FY14 YTD Accounts Receivable turnover: 48 days
• 15-day improvement in AR turnover since FY11 ~ $9.9m in additional cash flow
• GTA operating reserve balance
• Began FY14 with $21.5m reserve balance
• FY04 – FY09 federal liability pending review
• Completion of financial analysis targeted for December 2013

Enterprise Governance and Planning
Tom Fruman
Director
7

Enterprise Data Lifecycle Management
8

Data Lifecycle Management
• Constituent data
– Recognized as a valued asset
– Protected from unauthorized access
– Safeguarded and managed
– Used only for state business purposes
9

Data Lifecycle Management
Agency costs are increasing even as storage media
costs have decreased.
• Primary drivers
– Failure to implement stringent records retention
practices
– Failure to implement industry best practices for data
management
– Unprecedented growth in the amount of mission
critical data collected
10
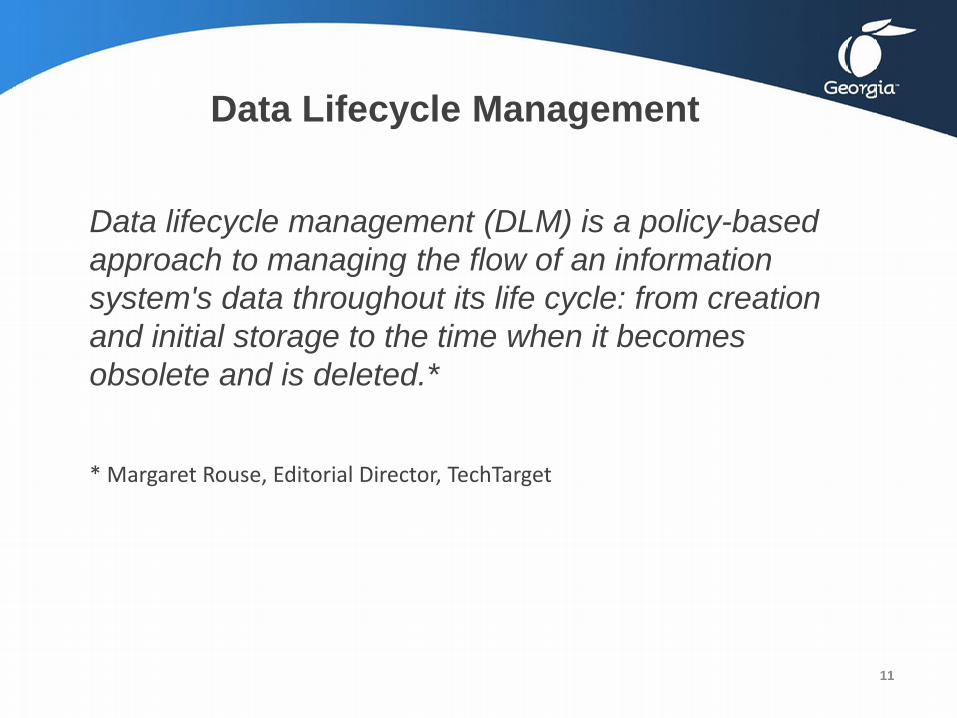
Data Lifecycle Management
Data lifecycle management (DLM) is a policy-based
approach to managing the flow of an information
system's data throughout its life cycle: from creation
and initial storage to the time when it becomes
obsolete and is deleted.*
* Margaret Rouse, Editorial Director, TechTarget
11

Data Lifecycle Management
Reliance on Electronic Records PS-08-007 Electronic records must be safeguarded against loss or unauthorized destruction. Each Agency shall issue an internal policy designating the authorized forms of official records in the custody of that agency.
Data and Asset Categorization PS-08-012 Data Owner/s will inventory and assign a security category to the data and the information systems, using the FIPS 199 Standards for Security Categorization for Federal Information systems.
Public Access Systems PS-08-028 Any agency that maintains internet facing systems shall provide security controls that protect the users and the confidentiality, integrity, and availability of web servers, applications and data
Existing Policies in support of DLM
12
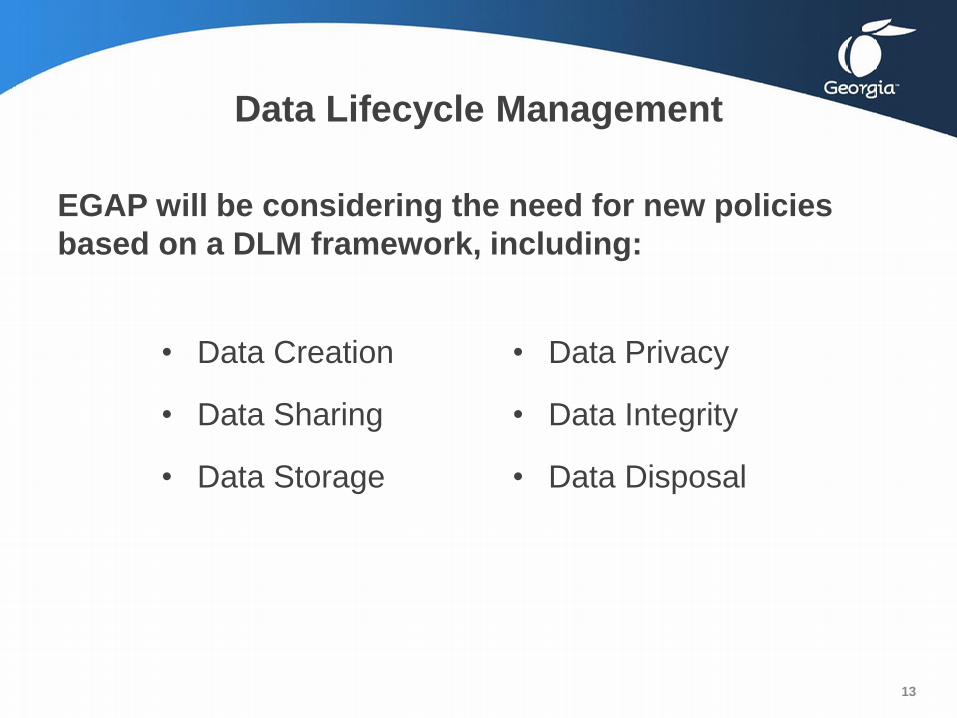
Data Lifecycle Management
EGAP will be considering the need for new policies
based on a DLM framework, including:
• Data Privacy
• Data Integrity
• Data Disposal
• Data Creation
• Data Sharing
• Data Storage
13

Agency Security Report Cards
14
IT Transformation and Performance
Update
Dean Johnson
GTA Chief Operating Officer
15
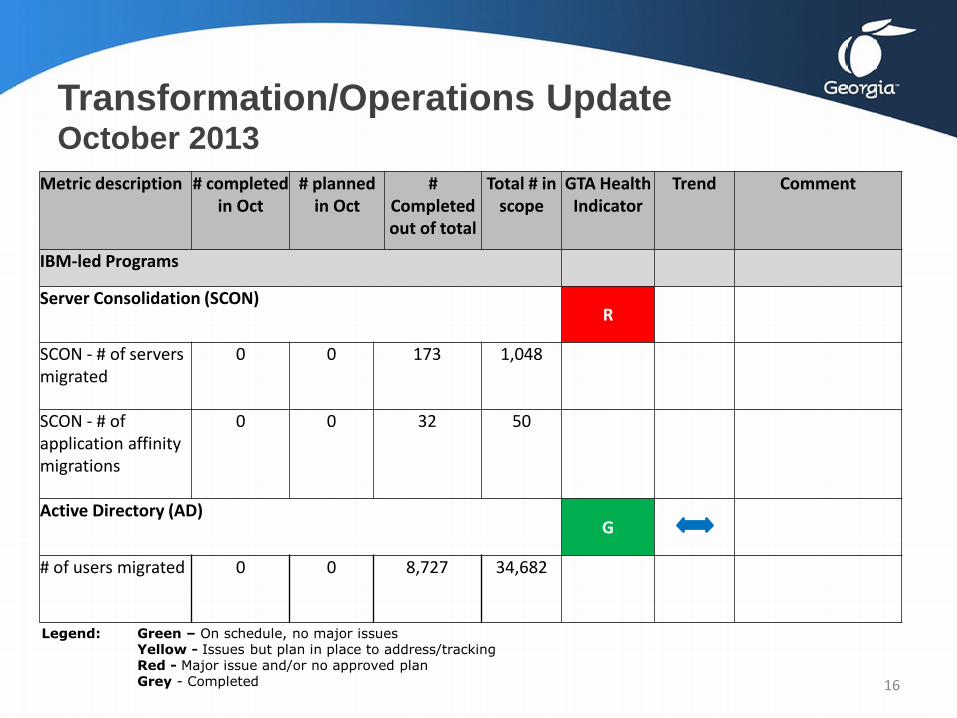
Transformation/Operations Update October 2013
Metric description # completed in Oct
# planned in Oct
# Completed out of total
Total # in scope
GTA Health Indicator
Trend Comment
IBM-led Programs
Server Consolidation (SCON) R
SCON - # of servers migrated
0 0 173 1,048
SCON - # of application affinity migrations
0 0 32 50
Active Directory (AD) G
# of users migrated 0 0 8,727 34,682
Legend: Green – On schedule, no major issues Yellow - Issues but plan in place to address/tracking Red - Major issue and/or no approved plan Grey - Completed 16
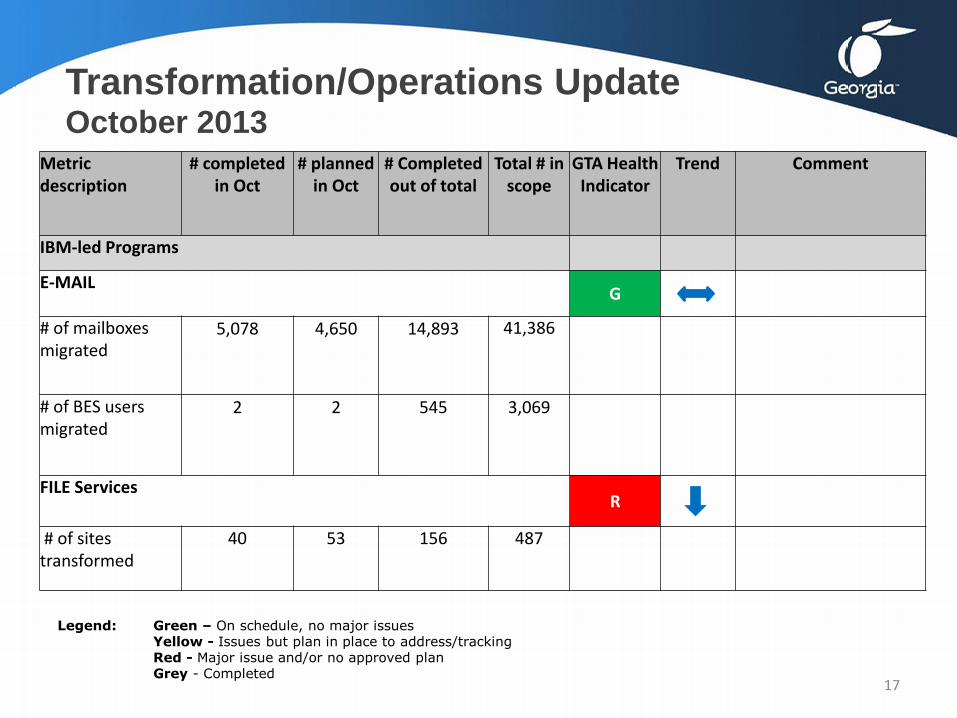
Transformation/Operations Update October 2013
Metric description
# completed in Oct
# planned in Oct
# Completed out of total
Total # in scope
GTA Health Indicator
Trend Comment
IBM-led Programs
E-MAIL G
# of mailboxes migrated
5,078 4,650 14,893 41,386
# of BES users migrated
2 2 545 3,069
FILE Services
R
# of sites transformed
40 53 156 487
Legend: Green – On schedule, no major issues Yellow - Issues but plan in place to address/tracking Red - Major issue and/or no approved plan Grey - Completed
17
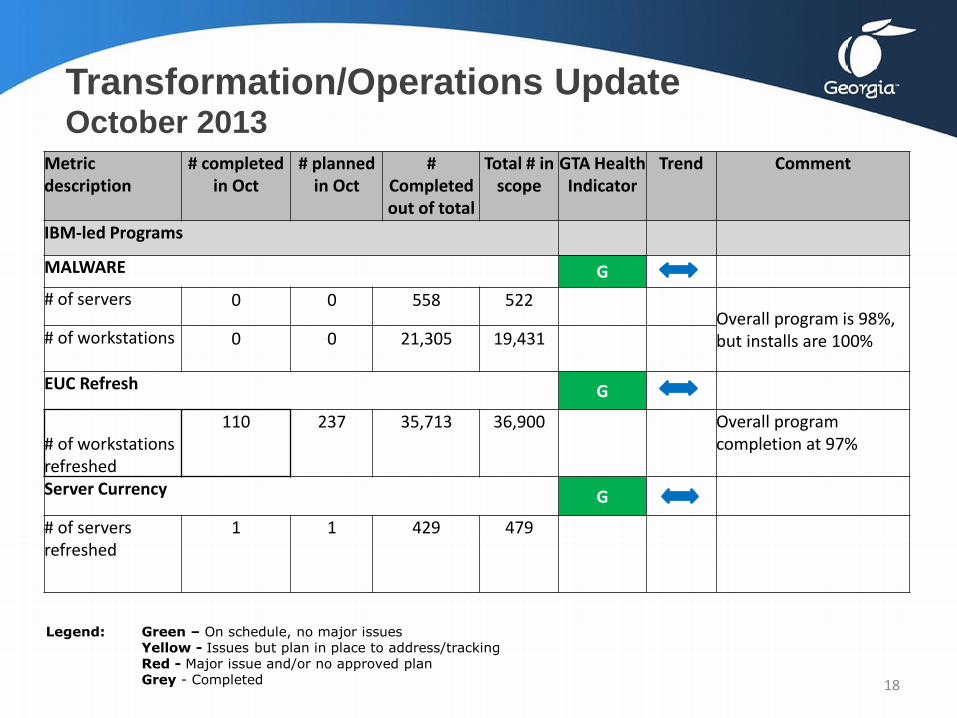
Transformation/Operations Update October 2013
Metric description
# completed in Oct
# planned in Oct
# Completed out of total
Total # in scope
GTA Health Indicator
Trend Comment
IBM-led Programs
MALWARE G
# of servers 0 0 558 522 Overall program is 98%, but installs are 100% # of workstations 0 0 21,305 19,431
EUC Refresh G
# of workstations refreshed
110 237 35,713 36,900
Overall program completion at 97%
Server Currency G
# of servers refreshed
1 1 429 479
Legend: Green – On schedule, no major issues Yellow - Issues but plan in place to address/tracking Red - Major issue and/or no approved plan Grey - Completed 18

Transformation/Operations Update October 2013
Metric description # Completed out of total
Total # in scope
GTA Health Indicator
Trend Comment
IBM Lead Programs
Tool Deployment & Monitoring Y
# workstations w/DDM & verified
25,319 35,068 72.20% effectiveness, up from 70.23%. Dell is working to replace DDM with KACE by March 2014 and expects better results.
# Servers w/Tools & Monitored
1,942 2,322 Total servers reporting is 84%, which is a slight increase over last quarter at 83%.
Legend: Green – On schedule, no major issues Yellow - Issues but plan in place to address/tracking Red - Major issue and/or no approved plan Grey - Completed
19
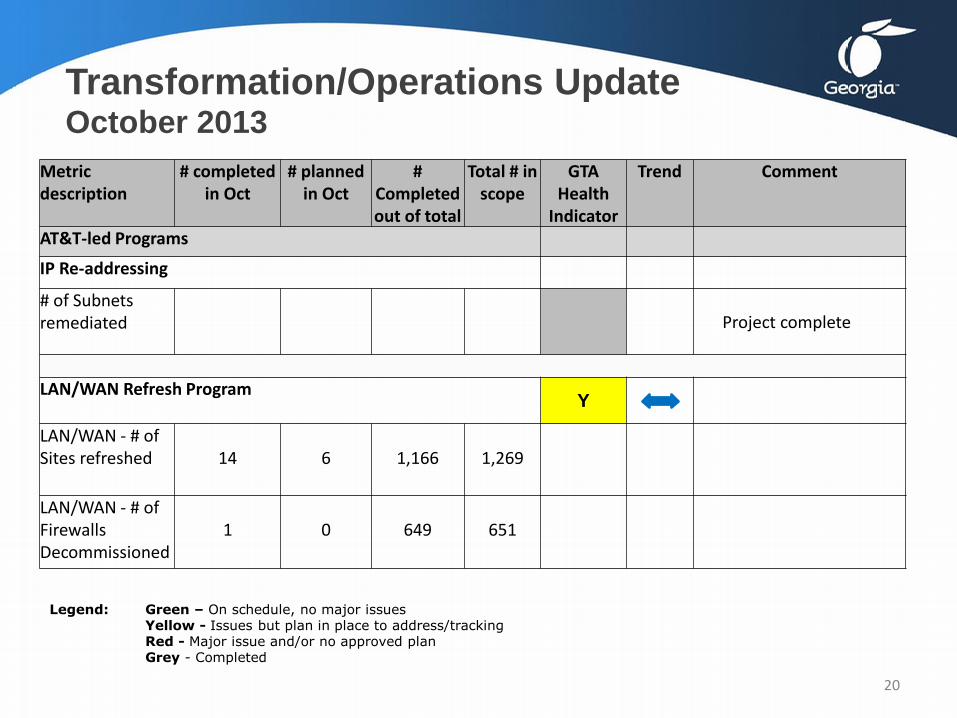
Transformation/Operations Update October 2013
Legend: Green – On schedule, no major issues Yellow - Issues but plan in place to address/tracking Red - Major issue and/or no approved plan Grey - Completed
Metric description
# completed in Oct
# planned in Oct
# Completed out of total
Total # in scope
GTA Health
Indicator
Trend Comment
AT&T-led Programs
IP Re-addressing
# of Subnets remediated Project complete
LAN/WAN Refresh Program Y
LAN/WAN - # of Sites refreshed
14
6
1,166
1,269
LAN/WAN - # of Firewalls Decommissioned
1
0
649
651
20
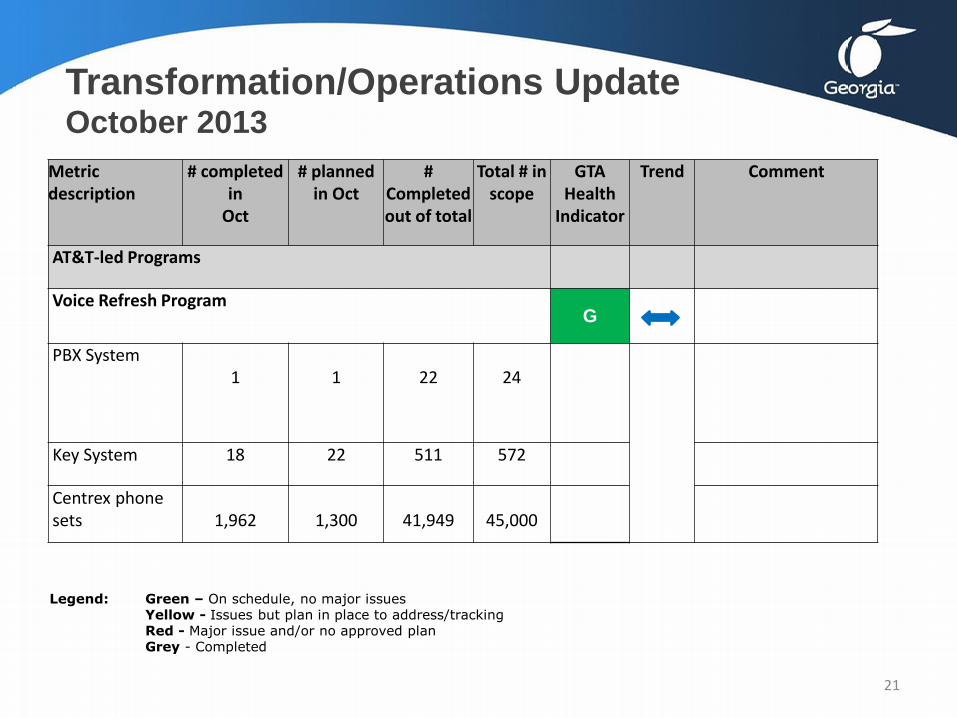
Transformation/Operations Update October 2013
Legend: Green – On schedule, no major issues Yellow - Issues but plan in place to address/tracking Red - Major issue and/or no approved plan Grey - Completed
Metric description
# completed in
Oct
# planned in Oct
# Completed out of total
Total # in scope
GTA Health
Indicator
Trend Comment
AT&T-led Programs
Voice Refresh Program G
PBX System
1
1
22
24
Key System 18 22 511 572
Centrex phone sets
1,962
1,300
41,949
45,000
21
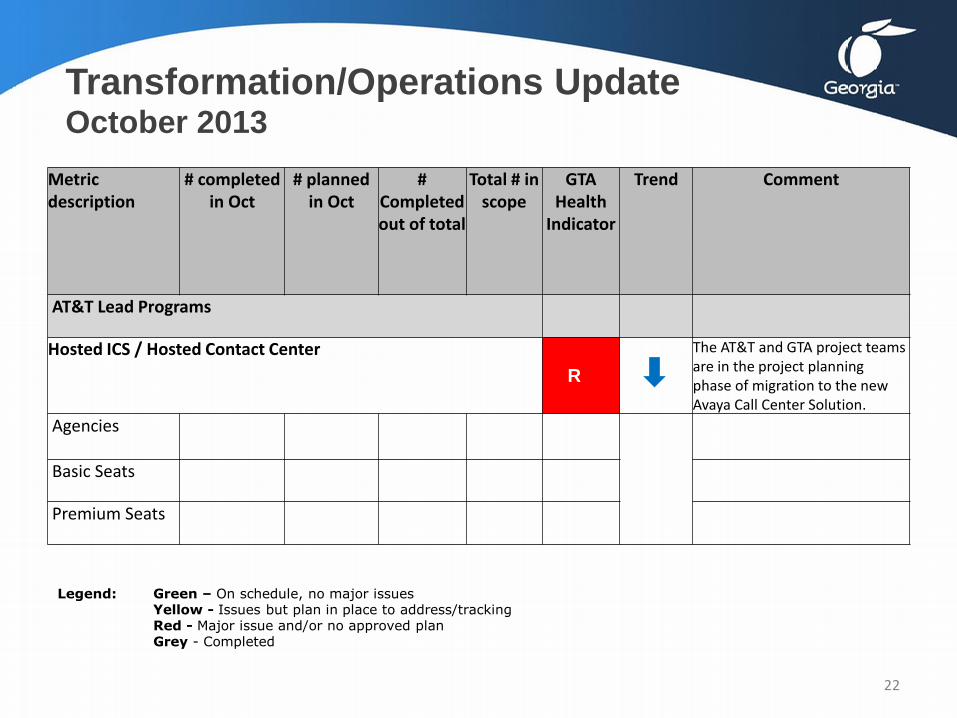
Transformation/Operations Update October 2013
Legend: Green – On schedule, no major issues Yellow - Issues but plan in place to address/tracking Red - Major issue and/or no approved plan Grey - Completed
Metric description
# completed in Oct
# planned in Oct
# Completed out of total
Total # in scope
GTA Health
Indicator
Trend Comment
AT&T Lead Programs
Hosted ICS / Hosted Contact Center
RR
The AT&T and GTA project teams are in the project planning phase of migration to the new Avaya Call Center Solution.
Agencies
Basic Seats
Premium Seats
22
23
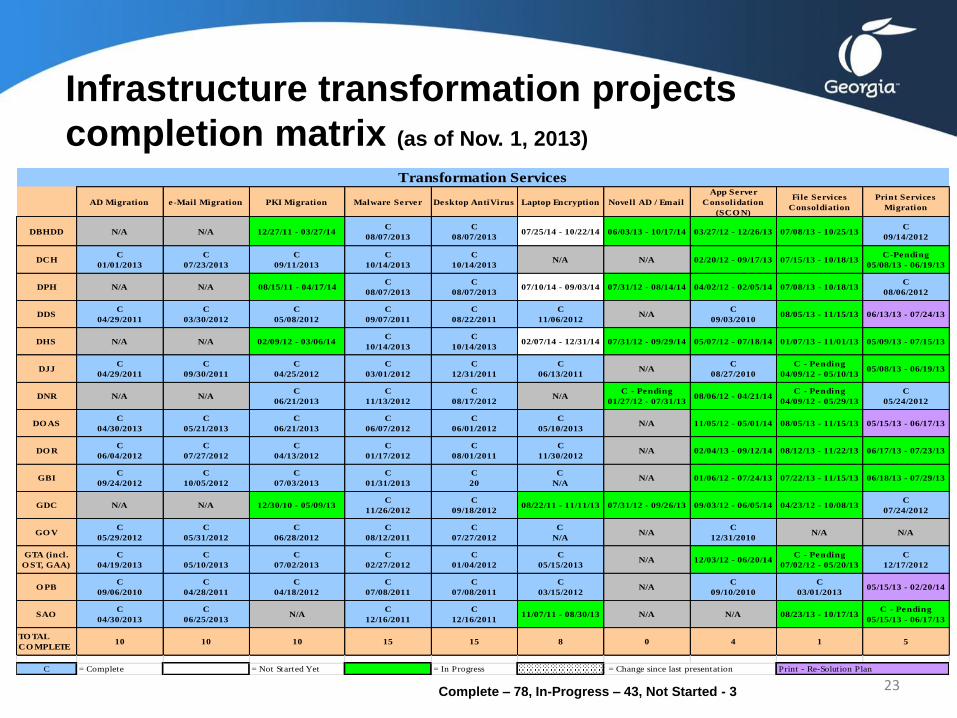
Infrastructure transformation projects
completion matrix (as of Nov. 1, 2013)
Complete – 78, In-Progress – 43, Not Started - 3
AD Migration e-Mail Migration PKI Migration Malware Server Desktop AntiVirus Laptop Encryption Novell AD / Email
App Server
Consolidation
(SCO N)
File Services
Consoldiation
Print Services
Migration
DBHDD N/A N/A 12/27/11 - 03/27/14C
08/07/2013
C
08/07/201307/25/14 - 10/22/14 06/03/13 - 10/17/14 03/27/12 - 12/26/13 07/08/13 - 10/25/13
C
09/14/2012
DCHC
01/01/2013
C
07/23/2013
C
09/11/2013
C
10/14/2013
C
10/14/2013N/A N/A 02/20/12 - 09/17/13 07/15/13 - 10/18/13
C-Pending
05/08/13 - 06/19/13
DPH N/A N/A 08/15/11 - 04/17/14C
08/07/2013
C
08/07/201307/10/14 - 09/03/14 07/31/12 - 08/14/14 04/02/12 - 02/05/14 07/08/13 - 10/18/13
C
08/06/2012
DDSC
04/29/2011
C
03/30/2012
C
05/08/2012
C
09/07/2011
C
08/22/2011
C
11/06/2012N/A
C
09/03/201008/05/13 - 11/15/13 06/13/13 - 07/24/13
DHS N/A N/A 02/09/12 - 03/06/14C
10/14/2013
C
10/14/201302/07/14 - 12/31/14 07/31/12 - 09/29/14 05/07/12 - 07/18/14 01/07/13 - 11/01/13 05/09/13 - 07/15/13
DJJC
04/29/2011
C
09/30/2011
C
04/25/2012
C
03/01/2012
C
12/31/2011
C
06/13/2011N/A
C
08/27/2010
C - Pending
04/09/12 - 05/10/1305/08/13 - 06/19/13
DNR N/A N/AC
06/21/2013
C
11/13/2012
C
08/17/2012N/A
C - Pending
01/27/12 - 07/31/1308/06/12 - 04/21/14
C - Pending
04/09/12 - 05/29/13
C
05/24/2012
DO ASC
04/30/2013
C
05/21/2013
C
06/21/2013
C
06/07/2012
C
06/01/2012
C
05/10/2013N/A 11/05/12 - 05/01/14 08/05/13 - 11/15/13 05/15/13 - 06/17/13
DO RC
06/04/2012
C
07/27/2012
C
04/13/2012
C
01/17/2012
C
08/01/2011
C
11/30/2012N/A 02/04/13 - 09/12/14 08/12/13 - 11/22/13 06/17/13 - 07/23/13
GBIC
09/24/2012
C
10/05/2012
C
07/03/2013
C
01/31/2013
C
20
C
N/AN/A 01/06/12 - 07/24/13 07/22/13 - 11/15/13 06/18/13 - 07/29/13
GDC N/A N/A 12/30/10 - 05/09/13C
11/26/2012
C
09/18/201208/22/11 - 11/11/13 07/31/12 - 09/26/13 09/03/12 - 06/05/14 04/23/12 - 10/08/13
C
07/24/2012
GO VC
05/29/2012
C
05/31/2012
C
06/28/2012
C
08/12/2011
C
07/27/2012
C
N/AN/A
C
12/31/2010N/A N/A
GTA (incl.
O ST, GAA)
C
04/19/2013
C
05/10/2013
C
07/02/2013
C
02/27/2012
C
01/04/2012
C
05/15/2013N/A 12/03/12 - 06/20/14
C - Pending
07/02/12 - 05/20/13
C
12/17/2012
O PBC
09/06/2010
C
04/28/2011
C
04/18/2012
C
07/08/2011
C
07/08/2011
C
03/15/2012N/A
C
09/10/2010
C
03/01/201305/15/13 - 02/20/14
SAOC
04/30/2013
C
06/25/2013N/A
C
12/16/2011
C
12/16/201111/07/11 - 08/30/13 N/A N/A 08/23/13 - 10/17/13
C - Pending
05/15/13 - 06/17/13
TO TAL
CO MPLETE10 10 10 15 15 8 0 4 1 5
C = Complete = Not Started Yet = In Progress = Change since last presentation Print - Re-Solution Plan
Transformation Services

IT Infrastructure Services
Note: These are quarterly percentages.
24
SLAs Quarterly Performance Trend
91.30%93.75%
86.96%89.13% 86.96%
95.12%
4.35%2.08%
8.70% 6.52% 6.52%4.88%4.35% 4.17%
4.35% 4.35%6.52%
0.00%0%
10%
20%
30%
40%
50%
60%
70%
80%
90%
100%
Jun-12 Sep-12 Dec-12 Mar-13 Jun-13 Sep-13
Equal or Above Expected Between Expected and Minimum Below Minimum

SLAs Quarterly Performance Trend
Note: These are quarterly percentages.
Managed Network Services
25
95.24% 95.24% 95.24% 92.86%
97.62% 100.00%
2.38% 4.76% 4.76% 4.76%
0.00% 0.00% 2.38% 0.00% 0.00% 2.38%
2.38%
0%
10%
20%
30%
40%
50%
60%
70%
80%
90%
100%
Jun-12 Sep-12 Dec-12 Mar-13* Jun-13 Sep-13
Equal or Above Expected Between Expected & Minimum Below Minimum

26
IBM Update
Beverly Saskowski
IBM VP and Senior Project Executive

Agenda
• Infrastructure Transformation Update
• Voice of the Customer – Tri Area
Focus Program
• 2013 Key Accomplishments
• 2014 Focus
27
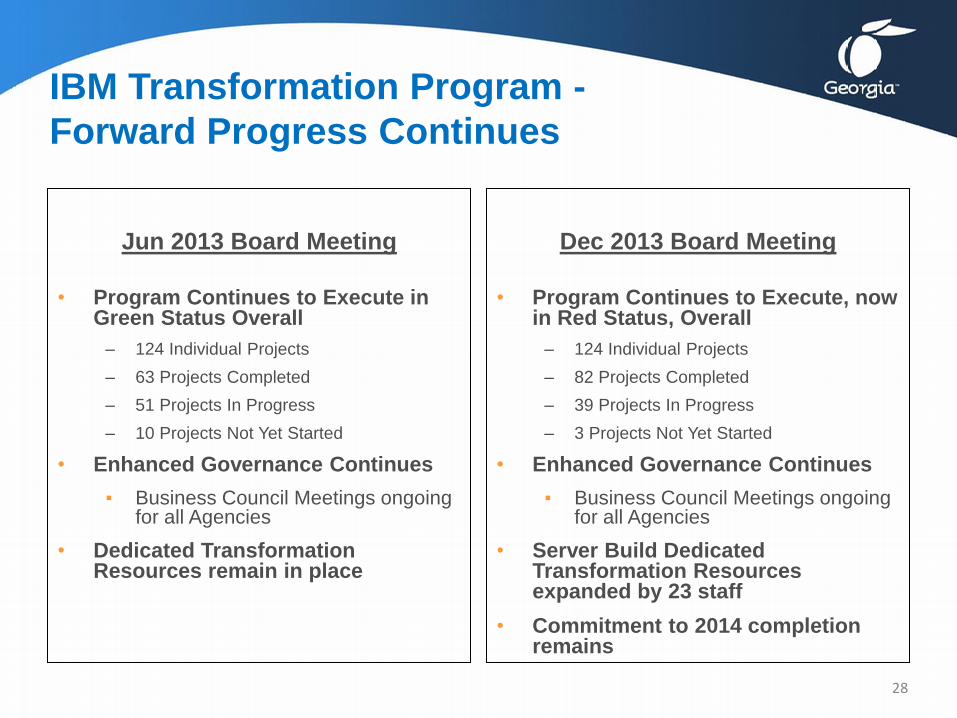
IBM Transformation Program -
Forward Progress Continues
Jun 2013 Board Meeting
• Program Continues to Execute in Green Status Overall
– 124 Individual Projects
– 63 Projects Completed
– 51 Projects In Progress
– 10 Projects Not Yet Started
• Enhanced Governance Continues
▪ Business Council Meetings ongoing for all Agencies
• Dedicated Transformation Resources remain in place
Dec 2013 Board Meeting
• Program Continues to Execute, now in Red Status, Overall
– 124 Individual Projects
– 82 Projects Completed
– 39 Projects In Progress
– 3 Projects Not Yet Started
• Enhanced Governance Continues
▪ Business Council Meetings ongoing for all Agencies
• Server Build Dedicated Transformation Resources expanded by 23 staff
• Commitment to 2014 completion remains
28

IBM Transformation – Dec 2013
Key Complete
Not Started
In Progress
AD Migration e-Mail Migration PKI Migration Malware Server Desktop AntiVirus Laptop Encryption Novell AD / Email
App Server
Consolidation
(SCO N)
File Services
Consoldiation
Print Services
Migration
DBHDD N/A N/A 12/27/11 - 03/27/14C
08/07/2013
C
08/07/201307/25/14 - 10/22/14 06/03/13 - 10/17/14 03/27/12 - 12/26/13 07/08/13 - 10/25/13
C
09/14/2012
DCHC
01/01/2013
C
07/23/2013
C
09/11/2013
C
10/14/2013
C
10/14/2013N/A N/A 02/20/12 - 09/17/13 07/15/13 - 10/18/13
C
11/13/2013
DPH N/A N/A 08/15/11 - 04/17/14C
08/07/2013
C
08/07/201307/10/14 - 09/03/14 07/31/12 - 08/14/14 04/02/12 - 02/05/14 07/08/13 - 10/18/13
C
08/06/2012
DDSC
04/29/2011
C
03/30/2012
C
05/08/2012
C
09/07/2011
C
08/22/2011
C
11/06/2012N/A
C
09/03/201008/05/13 - 11/15/13 06/13/13 - 07/24/13
DHS N/A N/A 02/09/12 - 03/06/14C
10/14/2013
C
10/14/201302/07/14 - 12/31/14 07/31/12 - 09/29/14 05/07/12 - 07/18/14 01/07/13 - 11/01/13
C
11/13/2013
DJJC
04/29/2011
C
09/30/2011
C
04/25/2012
C
03/01/2012
C
12/31/2011
C
06/13/2011N/A
C
08/27/2010
C - Pending
04/09/12 - 05/10/13
C-Pending
05/08/13 - 06/19/13
DNR N/A N/AC
06/21/2013
C
11/13/2012
C
08/17/2012N/A
C - Pending
01/27/12 - 07/31/1308/06/12 - 04/21/14
C - Pending
04/09/12 - 05/29/13
C
05/24/2012
DO ASC
04/30/2013
C
05/21/2013
C
06/21/2013
C
06/07/2012
C
06/01/2012
C
05/10/2013N/A 11/05/12 - 05/01/14 08/05/13 - 11/15/13 05/15/13 - 06/17/13
DO RC
06/04/2012
C
07/27/2012
C
04/13/2012
C
01/17/2012
C
08/01/2011
C
11/30/2012N/A 02/04/13 - 09/12/14 08/12/13 - 11/22/13
C
11/21/2013
GBIC
09/24/2012
C
10/05/2012
C
07/03/2013
C
01/31/2013
C
10/30/2012
C
N/AN/A 01/06/12 - 07/24/13 07/22/13 - 11/15/13 06/18/13 - 07/29/13
GDC N/A N/A 12/30/10 - 05/09/13C
11/26/2012
C
09/18/201208/22/11 - 11/11/13 07/31/12 - 09/26/13 09/03/12 - 06/05/14 04/23/12 - 10/08/13
C
07/24/2012
GO VC
05/29/2012
C
05/31/2012
C
06/28/2012
C
08/12/2011
C
07/27/2012
C
N/AN/A
C
12/31/2010N/A N/A
GTA (incl.
O ST, GAA)
C
04/19/2013
C
05/10/2013
C
07/02/2013
C
02/27/2012
C
01/04/2012
C
05/15/2013N/A 12/03/12 - 06/20/14
C - Pending
07/02/12 - 05/20/13
C
12/17/2012
O PBC
09/06/2010
C
04/28/2011
C
04/18/2012
C
07/08/2011
C
07/08/2011
C
03/15/2012N/A
C
09/10/2010
C
03/01/201305/15/13 - 02/20/14
SAOC
04/30/2013
C
06/25/2013N/A
C
12/16/2011
C
12/16/201111/07/11 - 08/30/13 N/A N/A 08/23/13 - 10/17/13
C
11/13/2013
TO TAL
CO MPLETE10 10 10 15 15 8 0 4 1 9
Transformation Services
3 Projects Not Started
39 Projects in Progress
82 Projects Completed
29

Key Transformation Metrics as of 11/15/13
Transformation Project Unit of Measure
Last Report 6/1/13
Last Report 6/1/13
Current Number of Migrations Completed
Target Number of Migrations
Percentage of Target
Completed
Delta 6/1/13 – 11/15/13
Active Directory Users 10,533 30.3% 10,633 34,682 30.7% 0.4%
eMail (All Exchange to Exchange Migrations Complete)
Users 11,705 28.3% 12,136 41,259 29.4% 1.1%
Blackberry Enterprise Servers (BES)
Users 922 30.1% 945 3,056 30.9% 0.8%
End User Computing Data Encryption
End users
1,303 23.7% 1,693 5,483 30.9% 7.2%
End User Computing
Anti-virus
End users
25,412 103.8% 26,400 24,465 107.9% 4.1%
Malware* Servers 1,266 72.7% 1,300 1,740 74.7% 2.0%
Server Consolidation Servers migrated
135 12.9% 141 1,048 13.5% 0.6%
* Malware program is 100% complete though the metric shows 74.7% complete, the initial target migration number was higher than what
the actuals required. 1,300 migrations was the final count.
30

Key Transformation Metrics as of 11/15/13
** Currently known servers to be “transformed in place”
Transformation Project
Unit of Measure
Last Report 6/1/13
Last Report 6/1/13
Current Number of Migrations Completed
Target Number of Migrations
Percentage of Target
Completed
Delta 6/1/13 – 11/15/13
Server Consolidation – Transformed in Place
Servers transformed
in place
29 54.7% 29 53** 54.7% 0%
File Servers -Site Surveys Complete - Servers Built & Configured -Servers Shipped & Installed -Servers Production Deployed
Sites
Servers
Servers
Servers
369 188
188
50
76.8% 39.1%
39.1%
10.4%
483 216
214
156
480 480
480
480
100.6% 45.0%
44.6%
32.5%
23.8% 5.9%
5.5%
22.1%
Print Services - Direct IP Print
Assets migrated
1,179 7.8% 12,200 15,072 80.9% 73.1%
31

Application Server Builds by Week
Date
SCON Servers
Turned over to
Agency by
Week Plan
SCON Servers
Turned over to
Agency by
Week Actual
SCON Servers
Turned over to
Agency
Cumulative
Plan
SCON Servers
Turned over to
Agency
Cumulative
Actual
SCON Server
Pending
Privileged ID's
by Week
SCON Server Count by
Agency Per Week
09/06 5 5 5 5 0 DCH-5
09/13 15 15 20 20 0 DBHDD-15
09/20 20 20 40 40 0 DBHDD-20
09/27 30 30 70 70 0 DBHDD-25, DNR-5
10/04 30 30 100 100 0 DNR-4, DPH-26
10/11 30 27 130 127 3 DNR-3, DPH-24, GTA-3
10/18 30 14 160 141 16 DNR-8, DPH-13, GTA-9
10/25 30 2 190 143 20 DNR-2, DPH-15, GTA-5
11/01 35 24 225 167 6 GTA-6, DHS-24
11/08 35 20 260 187 12 GTA-12, DHS-17
11/15 35 17 295 204 2 GDC-1, DHS-1, DPH-2
11/22 35 16 330 220 0 GDC-16
11/29 20 350
12/06 35 353
12/13 35 388
12/20 35 423
12/27 10 433
01/03 10 443
01/10 35 478
01/17 35 513
01/24 35 548
01/31 5 553
Total 585 220 585 220 5932
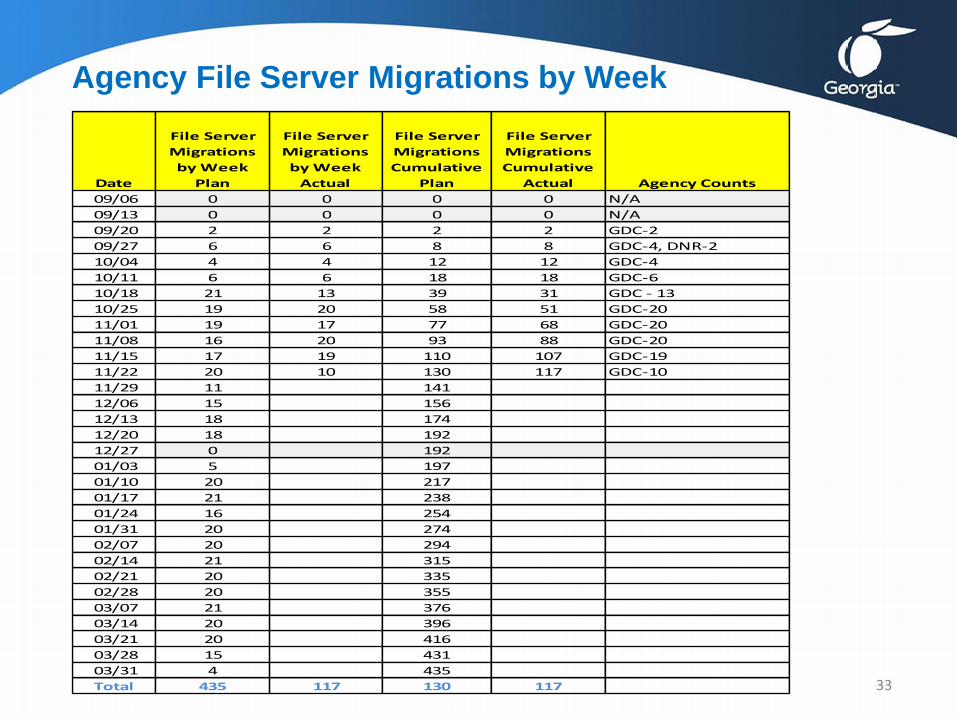
Agency File Server Migrations by Week
Date
File Server
Migrations
by Week
Plan
File Server
Migrations
by Week
Actual
File Server
Migrations
Cumulative
Plan
File Server
Migrations
Cumulative
Actual Agency Counts
09/06 0 0 0 0 N/A
09/13 0 0 0 0 N/A
09/20 2 2 2 2 GDC-2
09/27 6 6 8 8 GDC-4, DNR-2
10/04 4 4 12 12 GDC-4
10/11 6 6 18 18 GDC-6
10/18 21 13 39 31 GDC - 13
10/25 19 20 58 51 GDC-20
11/01 19 17 77 68 GDC-20
11/08 16 20 93 88 GDC-20
11/15 17 19 110 107 GDC-19
11/22 20 10 130 117 GDC-10
11/29 11 141
12/06 15 156
12/13 18 174
12/20 18 192
12/27 0 192
01/03 5 197
01/10 20 217
01/17 21 238
01/24 16 254
01/31 20 274
02/07 20 294
02/14 21 315
02/21 20 335
02/28 20 355
03/07 21 376
03/14 20 396
03/21 20 416
03/28 15 431
03/31 4 435
Total 435 117 130 117 33
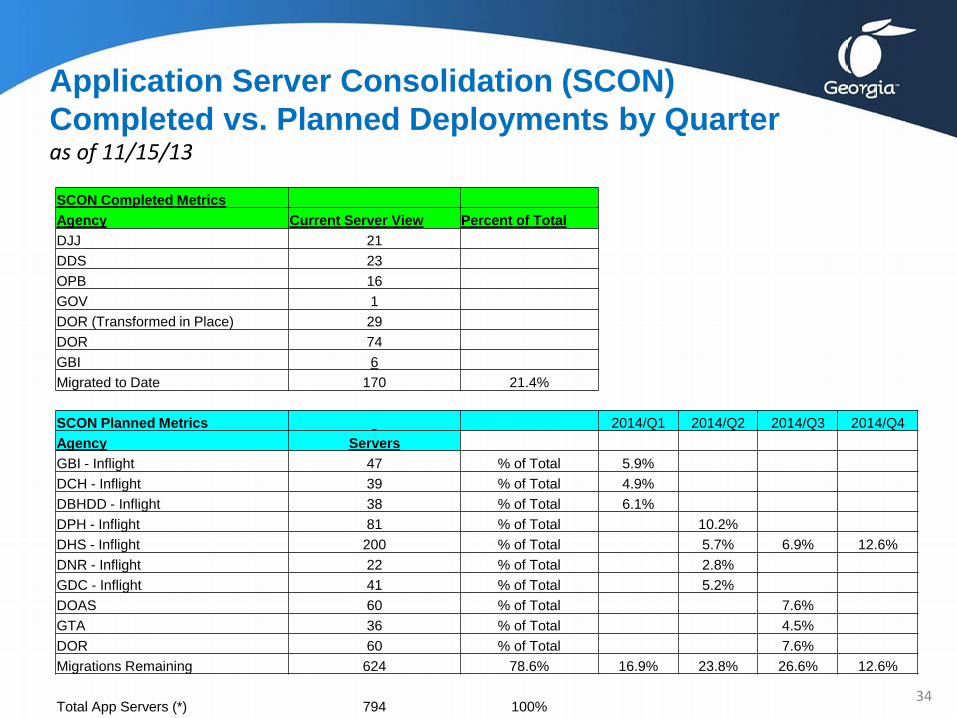
Application Server Consolidation (SCON)
Completed vs. Planned Deployments by Quarter as of 11/15/13
SCON Completed Metrics
Agency Current Server View Percent of Total
DJJ 21
DDS 23
OPB 16
GOV 1
DOR (Transformed in Place) 29
DOR 74
GBI 6
Migrated to Date 170 21.4%
SCON Planned Metrics 2014/Q1 2014/Q2 2014/Q3 2014/Q4
Agency Servers
GBI - Inflight 47 % of Total 5.9%
DCH - Inflight 39 % of Total 4.9%
DBHDD - Inflight 38 % of Total 6.1%
DPH - Inflight 81 % of Total 10.2%
DHS - Inflight 200 % of Total 5.7% 6.9% 12.6%
DNR - Inflight 22 % of Total 2.8%
GDC - Inflight 41 % of Total 5.2%
DOAS 60 % of Total 7.6%
GTA 36 % of Total 4.5%
DOR 60 % of Total 7.6%
Migrations Remaining 624 78.6% 16.9% 23.8% 26.6% 12.6%
Total App Servers (*) 794 100% 34

Transformed vs. Non-Transformed
Severity 1 & 2 Incidents per Server by Month
0
0.005
0.01
0.015
0.02
0.025
0.03
0.035
0.04
0.045
Sum of Sev 1-2 Transformed Incident Count Per Server Sum of Sev 1-2 Non-Tranformed Incident Count Per Server35
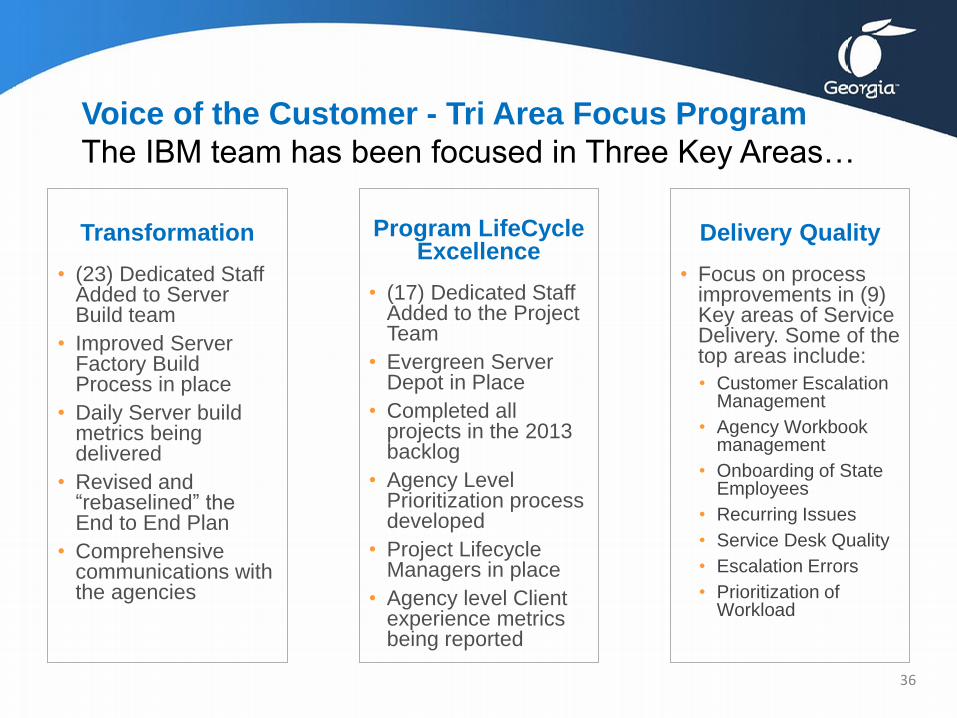
Voice of the Customer - Tri Area Focus Program
The IBM team has been focused in Three Key Areas…
Transformation
• (23) Dedicated Staff Added to Server Build team
• Improved Server Factory Build Process in place
• Daily Server build metrics being delivered
• Revised and “rebaselined” the End to End Plan
• Comprehensive communications with the agencies
Program LifeCycle
Excellence
• (17) Dedicated Staff Added to the Project Team
• Evergreen Server Depot in Place
• Completed all projects in the 2013 backlog
• Agency Level Prioritization process developed
• Project Lifecycle Managers in place
• Agency level Client experience metrics being reported
Delivery Quality
• Focus on process improvements in (9) Key areas of Service Delivery. Some of the top areas include:
• Customer Escalation Management
• Agency Workbook management
• Onboarding of State Employees
• Recurring Issues
• Service Desk Quality
• Escalation Errors
• Prioritization of Workload
36

Accomplishments for 2013
There were a number of notable items in 2013. Here
are a few…
EUC Refresh
35,700 EUC devices
refreshed. Second
refresh cycle started.
Server Currency
407 Servers Refreshed
Inception to Date. 47 in
2013.
Mainframe Upgrades
600+ MIPS added to the
Mainframe to support
month end processing.
Disaster Recovery
Fourth 100% Successful
off site DR Test with (9)
Agencies participating.
Projects
Completed 297 Projects
including those in the
backlog.
Mobility Device Mgt. Partnering with Airwatch
to securer State owned
and BYOD devices.
Class Room in a Box Deployed this cost
savings technology for
DJJ and SAO.
Network Upgrades
Added (2) OC12’s to
support video streaming
for the Legislative
Session plus Growth.
Governance IBM Senior VP now
State Of Georgia
Relationship Owner
Tim Shaughnessey.
37
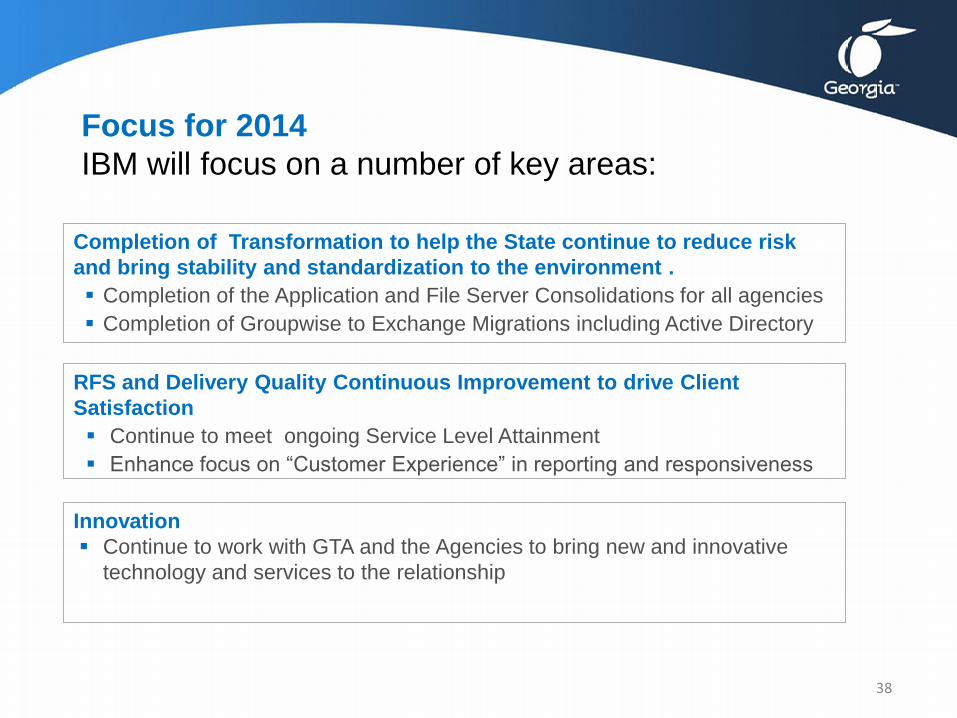
Focus for 2014
IBM will focus on a number of key areas:
Completion of Transformation to help the State continue to reduce risk
and bring stability and standardization to the environment .
Completion of the Application and File Server Consolidations for all agencies
Completion of Groupwise to Exchange Migrations including Active Directory
RFS and Delivery Quality Continuous Improvement to drive Client
Satisfaction
Continue to meet ongoing Service Level Attainment
Enhance focus on “Customer Experience” in reporting and responsiveness
Innovation
Continue to work with GTA and the Agencies to bring new and innovative
technology and services to the relationship
38
Thank You
We appreciate your business
39

Obamacare Update: Impact to GTA
Steve Nichols
State Chief Technology Officer
40

Benefit Programs
Medicare Health insurance for certain
Americans and legal residents
aged 65 and older
Federally administered
Medicaid Health insurance for low
income; pregnant women;
aged/blind/disabled
Jointly administered by
state and federal
government. Ga. Dept.
of Human Services
determines eligibility; Ga.
Dept. of Community
Health processes claims.
Children's Health
Insurance Program
(CHIP)
Health insurance for uninsured
children in families with
incomes that are modest but
too high to qualify for Medicaid
Jointly administered by
state and federal
government. Ga. Dept.
of Community Health
determines eligibility and
processes claims.
41
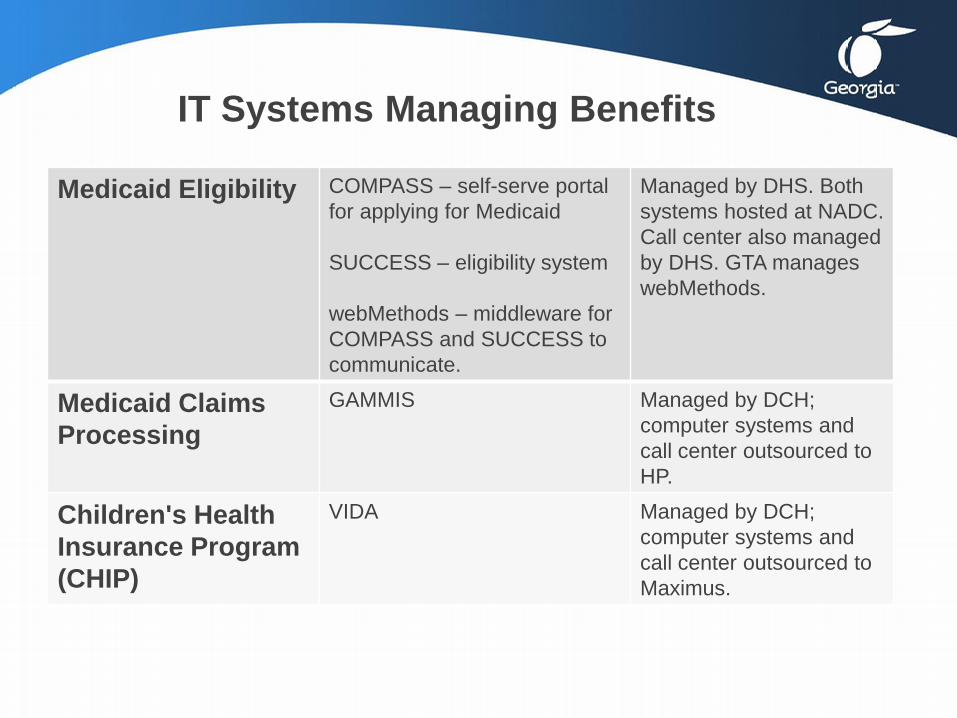
IT Systems Managing Benefits
Medicaid Eligibility COMPASS – self-serve portal
for applying for Medicaid
SUCCESS – eligibility system
webMethods – middleware for
COMPASS and SUCCESS to
communicate.
Managed by DHS. Both
systems hosted at NADC.
Call center also managed
by DHS. GTA manages
webMethods.
Medicaid Claims
Processing
GAMMIS Managed by DCH;
computer systems and
call center outsourced to
HP.
Children's Health
Insurance Program
(CHIP)
VIDA
Managed by DCH;
computer systems and
call center outsourced to
Maximus.

What Is Different Under the
Affordable Care Act?
• Medicaid expansion – increases income threshold to 133% of
federal poverty level (Georgia did not accept the expansion)
• Medicaid simplification – new business rules for calculating
income threshold
• Health Insurance Exchange – healthcare.gov (Georgia did not
build an exchange)
• Small Business Exchanges (SHOP) – State option (Georgia did
not build a SHOP exchange)
• Referrals between exchanges and Medicaid – states refer
applicants to federal exchanges and vice versa
43
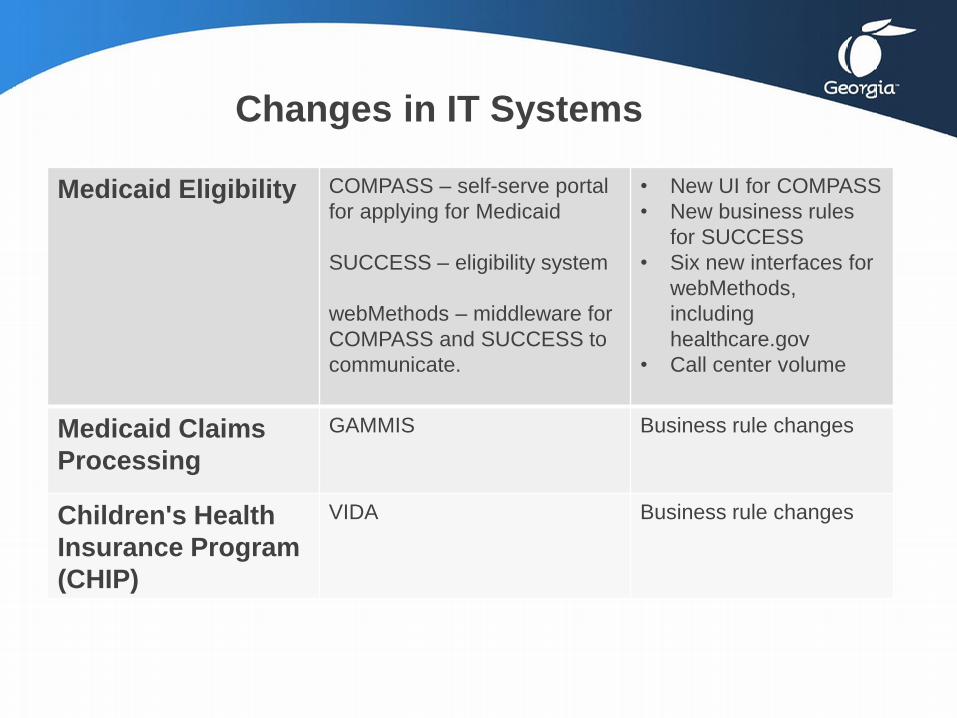
Changes in IT Systems
Medicaid Eligibility COMPASS – self-serve portal
for applying for Medicaid
SUCCESS – eligibility system
webMethods – middleware for
COMPASS and SUCCESS to
communicate.
• New UI for COMPASS
• New business rules
for SUCCESS
• Six new interfaces for
webMethods,
including
healthcare.gov
• Call center volume
Medicaid Claims
Processing
GAMMIS Business rule changes
Children's Health
Insurance Program
(CHIP)
VIDA
Business rule changes

Appendix
45
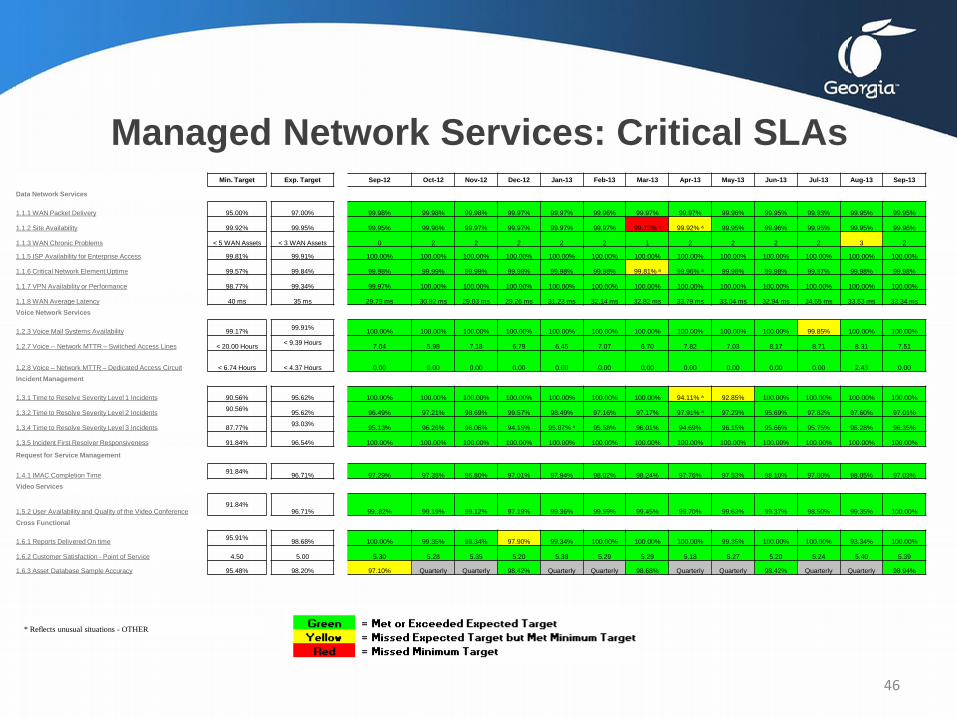
Managed Network Services: Critical SLAs
* Reflects unusual situations - OTHER
Min. Target Exp. Target Sep-12 Oct-12 Nov-12 Dec-12 Jan-13 Feb-13 Mar-13 Apr-13 May-13 Jun-13 Jul-13 Aug-13 Sep-13
Data Network Services
1.1.1 WAN Packet Delivery 95.00%
97.00% 99.98% 99.98% 99.98% 99.97% 99.97% 99.96% 99.97% 99.97% 99.96% 99.95% 99.93% 99.95% 99.95%
1.1.2 Site Availability 99.92%
99.95% 99.95% 99.96% 99.97% 99.97% 99.97% 99.97% 99.73% a 99.92% a 99.95% 99.96% 99.95% 99.95% 99.96%
1.1.3 WAN Chronic Problems < 5 WAN Assets
< 3 WAN Assets 0 2 2 2 2 2 1 2 2 2 2 3 2
1.1.5 ISP Availability for Enterprise Access 99.81% 99.91% 100.00% 100.00% 100.00% 100.00% 100.00% 100.00% 100.00% 100.00% 100.00% 100.00% 100.00% 100.00% 100.00%
1.1.6 Critical Network Element Uptime 99.57% 99.84% 99.98% 99.99% 99.99% 99.98% 99.98% 99.98% 99.81% a 99.96% a 99.98% 99.98% 99.97% 99.98% 99.98%
1.1.7 VPN Availability or Performance 98.77% 99.34% 99.97% 100.00% 100.00% 100.00% 100.00% 100.00% 100.00% 100.00% 100.00% 100.00% 100.00% 100.00% 100.00%
1.1.8 WAN Average Latency 40 ms
35 ms 29.79 ms 30.92 ms 29.03 ms 29.26 ms 31.23 ms 32.14 ms 32.82 ms 33.79 ms 33.04 ms 32.94 ms 34.55 ms 33.53 ms 33.34 ms
Voice Network Services
1.2.3 Voice Mail Systems Availability 99.17% 99.91%
100.00% 100.00% 100.00% 100.00% 100.00% 100.00% 100.00% 100.00% 100.00% 100.00% 99.85% 100.00% 100.00%
1.2.7 Voice -- Network MTTR – Switched Access Lines < 20.00 Hours < 9.39 Hours
7.04 5.98 7.18 6.79 6.45 7.07 6.70 7.82 7.03 8.17 8.71 8.31 7.51
1.2.8 Voice – Network MTTR – Dedicated Access Circuit < 6.74 Hours < 4.37 Hours 0.00 0.00 0.00 0.00 0.00 0.00 0.00 0.00 0.00 0.00 0.00 2.43 0.00
Incident Management
1.3.1 Time to Resolve Severity Level 1 Incidents 90.56% 95.62% 100.00% 100.00% 100.00% 100.00% 100.00% 100.00% 100.00% 94.11% a 92.85% 100.00% 100.00% 100.00% 100.00%
1.3.2 Time to Resolve Severity Level 2 Incidents 90.56%
95.62% 96.49% 97.21% 98.69% 99.57% 98.49% 97.16% 97.17% 97.91% a 97.29% 95.69% 97.82% 97.60% 97.01%
1.3.4 Time to Resolve Severity Level 3 Incidents 87.77% 93.03%
95.13% 96.26% 96.06% 94.15% 95.07% a 95.58% 96.01% 94.69% 96.15% 95.66% 95.75% 96.28% 96.35%
1.3.5 Incident First Resolver Responsiveness 91.84% 96.54% 100.00% 100.00% 100.00% 100.00% 100.00% 100.00% 100.00% 100.00% 100.00% 100.00% 100.00% 100.00% 100.00%
Request for Service Management
1.4.1 IMAC Completion Time 91.84%
96.71% 97.29% 97.38% 96.80% 97.01% 97.94% 98.02% 98.24% 97.76% 97.53% 98.10% 97.00% 98.05% 97.03%
Video Services
1.5.2 User Availability and Quality of the Video Conference 91.84%
96.71% 99..82% 99.19% 99.12% 97.19% 99.36% 99.59% 99.45% 99.70% 99.63% 99.37% 98.50% 99.35% 100.00%
Cross Functional
1.6.1 Reports Delivered On time 95.91%
98.68% 100.00% 99.35% 99.34% 97.90% 99.34% 100.00% 100.00% 100.00% 99.35% 100.00% 100.00% 93.34% 100.00%
1.6.2 Customer Satisfaction - Point of Service 4.50 5.00 5.30 5.28 5.35 5.20 5.38 5.29 5.29 5.18 5.27 5.20 5.24 5.40 5.39
1.6.3 Asset Database Sample Accuracy 95.48% 98.20% 97.10% Quarterly Quarterly 98.42% Quarterly Quarterly 98.68% Quarterly Quarterly 98.42% Quarterly Quarterly 98.94%
46
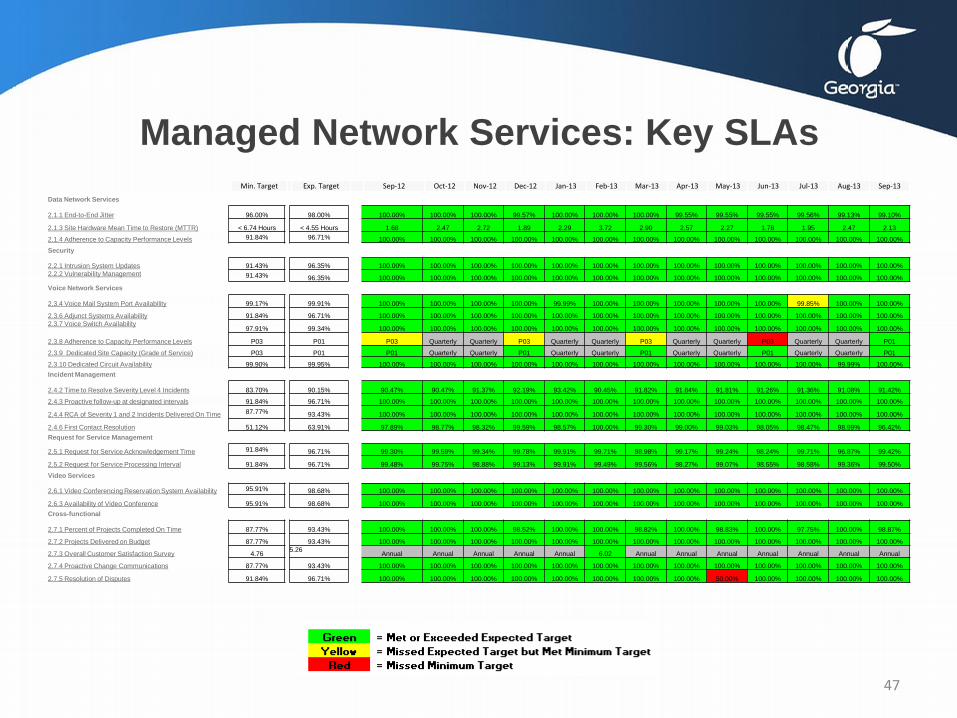
Managed Network Services: Key SLAs
Data Network Services
2.1.1 End-to-End Jitter 96.00% 98.00% 100.00% 100.00% 100.00% 99.57% 100.00% 100.00% 100.00% 99.55% 99.55% 99.55% 99.56% 99.13% 99.10%
2.1.3 Site Hardware Mean Time to Restore (MTTR) < 6.74 Hours < 4.55 Hours 1.68 2.47 2.72 1.89 2.29 3.72 2.90 2.57 2.27 1.78 1.95 2.47 2.13
2.1.4 Adherence to Capacity Performance Levels 91.84% 96.71% 100.00% 100.00% 100.00% 100.00% 100.00% 100.00% 100.00% 100.00% 100.00% 100.00% 100.00% 100.00% 100.00%
Security
2.2.1 Intrusion System Updates 91.43% 96.35% 100.00% 100.00% 100.00% 100.00% 100.00% 100.00% 100.00% 100.00% 100.00% 100.00% 100.00% 100.00% 100.00%
2.2.2 Vulnerability Management 91.43% 96.35% 100.00% 100.00% 100.00% 100.00% 100.00% 100.00% 100.00% 100.00% 100.00% 100.00% 100.00% 100.00% 100.00%
Voice Network Services
2.3.4 Voice Mail System Port Availability 99.17% 99.91% 100.00% 100.00% 100.00% 100.00% 99.99% 100.00% 100.00% 100.00% 100.00% 100.00% 99.85% 100.00% 100.00%
2.3.6 Adjunct Systems Availability 91.84% 96.71% 100.00% 100.00% 100.00% 100.00% 100.00% 100.00% 100.00% 100.00% 100.00% 100.00% 100.00% 100.00% 100.00%
2.3.7 Voice Switch Availability 97.91% 99.34% 100.00% 100.00% 100.00% 100.00% 100.00% 100.00% 100.00% 100.00% 100.00% 100.00% 100.00% 100.00% 100.00%
2.3.8 Adherence to Capacity Performance Levels P03 P01 P03 Quarterly Quarterly P03 Quarterly Quarterly P03 Quarterly Quarterly P03 Quarterly Quarterly P01
2.3.9 Dedicated Site Capacity (Grade of Service) P03 P01 P01 Quarterly Quarterly P01 Quarterly Quarterly P01 Quarterly Quarterly P01 Quarterly Quarterly P01
2.3.10 Dedicated Circuit Availability 99.90% 99.95% 100.00% 100.00% 100.00% 100.00% 100.00% 100.00% 100.00% 100.00% 100.00% 100.00% 100.00% 99.99% 100.00%
Incident Management
2.4.2 Time to Resolve Severity Level 4 Incidents 83.70% 90.15% 90.47% 90.47% 91.37% 92.19% 93.42% 90.45% 91.82% 91.84% 91.81% 91.26% 91.36% 91.08% 91.42%
2.4.3 Proactive follow-up at designated intervals 91.84% 96.71% 100.00% 100.00% 100.00% 100.00% 100.00% 100.00% 100.00% 100.00% 100.00% 100.00% 100.00% 100.00% 100.00%
2.4.4 RCA of Severity 1 and 2 Incidents Delivered On Time 87.77% 93.43% 100.00% 100.00% 100.00% 100.00% 100.00% 100.00% 100.00% 100.00% 100.00% 100.00% 100.00% 100.00% 100.00%
2.4.6 First Contact Resolution 51.12% 63.91% 97.89% 98.77% 98.32% 99.59% 98.57% 100.00% 99.30% 99.00% 99.03% 98.05% 98.47% 98.99% 96.42%
Request for Service Management
2.5.1 Request for Service Acknowledgement Time 91.84% 96.71% 99.30% 99.59% 99.34% 99.78% 99.91% 99.71% 98.98% 99.17% 99.24% 98.24% 99.71% 96.87% 99.42%
2.5.2 Request for Service Processing Interval 91.84% 96.71% 99.48% 99.75% 98.88% 99.13% 99.91% 99.49% 99.56% 98.27% 99.07% 98.55% 98.58% 99.36% 99.50%
Video Services
2.6.1 Video Conferencing Reservation System Availability 95.91% 98.68% 100.00% 100.00% 100.00% 100.00% 100.00% 100.00% 100.00% 100.00% 100.00% 100.00% 100.00% 100.00% 100.00%
2.6.3 Availability of Video Conference 95.91% 98.68% 100.00% 100.00% 100.00% 100.00% 100.00% 100.00% 100.00% 100.00% 100.00% 100.00% 100.00% 100.00% 100.00%
Cross-functional
2.7.1 Percent of Projects Completed On Time 87.77% 93.43% 100.00% 100.00% 100.00% 98.52% 100.00% 100.00% 98.82% 100.00% 98.83% 100.00% 97.75% 100.00% 98.87%
2.7.2 Projects Delivered on Budget 87.77% 93.43% 100.00% 100.00% 100.00% 100.00% 100.00% 100.00% 100.00% 100.00% 100.00% 100.00% 100.00% 100.00% 100.00%
2.7.3 Overall Customer Satisfaction Survey 4.76 5.26 Annual Annual Annual Annual Annual 6.02 Annual Annual Annual Annual Annual Annual Annual
2.7.4 Proactive Change Communications 87.77% 93.43% 100.00% 100.00% 100.00% 100.00% 100.00% 100.00% 100.00% 100.00% 100.00% 100.00% 100.00% 100.00% 100.00%
2.7.5 Resolution of Disputes 91.84% 96.71% 100.00% 100.00% 100.00% 100.00% 100.00% 100.00% 100.00% 100.00% 50.00% 100.00% 100.00% 100.00% 100.00%
Min. Target Exp. Target Sep-12 Oct-12 Nov-12 Dec-12 Jan-13 Feb-13 Mar-13 Apr-13 May-13 Jun-13 Jul-13 Aug-13 Sep-13
47

48
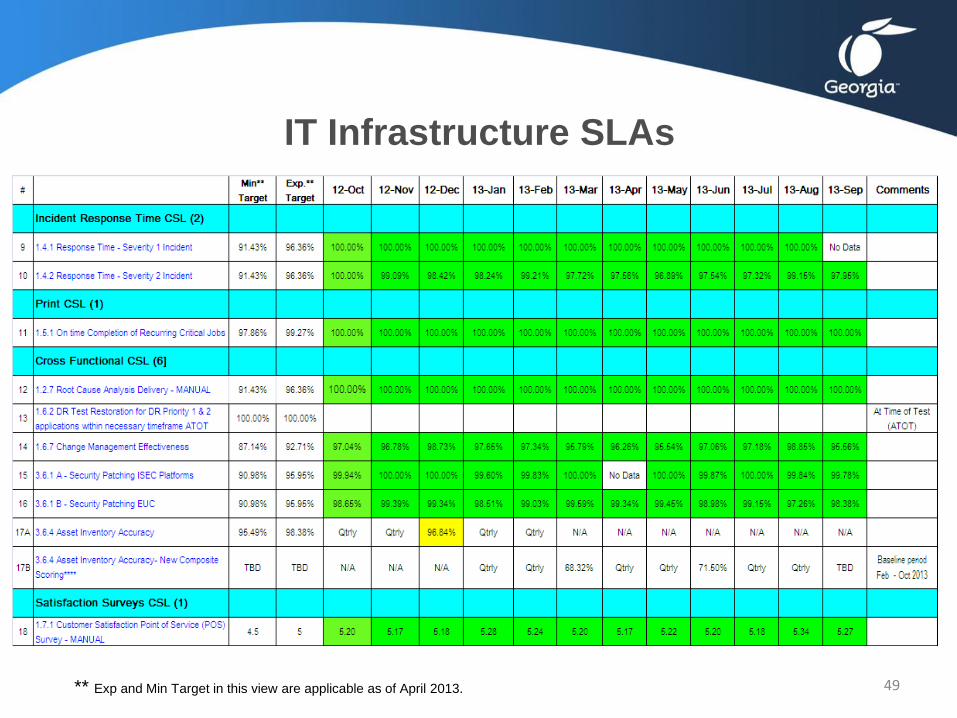
IT Infrastructure SLAs
** Exp and Min Target in this view are applicable as of April 2013.
49
IT Infrastructure SLAs
** Exp and Min Target in this view are applicable as of April 2013.
50
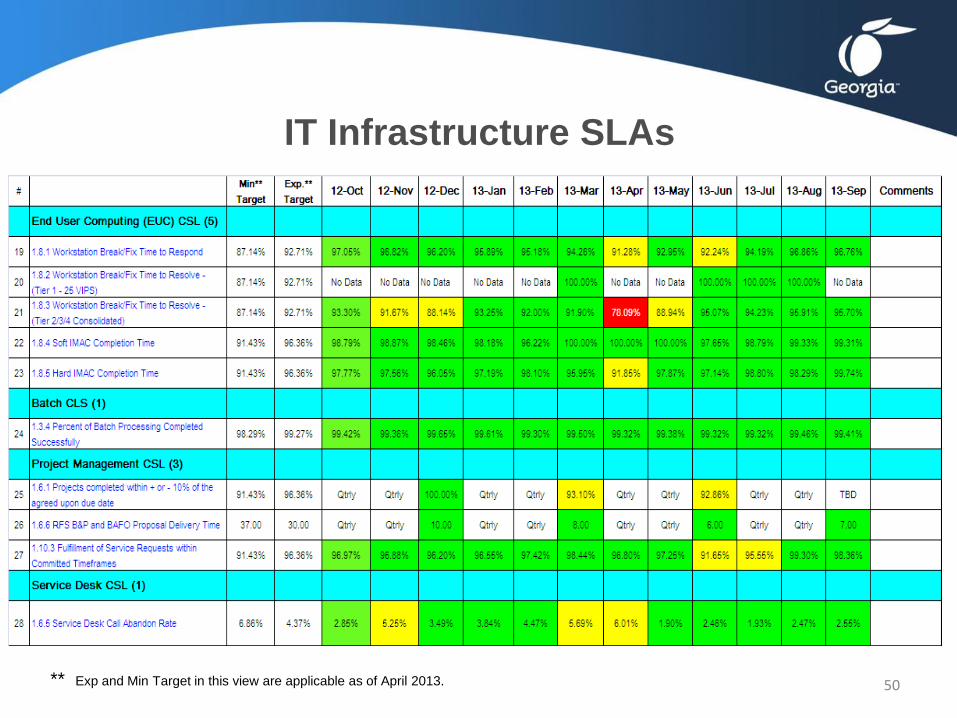
IT Infrastructure SLAs
** Exp and Min Target in this view are applicable as of April 2013.

51
IT Infrastructure SLAs
** Exp and Min Target in this view are applicable as of April 2013.

52
IT Infrastructure SLAs
** Exp and Min Target in this view are applicable as of April 2013.
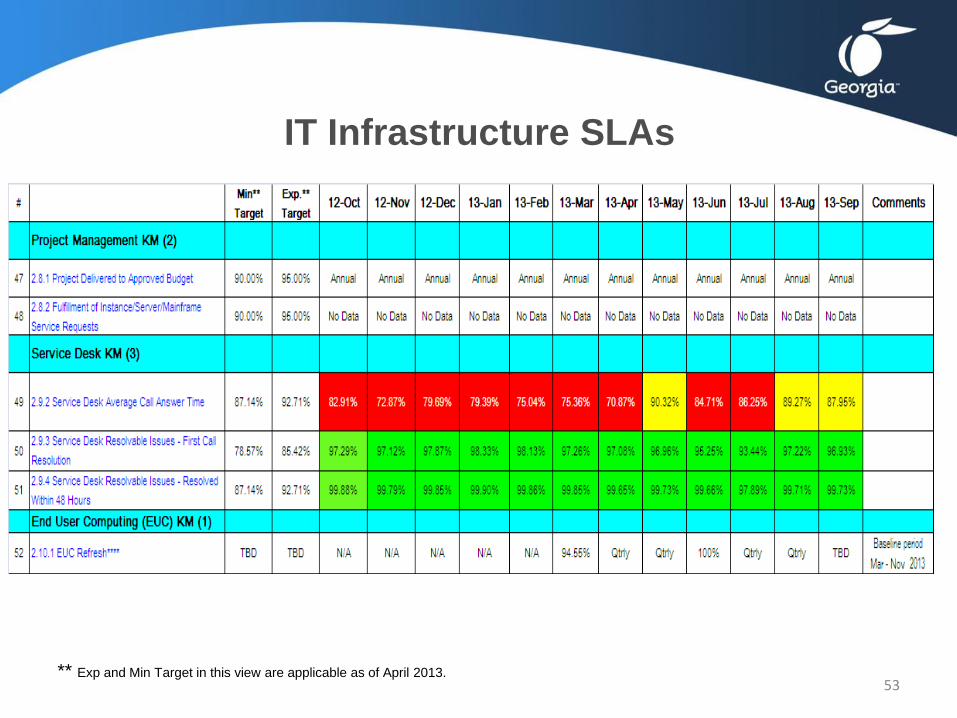
53
IT Infrastructure SLAs
** Exp and Min Target in this view are applicable as of April 2013.