gsma seminar theatre 2015 · gsma seminar: mobile, wifi continuum 3 march 2015 dr. robert pepper...
TRANSCRIPT


GSMA Seminar Theatre 2015Mobile – Wi-Fi
Is there room for both licensed and unlicensed
networks?

Cisco Visual Networking Index (VNI) Forecast Mobile Data Traffic Update, 2014–2019
GSMA Seminar: Mobile, WiFi Continuum
3 March 2015
Dr. Robert PepperVice President - Global Technology Policy

Home
45%*
Work
29%*
Hotspot
16%*
On the go
9%*
Day in a Connected life
*consumption of data by 2019 Source- Cisco VNI
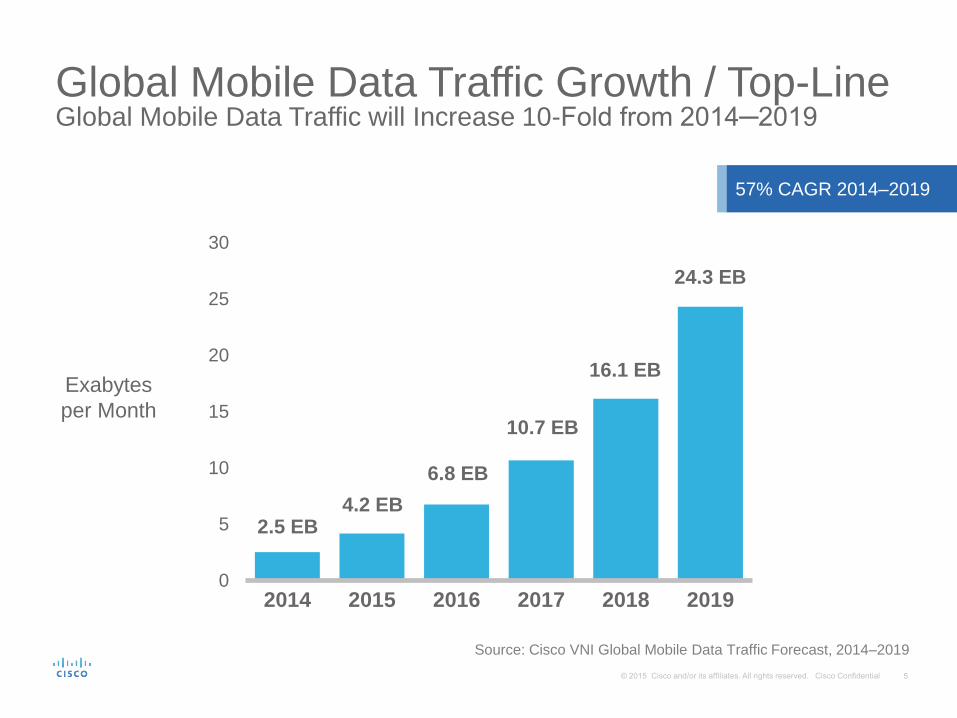
Global Mobile Data Traffic Growth / Top-LineGlobal Mobile Data Traffic will Increase 10-Fold from 2014─2019
Source: Cisco VNI Global Mobile Data Traffic Forecast, 2014–2019
57% CAGR 2014–2019
0
5
10
15
20
25
30
2014 2015 2016 2017 2018 2019
10.8 EB
2.5 EB
10.7 EB
6.8 EB
4.2 EB
16.1 EB
24.3 EB
Exabytes
per Month

Global Mobile Data Traffic Drivers
More Mobile
Connections
More Mobile
Users
Faster Mobile 4G
Speeds
More Mobile
Video
Source: Cisco VNI Global Mobile Data Traffic Forecast, 2014–2019
By 2019:
Mobile Momentum
Metrics
2014 2019
7.4 Billion 11.5 Billion
2014 2019
9.8 Mbps 14.1 Mbps
2014 2019
4.3 Billion 5.2 Billion
2014 2019
55% of Traffic
72% of Traffic

Global Mobile Device Growth by TypeBy 2019, Smartphones Will Attain Largest Share to Reach Nearly 40%
0
2
4
6
8
10
12
2014 2015 2016 2017 2018 2019
Other Portable Devices (0.2%,0.2%) Tablets (1%,3%)
Laptops (3%,2%) M2M (7%,28%)
Smartphones (29%,40%) Non-Smartphones (61%,27%)
9% CAGR 2014–2019
Source: Cisco VNI Global Mobile Data Traffic Forecast, 2014–2019
Billions of
Devices
* Figures (n) refer to 2014 and 2019 device shares
VNI Mobile Forecast Update, 2014–2019 Top Mobile Networking Trends
4G Takes Off
WiFi and off-loading becoming more essential
Video driving consumption
Wild Cards: VoWiFi and Low Power M2M WANs

0
1
2
3
4
5
6
7
2013 2014 2015 2016 2017 2018
Bill
ions o
f D
evic
es o
r C
onn
ectio
ns
4G 3G 2G
Global Connections by Network Type2G, 3G, and 4G Technology Connection Share
59%
68%
29%
3%
26%
15%
Source: Cisco VNI Global Mobile Data Traffic Forecast, 2013–2018
LAST YEAR

0.0
1.0
2.0
3.0
4.0
5.0
6.0
2014 2015 2016 2017 2018 2019
2G 3G 4G
Global Connections by Network Type2G, 3G, and 4G Technology Connection Share
48.2%
62%
32%
6%
28.5%
23.3%
Billions of
Devices or
Connections
Source: Cisco VNI Global Mobile Data Traffic Forecast, 2014–2019

0
50
100
150
200
250
300
350
400
2013 2014 2015 2016 2017 2018
Mill
ion
s o
f D
evic
es o
r C
onn
ectio
ns
4G 3G 2G
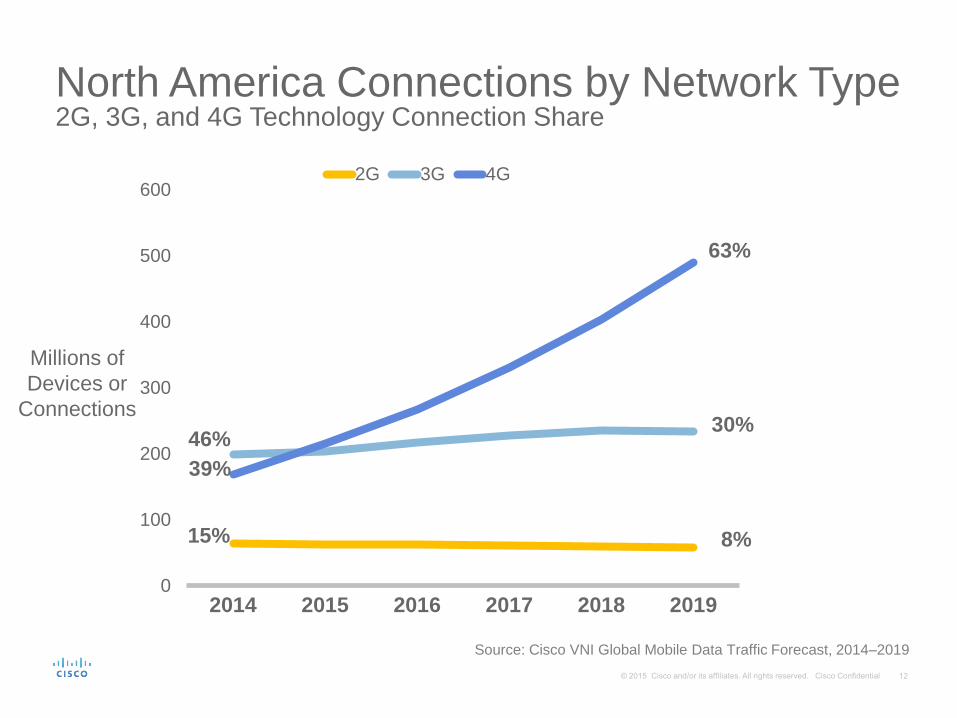
North America Connections by Network Type2G, 3G, and 4G Technology Connection Share
51%
62%
13%
25%
42%
7%
Source: Cisco VNI Global Mobile Data Traffic Forecast, 2013–2018
LAST YEAR
0
100
200
300
400
500
600
2014 2015 2016 2017 2018 2019
2G 3G 4G
North America Connections by Network Type2G, 3G, and 4G Technology Connection Share
63%
46%
39%
15%
30%
8%
Millions of
Devices or
Connections
Source: Cisco VNI Global Mobile Data Traffic Forecast, 2014–2019

0
100
200
300
400
500
600
2013 2014 2015 2016 2017 2018
Mill
ion
s o
f D
evic
es o
r C
onn
ectio
ns
4G 3G 2G
Western Europe Connections by Network Type2G, 3G, and 4G Technology Connection Share
60%
66%
32%
2%
24%
16%
Source: Cisco VNI Global Mobile Data Traffic Forecast, 2013–2018
LAST YEAR

0
50
100
150
200
250
300
350
400
450
500
2014 2015 2016 2017 2018 2019
2G 3G 4G
W. Europe Connections by Network Type2G, 3G, and 4G Technology Connection Share
45%
34%
56%
10%
37%
18%
Millions of
Devices or
Connections
Source: Cisco VNI Global Mobile Data Traffic Forecast, 2014–2019

0
100
200
300
400
500
600
700
2013 2014 2015 2016 2017 2018
Millio
ns o
f D
evic
es o
r C
on
necti
on
s
4G 3G 2G
Latin America Connections by Network Type2G, 3G, and 4G Technology Connection Share
64%
74%
25%
0.1%
27%
9%
Source: Cisco VNI Global Mobile Data Traffic Forecast, 2013–2018
LAST YEAR

0
100
200
300
400
500
600
2014 2015 2016 2017 2018 2019
2G 3G 4G
Latin America Connections by Network Type2G, 3G, and 4G Technology Connection Share
55%66%
33%
1%
23%
21%
Millions of
Devices or
Connections
Source: Cisco VNI Global Mobile Data Traffic Forecast, 2014–2019

0
1
1
2
2
3
3
4
2013 2014 2015 2016 2017 2018
Bill
ion
s o
f D
evic
es o
r C
on
ne
ctio
ns
4G 3G 2G
Asia Pacific Connections by Network Type2G, 3G, and 4G Technology Connection Share
58%
74%
2%
24%
29%
13%
Source: Cisco VNI Global Mobile Data Traffic Forecast, 2013–2018
LAST YEAR

0
500
1,000
1,500
2,000
2,500
3,000
2014 2015 2016 2017 2018 2019
2G 3G 4G
Asia Pacific Connections by Network Type2G, 3G, and 4G Technology Connection Share
48%66%
28%
5%
27%25%
Millions of
Devices or
Connections
Source: Cisco VNI Global Mobile Data Traffic Forecast, 2014–2019
0
200
400
600
800
1,000
1,200
2013 2014 2015 2016 2017 2018
Mill
ions o
f D
evic
es o
r C
onnections
4G 3G 2G
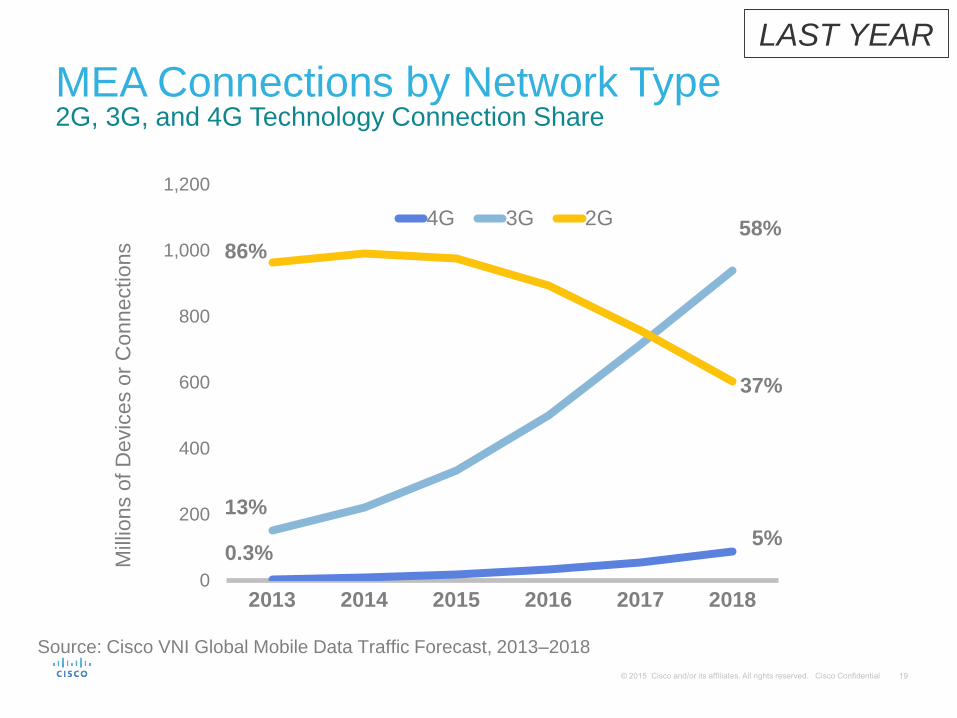
MEA Connections by Network Type2G, 3G, and 4G Technology Connection Share
58%86%
13%
0.3%
37%
5%
Source: Cisco VNI Global Mobile Data Traffic Forecast, 2013–2018
LAST YEAR

0
200
400
600
800
1,000
1,200
2014 2015 2016 2017 2018 2019
2G 3G 4G
MEA Connections by Network Type2G, 3G, and 4G Technology Connection Share
54%80%
19%
1%
32%
14%
Millions of
Devices or
Connections
Source: Cisco VNI Global Mobile Data Traffic Forecast, 2014–2019

0
10
20
30
40
50
60
70
2013 2014 2015 2016 2017 2018
Mill
ion
s o
f D
evic
es o
r C
onn
ectio
ns
4G 3G 2G
Spain Connections by Network Type2G, 3G, and 4G Technology Connection Shares
66%
74%
1%
24%17%
17%
Source: Cisco VNI Global Mobile Data Traffic Forecast, 2013–2018
LAST YEAR

0
5
10
15
20
25
30
35
40
45
2014 2015 2016 2017 2018 2019
2G 3G 4G
Spain Connections by Network Type2G, 3G, and 4G Technology Connection Share
45%
22%
67%
11%
42%
14%
Millions of
Devices or
Connections
Source: Cisco VNI Global Mobile Data Traffic Forecast, 2014–2019
0
5
10
15
20
25
30
35
40
2014 2015 2016 2017 2018 2019
2G 3G 4G
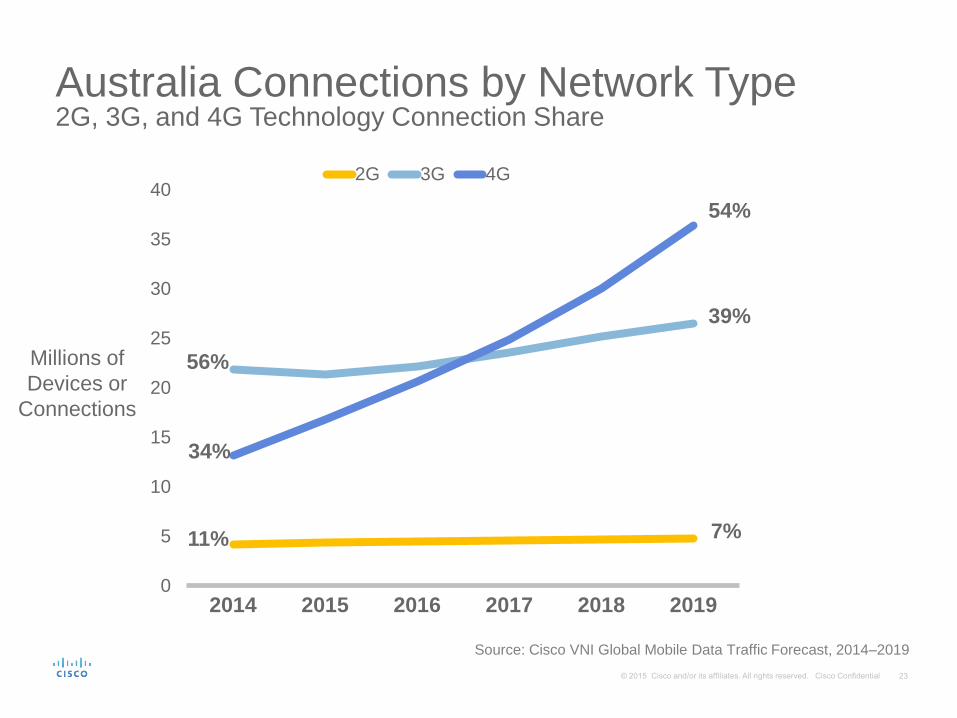
Australia Connections by Network Type2G, 3G, and 4G Technology Connection Share
54%
34%
56%
11%
39%
7%
Millions of
Devices or
Connections
Source: Cisco VNI Global Mobile Data Traffic Forecast, 2014–2019

VNI Mobile Forecast Update, 2014–2019 Top Mobile Networking Trends
4G Takes Off
WiFi and off-loading becoming more essential
Video driving consumption
Wild Cards: VoWiFi and Low Power M2M WANs

0
5
10
15
20
25
30
35
40
45
50
55
60
2014 2015 2016 2017 2018 2019
Cellular Traffic from Mobile Devices
Offload Traffic from Mobile Devices
Global Mobile Data Traffic Offload*54% of Mobile Traffic to be Offloaded by 201946% of Mobile Traffic Offloaded in 2014
46%
54%
Source: Cisco VNI Global Mobile Data Traffic Forecast, 2014–2019
Exabytes
per Month
*Offload includes traffic from dual-mode devices (i.e., supports cell & Wi-Fi, excl. laptops) over Wi-Fi/small cell networks

0
2
4
6
8
10
12
2014 2015 2016 2017 2018 2019
Cellular Traffic from Mobile Devices
Offload Traffic from Mobile Devices
NA Mobile Data Traffic Offload*66% of Mobile Traffic to be Offloaded by 201957% of Mobile Traffic Offloaded in 2014
34%
66%
Source: Cisco VNI Global Mobile Data Traffic Forecast, 2014–2019
Exabytes
per Month
*Offload includes traffic from dual-mode devices (i.e., supports cell & Wi-Fi, excl. laptops) over Wi-Fi/small cell networks

0
1
2
3
4
5
6
7
2014 2015 2016 2017 2018 2019
Cellular Traffic from Mobile Devices
Offload Traffic from Mobile Devices
WE Mobile Data Traffic Offload*61% of Mobile Traffic to be Offloaded by 201945% of Mobile Traffic Offloaded in 2014
39%
61%
Source: Cisco VNI Global Mobile Data Traffic Forecast, 2014–2019
Exabytes
per Month
*Offload includes traffic from dual-mode devices (i.e., supports cell & Wi-Fi, excl. laptops) over Wi-Fi/small cell networks

0
1
2
3
4
2014 2015 2016 2017 2018 2019
Cellular Traffic from Mobile Devices
Offload Traffic from Mobile Devices
LATAM Mobile Data Traffic Offload*46% of Mobile Traffic to be Offloaded by 201935% of Mobile Traffic Offloaded in 2014
54%
46%
Source: Cisco VNI Global Mobile Data Traffic Forecast, 2014–2019
Exabytes
per Month
*Offload includes traffic from dual-mode devices (i.e., supports cell & Wi-Fi, excl. laptops) over Wi-Fi/small cell networks
0
5
10
15
20
2014 2015 2016 2017 2018 2019
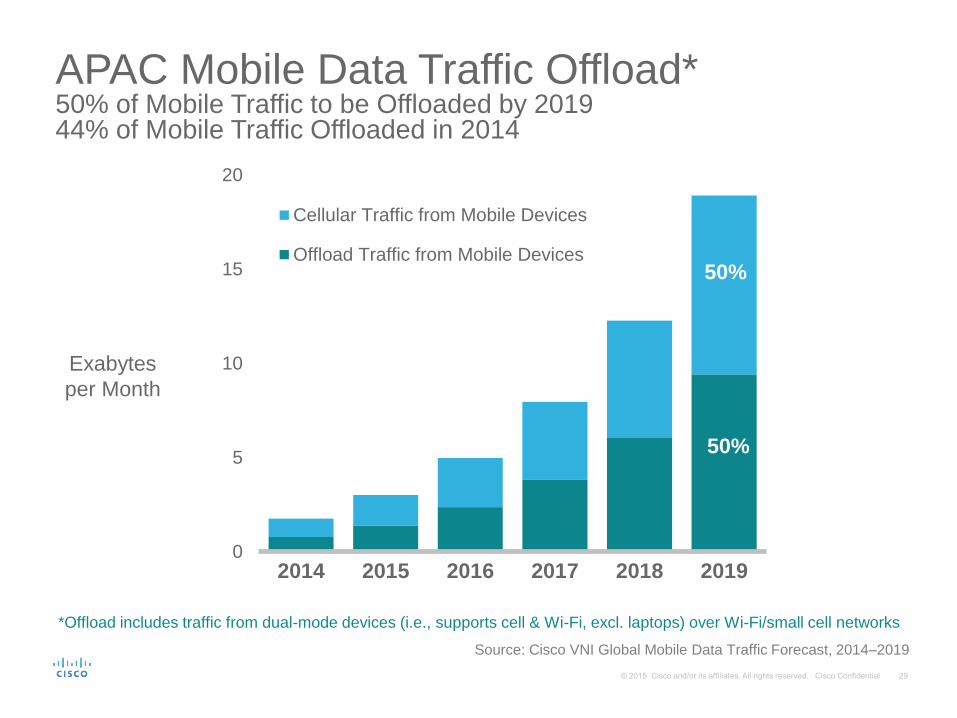
Cellular Traffic from Mobile Devices
Offload Traffic from Mobile Devices
APAC Mobile Data Traffic Offload*50% of Mobile Traffic to be Offloaded by 201944% of Mobile Traffic Offloaded in 2014
50%
50%
Source: Cisco VNI Global Mobile Data Traffic Forecast, 2014–2019
Exabytes
per Month
*Offload includes traffic from dual-mode devices (i.e., supports cell & Wi-Fi, excl. laptops) over Wi-Fi/small cell networks

0
1
2
3
4
5
6
2014 2015 2016 2017 2018 2019
Cellular Traffic from Mobile Devices
Offload Traffic from Mobile Devices
MEA Mobile Data Traffic Offload*38% of Mobile Traffic to be Offloaded by 201929% of Mobile Traffic Offloaded in 2014
62%
38%
Source: Cisco VNI Global Mobile Data Traffic Forecast, 2014–2019
Exabytes
per Month
*Offload includes traffic from dual-mode devices (i.e., supports cell & Wi-Fi, excl. laptops) over Wi-Fi/small cell networks
0
100
200
300
400
2014 2015 2016 2017 2018 2019
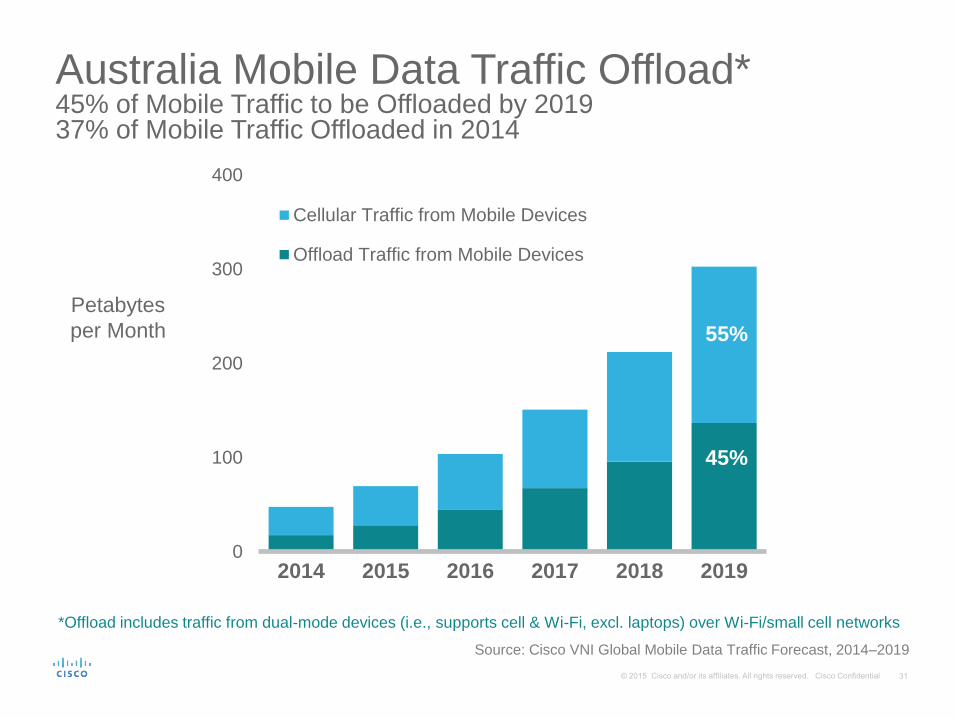
Cellular Traffic from Mobile Devices
Offload Traffic from Mobile Devices
Australia Mobile Data Traffic Offload*45% of Mobile Traffic to be Offloaded by 201937% of Mobile Traffic Offloaded in 2014
55%
45%
Source: Cisco VNI Global Mobile Data Traffic Forecast, 2014–2019
Petabytes
per Month
*Offload includes traffic from dual-mode devices (i.e., supports cell & Wi-Fi, excl. laptops) over Wi-Fi/small cell networks

Global Internet Traffic by Local Access Technology76% Internet Traffic Access is Wireless
Source: Cisco VNI Global IP Traffic Forecast, 2013–2018
Petabytes
per Month
0
20,000
40,000
60,000
80,000
100,000
120,000
2013 2014 2015 2016 2017 2018
Mobile Data (61% CAGR)
Fixed/Wired (10% CAGR)
Fixed/Wi-Fi from Mobile Devices (71% CAGR)
Fixed/Wi-Fi from Wi-Fi Only Devices (19%CAGR) 24%
44%
15%
23% CAGR 2013–2018
17%

Australia Traffic by Local Access Technology77% Internet Traffic Access is Wireless
Source: Cisco VNI Global IP Traffic Forecast, 2013–2018
Petabytes
per Month
0
100
200
300
400
500
600
700
800
900
2013 2014 2015 2016 2017 2018
Mobile Data (63% CAGR)
Fixed/Wired (7% CAGR)
Fixed/Wi-Fi from Mobile Devices (77% CAGR)
Fixed/Wi-Fi from Wi-Fi Only Devices (19% CAGR)23%
56%
13%
22% CAGR 2013–2018
8%

VNI Mobile Forecast Update, 2014–2019 Top Mobile Networking Trends
4G Takes Off
WiFi and off-loading becoming more essential
Video driving consumption
Wild Cards: VoWiFi and Low Power M2M WANs

0
5
10
15
20
25
30
2014 2015 2016 2017 2018 2019
Mobile File Sharing (1%,2%)
Mobile Audio (8%,7%)
Mobile Web/Data/VoIP (36%,19%)
Mobile Video (55%,72%)
Global Mobile Data Traffic Growth / AppsVideo to Exceed 72 Percent of Mobile Data Traffic by 2019
57% CAGR 2014–2019
Source: Cisco VNI Global Mobile Data Traffic Forecast, 2014–2019
Exabytes
per Month
* Figures (n) refer to 2014 and 2019 mobile data traffic shares

0
500
1,000
1,500
2,000
2,500
3,000
3,500
4,000
4,500
2014 2015 2016 2017 2018 2019
Mobile File Sharing (1%,2%)
Mobile Audio (7%,6%)
Mobile Web/Data/VoIP (32%,17%)
Mobile Video (60%,75%)
NA Mobile Data Traffic Growth / AppsVideo to Account for 75 Percent of Mobile Data Traffic by 2019
47% CAGR 2014–2019
Source: Cisco VNI Global Mobile Data Traffic Forecast, 2014–2019
Exabytes
per Month
* Figures (n) refer to 2014, 2019 mobile data traffic share

0
500
1,000
1,500
2,000
2,500
3,000
2014 2015 2016 2017 2018 2019
Mobile File Sharing (1%,2%)
Mobile Audio (7%,6%)
Mobile Web/Data/VoIP (35%,18%)
Mobile Video (56%,74%)
WE Mobile Data Traffic Growth / AppsVideo to Account for 74 Percent of Mobile Data Traffic by 2019
48% CAGR 2014–2019
Source: Cisco VNI Global Mobile Data Traffic Forecast, 2014–2019
Petabytes
per Month
* Figures (n) refer to 2014, 2019 mobile data traffic share
0
500
1,000
1,500
2,000
2,500
3,000
3,500
4,000
2014 2015 2016 2017 2018 2019
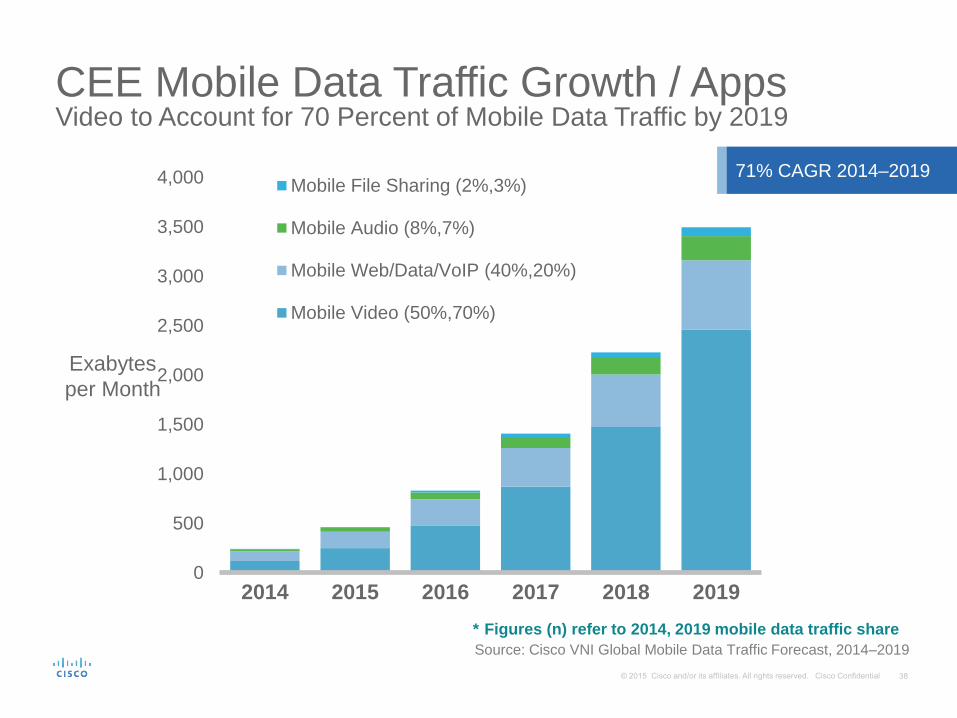
Mobile File Sharing (2%,3%)
Mobile Audio (8%,7%)
Mobile Web/Data/VoIP (40%,20%)
Mobile Video (50%,70%)
CEE Mobile Data Traffic Growth / AppsVideo to Account for 70 Percent of Mobile Data Traffic by 2019
71% CAGR 2014–2019
Source: Cisco VNI Global Mobile Data Traffic Forecast, 2014–2019
Exabytes
per Month
* Figures (n) refer to 2014, 2019 mobile data traffic share

0
500
1,000
1,500
2,000
2,500
2014 2015 2016 2017 2018 2019
Mobile File Sharing (1%,2%)
Mobile Audio (8%,7%)
Mobile Web/Data/VoIP (38%,19%)
Mobile Video (53%,72%)
LATAM Mobile Data Traffic Growth / AppsVideo to Account for 72 Percent of Mobile Data Traffic by 2019
59% CAGR 2014–2019
Source: Cisco VNI Global Mobile Data Traffic Forecast, 2014–2019
Exabytes
per Month
* Figures (n) refer to 2014, 2019 mobile data traffic share

0
1,000
2,000
3,000
4,000
5,000
6,000
7,000
8,000
9,000
10,000
2014 2015 2016 2017 2018 2019
Mobile File Sharing (1%,2%)
Mobile Audio (8%,7%)
Mobile Web/Data/VoIP (37%,20%)
Mobile Video (54%,71%)
APAC Mobile Data Traffic Growth / AppsVideo to Account for 71 Percent of Mobile Data Traffic by 2019
58% CAGR 2014–2019
Source: Cisco VNI Global Mobile Data Traffic Forecast, 2014–2019
Exabytes
per Month
* Figures (n) refer to 2014, 2019 mobile data traffic share

0
500
1,000
1,500
2,000
2,500
3,000
3,500
2014 2015 2016 2017 2018 2019
Mobile File Sharing (2%,3%)
Mobile Audio (8%,7%)
Mobile Web/Data/VoIP (40%,22%)
Mobile Video (50%,68%)
MEA Mobile Data Traffic Growth / AppsVideo to Account for 68 Percent of Mobile Data Traffic by 2019
72% CAGR 2014–2019
Source: Cisco VNI Global Mobile Data Traffic Forecast, 2014–2019
Exabytes
per Month
* Figures (n) refer to 2014, 2019 mobile data traffic share

0
20
40
60
80
100
120
140
160
2014 2015 2016 2017 2018 2019
Average Hour Traffic
Busy Hour Traffic
Busy Hour Mobile Data TrafficBusy Hour Is 64% Higher than Average Hour in 2014, 84% in 2019
Source: Cisco VNI Global Mobile Data Traffic Forecast, 2014–2019
Tbps

VNI Mobile Forecast Update, 2014–2019 Top Mobile Networking Trends
4G Takes Off
WiFi and off-loading becoming more essential
Video driving consumption
Wild Cards: VoWiFi and Low Power M2M WANs

0
1
2
3
4
5
6
7
8
9
2014 2015 2016 2017 2018 2019
VoWiFi VoLTE VoIP
71%
Wild Card: VoWiFi MoU Exceeds VoLTE by 2018VoWiFi Accounts for 53% of Mobile IP Voice by 2019
53%
41%
Minutes of
Use
(Billions) per
Year
Source: ACG, Cisco VNI Global Mobile Data Traffic Forecast, 2014–2019
6%29%

0.0
0.2
0.4
0.6
0.8
1.0
1.2
2014 2015 2016 2017 2018 2019
2G 3G 4G LP M2M
Wild Card: Global M2M Connections By Network Type
35%
67%
32%
1%
29%
23%42%
38%
7%
Billions of
Devices or
Connections
Source: Cisco VNI Global Mobile Data Traffic Forecast, 2014–2019
13%
13%

Key Takeaways
• 4G taking off…3G dominate…2G past peak
• WiFi essential as complement to mobile macro cell networks
• Video driving mobile data
• Need more investment in networks to meet demand
• Need more spectrum—licensed and unlicensed
• Wild cards: new business models

Cisco VNI Mobile Forecast; 2014–2019Get more info—see Tools and Resources
www.cisco.com/go/vni

