gsa bon secour river watershed sedimentation and … · ii geological survey of alabama berry h....
TRANSCRIPT

ANALYSIS OF SEDIMENT LOADING RATES AND WATER QUALITY FOR THE
BON SECOUR RIVER WATERSHED, BALDWIN COUNTY, ALABAMA

ii
GEOLOGICAL SURVEY OF ALABAMA
Berry H. (Nick) Tew, Jr. State Geologist
ANALYSIS OF SEDIMENT LOADING RATES AND WATER QUALITY FOR THE BON SECOUR RIVER WATERSHED,
BALDWIN COUNTY, ALABAMA
OPEN FILE REPORT 1409
By
Marlon R. Cook, Neil E. Moss, Alana L. Rogers, and
Mac McKinney
Funding for this project provided by the Mobile Bay National Estuary Program and the Alabama Department of Conservation and Natural Resources, State
Lands Division, Coastal Section, in part by a grant from the National Oceanic and Atmospheric Administration, Office of Ocean and Coastal Resource
Management, Award # 12NOS4190173.
Tuscaloosa, Alabama 2014

iii
TABLE OF CONTENTS
Introduction ............................................................................................................ 1
Acknowledgments .................................................................................................. 1
Monitored watersheds ............................................................................................. 3
Land use ................................................................................................................. 3
Stream-flow conditions ............................................................................................ 13
Sedimentation ......................................................................................................... 14
Sediment loads transported by monitored streams ........................................... 15
Suspended sediment ................................................................................... 16
Bed sediment ............................................................................................... 17
Total sediment loads .................................................................................... 19
Nutrients ................................................................................................................. 21
Nitrate ................................................................................................................ 22
Phosphorus ....................................................................................................... 23
Metallic constituents ................................................................................................ 23
Organic constituents ............................................................................................... 26
Summary ................................................................................................................ 28
References cited ..................................................................................................... 32
ILLUSTRATIONS
PLATES
Plate 1. Topography and monitored sites for the Bon Secour River
Watershed
Plate 2. Elevation and monitored sites for the Bon Secour River Watershed
Plate 3. 2001 Land-use/land-cover for the Bon Secour River Watershed
Plate 4. 2011 Land-use/land-cover for the Bon Secour River Watershed
FIGURES
Figure 1. Location of Bon Secour monitoring sites and monitored
watersheds ............................................................................................. 2
Figure 2. Changes in average NLCD land use classes from 2001 to
2011 for the entire project area .............................................................. 6

iv
Figure 3. Changes in average NLCD land use classes from 2001 to 2011
for site BS0. ............................................................................................ 7
Figure 4. Changes in average NLCD land use classes from 2001 to 2011
for site BS1 ............................................................................................. 7
Figure 5. Changes in average NLCD land use classes from 2001 to 2011
for site BS2. ............................................................................................ 8
Figure 6. Changes in average NLCD land use classes from 2001 to 2011
for site BS3. ............................................................................................ 8
Figure 7. Changes in average NLCD land use classes from 2001 to 2011
for site BS4. ............................................................................................ 9
Figure 8. Changes in average NLCD land use classes from 2001 to 2011
for site BS5 ............................................................................................. 10
Figure 9. Changes in average NLCD land use classes from 2001 to 2011
for site BS6. ............................................................................................ 11
Figure 10 Changes in average NLCD land use classes from 2001 to 2011
for site BS7. ............................................................................................ 11
Figure 11 Changes in average NLCD land use classes from 2001 to 2011
for site BS8. ............................................................................................ 12
Figure 12 Changes in average NLCD land use classes from 2001 to 2011
for site BS9. ............................................................................................ 13
Figure 13 Bed sediment measured in Bon Secour River site BS3. ........................ 19
Figure 14 Estimates of sediment loads from 30 streams throughout
Alabama. ................................................................................................. 21
Figure 15 Nitrate concentrations at selected sites in the Bon Secour
watershed. .............................................................................................. 22
Figure 16 Phosphorus concentrations at selected sites in the Bon Secour
watershed. .............................................................................................. 24
TABLES
Table 1. Measured area in square miles for the Bon Secour
assessment sites .................................................................................... 3

v
Table 2. Land use data for the Bon Secour sediment assessment
sites (2011 NLCD) .................................................................................. 5
Table 3. Measured stream flow characteristics for monitored sites in
the Bon Secour River watershed ............................................................ 15
Table 4. Measured turbidity, total suspended solids (TSS), and
estimated suspended sediment loads for monitored sites in
the Bon Secour River watershed ............................................................ 17
Table 5. Measured discharge, stream-flow velocity, and estimated
bed sediment loads for monitoring sites on selected streams
in the project area ................................................................................... 19
Table 6. Total estimated sediment loads for monitored streams........................... 20
Table 7. Concentrations of metallic constituents detected in water
samples at selected monitoring sites in the Bon Secour
project area ............................................................................................. 25
Table 8. Measured TOC concentrations at selected sites .................................... 26
Table 9. Measured oil and grease concentrations at selected sites ...................... 27

1
ANALYSIS OF SEDIMENT LOADING RATES AND WATER QUAILTY FOR THE BON SECOUR RIVER WATERSHED,
BALDWIN COUNTY, ALABAMA
INTRODUCTION
Baldwin County is characterized by highly variable surface-water and habitat
quality related to diverse land use, topographic relief, and erodible soils. Previous
investigations of sedimentation by the Geological Survey of Alabama (GSA) have
shown links between patterns of land use and impacts on sediment loads and biological
habitat in watersheds (Cook and others, 2002; Cook, 2005; Cook and Moss, 2007;
Cook and others, 2008; Cook and others, 2009). Sedimentation data are valuable in
quantifying impacts so that remedial plans can be developed and limited regulatory and
remedial resources employed where needs are greatest. Due to the geologic and
hydrologic character of much of Baldwin County, activities associated with land-use
change are particularly effective in promoting erosion and transport of large volumes of
sediment that are eventually deposited in Mobile Bay and the Gulf of Mexico. Parts of
Baldwin County are among the fastest growing areas in Alabama where agricultural and
forested land is being converted to residential and commercial developments.
The purpose of this project is to determine sediment loads and general surface-
water quality for the Bon Secour River watershed in southwestern Baldwin County so
that sources of sediment can be identified and land treatment efforts can be focused on
subwatersheds with excessive erosion and sediment transport or other water-quality
impacts (fig. 1).
ACKNOWLEDGMENTS
Contributors to the completion of this project include Ms. Roberta Swann,
Director, Mobile Bay National Estuary Program; Mr. Phillip Hinesley, Chief, and Ms.
Amy Gohres, Natural Resource Planner, Coastal Section, Alabama State Lands
Division of the Alabama Department of Conservation and Natural Resources; and Ms.
Leslie Gahagan, Environmental Manager, city of Foley.

2
Figure 1.—Location of Bon Secour monitoring sites and monitored watersheds

3
MONITORED WATERSHEDS
The Bon Secour River watershed sedimentation assessment project area is
approximately 58 square miles. Monitoring sites were established in 10 watersheds,
varying in size from approximately 0.5 to 8.8 square miles (mi2) (table 1). The project
area and monitored watersheds are shown on plate 1. Site BS3 monitored the largest
watershed (main stem Bon Secour River) and was located on Baldwin County Road 12,
the last point of access upstream from tidal influence. Sites BS0 (unnamed tributary)
and BS8 (Turkey Creek) were on tributaries upstream from Bon Secour River site BS3.
Sites BS1 and BS2 (unnamed tributaries), BS4 (Shutt Creek), BS5 (School House
Branch), BS6 (Boggy Branch), BS7 (Brights Creek), BS8 (Turkey Creek), and BS9
(unnamed tributary, were on streams with Bon Secour River confluences downstream
from site BS3. Monitoring site designations, stream names, locations, and monitored
areas are shown on plate 1.
LAND USE
Land use is directly correlated with water quality, hydrologic function, ecosystem
health, biodiversity, and the integrity of streams and wetlands. When natural landscapes
are converted to urban, permeable soils are covered with impervious surfaces such as
roads, sidewalks, parking lots, and buildings. Impervious surfaces or cover is defined as
all hard surfaces of watersheds that are impermeable to rainfall infiltration. Increased
Table 1.—Measured area in square miles for the Bon Secour assessment sites.
Monitoring site numbers
Monitored stream name and site locationMonitored watershed
area (mi2)
BS0 Unnamed tributary to Bon Secour River at South Hickory Street 1.7BS1 Unnamed tributary to Bon Secour River at County Road 12 0.9BS2 Unnamed tributary to Bon Secour River at County Road 12 0.6BS3 Bon Secour River at County Road 12 8.8BS4 Shutt Creek at Bon Secour Highway 1.8BS5 School House Branch at Bon Secour Highway 0.8BS6 Boggy Branch at Alabama Highway 59 2.3BS7 Brights Creek at Viola Road 0.5BS8 Turkey Creek at County Road 65 2.9BS9 Unnamed tributary to Bon Secour River at Alabama Highway 59 2.1
4
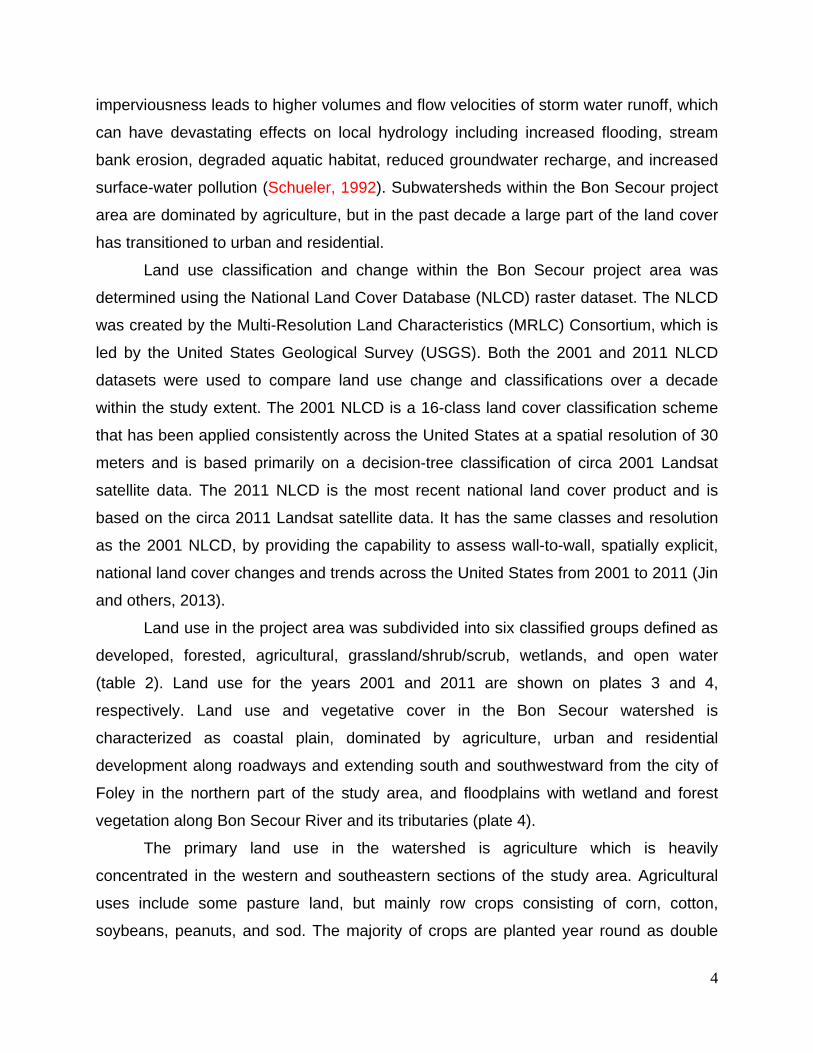
imperviousness leads to higher volumes and flow velocities of storm water runoff, which
can have devastating effects on local hydrology including increased flooding, stream
bank erosion, degraded aquatic habitat, reduced groundwater recharge, and increased
surface-water pollution (Schueler, 1992). Subwatersheds within the Bon Secour project
area are dominated by agriculture, but in the past decade a large part of the land cover
has transitioned to urban and residential.
Land use classification and change within the Bon Secour project area was
determined using the National Land Cover Database (NLCD) raster dataset. The NLCD
was created by the Multi-Resolution Land Characteristics (MRLC) Consortium, which is
led by the United States Geological Survey (USGS). Both the 2001 and 2011 NLCD
datasets were used to compare land use change and classifications over a decade
within the study extent. The 2001 NLCD is a 16-class land cover classification scheme
that has been applied consistently across the United States at a spatial resolution of 30
meters and is based primarily on a decision-tree classification of circa 2001 Landsat
satellite data. The 2011 NLCD is the most recent national land cover product and is
based on the circa 2011 Landsat satellite data. It has the same classes and resolution
as the 2001 NLCD, by providing the capability to assess wall-to-wall, spatially explicit,
national land cover changes and trends across the United States from 2001 to 2011 (Jin
and others, 2013).
Land use in the project area was subdivided into six classified groups defined as
developed, forested, agricultural, grassland/shrub/scrub, wetlands, and open water
(table 2). Land use for the years 2001 and 2011 are shown on plates 3 and 4,
respectively. Land use and vegetative cover in the Bon Secour watershed is
characterized as coastal plain, dominated by agriculture, urban and residential
development along roadways and extending south and southwestward from the city of
Foley in the northern part of the study area, and floodplains with wetland and forest
vegetation along Bon Secour River and its tributaries (plate 4).
The primary land use in the watershed is agriculture which is heavily
concentrated in the western and southeastern sections of the study area. Agricultural
uses include some pasture land, but mainly row crops consisting of corn, cotton,
soybeans, peanuts, and sod. The majority of crops are planted year round as double
5
crops and winter wheat is grown in winter and early spring. A turf (sod/grass seed) farm
is located in the west-central portion of the watershed. Double crops, winter cover
vegetation, and long growing seasons decrease the amount of time the land is bare and
limits erosion from agricultural land.
Average land use change was calculated for the entire project area from 2001 to
2011. Significant changes were observed in the “developed” category, which increased
by 7.8 percent, and the agriculture category, which decreased by 7.6 percent (fig. 2). It
can be inferred that the decrease in agriculture and increase in developed classes
correlate as crop lands were likely converted into urban and residential use. As
previously mentioned, urbanization increases the amount of impervious surfaces in a
watershed, leading to intensified flood events, stream bank erosion, and sedimentation.
The watershed upstream from site BS0 is comprised mainly of developed land
(66 percent) due to its location within the city of Foley where urban land use is most
prominent (fig. 3). There was a 13 percent increase in developed land use in this
watershed from 2001 to 2011. Agriculture is the second largest land use category for
BS0, which decreased 10.8 percent. There were also small decreases in forested land
(0.6 percent), grassland/shrub/scrub (0.6 percent), and wetlands (1 percent). There is
no open water in the watershed.
The watershed upstream from site BS1 consists largely of developed land (46.7
percent) (fig. 4). It is located in the southern portion of Foley, where commercial and
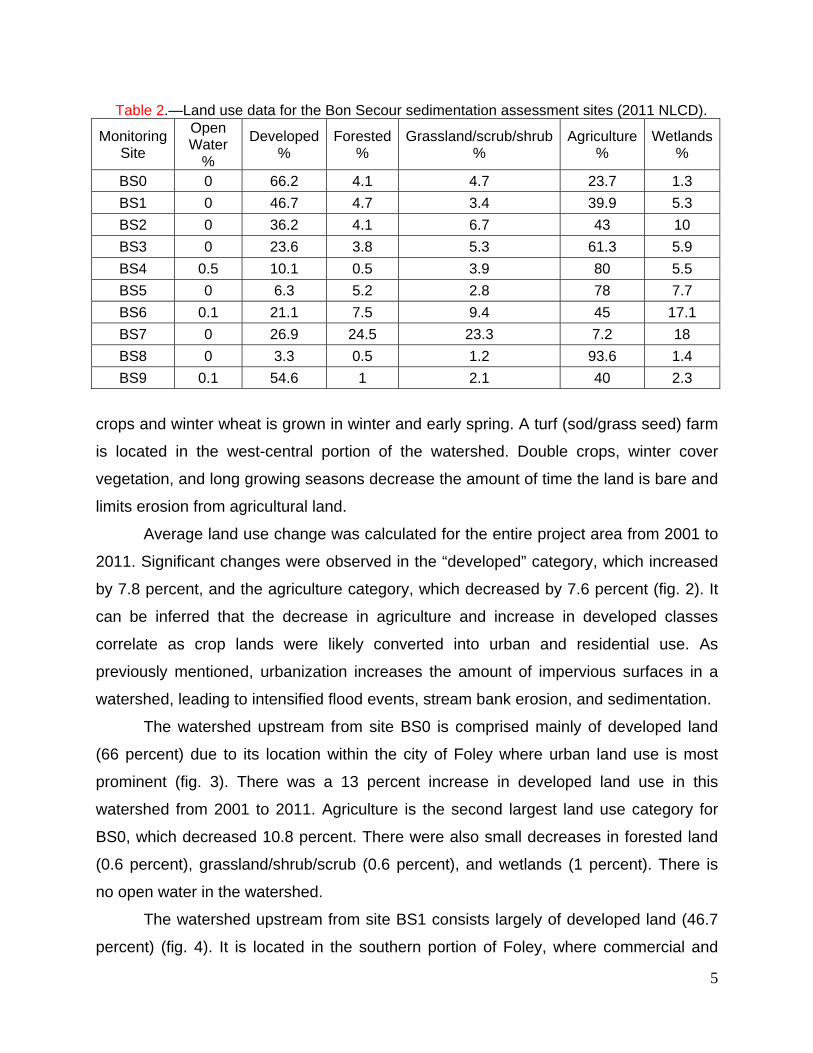
Table 2.—Land use data for the Bon Secour sedimentation assessment sites (2011 NLCD).
Monitoring Site
Open Water
%
Developed %
Forested %
Grassland/scrub/shrub %
Agriculture %
Wetlands %
BS0 0 66.2 4.1 4.7 23.7 1.3
BS1 0 46.7 4.7 3.4 39.9 5.3
BS2 0 36.2 4.1 6.7 43 10
BS3 0 23.6 3.8 5.3 61.3 5.9
BS4 0.5 10.1 0.5 3.9 80 5.5
BS5 0 6.3 5.2 2.8 78 7.7
BS6 0.1 21.1 7.5 9.4 45 17.1
BS7 0 26.9 24.5 23.3 7.2 18
BS8 0 3.3 0.5 1.2 93.6 1.4
BS9 0.1 54.6 1 2.1 40 2.3

6
residential areas extended south of the city. There was a 29.6 percent increase in
developed land use from 2001 to 2011. Agriculture is the second largest land use
category for BS1, which decreased 20.5 percent. There were also small decreases in
forested land (2.2 percent) and grassland/shrub/scrub (7.6 percent). Wetlands
increased by 0.7 percent. There is no open water in the watershed.
The watershed upstream from site BS2 is comprised mainly of agriculture (43
percent) (fig. 5). There was a 20.8 percent decrease in agricultural land use from 2001
to 2011. Developed land (36.2 percent) is the second largest land use category for BS2,
which increased 25.4 percent. There were also small decreases in forested land (1
percent), grassland/shrub/scrub (2.7 percent), and wetlands (1 percent). There is no
open water in the watershed.
The watershed upstream from site BS3 includes the headwaters of Bon Secour
River. It is located in the western portion of the study area which is comprised of heavy
agriculture and row crops classified as agriculture (61.3 percent) (fig. 6). There was a
Figure 2.—Changes in average NLCD land use classes from 2001 to 2011 for the
entire project area.

7
Figure 3.—Changes in average NLCD land use classes from 2001 to 2011 for site BS0.
Figure 4.—Changes in average NLCD land use classes from 2001 to 2011 for site BS1.

8
7.5 percent decrease in agricultural land use from 2001 to 2011. Developed land (23.6
percent) is the second largest land use category for the watershed, which increased 8.5
Figure 5.—Changes in average NLCD land use classes from 2001 to 2011 for site BS2.
Figure 6.—Changes in average NLCD land use classes from 2001 to 2011 for site BS3.
9
percent. There were also small decreases in forested land (0.6 percent) and wetlands
(1.5 percent). Grassland/shrub/scrub increased by 1 percent. There is no open water in
the watershed.
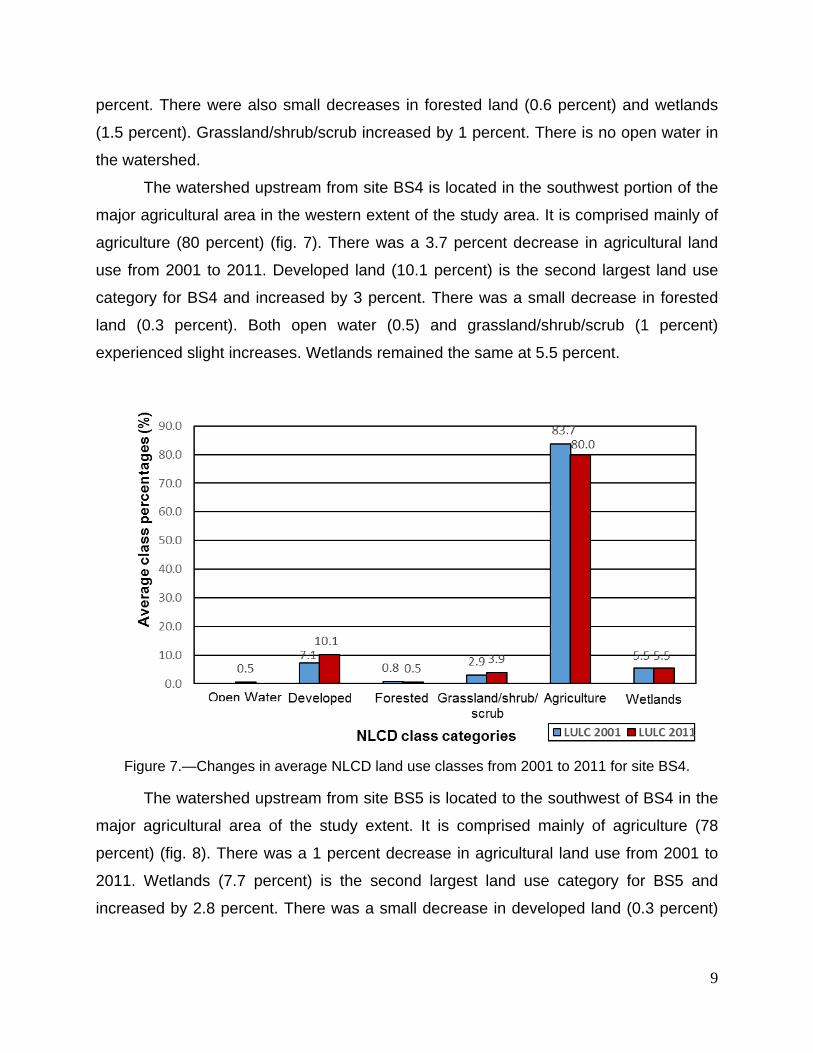
The watershed upstream from site BS4 is located in the southwest portion of the
major agricultural area in the western extent of the study area. It is comprised mainly of
agriculture (80 percent) (fig. 7). There was a 3.7 percent decrease in agricultural land
use from 2001 to 2011. Developed land (10.1 percent) is the second largest land use
category for BS4 and increased by 3 percent. There was a small decrease in forested
land (0.3 percent). Both open water (0.5) and grassland/shrub/scrub (1 percent)
experienced slight increases. Wetlands remained the same at 5.5 percent.
The watershed upstream from site BS5 is located to the southwest of BS4 in the
major agricultural area of the study extent. It is comprised mainly of agriculture (78
percent) (fig. 8). There was a 1 percent decrease in agricultural land use from 2001 to
2011. Wetlands (7.7 percent) is the second largest land use category for BS5 and
increased by 2.8 percent. There was a small decrease in developed land (0.3 percent)
Figure 7.—Changes in average NLCD land use classes from 2001 to 2011 for site BS4.

10
and forested land (2.9 percent). Grassland/shrub/scrub increased by 1.4 percent. There
is no open water in the watershed.
The watershed upstream from site BS6 is located in the southeastern portion of
the study area south of BS9. It is comprised mainly of agriculture (45 percent) (fig. 9).
Agricultural land use decreased 6.8 percent from 2001 to 2011. Developed land (21.1
percent) is the second largest land use category for BS6 and increased by 12.4 percent.
Forested land (2.9), grassland/shrub/scrub (1.4), and wetlands (1.2) experienced slight
decreases within the decade. Open water increased by 0.1 percent.
The watershed upstream from site BS7 is located in the southeastern portion of
the study extent south of BS6. It is comprised mainly of developed land (26.9 percent)
(fig. 10). Developed land use increased slightly by 0.9 percent from 2001 to 2011.
Forested land (24.5 percent) is the second largest land use category for BS7 and
decreased by 11.8 percent. Grassland/shrub/scrub increased by 1.2 percent, wetlands
increased by 11.3 percent, and agriculture decreased by 1.6 percent. There is no open
water in the watershed.
Figure 8.—Changes in average NLCD land use classes from 2001 to 2011 for site BS5.

11
The watershed upstream from site BS8 is located in the western portion of the
Figure 9.—Changes in average NLCD land use classes from 2001 to 2011 for site BS6.
Figure 10.—Changes in average NLCD land use classes from 2001 to 2011 for site BS7.

12
study extent within the main agricultural area. It is almost entirely comprised of
agricultural land (93.6 percent) (fig. 11). Agricultural land use decreased slightly by 1.1
percent from 2001 to 2011. Developed land (3.3 percent) is the second largest land use
category for BS8 and remained constant over the past decade. Grassland/shrub/scrub
increased by 0.9 percent, wetlands increased by 0.5 percent, and forested land
decreased by 0.4 percent. There is no open water in the watershed.
The watershed upstream from site BS9 is located in the northeastern portion of
the study extent. It is comprised mainly of developed land (54.6 percent) because it is
located in the southern outskirts of the city of Foley where urban land use is prominent.
There was a 26.7 percent increase in developed land use from 2001 to 2011 (fig. 12).
Agriculture is the second largest land use category for BS9 and decreased by 18.7
percent. There were also small decreases in forested land (3.4 percent),
grassland/shrub/scrub (3 percent), and wetlands (1.5 percent). Open water remained
constant over the decade at 0.1 percent.
Figure 11.—Changes in average NLCD land use classes from 2001 to 2011 for site BS8.

13
STREAM-FLOW CONDITIONS
Precipitation, stream gradient, geology, and land use are all important factors
that influence discharge, sediment transport, and water quality of streams. Water quality
conditions in the Bon Secour watershed are segregated by particular stream segments
based on instream conditions that are influenced by topography and soils, impervious
surfaces, construction activities, and associated erosion prevention and runoff
management efforts. Estimates of sediment loads are based on measured sediment
and stream discharge. Stream discharge at sites BS1 and BS2 (unnamed tributaries) is
intermittent and extremely flashy, resulting from the relatively small catchments and
intensity of individual rainfall events. Discharge at sites BS0 (unnamed tributary), BS6
(Boggy Branch), and BS9 (unnamed tributary) originates as runoff from the city of Foley
and is extremely flashy, characterized by minimal base flow due to expansive
impervious surfaces, resulting in small discharge and low flow velocities (BS0 is
intermittent) during dry periods and relatively large discharge and high velocities during
storm events.
Figure 12.—Changes in average NLCD land use classes from 2001 to 2011 for site BS9.

14
Site BS3 (Bon Secour River at Baldwin County Road 12) was outfitted with an
Ott Orpheus Mini pressure transducer and data logger, which recorded water levels at
30 minute intervals from February 19, 2013 to May 22, 2014. Manual discharge
measurements were made periodically and combined with water levels to produce a
rating table for the site that was used to calculate average daily discharge. Site 3
discharge data, along with measured discharge and watershed drainage area upstream
from each monitoring site were used to estimate average daily discharge for all
monitored streams (table 2). Evaluation of discharge for each monitored watershed
indicates that land use and size of areas covered by impervious surfaces are the major
influences on volume and velocity of stream flow. With the exception of site BS3 (main
stem of Bon Secour River), discharge for sites BS0, BS6, and BS9 have the largest
discharge and when normalized with respect to drainage area (cubic feet per second
per square mile (cfs/mi2)of drainage area, these sites have more than three times higher
discharge than any other monitored site (table 2). Site BS0, a concrete channelized
stream with headwaters in downtown Foley, had an average stream-flow velocity of 7.8
feet per second (ft/s), which is more than twice that of any other monitored site (table 2).
Sediment transport conditions in the Bon Secour River area are segregated by
particular stream segments based on instream conditions influenced by topography and
soils, impoundments (human and beaver constructed), construction and excavation,
and existing erosion prevention and runoff detention efforts. Natural conditions including
precipitation, stream gradient, geology, and vegetative cover are also important factors
that impact sediment transport characteristics of streams.
Estimates of sediment loads are based on regressions determined from
measured sediment and stream discharge. Therefore, a stream-flow dataset composed
of values that vary from base flow to flood is desirable (table 3).
SEDIMENTATION
Sedimentation is a process by which eroded particles of rock are transported
primarily by moving water from areas of relatively high elevation to areas of relatively
low elevation, where the particles are deposited. Upland sediment transport is primarily

15
accomplished by overland flow and rill and gully development. Lowland or flood plain
transport occurs in streams of varying order, where upland sediment joins sediment
eroded from flood plains, stream banks, and stream beds. Erosion rates are accelerated
by human activity related to agriculture, construction, timber harvesting, unimproved
roadways, or any activity where soils or geologic units are exposed or disturbed.
Excessive sedimentation is detrimental to water quality, destroys biological habitat,
reduces storage volume of water impoundments, impedes the usability of aquatic
recreational areas, and causes damage to structures. Sediment loads in streams are
primarily composed of relatively small particles suspended in the water column
(suspended solids) and larger particles that move on or periodically near the streambed
(bed load).
SEDIMENT LOADS TRANSPORTED BY MONITORED STREAMS
The transport rate of sediment is a complex process controlled by a number of
factors primarily related to land use, precipitation runoff, erosion, stream discharge and
flow velocity, stream base level, and physical properties of the sediment. Without
human impact, erosion rates in the watersheds, called the geologic erosion rate, would
be 64 t/mi2/yr (Maidment, 1993). This value allows comparison of estimated sediment
transport rates in monitored streams in the Bon Secour River watershed.
Table 3.—Measured stream flow characteristics for monitored sites in the Bon Secour River watershed.
Site
Average daily
discharge (cfs)
Maximum average daily
discharge (cfs)
Minimum average
daily discharge
(cfs)
Maximum flow
velocity (ft/s)
Average daily runoff
(cfs/mi2)
BS0 25 467 0 7.8 14.5 BS1 1.4 37 0 3.4 1.6 BS2 1.0 33 0 3.5 1.7 BS3 41 572 6.8 0.9 4.7 BS4 1.8 25 0.3 1.2 1.0 BS5 2.6 47 0.5 1.9 3.3 BS6 24 470 0.2 0.8 10.4 BS7 1.8 25 0.3 1.0 3.6 BS8 9.6 135 1.6 1.3 3.3 BS9 29 572 0.2 1.5 13.8

16
Land surface disturbance related to agriculture and urbanization are the primary
causes of excessive erosion and sedimentation in the Bon Secour River watershed. The
monitored watersheds are underlain by highly erodible soils formed from Citronelle
Formation sediments. These soils combined flashy runoff from increasing areas of
impervious surfaces and channelized routing of storm water, result in sediment
transport in excess of baseline conditions (geologic erosion rate) in most streams in the
Bon Secour watershed. Excessive sedimentation causes changes in base level
elevation of streams in the watershed and triggers downstream movement of the
material as streams attempt to regain base level equilibrium. The movement of this
material is accelerated by periodic large precipitation events that cause increased
stream flow and stream-flow velocity.
SUSPENDED SEDIMENT
The basic concept of constituent loads in a river or stream is simple. However,
the mathematics of determining a constituent load may be quite complex. The
constituent load is the mass or weight of a constituent that passes a cross-section of a
stream in a specific amount of time. Loads are expressed in mass units (tons or
kilograms) and are considered for time intervals that are relative to the type of pollutant
and the watershed area for which the loads are calculated. Loads are calculated from
concentrations of constituents obtained from analyses of water samples and stream
discharge, which is the volume of water that passes a cross-section of the river in a
specific amount of time.
Suspended sediment is defined as that portion of a water sample that is
separated from the water by filtering. This solid material may be composed of organic
and inorganic particles that include algae, industrial and municipal wastes, urban and
agricultural runoff, and eroded material from geologic formations. These materials are
transported to stream channels by overland flow related to storm-water runoff and
cause varying degrees of turbidity.
Annual suspended sediment loads were estimated using the computer
regression model Regr_Cntr.xls (Regression with Centering) (Richards, 1999). The
program is an Excel adaptation of the U.S. Geological Survey (USGS) seven-parameter
regression model for load estimation (Cohn and others, 1992). The regression with
17
centering program requires TSS concentrations and average daily stream discharge to
estimate annual loads. Although annual average daily discharge for all project streams
was not available from direct measurement, it was estimated by establishing a unit area
discharge or a ratio between periodic measured discharge in project streams and
discharge values for the same times obtained from a temporary GSA stream-flow
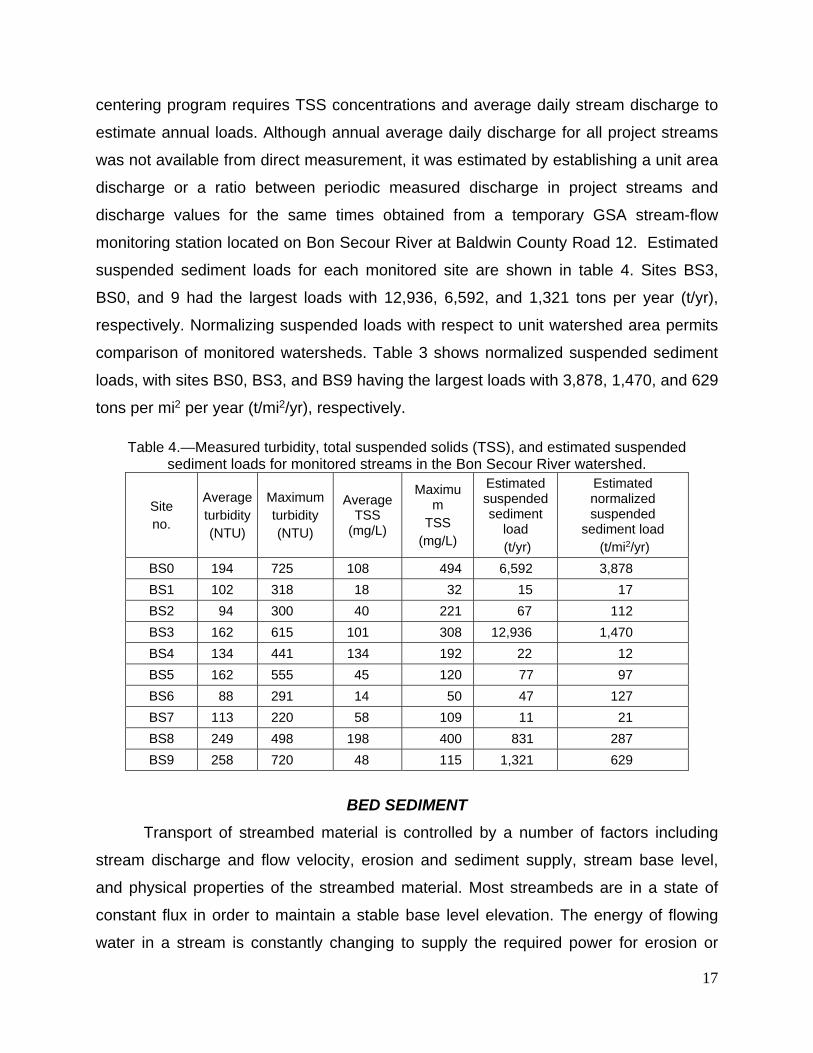
monitoring station located on Bon Secour River at Baldwin County Road 12. Estimated
suspended sediment loads for each monitored site are shown in table 4. Sites BS3,
BS0, and 9 had the largest loads with 12,936, 6,592, and 1,321 tons per year (t/yr),
respectively. Normalizing suspended loads with respect to unit watershed area permits
comparison of monitored watersheds. Table 3 shows normalized suspended sediment
loads, with sites BS0, BS3, and BS9 having the largest loads with 3,878, 1,470, and 629
tons per mi2 per year (t/mi2/yr), respectively.
BED SEDIMENT
Transport of streambed material is controlled by a number of factors including
stream discharge and flow velocity, erosion and sediment supply, stream base level,
and physical properties of the streambed material. Most streambeds are in a state of
constant flux in order to maintain a stable base level elevation. The energy of flowing
water in a stream is constantly changing to supply the required power for erosion or
Table 4.—Measured turbidity, total suspended solids (TSS), and estimated suspended sediment loads for monitored streams in the Bon Secour River watershed.
Site no.
Average turbidity (NTU)
Maximum turbidity (NTU)
Average TSS
(mg/L)
Maximum
TSS (mg/L)
Estimated suspended sediment
load (t/yr)
Estimated normalized suspended
sediment load (t/mi2/yr)
BS0 194 725 108 494 6,592 3,878
BS1 102 318 18 32 15 17
BS2 94 300 40 221 67 112
BS3 162 615 101 308 12,936 1,470
BS4 134 441 134 192 22 12
BS5 162 555 45 120 77 97
BS6 88 291 14 50 47 127
BS7 113 220 58 109 11 21
BS8 249 498 198 400 831 287
BS9 258 720 48 115 1,321 629

18
deposition of bed load to maintain equilibrium with the local water table and regional or
global sea level. Stream base level may be affected by regional or global events
including fluctuations of sea level or tectonic movement. Local factors affecting base
level include fluctuations in the water table elevation, changes in the supply of sediment
to the stream caused by changing precipitation rates, and/or land use practices that
promote excessive erosion in the floodplain or upland areas of the watershed.
Bed sediment is composed of particles that are too large or too dense to be
carried in suspension by stream flow. These particles roll, tumble, or are periodically
suspended as they move downstream. Traditionally, bed load sediment has been
difficult to quantify due to deficiencies in monitoring methodology or inaccuracies of
estimating volumes of sediment being transported along the streambed. This is
particularly true in streams that flow at high velocity or in streams with excessive
sediment loads.
The Geological Survey of Alabama developed a portable bed load sedimentation
rate-monitoring device to accurately measure bed sediment in shallow sand or gravel
bed streams (fig. 13) (Cook and Puckett, 1998). The device was utilized during this
project to measure bed load periodically over a range of discharge events to calculate
daily bed load sedimentation rates. However, bed sediment is of minimal importance in
the monitored watersheds as all monitored sites except BS3 and BS4 are characterized
by stream channelization and discharge conditions that cause sediment to be
suspended and therefore the total sediment loads for these sites are included previously
as suspended loads (table 4).
As with suspended sediment, it is possible to use discharge/sediment
relationships to develop regression models to determine mean daily bed load volumes
and annual bed sediment loads. Table 5 gives average daily discharge, maximum
stream-flow velocity, annual bed sediment loads, and normalized annual bed sediment
loads for sites BS3 and BS4. Sites BS3 and BS4 had estimated bed sediment loads of
539 and 276 tons per year (t/yr), respectively. After normalization of bed sediment
loads, sites BS3 and BS4 had loads of 61 and 153 t/mi 2/yr, respectively.

19
TOTAL SEDIMENT LOADS
Total sediment loads are composed of suspended and bed sediment. As
discussed previously, much of the erosion in the project watersheds is caused by
human activity. Numerous commercial and residential construction projects were
ongoing in the project area during the monitoring period. Without human impact, erosion
rates in the watersheds, called the geologic erosion rate, would be 64 t/mi2/yr
(Maidment, 1993). The geologic erosion rates for the project watersheds are shown in
table 6.
Figure 13.—Bed sediment measured in Bon Secour River site BS3.
Table 5.—Measured discharge, stream-flow velocity, and estimated bed sediment loads for monitoring sites on selected streams in the project area.
Site no.
Average daily discharge
(cfs)
Maximum stream-flow
velocity (ft/s)
Estimated annual bed sediment loads
(t/yr)
Estimated Normalized annual bed
sediment loads (t/mi2/yr)
BS3 41 0.9 539 61
BS4 1.8 1.2 276 153

20
The largest total annual sediment load (13,475 t/yr) was estimated for site BS3
(table 6). This is not surprising since site BS3 (main stem Bon Secour River) has the
largest drainage area and represents the cumulative load for streams monitored at sites
BS0, BS3, and BS8.
The largest total sediment load for a tributary was site BS0 (unnamed tributary
with headwaters in downtown Foley) with 6,592 t/yr. When the data are normalized,
allowing comparison of sediment loads with respect to unit drainage areas, site BS0 had
the largest load (3,878 t/mi2/yr) (table 6). Table 6 also shows total sediment loads for
each of the monitored stream segments in cubic yards per year.
When normalized total sediment loads are compared with land use trends for
each of the monitored watersheds, causes of excessive erosion and sediment transport
become apparent. Excluding site BS3, which shows cumulative loads from multiple
tributaries, watersheds with the two largest sediment loads (BS0 and BS9) had the
largest area of developed land. The third largest load (BS8) was dominated by
agricultural land use, which was primarily turf farming. Other watersheds (sites BS4,
BS5, and BS6) with dominant agricultural land use (row crop) had relatively small
sediment loads (tables 2, 6).
Table 6.—Total estimated sediment loads for monitored streams. Monitored
site Estimated geologic erosion
rate total sediment load
(t/yr)
Estimated total annual sediment
load (t/yr)
Estimated normalized total annual
sediment load (t/mi 2/yr)
Estimated normalized total annual
sediment load (cubic
yards/yr)
0 109 6,592 3,878 12,207
1 58 15 17 28
2 38 67 112 124
3 563 13,475 1,531 24,953
4 115 296 165 548
5 51 77 97 143
6 147 47 127 87
7 32 11 21 20
8 186 831 287 1,539
9 134 1,321 629 2,446
21
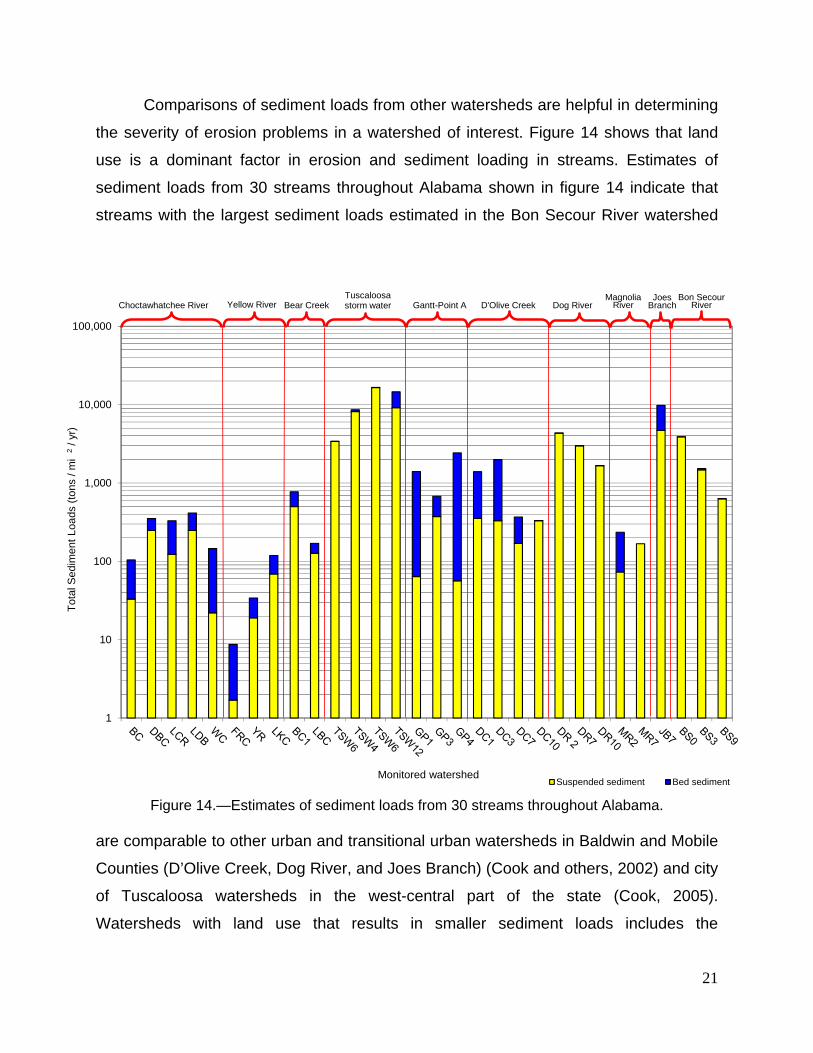
Comparisons of sediment loads from other watersheds are helpful in determining
the severity of erosion problems in a watershed of interest. Figure 14 shows that land
use is a dominant factor in erosion and sediment loading in streams. Estimates of
sediment loads from 30 streams throughout Alabama shown in figure 14 indicate that
streams with the largest sediment loads estimated in the Bon Secour River watershed
are comparable to other urban and transitional urban watersheds in Baldwin and Mobile
Counties (D’Olive Creek, Dog River, and Joes Branch) (Cook and others, 2002) and city
of Tuscaloosa watersheds in the west-central part of the state (Cook, 2005).
Watersheds with land use that results in smaller sediment loads includes the
1
10
100
1,000
10,000
100,000
Tot
al S
edim
ent
Loa
ds (
tons
/ m
i 2
/ yr)
Monitored watershedSuspended sediment Bed sediment
Magnolia River
Bon Secour River Choctawhatchee River Yellow River Bear Creek
Tuscaloosa storm water Dog River Gantt-Point A D'Olive Creek
Joes Branch
Figure 14.—Estimates of sediment loads from 30 streams throughout Alabama.

22
Choctawhatchee River, Bear Creek, and Magnolia River, which is dominated by
agriculture, Gantt-Point A Reservoir tributaries on the Conecuh River where sediment
loads are influenced by unpaved roads, and Yellow River, which is forested.
NUTRIENTS
Excessive nutrient enrichment is a major cause of water-quality impairment.
Excessive concentrations of nutrients, primarily nitrogen and phosphorus, in the aquatic
environment may lead to increased biological activity, increased algal growth,
decreased dissolved oxygen concentrations at times, and decreased numbers of
species (Mays, 1996). Nutrient-impaired waters are characterized by numerous
problems related to growth of algae, other aquatic vegetation, and associated bacterial
strains. Blooms of algae and associated bacteria can cause taste and odor problems in
drinking water and decrease oxygen concentrations to eutrophic levels. Toxins also can
be produced during blooms of particular algal species. Nutrient-impaired water can
dramatically increase treatment costs required to meet drinking water standards.
Nutrients discussed in this report are nitrate (NO3-N) and phosphorus (P-total).
NITRATE
The U.S. Environmental Protection Agency (USEPA) Maximum Contaminant
Level (MCL) for nitrate in drinking water is 10 mg/L. Typical nitrate (NO3 as N)
concentrations in streams vary from 0.5 to 3.0 mg/L. Concentrations of nitrate in
streams without significant nonpoint sources of pollution vary from 0.1 to 0.5 mg/L.
Streams fed by shallow groundwater draining agricultural areas may approach 10 mg/L
(Maidment, 1993). Nitrate concentrations in streams without significant nonpoint
sources of pollution generally do not exceed 0.5 mg/L (Maidment, 1993).
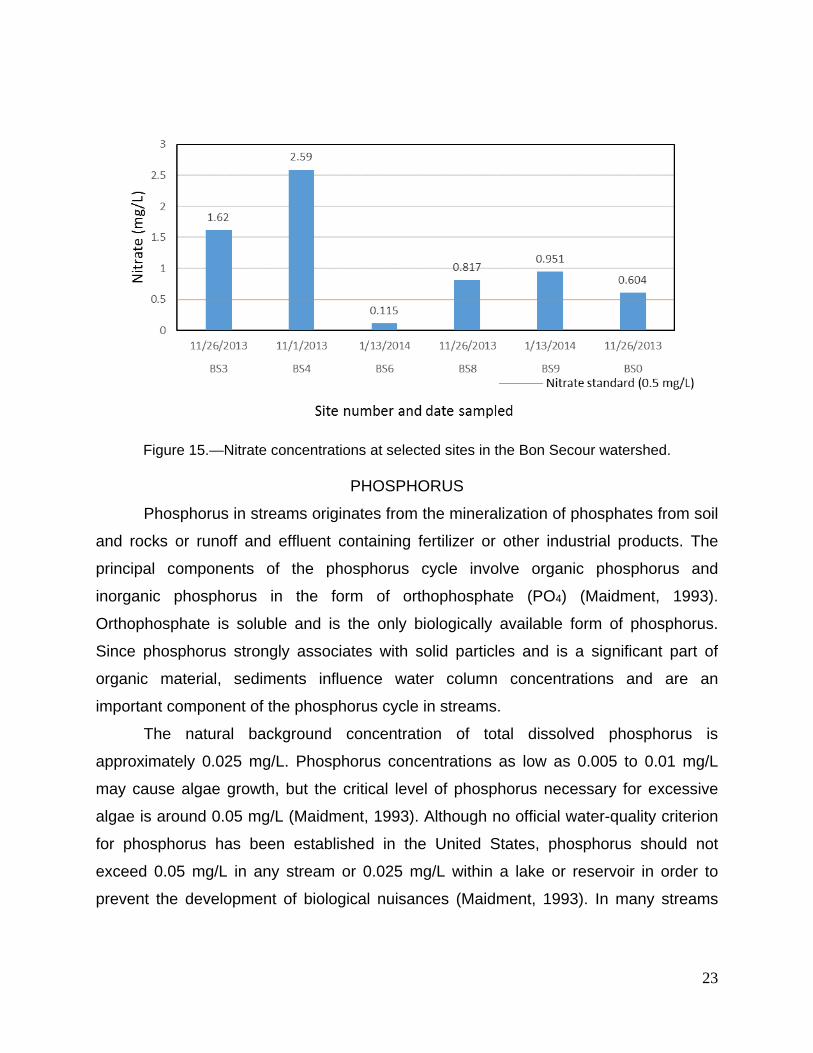
Six sites were sampled for nitrate in the Bon Secour watershed between
November 2013 and January 2014 (fig.15). All sites were sampled during or
immediately after a precipitation event resulting in elevated stream discharges. Five
sites show elevated nitrate levels above the 0.5 mg/L standard with site BS4, sampled
on November 1, 2013 the highest at 2.59 mg/L (fig.15). This may be expected, since 80
percent of the land is used for agriculture. Site SB6, sampled on January 13, 2014, had
the lowest, with a nitrate level of 0.115 mg/L (fig.15).
23
PHOSPHORUS
Phosphorus in streams originates from the mineralization of phosphates from soil
and rocks or runoff and effluent containing fertilizer or other industrial products. The
principal components of the phosphorus cycle involve organic phosphorus and
inorganic phosphorus in the form of orthophosphate (PO4) (Maidment, 1993).
Orthophosphate is soluble and is the only biologically available form of phosphorus.
Since phosphorus strongly associates with solid particles and is a significant part of
organic material, sediments influence water column concentrations and are an
important component of the phosphorus cycle in streams.
The natural background concentration of total dissolved phosphorus is
approximately 0.025 mg/L. Phosphorus concentrations as low as 0.005 to 0.01 mg/L
may cause algae growth, but the critical level of phosphorus necessary for excessive
algae is around 0.05 mg/L (Maidment, 1993). Although no official water-quality criterion
for phosphorus has been established in the United States, phosphorus should not
exceed 0.05 mg/L in any stream or 0.025 mg/L within a lake or reservoir in order to
prevent the development of biological nuisances (Maidment, 1993). In many streams
Figure 15.—Nitrate concentrations at selected sites in the Bon Secour watershed.

24
phosphorus is the primary nutrient that influences excessive biological activity. These
streams are termed “phosphorus limited.”
Six sites were sampled for phosphorus in the Bon Secour watershed between
November 2013 and January 2014 (fig.16). All sites were sampled during or
immediately after a precipitation event resulting in elevated stream discharges. Five
sites show elevated phosphorus levels above the 0.05 mg/L standard with site BS8,
sampled on November 26, 2013 the highest at 0.699 mg/L (fig.16). Site BS4 sampled
on November 1, 2013, was the lowest with a phosphorus level of 0.043 mg/L (fig.16).
METALLIC CONSTITUENTS
The USEPA compiled national recommended water quality criteria for the
protection of aquatic life and human health in surface water for approximately 150
pollutants. These criteria are published pursuant to Section 304(a) of the Clean Water
Act (CWA) and provide guidance for states and tribes to use in adopting water quality
standards (USEPA, 2009). The criteria were developed for acute (short-term exposure)
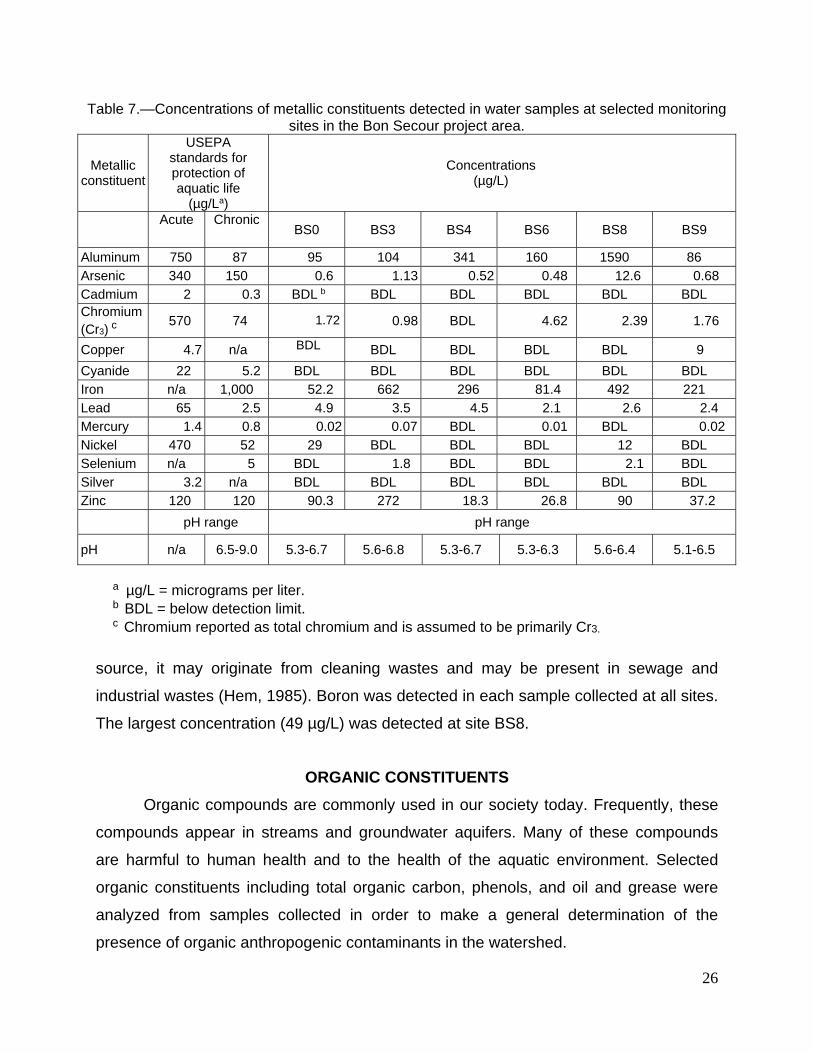
and chronic (long-term exposure) concentrations. Table 7 shows selected metals and
their measured and recommended acute and chronic maximum concentrations.
Figure 16.—Phosphorus concentrations at selected sites in the Bon Secour watershed.

25
Numerous metals are naturally present in streams in small concentrations.
However, toxic metals in streams are generally anthropogenic in origin. Water samples
collected from sites BS0, BS3, BS4, BS6, BS8, and BS9 were analyzed for selected
metallic constituents. Table 7 compares concentrations of samples collected with the
USEPA recommended criteria for protection of aquatic life. The acute protection
standard was exceeded in three samples: aluminum at site BS8, copper at site BS9,
and zinc at site BS3. Elevated concentrations of aluminum are common in Alabama
streams and is related to erosion of clays that naturally contain high concentrations of
aluminum. The chronic standard for aluminum was exceeded at all sites except site BS9
and the chronic standard for lead was exceeded at all sites except sites BS6 and BS9.
The only other chronic standard exceeded was for zinc at site BS3. In addition to
aluminum, lead, copper and zinc, other metals detected in the streams included arsenic,
chromium, iron, mercury, nickel, and selenium (table 7). Iron occurs commonly in
Alabama streams. However, although in small concentrations, arsenic, chromium,
mercury, nickel, and selenium are probably related to industrial components of urban
runoff.
Although not included in USEPA criteria, barium, manganese, and magnesium
were also detected in water samples collected at all sites. These constituents are
common in Alabama streams and are a result of dissolution or erosion of rocks and
sediment.
Although not a metallic constituent, pH is included in table 7 due to its importance
in the occurrence and solubility of metals. Concentrations of hydrogen ions control
speciation of other constituents, influence dissolution and precipitation of chemical
elements, and determine whether the water will support aquatic life. Aquatic organisms
are sensitive to pH change and require a pH of 6.5 to 9. pH in study area streams was
consistently low at all sites and below the USEPA chronic standard criteria in most
instances.
Another nonmetallic constituent detected in collected water samples is boron.
Although no water quality criteria for boron has been established, concentrations as
small as 1 mg/L may be toxic to plant life (Hem, 1985). Boron is naturally associated
with igneous rocks and is present in active volcanic areas. In areas without a natural
26
source, it may originate from cleaning wastes and may be present in sewage and
industrial wastes (Hem, 1985). Boron was detected in each sample collected at all sites.
The largest concentration (49 µg/L) was detected at site BS8.
ORGANIC CONSTITUENTS
Organic compounds are commonly used in our society today. Frequently, these
compounds appear in streams and groundwater aquifers. Many of these compounds
are harmful to human health and to the health of the aquatic environment. Selected
organic constituents including total organic carbon, phenols, and oil and grease were
analyzed from samples collected in order to make a general determination of the
presence of organic anthropogenic contaminants in the watershed.
Table 7.—Concentrations of metallic constituents detected in water samples at selected monitoring sites in the Bon Secour project area.
Metallic constituent
USEPA standards for protection of aquatic life
(µg/La)
Concentrations (µg/L)
Acute Chronic
BS0 BS3 BS4 BS6 BS8 BS9
Aluminum 750 87 95 104 341 160 1590 86
Arsenic 340 150 0.6 1.13 0.52 0.48 12.6 0.68 Cadmium 2 0.3 BDL b BDL BDL BDL BDL BDL Chromium (Cr3) c
570 74 1.72 0.98 BDL 4.62 2.39 1.76
Copper 4.7 n/a BDL BDL BDL BDL BDL 9
Cyanide 22 5.2 BDL BDL BDL BDL BDL BDL Iron n/a 1,000 52.2 662 296 81.4 492 221
Lead 65 2.5 4.9 3.5 4.5 2.1 2.6 2.4 Mercury 1.4 0.8 0.02 0.07 BDL 0.01 BDL 0.02
Nickel 470 52 29 BDL BDL BDL 12 BDL Selenium n/a 5 BDL 1.8 BDL BDL 2.1 BDL
Silver 3.2 n/a BDL BDL BDL BDL BDL BDL Zinc 120 120 90.3 272 18.3 26.8 90 37.2
pH range pH range
pH n/a 6.5-9.0 5.3-6.7 5.6-6.8 5.3-6.7 5.3-6.3 5.6-6.4 5.1-6.5
a µg/L = micrograms per liter. b BDL = below detection limit. c Chromium reported as total chromium and is assumed to be primarily Cr3.

27
Total organic carbon (TOC) analysis is a well-defined and commonly used
methodology that measures the carbon content of dissolved and particulate organic
matter present in water. Many water utilities monitor TOC to determine raw water quality
or to evaluate the effectiveness of processes designed to remove organic carbon. Some
wastewater utilities also employ TOC analysis to monitor the efficiency of the treatment
process. In addition to these uses for TOC monitoring, measuring changes in TOC
concentrations can be an effective surrogate for detecting contamination from organic
compounds (e.g., petrochemicals, solvents, pesticides). Thus, while TOC analysis does
not give specific information about the nature of the threat, identifying changes in TOC
can be a good indicator of potential threats to a hydrologic system (USEPA, 2005).
Typical TOC values for natural waters vary from 1 to 10 mg/L (Mays, 1996). TOC
concentrations from water samples collected from study area sites all fall within typical
values for natural waters (table 8).
Phenols are used in the production of phenolic resins, germicides, herbicides,
fungicides, pharmaceuticals, dyes, plastics, and explosives (Bevans, 1998). Phenols
may occur in domestic and industrial wastewaters, natural waters, and potable water
supplies. The USEPA has set its water quality criteria, which states that phenols should
be limited to 10,400 µg/L (micrograms per liter) (10.4 mg/L) in lakes and streams to
protect humans from the possible harmful effects of exposure (USEPA, 2009). Phenols
cause acute and chronic toxicity to freshwater aquatic life. Study area streams were
found to have no phenols above the laboratory minimum detection level of 3 µg/L.
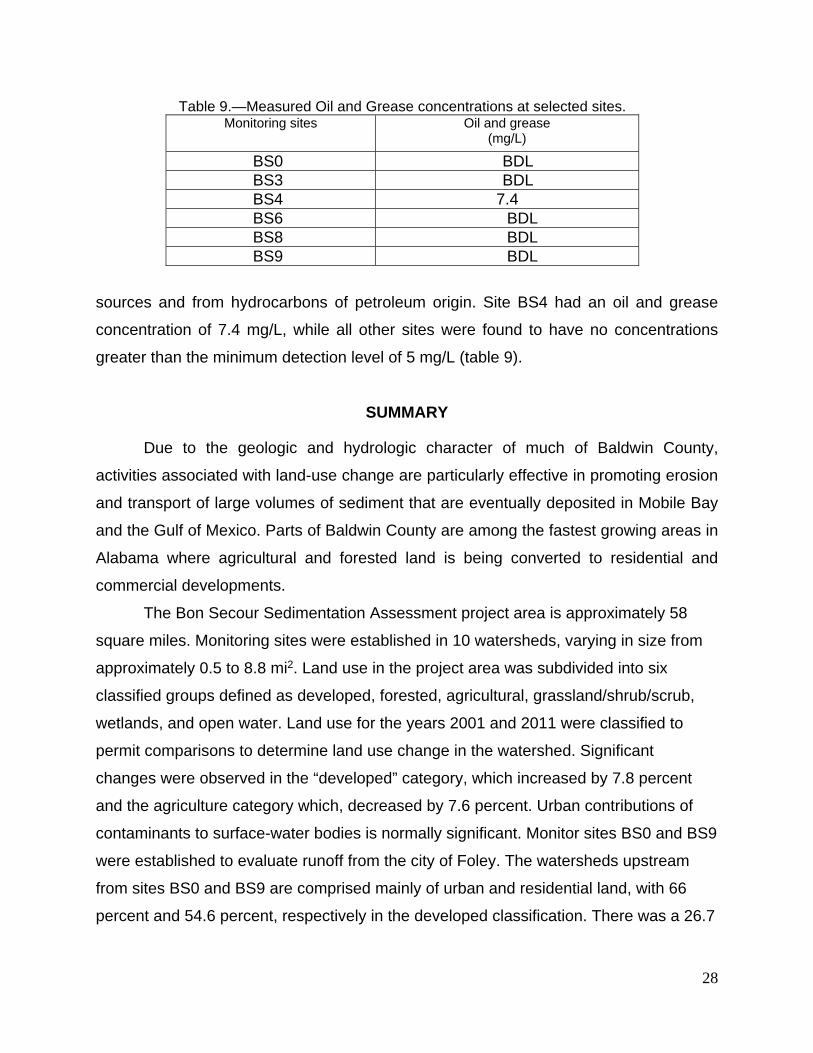
Concentrations of oil and grease were determined for water samples collected
from selected sites. Oil and grease includes fatty matter from animal and vegetable
Table 8.—Measured TOC concentrations at selected sites. Monitoring sites Total Organic Carbon
(mg/L)
BS0 5.0 BS3 6.3 BS4 3.9 BS6 3.8 BS8 9.7 BS9 2.8
28
sources and from hydrocarbons of petroleum origin. Site BS4 had an oil and grease
concentration of 7.4 mg/L, while all other sites were found to have no concentrations
greater than the minimum detection level of 5 mg/L (table 9).
SUMMARY
Due to the geologic and hydrologic character of much of Baldwin County,
activities associated with land-use change are particularly effective in promoting erosion
and transport of large volumes of sediment that are eventually deposited in Mobile Bay
and the Gulf of Mexico. Parts of Baldwin County are among the fastest growing areas in
Alabama where agricultural and forested land is being converted to residential and
commercial developments.
The Bon Secour Sedimentation Assessment project area is approximately 58
square miles. Monitoring sites were established in 10 watersheds, varying in size from
approximately 0.5 to 8.8 mi2. Land use in the project area was subdivided into six
classified groups defined as developed, forested, agricultural, grassland/shrub/scrub,
wetlands, and open water. Land use for the years 2001 and 2011 were classified to
permit comparisons to determine land use change in the watershed. Significant
changes were observed in the “developed” category, which increased by 7.8 percent
and the agriculture category which, decreased by 7.6 percent. Urban contributions of
contaminants to surface-water bodies is normally significant. Monitor sites BS0 and BS9
were established to evaluate runoff from the city of Foley. The watersheds upstream
from sites BS0 and BS9 are comprised mainly of urban and residential land, with 66
percent and 54.6 percent, respectively in the developed classification. There was a 26.7
Table 9.—Measured Oil and Grease concentrations at selected sites. Monitoring sites Oil and grease
(mg/L)
BS0 BDL BS3 BDL BS4 7.4 BS6 BDL BS8 BDL BS9 BDL

29
percent increase in developed land use in the watershed upstream from site BS9
between 2001 and 2011.
Precipitation, stream gradient, geology, and land use are all important factors
that influence discharge, sediment transport, and water quality of streams. Site BS3
(Bon Secour River at Baldwin County Road 12) was outfitted with an Ott Orpheus Mini
pressure transducer and data logger, which recorded water levels at 30 minute intervals
from February 19, 2013, to May 22, 2014. Manual discharge measurements were made
periodically and combined with water levels to produce a rating table for the site that
was used to calculate average daily discharge. Site 3 discharge data, along with
measured discharge and watershed drainage area upstream from each monitoring site
were used to estimate average daily discharge for all monitored streams. Evaluation of
discharge for each monitored watershed indicates that land use and size of areas
covered by impervious surfaces are the major influences on volume and velocity of
stream flow. With the exception of site BS3 (main stem of Bon Secour River), discharge
for sites BS0, BS6, and BS9 have the largest discharge and when normalized with
respect to drainage area (cfs/mi2), these sites have more than three times higher
discharge than any other monitored site. Sediment loads in streams are primarily
composed of relatively small particles suspended in the water column (suspended
solids) and larger particles that move on or periodically near the streambed (bed load).
Sites BS3, BS0, and BS9 had the largest loads with 12,936, 6,592, and 1,321 t/yr,
respectively. Normalizing suspended loads with respect to unit watershed area permits
comparison of monitored watersheds. Normalizing suspended sediment loads shows
that sites BS0, BS3, and BS9 have the largest loads with 3,878, 1,470, and 629 t/mi2/yr.
Sites BS3 and BS4 were the only sites with measurable bed sediment. All other
sites had stream beds that caused most sediment to be suspended so that total loads
for those sites is included in the suspended loads. Sites BS3 and BS4 had estimated
bed sediment loads of 539 and 276 t/yr, respectively. After normalization of bed
sediment loads, sites BS3 and BS4 had loads of 61 and 153 t/mi 2/yr, respectively. The
largest total annual sediment load (13,475 t/yr) was estimated for site BS3, which was
expected since this site was on the main channel of Bon Secour River. When
normalized total sediment loads are compared with land use trends for each of the

30
monitored watersheds, causes of excessive erosion and sediment transport become
apparent. Excluding site BS3, which shows cumulative loads from multiple tributaries,
watersheds with the two largest sediment loads (BS0 and BS9) had the largest area of
developed land. The third largest load (BS8) was dominated by agricultural land use,
which was primarily turf farming. Comparisons of sediment loads from other watersheds
are helpful in determining the severity of erosion problems in a watershed of interest.
Estimates of sediment loads from 30 streams throughout Alabama indicate that streams
with the largest sediment loads estimated in the Bon Secour River watershed are
comparable to other urban and transitional urban watersheds in Baldwin and Mobile
Counties (D’Olive Creek, Dog River, and Joes Branch) and in the city of Tuscaloosa in
the west-central part of the state.
Six sites were sampled for nitrate in the Bon Secour watershed between
November 2013 and January 2014. All sites were sampled during or immediately after a
precipitation event resulting in elevated stream discharges. Five sites show elevated
nitrate levels above the 0.5 mg/L standard with site BS4, sampled on November 1, 2013
the highest at 2.59 mg/L. This may be expected, since 80 percent of the land is used for
agriculture.
Six sites were sampled for phosphorus in the Bon Secour watershed between
November 2013 and January 2014. All sites were sampled during or immediately after a
precipitation event resulting in elevated stream discharges. Five sites show elevated
phosphorus levels above the 0.05 mg/L standard with site BS8, sampled on November
26, 2013 the highest at 0.699 mg/L. The dominant land use (about 94 percent) for the
watershed upstream from site BS8 is agriculture.
Numerous metals are naturally present in streams in small concentrations.
However, toxic metals in streams are generally anthropogenic in origin. Water samples
collected from sites BS0, BS3, BS4, BS6, BS8, and BS9 were analyzed for selected
metallic constituents and compared to the USEPA recommended criteria for protection
of aquatic life. The acute protection standard was exceeded in three samples: aluminum
at site BS8, copper at site BS9, and zinc at site BS3. Elevated concentrations of
aluminum are common in Alabama streams and are related to erosion of clays that
naturally contain high concentrations of aluminum. The chronic standard for aluminum

31
was exceeded at all sites except site BS9 and the chronic standard for lead was
exceeded at all sites except sites BS6 and BS9. The only other chronic standard
exceeded was for zinc at site BS3. In addition to aluminum, lead, copper and zinc, other
metals detected in monitored streams included arsenic, chromium, iron, mercury, nickel,
and selenium. Iron occurs commonly in Alabama streams. However, although in small
concentrations, arsenic, chromium, mercury, nickel, and selenium are probably related
to industrial components of urban runoff.
Previous surface-water quality assessments performed by the Geological Survey
of Alabama have determined that urban runoff has the most deleterious impacts on
streams and habitats. During this assessment, the quality of water in Bon Secour River
and a number of its tributaries was found to be profoundly influenced by agricultural and
urban land uses. Without intervention, as more agricultural, forested and wetland areas
are converted to residential and urban land uses, water quality and biological habitats
will continue to degrade. Implementation of best management practices designed to
prevent erosion from cleared lands and to slow and treat urban runoff can slow and
reverse negative water-quality impacts and restore habitats in the Bon Secour River
watershed and Mobile Bay that provide the quality of life enjoyed by area residents.

32
REFERENCES CITED
Bevans, H. E., Lico, M. S., Lawrence, S. J., 1998, Water quality in the Las Vegas Valley
area and Carson and Truckee Rivers, Nevada and California, 1992-96: U.S.
Geological Survey Circular 1170, Glossary, URL
http://water.usgs.gov/pubs/circ/circ1170/gloss.htm accessed April 1, 2005.
Cohn, T. A., Caulder D. L., Gilroy E. J., Zynjuk, L. D., and Summers, R. M., 1992, The
validity of a simple statistical model for estimating fluvial constituent loads: an
empirical study involving nutrient loads entering Chesapeake Bay: Water
Resources Research, v. 28, p. 2353-2363.
Cook, M. R., and Puckett, T. M., 1998, Section 319 national monitoring program project
for Lightwood Knot Creek watershed in southeast Alabama: A report to the
Alabama Department of Environmental Management, 1997 Annual Report and
Paired Watershed Calibration: Geological Survey of Alabama Open-file Report,
140 p.
Cook, M. R., 2005, Water quality assessment Terrapin Creek, northeast Alabama:
Geological Survey of Alabama Open-file Report, 29 p.
Cook, M. R., Henderson, W. P., Jr., Moss, N. E., and Baker, R. M., 2005, City of
Tuscaloosa storm-water assessment: Geological Survey of Alabama Open-file
Report 0514, 118 p.
Cook, M. R., and Moss, N. E., 2007, Analysis of sediment loading rates and impacts of
unpaved roads on selected tributaries to Gantt and Point A Lakes, Covington
County, Alabama 2002-2007: Geological Survey of Alabama Open-file Report
0703, 40 p.
Cook, M. R., Moss, N. E., and O’Neil, P. E., 2008, Analysis of water quality, sediment
loading rates, biological resources, and impacts of land-use change on the
D’Olive and Tiawasee Creek watersheds, Baldwin County, Alabama 2008:
Geological Survey of Alabama Open-file Report 0811, 85 p.
Cook, M. R., Moss, N. E., and Murgulet, Dorina, 2009, Analysis of sediment loading for
the Magnolia River watershed, Baldwin County, Alabama, 2009: Geological
Survey of Alabama Open-file Report 0914, 22 p.
33
Cook, M. R., O’Neil, P. E., Moss, N. E., and DeJarnette, S., 2002, Assessment of water
resources in the Yellow River watershed in south-central Alabama: Surface water
and biological resources: Geological Survey of Alabama Open-file report, 85 p.
Hem, J. D., 1985, Study and interpretation of the chemical characteristics of natural
waters (3rd ed.): U.S. Geological Survey Water Supply Paper no. 2254, 264 p.
Homer, C., Dewitz, J., Fry, J., Coan, M., Hossain, N., Larson, C., Herold, N., McKerrow,
A., VanDriel, J.N., and Wickham, J., 2007. Completion of the 2001 National
Land Cover Database for the Conterminous United States: Photogrammetric
Engineering and Remote Sensing, vol. 73, no. 4, p.337-341.
Jin, S., Yang, L., Danielson, P., Homer, C., Fry, J., and Xian, G., 2013, A
comprehensive change in detection method for updating the National Land Cover
Database to circa 2011: Remote Sensing of Environment, v.132 p. 159-175.
Maidment, D. R., ed., 1993, Handbook of hydrology: New York, Mcgraw-Hill Inc., p.
11.37-11.54.
Mays, L. W., ed., 1996, Water resources handbook: New York, McGraw-Hill, p. 8.3-
8.49.
Richards, R. P., 1999, Estimation of pollutant loads in rivers and streams: a guidance
document for NPS programs: Heidelberg College.
Schueler, T. R., 1992, Mitigating the adverse impacts of urbanization on streams: a
comprehensive strategy for local government in P. Kimble and T. Schueler,
editors, Watershed Restoration Sourcebook: Metropolitan Washington Council of
Governments, Publication #92701.
U.S. Environmental Protection Agency, 2005, Water and wastewater security product
guide: Chemical sensor – Total organic carbon analyzer, URL
http://www.epa.gov/safewater/watersecurity/guide/chemicalsensortotalorganiccar
bonanalyzer.html accessed April 1, 2005.
U.S. Environmental Protection Agency, 2009, National recommended water quality
criteria: Aquatic life criteria,
http://water.epa.gov/scitech/swguidance/standards/criteria/current/index.cfm#alta
ble#altable.html accessed December 3, 2012.

34
GEOLOGICAL SURVEY OF ALABAMA
P.O. Box 869999 420 Hackberry Lane
Tuscaloosa, Alabama 35486-6999 205/349-2852
Berry H. (Nick) Tew, Jr., State Geologist
A list of the printed publications by the Geological Survey of Alabama can be obtained from the Publications Sales Office (205/247-3636) or through our
web site at http://www.gsa.state.al.us/.
E-mail: [email protected]
The Geological Survey of Alabama (GSA) makes every effort to collect, provide, and maintain accurate and complete information. However, data acquisition and research are ongoing activities of GSA, and interpretations may be revised as new data are acquired. Therefore, all information made available to the public by GSA should be viewed in that context. Neither the GSA nor any employee thereof makes any warranty, expressed or implied, or assumes any legal responsibility for the accuracy, completeness, or usefulness of any information, apparatus, product, or process disclosed in this report. Conclusions drawn or actions taken on the basis of these data and information are the sole responsibility of the user.
As a recipient of Federal financial assistance from the U.S. Department of the Interior, the GSA prohibits discrimination on the basis of race, color, national origin, age, or disability in its programs or activities. Discrimination on the basis of sex is prohibited in federally assisted GSA education programs. If anyone believes that he or she has been discriminated against in any of the GSA’s programs or activities, including its employment practices, the individual may contact the U.S. Geological Survey, U.S. Department of the Interior, Washington, D.C. 20240.
AN EQUAL OPPORTUNITY EMPLOYER
Serving Alabama since 1848