grsg 28th international annual conference · the abstracts and subsequent presentation material for...
TRANSCRIPT
GRSG 28TH INTERNATIONAL
ANNUAL CONFERENCE
APPLIED GEOLOGICALREMOTE SENSING
13th - 15th December 2017
JUpiter Hotel, Lisbon,
Portugal

WELCOME FROM THE GRSG Chair
Dear all, Welcome to the 28th International GRSG conference and welcome to Lisbon!! Each year we are inundated with technical talks and this year was no exception. We have a packed programme with talks across the spectrum of geological remote sensing from ground to UAV to aerial to satellite. We welcome a number of returning speakers but I am delighted that we also have so many new speakers as well including two of this year’s Student Award Winners, both awarded £1,000 to support their continued research. Our keynote speakers this year, David Coulter, Christian Haselwimmer and Jason Manning, need very little introduction as current or past members of the committee and well known within their fields of Mining, Oil&Gas and Engineering. They provide a great starting point to each days mixed programme of talks. For the first time in a number of years we also have a RapidFire session, designed for our Poster presenters to provide a 2 minute introduction to their work which will permanently be displayed at the back of the main conference room. You are invited and encouraged to take your time to see these posters during the breaks and lunch. We are also proud to hold the inaugural GRSG Field Trip this year! This will take us around a number of sites of geologic interest to the west and north west of Lisbon. We look forward to holding similar events in the future. Finally, our networking events are designed to get everyone together and share a great evening of food and conversation. The GRSG prides itself on being a group of professionals but above all enthusiasts across the range of remote sensing geological applications and across all years of experience. We encourage everyone to chat together and join us at some really special social events this year. Above all else have a great conference and the committee are on hand to help answer any questions along the way! Charlotte GRSG Chairman
CONTENTS
Click the link to visit the relevant section of the book:
2017 GRSG COMMITTEE
CONFERENCE SPONSORS
CONFERENCE AGENDA AND LOGISTICS
ABSTRACTS
POSTER PRESENTATIONS
GRSG STUDENT AWARD
GRSG MEMBERSHIP & WEBSITE
The Geological Remote Sensing Group (GRSG) is a Special Interest Group affiliated jointly with The Geological Society of London and the Remote Sensing and Photogrammetry Society. It was founded in 1989 to raise awareness and encourage the use of remote sensing technologies in the geoscientific and related communities. The GRSG seeks to represent the views of industry, government and academic individuals and organisations - resulting in a balanced scientific, technological and commercial viewpoint.
Disclaimer re. The abstracts and subsequent presentation material for the 28th International Annual GRSG conference do not represent the view of the Geological Remote Sensing Group (GRSG) or our parent bodies Geological Society and Remote Sensing and Photogrammetary Society (RSPSoc)

Charlotte BishopChairman
Alex GowTreasurer
Tomasz GmerekSecretary
Andy HartMembership Secretary
Alasdair KyleSocial Media Manager
Barney GordonSocial Media Manager
Matt WebsterEarly Careers
Christian Haselwimmer International Liaison
Simon BlockStudent [email protected]
THE GRSG Committee
Toby MerrittStudent [email protected]
Alistair MaclenanMarketing
Huma IrfanNewsletter Editor

Nick KellermanCommittee Member
Dave Committee Member
Xu TeoCommittee Member
THE GRSG Committee

We combine extensive civil engineering experience with specialist natural hazard expertise to provide our clients with robust risk management strategies for a wide range of terrains.
www.arup.com
sponsors of the GRSG 2017 AGM and Conference

Jupiter Hotel: The conference venue is in the business district of the city, between the Campo Pequeno and Saldanha Metro stations (less than 5 minute walk from the hotel and 5-10 minute walk respectively). A downhill walk to the old town will take approximately 40 minutes. It is close to the Gulbenkian Museum (10 minute walk), the Bull Ring (5 minute walk) and within easy reach of all that Lisbon has to offer.
12th December, Icebreaker Reception: Dote, Avenue da Republica will host the icebreaker reception. This bar/restaurant is almost directly opposite the Jupiter hotel. There will be a cash bar for you to purchase craft beer, wine, cocktails and soft drinks with a finger buffet provided by GRSG. Join us from 6pm.
Conference agenda & logistics

12th December 2017: Icebreaker Reception, DOTE – REPÚBLICA Campo Pequeno from 18.00 (cash bar)
Day 1: 13th December 2017Time Title Speaker08.30 Registration Opens09.30 Welcome and Introduction Charlotte Bishop
Mineral Exploration - Chair: Dan Taranik, Exploration Mapping09.45 Keynote: Advances in Spectral Geology and
Remote Sensing for Mineral Exploration a Ten Year Perspective
Dave Coulter – Overhill Imaging, Ireland
10.15 Application of Multiscale Imaging Spectroscopy for mapping Porphyry Cu deposits in the Eastern Alaska Range
Ray Kokaly – USGS, USA
10.35 Hyperspectral core imaging of a reduced intrusion related gold system
Richard Bedell – Rengold, USA
10.55 Coffee Break - Exhibition & PostersOil&Gas - Chair: Christian Haselwimmer, Chevron
11.25 Remote Sensing to Reduce Oil and Gas Risk Mike King – CGG NPA, UK11.45 Satellite-derived structural geomorphology as
a tool to assist new oil well locations during developing phase
Pedro Barreto – Partex Oil&Gas, Portugal
12.05 Oil Leakage recognition using SAR data Marta Reis – University of Coimbra, Portugal
12.30 LunchGeological Mapping – Tom Gmerek, Quarry One Eleven
13.30 Combining airborne geophysics and satellite imagery to explore for lithium brine at depth in Cornwall, SW England
Chris Yeomans – University of Exeter, UK
13.50 Generating a DEM using atmospheric absorption bands to improve surface reflectance
Yaron Ogen – University of Tel Aviv, Israel
14.10 Geomorphometric imprint of strike slip and compressional tectonics
Alper Gurbuz - Nigde Omer Halisdemir University, Turkey
14.30 Extraction and Integration of mineralogical and topographic information derived from ASTER and DEM data
Yasushi Yamaguchi – University of Nagoya, Japan
Conference agenda & logistics

Day 1: 13th December 2017Time Title Speaker14.50 Coffee Break - Exhibition & Posters
Technology Advances and New Applications – Marc Goossens, Geosense15.20 Earth Observation 2.0: Image processing at
scaleCharlotte Bishop – Terrabotics, UK
15.40 Three years of Photographing – Extreme 3D mapping
Erik Vest Sorensen – GEUS, Denmark
16.00 From Pixels to Answers: DigitalGlobe Geospatial Big Data Applications
Alex Gow – DigitalGlobe, UK
16.20 HySpex Mjolnir – the first scientific grade hyperspectral camera for UAV remote sensing.
Lukas Paluchowski - NEO, Norway
17.00 ANNUAL GENERAL MEETING17.30 Wine Reception - Jupiter Lisboa Hotel
Conference agenda & logistics
13th December, Wine Reception: Following the Day 1 of the GRSG conference which culminates with our AGM (open to all delegates) we will adjourn to the upper terrace (weather permitting) of the hotel for our wine reception.
This will run from approximately 6-8pm leaving plenty of time for dinner at your leisure.

Day 2: 14th December 2017Time Title Speaker08.30 Registration Opens09.30 Welcome and Introduction Charlotte Bishop
Oil&Gas – Pedro Barreto, Partex Oil & Gas 09.40 Keynote: Remote sensing across the oil and gas
lifecycleChristian Haselwimmer - Chevron, USA
10.10 The application of imaging IR spectroscopy for mineralogical analysis of core and cuttings
Gavin Hunt – Spectra-Map, UK
10.30 Remote Sensing and Spatial Analysis Applied to Prospectivity Mapping
Carlos Roberto Souza Filho - UNICAMP, Brazil
10.50 Coffee Break - Exhibition & PostersMineral Exploration – Richard Bedell, Rengold
11.30 Characterisation of rare earth element bearing minerals in core, hand samples and thin section billets using imaging spectroscopy
Todd Hoefen - USGS, USA
11.50 Hyperspectral Imaging for Mineral Exploration – Examples from the Iberian Pyrite Belt, Spain
Anne Papenfuss - BGR, Germany
12.10 The feasibility of targeting REEs in tailings using remote sensing data
Imam Purwadi - ITC, Netherlands
12.30 LunchGeological Mapping – Micky Brown, Mappa Mundi
13.30 Mapping the footprint of volcanic hydrothermal systems from the shallow submarine environment
Jo Miles - University of Bristol, UK
13.50 Mapping the Milh Kharwah Salt Diapir Sab’atayn Basin, Yemen
Leslie Jessen – OMV, Austria
14.10 Multidisciplinary fieldwork for applied geoscience: The Milos field course
Luke Bateson – BGS, UK
14.30 Mapping using visible to near infrared, shortwave and longwave infrared
Veronika Kopackova – Czech Geological Survey, Czech Republic
14.50 Coffee Break - Exhibition & Posters
Conference agenda & logistics

Day 2: 14th December 2017Time Title Speaker15.20 RapidFire Session: Chair, Charlotte Bishop,
GRSG Chairman
Geohazards: Jason Manning, Arup 16.00 Mixing Zones in Debris Flow: New advances
combining NIR and spectrometryFrederico Barata, University of Portsmouth, UK
16.20 Predicting tailings dam failure using multipolarisation SAR
Neil Pendock – South Africa
16.40 Towards the Compilation of a Terrain-Corrected Backscatter Database of Glacio-Volcanic Land Cover Types
Jirathana Dittrich – University of Salzburg, Austria
17.00 Close19.30 Conference Dinner Casa de Leao, Castelo S. Jorge - buses at 6.30
Conference agenda & logistics
14th December, Conference Dinner: The conference dinner will be held at the Casa do Leão (Lion House) at Castelo São Jorge, Lisbon’s beautiful Moorish castle which sits on top of the hill overlooking the city. Transfers will be provided to the conference dinner which also secures our entry through the security barriers to the dinner location. Please note the surface at the castle is very uneven and therefore caution is advised particularly for those wearing high heels. There will be a member of the committee directing each group to the restaurant and the beautiful views over the city that the terrace offers.
A welcome drink will be served upon arrival with buffet served from 8pm. Wine, beer and soft drinks will be available throughout the meal with additional items e.g. spirits etc on your own account.
We must vacate this venue before 11pm and it is a downhill walk to the old town with the closest Metro station being Terreiro do Paço (blue line). As we know people will wish to leave at different times and are staying in different hotels the GRSG will not be providing transfers back to Jupiter Hotel.

Day 3: 15th December 2017Time Title Speaker08.30 Registration Opens09.30 Welcome and Introduction Charlotte Bishop
Geohazards: Charlotte Bishop, GRSG Chairman09.40 Keynote: The role of EO for supporting
resilience – from national scale through city scale to local scale
Jason Manning – Arup, UK
10.10 The application of satellite borne sensors for monitoring coastal erosion and ecosytems in Ireland
Daithi Maguire – National University, Ireland
10.30 Slope Stability assessment of two coastal landslides n Portland, Dorset
Dietmar Backes, University of Luxemburg
10.50 Coffee Break - Exhibition & PostersInSAR - Luke Bateson, BGS
11.30 Classification of landslide Activity based on advanced DInSAR datasets
Andre Kalia – BGR, Germany
11.50 Investigating the relationship between ground deformation, ground water tables and the underlying geology in London, UK
Christine Birschoff – Imperial College, UK
12.10 Automated InSAR processing and temporal analysis for the monitoring of oil field subsidence caused by steam injection
Stewart Wyseman – PCI Geomatics, Canada
12.30 LunchMineral Exploration: Dave Coulter, Overhill Imaging
13.30 Multiscale characterisation of the Jaguelito Deposit (Argentina)
Diego Ducart – UNICAMP, Brazil
13.50 Mapping Epithermal alteration mineralogy with high spatial resolution hyperspectral imagers
Isabel Cecilia Contreras – Helmholtz IFRT, Germany
14.10 The influence of geological sample surface preparation on TIR spectroscopy
Evelien Rost – ITC, Netherlands
14.30 Targeting copper and gold in vegetated areas of Colombia using LWIR satellite imagery
Dave Forest – N-side Mining, USA
15.10 Technical Conference Closes15.20 Afterglow - Location TBA
Conference agenda & logistics

Conference agenda & logistics
Other useful information
Timezone: Lisbon is on WET (Western European Time) which is the same as GMT and therefore London.
Restaurants close by: There are a number of excellent restaurants in Lisbon and there are far too many to mention. However, near the Jupiter Hotel there are a few restau-rants around the Bull ring which include Italian, Portuguese Tapas and Sushi, Dote (our Icebreaker venue) which serves traditional Portuguese food in an American style and then in areas such as Biarro Alto, Baixa-Chiado, Rossio square and Terreiro do Paço there are a seemingly infinite number with some far more touristy than others.
There are however some hidden gems just tucked away from these central areas such as O Solar dos Presuntos (closest Metro, Restauradores) an excellent fish and meat restaurant loved by locals. Or why not try the hidden courtyard (under the arch at number 19 Rue Garrett) with a few restaurants to choose from just down from Biaxa-Chiado Metro includ-ing a great pizza/pasta place. If you want dinner with a view then, whilst perhaps a little more pricey, the Panorama Bar and Restaurant at the Sheraton hotel is one not to miss. This has fantastic views over the city and excellent food.
There are also a number of coffee shops (you might like to try Versailles on Avenue da Republica) close to the hotel if you need a break or a quick meeting, head down towards Saldanha Metro on the opposite side of the road to the hotel and you can’t miss it.
Christmas markets: if you like Christmas markets then there are a couple to choose from including Lisbon’s Winter Wonderland just outside Marques de Pombal Metro (in Parque de Eduardo VII) or in Rossio square. As well as a wide variety of high street and designer shops.
Travelling from the airport: The airport is on the edge of the city with only a short travel ride into the centre of Lisbon. Access to the city can be via taxi, bus or metro. For those staying at Jupiter Hotel the easiest route is to take the ‘Pink’ line straight from the airport to Saldanha where the hotel is only a short walk away. A taxi ride will take ~15-20minutes to Jupiter Hotel (traffic dependent) and will cost approximately 10-15 euro (extra charge added for baggage).
Getting around: There are a number of ways to travel in the city aside from walking these include the trams, taxis and of course the metro. The metro is easy to use with ticket machines in English/Spanish and Portuguese. Viva Viagem cards can be purchased at each metro station these cost 0.50 euro per card but are rechargeable either with single/24hour tickets or with an amount of your choice (similar to London’s oyster card system). Each journey will cost ~1.45 euro. More information on fares and journey planning etc are available here: http://www.metrolisboa.pt/eng/

ADVANCES IN SPECTRAL GEOLOGY AND REMOTE SENSING: 2008-2017D. COULTEROVERHILL IMAGING, IRELAND
Over the past decade the field of exploration remote sensing has undergone a fundamental transformation from processing images to extracting spectroscopic mineralogical information resulting in the broader field of Spectral Geology and Remote Sensing (SGRS), which encompasses technologies that contribute to the definition, confirmation, and characterization of mineral deposits.
SGRS technologies provide information on the mineralogical and alteration characteristics of a mineral orebody by assisting with the identification of features on the surface, in field samples, and in the subsurface through core spectroscopic measurements and imaging.
This contributes mineralogical composition for field mapping and orebody characterization with non-contact, non-destructive measurements at high sampling density that no other technology can accomplish. Application of spectral geology and remote sensing technologies varies depending on the scale of exploration, surface exposure, and alteration type, but may include the use of high resolution satellite multispectral imagery, airborne hyperspectral imagery, surface and core point spectral analysis, or hyperspectral core imaging.
SGRS technologies augment human vision by making measurements far beyond the sensitivity of human eyes, providing accurate and densely sampled mineralogical information that contributes to more efficient and accurate field mapping and core logging. When integrated with other exploration data, geologic observation, and engineering and geometallurgical analyses, SGRS data contributes to both upstream and downstream efficiencies.
Although the exploration and mining business cycle has impacted expenditures for research and develop of exploration related technologies, SGRS capabilities continue to grow based on demand for new instrumentation and capabilities from the broader geospatial and spectroscopy community.
WEDnesday 13th december 09.45

APPLICATION OF MULTISCALE IMAGING SPECTROSCOPY FOR MAPPING PORPHYRY CU DEPOSITS IN THE EASTERN ALASKA RANGE
R. F. KOKALY1, G. GRAHAM1, T. M. HOEFEN1, K. D. KELLEY1, M. R. JOHNSON1 & B. E. HUBBARD2
1 U.S. GEOLOGICAL SURVEY, DENVER, CO, USA, 2 U.S. GEOLOGICAL SURVEY, RESTON, VIRGINIA, USA
Arctic environments provide a challenging ground for geological mapping and mineral exploration. Inaccessibility and harsh conditions complicate ground surveys and a dense cover of ice, vegetation, and lichens hinders supportive remote sensing surveys. Steep coastal cliffs are often the only accessible major outcrops, but are mostly not observable by air- or space-borne remote sensing data due to their off-nadir viewing angle. Former studies of those cliff sections focused on the manual interpretation of ground- or boat-based RGB images. However, detailed spectral data is missing, which is essential for common semi-automatic remote sensing data processing and interpretation of mineralogy and structures as well as mapping subtle mineralogical differences.
This contribution introduces an approach for photogrammetry and hyperspectral remote sensing of near-vertical cliff sections of geological outcrops in central west Greenland. A 3D image-based surface reconstruction technique is developed to enable a semi-automated outcrop evaluation. The focus lies hereby on the integration of digital photogrammetry with boat-based hyperspectral imaging to complement Digital Outcrop Models (DOM) with quantitative information about mineral variations in the outcrop.
This add-on information allows for distinctions between rock formations, or for defining barren ground versus potential economic ore deposits. The project focuses on: 1) integration of hyperspectral images with the photogrammetry derived DOM´s, 2) geometric distortion correction of boat-based hyperspectral images, 3) extraction and mapping of geological features from close range hyperspectral images. The extreme off-nadir (nearly horizontal) scanning view and the resulting scan geometry need to be taken into account during processing. This contribution also highlights future possibilities for rapid semi-automatic interpretation of the data and advances in technology.
Our approach provides a promising workflow for off-nadir remote sensing campaigns in coastal artic environments including photogrammetry and hyperspectral imagery even in remote regions, which are only accessible by boat and can hardly be observed by classic geological mapping.
WEDnesday 13th december 10.15

HYPERSPECTRAL CORE IMAGING OF A REDUCED INTRUSION RELATED GOLD SYSTEM
R. BEDELL1, P. LINTON2 & P. QUILLEN3
1 RENAISSANCE GOLD, RENO NV, 2 TERRACORE, RENO NV3 UNIVERSITY OF NEVADA, RENO, CENTER FOR RESEARCH IN ECONOMIC GEOLOGY, RENO, NV
One drill core hole and well-studied rock slabs were analyzed using hyperspectral imaging to aid in defining the intrusive history, alteration, and mineralization of a reduced intrusion-related gold system at the Buffalo Canyon Project, operated by Renaissance Gold in Nye County Nevada. The data were collected by TerraCore using a sisuROCK VNIR-SWIR+LWIR (SpecIm FENIX plus OWL) hyperspectral core imaging instrument.
The geology is defined by superimposed Jurassic (160 Ma), Cretaceous (82 Ma), and Oligocene (25 Ma) magmatic intrusions, gold and base metal mineralization, and a variety of alteration styles. Previous geologic work could not distinguish the true vectors to gold mineralisation.
Hyperspectral imaging at 1mm pixel resolution allows petrologic observations to be made that assist in unraveling the geology.The data were processed using self-organizing map (SOM) and mineral matching algorithms, and information related to individual spectral features were extracted. Spectral results and multielement geochemistry at 5 foot (1.524 m) intervals were loaded into IntelliCore© for interpretation.
Pervasive chlorite of an intermediate Fe-Mg composition is overprinted by zones of muscovite-chlorite alteration, within which occur tourmaline veins. These in turn are cut by late illite-chlorite veins and veinlets. Four intervals of anomalous gold and base metals correspond spatially with tourmaline and associated epidote. Quartz veins occur associated with mineralization, however quartz is widespread and less useful as a vector than tourmaline.
The host intrusions are mapped by chlorite, plagioclase (oligoclase) and quartz. Biotite hornfelsed metasediments of Jurassic age contain quartz, chlorite, biotite, calcite, amphibole and various clays. The LWIR detects a quartz - Al-clay assemblage that is mapped in the SWIR by chlorite, demonstrating the complementary nature of those wavelength ranges.
Hyperspectral core imaging has offered direct and rapid synthesis of multiple alteration assemblages of three different ages, and has defined the alteration assemblages related to mineralization.
WEDnesday 13th december 10.35

REDUCING OIL & GAS EXPLORATION RISK WITH SATELLITE IMAGERY, LATEST EXAMPLES FROM NPA’S MAP SUITE AND SEEP EXPLORER DATABASES
M. King1
1 CCG NPA, UK
Exploration risk can be divided into health and safety risk and risk associated with the presence of oil & gas. HSE risk has benefited from the recent developments in satellite technology in terms of both spatial, temporal and spectral resolution but also in the processing techniques and delivery mechanisms to help mitigate risk. Risk associated with source presence has largely been covered by satellite seepage slick detection offshore where the technique is now routine. However there are inherent ambiguities in the data which affect the confidence levels on the seepage slicks.
CGG | NPA Satellite Mapping (NPA) has managed to overcome many of these risks by combining with their own seismic and geochemistry databases. The widespread validation of the technique has changed our understanding of how basins leak and proven the widespread applicability of seep detection in reducing exploration source risk. Onshore exploration has instead relied on more traditional photo-geology techniques. The latest freely available datasets now mean that cost effective mapping solutions and 3D geological models can be created over most geographies prior to any commitment being made.
High-resolution imagery and DEM’s further reduce uncertainty in the exploration cycle and go some way to filling in the gaps in both seismic lines and also the near surface.
WEDnesday 13th december 11.25

SATELLITE-DERIVED STRUCTURAL GEOMORPHOLOGY AS A TOOL TO ASSIST NEW OIL WELL LOCATIONS DURING DEVELOPING PHASE: EXAMPLE FROM ONSHORE POTIGUAR BASIN, BRAZILP. BARRETO1
1 PARTEX OIL&GAS, PORTUGAL
After a successful 3 years exploration phase in Onshore Potiguar Basin, the consortium Partex - Petrobras started production on its newly discovered Colibri and Cardeal Fields back in 2007/2008. These fields where discovered using conventional exploration methodologies that included 3D seismic surveying followed by the drilling of several exploration and appraisals wells. Since early stages of the development phase several technical difficulties related with lateral delimitation of structural culminations and characterization of the main reservoirs were identified. Cardeal field reservoirs, all part of Açu Formation (Fm.), correspond mainly to sandstones deposited by braided rivers systems, presently at depths ranging from 350 to 400m, with both lateral and vertical complex architectures that are hard to image on seismic data. The poor imaging is mainly the result of the static effect produced by the overlaying Jandaira Fm. This unit corresponds to a 200 to 250 m thick highly karstified, crystalline limestones that extends and outcrop over a large portion of Potiguar Basin. The shallow position of the reservoirs together with the geophysical character of outcropping unit implied strong constrains in the 3D seismic campaign design. As result seismic data quality was significantly reduced and consequently made seismic interpretation extremely difficult. The static effect is particularly important when considered that culminations associated with these oil fields are typically in the range of 2-4 ms (TWTT) of amplitude and therefore any small anomalous effect have strong repercussions on the mapping, especially in the definition of the closures lateral extent.
Considering the problematic in defining the lateral extent of the oil accumulations, the motivation for this study was the fact that some of the oil fields in the license area, as well as in adjacent ringfences, are in interfluves characterized by closed or highly strangled topographic contours. The shapes of these contours and the way drainage deflects around them, often reflect the approximate shape and size of the culmination at depth, identified on the 3D seismic. It has been long known and well described in the geological literature that geomorphology is not solely controlled by the outcropping geology. Large structural highs at depth / basement levels strongly control sedimentary basin infill dynamics, leading to differential compaction of sediments and consequently influencing drainage patterns and erosion. Therefore, subsurface geological structures, particularly when affecting reasonably harmonic, sub-parallel sedimentary sequences, as the post-rift Açu and Jandaira Formations in Potiguar Basin, indirectly controls the surface drainage which deviate and deflect around them. Taking the above into account, this study used very high-resolution satellite data (WV-1 and AW3D) such as optical imagery, DSM and DTM to characterize the geomorphology of the study area and infer geomorphological expressions of buried structural highs. These surface features were then observed/checked in the field and compared with the reservoir depth maps derived from 3D seismic. The main goal was to reduce the uncertainty related with the lateral extend of the structural culminations and at the same time identify and infer other potential structures not clear on 3D seismic data.
WEDnesday 13th december 11.45
OIL LEAKAGE RECOGNITION USING SAR DATA
M. REIS1,2, E. I. ALVES AND R. PENA DOS REIS (1) 1 GEOSCIENCES CENTRE,UNIVERSITY OF COIMBRA, PORTUGAL2 CENTRE FOR EARTH AND SPACE RESEARCH, UNIVERSITY OF COIM-BRA, PORTUGAL
SAR images have been used to identify evidences of oil pollution related to illegal discharges from ships (oil spills) and natural seepage (oil seeps). The knowledge of the geographic location of these accumulations is important to the environment and the economy.
We present the first results of oil leakage recognition in the Portuguese offshore and its relation with major structures off the west coast of Portugal. SAR data was acquired by ESA satellite SENTINEL 1A between 2014 and 2016. These C-band SAR images are very effective for oil leakage detection since they record high resolution scenes and are not influenced by weather conditions. The procedure has three phases: (i) manual observation to select scenes of interest, (ii) segmentation using a semi-automatic hysteresis algorithm and (iii) image analysis.
Phase (i) aims to identify anomalous dark patches, based on colour and contrast with the background, which are considered to correspond to potential oil leakages. Phase (ii) consists in image segmentation using an ImageJ plugin for the implementation of hysteresis threshold. In this procedure we applied an upper and lower threshold, which divides the objects from the background. Phase (iii) analysis of the segmented images and oil related object recognition.
Our method can identify putative oil accumulations and remove other dark patches that are not related to oil leakage, such as biogenic slicks. This algorithm can minimize the error during discrimination of oil leakage. Another advantage of using hysteresis is that delineating the oil-water interface becomes less subjective and more viable. The identified oil seeps appear to be associated with extensive tectonic structures, such as deep fractures and local exposition of one of the petroleum systems’ components.
WEDnesday 13th december 12.05

MULTIDISCIPLINARY FIELDWORK FOR APPLIED GEOSCIENCE: THE MILOS FIELD COURSE
L. BATESON1, G. BROWN2, S. GORDON3, S. GREBBY4, R. HERRINGTON5, B. LISTER1, J. NADEN1, D. SMITH6
1 BRITISH GEOLOGICAL SURVEY, 2 CONSULTING GEOLOGIST, 3 SATARLA,4 UNIVERSITY OF NOTTINGHAM, 5 NATURAL HISTORY MUSEUM, 6 UNIVERSITY OF LEICESTER
For the past 3 years the British Geological Survey, University of Nottingham, University of Leicester, Natural History Museum and industry representatives have run a training course on the Greek island of Milos for Doctoral and early career researchers. This course, funded by the Natural Environmental Research Council (NERC), exposes young geoscientists to the field skills they need to enter into a career in mineral exploration. These include pre-field data assessment, site prioritisation and logistical planning, field observation and recording skills, the use of field instrumentation, and team working. The course lasts for twelve days and is split into two parts. Part 1 consists of assessment and planning, which takes place in the BGS offices, where the participants have access to a range of digital data. Their objective is to identify mineral targets and plan a field campaign; to enable this they receive basic training in geological remote sensing, GIS and prospectivity analysis. The use of the BGS 3D visualisation facility allows virtual field reconnaissance making use of NERC ARF LiDAR, photography and hyperspectral data, as well as freely available satellite imagery (Landsat 8 and ASTER). Part 2 takes place in the field and field office on Milos; here the attendees (i) recognise a range of volcanic products and relate them to volcanic processes; (ii) identify features associated with hydrothermal alteration plus associated mineralisation; (iii) use field spectroscopy, terrestrial LiDAR, portable XRF and XRD to identify different types of alteration mineralogy and metal contents of mineralised material; (iv) design and undertake a team-based mineral prospect evaluation exercise using a range of developed fieldwork skills, including the field-based instrumentation technologies and digital field data capture, such as the BGS–SIGMA system
Milos is selected as a field location for the following reasons:
1. The island is renowned as a natural laboratory for examining volcanism and mineralisation, with several different styles and variations of each well exposed and easily accessible2. There is a NERC ARF high-resolution data set comprising a LiDAR DEM, hyperspectral imagery and aerial photography to enable detailed virtual field reconnaissance3. The course tutors have considerable experience of the geology of Milos4. Active mining offers the opportunity to investigate the social, community and environmental issues associated with mineral exploration and extraction5. Good weather guarantees maximum time for developing a range of field-based observational skills.At the end of the fieldtrip, working in teams, the delegates use the observations and knowledge gained to present a case for further work and potential exploration investment, including an assessment of environmental and community issues.
WEDnesday 13th december 13.30

GENERATING A DIGITAL ELEVATION MODEL (DEM) USING ATMOSPHERIC ABSORPTION BANDS TO IMPROVE SURFACE-REFLECTANCE RETRIEVAL FROM HYPERSPECTRAL SENSORS
Y. OGEN AND E. DOR1
1 THE DEPARTMENT OF GEOGRAPHY AND HUMAN ENVIRONMENT, TEL AVIV UNIVERSITY
Digital elevation models (DEMs) are generated from either a LiDAR sensor or a pair of stereo images, and although these sources produce high-resolution elevation models, their drawbacks are significant for hyperspectral remote-sensing (HRS) applications. This is mainly because of mis-geolocation of the DEM with the HRS image which may demolish the radiance information of each pixel. Accounting for elevation data in the HRS arena is crucial to precisely rectifying the data atmospherically. In radiative-transfer models, atmospheric correction requires the elevation information for every pixel to allow accurate reflectance retrieval. Accordingly, a method that will generate DEM information from HRS data without radiometric deformation is strongly required and important. This study reports the results of an idea to use atmospheric gases to extract elevation information on a pixel-by-pixel basis.
The earth’s atmosphere contains a wide variety of gases, some of which absorb energy at specific spectral wavelengths. The intensity of the absorption feature of these gases under unsaturated conditions is highly correlated with the radiance path from the top of the atmosphere to the ground and back. In this study, we used the AisaDUAL hyperspectral sensor to examine the correlation of gas absorption features with elevation over Makhtesh Ramon, Israel, which is characterized by varying mineralogy, rough terrain and arid climate. After comparing our results with an external source—a highly accurate DEM—using R² and RMSEP, we found water vapor absorption at 724 nm to be the most sensitive for extracting elevation data.
We then ran an atmospheric-removal procedure using ATCOR-4 software before and after extracting the elevation information and found that the extracted DEM enables better reflectance retrieval over several ground-truth areas. These results demonstrate a promising capability to improve surface reflectance values, taking into account each pixel’s elevation, without any radiometry deformation of the original data.
WEDnesday 13th december 13.50
GEOMORPHOMETRIC IMPRINTS OF STRIKE-SLIP AND COMPRESSIONAL TECTONICS IN THE YEŞİLIRMAK RIVER BASIN, NORTHERN TURKEYA. GÜRBÜZ1, E. GÜRBÜZ2, N. KAZANCI3
1 NIĞDE ÖMER HALISDEMIR ÜNIVERSITESI, TURKEY2 AKSARAY ÜNIVERSITESI, TURKEY3 ANKARA ÜNIVERSITESI, TURKEY
The goal of this study is to understand the geomorphic and morphometric effects of active tectonics on a river drainage basin, and on the other hand to understand the unknown tectonic deformations using systematic geomorphic anomalies analysed through remote sensing in northern Turkey. This region is divided into several faulted blocks by dextral strike-slip deformations of the North Anatolian fault zone and its branches. In northern Turkey, the fluvial network of the Yeşilırmak River basin includes several geomorphic imprints of strike-slip deformations, such as offsets, aligned drainages, and linear valleys which are expected morphotectonic responses in the drainage basin.
We used such morphotectonic structures to determine the long term effects of strike-slip faulting in the drainage basin fluvial network. Offsets on the splay faults of North Anatolian Fault Zone represent low values toward south and are consistent with current geodetic data of the region. However, some other large-scale diversions along the river courses extracted from the fluvial network are not related only to strike-slip faulting of the North Anatolian Fault Zone and its branches. Folding and thrusting in the region are responsible for such large-scale geomorphic anomalies. In this framework, whereas the major force shaping the current geomorphology on a regional scale is the North Anatolian fault zone, the continental collision between the Arabian and Eurasian plates has still effective in the region with its compressional structures.
One of the major splay faults of the North Anatolian Fault Zone, the Sungurlu–Ezinepazarı fault is also playing an important role in the geomorphic evolution of the region. According to geomorphometric analyses, activities of the mentioned strike-slip faults and related block movements have resulted with tilting processes that drive the evolutions of subbasins in the Yeşilırmak River drainage basin in northern Turkey.
WEDnesday 13th december 14.10

EXTRACTION AND INTEGRATION OF MINERALOGICAL AND TOPOGRAPHIC INFORMATION DERIVED FROM ASTER AND DEM DATA
Y. YAMAGUCHI1, K. KURATA1, R. HIRAI1, S. NODA2, AND S. KODAMA3
1 GRADUATE SCHOOL OF ENVIRONMENTAL STUDIES, JAPAN2 JAPAN OIL, GAS AND METALS NATIONAL CORPORATION, JAPAN3 GEOLOGICAL SURVEY OF JAPAN
Advanced Spaceborne Thermal Emission and Reflection Radiometer (ASTER) has three spectral bands in the VNIR, six bands in the SWIR, and five bands in the TIR regions respectively, along with one backward-viewing VNIR band for stereoscopic observation. The VNIR bands are useful in assessing vegetation and iron-oxide minerals, the SWIR bands were targeting the diagnostic absorption features of phyllosilicate and carbonate minerals, and the TIR bands can be used to characterize silicate rocks.
One challenging problem is that such diverse information exists in the different wavelength regions with different spatial resolutions. In addition, their spectral patterns are affected by extraneous factors such as topography and grain size. In the information extraction stage to identify minerals and their relative amounts, these effects can be suppressed by techniques such as band ratios, SAM or modified SAM. We also applied a simple classification method such as the decision tree classifier to the band rationing results in order to discriminate carbonate and skarn minerals, which have absorption features in the similar wavelength regions.
On the other hand, topography is often useful to interpret the geology, and is also important to know the landscape and current location. We developed a technique to visualize topography from a digital elevation model (DEM). Then, by using the HSV color model, the mineralogical information derived from the ASTER data by suppressing the topography effect was integrated with the topographic information derived from DEM. Namely, spectral indices or classification results representing the mineral species were assigned to H (hue), relative amounts of minerals to S (saturation), and the topography to V (value) elements, respectively. This technique allows us to provide a color image showing geological information, which can be easily interpreted by a geologist.
WEDnesday 13th december 14.30
EARTH OBSERVATION 2.0: IMAGE PROCESSING AT SCALE
C. BISHOP1
1TERRABOTICS, UK
As space becomes cheaper to access the vast, and ever increasing, amount of Earth Observation data now available presents a continued challenge to the industry. In this new era of technology, the ability to process these billions of pixels into intelligent information solutions for users in a scaleable manner, quickly and repeatably without compromising on accuracy, becomes more of a necessity. Innovative smart cloud-based algorithms allow data to be processed rapidly, at a lower cost and in a more repeatable way than ever before allowing us to efficiently combine data sources together to derive actionable intelligence from 2D, 3D and 4D products. Terrabotics was founded in response to this step change in space and has challenged traditional image processing techniques with faster, more cost effective and accurate solutions for Oil&Gas, Mining and Natural Resources sectors bolstered by expertise across remote sensing, computer vision whilst coupled with deep domain knowledge. The ability to process high resolution DEMs from 0.5m-10m grid resolution quickly for example. enables decisions makers fast access to information to help reduce overall project risk. Our core image processing algorithm also prepares the imagery for feature detection through 2D and 3D machine learning lead object recognition and allows us to ingest high volumes of data into this process. Here, we present a series of product examples from 3D base mapping, time series volumetric change detection over mines, enhanced image processing for geology as well as the value of 3D to object detection across a number of sites globally. This whistlestop tour will highlight how advances in technology are vital to keep up with the increasing number of satellites expected over next 2-10 years and presents an enormous opportunity for us as technology companies to exploit such data in a meaningful way to serve specific customer needs.
WEDnesday 13th december 15.20
THREE YEARS OF PHOTOGRAPHING – EXTREME 3D MAPPING
E. V. SORENSEN1. N. BAKER2 AND P. GUARNIERI1
1 GEUS, DENMARK2 UNIVERSITY OF COPENHAGEN
The geology of the Paleoproterozoic Karrat Group in West Greenland (71°-74°50´N) was investigated using digital photogrammetry and traditional field work as a collaboration between the Geological Survey of Denmark and Greenland and the Ministry of Minerals Resources in Greenland. The area is remotely located and characterized by steep alpine terrain with up to 2000 m of relief that in many places is completely inaccessible.
It was therefore decided, at an early state of the project planning, to collect stereo-images to ensure a successful conduction of the investigation. Over the last three years this has led to the production of a unique data-set consisting of more than 50.000 highoblique stereo-images. The stereo-images were collected with hand-held digital SLR cameras deployed from 1) boat (which served as base-camp 2) helicopter used for day excursions and placing field camps and 3) ground.
The images were typically collected in large coherent line series while moving parallel to cliffs in strait or gentle curving trajectories (10-100’s of km) at varying distance to the cliffs. The GSD of the images typically varies between 0.2-0.5 meters with close-up lines have GSD´s in the mm to cm range.
We here use the opportunity to present our methodology and report on different aspects of this unique data-set with examples ranging from revision of regional geological maps, detailed geological interpretation of the meta-volcanic stratigraphy to reporting on the massive 2017 Karrat Fjord landslide.
WEDnesday 13th december 15.40

FROM PIXELS TO ANSWERS: DIGITALGLOBE GEOSPATIAL BIG DATA APPLICATIONS
A. GOW1
1 DIGITALGLOBE, UK
Over the last 16 years, DigitalGlobe high resolution imagery has been an indispensable source to extract geospatial information timely and accurately all over the world. Thanks to a world class constellation of highly capable satellites, DigitalGlobe has constantly pushed the boundaries in providing extremely accurate data and new ways to see the planet we live in.
Today, the geospatial sector is undergoing some profound changes. The ability to rapidly analyse large amounts of data together with the increase in data availability are bringing new users and creating innovative applications that a few years ago were not feasible.
DigitalGlobe, now a Maxar Technologies company, has developed a Geospatial Big Data Platform called GBDX where users can leverage every high resolution imagery ever collected and use advanced algorithms to analyse them. Thanks to the power of the cloud, extensive experience in image processing and innovative machine learning approaches, users can now extract information at scale from geospatial data.
During this presentation, I will explore some of the use cases that GBDX is enabling, look at the future of DigitalGlobe’s constellation and discuss some new capabilities from the Maxar Technologies group of companies.
WEDnesday 13th december 16.00


THE EIX SATELLITE CONSTELLATION – HOW MINING, OIL & GAS CAN BENEFIT
P. HAUSKNECHT1 AND G. CRISFORD1
1 EARTH-I LTD, UK
Earth-i has recently announced plans to launch a constellation of small satellites which provide full colour video and still images at 1m resolution or better. A prototype satellite for this constellation, built by SSTL in Guildford, is scheduled for launch in October ’17 and first demonstrator data sets will be potentially available for the conference in December. The subsequent EiX constellation will provide multiple revisit opportunities throughout the day, for every place on earth, hence bringing a new dimension of VHR data availability to the Earth Observation community. Quite a few large scale EO applications benefit from the ESA / EU Sentinel programme, which has well and truly pushed the high-medium resolution satellite data into the ‘Big Data’ space and service providers are fast coming up with the tools to harvest such ‘free’ data volumes. But for quite a few applications, like infrastructure monitoring, detailed access road mapping, urban sprawl and smart city applications one needs to have very high resolution data at least once or twice a year to verify and quantify spatial changes. Some applications like incident response and security concerns even demand monthly or weekly monitoring in dynamic areas. Such high revisit times become important for high value assets in a dynamic environment, for example the oil & gas assets or mining infrastructure. In critical times daily monitoring, with video capability, or even multiple times a day would benefit operational decisions in such a high value environment. In contrast to the high to medium resolution, often free, data on the one side, the very high resolution spatial satellite sector has been left to the commercial providers and such data has often been seen as expensive or not suitable for operational and large scale monitoring, partly due to limited reliable availability. But this is changing now and new players are entering the market; the cost for ‘fit for purpose’ and highly reliable satellite sensors has come down and the market is getting more competitive. Fresh high resolution optical data is potentially available for every place on earth every day, of course cloud cover permitting. Data collection capabilities, on board storage and a global network of downlink stations have almost but done away with any data collection restrictions seen in the past. New concepts of small cube-sat type space sensors will likely revolutionise data availability in the next few years. Earth-i is part of the next generation companies with new concepts to deliver not only images & videos, but also information and insights to their customers. In the near future managers responsible for multi-million dollar assets and politicians in charge will see such technologies not as a ‘nice to have’, but an essential part of any responsible company’s / government’s information tool box. They need and will want to be, at any time, in a position to make the most informed decisions with an up-to-date geospatial repository, to which the very high resolution earth observation data contribute an essential part.
WEDnesday 13th december 16.20
HYSPEX MJOLNIR – THE FIRST SCIENTIFIC GRADE HYPERSPECTRAL CAMERA FOR UAV REMOTE SENSING.
L. PALUCHOWSKI1
1 NEO, NORWAY
The HySpex Mjolnir hyperspectral cameras provide a unique combination of small form factor and low mass combined with high performance and scientific grade data quality. Top level specifications include a spatial resolution of 1240 pixels, a spectral resolution of 200 bands, and high light throughput (F1.8) for VNIR camera (400-1000nm) and a spatial resolution of 620 pixels, a spectral resolution of 300bands, and light throughput (F1.9) for SWIR system (970-2500nm). A rugged design with good thermal and mechanical stability makes these cameras an excellent option for a wide range of scientific applications for UAV operations and field applications. The optical architecture is based on the high-end ODIN-1024system and features a total FOV of 20 degrees.
With a total mass of less than 4.5Kg including hyperspectral camera, data acquisition unit, battery, IMU and GPS, the system is suitable for even small UAVs. The system is generic and can be deployed on a wide range of UAVs with various downlink capabilities. The ground station software enables full control of the sensor settings and also has the capability to show in real time where the UAV is located, plot the track of the UAV and display the image footprint in order to give instant feedback on spatial coverage. Real time processing results can also be displayed directly on the ground control station. The system can be triggered automatically by the UAV’s flight management system, but can also be controlled manually.
In this presentation, we will present results from tests of the performance and stability of the system and give an overview of the complete system from the hyperspectral camera to computer, navigation system and software. We will also present the methods used to calibrate and characterize this system. We will also introduce a new real-time processing software that will be running on the dataacquisition unit inside the Mjolnir. This software will enable real time georeferencing and rectification, real time indices maps and real-time classification for various remote sensing applications.
WEDnesday 13th december 16.40

REMOTE SENSING ACROSS THE OIL AND GAS LIFECYCLE
C. HASELWIMMER11 CHEVRON, USA
Remote sensing provides crucial data for the exploration and characterization of oil and gas resources, as input to managing operations, and is of increasing importance to minimizing the health, environment, and safety risks associated with a wide range of oil and gas activities.
This talk will present an overview of the diverse range of applications of remote sensing across the lifecycle of oil and gas projects. The oil and gas lifecycle from exploration to decommissioning/rehabilitation phases will be discussed and practical examples of the use of remote sensing at the different project phases will be discussed.
The talk will summarize current/future trends for both the oil and gas industry and recent advances in remote sensing and cloud-based data management/analytics technologies. A discussion on the implications of advances in remote sensing technologies for oil and gas industry applications will be presented.
THURSDAY 14th december 09.40

See a better world.®
DigitalGlobe.com
DigitalGlobe BasemapAccess satellite imagery, online or offline, anywhere
in the world—quickly and easily.
Geospatial Big DataImagine a living digital library that documents every inch of our
changing planet. Now imagine a powerful, cloud-based platform with
tools to extract meaningful insights at scale from that library. Finally,
imagine an ecosystem that matches the creators of those insights with
customers who can turn them into effective, world-changing
solutions. That’s geospatial big data made accessible. That’s GBDX
Imagery + AnalyticsAccess our rich 100-petabyte image library plus the advanced
algorithms and machine learning of our Geospatial Big Data
platform, GBDX. Subscription available to Esri ArcGIS Enterprise
10.5 platform customers.

THE APPLICATION OF IMAGING IR SPECTROSCOPY FOR MINERALOGICAL ANALYSIS OF CORE AND CUTTINGS.
G. HUNT1
1 SPECTRA-MAP, UK
The use of infrared spectroscopy for mineral identification dates back several decades, and is complementary to other mineral analytical techniques, such as XRD or point counting. However, a major drawback of these techniques, including the older point sampling IR spectrometers, is that they require sample preparation – an expense in both time and money.
More importantly they cannot provide continuous quantitative mineralogical data to aid reservoir characterisation. The most recent advance in IR spectroscopy is the use of real-time imaging reflectance spectrometers. These are non-contact and non-destructive, and acquire continuous mineral data in a detailed sub-mm pixel image format. The first of these introduced to the UK oil industry in 2008 is the portable SpecCam imaging spectrometer. It has been designed for detailed and automated mineral logging from cuttings and core and plugs over the mm to metre scale.
The current SpecCam design can characterise many of the key molecular vibrations associated with amorphous and crystalline minerals that are important to understanding the performance of tight and unconventional reservoirs. The IR image data can be used to accurately discriminate and quantify different polytypes of the swelling and non-swelling clays, carbonates and sulphates. It also uniquely provides hydrocarbon information (presence or absence) and whether the oil is ‘light’, ‘heavy’ or an invasive OBM.
The ability to image and map subtle compositional and crystallinity changes in a variety of important reservoir-influencing minerals can help identify unconformities and aid well to well correlations. In addition, the impact and interrelationship of clay and carbonate mineralogies on hydrocarbon distribution and permeabilities can be studied.
The SpecCam IR imaging technology addresses 3 major limitations of point sampling techniques – low productivity, inability to show detailed spatial distribution of minerals and low data density. These limitations have direct implications for the reliability and use of these data. Imaging IR spectrometers, such as the SpecCam, overcome these limitations and can provide a unique, spatially-detailed and continuous dataset, which provides a link between point sampling methods and continuous logs.
THURSDAY 14th december 10.10
REMOTE SENSING AND SPATIAL ANALYSIS APPLIED TO PROSPECTIVITY MAPPING
C. R. S. FILHO1
1 UNICAMP, BRAZIL
This work aims to introduce strategies to map petroleum hydrocarbon (PHC) prospectivity on the basis of remote sensing and spatial data modeling. HC seepage is a phenomenon usually associated with structural lineaments and headstreams. It causes bleaching of rocks and soils, triggers geobotanical markers and increases the relative concentration of clays and carbonates. Using this geologic model, data recorded by multispectral sensors were processed by spectral mixture analysis techniques to generate mineral abundance maps.
Vegetation indexes and spatial buffering were used to produce a map of vegetation abundance and maps of proximity to drainage and lineaments, respectively. Such evidential maps were combined by knowledge-driven (i.e. fuzzy logic) and data-driven (i.e. logistic regression) techniques using the new version of the public domain Spatial Data Modeler software.
Data training was guided by gasometric anomalies obtained from geochemical analysis of soil (concentration of gaseous HCs in soil). Both models enabled the integration of information extracted from VNIR-SWIR and TIR multispectral data and various ancillary exploration datasets.
The PHC prospectivity maps yielded attest for the high potentiality of the regions equally mapped by gasometry, corroborating to the usefulness of the methods tested here for this aim. The research proves the applicability of multispectral data and methods to extract relevant spectral-spatial information to oil and gas exploration in continental basins.
THURSDAY 14th december 10.30
CHARACTERIZATION OF RARE EARTH ELEMENT-BEARING MINERALS IN CORE, HAND SAMPLES AND THIN SECTION BILLETS USING IMAGING SPECTROSCOPY
T. HOEFEN1, R. KOKALY, G. SWAYZE, C. TAYLOR, P. VERPLANCK, J. HOLLOWAY, H. LOWERS, A. KOENIG, K. LIVO AND S. GILES1 USGS, USA
In April 2017, the USGS Spectral Library Version 7 was released to the public. Among the significant additions is a suite of high-resolution ultraviolet to short-wave infrared rare earth element (REE)-bearing mineral reference spectra. REE-bearing minerals have sharp absorption features caused by 4fn -4fn transitions in trivalent lanthanide elements. When a lanthanide ion is incorporated into a crystal, the number and position of absorbtions are influenced by the crystal field and the site symmetry of the lanthanide ion. These subtle shifts allow for the identification of the REE mineral and the dominant lanthanide elements that are present . Spectra of light REE-bearing minerals are dominated by Nd, Sm and Pr absorptions while heavy REE-bearing minerals are dominated by Dy, Er and Ho absorptions.
Two state-of-the-art imaging spectrometers were used for this study. The first is the Corescan Hyperspectral Core Imager Mark III™ system which integrates visual imagery, 3-dimensional laser profiling and imaging spectrometer data. Imaging spectrometer data were acquired at spatial resolutions of 500 µm per pixel and red-green-blue (RGB) imagery collected at 60 µm per pixel. The second instrument is a HySpex™ system that combines the VNIR-1800 and SWIR-384 imaging spectrometers. The VNIR-1800 is capable of imaging as fine as 24 µm per pixel with a bandpass of 3.7 nm while the SWIR-384 images as fine as 53 µm per pixel with a bandpass of 7.0 nm depending on the fore-optics used.
Imaging spectrometer data has been acquired and analyzed for REE-bearing minerals in drill core, thin section billets, and hand samples from Bokan Mountain and Dora Bay, Alaska; Yellowstone National Park, Montana; Mountain Pass, California; and Elk Creek, Nebraska in the USA. The interpretation of processes that form REE-bearing mineral assemblages is enhanced through the combination of spectroscopic data with micro X-ray fluorescence, scanning electron microscope and electron microprobe data to determine the relationships between spectroscopy and mineral chemistry at the micron scale
THURSDAY 14th december 11.30

HYPERSPECTRAL IMAGING FOR MINERAL EXPLORATION – EXAMPLES FROM THE IBERIAN PYRITE BELT, SPAIN
A. PAPENFUß1, M. SCHODLOK1 AND M. FREI1
1 FEDERAL INSTITUTE FOR GEOSCIENCES AND NATURAL RESOURCES, STILLEWEG 2, 30655 HANOVER, GERMANY
The Iberian Pyrite Belt (IPB), located in the south of Portugal and Spain, is one of the world’s largest polymetallic massive sulphide complexes. The still existing regional mining potential requires the development of new application-oriented and generic methods for mineral exploration. In this context, VNIR-SWIR (0.4 µm – 2.5 µm) and LWIR (7.7 µm – 12.3 µm) hyperspectral imaging field spectroscopy at the Los Frailes Mine in the east of the IPB was performed for the detection of hydrothermal alteration zones. In addition to the images, further hyperspectral point measurements were performed at selected points of interest for calibration and validation purposes.
The imagery was taken in the open-pit mine in Los Frailes in the east of the IPB. The present geology is a sequence of felsic volcanic rocks of dacitic and rhyolitic composition and epiclasts, and sedimentary rocks (shales), including the weathered massive sulphide ore body. Around the ore body, a hydrothermal alteration pattern with an inner chlorite-rich and a peripheral sericite-rich zone has developed. This pattern can indicate the presence of ore bodies with CuPb-Zn-mineralisation. Therefore, the mineral identification is focused on chlorite and muscovite/sericite abundances.
The hyperspectral data of the VNIR-SWIR were atmospherically corrected using the empirical line method based on field measurements. The LWIR data were corrected using the normalized emissivity method to derive emissivity data. The mineral mapping is based on the Spectral Angle Mapper algorithm (SAM) focused on wavelength ranges where significant mineral-diagnostic absorption features occur. The results of the mineral transitions are discussed in the geological and mineralogical context. This study shows the potential to complement traditional mineral exploration to detect new ore bodies. Finally, an approach to transfer the method to a regional scale using hyperspectral airborne data is discussed.
THURSDAY 14th december 11.50

THE FEASIBILITY OF TARGETING REES IN TAILINGS USING SATELLITE REMOTE SENSING DATA
I. PURWADI1, H. VAN DER WERFF, C. LIEVENS AND C. HECKER1 ITC, NETHERLANDS
Rare Earth Elements (REEs) are the main ingredient for high-tech industrial products. Fulfilling the current demand and securing the future supply is a challenging task, as the demand for REE is ever-increasing while locating new REE deposit is getting more difficult over time.
Satellite remote sensing is an established technique for acquiring physical properties of Earth’s surface materials with large area coverage and relatively low-cost. However, there is a knowledge gap in targeting REEs using satellite remote sensing. To date, existing research mainly studies the spectral reflectance of REEs in an aqueous environment or pure compounds with a few looking at soil samples.
Moreover, most existing research using mineral specimens focuses on REE-rich carbonatite as it is the main host rock of REEs. Given that the probability to encounter pure REE-bearing minerals on the Earth’s surface is small, understanding spectroscopy of a mixed element between REEs and other elements is important when targeting REEs using satellite remote sensing images.
In this study, the spectral reflectance of tailings suspected containing REEs will be related to the concentration of REEs and iron. The feasibility study of targeting REEs using satellite remote sensing data will be conducted by convolving laboratory spectra to currently available satellite sensors.
THURSDAY 14th december 12.10
MAPPING THE FOOTPRINT OF VOLCANIC-HYDROTHERMAL SYSTEMS FROM THE SHALLOW SUBMARINE ENVIRONMENT: HYPERSPECTRAL SWIR IMAGERY FROM MILOS ISLAND, GREECEJ. MILES1, 2, J. NADEN2 AND S. GREBBY3
1UNIVERSITY OF BRISTOL, UK, 2BRITISH GEOLOGICAL SURVEY, UK3UNIVERSITY OF NOTTINGHAM, UK
The submarine environment can host significant concentrations of metals (e.g. Cu, Au and Ag) and non-metals (e.g. kaolinite). When submarine settings emerge and transition into the terrestrial realm, they provide a natural on-land laboratory to study surface and near-surface features of volcanic-hydrothermal and geothermal systems. Consequently, correct identification and interpretation of preserved paleosurfaces can suggest concealed mineralisation (e.g. sinters), whilst others (e.g. paleowater table) are less diagnostic features.
A high-resolution airborne remote sensing dataset (LiDAR, digital photography, hyperspectral SWIR imagery) reveals information on paleosurface features including hydrothermal alteration from the island of Milos, Greece. The emergent island of Milos (1.4 Ma) is the western-most island in the Cyclades archipelago and hosts a variety of mineralisation styles (e.g. epithermal-like mineralisation, hypogene advanced argillic alteration and bentonite). An alteration-specific spectral library was acquired from ASD AgriSpec measurements and XRD (X-ray diffraction) mineral identification.
We will present revised alteration maps based on analysis of airborne imagery and field samples for the distribution of kaolinite, illite, smectite, dickite and alunite on Milos, to put paleosurface landforms and hydrothermal alteration in their correct hydrothermal context. For example, identifying illite, illite-smectite and smectite zones will enable the identification of the fluid upflow centres and declining temperature gradients that vector mineralisation.
Preliminary interpretation of the SWIR imagery coupled with spectroradiometry measurements and XRD results from field samples suggest a dickite-alunite signature, indicative of high temperature hypogene acid-sulphate alteration, localised to eastern Milos. In the west of the island, by comparison, an adularia-sericite signature prevails. However, this can also be spatially associated with alunite- and kaolinite-rich zones. Though in this case, alteration is the result of low temperature steam heated fluids and emphasises the need for field observations to reveal important information regarding the origin of hydrothermal fluids and implications for nearby mineralisation or lack of.
THURSDAY 14th december 13.30
MAPPING THE MILH KHARWAH SALT DIAPIR SAB’ATAYN BASIN, YEMEN
L. JESSEN1, 2, G. TARI1, P. KENNELLY2, A. SALMAN3, A. GOW4 & D. HUM-PHREVILLE4
1 OMV EXPLORATION & PRODUCTION GMBH, AUSTRIA2 COLLEGE OF EARTH AND MINERAL SCIENCES, THE PENNSYLVANIA STATE UNIVERSITY, USA3 OMV (YE BL.S2) EXPLORATION GMBH, YEMEN4 DIGITALGLOBE INTERNATIONAL, UK
The Sab’atayn Basin in Yemen is a hydrocarbon-rich region with a complex history of salt tectonics. The basin is charged by multiple intervals of source rocks from the Upper Jurassic, including the prolific oil-prone Madbi formation, containing sandstone, evaporite and shale members. The younger Sab’atayn formation contains several massive salt intervals, which following extensional episodes in the Cretaceous, now form critical pre-salt and intra-salt traps as well as seals for the regional plays. The cooling effect of the numerous subsurface salt diapirs is also important for assessing source rock maturation in basin models.
In a first-time technology project, OMV is using multispectral imagery to analyze the surficial geology of this remote and conflict-stricken region. Sixteen band VIS-NVIR and SWIR World-View Three imagery covers the Milh Kharwah salt diapir, an outcrop of the Upper Jurassic salt clearly visible on a vintage 2D seismic line running directly across the diapir. Examination of natural color satellite imagery of the diapir indicates a high likelihood that non-evaporitic sedimentary stringers interlaid in the salt are also exposed at the surface. Identifying these stringers, any remnants of a gypsum-anhydrite caprock, or possibly the apparently missing/eroded Upper Cretaceous strata is useful for further interpreting the geologic history and hydrocarbon potential of the area.
To analyze the high-resolution WV-3 imagery a variety of remote sensing techniques are tested in ArcGIS and QGIS with the primary objective of creating a lithogic map of the diapir. In 2016 a field team successfully obtained rock samples from inside the diapir and around its perimeter. Analyses of these samples and reports from a well drilled directly into the diapir confirm some of the lithologies and spectral signatures identifiable in the imagery. The resulting lithologic maps are used to develop a more detailed understanding of internal salt geometries and potential exploration targets.
THURSDAY 14th december 13.50

COMBINING AIRBORNE GEOPHYSICS AND SATELLITE IMAGERY TO EXPLORE FOR LITHIUM BRINE AT DEPTH IN CORNWALL, SW ENGLAND
C. M. YEOMANS1,2, L. BATESON2, C. HARKER3, K. HICKS4, K. COLTHIER5, R.K. SHAIL1, J. WRATHALL3, A. HARTWELL6 & THE “LITHIUM PROJECT” TEAM1 CAMBORNE SCHOOL OF MINES, UK, 2 BRITISH GEOLOGICAL SURVEY, UK, CORNISH LITHIUM LTD, UK, 4 CARRAK CONSULTING, UK, 5 NORTH COAST CONSULTING, UK, 6 SATELLITE APPLICATIONS CATAPULT, HARWELL, UK
The “Lithium Project” (or “Space Enabled Exploration And Monitoring Of Cornwall Lithium Resources” to give its full title) is a government-industry-academia collaborative research project funded by Innovate UK through the Satellite Applications Catapult. The work presented here is from Work Package 2 (WP2), which aims to identify indicators for prospective lithium brine at depth. WP2 will combine Tellus South West airborne geophysical data with newly acquired high resolution satellite products to explore for a new lithium resource. Lithium is an important metal in the production of lithium-ion batteries and the electric car industry, but the adoption of lithium-ion technology to store renewable power is also seen as a major area of growth. The global lithium-ion battery market size is expected to be $46.21 billion by 2022 (Allied Market Research, 2016). Exploration for new sources of lithium are a matter of importance and historical records of lithium-rich brine upwelling in Cornish mines has been cause for investigation.
SW England hosts a diverse assemblage of metals and is one of the most intensely mined regions in Western Europe. There is no historical mining of lithium although lithium-micas are prevalent in the granite. Research into the extraction of lithium from mica has yet to produce an effective processing method. The presence of lithium in geothermal brines in Cornwall has been known since 1864 but recent changes in technology now make such deposits potentially extractable.
Lithium brines are inferred to be found in deep aquifers and associated with major NW-SE fault systems. These fault systems are known to display haematisation and are associated with kaolinization and illitization (Pysrillos et al., 2003). Heat-flow may be increased through these structures and be prospective for geothermal energy. Current areas for exploration are guided by historic records of lithium brine in proximity to major fault structures on the flanks of large granite bodies. If successful the project could enhance the prospects of developing a large-scale lithium extraction industry in the UK.
At the time of writing, a call for satellite products is out to tender. Work on the data will commence in the last quarter of 2017 and we are confident of reporting some exciting results in Lisbon.
THURSDAY 14th december 14.10

ADVANCED MINERAL MAPPING USING VISIBLE TO NEAR INFRARED, SHORTWAVE AND LONGWAVE INFRARED HIGH SPECTRAL RESOLUTION DATAV. KOPAČKOVÁ1 AND L. KOUCKÁ1
1 REMOTE SENSING CENTRE, CZECH GEOLOGICAL SURVEY, KLÁROV 3, PRAGUE, CZECH REPUBLIC
Independent spectral analysis is usually employed to analyze hyperspectral optical (visible: VIS, near infrared: NIR, shortwave infrared: SWIR) and thermal (longwave infrared: LWIR) data.
The integration of the spectral information provided by different wavelength ranges and a consequent complex classification remains still challenging. In this paper we will demonstrate the benefits of mineral classification employed to optical and thermal high spectral resolution data when using new tools (QUANTools) developed at the Czech Geological Survey (CGS).
These tools allow automatic detection of multiple absorption feature parameters to classify high spectral resolution data. One of the main advantages on using these new tools is that prior definition of endmembers is not requested to classify hyperspectral data.
As inputs diverse reflectance as well as emissivity data, either in a form of spectral libraries or image data, are used to model desire parameters. In that way QUANTools also allow diverse sensor information fusion and integration.
THURSDAY 14th december 14.30

MIXING ZONES IN DEBRIS FLOW: NEW ADVANCES COMBINING NIR AND SPECTROMETRY
F BARATA, A GIBSON, P ROWLEY, E BUTCHER, M WHITWORTH1
1 UNIVERSITY OF PORTSMOUTH – SCHOOL OF EARTH AND ENVIRONMENTAL SCIENCES – CENTRE OF APPLIED GEOSCIENCES, UK
A debris flow is a moving mass of loose mud, sand, soil, rock, water and air that travels down a slope under the influence of gravity. They are one of the most damaging geological hazards, responsible for many thousands of fatalities each year, for instance Leyte in 2006 which killed 1000 (Evans et al. 2007) or Zhouqu debris flow of 2009 which killed 1800 (Tang et al. 2011).
Knowledge of these processes is limited by the design of laboratory experiments using analogue techniques (e.g. Shea and van Wyk de Vries, 2008 and Longchamp et al., 2016). Though useful in understanding either the internal arrangement of debris flows or surface topography, such experiments fail to link these as a system and therefore result in limited understanding.
This work uses near-surface hyperspectral probes and surface hyperspectral camera to quantitatively characterise the internal arrangement and surface expression of laboratory flows created by mobilising spectrally discrete (coloured) debris (sand) under controlled conditions. By analysing the internal and external arrangement of particles of different flow deposits we will, for the first time, develop an integrated description and analyses of pre- and post-flow particle mixing within the debris mass and at surface.
Further experiments are in development to better test the hypothised mixing and morphology characteristics, in addition to how cohesion will affect the debris-flow. By increasing the experiment size, it will be possible to compare and analyse the effect of cohesion in the flows and compare its internal mixing with the dry flows.
The outcome of this project will lead to a new understanding of debris-flow mitigation (engineering perspective) and with hyperspectral techniques it will be possible to understand debris flows on planetary bodies (remote sensing perspective).
THURSDAY 14th december 16.00

PREDICTING TAILINGS DAM FAILURE USING SATELLITE MULTIPOLARIZATION SYNTHETIC APERTURE RADAR SYSTEMS
N. PENDOCK1
1 BANGA BANGA, SOUTH AFRICA
The Fundao dam tailings dam collapsed on 5 November 2015 and 19 people in the village of Bento Rodrigues, 3 Km downstream, lost their lives. The biggest ecological disaster in Brazilian history will likely cost BHP Billiton and Vale many billions of dollars in fines and remediation charges.
An analysis of a time series of seven satellite synthetic aperture radar images taken in the three months prior to the collapse, the last imaged the day before disaster struck, reveal increasing moisture inundation of the dam wall.
The dielectric constant for sand, sludge and slurry in tailings dams may be estimated at spatial resolutions of 5m and 3m using the C-band Sentinel-1 system of the European Space Agency and the Japanese ALOS L-band system. This is achieved using the differential response of the material to various polarizations of the interrogating radar wave.
Revisit time of 12 and 14 days respectively allows for reasonable monitoring systems to be implemented. This technique also has application to monitoring slope stability in opencast mines and will likely become a useful monitoring technique as global rainfall patterns become increasingly erratic in the era of global climate change.
THURSDAY 14th december 16.20
cgg.com/npa
NPA Satellite Mapping
Integrated exploration offersOnly CGG can effectively integrate data from space to the sea floor and below.
We have discounts for the following multi-client studies:
•Myanmar, Middle East and African geological mapping studies•Regional and Global Seep Explorer •New offshore seepage studies released for Brazil and Trinidad & Tobago•CGG-integrated seeps, geology and seismic data available for offshore Gabon,
Porcupine and Australia
As well as competitive pricing for:
•Site monitoring services using the latest high resolution optical or SAR•High resolution Digital Elevation Models (DEM’s)•InSAR surface deformation studies
Contact: Mike [email protected]

TOWARDS THE COMPILATION OF A TERRAIN-CORRECTED BACKSCATTER DATABASE OF GLACIO-VOLCANIC LAND COVER TYPES
J DITTRICH1, B FRIEDL1, D HÖLBLING1, G BIRKEFELDT MØLLER PEDERSEN2, T SAEMUNDSSON3, S GUÐMUNDSSON4
1 DEPARTMENT OF GEOINFORMATICS – Z_GIS, UNIVERSITY OF SALZBURG, AUSTRIA, 2 INSTITUTE OF EARTH SCIENCES, UNIVERSITY OF ICELAND, 3 FACULTY OF LIFE AND ENVIRONMENTAL SCIENCES, UNIVERSITY OF ICELAND, 4 SOUTH EAST ICELAND NATURE RESEARCH CENTER (NATTSA)
Terrain variations affect both the position of a given point on the Earth´s surface and the radar brightness of the target observed by synthetic aperture radar (SAR). Without taking terrain effects into account, the estimated backscatter coefficients are biased and meaningless. Precise backscatter estimates enable a more stable use of retrieved SAR signals in applications such as land cover classification, monitoring of deforestation, and delineation of snow covered areas.
This study applies a backscatter normalization concept to derive actual land cover induced backscatter estimates from dual-polarized Sentinel-1 data. We aim to generate a universal terrain-corrected backscatter database (gamma naught) primarily focusing on the glacio-volcanic land cover types in a study site located in southeast Iceland, i.e. an area east of Öræfajökull.
The Öræfajökull massif is composed of basaltic and silicic rocks (lava flows, hyaloclastite and intrusions) as well as sedimentary rocks. The area is strongly influenced by the rapid retreat of the Vatnajökull glacier, which causes significant isostatic uplift. In addition, the interaction of tectonic, volcanic, glacial and extreme weather processes causes progressive changes in land surface morphology.
A major focus is the compilation of SAR backscatter signatures for identifying specific geological and geomorphological features (e.g. glacial flutes, moraines, glaciofluvial deposits) present in the study area. The generated backscatter database may allow inter-comparisons across different SAR sensors, different acquisition modes and different tracks. The normalized backscatter information is validated with ground truth information collected at similar points in time compared to the Sentinel-1 acquisition dates and compared to geological maps.
THURSDAY 14th december 16.40

THE ROLE OF EO FOR SUPPORTING RESILIENCE – FROM NATIONAL SCALE THROUGH CITY SCALE TO LOCAL SCALE
J. MANNING11 ARUP, UK
FRIDAY 14th december 09.40
THE APPLICATION OF SATELLITE-BORNE REMOTE SENSORS FOR MONITORING COASTAL EROSION AND ECOSYSTEMS IN IRELAND.
D. MAGUIRE1, E. FARRELL1
1 NATIONAL UNIVERSITY OF IRELAND GALWAY
Advances in the resolution and availability of imagery from satellite-borne remote sensors have presented an opportunity to utilise the data for near real-time monitoring of coastal erosion and coastal ecosystems. This research project focuses on developing a technique for measuring changes in coastal geomorphology and vegetation cover using a combination of synthetic aperture radar and multispectral imagery.
The technique is being developed, tested and refined using data collected from two study sites on the west coast of Ireland. Extracted shoreline positions are validated against aerial photography and LiDAR archives and repeat field survey data. Time series analyses are used to determine localised erosion rates and forecasting techniques will be utilised to produce predicted shoreline positions for years 2020, 2030 and 2050. These results will be benchmarked against equivalent shoreline predictions published in the Irish Coastal Protection Strategy Study.
The imagery will further be used to generate vegetation maps for the purposes of monitoring the ecological status of coastal habitats (with respect to the EU Habitats Directive) and identifying and delineating areas of invasive vegetation species such as sea-buckthorn (Hippophae rhamnoides) and Chilean-rhubarb (Gunnera tinctoria).
The results will be of wider interest to coastal ecologists, geomorphologists, managers and engineers involved in coastal research and preservation. In particular, the research can inform coastal management strategies for coping with the increased storminess predicted by future scenarios described in many climate models.
FRIDAY 14th december 10.10
SLOPE STABILITY ASSESSMENT OF TWO COASTAL LANDSLIDES ON PORTLAND, DORSET
A. OYEBAMIJI1
1 UNIVERSITY OF PORTSMOUTH, UK
The Isle of Portland is a massive block of limestone extending over an area of about 7.24km by 2.82km. It exists as a tilted island, 400ft above sea level, located in the South of Weymouth resort, Dorset, England, at 500 45’N, 020 26’W. Northwards, jagged, steep cliffs dominate while plateaus with a seaward dipping slope prevail in the south.
The oldest formation, impermeable Kimmeridge Clay Formation contains abundant fossils and is well researched for its oil production. It is overlain by the permeable dolomitic Jurassic Portland Group consisting of marine deposits of Sands and Limestones.
This underlies the Purbeck Group which comprises of sediments from a wide range of origins, after which lies the Superficial deposits from quarry-induced and mass moved debris. The presence of the permeable upper layers over the impermeable older strata results in numerous landslides.
This research aimed at measuring and modelling the present slope stability of the area, with an emphasis on analysing the mechanisms of failure at the Osprey and Southwell landslides. This is performed by determining the geotechnical parameters of the lithologies based on literature review, which is accompanied by engineering geomorphological mapping.
2m resolution of the Light detection and Ranging (LiDAR) data was processed to produce the slope angles, profile curvature and slope profiles within the ArcGIS software 10.4 package. The geotechnical parameters derived from academic publications were also inputted into the RocScience Suite for modeling of the slope stability. Results show active, ongoing instability of the Osprey and Southwell landslides with a 100% probability of occurrence and reliability index greater than three.
FRIDAY 14th december 10.30

CLASSIFICATION OF LANDSLIDE ACTIVITY BASED ON ADVANCED DINSAR DATASETS
A. KALIA1
1 FEDERAL INSTITUTE FOR GEOSCIENCES AND NATURAL RESOURCES (BGR), GERMANY
Landslide inventories are an important datasource to enable responsible authorities to perform regional scale hazard and risk analysis. However, up-to-date information of landslide activity is often missing. Advanced differential interferometric SAR processing techniques (A-DInSAR), e.g. Persistent Scatterer Interferometry (PSI) and Small Baseline Subset (SBAS) are able to measure surface motions with a high precision, a large spatial coverage and a high spatial sampling density compared to terrestrial measurement techniques.
The technological progress and the existence of multiple spaceborne SAR missions, ensuring long-term data availability, result in an increasing interest within the geohazard community to use this technology for updating landslide inventories.
This presentation focuses on the workflow for (semi-) automatic landslide inventory updates. The workflow consists of preparation of the PSI datasets (projection of the LOS velocity vector into slope direction), probabilistic classification of the landslide activity (using e.g. the sensitivity of the SAR acquisition geometry and a landslide susceptibility model) and an accuracy assessment.
A current pilot study, based on Sentinel-1 and TerraSAR-X PSI datasets, ancillary data (landslide inventory, lithological map, DEM) and ground-truth data is used to demonstrate the workflow. The area of interest is located in the valley of river Moselle in Rhineland-Palatinate and is characterized by various landslide types, ranging from e.g. soil creep, shallow landslides, deep seated rotational landslides to rock falls. Finally, the results of the accuracy assessments are presented and the transferability of the proposed workflow is discussed.
FRIDAY 14th december 11.30

INVESTIGATING THE RELATIONSHIP BETWEEN GROUND DEFORMATION, GROUNDWATER TABLES AND THE UNDERLYING GEOLOGY IN LONDON, UK, USING PSINSAR DATA FROM 1992 TO PRESENTC. BISCHOFF1, M. BASILICO2, A. FERRETTI2, D. MOLINARO2, C. GIANNICO2, R. GHAIL1, P. MASON3 1 DEPARTMENT OF CIVIL & ENVIRONMENTAL ENGINEERING, IMPERIAL COLLEGE, UK, 2 TELE-RILEVAMENTO EUROPA (T.R.E.) ITALY 3 DEPARTMENT OF EARTH SCIENCES & ENGINEERING, IMPERIAL COLLEGE, UK
Recent tunnelling activities in London, such as the Crossrail project, exposed the need for an improved and more detailed model of London’s geology (Royse et al., 2012). As an alternative to conventional surveys, analysing ground deformation patterns revealed in PSInSAR data could improve the prediction of ground conditions in London.
Unexpected faulting was met in several locations during the tunnelling of Crossrail and there are indications that these structures are still actively deforming (Aldiss et al., 2012; Black, 2017; Dodge, 2016; Duarte and Davis, 2014). The scale of this tectonic movement is expected to be small (ca 1mm/year), although it is not clear whether it is continuous or directly visible in the PSInSAR data. However, it is known from well data that the majority of faults in London act as barriers to ground water flow (Environment Agency UK, 2017). The settlement patterns resulting from water abstraction for construction are influenced by existing faults and geological strata such as river deposits. Analysing this interaction in areas with known ground conditions could be used to help predicting ground conditions in other, less well understood locations.
The available data covers the past 25 years almost continuously. The data analysed include data stacks of ascending and descending geometries from ERS and ENVI satellites covering the time 1992-2010; a high resolution, descending TerraSAR-X data stack covering 20112017; ascending and descending data stacks from Sentinel-1 covering 2015-2017. All data was processed by TRE ALTAMIRA using the SqueeSARTM algorithm. Ascending and descending geometries allow the decomposition of the Line of Sight (LOS) deformation vector into East-West and Vertical motion.
Presented are results of an investigation into whether: 1. - the scale and nature of tectonic movement in London is such that it can be directly detected in PSInSAR data. If there is tectonic movement, it should be most clearly visible in the horizontal component of the LOS vector. 2. - water abstraction settlement patterns can be related to and potentially predict London’s geology.
FRIDAY 14th december 11.50

AUTOMATED INSAR PROCESSING AND TEMPORAL ANALYSIS FOR THE MONITORING OF OIL FIELD SUBSIDENCE CAUSED BY STEAM INJECTION
S. WYSEMAN1, J. WESSELS1, G. STAPLES2 AND K. JONES1
1 PCI GEOMATICS, CANADA.2 MDA SYSTEMS LTD., CANADA.
The objective of this study is to assess the feasibility of using InSAR measurements to monitor surface deformation over oil fields when bitumen is extracted using a process termed Cyclic Steam Stimulation (CSS).
We will demonstrate that the automated interferometric processing system developed by PCI is capable of performing long term temporal analysis on coregistered subsidence maps to accurately measure subtle changes in local topography. An understanding of the long term temporal changes in local topography provides insight into reservoir volume and pressure and can be used to monitor the movement of the injected steam and determine the permeability of the surrounding area.
Since CSS results in significant volumetric strain of the reservoir, the ability to accurately map and analyze deformation over long time intervals is of significant commercial value.
The approach required the installation of corner reflectors on pipeline-pilings which respond to the surface deformation induced by the CSS process. A total of 8 RADARSAT-2 UltraFine data sets covering the period between September 2009 and February 2010 were processed. The algorithms developed by PCI were applied to the data to estimate millimeter-scale surface deformation. The processing steps are designed for non-SAR experts with many of the required InSAR parameters automatically generated from the image metadata.
For each temporal interval, the data sets are automatically coregistered, adaptively filtered, phase adjusted for flat earth and topographic effects, refined for orbital effects and phase unwrapped. Each output layer is converted to a common gridded map projection for temporal analysis. The temporally ordered layers are automatically merged and converted to velocity and/or cumulative displacement. A visualization tool is available to display either velocity or cumulative displacement as a function of time for the current cursor position.
Comparisons between the surface heave model and the InSAR measurements for the corner reflectors will be provided. Images illustrating the InSAR derived cumulative deformation over the entire reservoir region will also be shown.
FRIDAY 14th december 12.10
MULTI-SCALE CHARACTERIZATION OF THE JAGÜELITO DEPOSIT (ARGENTINA) HYDROTHERMAL ALTERATION, USING MULTISPECTRAL WORLDVIEW-3, HYPERSPECTRAL CORE SCANNING AND POINT-REFLECTANCE DATA
D. DUCART1, H. KONDRASOVAS1, M. GONZALEZ1, C. SOUZA FILHO1, AND A. NAVARRO2 1 INSTITUTE OF GEOSCIENCES, STATE UNIVERSITY OF CAMPINAS (UNICAMP), BRAZIL, 2 GEOPEHUEN, ARGENTINA
Jagüelito, a high sulfidation gold deposit located in the southeast sector of the El Indio-Pascua Lama precious metal belt, is related to Miocene volcanism hosted in a Permo-Triassic basement.
This deposit has an intense hydrothermal alteration, located mainly in volcanoclastic units. The alteration was studied in different scales using spectral technologies. The physical limits and the mineral zonation were mapped with the Worldview-3 multispectral sensor. The results were validated with field ultraspectral FieldSpec-4 data.
Spectra were also collected every two meters on 6,740 meters of drill cores. Some 3,600 spectra were processed with the TSG-8 software. Abundance of alunite, dickite, kaolinite, pyrophyllite, illite, and muscovite were mapped. Composition of alunite, between Ca-alunite, Na-alunite and K-alunite, were recognized. In representative samples of drill core, hyperspectral images were obtained with the Specim/SisuCHEMA camera.
The results assisted in the mapping of the advanced argillic, argillic, silicic and phyllic alteration of the deposit. Different hydrothermal events were recognized using these spectral technologies, providing valuable information for the hydrothermal evolution of the system.
FRIDAY 14th december 13.30
MAPPING EPITHERMAL ALTERATION MINERALOGY WITH HIGH SPATIAL RESOLUTION HYPERSPECTRAL IMAGING OF ROCK SAMPLES
I. CONTRERAS1
1 ITC FACULTY, UNIVERSITY OF TWENTE. ENSCHEDE, THE NETHERLANDS
Classifications of alterations zones have been done qualitatively, based on the minerals that exist or not in the alteration system. This results in a problem since minerals such as alunite can be formed by either hypogene or supergene processes. For mineral exploration purposes, these two groups should be mapped separately from each other to recognize which accumulations are prospective for important ore accumulations.
This research uses the high-sulfidation epithermal system in the Rodalquilar Caldera Complex where hypogene alteration is associated with gold accumulations, and also supergene overprinting patterns occur. A total of 22 images were acquired with the high spatial resolution hyperspectral SWIR SPECIM camera, allowing not only to quantify mineral concentrations in a more representative way but also to evaluate the spatial distribution of the minerals in the samples. After the images were pre-processed for calibration issues, spectral and chemical differences of alunites were studied.
As a validation of the alunite study, Inductively Coupled Plasma/Optical Emission Spectrometry and Thermogravimetric analyses were carried out. The Iterative Spectral Mixture Analysis (ISMA) algorithm was used and led to a more realistic quantification of the concentration of the minerals. The quantification of the aggregated partial fractions of the minerals per pixel was done to classify the rock samples. Spectral differences were found in alunites from the Rodalquilar. For the hypogene and supergene alunite, chemical differences were encountered in the composition and structure of the two minerals. K rich alunite is confirmed to have the 1480 feature at short wavelengths.
FRIDAY 14th december 13.50
THE INFLUENCE OF GEOLOGICAL SAMPLE SURFACE PREPARATION ON TIR SPECTROSCOPY
E. ROST1, C. HECKER1, F. VAN DER MEER1, M. SCHODLOK2
1 FACULTY OF GEO-INFORMATION SCIENCE AND EARTH OBSERVATION (ITC), UNIVERSITY OF TWENTE, NETHERLANDS 2 FEDERAL INSTITUTE FOR GEOSCIENCES AND NATURAL RESOURCES (BGR), GERMANY
Hyperspectral imaging of rock samples and drill cores is a promising and powerful tool in the field of geological remote sensing. It can be used to continuously analyze big datasets with a submillimeter spatial resolution allowing identification of trends in mineral assemblages. However, research has shown that changes in sample surface roughness influence the spectral signature both in spectral contrast as well as in spectral shape (Kirkland et al. 2002a; Kirkland et al. 2003; Hardgrove et al. 2016). The research presented here studies and quantifies the influence of surface roughness differences resulting from various sample preparation methods on the measured spectra, and their effects on the projected sample composition. To determine how surface roughness influences the spectral signature , different sample surface preparation methods (e.g. saw, split and polish) are applied to three rock types: a pure quartz sandstone, a quartz sandstone that also contains kaolinite, and a medium grained gabbro. To eliminate influence of sample heterogeneity, the selected samples have a limited mineral variation, homogeneous mineral distribution and a uniform grain size. Thermal infrared (TIR) point measurements where conducted on the non-imaging Bruker Vertex 70 FTIR reflectance spectrometer, with an external integrating sphere which allows for measurements in directional hemispherical reflectance (DHR). TIR images where obtained with the SPECIM AisaOWL TIR imaging spectrometer. Scanning electron microscopy (SEM) and profilometer measurements where conducted for surface analyses and quantitative x-ray diffraction (QXRD) was conducted to validate the sample composition. The results of this study show that changes in surface roughness result in changes in the spectral signature both in spectral contrast as well as in spectral shape. Observed spectral changes are peak position shifts and variation in relative peak contrast. Furthermore, the changes in spectral shape influence spectral unmixing resulting in distinct differences in the derived mineral composition. This shows that the influence of sample surface preparation should be taken into account, especially when working with proximal hyperspectral imaging.
FRIDAY 14th december 14.10

Hyperspectral Cameras and Acquisition Solutions for all Applications
Visit the HySpex stand for more information and sample data.
www.hyspex.no

REGIONAL GEOTHERMAL INVENTORIES USING SATELLITE LWIR AND SWIR IMAGERY
M. SEARS1, N. PENDOCK1 1 SCHOOL OF COMPUTER SCIENCE AND APPLIED MATHEMATICS, UNI-VERSITY OF THE WITWATERSRAND, SOUTH AFRICA
Humans use 18TW of energy each year while 44TW of energy per annum is radiated from the core and mantle into space. Geothermal energy has the potential to satisfy global energy requirements.
We discuss how remote sensing images may be used to map geothermal resources and present a heat flow map for Botswana derived from a timeseries of daytime and nighttime Modis temperature images at 1Km resolution. We calibrate these satellite derived heat flow images with estimates derived from regional aeromagnetic surveys and achieve a correlation of 0.96.
Increasing resolution by an order of magnitude, we show how nighttime Aster long wave infrared [LWIR] imagery corrected for elevation, vegetation cover and surface emissivity can be used to map hot springs as temperature anomalies.
These targets may be upgraded to geothermal resources by noting the presence of hydrothermal alteration halos of particular minerals. In the case of Seferihisar, Turkey, hornblende is altered into biotite through hydrothermal action.
FRIDAY 14th december 14.30

TARGETING COPPER AND GOLD IN VEGETATED AREAS OF COLOMBIA USING LWIR SATELLITE IMAGERY
D. FOREST1, N. PENDOCK2
1 N-SIDE MINING, VANCOUVER2 N-SIDE MINING, CAPE TOWN
The Andean mineral belt of South America produces 40% of the world’s copper. Production is from porphyries, skarns and manto deposits. Colombia represents the northern extent of the belt and there is little historical exploration and development due to past political instability. Historic surveys for gold and copper have reported deposits in unexplored areas of Colombia.
We embarked on a desktop study of the Cesar Department of northern Colombia. The terrain is moderate to densely vegetated ruling out traditional VNIR and SWIR remote sensing. In addition, target minerals such as chalcopyrite lack diagnostic responses in these regions of the EM spectrum.
LWIR temperature/emissivity separation followed by sparse spectral unmixing mapped significant chalcopyrite targets along with alunite, quartz and clays, indicative of nearby porphyry / epithermal potential. Fieldwork confirmed the LWIR targets as well as alunite and clay alteration and produced some viable targets for further exploration.
LWIR is a rapid and cost effective tool for mineral exploration in vegetated terrains, and particularly effective in narrowing large areas of permissive mineral tracts down to discrete targets that can be checked by field visits.
FRIDAY 14th december 14.50

SELECTION OF PARAMETERS FOR AUTOMATIC SWITCH BETWEEN LINEAR AND NON-LINEAR SPECTRAL UNMIXING
A. AHMED1, O. DURAN, Y. ZWEIRI AND M. SMITH1 KINGSTON UNIVERSITY, UK
Spectral unmixing is the process of identifying the constituent spectra of the mixed pixel, also called endmembers and computing the corresponding proportions or abundances within each pixel in a given image.
Many spectral unmixing methods have being proposed in the literature based on linear or nonlinear models. The linear model is usually adopted providing that the mixing process occurs at macroscopic level and that photons interact with a single material before reaching the sensor. When those assumptions do not hold, more complex nonlinear models are to be used.
However, there is no methodology to decide whether the linear or non linear methods provide more accurate results for particular images. Here we propose to study and identify suitable spatial and spectral features in the data in order to robustly choose the most suitable method among linear and non linear approaches. Neural networks are used to assess the validity of the different features.
Different sets of low and high order statistical parameters in both the spectral and spatial domains and spectral distances are assessed. To prove the validity of the chosen features, the switch is made between state of the art methods such as the Vertex Component Analysis (VCA) and Fully Constrained Least Square Method (FCLS) for the linear models, and the Polynomial Post Nonlinear Mixing Model (PPNMM) and Generalized Bilinear Model (GBM).
poster Presentation

A COMPARISON BETWEEN TERRASAR-X AND SENTINEL-1 PSINSAR DATA FOR INFRASTRUCTURE MONITORING IN LONDON, UK C. BIRSCHOFF1 M. BASILICO2, A. FERRETTI2, D. MOLINARO2, C. GIANNI-CO2, R. GHAIL1 AND P. MASON1 1 IMPERIAL COLLEGE, UK2 TRE-ALTAMIRA, ITALY
PSInSAR is increasingly becoming a standard technique for ground deformation monitoring. This technique is frequently used to assess the surface impact of large subterranean infrastructure projects such as new Metro lines, but can also be applied to observe long-term trends in motion of surface structures such as bridges. Large urban areas like London (UK) are especially suitable for the use of PSInSAR, because man-made structures are generally permanent scatterers with a high coherence and therefore provide a very high measurement point density and reliability in urban areas.
The limit of detectable motion and number of measurement points in a PSInSAR data stack is strictly dependent on some key parameters such as resolution, wavelength and orbital parameters like the repeat cycle. Considering only the wavelength of a sensor, a shorter wavelength implies higher sensitivity to ground deformation, because for example 5mm of displacement corresponds to a larger fraction of the wavelength in X-Band (λ~1.5cm) than in C-Band (λ~5.5cm). Presented here are the results of processing a TerraSAR-X and a Sentinel-1 data stack over the Central London area using the SqueeSARTM algorithm. The data stacks contain the same number of images collected over the same time span, with similar image acquisition intervals (11 days for TSX; 12 days for Sentinel-1). This allows to underline the strengths and constraints of X-Band compared to C-Band.
Firstly, the suitability of X-Band compared to C-Band with regard to observing regional ground deformation is tested, looking at the impact of dewatering caused by Crossrail and the subsidence caused by tunnelling for the Northern Line Extension. Secondly, the use of C-Band vs X-Band data for monitoring a specific infrastructure, Blackfriars Bridge, is explored.
poster Presentation
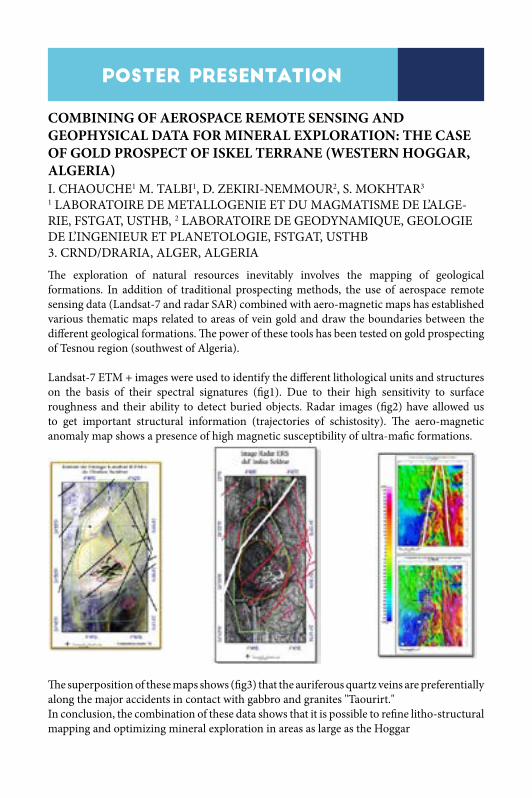
COMBINING OF AEROSPACE REMOTE SENSING AND GEOPHYSICAL DATA FOR MINERAL EXPLORATION: THE CASE OF GOLD PROSPECT OF ISKEL TERRANE (WESTERN HOGGAR, ALGERIA)I. CHAOUCHE1 M. TALBI1, D. ZEKIRI-NEMMOUR2, S. MOKHTAR3 1 LABORATOIRE DE METALLOGENIE ET DU MAGMATISME DE L’ALGE-RIE, FSTGAT, USTHB, 2 LABORATOIRE DE GEODYNAMIQUE, GEOLOGIE DE L’INGENIEUR ET PLANETOLOGIE, FSTGAT, USTHB 3. CRND/DRARIA, ALGER, ALGERIA
The exploration of natural resources inevitably involves the mapping of geological formations. In addition of traditional prospecting methods, the use of aerospace remote sensing data (Landsat-7 and radar SAR) combined with aero-magnetic maps has established various thematic maps related to areas of vein gold and draw the boundaries between the different geological formations. The power of these tools has been tested on gold prospecting of Tesnou region (southwest of Algeria).
Landsat-7 ETM + images were used to identify the different lithological units and structures on the basis of their spectral signatures (fig1). Due to their high sensitivity to surface roughness and their ability to detect buried objects. Radar images (fig2) have allowed us to get important structural information (trajectories of schistosity). The aero-magnetic anomaly map shows a presence of high magnetic susceptibility of ultra-mafic formations.
poster Presentation
The superposition of these maps shows (fig3) that the auriferous quartz veins are preferentially along the major accidents in contact with gabbro and granites "Taourirt." In conclusion, the combination of these data shows that it is possible to refine litho-structural mapping and optimizing mineral exploration in areas as large as the Hoggar

REMOTE SENSING BASED SEISMOTECTONICS OF THE NIĞDE-ULUKIŞLA REGION, SOUTH-CENTRAL TURKEY
E. GŰRBŰZ1 G. SEYITOGLU2, A. YILDIZ2 1 ASKARAY UNIVERSITY, TURKEY2 ANKARA UNIVERSITY, TURKEY
This study is based on a comparison of lineament analyses results and the seismicity of south-central Turkey. Lineament analysis is one of the widely used remote sensing methods to understand the tectonics and associated deformations in a region. The Niğde-Ulukışla region in south-central Turkey is defined as a seismically less active area within the seismically highly active framework of the country.
On the other hand, seismicity in the region indicates some linearities in the spatial distributions of earthquakes which are not corresponds the known active tectonic structures in the region, such as the Ecemiş and Tuzgölü fault zones. In this study, lineament maps of the region were prepared through digital elevation models based on 1:25.000 scaled topographic maps and Landsat-8 satellite images with different image enhancement processes.
Then the maps were correlated with seismicity in the region. The lineament maps and predominantly concentrated in NE-SW and ENE-WSW directions which are compatible with the important faults in this area. In addition to already mapped active structures in the region, the seismic activity has clearly observed along the Niğde Fault and the newly defined faults in this study which are trending approximately in an E-W direction. Our results indicate that many lineaments in the studied region may be reactivated paleotectonic structures and the seismicity potential of the Niğde-Ulukışla region should be handled within this viewpoint.
poster Presentation
REMOTE SENSING BASED SEISMOTECTONICS OF THE NIĞDE-ULUKIŞLA REGION, SOUTH-CENTRAL TURKEY
E. GŰRBŰZ1 G. SEYITOGLU2, A. YILDIZ2 1 ASKARAY UNIVERSITY, TURKEY2 ANKARA UNIVERSITY, TURKEY
This study is based on a comparison of lineament analyses results and the seismicity of south-central Turkey. Lineament analysis is one of the widely used remote sensing methods to understand the tectonics and associated deformations in a region. The Niğde-Ulukışla region in south-central Turkey is defined as a seismically less active area within the seismically highly active framework of the country. On the other hand, seismicity in the region indicates some linearities in the spatial distributions of earthquakes which are not corresponds the known active tectonic structures in the region, such as the Ecemiş and Tuzgölü fault zones. In this study, lineament maps of the region were prepared through digital elevation models based on 1:25.000 scaled topographic maps and Landsat-8 satellite images with different image enhancement processes. Then the maps were correlated with seismicity in the region. The lineament maps and predominantly concentrated in NE-SW and ENE-WSW directions which are compatible with the important faults in this area. In addition to already mapped active structures in the region, the seismic activity has clearly observed along the Niğde Fault and the newly defined faults in this study which are trending approximately in an E-W direction. Our results indicate that many lineaments in the studied region may be reactivated paleotectonic structures and the seismicity potential of the Niğde-Ulukışla region should be handled within this viewpoint.
poster Presentation

MAPPING OF EVAPORITES IN THE ULUKIŞLA BASIN BY ASTER SOUTH-CENTRAL TURKEY
E. GŰRBŰZ1 1 ASKARAY UNIVERSITY, TURKEY
Evaporite minerals formed by chemical processes depending on temperature and evaporation. These minerals represent an important subgroup of chemical sedimentary rocks. Gypsum (CaSO4.2H2O), anhydrite (CaSO4) and halite (NaCl) are the most common evaporitic minerals that can form in different terrestrial and marine basins. Evaporitic rocks are important because of their paleoenvironmental and paleoclimatic meanings in geology. On the other hand, their common usage in industry and potential as traps for oil and gas reserves make them strategic for various fields.
In Turkey, there are various marine and terrestrial evaporite deposits outcrop majorly in the Çankırı-Çorum, Sivas, Ulukışla, Tuzgölü, Haymana, Beypazarı and Polatlı-Sivrihisar basins which are known as Central Anatolian basins in Turkey. In the context of this study, basic remote sensing methods such as band rationing, decorrelation stretch, feature-oriented principal component analysis and thermal indices have been used on the ASTER images to identifying and mapping of evaporate deposits in the Ulukışla Basin in south-central Turkey.
According to our results, all the aforementioned methods are successful in mapping of evaporates, but particularly the band rationing method using SWIR bands and Sulfate Index using thermal bands accomplished than the other methods.
poster Presentation

STRUCTURAL ANALYSIS AND LINEAMENT CONTROLLED SUBSIDENCE AT MT MERU, TANZANIA
K. HAHNE1 1 BGR, GERMANY
A structural analysis based on multispectral satellite data and high- and medium resolution DEMs improves the geological and tectonic knowledge of a working area at Mt. Meru in Tanzania.
The mapped lineaments represent faults, strongly connected to the youngest movements of the ongoing rifting of the Neogene rifts. Faults of WNW orientations dominate the Mt. Meru area. Along these orientations, young hydrothermal alterations occur in the crater of the central ash cone. There are structural hints, which strongly suggest the existence of a NW-SE orientated graben structure between Mt. Meru and Mt. Kilimanjaro. This “Meru Kilimanjaro Graben” would represent the “Mt. Kilimanjaro-deflected” prolongation of the Pangani Graben.
The interpretation of InSAR results benefits well from the preceding structural analysis:
The InSAR analysis shows linear zones of subsidence at Mt. Meru, which follow the trends of existing lineaments and seem to be lineament-controlled.
poster Presentation
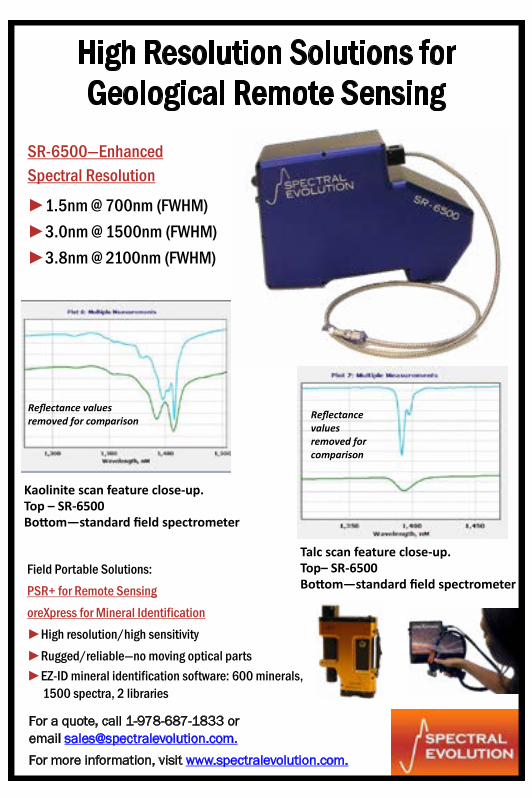
High Resolution Solutions for Geological Remote Sensing
For a quote, call 1-978-687-1833 or email [email protected]. For more information, visit www.spectralevolution.com.
SR-6500—Enhanced Spectral Resolution
►1.5nm @ 700nm (FWHM) ►3.0nm @ 1500nm (FWHM) ►3.8nm @ 2100nm (FWHM)
Kaolinite scan feature close-up. Top – SR-6500 Bottom—standard field spectrometer
Field Portable Solutions: PSR+ for Remote Sensing oreXpress for Mineral Identification ►High resolution/high sensitivity ►Rugged/reliable—no moving optical parts ►EZ-ID mineral identification software: 600 minerals, 1500 spectra, 2 libraries
Talc scan feature close-up. Top– SR-6500 Bottom—standard field spectrometer
Reflectance values removed for comparison
Reflectance values removed for comparison

THE IMPORTANCE OF QUEENSLAND’S NEW VHR SATELLITE BASELINE IMAGE MAP TO INDUSTRY (MINING, OIL&GAS) AND ‘THE REGULATOR’
P HAUSKNECHT1 1 EARTH-I, UK Earth-i has been delivering to the state of Queensland, Australia a very high-resolution base image map of their entire state – approx. 2 million km2 in size – for 2016 and the 2017 coverage is well under way. The entire area was covered with VHR satellite data from the DMC3/TripleSat constellation operated by 21AT. Other countries around the globe or individual states within them are considering similar projects with an annual very high-resolution coverage. With large area coverages like that, the price per km2 can come down substantially, hence make it affordable for the customer and still be attractive for the supplier. In addition to the DMC3 constellation, Earth-i collaborates with SIIS to bring the 3 very high resolution KOMPSAT sensors to a project. Subsequently change detection and change monitoring becomes easily feasible on a spatial scale required by urban planners, infrastructure construction planning and many others. Examples will be presented as part of this paper. As presented in another paper, at this conference, Earth-i will also have VHR data available from their own satellites in the near future.
A number of country wide / regional EO applications benefit from the NASA/USGS LandSat and/or ESA / EU Sentinel programme, which have well and truly pushed the medium resolution satellite data into the ‘Big Data’ space and service providers are fast coming up with the tools to harvest such ‘free’ data volumes. The Australian government has created their ‘Cube’ incorporating all the historic free data sets in a homogenised grid ready for applications to be applied. But for quite a few applications, like infrastructure monitoring, environmental impact assessment, detailed road mapping, urban sprawl or smart cities one needs to have very high resolution data. Otherwise the structures of interest are just not being mapped or tracked sufficient enough. At least once or twice a year is required to verify and quantify significant spatial changes. The Queensland government has recognised such requirements and provides a very high resolution base map to all its departments on an annual base. This detailed base map with a spatial accuracy of 6m or better at CE90, allows all institutions to plan according to the same data set and respective GIS being accurately represented overlaying the base map.
This very high spatial annual base image map will not only be used by the regulator, but as part of the Queensland globe, and RGB composite mosaic is free to view for all interested parties. Hence every engaged citizen, but also the corporate world, agriculture, mining, shale gas or coal companies can verify that their geospatial information provision will be fit for purpose in accordance to the governmental base map. Examples from a variety of different locations will demonstrate the usefulness and importance of such a state wide base map dataset. These datasets can now feed into the wider application of Earth Observation in Queensland, be it the hyperspectral airborne surveys for mineral exploration, the ASTER based geology mapping or the Queensland portion of the Geoscience Australia Cube of all LandSat and Sentinel dat.
It is already clear to a lot of politicians and managers that such monitoring and mapping technology is not as a ‘nice to have’, but an essential part of any responsible governments / company’s information tool box. They want to be, at any time, in a position to make the most informed decisions with an up-to-date geospatial repository, to which the very high resolution earth observation data contribute an essential part.
poster Presentation

DEM DATA ANALYSIS FOR SN-W EXPLORATION IN HIGH DENSE VEGETATION AREA, TANINTHARYI REGION, MYANMAR
S. NODA1, T. TAKEDA1 K. MASUDA1 , H. N. ZAW2, M. T. HA2 AND M. SOE21 JOGMEC, JAPAN 2 MINISTRY OF NATURAL RESOURCES AND ENVIRONMENTAL CONSERVATION, MYANMAR
In the southern part of Myanmar, Tanintharyi Region, there are a lot of Sn-W mineralization mainly characterized by the primary type related with granite and the placer type.
It is efficient for exploration to extract greisenization granite area which may be related to Sn-W occurrence by the optical sensor data such as ASTER. However, direct extraction of greisen using the optical sensor data is extremely difficult because of the high dense vegetation, tropical rainforests. In this study, we applied various DEM (Digital Elevation Model) data processing to estimation of granite distribution and interpretation of relationship between granite and Sn-W mineralization in Tanintharyi.
For identification of topographic features and discrimination of granite from meta-sedimentary rock, the elevation image with the transparent slope image made up by AW3D30 data was most effective.
The topographic features of granite distribution area in Tanintharyi from DEM data are defined as (1) Massive distribution in relatively higher elevation than the others, (2) Steep slope in particular of the boundaries with meta-sedimentary rocks, (3) Poor development of water system, (4) Development of linear ridge/valley in large distribution area. On the other hand, the dendritic drainage pattern was developed in the distribution of meta-sedimentary rock. Based on this topographic identification, we could extract new granite distribution, which is the area described as meta-sedimentary rock in existing geological map, and opposite case was also confirmed.
Moreover, most of the Sn-W mines are located within the 5 km from the boundary between granite and meta-sedimentary. The rock type discrimination and extraction of topographic information by DEM data in high dense vegetation region are useful for further exploration.
poster Presentation
HYPERSPECTRAL MAPPING OF RARE EARTH ELEMENT BEARING ROCKS IN OUTCROPS AND DIAMON DRILL CORE
M. SCHODLOK1, L. IWAN1 J. MEIMA1 , D. GOERICKE1, & D. RAMMLMAIR11 BGR, GERMANY
Rare earth elements (REE) are some of the most important components of high tech products as well as for “green” technologies and are used for the production of e. g. batteries, lasers, lenses, magnets of wind power plant turbines, modern color displays as well as fuel cells.
The EU commission declared REE as some of the economically critical raw materials in 2009. Therefore, new exploration technologies and methods have to be developed to characterize existing and to find new REE deposits, to secure the worlds need of REE oxides und to lower the dependency on a few major REE providers. In that scope the potential of hyperspectral imaging data was assessed to map rare earth element bearing mineralogy and their surrounding rocks. In situ outcrop and drill core image data covering the visible, near infrared- shortwave infrared wavelength range (VNIR-SWIR, 0.4 – 2.5 µm) and long wave infrared wavelength range (LWIR, 7.7 – 12.5 µm) were acquired at different scales with a spatial resolution varying from 25 µm, 400 µm, 1.4 mm and a few centimeters per pixel. Area of interest were selected outcrops of the FEN complex in Norway, Norra Kärr in Sweden and a selected sequence of a diamond drill core of the REE bearing carbonatite at Storkwitz, Saxony.
The spectral analysis is based on a multispectral feature extraction method and is applied on the VNIR, SWIR and LWIR data. In case of ambiguities results, a combination of diagnostic spectral features derived from the full wavelength range was applied. Geochemical data (µEDXRF and LIBS ) e.g. of selected areas on the drill core were used for validation. REE were clearly detected and their spatial distribution were mapped successfully. For the drill core sample mineral patterns indicate that more than two phases of mineralization occurred. Finally, the influence of spatial resolution on the separability of the mineral phases was investigated. All results are discussed in context to geology and the accuracy of the mineral maps are assessed by the validation data.
poster Presentation

INTEGRATION OF MINERALOGICAL AND HYPERSPECTRAL DATA FOR DRILL-CORE CHARACTERISATION
L. TUSA1, L. ANDREANI1 I. CECILIA CONTRERAS1 , P. IVASCANU3, R. GLOAGUEN AND J. GUTZMER1,2
1 HELMHOLTZ-ZENTRUM DRESDEN-ROSSENDORF, GERMANY 2 TECHNISHE UNIVERSITAT BERGAKADEMIE FREIBERG, GERMANY 3 ELDORADO GOLD CORPORATION Mineral exploration and resource definition require extensive drilling campaigns that are generally done with tight deadlines and often rely only on visual qualitative evaluation of the rock characteristics (core logging) and limited chemical analyses. The aim of these campaigns is to understand the genesis and zonality of mineral deposits. The ore, in many cases, is closely related to the distribution of hydrothermal alterations and their associated structures. Therefore, the host characteristics are analysed in order to build a distribution model of the mineralization. However, traditional techniques such as core logging can present limitations in the identification of often subtle and therefore similar mineral assemblages and the acquired data are only qualitative. Additionally, the identification and quantification of other textural and structural features, such as veins, is slow, laborious and frequently limited by the subjectivity of the observer. Our aim is to develop new methods which respond to the need for rapid, automated and precise extraction of mineralogical, textural and structural information from cores. We propose to process hyperspectral VNIR/SWIR data from core scanners, using innovative image segmentation and classification techniques in order to quickly extract precise numerical parameters of both mineralogical and structural information. We use scanning electron microscopy (SEM)-based analyses on selected samples to train the classifier and validate the results. SEM shows great potential in the identification of the main alteration assemblages as well as of the main hydrothermal events they are associated with. Even though it requires extensive sample preparation and the measurements are time consuming, by analysing representative samples for different alteration types, SEM-based analyses provide control information for the interpretation and classification of hyperspectral data. Hyperspectral data allow the identification of the main alteration phases and the distribution of specific mineral assemblages as each vein type displays a specific signature in the VNIR-SWIR region of the electromagnetic spectrum. Image segmentation techniques allow us to extract veins and additional parameters such as orientations and densities. The interest of this approach is that it (1) allows the combined analysis of compositional and structural features, (2) provides a very rapid and validated mapping of the cores that is based on (3) the upscaling of SEM data. The proposed methodology has been tested on selected core samples from the Bolcana copper-gold porphyry system (Romania). This site is located in the Golden Quadrilateral (Apuseni Mountains) where extensive drilling has been performed by Eldorado Gold using state of art methodology that includes thorough chemical analyses, detailed logging and spectral characterization of assay pulps. The mineralization in Bolcana is hosted in Neogene subvolcanic dioritic intrusions and associated magmatic-hydrothermal breccias that intruded in a shallow volcanic environment. The system is characterized by complex transitions on lithological and alteration assemblages. The porphyry mineralization is also overprinted by later epithermal events that lead to different alteration patterns than those usually encountered in porphyry systems.
The analyses of the cores collected from the Bolcana site have shown a preferential association of specific alteration assemblages with different vein generations such as white mica dominant assemblages for late stage pyrite veins, a chlorite-epidote dominant assemblage on early chalcopyrite veins and low intensity white mica dominant assemblage associated with early quartz veins. At core scale a preferential orientation of these veins was additionally observed.
The integration of this new approach with traditional logging methods performed by site geologists as well as with structural data (Reflex IQ-logger) provided by Eldorado Gold gives us an insight on the spatial and directional distribution of the main vein types and their characteristic alteration assemblages in the Bolcana site. The integration of such new methodologies in the exploration campaign allows for better and faster exploration targeting based on key mineral assemblages and structural features, as well as a more comprehensive preliminary ore evaluation and resource modelling. This would be achieved by the implementation of on-site drill-core scanning.
poster Presentation
EXTRACTION OF MICROSTRUCTURAL INFORMATION FROM ROCK SPECIMEN WITH HIGH-RESOLUTION (26 µM) SWIR HYPERSPECTRAL IMAGERYF. VAN RUITENBEEK1, H. VAN DER WERFF1 W. BAKKER1 , F. VAN DER MEER1 & K. HEIN21 ITC, UNIVERSITY OF TWENTE, THE NETHERLANDS 2 UNIVERSITY OF WITWATERSRAND, SOUTH AFRICA
In this study we attempted to extract numerical data that describe microstructural parameters of selected rocks using SWIR hyperspectral imagery. The microstructural texture of rocks is related to the size, shape and arrangement of minerals, and determined by rock type and processes of formation. Parameters describing the microstructure of rocks can potentially be produced from hyperspectral mineral maps and used to model physical and chemical properties such as metal contents, or temperature and pressure of rock formation.
Hyperspectral images were acquired with a Sisuchema imaging system at 26 µm spatial resolution between 1000 and 2500 nm from rocks with different microstructures, including igneous, sedimentary and alteration textures. The images were calibrated to reflectance and further processed to reduce noise and remove bad bands and pixels. The images were subsequently classified into mineral maps using decision trees applied to images of wavelength positions of deepest absorption features. This method of classification was chosen because of its reproducibility and the unnecessary use of thresholding of abundance images. From the objects in the mineral maps that represented mineral grains/crystals or aggregates of minerals, several spatial parameters were calculated, including object size, object size distribution, compactness and other shape parameters and orientations. Results of the spatial analyses were compared with those of petrographic analyses of the same rocks, the latter providing information on the size of mineral grains and aggregates, the type and origin of the different minerals.
It was shown that the spatial parameters can be used to differentiate between microstructural end members. Success in differentiating between different microstructures is strongly influenced by the spatial distribution and variation in spectral contrast between the SWIR active minerals in the rock. The methods presented in this exploratory study will be further developed as inputs for modeling of physical and chemical rock properties of rock.
poster Presentation

INTEGRATED LINEAMENT DETECTION FROM AIRBORNE GEOPHYSICAL DATA USING OBJECT-BASED IMAGE ANALYSIS TECHNIQUES OVER SW ENGLAND
C. YEOMANS1,3, M. MIDDLETON3 , R. SHAIL1 , S. GREBBY4, AND P. LUSTY2
1 CAMBOURNE SCHOOL OF MINES, UNIVERSITY OF EXETER, UK 2 BGS, UK, 3 GEOLOGICAL SURVEY OF FINLAND, FINLAND 4 UNIVERSITY OF NOTTINGHAM, UK
Object-Based Image Analysis (OBIA) remains an under-utilised technique for lineament detection. Reported studies have applied OBIA to satellite imagery (Mavrantza & Argialas, 2008; Marpu et al., 2008), airborne LiDAR (Rutzinger et al., 2007) and more recently airborne magnetic data (Middleton et al. 2015) for lineament detection. OBIA creates image objects which link pixel-based information and vector-based information via a topology. It is considered particularly useful for lineament detection (Sukumar et al. 2014).
Middleton et al. (2015) devised a top-down OBIA method for extracting lineaments from airborne magnetic data. The publically available Object-Based Lineament Detection (OBLD) algorithm used the line extraction tool to produce a ‘lineness’ raster and the multi-threshold segmentation tool in Trimble’s eCognition software.
Airborne geophysics from the Tellus South West project makes SW England an ideal case study region. The structural geology of SW England is complex and is integral to the world-class tin-tungsten mineralisation. Regional mapping is inconsistent despite geological mapping by the British Geological Survey. A regional lineament analysis of Landsat TM data completed by Rogers (1997) was inconsistent across scenes and required a coarse resolution to be effective.
Airborne geophysics circumvents the problems encountered by Rogers (1997). We develop the OBLD algorithm of Middleton et al. (2015) to integrate airborne magnetic, radiometric and LiDAR data. Additionally, we add metadata relating to the source of the lineament to the final polyline data.
Furthermore, we present an alternative bottom-up OBIA method. The bottom-up approach uses multi-resolution segmentation across the whole image scene. Image objects are classed as ‘major’ or ‘minor’ by thresholding the ‘lineness’ raster. The final polyline data contains metadata to determine major and minor lineaments but lacks information on the source data.
Integrated lineament detection from airborne geophysical datasets through OBIA methods has yielded the most consistent structural lineament map over SW England to date. The data will provide key information identifying new mineral deposits, geothermal energy targets and prospective areas for novel resources such as lithium brine.
poster Presentation

EVOLUTION OF THE DEFORMATION AROUND THE GRANITIC BLOCKS OF THE REGION OF DJANET (EASTERN HOGGAR, ALGERIA)D. ZEKIRI-NEMMOUR1 AND Y. MAHDJOUB11 LABORATORY OF GEODYNAMICS, ENGINEERING GEOLOGY AND PLANETOLOGY, FSTGAT/USTHB
The Djanet area is located at the northeast extremity of eastern Hoggar. It covers the entire terrane of Djanet and part of the terrane of the Edembo.
This region is made up of a Neoproterozoic basement, itself consisting of two sets: (1) a granito-gneissic unit flushing in the Edembo terrane, and (2) an epizonal meta-sedimentary unit of neoproterozoic, intruded by post-orogenic granitoids forming the Djanet terrane. This basement is surmounted by the paleozoic Cambro-Ordovician sandstones of Tassili n'Ajjer.
The neoproterozoic schistose formations of the Djanet series which constitute the enclosure of all the post-orogenic granites of the Djanet region are characterized by disturbances of the regional schistosity.
The methodological approach of mapping these structural elements in the shale formations of the Djanet region is based essentially on the combination of classical field methods and techniques for digital processing of satellite images from Google Earth with a resolution of one meter and the interpretation of band reports for Landsat-7 ETM + images.
The analysis of the deformation fields around the granites shows that the perturbations of the regional schistosity materialized by folds are rather related to synchronous shears at the placement of the granites of global direction NW-SE to N-S.
In the North of Djanet, this evolution in the style of the wrinkling is accompanied by a rotation of the axial surfaces. The axial surfaces intensify and change direction gradually from NW-SE to N-S. We observe upright folds or overturned westward and with slightly plunging axes towards the NW.
Moreover, it is observed that this reorientation of the axial surfaces follows the direction of shear NW-SE to N-S.
We can thus deduce that the existence of these structures testifies to an old ductile deformation NS later taken up by a brittle deformation.
poster Presentation

WWW.GRSG.ORG.UK
Website & GRSG Membership
Three membership types are available for the GRSG:
• Individual (£40 annually)• Student/Retired (£7 annually)• Corporate (£200 annually)
• There are a variety of benefits to becoming a GRSG member:• Priority access to the regular newsletter and past conference presentations• Reduced conference registration fees for the Annual General Meeting typically
held every year at The Geological Society of London• Student members can apply for student awards to aid research in geoscientific
remote sensing• Corporate members are entitled to distribute the GRSG newsletter within their
organisation and to have their corporate-members logo and contact details displayed in the GRSG newsletter and website
It’s easy to join and renew membership - You can become a member of the GRSG by applyingonline (www.grsg.org.uk) alternatively to request a hard copy of the membership applicationform email us at [email protected]. Membership is valid for 12 months from date ofmembership registration.