growth, yield, and yield components of canola as...
TRANSCRIPT
Growth, yield, and yield components of canola as affected by nitrogen,sulfur, and boron applicationBao-Luo Ma1*, Dilip K. Biswas1, Aruna W. Herath1, Joann K. Whalen2, S. Qianying Ruan2, Claude Caldwell3,Hugh Earl4, Anne Vanasse5, Peter Scott6, and Donald L. Smith2
1 Agriculture and Agri-Food Canada, Eastern Cereal and Oilseed Research Centre, Ottawa, ON K1A 0C6, Canada2 McGill University, 21,111 St. Anne-de-Bellevue, QC H9X 3V9, Canada3 Dalhousie University, Truro, NS B2N 5E3, Canada4 University of Guelph, Guelph, ON N1G 2W1, Canada5 Laval University, Laval, QC G1V 0A6, Canada6 New Brunswick Department of Agriculture, Aquaculture and Fisheries, Fredericton, NB E3B 5H1, Canada
Abstract
Developing efficient nutrient management regimes is a prerequisite for promoting canola (Brassi-ca napus L.) as a viable cash crop in eastern Canada. Field experiments were conducted to in-vestigate the growth, yield, and yield components of canola in response to various combinationsof preplant and sidedress nitrogen (N) with soil-applied sulfur (S) and soil and foliar-applied bor-on (B). Canola yield and all its yield components were strongly correlated (r2 = 0.99) with theamount of N applied, as was the above-ground biomass at 20% flowering and the leaf area in-dex. Sidedress N was more efficiently utilized by the crop, leading to greater yields than preplantN application. On average, canola yields increased by 9.7 kg ha–1 for preplant N application andby 13.7 kg ha–1 for sidedress N application, for every kg N ha–1 applied, in 6 of the 10 site-years.Soil-applied S also increased canola yields by 3–31% in 7 of the 10 site-years, but had no effecton yield components. While there was no change in yield from soil-applied B, the foliar B applica-tion at early flowering increased yields up to 10%, indicating that canola plants absorb B effi-ciently through their leaves. In summary, canola yields were improved by fertilization with N (8 of10 site-years), S (7 of 10 site-years) and B (4 of 10 site-years). Yield gains were also noted withsplit N-fertilizer application that involved sidedressing N between the rosette and early floweringstage. Following these fertilizer practices could improve the yield and quality of canola cropgrown in rainfed humid regions similar to those in eastern Canada.
Key words: Brassica napus / fertilizer application / nutrient management / yield components
Accepted May 25, 2015
1 Introduction
Brassica napus L., known as Argentine rapeseed, is a high-value crop for both edible oil and animal meal protein. Canolais a crop bred from rapeseed to contain low erucic acid(a known health concern) in the oil and low glucosinolate(an anti-nutritive factor) concentrations in its byproduct oil-meal (Potts et al., 2003). Therefore, canola is generallyreferred to as ‘‘Double Zero Rapeseed’’ and consumption ofcanola is beneficial to humans and livestock. Moreover, prop-erties of the oilseed such as its low saturated fat concentra-tion and 10% oxygen by weight favor its efficient combustionunder cold conditions, making canola a desirable and renew-able feedstock for biodiesel production (Blackshaw et al.,2011).
Under favorable environmental conditions, canola has thehighest seed-yield potential among the Brassicaceae crops(Kimber and McGregor, 1995). Thus, canola has been rapidlyadopted and has become a major cash crop in western Cana-da. Canola production is far less common in eastern Canada.
One of the main reasons for its tardy adoption is the lack ofcrushing facilities within a reasonable distance from majorgrowing areas of eastern Canada, which made it economi-cally unattractive to farmers in this region. Consequently,there was little research to facilitate adapting the crop togrowth conditions and environment of eastern Canada. How-ever, recent operationalization of a canola and soybeancrushing plant and oil refinery in Becancour, Quebec by TwinRiver Technologies–Enterprise De Transformation de GrainesOleagineuses (TRT-ETGO) significantly brightened the pros-pects of canola production in eastern Canada (Better Farm-ing, 2011). Between 2006 and 2011, canola production ineastern Canada increased by 305% over 57,000 hectares, in-creasing farmgate cash receipts by almost 700% to $46.3 mil-lion (Francis Rory, President of the Eastern Canada OilseedResearch Alliance, Inc.; pers. comm.). There is an urgentneed for developing sound agronomic practices for canolaproduction in eastern Canada, particularly with respect to Nfertilizer application and improved N-use efficiency (NUE), forthe environmental and economic sustainability of canola pro-duction.
ª Her Majesty the Queen in Right of Canada, as represented by the Minister of Agriculture and Agri-Food Canada. www.plant-soil.com
658 10.1002/jpln.201400280 J. Plant Nutr. Soil Sci. 2015, 178, 658–670
* Correspondence: Dr. B. L. Ma; e-mail: [email protected]

Generally, canola requires more nutrients than small-grain ce-reals (Rathke et al., 2005). Adequate N fertilization is vital be-cause it increases yield by promoting more vigorous growthand development as reflected by increasing plant height, leafarea development and overall crop assimilation (Wright et al.,1988). Besides, several studies conducted in western Cana-da showed that N fertilizer increases canola yield by influenc-ing key yield components such as branches per plant, podsper plant, number of seeds per pod and seed weight (Gan etal., 2007; Malhi et al., 2013). Since N is vulnerable to lossfrom the soil, particularly in humid temperate zones such aseastern Canada where leaching and denitrification occur dur-ing the growth season (Ma et al., 2010a, 2010b), N availabilitycould be the limiting factor for canola growth and yield. A suffi-cient and timely supply of N fertilizer is required to optimizeseed yield. In addition, sulfur (S) is an essential component ofcertain plant amino acids and proteins (Subedi and Ma,2009), and canola yield was often enhanced by S fertilizationin western Canada (Malhi and Gill, 2007). Boron (B), a micro-nutrient, is also a key element in carbon metabolism, sugartransport and flower pollination (Subedi and Ma, 2009). BothS and B are important nutrients required for canola to en-hance canola development, hence deficiencies of S, and Bcould restrict canola yield significantly (Malhi and Gill, 2007).Hidden hunger for (micro) nutrients could be one of the contri-buting factors of low N-use efficiency (Subedi and Ma, 2009;Gao and Ma, 2015). Therefore, effective fertilizer manage-ment strategies are a prerequisite to ensure optimum seedyields and seed quality. Moreover, such fertilizer managementstrategies must be economically viable and must ensureminimized negative impacts on the environment.
While several fertilization studies with canola were conductedin the semi-arid regions of western Canada on black, brown,and grey chernozemic soils (Cutforth et al., 2009; Gan et al.,2007; Harker et al., 2013; Malhi et al., 2013), there was lim-ited research in the humid regions of eastern Canada (Simardet al., 2009). Data on N-use efficiency of canola and re-sponses to B and S fertilization in eastern Canada were notavailable, but were expected to exhibit a wider range of val-
ues than in western Canada due to greater site-specific varia-bility in climate, soils and agronomic practices in eastern Can-ada. We hypothesized that both grain yield and the most eco-nomic rate of N (MERN) of canola crops would vary amongsite-years, and would also vary with the application rate andtiming of N, S, and B fertilizers for canola production in rainfedhumid regions. Multiple field experiments were therefore es-tablished to develop site-specific management practices forgrowing canola in eastern Canada with the specific objectiveof determining the optimum rate and timing of N, S, and Bfertilizers on canola growth, yield and yield components.
2 Material and methods
Field experiments were conducted in 2011 and 2012 at six lo-cations in Eastern Canada: the Central Experimental Farm,Ottawa, ON (45�23¢ N, 75�43¢ W); Macdonald Campus ofMcGill University in Ste. Anne-de-Bellevue, QC (45�25¢ N,73�56¢ W); the Potato Research Centre in Fredericton, NB(45�55¢ N, 66�36¢ W); Lyndhurst Farms Ltd. in Canning, NS(45�01¢ N, 64�26¢ W); Laval University Research Farm inSt-Augustin-de-Desmaures, QC (45�34¢ N, 73�41¢ W); andElora Research Station in Elora, ON (43�38¢ N, 80�24¢ W).Average spring and summer temperature and rainfall forthese site-years are presented in Fig. 1. The soil type, pre-ceding crop, and the soil basic physical and chemical proper-ties (0–30 cm depth) are given in Table 1.
2.1 Experimental design and field management
An unbalanced N · S · B factorial experiment was estab-lished in various fields each site-year, with < 1 km betweenfields used in 2011 and 2012 at the same location. In 2011,treatments included six levels of N (0, 50, 100, 150 kg ha–1 atpreplant and 50 kg ha–1 at preplant plus 50, and 100 kg ha–1
sidedressed at the six-leaf stage), two levels of S (0 and 20kg ha–1 at preplant) and three levels of B [preplant at the rateof 0 and 2 kg ha–1 and 500 g B ha–1 foliar-applied at the 20%flowering stage, corresponding to phenological growth stage
ª Her Majesty the Queen in Right of Canada, as represented by the Minister of Agriculture and Agri-Food Canada. www.plant-soil.com
Table 1: Soil (0–30 cm) characteristics of field sites before canola planting in 2011 and 2012.
Location Ottawa Ste. Anne-de-Bellevue
Fredericton Canning Elora Laval
2011 2012 2011 2012 2011 2012 2011 2012 2012 2012
Soil type Sandyloam
Sandyloam
Loam Sand Loam Sandyloam
Sandyloam
Sandyloam
Loam Sandyloam
Preceding crop Barley Soybean Wheat Fallow Forage Hay Springwheat
Winterwheat
Soybean Wheat
Soil pH 7.1 6.5 5.2 5.0 5.7 5.6 6.0 6.0 7.8 6.1
Organic matter / g kg–1 26.0 40.3 41.0 34.0 53.0 55.0 29.0 34.0 42.0 37.0
Soil available Pa / mg kg–1 34 114 87 94 175 149 486 444 24 197
Soil available K/ mg kg–1 60 128 103 86 63 146 163 146 57 345
aAt the Ottawa and Elora sites, available P refers to sodium bicarbonate test P and available K was the ammonium acetate-extractable K. Atthe other sites, Mehlich-3 extraction was performed to determine P and K fertilizer recommendations.
J. Plant Nutr. Soil Sci. 2015, 178, 658–670 Growth and yield of canola 659

(GS) 62]. Sulfur and B were applied only in plots that received100 kg ha–1 or more N, and the combined N, S, and B treat-ments were tested at all sites except Laval and Elora. In2012, two additional N treatments of 200 kg ha–1 at preplantand 50 kg ha–1 at preplant plus 150 kg ha–1 sidedressed atthe six-leaf stage were included and tested at all six sites. Ateach site-year, the experiment was arranged in a randomizedcomplete block design with four replications.
Field preparation involved chisel plowing to a depth ofabout 15–20 cm in the fall, using the DMI Elco Tiger ma-
chine, and cultivated to a depth of 10–15 cm in the springwith the C-shank cultivator before broadcasting the preplantN fertilizer (urea, 46-0-0) at the correct application rate foreach N treatment plot. Also broadcast in the preplant periodwere S fertilizer (ammonium sulfate formulated as 21-0-0with 24% S) and soil-applied B fertilizer (Alpine B, contain-ing 10% boric acid). To balance the N contained in theammonium sulfate, 17.5 kg N ha–1 as urea were applied byhand to all the zero-N control plots prior to planting. In addi-tion, all plots received a broadcast application of P and K ata rate determined from the soil test recommendations for
ª Her Majesty the Queen in Right of Canada, as represented by the Minister of Agriculture and Agri-Food Canada. www.plant-soil.com
Mea
n T
/ °C
Mea
n T
/ °C
Mea
n T
/ °C
Mea
n T
/ °C
Rai
nfal
l/ m
mR
ainf
all/
mm
Rai
nfal
l/ m
mR
ainf
all/
mm
Rai
nfal
l/ m
mR
ainf
all/
mm
Figure 1: Daily mean air temperature (T) and total rainfall during the growing season in 2011 and 2012 at Ottawa and Elora, Ontario; Frederic-ton, New Brunswick; Ste. Anne-de-Bellevue and Laval, Quebec; and Canning, Nova Scotia.
660 Ma, Biswas, Herath, Whalen, Ruan, Caldwell, Earl, Vanasse, Scott, Smith J. Plant Nutr. Soil Sci. 2015, 178, 658–670

the site (Table 1), to ensure ample P and K for canola pro-duction. Within 24 h, the field was cultivated again with anS-tine cultivator to incorporate the preplant fertilizers intosoil before seeding canola.
Canola (Brassica napus L. hybrid InVigor 5440, LL) wassown at a rate of 5 kg ha–1 at a seeding depth of 1–2 cm. Thesize of the plots varied among sites with row widths rangingfrom 12.5–17.8 cm and row length of 8–10 m. Weeds werecontrolled by spraying Liberty herbicide (post emergence) atall sites. The post-emergence fertilization included sidedressN fertilizer application (urea, 46-0-0) applied by hand on thesoil surface. The foliar application of B as 500 g B ha–1 in 200L ha–1 solution, containing the surfactant Agral 90 at 0.125%(v/v) to enhance the absorption of B through the foliage, wasdone with a backpack sprayer at 207 kPa (30 psi).
2.2 Sampling and data collection
The weekly record of phenology was based on the Phenologi-cal Growth Stage (GS) and BBCH-identification keys of oil-seed rape (Weber and Bleiholder, 1990; Lancashire et al.,1991). Plant biomass was determined by collecting plants ina 1 m · 1 row area at the 20% flowering stage (GS 62). At theOttawa and Laval sites, leaf area index (LAI) was determinedat rosette and 20% flowering stages by measuring the plantcanopy between two rows of canola.
At physiological maturity, plants were collected from a 1 m · 2row area of each plot and the number of plants m–2 wascounted. These plants were dried in a forced-draft oven at50�C and then weighed and threshed to determine the har-vest index (HI). An additional sample of five plants per plotwas taken at random from an inner row to determine the yieldcomponents: branches plant–1, pods plant–1, seeds pod–1,and 1000-seed weight. Grain yield and moisture were deter-mined by combining central 4 to 6 rows of canola in each plotand reported on a 100 g kg–1 water basis.
At the Ottawa site, the percentage of distinctly green (DGR),brown, tan, and empty seeds (total poor-quality seed) wasdetermined based on a color guide produced by the OntarioCanola Growers Association. According to the CanadianGrain Commission Guidelines (CGC, 2014), a canola count-ing paddle that holds 100 seeds, a roller, and double-sidedmasking tape was used to crush the seed to better determinethe color differences. Two sets of 100-seed samples per plotwere used and average values were taken for statisticalanalysis.
2.3 Data analysis
This was an unbalanced factorial experiment, thus, the datawere analyzed in two different ways: (1) general linear mod-el (GLM) procedure of statistical analysis system (SAS)which includes the statistical methods of analysis of var-iance (ANOVA) and multivariate analysis of variance (MAN-OVA) to estimate partial correlation coefficients, and (2)MIXED procedure of SAS to analyze the sidedress (split)versus preplant N application rates using the LSMEANS
statement with the print difference (PDIFF) option. A pooledanalysis of variance across site-years was also attemptedwith the common treatments but not reported due to thelarge heterogeneous error variances, which were likelycaused by the unusual drought stress at some sites in2012. Treatment mean differences were separated accord-ing to the protected-LSD0.05 test.
2.4 Estimation of maximum economic rate ofnitrogen
Assuming that an average canola price was $ 0.50 kg–1 andN fertilizer cost was $ 1.00 kg–1 N, the maximum economicrate of N (MERN) was calculated according to Rashid andVoroney (2005) for each site-year when there was a yield re-sponse to N. It is a single target tare based on the formula ofgrain yield (Y) response to N rate (X):
Y = aX2 + bX + c, (1)
where both Y and X have the same unit (kg ha–1), and a, b, care the coefficients. Taking the first derivative of this quadraticequation Y¢ = 2aX + b, and setting Y¢ = 0, the N fertilizer rate(Xmax) to achieve the maximum yield (Ymax) is obtained as:
Xmax = –b / 2a. (2)
Therefore, by substituting Xmax into Eq. (1):
Ymax = (–b2 / 4a) + c, (3)
MERN = (Xmax (2Ymax – Xmax · B)) / 2Ymax, (4)
where Xmax refers to the N rate at which the largest yield re-sponse (i.e., Ymax) occurs (Janovicek and Stewart, 2014) andwhere B = N Cost/Grain value = 1/0.5 = 2, i.e., B representsthe price ratio of 1 kg of fertilizer N to the price of 1 kg of cano-la grain (Rashid and Voroney, 2005).
3 Results and discussion
3.1 Weather
While the 2011 growth season started slightly late in theMaritime Provinces, there was sufficient heat and adequaterainfall for canola crop production across eastern Canada.In contrast, the 2012 growth season occurred at least 2weeks earlier than normal and canola suffered from mediumto severe drought stress between flowering and maturity(Table 2; Fig. 1), especially in the Mixwood regions of east-ern Ontario and southern Quebec (43–46�N, 71–79�W). Forexample, there was only 23 mm of total rainfall at the Otta-wa site from 20 June to 5 Aug 2012 and the 45-y long-termtotal rainfall for the same period was 160 mm (Ma et al.,2006).
ª Her Majesty the Queen in Right of Canada, as represented by the Minister of Agriculture and Agri-Food Canada. www.plant-soil.com
J. Plant Nutr. Soil Sci. 2015, 178, 658–670 Growth and yield of canola 661

ª Her Majesty the Queen in Right of Canada, as represented by the Minister of Agriculture and Agri-Food Canada. www.plant-soil.com
Table 2: Planting date and occurrence of major phenological growth stages of canola at each site-year.
Location Ottawa St. Anne-de-Bellevue
Fredericton Canning Elora Laval
2011 2012 2011 2012 2011 2012 2011 2012 2012 2012
Planting date May 11 May 14 May 12 May 7 Jun 3 May 28 May 4 May 17 May 8 May 5
Emergence May 20 May 20 May 19 May 24 Jun 7 Jun 9 May 9 May 24 May 14 May 18
GS 31 (sidedress N) Jun 14 Jun 7 Jun 9 Jun 13 Jul 7 Jul 3 Jun 8 Jun 26 Jun 21 Jun 11
20% flowering (GS 62) Jun 20 Jun 22 Jun 27 Jun 26 Jul 11 Jul 12 Jun 20 Jul 6 Jun 28 Jun 21
Maturity Aug 2 Aug 8 Aug 17 Aug 6 Sept 12 Sep 2 Aug 18 Aug 18 Aug 1 Aug 6
In comparison, the weather in western Canada is generallydrier and more continental (colder winter but hotter summer)than in eastern Canada. Accordingly, soils in western Canadacontain generally higher soil organic matter withless N leaching (Malhi and Gill, 2007) than those ineastern Canada. The prevailing wet and cool soilconditions in early spring and frequent rainfallevents and erratic distribution during the growthseason in eastern Canada often result in soil Nlosses through NO3-N leaching, N2O emissionsand NH3 volatilization with preplant N fertilization(Ma et al., 2006, 2010a, 2010b). Other anionic nu-trients that move through mass flow in the soil solu-tion, such as SO2�
4 , are susceptible to leaching inthis humid environment, particularly in coarse-tex-tured soils (sandy and sandy-loam) that have lim-ited anion exchange capacity.
3.2 Effects of N, S, and B fertilizerapplications on canola growthparameters
3.2.1 Leaf area index (LAI)
The ability of a plant to produce biomass dependson the size, efficiency, and longevity of the photo-synthetic organs. Figure 2 illustrates the LAI meas-ured at rosette in 2011, and at 20% flowering stagein both years at Ottawa and in 2012 at Laval. Inboth years, LAI values increased with increasingamounts of preplant N fertilizer between rosetteand 20% flowering stages at the Ottawa site. TheLAI values were significantly greater in plots re-ceiving preplant 150 kg N ha–1 (150N) than plotsthat received the same amount of total N(50N+100N) with N sidedressed at the rosettestage. However, this difference disappeared at theearly flowering stage, indicating that the additionalN applied by sidedressing was utilized by the crop.In 2011, the highest LAI value was found with pre-plant N applied at 100 kg N ha–1 plots. In 2012, theplots that received 150 and 200 kg N ha–1 preplantapplications had significantly higher LAI values,compared to the check N treatment. However,such differences were not found in the plots thatreceived the same amount of N as sidedress appli-
cation (Fig. 2b). Further, the LAI values at Ottawa in 2012were nearly twice as large as those measured in 2011 for allthe treatments. This higher LAI was probably due to the early
O�awa - 20% Flowering
Applied N fertilizer / kg ha–1
(a)
(b)
(c)
Figure 2: Effects of N-fertilizer application on the leaf area index (LAI) measuredby using the LI-COR Plant Canopy Analyzer just before sidedressing of N and atthe 20% flowering stage in 2011 in Ottawa, and with Leaf Area Meter at 20% flow-ering stage in both years in Ottawa, and Laval. Means with different letters withina site-year and growth stage are significantly different according to an F-protectedLSD test at the 5% level.
662 Ma, Biswas, Herath, Whalen, Ruan, Caldwell, Earl, Vanasse, Scott, Smith J. Plant Nutr. Soil Sci. 2015, 178, 658–670

spring and favorable warm weather conditions atthe 2012 Ottawa site, where March was verywarm, with maximum temperatures reaching24–26�C by the middle of the month, causing thesnow to disappear quickly. High temperatures inMay (Fig. 1) led to maximum vegetative growth ofthe crop. At the Laval site in 2012, LAI values in-creased with increasing levels of preplant andsidedress N applications (Fig. 2c), but there wasno difference in LAI with comparable levels of Napplication, and this suggests that the N sidedresswas not adequately utilized at the 20% floweringstage as N released from urea hydrolysis tooktime. The results of preplant N on LAI are compa-rable with earlier findings in western Canada andelsewhere (Allen and Morgan, 1975; Cheema etal., 2001; Kumar et al., 1997; Wright et al., 1988).Generally canola took up and assimilated most ofthe N at early growth stages for maximum growthand development (Xing et al., 1998). The early ad-dition of N helped the crop to increase cell divisionand cell enlargement, resulting in greater leaf-areadevelopment. This leaf-area expansion favoredsubsequent interception and efficient utilization ofsolar radiation enhancing overall photosyntheticactivities, which ultimately increased accumulationof dry matter in leaves and shoots (Holmes, 1980).
3.2.2 Above ground plant biomass
In both years at Ottawa, plant biomass significantlyincreased with the increasing amounts of preplantand sidedress N applications compared to the plotsthat received the control N treatment, with only twoexceptions (50N in 2011 and 50N+100N in 2012; Fig. 3a). Thelowest plant biomass was in plots with the control N treatmentand the highest plant biomass was in plots with preplant applica-tion at 100 kg N ka–1 in 2011 and 150 kg N ka–1 in 2012. Whilepreplant and sidedress N treatments produced similar biomassin Ottawa in 2011, the 2012 plant biomass was higher for pre-plant treatment at 150 kg N ha–1 than for the 50+100 kg N ha–1
treatment with sidedress N (Fig. 3a). The reason for higher bio-mass production with preplant N application than sidedress Napplication was likely due to the early spring and warm weatherconditions which promoted early vegetative growth of the crop in2012, similar to that observed under dryland farming conditionsin Australia (Hocking et al., 1997). In addition, for Ottawa in2012, the progressive increase of N levels from 100 to 200 kg Nha–1 in preplant or 50+50, 50+100, to 50+150 kg N ha–1 in side-dress did not lead to corresponding increases in plant biomass.Overall for Ottawa, plant biomass with all preplant and sidedressN treatments was 86–117% greater in 2012 than in 2011 and thelowest plant biomass was with the control N treatment and thehighest increase was with the 150 kg N ha–1 preplant application(Fig. 3a). This higher biomass production in 2012 was ob-vious, because, the warm weather in 2012 in Ottawa influ-enced most of the physiological functions of the canola crop.
At the Laval site in 2012, plant biomass production significantlyincreased with increasing N application, either preplant (ex-cept 50 kg N ha–1) or sidedress, compared to the control N
treatment (Fig. 3b). The 200 kg ha–1 preplant N treatment pro-duced almost twice as much plant biomass as the 0N plots,while there were no significant differences of plant biomass be-tween preplant and sidedress N at the same level. Comparedto Ottawa in 2012, plant biomass was low in all treatments atthe Laval site (Fig. 3a vs. 3b), which is attributed to the differen-ces in soil and climatic factors at these two locations.
3.2.3 Plant height
Plant height is an indicator of the vegetative growth potentialof a crop and is both genetically and environmentally deter-mined. In this study, at almost all of the sites and in both years(except Ottawa and Ste. Anne-de-Bellevue in 2012), preplantand sidedress N applications significantly increased canolaplant heights compared to the control N treatment (Table 3).Plants receiving preplant N application were significantly tallerthan the plants that received equivalent amounts of sidedressN for most sites, and the tallest plants were found in plots thatreceived 150 to 200 kg N ha–1. These results clearly indicatethat canola plants responded more to preplant N in their earlygrowth stage and sidedress N may have been more availablefor reproductive growth. However, the Ottawa and Ste. Anne-de-Bellevue sites in 2012 produced no significant differencein plant height between preplant and sidedress N applicationsand there was no gain in plant height with increasing N ferti-lizer inputs. This could be attributed to the weather conditions
ª Her Majesty the Queen in Right of Canada, as represented by the Minister of Agriculture and Agri-Food Canada. www.plant-soil.com
Applied N fertilizer / kg ha–1
Bio
mas
s / g
m–2
Bio
mas
s / g
m–2
(a)
(b)
Figure 3: Effects of N fertilizer application on the aboveground plant biomass at20% flowering for Ottawa in both 2011 and 2012 and for Laval in 2012. Meanswith different letters within a site-year are significantly different according to anF-protected LSD test at the 5% level.
J. Plant Nutr. Soil Sci. 2015, 178, 658–670 Growth and yield of canola 663

especially total rainfall and temperature conditions. In Ottawa,June and July months were extremely dry with only 23 mm ofrainfall from June 20 to Aug 4, 2012 (Fig. 1). By July 16,2012, the Ottawa area was in a stage 2 drought and condi-tions were similar in Ste. Anne-de-Bellevue, which is about150 km away from Ottawa. Soil moisture decreased through-out the summer from 23.8% at 5 cm and 21.2% at 15 cm soildepth on June 13, to 7.5% (5 cm) and 8.2% (15 cm), respec-tively, on July 22 through August 5. This likely influenced plantstature. Similar to our observations, Ozturk (2010) working inTurkey, reported that increased plant heights with different Nsources (ammonium nitrate, ammonium sulphate and urea)and maximum plant heights were found with plants thatreceived 150 kg N ha–1. However, in contrast to our results,Ozturk (2010) also reported that plant height decreased at thehighest N rate (200 kg ha–1), likely due to the confoundingeffect of drought on crop response to N.
3.3 Yield components
For most site-years, the addition of N fertilizer significantly in-creased the following yield components: Branches plant–1,pods plant–1, seeds pod–1 and 1000-seed weight (Table 4).This was expected since the application of N fertilizer acceler-ates crop growth (Fismes et al., 2000), thereby facilitating so-lar radiation interception and the conversion of photosyn-thates to yield components, including oilseed.
At most site-years, the number of branches per plant andpods per plant increased with increasing rates of preplant andsidedress N application (Table 4). For example in 2011, thebranches plant–1 significantly increased in the plots that re-ceived preplant N (100N and 150N at Ottawa) and sidedressN applications (50N+50N at Ottawa and 50N+100N at Ste.Anne-de-Bellevue), compared to plots that received the con-trol N treatment. In 2012, the number of branches per plantwas significantly higher in the plots that received preplant 100kg ha–1 (Ottawa), 150 kg ha–1 (Elora), and 200 kg ha–1 (Otta-wa, Fredericton and Elora) applications and also with side-dress N applications at 50+50 kg ha–1 (Ottawa and Laval),
50+100 kg ha–1 (Canning), and 50+150 kg ha–1 (Fredericton)than the control N treatment. However, in a few cases, thenumber of branches did not respond to any level of N treat-ments either at preplant or at sidedress (Fredericton and Can-ning in 2011 and Ste. Anne-de-Bellevue in 2012). Increasingbranch number in response to increasing N application wasnoted with higher levels of N fertilizer, up to 120 kg ha–1
(Khan et al., 2002), 150 kg ha–1 (Uddin et al., 1992), 160 kgha–1 (Ahmad et al., 2011), and 200 kg ha–1 (Ozturk, 2010).
At the Ottawa and Fredericton sites in 2012, preplant N appliedat 200 kg ha–1 produced more pods per plant than did sidedressapplication at the same amount of N (50N+150N). In contrast, atCanning in 2012, plots that received sidedress N (50N+100N)had significantly higher pod numbers than the plots that receivedthe same amount of N at preplant. Overall, in most site-years,the number of pods per plant did not differ significantly betweenpreplant and sidedress N application (Table 4).
At the Ottawa and Fredericton sites, the number of seeds perpod increased with increasing level of preplant and sidedressN applications, with the lowest number of seeds per pod inthe control N treatment and the highest number of seeds perpod in the plots that received sidedress N at the 50N+100Nlevel. At the Ste. Anne-de-Bellevue site in 2011 and 2012,there was no difference in the number of seeds per pod dueto N fertilization (Table 4).
There was no difference in 1000-seed weight between N appli-cation and the control N treatment at the Ottawa and Lavalsites in 2012, and at Ste. Anne-de-Bellevue and Fredericton in2011 (Table 4). For other sites-years, while some responses ofseed weights to preplant and sidedress N applications wereobserved, there was no consistent pattern (Table 4). Suchlarge variation in the response of seed weight to N fertility waslikely related to the higher LAI and plant biomass, at the flower-ing stage, but a lower number of seeds set in 2012 due to thesevere drought after flowering that occurred at those sites.Hocking and Stapper (2001) found that N fertilizer had no sig-nificant effects on 1000-seed weights, while Ahmad et al.(2011) and Kutcher et al. (2005) found that 1000-seed weight
ª Her Majesty the Queen in Right of Canada, as represented by the Minister of Agriculture and Agri-Food Canada. www.plant-soil.com
Table 3: Effects of N fertilizer on plant height at physiological maturity of canola grown at each site in 2011 and 2012.a
Nitrogen Ottawa Ste. Anne-de-Bellevue
Fredericton Canning Elora Laval
/ kg ha–1 2011 2012 2011 2012 2011 2012 2011 2012 2012 2012
0 163 c 124 ab 108 d 116 ab 125 b 116 d 84 c N/D 99 a 102 f
50 174 bc 124 ab 109 cd 119 ab 131 b 121 cd 97 b N/D 104 a 107 def
100 187 a 128 ab 113 bc 117 ab 140 a 126 bc 104 a N/D 106 a 111 bcd
150 191 a 131 a N/D 118 ab 140 a 129 ab 110 a N/D 106 a 115 abc
200 – 129 ab – 121 a – 134 a – N/D 106 a 118 a
50 + 50 175 b 122 b 109 d 113 b 143 a 125 bc 96 b N/D 103 a 110 cde
50 + 100 188 a 122 b 114 ab 113 b 142 a 123 bc 95 b N/D 102 a 104 ef
50 + 150 – 131 a – 117 ab – 125 bc – N/D 106 a 117 ab
aN/D, not determined. Means in the same column with different letters are significantly different according to an F-protected LSD test at the 5%level.
664 Ma, Biswas, Herath, Whalen, Ruan, Caldwell, Earl, Vanasse, Scott, Smith J. Plant Nutr. Soil Sci. 2015, 178, 658–670

ª Her Majesty the Queen in Right of Canada, as represented by the Minister of Agriculture and Agri-Food Canada. www.plant-soil.com
Table 4: Effects of N fertilizer on yield components of canola grown at each site in 2011 and 2012.a
Nitrogen Ottawa Ste. Anne-de-Bellevue Fredericton Canning Elora Laval
/ kg ha–1 2011 2012 2011 2012 2011 2012 2011 2012 2011 2012
Branches plant–1
0 2.5 b 2.4 b 3.2 b 6.0 a 6.0 a 5.0 c 1.8 a 1.8 bc 2.6 b 4.7 b
50 3.0 ab 3.3 ab 3.6 ab 6.0 a 6.0 a 5.5 c 2.4 a 2.2 bc 3.0 ab 5.5 b
100 3.6 a 4.0 a 4.0 ab 6.0 a 8.0 a 5.8 bc 2.4 a 2.7 ab 3.1 ab 5.0 b
150 3.7 a 3.6 ab 3.8 ab 6.0 a 7.0 a 6.3 abc 2.4 a 2.2 bc 3.4 a 5.7 b
200 – 4.0 a – 6.0 a – 7.5 ab – 2.0 bc 3.6 a 6.5 b
50 + 50 3.5 a 4.0 a 3.3 b 5.0 a 6.0 a 5.8 c 2.5 a 1.3 c 3.1 ab 9.2 a
50 + 100 3.3 ab 3.0 ab 4.2 a 5.0 a 7.0 a 6.3 abc 2.7 a 3.3 a 3.3 ab 7.2 ab
50 + 150 – 3.0 ab – 4.0 a – 7.8 a – 2.3 abc 3.2 ab 5.5 b
Pods plant–1
0 43 b 48 b 60 a 96 ab 121 b 84 c 21 b 25 b 37 b 71 c
50 54 ab 59 ab 74 a 88 b 122 b 94 bc 26 ab 28 b 45 ab 87 bc
100 71 a 68 ab 75 a 133 a 149 ab 99 bc 33 ab 30 b 50 ab 86 bc
150 71 a 72 ab 79 a 126 ab 140 ab 116 b 35 a 27 b 57 a 102 abc
200 – 84 a – 108 ab – 146 a – 32 b 58 a 124 a
50 + 50 68 a 59 ab 69 a 118 ab 123 b 95 bc 21 b 23 b 45 ab 68 c
50 + 100 68 a 60 ab 80 a 102 ab 173 a 103 bc 32 ab 58 a 47 ab 110 ab
50 + 150 – 57 b – 113 a – 96 bc – 31 b 45 ab 101 abc
Seeds pod–1
0 12 c 19 c 18 a 20 a N/D 20 c N/D N/D N/D N/D
50 13 bc 21 bc 19 a 23 a N/D 20 c N/D N/D N/D N/D
100 14 bc 23 b 20 a 19 a N/D 20 c N/D N/D N/D N/D
150 17 ab 23 b 20 a 21 a N/D 21 bc N/D N/D N/D N/D
200 – 23 b – 18 a – 24 a – N/D N/D N/D
50 + 50 14 bc 23 b 18 a 20 a N/D 21 bc N/D N/D N/D N/D
50 + 100 18 a 26 a 19 a 20 a N/D 21 bc N/D N/D N/D N/D
50 + 150 – 22 b – 20 a – 23 ab – N/D N/D N/D
1000–seed weight / g
0 3.06 a 3.20 a 2.80 ab 2.93 c 3.49 a 3.24 a 3.5 a 3.00 e N/D 3.50 a
50 2.94 ab 3.30 a 2.80 ab 2.96 c 3.42 a 3.15 ab 3.29 ab 3.11 de N/D 3.50 a
100 2.90 b 3.20 a 2.80 ab 3.10 abc 3.37 a 3.14 ab 3.29 ab 3.14 cd N/D 3.50 a
150 2.95 ab 3.30 a 2.75 b 3.04 bc 3.36 a 3.20 ab 3.28 b 3.14 cd N/D 3.40 a
200 – 3.30 a – 2.98 c – 3.10 b – 3.30 a N/D 3.50 a
50 + 50 2.98 ab 3.40 a 2.90 a 3.00 c 3.40 a 3.20 ab 3.45 a 3.13 de N/D 3.50 a
50 + 100 3.04 a 3.30 a 2.75 b 3.15 ab 3.40 a 3.25 a 3.48 a 3.20 bc N/D 3.50 a
50 + 150 – 3.10 a – 3.20 a – 3.08 b – 3.27 ab N/D 3.40 a
aN/D, not determined. Means in the same column with different letters are significantly different according to an F-protected LSD test at the 5%level.
J. Plant Nutr. Soil Sci. 2015, 178, 658–670 Growth and yield of canola 665

was in fact reduced with increasing rate of N application. An-other possible explanation for this decline might be associatedwith late maturity caused by N fertilization, which resulted inpoor seed filling and a greater proportion of green seeds ac-cording to some authors, although not observed in this study.Cheema et al. (2001) pointed out that differences in seedweight were related to a short period between anthesis andmaturity and, at that time, the supply of assimilates to the podsplays a crucial role in the development of the seed.
Overall, differences in the response of yield components to Napplications among site-years could be explained in terms ofthe differences in the weather conditions when the specificyield components were formed at these locations, and yieldcomponents are known to be compensated by each other, with-in a certain range, in response to environment-induced stress.
3.4 Seed yields
Seed yield of canola is a function of plant density, number ofpods per plant, number of seeds per pod, and seed weight. Inthis study, seed yield positively responded to N fertilizer appli-cations in both years and sites (Fig. 4). In 2011, at all sitesgrain yield was significantly greater for preplant or sidedressN application than for the check N treatment. The 50N+100Nsidedress N treatment resulted in the highest yield at Ottawa(3374 kg ha–1), Canning (3190 kg ha–1), Fredericton (4012 kgha–1), and Ste. Anne-de-Bellevue (3808 kg ha–1).
At the Canning, Fredericton, and Laval (or St-Augustin) sites,response of seed yield to N application in 2012 was similar tothat in 2011 (Fig. 4), with greater yields by 62.3% (1514 kgha–1) at Fredericton and by 33.7% (442 kg ha–1) at Laval orCanning, due to N application relative to the control N treat-ment. However, at the Ottawa and Ste.-Anne-de-Bellevue
ª Her Majesty the Queen in Right of Canada, as represented by the Minister of Agriculture and Agri-Food Canada. www.plant-soil.com
2011 2012
Fertilizer application / kg N ha–1
Yiel
d / k
gha
–1Yi
eld
/ kg
ha–1
Yiel
d / k
gha
–1Yi
eld
/ kg
ha–1
Fertilizer application / kg N ha–1
Figure 4: Grain yield of canola as a function of the amount of N fertilizer applied at preplant (empty circles and dashed line) vs. sidedress (solid circlesand solid line) at each site in 2011 and 2012. Regression lines in the graph indicate significant (P < 5%) responses of yield to N fertilizer rates.
666 Ma, Biswas, Herath, Whalen, Ruan, Caldwell, Earl, Vanasse, Scott, Smith J. Plant Nutr. Soil Sci. 2015, 178, 658–670
sites, there was no change in seed yield due to N applicationeither at preplant or as sidedress, due the severe drought thatoccurred at these sites in 2012.
In most cases (except for Elora 2012), there were larger re-sponses of seed yields to sidedress than preplant N applica-tion at the same N level (Fig. 4). Soil textures are similaramong the tested site-years, with neutral to slightly acidic pHvalues for most site-years, except for Elora (Table 1). Side-dress of N at Elora in 2012 resulted in a non-significant butgreater yield than preplant application, which was likely dueto greater potential loss of urea N through NH3 volatilizationfor sidedress than for preplant application (Ma et al., 2010b).Nevertheless, weather, especially rainfall events and its distri-bution had the largest impact on canola yield response to Ntreatments. Both Ottawa and the Ste. Anne-de-Bellevue sitesin 2012 encountered severe drought stress from early flower-ing to seed filling, resulting in no response of yield to neitherpreplant nor sidedress N application. Overall, our results indi-cate that sidedress N application appeared to be better utiliz-ed by the canola crop and thus produced greater yields thanthe crop that received equivalent amounts of preplant N. Forexample, for every kg N ha–1 applied canola yields increasedon average by 9.7 kg ha–1 for preplant N application, and by13.7 kg ha–1 for sidedress N application, in 6 out of the 10site-years.
Our results are in line with those reported by Cheema (1999)and Zaman (2003). One of the potential reasons for the effectof sidedress application (i.e., one small portion at preplantand the other portion as in-season application of N fertilizer)on seed yield might be to boost availability of N at the opti-mum time for uptake in the vegetative and reproductivegrowth of the canola crop. However, contradictory resultswere reported in Australia by Taylor et al. (1991), who illus-trated that split applications of N were no more effective thanapplying all the required N at seeding. Clearly, the require-ment for N fertilizer to achieve maximum seed yield varies ac-cording to the environmental variables, including weather, soiltype, residual fertility (especially nitrate), management practi-ces, cultivars, etc. (Holmes and Ainsley, 1977), and there is aneed for site-specific nutrient best management practices.
Gan et al. (2007) found that the N rate required to achievemaximum yields of canola in Saskatchewan, Canada, was135 kg ha–1, whereas Kutcher et al. (2005) reported that themaximum seed yield of canola was obtained with 120 kg Nha–1 application in northern prairies. Accordingly, choosingthe correct rate and timing of N fertilization for a particular siteis one of the most critical aspects of successful canola pro-duction.
In eastern Canada, using the current cost of N and price ofcanola, the estimated maximum economic rate of N (MERN)ranged from 105–175 kg N ha–1 for preplant N applicationand 118–233 kg N ha–1 for sidedress N application. Clearly,MERN values are affected largely by the site-specific weatherconditions and the soil environment. It is difficult to get a gen-eral conclusion on the amounts of N that should be applied.However, as a rule of thumb, at the current yield level andaverage weather, the optimum rate of N on sandy loam orloam soils under the humid climate conditions is between 120and 150 kg N ha–1, and sidedress N strategy is more efficientthan preplant application with savings of 10–20 kg N ha–1 toachieve similar canola seed yield. When growth conditionsare favorable, it is possible to realize a greater yield potentialwith the same or slightly more N for sidedress than for pre-plant N application.
3.5 Effect of sulfur fertilization on growth, yield,and yield components of canola
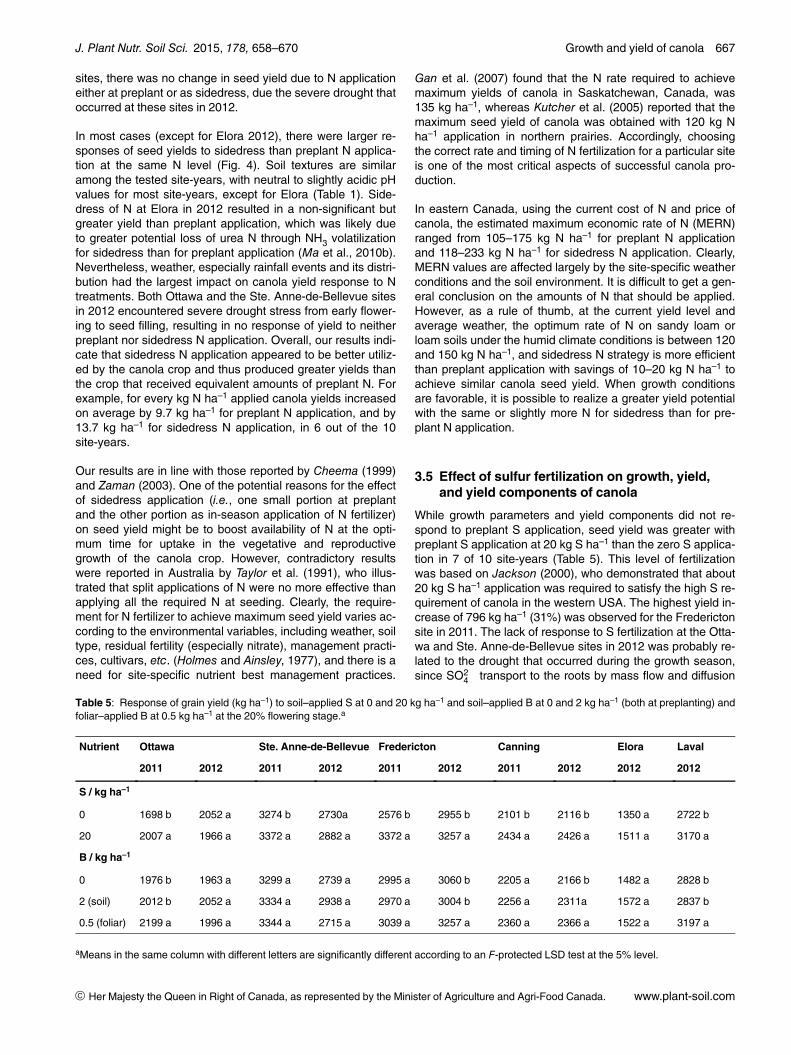
While growth parameters and yield components did not re-spond to preplant S application, seed yield was greater withpreplant S application at 20 kg S ha–1 than the zero S applica-tion in 7 of 10 site-years (Table 5). This level of fertilizationwas based on Jackson (2000), who demonstrated that about20 kg S ha–1 application was required to satisfy the high S re-quirement of canola in the western USA. The highest yield in-crease of 796 kg ha–1 (31%) was observed for the Frederictonsite in 2011. The lack of response to S fertilization at the Otta-wa and Ste. Anne-de-Bellevue sites in 2012 was probably re-lated to the drought that occurred during the growth season,since SO2�
4 transport to the roots by mass flow and diffusion
ª Her Majesty the Queen in Right of Canada, as represented by the Minister of Agriculture and Agri-Food Canada. www.plant-soil.com
Table 5: Response of grain yield (kg ha–1) to soil–applied S at 0 and 20 kg ha–1 and soil–applied B at 0 and 2 kg ha–1 (both at preplanting) andfoliar–applied B at 0.5 kg ha–1 at the 20% flowering stage.a
Nutrient Ottawa Ste. Anne-de-Bellevue Fredericton Canning Elora Laval
2011 2012 2011 2012 2011 2012 2011 2012 2012 2012
S / kg ha–1
0 1698 b 2052 a 3274 b 2730a 2576 b 2955 b 2101 b 2116 b 1350 a 2722 b
20 2007 a 1966 a 3372 a 2882 a 3372 a 3257 a 2434 a 2426 a 1511 a 3170 a
B / kg ha–1
0 1976 b 1963 a 3299 a 2739 a 2995 a 3060 b 2205 a 2166 b 1482 a 2828 b
2 (soil) 2012 b 2052 a 3334 a 2938 a 2970 a 3004 b 2256 a 2311a 1572 a 2837 b
0.5 (foliar) 2199 a 1996 a 3344 a 2715 a 3039 a 3257 a 2360 a 2366 a 1522 a 3197 a
aMeans in the same column with different letters are significantly different according to an F-protected LSD test at the 5% level.
J. Plant Nutr. Soil Sci. 2015, 178, 658–670 Growth and yield of canola 667
is impeded by low soil moisture. Overall, S application at20 kg ha–1 increased canola yield on average by 15.9%(384 kg ha–1) in 2011 and by 9.2% (214 kg ha–1) in 2012. Thisis lower than the response to S fertilizer in India, which in-creased seed yield of Brassica species by 30–46% (Ahmadet al., 1999). In northern Saskatchewan, Malhi et al. (2007)demonstrated that canola seed yield increased sharply withthe first 10 kg S ha–1 increment, moderately with the secondincrement and slightly with the third increment of 10 kg Sha–1. Historically, crop production in eastern Canada does notneed supplement with S fertilization due to atmospheric depo-sition. However, with the effective control of acid rain deposi-tion and continued increase in crop yields, S release from soilorganic matter mineralization may not be sufficient to meettimely requirement of the crop, and sporadic S deficiency hasobserved, especially in coarse-textured sand or sandy loamsoils (K. Reid, pers. comm.). Therefore, further studies to opti-mize the S-fertilizer rate on a site-specific basis are warrantedfor canola production in eastern Canada.
3.6 Effects of boron on growth, yield, and yieldcomponents of canola
In most site-years, there was no change in yield and yieldcomponents when plots received soil-applied B at 2 kg ha–1
rate (2B), compared to zero B application (Table 5). Canningwas the only exception, where preplant soil applied-B in 2012resulted in a 6.7% yield increase (144.6 kg ha–1). However,the significant response of canola to foliar B fertilization atCanning in 2012 as well as 3 other site-years (Table 5) indi-cates that B fertilizer was beneficial at those sites, whicheither lacked sufficient soil B or the plant was not able to ac-quire soil B at the right time to fulfill its physiological needs forthis element. Canola response to foliar B application resultedin yield increase of 11.3% (223 kg ha–1) at Ottawa (2011),6.4% at Fredericton (2012), 9.2% at Canning (2012) and 13%
at Laval (2012; Table 5). These results indicate that the cano-la plants acquired B more efficiently through their leaves thanthrough their roots, and B fertilizer should be foliar applied toachieve a positive yield response of canola. Soil-applied Btends to bind with the soil organo-minerals and, therefore,was not be plant-available. In general, there is a narrow rangeof soil-extractable B concentration that will optimize cropgrowth, and B released from soil organic matter decomposi-tion can meet the requirement of many crop plants in easternCanada (Subedi and Ma, 2009). However, the canola crophas a larger requirement at flowering and pod/seed set thanother crops (Hammond, 2011). We speculate that the site-specific response of canola yield to foliar B application islikely due to the fact that seasonal release of B from decom-position in sandy loam soils may not meet the timely require-ment for B by the crop. There are two other possibilities, thefirst being that soil-applied B was bound to soil organo-miner-als, and second that the plant-available forms of this nutrient(boric acid, H3BO3 is the predominant form in soil solution)are susceptible to leaching in coarse-textured soils of humidregions. As a neutral species, boric acid may be readily trans-ported through soil solution due to lack of steric hindranceand lack of charge repulsion. As at the present, there is no re-liable soil or plant tissue testing method for predicting eco-nomic response to applied B fertilizer, but a tissue test is likelypreferred (Hammond, 2011). An emerging research priority isin developing diagnosis tools and implementing B-manage-ment technologies for canola in eastern Canada.
3.7 Correlations of canola seed yield and yieldcomponents
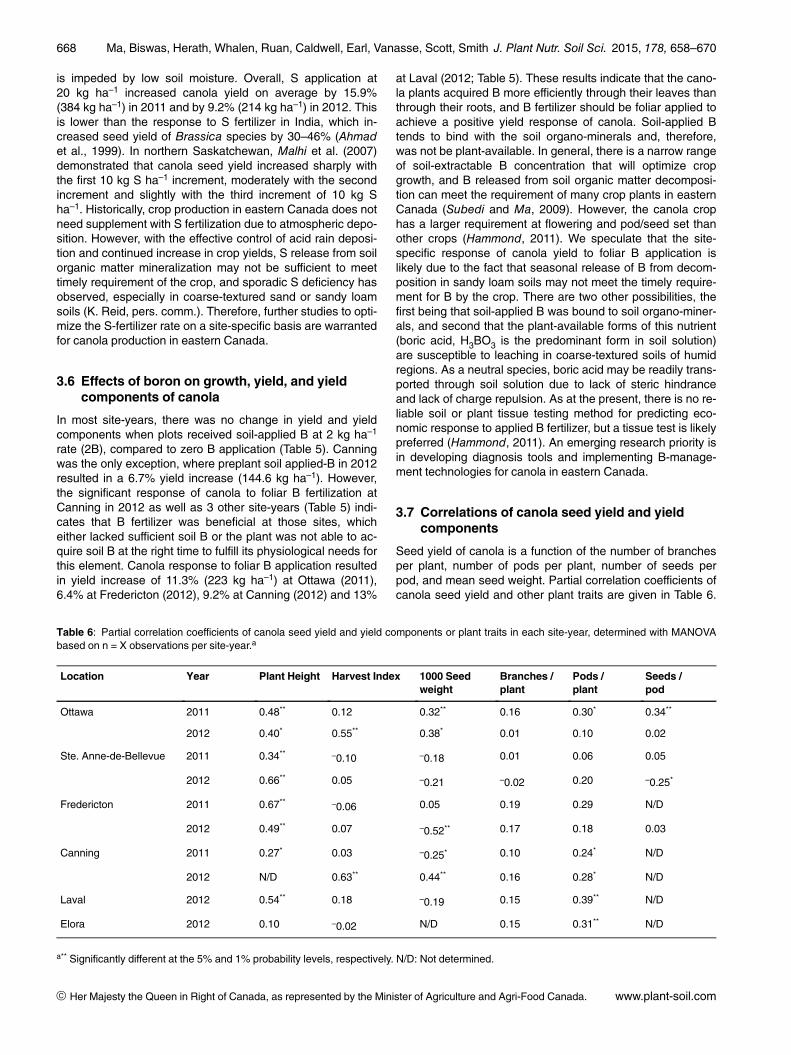
Seed yield of canola is a function of the number of branchesper plant, number of pods per plant, number of seeds perpod, and mean seed weight. Partial correlation coefficients ofcanola seed yield and other plant traits are given in Table 6.
ª Her Majesty the Queen in Right of Canada, as represented by the Minister of Agriculture and Agri-Food Canada. www.plant-soil.com
Table 6: Partial correlation coefficients of canola seed yield and yield components or plant traits in each site-year, determined with MANOVAbased on n = X observations per site-year.a
Location Year Plant Height Harvest Index 1000 Seedweight
Branches /plant
Pods /plant
Seeds /pod
Ottawa 2011 0.48** 0.12 0.32** 0.16 0.30* 0.34**
2012 0.40* 0.55** 0.38* 0.01 0.10 0.02
Ste. Anne-de-Bellevue 2011 0.34** –0.10 –0.18 0.01 0.06 0.05
2012 0.66** 0.05 –0.21 –0.02 0.20 –0.25*
Fredericton 2011 0.67** –0.06 0.05 0.19 0.29 N/D
2012 0.49** 0.07 –0.52** 0.17 0.18 0.03
Canning 2011 0.27* 0.03 –0.25* 0.10 0.24* N/D
2012 N/D 0.63** 0.44** 0.16 0.28* N/D
Laval 2012 0.54** 0.18 –0.19 0.15 0.39** N/D
Elora 2012 0.10 –0.02 N/D 0.15 0.31** N/D
a** Significantly different at the 5% and 1% probability levels, respectively. N/D: Not determined.
668 Ma, Biswas, Herath, Whalen, Ruan, Caldwell, Earl, Vanasse, Scott, Smith J. Plant Nutr. Soil Sci. 2015, 178, 658–670
These results show that grain yield was positively correlatedwith some of the measured traits. For example, for 9 of the 10site-years, except Ottawa in 2012, plant height was signifi-cantly correlated (P £ 0.1%) with seed yield. Other yieldcomponents, such as pods per plant, seeds per plant and1000-seed weight (TSW) were also significantly correlated(P £ 0.1% and P £ 1%) with seed yield in some site-years(Table 6). The inconsistent correlations between seed yieldsand yield components across site-years were probably due tothe overarching impact of environmental conditions (rainfall,temperature, radiation, humidity, wind, etc.) during the specif-ic yield formation stages at each site. When grown in stressfulenvironments, canola responds physiologically by altering en-ergy allocation to various yield components, leading to a com-pensatory response among traits that contribute to the finalseed yield.
3.8 Seed quality
In 2011 and 2012, seed quality parameters were measuredfor the Ottawa site only. In 2011, the percentages of distinctlygreen seeds were not significantly different among treatments(data not shown). However, N application either as preplantor sidedress tended to produce higher percentages (up to2.4%) of brown, tanned, and empty seeds than the zero N(0.7%). The percentage of damaged seeds (a total of thegreen, brown, tanned, and empty seeds) also increased sig-nificantly with increasing amounts of preplant and sidedressN applications compared to the check N treatment, and thehighest percentage of damaged seeds (up to 3.5%) was un-expectedly found in the plots that received 50N+50N side-dress N. Nevertheless, total irregular and damaged seeds forall treatments were below 5%. In 2012, there were no greenseeds for any of the treatments and no N fertilizer effect onthe percentage of damaged seeds. In general, excessive soilN supply may lead to green seed problem due to N’s role inchlorophyll synthesis. Still, considering the N fertilizer levelswere tested in this study for 2 years, it was encouraging tonote that there were fewer than 2% distinctly green seedsand less than 5% damaged seeds across all fertilizer treat-ments. Hence the seed quality in both growth seasons couldbe considered as grade No. 1 canola and the N fertilizer ratesselected appeared to be suitable for producing high-qualitycanola, without generating an excessive N supply at thesesites in eastern Canada.
4 Conclusions
Sidedress application appeared to meet the N requirement ofcanola more efficiently during the rapid growth and develop-ment stages and, thus, displayed greater efficiency in mostcases. Preplant S application at 20 kg S ha–1 was effective atpromoting yield in 7 of 10 site-years. When B was required bythe crop (4 of 10 site-years), foliar B application at the 20%flowering stage was more effective than soil-applied B, indi-cating that the canola plants acquire B through their leavesmore efficiently than through their roots. This may indicatethat soil-applied B was bound to the soil organo-minerals, orthat it was susceptible to leaching from coarse-textured soilsin the humid regions where this study was conducted, and
therefore not plant-available. The challenge remains to devel-op site-specific fertilizer applications that deliver ample N, S,and B for canola production considering that unfavorableweather conditions may cause nutrient losses and constraincanola growth at key development stages in eastern Canada.
Acknowledgments
This study was financially supported, in part, by the EasternCanada Oilseed Development Alliance (ECODA) through theDeveloping Innovative Agri-Products Initiative (DIAP) andthe Agri-Innovation project (AIP - P025) of Agriculture andAgri-Food Canada (AAFC) Growing Forward I and II. Wewish to thank Lynne Evenson and Scott Peterson of AAFC,Doug Macdonald of Dalhousie University, Inna Teshler ofMcGill University, and Marie-Eve Bernard of Laval University,for their excellent technical assistance in the experiment.AAFC-ECORC contribution No. 15-009.
References
Ahmad, A., Abrol, Y. P., Abdin, M. Z. (1999): Effect of split applicationof sulphur and nitrogen on growth and yield attributes of Brassicagenotypes differing in time of flowering. Can. J. Plant Sci. 79,175–180.
Ahmad, G., Jan, A., Arif, M., Jan, M. T., Shah, H. (2011): Effect ofnitrogen and sulfur fertilization on yield components, seed and oilyields of canola. J. Plant Nutr. 34, 2069–2082.
Allen, E. J., Morgan, D. G. (1975): A quantitative comparison of thegrowth, development and yield of different varieties of oilseed rape.J. Agric. Sci. 85, 159–174.
Better Farming (2011): http://www.betterfarming.com/online-news/eastern-canadian-canola-soybean-crushers-establish-joint-venture-4870.
Blackshaw, R. E., Johnson, E., Gan, Y., May, W., McAndrew, D.,Barthet, V., McDonald, T., Wispinski, D. (2011): Alternative oilseedcrops for biodiesel feedstock on the Canadian Prairies. Can. J.Plant Sci. 91, 889–896.
Cheema, M. A. (1999): Production efficiency of canola (Brassicanapus L.) cv. Shiralee under different agro-management practices.Ph.D. Thesis, University of Agriculture, Faisalabad, Pakistan.
Cheema, M. A., Malik, M. A., Hussain, A., Shah, S. H., Basra, S. M.A. (2001): Effects of time and rate of nitrogen and phosphorusapplication on the growth and the seed and oil yields of canola(Brassica napus L.). J. Agr. Crop Sci. 186, 103–110.
CGC—Canadian grain commission (2014): Official Grain GradingGuide, Canola and rapeseed, Chapter 10. Available at: http://cgc.ca/oggg-gocg/10-canola-2014-eng.pdf.
Cutforth, H., MeConkey, B., Brandt, S., Gan, Y., Lafond, G., Angadi,S., Judiesch, D. (2009): Fertilizer N response and canola yield inthe semiarid Canadian prairies. Can. J. Plant Sci. 89, 501–503.
Fismes, J., Vong, P. C., Guckert, A., Frossard, E. (2000): Influence ofsulphur on apparent N-use efficiency, yield and quality of oilseedrape (Brassica napus L.) grown on a calcareous soil. Eur. J.Agron. 12, 127–141.
Gan, Y., Malhi, S. S., Brandt, S., Katepa-Mupondwa, F., Kutcher, H.R. (2007): Brassica juncea canola in the northern Great Plains:Responses to diverse environments and N fertilization. Agron. J.99, 1208–1218.
ª Her Majesty the Queen in Right of Canada, as represented by the Minister of Agriculture and Agri-Food Canada. www.plant-soil.com
J. Plant Nutr. Soil Sci. 2015, 178, 658–670 Growth and yield of canola 669

Gao, Y., Ma, B. L. (2015): Nitrogen, phosphorus, and zinc supply onyield and metal accumulation in canola grain. J. Plant Nutr. 38,473–483.
Hammond, D. (2011): Agronomy, in Daun, J. K., Neskin, A. M.,Hickling, D. (eds.): Canola— Chemistry, Production, Processing,and Utilization. AOCS Press, Urbana, IL, USA, pp. 93–117.
Harker, K. N., O’Donovan, J. T., Blackshaw, R. E., Hall, L. M.,Willenborg, C. J., Kutcher, H. R., Gan, Y., Lafond, G. P., May, W.E., Grant, C. A., Barthet, V., McDonald, T., Wispinski, D., Hartman,M. (2013): Effect of agronomic inputs and crop rotation onbiodiesel quality and fatty acid profiles of direct-seeded canola.Can. J. Plant Sci. 93, 577–588.
Hocking, P. J., Stapper, M. (2001): Effects of sowing time andnitrogen fertiliser on canola and wheat, and nitrogen fertiliser onIndian mustard. I. Dry matter production, grain yield, and yieldcomponents. Aust. J. Agric. Res. 52, 623–634.
Hocking, P. J., Randall, P. J., DeMarco, D. (1997): The response ofdryland canola to nitrogen fertilizer: Partitioning and mobilization ofdry matter and nitrogen and nitrogen effects on yield components.Field Crop. Res. 54, 201–220.
Holmes, M. R. J. (1980): Nutrition of the Oilseed Rape Crop. AppliedScience Publication, Barking Essex, UK.
Holmes, M. R. J., Ainsley, A. M. (1977): Fertilizer requirements ofspring oilseed rape. J. Sci. Food Agric. 28, 301–311.
Jackson, G. D. (2000): Effects of nitrogen and sulfur on canola yieldand nutrient uptake. Agron. J. 92, 644–649.
Janovicek, K. J., Stewart, G. A. (2014): Using maximum yieldresponse to nitrogen to verify corn nitrogen recommendations.2014 ASA, CSSA, & SSSA International Meeting, Long Beach,CA. Available at: https://scisoc.confex.com/scisoc/2014am/webprogram/Paper88158.html.
Khan, N., Jan, A., Ihsanullah, I., Khan, A., Khan, N. (2002): Responseof canola to nitrogen and sulphur nutrition. Asian J. Plant Sci. 1,516–518.
Kimber, D. S., McGregor, D. I. (1995): Brassica Oilseeds: Productionand Utilization. 1st Ed. CAB International, Wallingford, UK.
Kumar, S., Singh, J., Dhingra, K. K. (1997): Leaf area index rela-tionship with solar radiation interception and yield of Indianmustard (Brassica juncea) as influenced by plant population andN. Ind. J. Agron. 42, 348–351.
Kutcher, H. R., Malhi, S. S., Gill, K. S. (2005): Topography andmanagement of nitrogen and Fungicide Affects Diseases andProductivity of Canola. Agron. J. 97, 533–541.
Lancashire, P. D., Bleiholder, H., van den Boom, T., Langeluddeke,P., Stauss, R., Weber, E., Witzenberger, A. (1991): A uniformdecimal code for growth stages of crops and weeds. Ann. Appl.Biol. 119, 561–601.
Ma, B. L., Subedi, K. D., Liu, A. (2006): Variations in grain nitrogenremoval associated with management practices in corn production.Nutr. Cycl. Agroecosyst. 76, 67–80.
Ma, B. L., Wu, T. Y., Tremblay, N., Deen, W., McLaughlin, N. B.,Morrison, M. J., Gregorich, E. G., Stewart, G. (2010a): Nitrousoxide fluxes from corn fields: On-farm assessment of the amountand timing of nitrogen fertilizer. Global Change Biol. 16, 156–170.
Ma, B. L., Wu, T. Y., Tremblay, N., Deen, W., McLaughlin, N. B.,Morrison, M. J., Stewart, G. (2010b): On-farm assessment of theamount and timing of nitrogen fertilizer on ammonia volatilization.Agron. J. 102, 134–144.
Malhi, S. S., Gill, K. S. (2007): Interactive effects of N and S fertilizerson canola yield and seed quality on S-deficient Gray Luvisol soilsin northeastern Saskatchewan. Can. J. Plant Sci. 87, 211–222.
Malhi, S. S., Gan, Y., Raney, J. P. (2007): Yield, seed quality, andsulfur uptake of Brassica oilseed crops in response to sulfur ferti-lization. Agron. J. 99, 570–577.
Malhi, S. S., Vera, C. L., Brandt, S. A. (2013): Relative effectivenessof organic and inorganic nutrient sources in improving yield, seedquality and nutrient uptake of canola. Agric. Sci. 4, 1–18.
Ozturk, O. (2010): Effects of source and rate of nitrogen fertilizer onyield, yield components and quality of winter rapeseed (Brassicanapus L.). Chilean J. Agric. Res. 70, 132–141.
Potts, D. A., Rakow, G. W., Males, D. R., Woods, D. L. (2003): Thedevelopment of canola-quality Brassica juncea. Can. J. Plant Sci.83, 117–118.
Rashid, M. T., Voroney, R. P. (2005): Predicting nitrogen requirementsfor corn grown on soils amended with oily food waste. Soil Sci.Soc. Am. J. 69, 1256–1265.
Rathke, G. W., Christen, O., Diepenbrock, W. (2005): Effects of Nsource and rate on productivity and quality of winter oilseed rapegrown in different crop rotations. Field Crop. Res. 94, 103–113.
Subedi, K. D., Ma, B. L. (2009): Corn crop production: growth, ferti-lization and yield, in Danforth A. T. (ed.): Corn Crop Production:Growth, Fertilization and Yield. Series: Agriculture Issues andPolicies. Nova Publisher, Inc., New York, NY, USA, pp. 1–84.
Simard, M. J., Panneton, B., Longchamps, L., Lemieux, C., Legere,A., Leroux, G. D. (2009): Validation of a management problembased on a weed cover threshold model: effects on herbicide useand weed populations. Weed Sci. 57, 187–193.
Taylor, A. J., Smith, C. J., Wilson, I. B. (1991): Effect of irrigation andnitrogen fertilizer on yield, oil content, nitrogen accumulation andwater use of canola (Brassica napus L.). Fert. Res. 29, 249–260.
Uddin, M. K., Khan, M. N. H., Mahbub, A. S. M., Hussain, M. M.(1992): Growth and yield of rapeseed as affected by nitrogen andseed rate. Bangladesh J. Sci. Indust. Res. 27, 30–38.
Weber, E., Bleiholder, H. (1990): Explanations of the BBCH decimalcodes for the growth stages of maize, rape, faba beans, sunflowersand peas-with illustrations. Gesunde Pflanzen 42, 308–321.
Wright, G. C., Smith, C. J., Woodroofe, M. R. (1988): The effect of irri-gation and nitrogen fertilizer on rapeseed productions in SouthEastern Australia. Irr. Sci. 9, 1–13.
Xing, L., Wei, W. J., Zhi, L. C., Ying, L. D., Hu, L. S., Hua, S. Y., Liao,X., Wang, J. W., Liu, C. Z., Li, D. Y., Leng, S. H., Shan, Y. H. (1998):Requirement of NPK nutrients of hybrid oilseed rape. Soils Fert.Beijing 6, 11–13.
Zaman, M. (2003): Effect of rate and time of nitrogen application ongrowth, seed yield and oil contents of canola (Brassica napus L.).M.Sc. (Hons.) thesis, University of Agriculture, Faisalabad,Pakistan.
ª Her Majesty the Queen in Right of Canada, as represented by the Minister of Agriculture and Agri-Food Canada. www.plant-soil.com
670 Ma, Biswas, Herath, Whalen, Ruan, Caldwell, Earl, Vanasse, Scott, Smith J. Plant Nutr. Soil Sci. 2015, 178, 658–670